Test: Apple iPhone 12 - Apple-telefon med 5G (Sammanfattning)
Testgrupp
Gradering | Datum | Modell | Vikt | Enheten | Storlek | Upplösning | Pris |
|---|---|---|---|---|---|---|---|
| 88.2 % v7 (old) | 11/2020 | Apple iPhone 12 A14, A14 Bionic GPU | 162 g | 64 GB SSD | 6.10" | 2532x1170 | |
| 86.5 % v7 (old) | 10/2019 | Apple iPhone 11 A13 Bionic, A13 Bionic GPU | 194 g | 64 GB SSD | 6.10" | 1792x828 | |
| 87 % v7 (old) | 09/2020 | Asus Zenfone 7 Pro ZS671KS SD 865+ (Plus), Adreno 650 | 235 g | 256 GB UFS 3.1 Flash | 6.67" | 2400x1080 | |
| 89.4 % v7 (old) | 04/2020 | Huawei P40 Pro Kirin 990 5G, Mali-G76 MP16 | 209 g | 256 GB UFS 3.0 Flash | 6.58" | 2640x1200 | |
| 87.8 % v7 (old) | 10/2020 | OnePlus 8T SD 865, Adreno 650 | 188 g | 128 GB UFS 3.1 Flash | 6.55" | 2400x1080 | |
| 88.1 % v7 (old) | 10/2020 | Samsung Galaxy Note20 Exynos 990, Mali-G77 MP11 | 192 g | 256 GB UFS 3.1 Flash | 6.70" | 2400x1080 |
| Networking | |
| iperf3 transmit AX12 | |
| Huawei P40 Pro | |
| Apple iPhone 12 | |
| Samsung Galaxy Note20 | |
| OnePlus 8T | |
| Asus Zenfone 7 Pro ZS671KS | |
| Apple iPhone 11 | |
| iperf3 receive AX12 | |
| Samsung Galaxy Note20 | |
| Asus Zenfone 7 Pro ZS671KS | |
| Huawei P40 Pro | |
| OnePlus 8T | |
| Apple iPhone 12 | |
| Apple iPhone 11 | |
Bildjämförelse
Välj en scen och navigera inom den första bilden. Ett klick ändrar positionen på pekskärmar. Ett klick på den inzoomade bilden öppnar originalet i ett nytt fönster. Den första bilden visar det skalade fotografiet av testanordningen.
Hauptobjektiv BlumeHauptobjektiv UmgebungHauptobjektiv Low LightUltraweitwinkel


| |||||||||||||||||||||||||
Distribution av ljusstyrkan: 97 %
Mitt på batteriet: 642 cd/m²
Kontrast: ∞:1 (Svärta: 0 cd/m²)
ΔE ColorChecker Calman: 0.9 | ∀{0.5-29.43 Ø4.71}
ΔE Greyscale Calman: 0.8 | ∀{0.09-98 Ø4.96}
99.4% sRGB (Calman 2D)
Gamma: 2.188
CCT: 6404 K
| Apple iPhone 12 OLED, 2532x1170, 6.1" | Apple iPhone 11 IPS, 1792x828, 6.1" | Asus Zenfone 7 Pro ZS671KS Super AMOLED, 2400x1080, 6.7" | Huawei P40 Pro OLED, 2640x1200, 6.6" | OnePlus 8T AMOLED, 2400x1080, 6.6" | Samsung Galaxy Note20 Super AMOLED Plus, 2400x1080, 6.7" | |
|---|---|---|---|---|---|---|
| Screen | -3% | -29% | -27% | -3% | -84% | |
| Brightness middle (cd/m²) | 642 | 679 6% | 684 7% | 584 -9% | 743 16% | 610 -5% |
| Brightness (cd/m²) | 639 | 671 5% | 690 8% | 576 -10% | 734 15% | 621 -3% |
| Brightness Distribution (%) | 97 | 93 -4% | 95 -2% | 95 -2% | 91 -6% | 95 -2% |
| Black Level * (cd/m²) | 0.68 | |||||
| Colorchecker dE 2000 * | 0.9 | 0.8 11% | 1.3 -44% | 1.1 -22% | 0.89 1% | 2.4 -167% |
| Colorchecker dE 2000 max. * | 2.42 | 2.4 1% | 2.5 -3% | 2.3 5% | 1.69 30% | 4.3 -78% |
| Greyscale dE 2000 * | 0.8 | 1.1 -38% | 1.9 -137% | 1.8 -125% | 1.4 -75% | 2.8 -250% |
| Gamma | 2.188 101% | 2.24 98% | 2.29 96% | 2.16 102% | 2.199 100% | 2.09 105% |
| CCT | 6404 101% | 6610 98% | 6475 100% | 6355 102% | 6423 101% | 6368 102% |
| Contrast (:1) | 999 |
* ... mindre är bättre
Skärmflimmer / PWM (Puls-Width Modulation)
| Skärmflimmer / PWM upptäckt | 226.2 Hz | 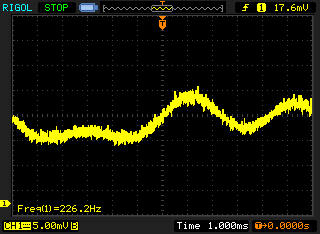 | |
Displayens bakgrundsbelysning flimrar vid 226.2 Hz (i värsta fall, t.ex. med PWM) . Frekvensen för 226.2 Hz är relativt låg, så känsliga användare kommer sannolikt att märka flimmer och uppleva ansträngda ögon vid den angivna ljusstyrkeinställningen och nedan. Som jämförelse: 52 % av alla testade enheter använder inte PWM för att dämpa skärmen. Om PWM upptäcktes mättes ett medelvärde av 7747 (minst: 5 - maximum: 343500) Hz. | |||
Visa svarstider
| ↔ Svarstid svart till vitt | ||
|---|---|---|
| 22 ms ... stiga ↗ och falla ↘ kombinerat | ↗ 19 ms stiga | 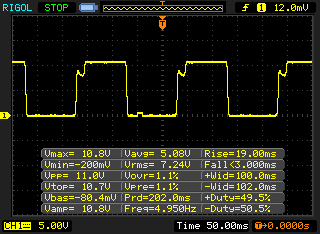 |
| ↘ 3 ms hösten | ||
| Skärmen visar bra svarsfrekvens i våra tester, men kan vara för långsam för konkurrenskraftiga spelare. I jämförelse sträcker sig alla testade enheter från 0.1 (minst) till 240 (maximalt) ms. » 49 % av alla enheter är bättre. Detta innebär att den uppmätta svarstiden är sämre än genomsnittet av alla testade enheter (19.8 ms). | ||
| ↔ Svarstid 50 % grått till 80 % grått | ||
| 10 ms ... stiga ↗ och falla ↘ kombinerat | ↗ 5 ms stiga | 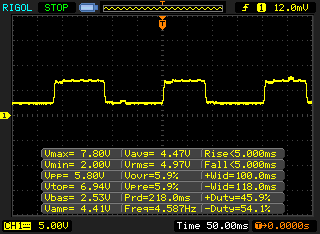 |
| ↘ 5 ms hösten | ||
| Skärmen visar bra svarsfrekvens i våra tester, men kan vara för långsam för konkurrenskraftiga spelare. I jämförelse sträcker sig alla testade enheter från 0.165 (minst) till 636 (maximalt) ms. » 23 % av alla enheter är bättre. Det betyder att den uppmätta svarstiden är bättre än genomsnittet av alla testade enheter (31 ms). | ||
| AnTuTu v8 - Total Score (sortera efter värde) | |
| Apple iPhone 12 | |
| Asus Zenfone 7 Pro ZS671KS | |
| Huawei P40 Pro | |
| OnePlus 8T | |
| Samsung Galaxy Note20 | |
| Genomsnitt Apple A14 Bionic (510245 - 647374, n=5) | |
| Basemark GPU 1.2 | |
| 1920x1080 Metal Medium Offscreen (sortera efter värde) | |
| Apple iPhone 12 | |
| Genomsnitt Apple A14 Bionic (156.4 - 169.4, n=3) | |
| Genomsnitt av klass Smartphone (n=1senaste 2 åren) | |
| Metal Medium Native (sortera efter värde) | |
| Apple iPhone 12 | |
| Genomsnitt Apple A14 Bionic (96.2 - 136, n=3) | |
| Genomsnitt av klass Smartphone (n=1senaste 2 åren) | |
| 3840x2160 Metal High Offscreen (sortera efter värde) | |
| Apple iPhone 12 | |
| Genomsnitt Apple A14 Bionic (50.3 - 51.5, n=2) | |
| AImark - Score v2.x (sortera efter värde) | |
| Apple iPhone 12 | |
| Apple iPhone 11 | |
| Huawei P40 Pro | |
| Genomsnitt Apple A14 Bionic (91892 - 92916, n=4) | |
| Jetstream 2 - 2.0 Total | |
| Genomsnitt Apple A14 Bionic (158.2 - 178.9, n=6) | |
| Genomsnitt av klass Smartphone (63.9 - 423, n=125, senaste 2 åren) | |
| Apple iPhone 12 (Safari 14) | |
| Apple iPhone 11 (Safari Mobile 13.0) | |
| Huawei P40 Pro (Huawei Browser 10.1) | |
| Asus Zenfone 7 Pro ZS671KS (Chrome 81.0.4044.138) | |
| OnePlus 8T (Chrome 86) | |
| Samsung Galaxy Note20 (Samsung Browser 12.1) | |
| JetStream 1.1 - 1.1 Total | |
| Genomsnitt Apple A14 Bionic (305 - 376, n=5) | |
| Apple iPhone 12 (Safari 14) | |
| Apple iPhone 11 (Safari Mobile 13.0) | |
| Asus Zenfone 7 Pro ZS671KS (Chrome 81.0.4044.138) | |
| OnePlus 8T (Chrome 86) | |
| Huawei P40 Pro (Huawei Browser 10.1) | |
| Samsung Galaxy Note20 (Samsung Browser 12.1) | |
| Speedometer 2.0 - Result 2.0 | |
| Genomsnitt av klass Smartphone (49.3 - 733, n=85, senaste 2 åren) | |
| Genomsnitt Apple A14 Bionic (188 - 272, n=6) | |
| Apple iPhone 12 (Safari 14) | |
| Apple iPhone 11 (Safari Mobile 13.0) | |
| Huawei P40 Pro (Huawei Browser 10.1) | |
| OnePlus 8T (Chome 86) | |
| Samsung Galaxy Note20 (Samsung Browser 12.1) | |
| Asus Zenfone 7 Pro ZS671KS (Chrome 81.0.4044.138) | |
| WebXPRT 3 - Overall | |
| Genomsnitt Apple A14 Bionic (191 - 214, n=6) | |
| Apple iPhone 12 (Safari 14) | |
| Apple iPhone 11 (Safari Mobile 13.0) | |
| Genomsnitt av klass Smartphone (104 - 380, n=12, senaste 2 åren) | |
| Asus Zenfone 7 Pro ZS671KS (Chrome 81.0.4044.138) | |
| OnePlus 8T (Chrome 86) | |
| Samsung Galaxy Note20 (Samsung Browser 12.1) | |
| Huawei P40 Pro | |
| Octane V2 - Total Score | |
| Genomsnitt Apple A14 Bionic (55710 - 59963, n=6) | |
| Apple iPhone 12 (Safari 14) | |
| Genomsnitt av klass Smartphone (2800 - 126661, n=151, senaste 2 åren) | |
| Apple iPhone 11 (Safari Mobile 13.0) | |
| Asus Zenfone 7 Pro ZS671KS | |
| Huawei P40 Pro (Huawei Browser 10.1) | |
| Samsung Galaxy Note20 (Samsung Browser 12.1) | |
| OnePlus 8T (Chrome 86) | |
| Mozilla Kraken 1.1 - Total | |
| Samsung Galaxy Note20 (Samsung Browser 12.1) | |
| Huawei P40 Pro (Huawei Browser 10.1) | |
| OnePlus 8T (Chrome 86) | |
| Asus Zenfone 7 Pro ZS671KS (Chrome 81.0.4044.138) | |
| Genomsnitt av klass Smartphone (257 - 28190, n=129, senaste 2 åren) | |
| Apple iPhone 11 (Safari Mobile 13.0) | |
| Genomsnitt Apple A14 Bionic (460 - 547, n=6) | |
| Apple iPhone 12 (Safari 14) | |
* ... mindre är bättre
(+) Den maximala temperaturen på ovansidan är 37.8 °C / 100 F, jämfört med genomsnittet av 35.3 °C / 96 F , allt från 21.9 till 247 °C för klassen Smartphone.
(+) Botten värms upp till maximalt 37.3 °C / 99 F, jämfört med genomsnittet av 34 °C / 93 F
(+) Vid tomgångsbruk är medeltemperaturen för ovansidan 30 °C / 86 F, jämfört med enhetsgenomsnittet på 33 °C / ### class_avg_f### F.
Apple iPhone 12 ljudanalys
(±) | högtalarljudstyrkan är genomsnittlig men bra (81.1 dB)
Bas 100 - 315 Hz
(-) | nästan ingen bas - i genomsnitt 62.2% lägre än medianen
(+) | basen är linjär (0% delta till föregående frekvens)
Mellan 400 - 2000 Hz
(-) | nästan inga mids - i genomsnitt 62.2% lägre än medianen
(+) | mids är linjära (0% delta till föregående frekvens)
Högsta 2 - 16 kHz
(-) | nästan inga toppar - i genomsnitt 62.2% lägre än medianen
(+) | toppar är linjära (0% delta till föregående frekvens)
Totalt 100 - 16 000 Hz
(-) | det totala ljudet är inte linjärt (123.1% skillnad mot median)
Jämfört med samma klass
» 92% av alla testade enheter i den här klassen var bättre, 7% liknande, 1% sämre
» Den bästa hade ett delta på 11%, genomsnittet var 34%, sämst var 134%
Jämfört med alla testade enheter
» 98% av alla testade enheter var bättre, 2% liknande, 0% sämre
» Den bästa hade ett delta på 4%, genomsnittet var 23%, sämst var 134%
Apple iPhone 11 ljudanalys
(+) | högtalare kan spela relativt högt (83.4 dB)
Bas 100 - 315 Hz
(±) | reducerad bas - i genomsnitt 13.5% lägre än medianen
(±) | linjäriteten för basen är genomsnittlig (13.6% delta till föregående frekvens)
Mellan 400 - 2000 Hz
(±) | högre mellan - i genomsnitt 5.3% högre än median
(+) | mids är linjära (5.4% delta till föregående frekvens)
Högsta 2 - 16 kHz
(±) | högre toppar - i genomsnitt 10.3% högre än medianen
(+) | toppar är linjära (4.6% delta till föregående frekvens)
Totalt 100 - 16 000 Hz
(±) | linjäriteten för det totala ljudet är genomsnittlig (21.4% skillnad mot median)
Jämfört med samma klass
» 42% av alla testade enheter i den här klassen var bättre, 8% liknande, 50% sämre
» Den bästa hade ett delta på 11%, genomsnittet var 34%, sämst var 134%
Jämfört med alla testade enheter
» 60% av alla testade enheter var bättre, 7% liknande, 33% sämre
» Den bästa hade ett delta på 4%, genomsnittet var 23%, sämst var 134%
| Av/Standby | |
| Låg belastning | |
| Hög belastning |
|
Förklaring:
min: | |
| Apple iPhone 12 2815 mAh | Apple iPhone 11 3110 mAh | Asus Zenfone 7 Pro ZS671KS 5000 mAh | Huawei P40 Pro 4200 mAh | OnePlus 8T 4500 mAh | Samsung Galaxy Note20 4300 mAh | Genomsnitt Apple A14 Bionic | Genomsnitt av klass Smartphone | |
|---|---|---|---|---|---|---|---|---|
| Power Consumption | -11% | -3% | 20% | 2% | 3% | -42% | -4% | |
| Idle Minimum * (Watt) | 0.9 | 0.56 38% | 0.63 30% | 0.92 -2% | 1.1 -22% | 0.92 -2% | 0.933 ? -4% | 0.883 ? 2% |
| Idle Average * (Watt) | 1.5 | 2.99 -99% | 2.06 -37% | 1.41 6% | 1.5 -0% | 1.5 -0% | 3.51 ? -134% | 1.469 ? 2% |
| Idle Maximum * (Watt) | 1.8 | 3.02 -68% | 2.08 -16% | 1.47 18% | 1.7 6% | 1.54 14% | 3.66 ? -103% | 1.658 ? 8% |
| Load Average * (Watt) | 5.5 | 4.17 24% | 5.55 -1% | 3.35 39% | 4.6 16% | 5.49 -0% | 5.4 ? 2% | 6.72 ? -22% |
| Load Maximum * (Watt) | 10.4 | 5.44 48% | 9.71 7% | 6.37 39% | 9.4 10% | 9.99 4% | 7.57 ? 27% | 11.3 ? -9% |
* ... mindre är bättre
| Apple iPhone 12 2815 mAh | Apple iPhone 11 3110 mAh | Asus Zenfone 7 Pro ZS671KS 5000 mAh | Huawei P40 Pro 4200 mAh | OnePlus 8T 4500 mAh | Samsung Galaxy Note20 4300 mAh | |
|---|---|---|---|---|---|---|
| Batteridrifttid | -2% | -32% | -24% | -16% | -11% | |
| Reader / Idle (h) | 43.4 | 46.1 6% | 20.2 -53% | 24.6 -43% | 25.7 -41% | 34.5 -21% |
| H.264 (h) | 18.9 | 19.1 1% | 16.6 -12% | 19 1% | 18.4 -3% | 18.7 -1% |
| WiFi v1.3 (h) | 15.8 | 14.4 -9% | 11.3 -28% | 12.4 -22% | 17.1 8% | 9.8 -38% |
| Load (h) | 4.7 | 4.5 -4% | 3.1 -34% | 3.3 -30% | 3.4 -28% | 5.4 15% |
För
Emot
Omdöme - Användbara förbättringar
Läs den fullständiga versionen av den här recensionen på engelska här.
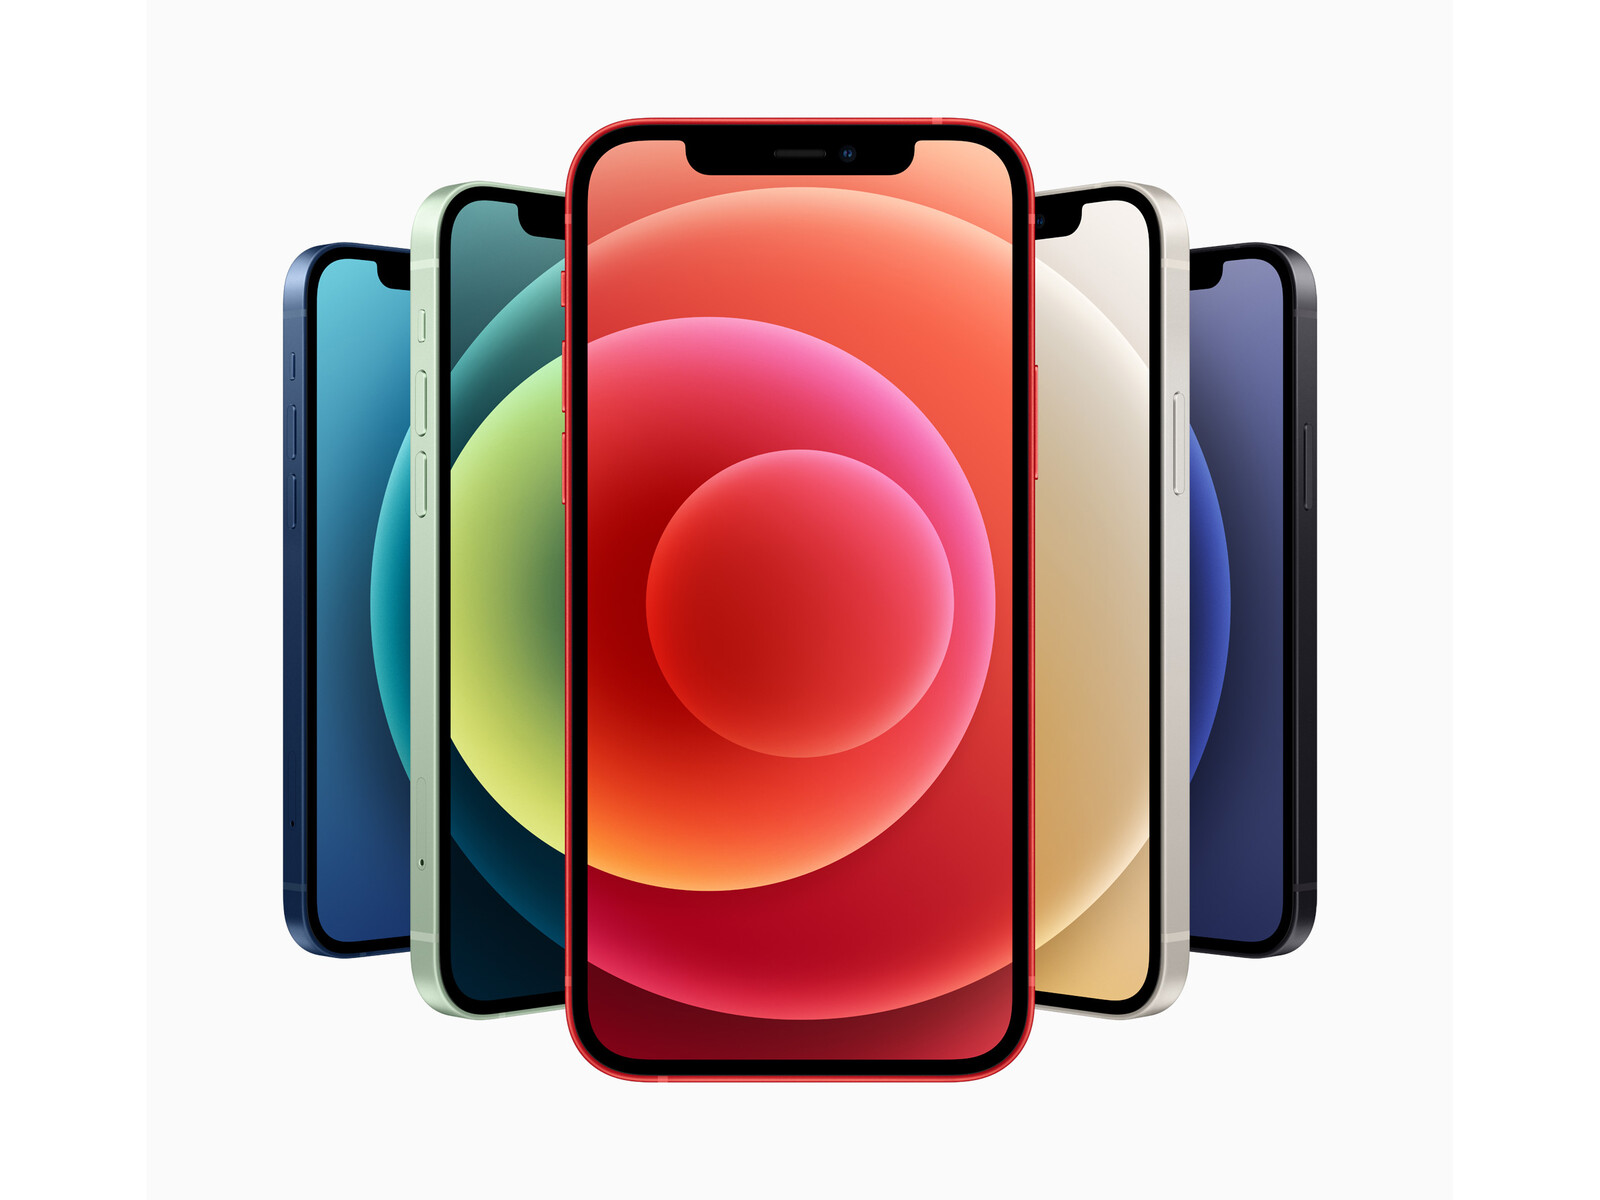
Apples telefoner har förstås alltid haft en unik egenskap såtillvida att de tillverkats av Apple. Men även 2020 har iPhone 12 ett antal nya förbättringar att erbjuda, exempelvis en OLED-skärm, högre prestanda och stöd för 5G.
Inte heller den här gången bryr sig Apple om aktuella standarder för toppskiktstelefoner, vilket är anledningen till att iPhone 12 fortfarande inte har en 90- eller 120 Hz-skärm och att basmodellen har ganska liten mängd lagring. När det kommer till trådlös laddning och IP-certifiering hänger Apples telefon däremot med.
Faktum att priset på Apples nya telefon återigen har ökat jämfört med föregångaren är ganska irriterande, och då ingår inte ens en AC-adapter eller ett headset. På den sistnämnda punkten går det dock att köpa Apples argument om miljöpåverkan.
iPhone 12 är ytterligare en smartphone av hög kvalitet med massor av styrka och ett bra hölje. De nya funktionerna är inte direkt revolutionerande, men de är väldigt användbara.
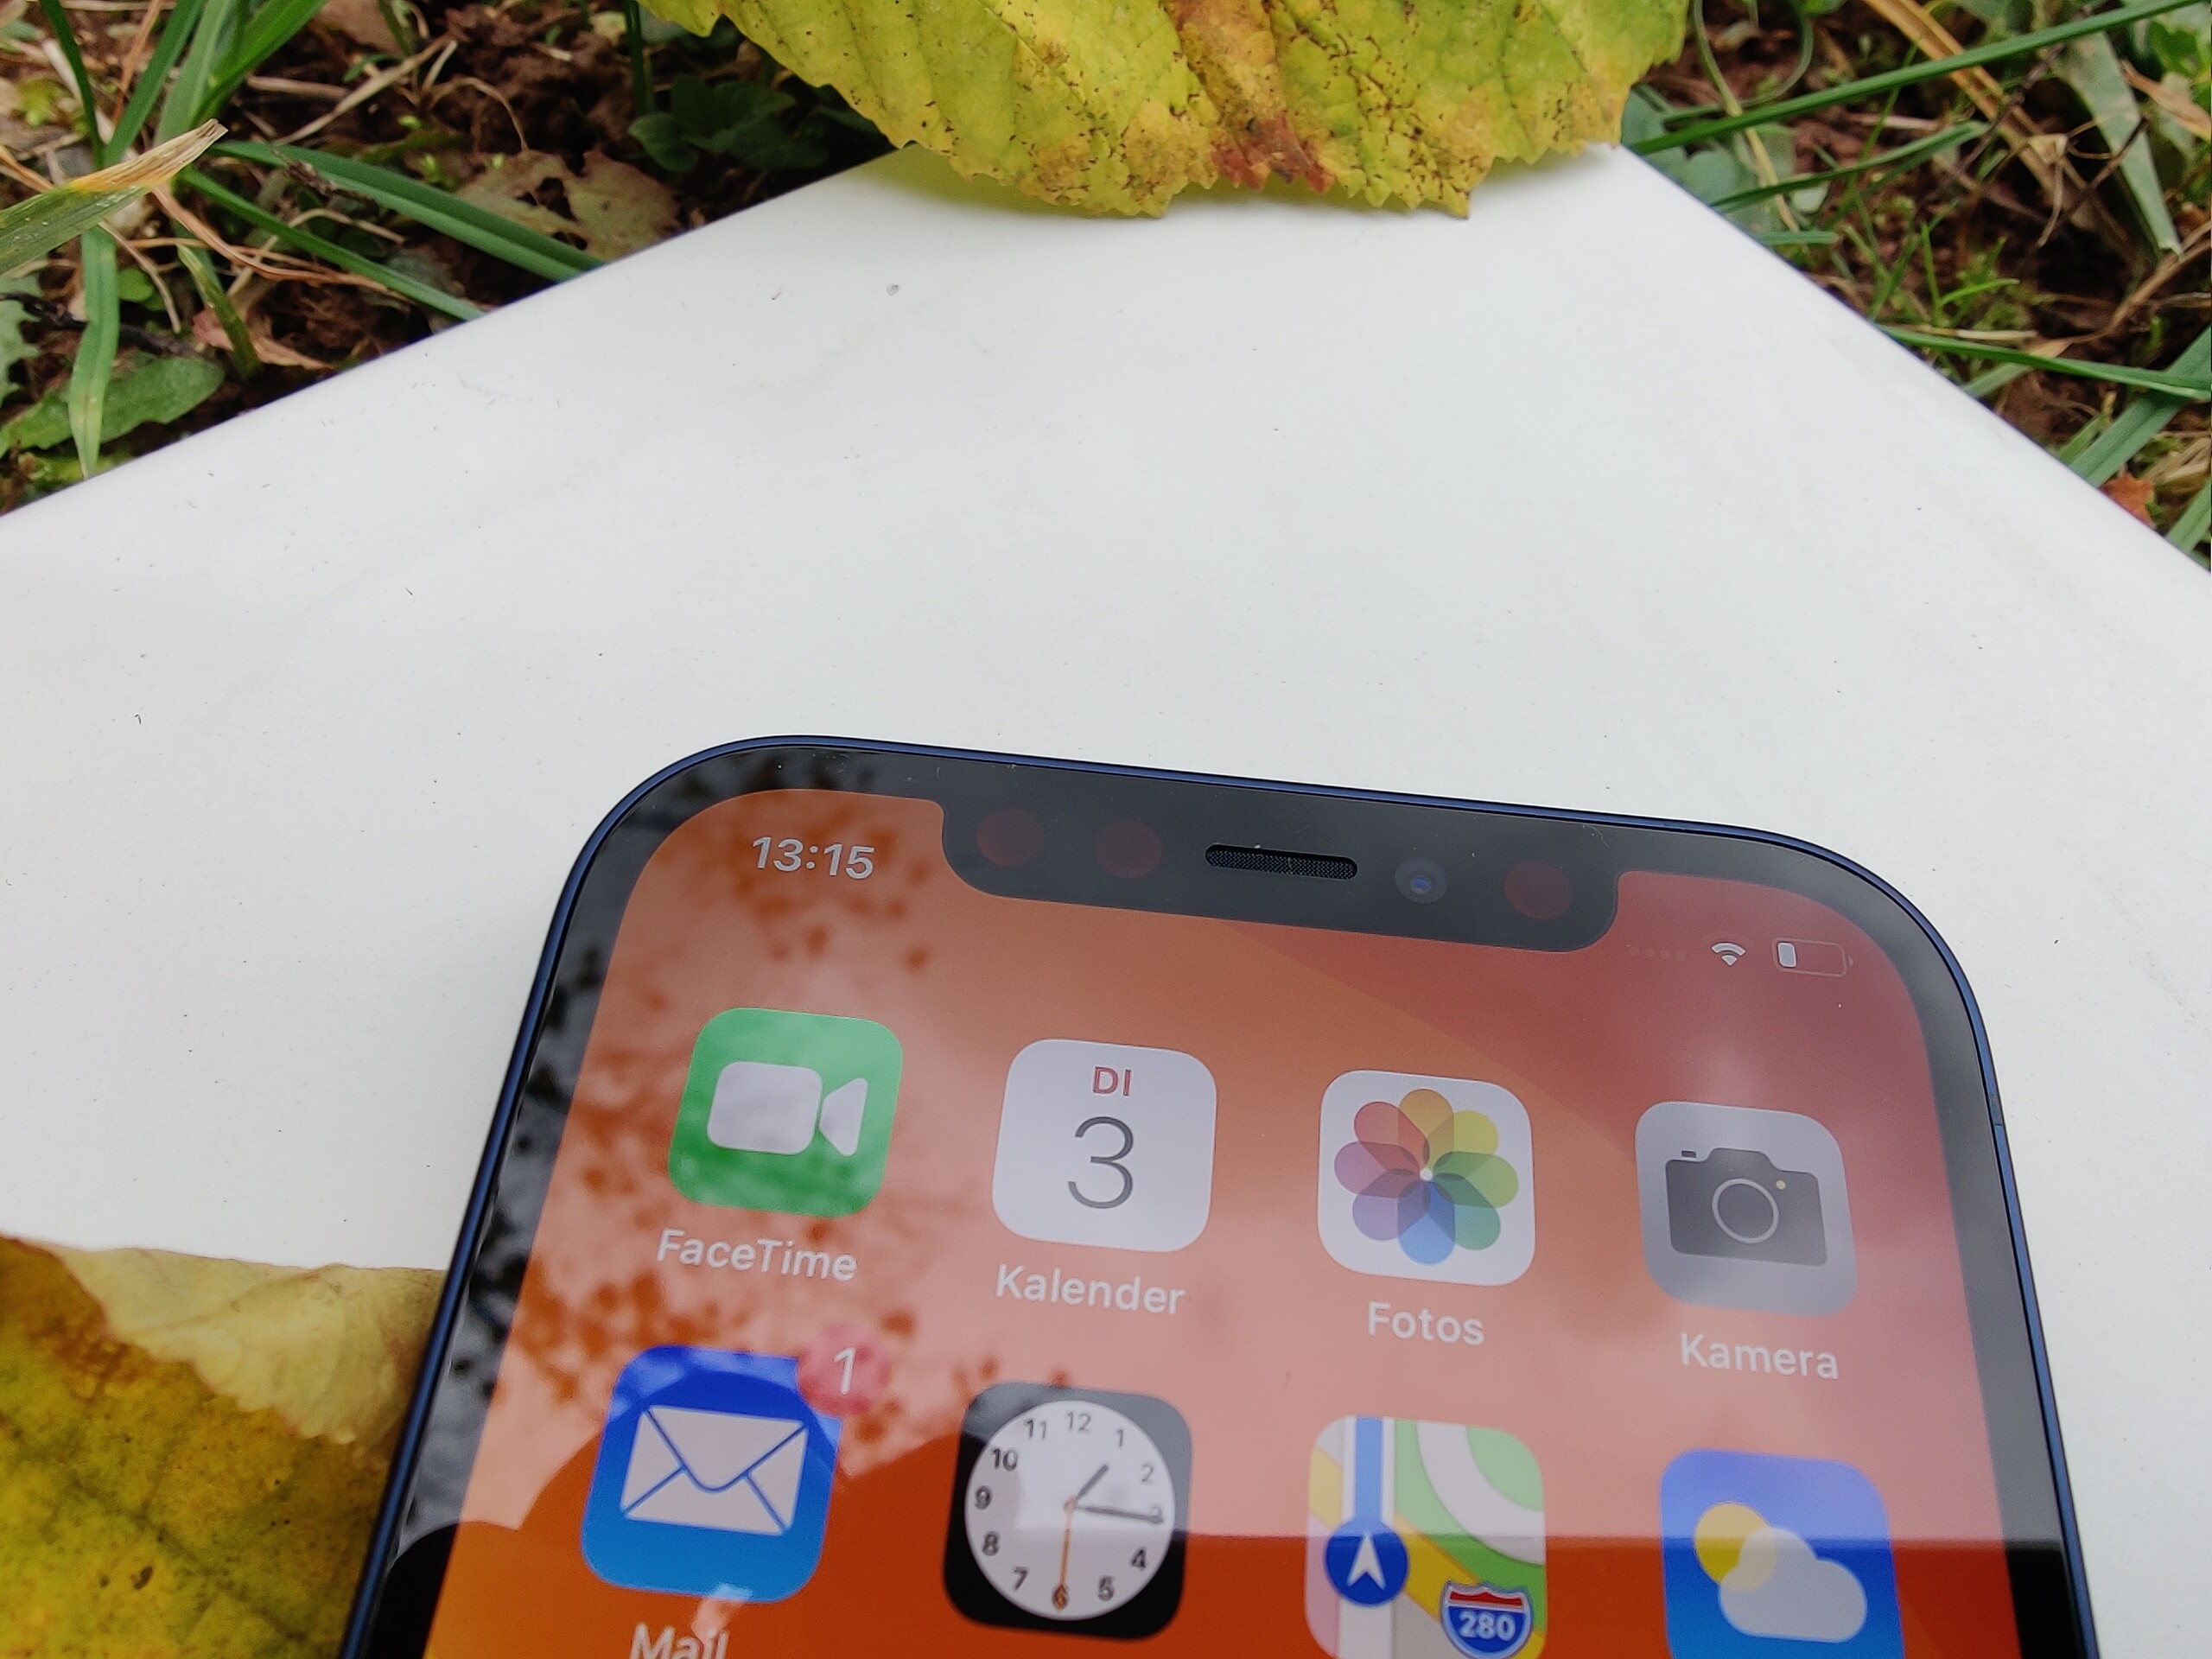
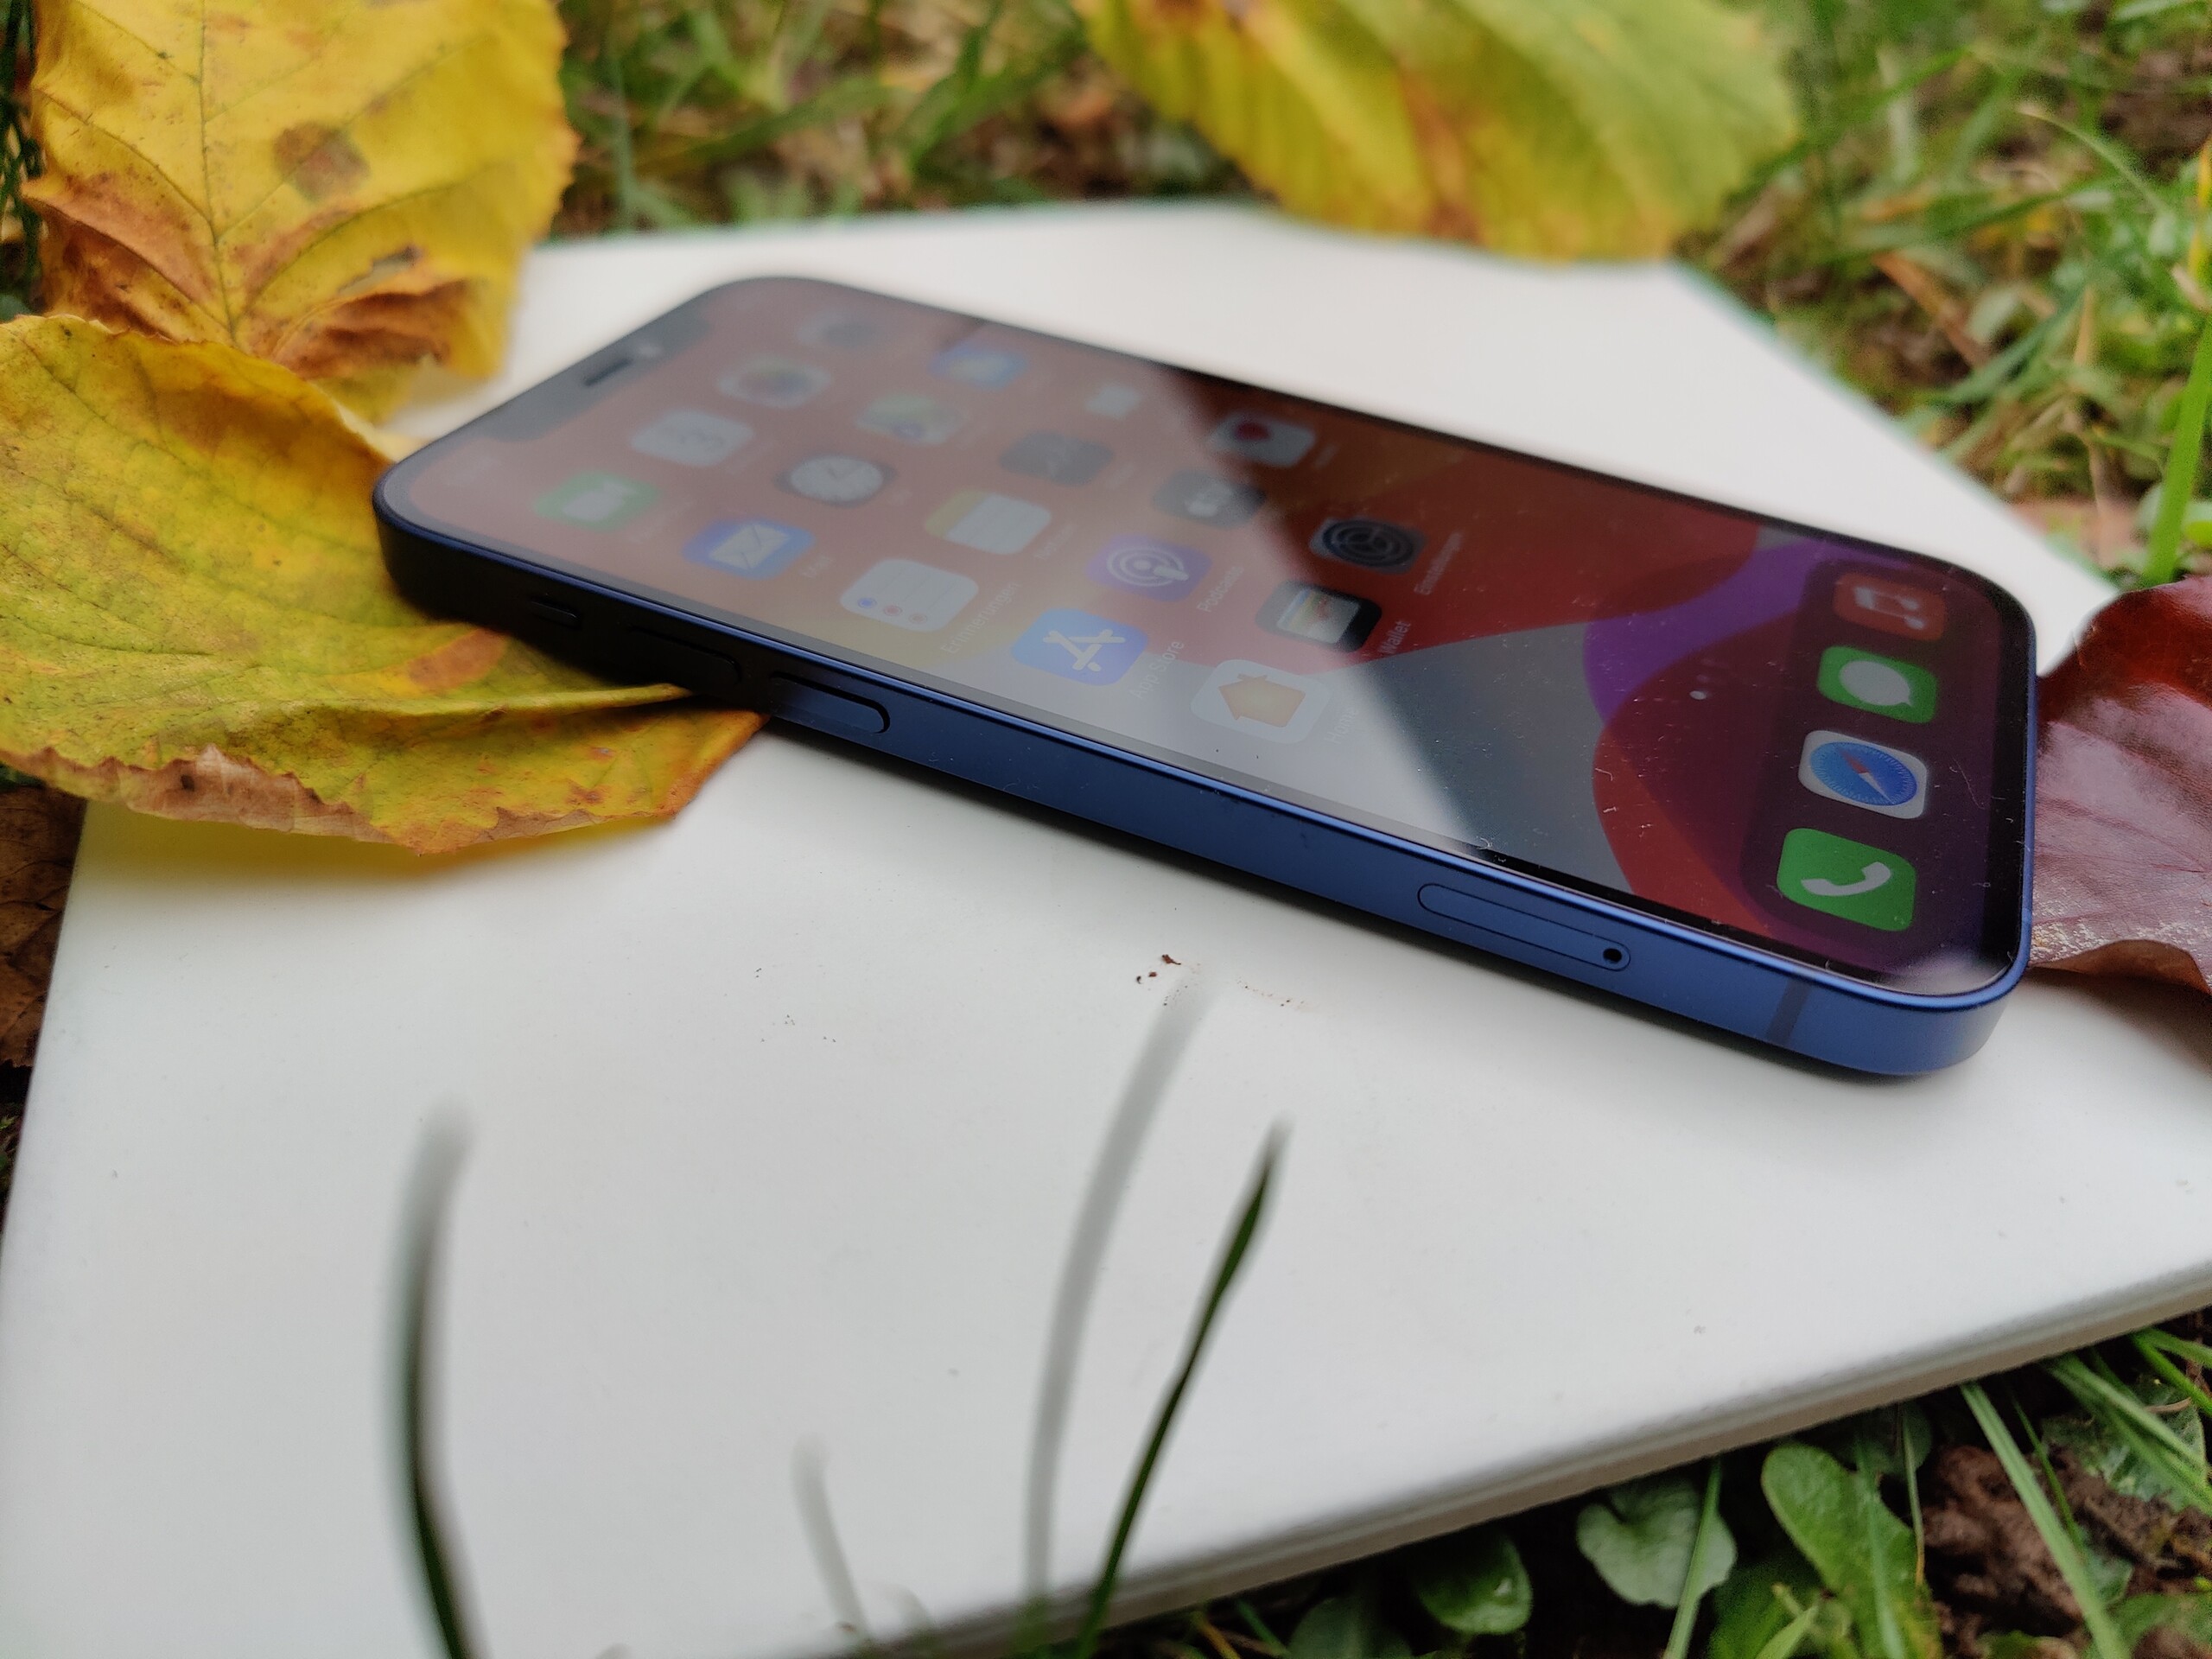
Ser man på den separat imponerar iPhone 12 återigen med utmärkt hantverk och vacker design. Den nya MagSafe-porten kommer troligen snart att innebära massor av nya tredjepartstillbehör, som det brukar vara, och den kan till och med användas för att ladda telefonen.
Apple har släppt en bra uppdatering som kanske inte kan ses som revolutionerande men som är ett logiskt nästa steg som uppfyller den höga standard som Apples köpare är vana vid och förväntar sig.
Apple iPhone 12
- 08/31/2022 v7 (old)
Florian Schmitt
Price comparison
