Test: Apple iPad 7 2019 - Små förändringar med stor påverkan? (Sammanfattning)
Gradering | Datum | Modell | Vikt | Höjd | Storlek | Upplösning | Pris |
|---|---|---|---|---|---|---|---|
| 85.4 % v7 (old) | 10/2019 | Apple iPad 7 2019 A10 Fusion, A10 Fusion GPU | 483 g | 7.5 mm | 10.20" | 2160x1620 | |
| 84.6 % v7 (old) | 04/2018 | Apple iPad 6 2018 A10 Fusion, A10 Fusion GPU | 469 g | 7.5 mm | 9.70" | 2048x1536 | |
| 87.5 % v7 (old) | 04/2019 | Apple iPad Air 3 2019 A12 Bionic, A12 Bionic GPU | 456 g | 6.1 mm | 10.50" | 2224x1668 | |
| 89.8 % v7 (old) | 12/2018 | Apple iPad Pro 11 2018 A12X Bionic, A12X Bionic GPU | 468 g | 5.9 mm | 11.00" | 2388x1668 | |
| 87.5 % v6 (old) | 08/2018 | Huawei MediaPad M5 10.8 Pro Kirin 960, Mali-G71 MP8 | 498 g | 7.3 mm | 10.80" | 2560x1600 | |
| 84.5 % v7 (old) | 06/2019 | Samsung Galaxy Tab S5e SM-T720 SD 670, Adreno 616 | 400 g | 5.5 mm | 10.50" | 2560x1600 |


| |||||||||||||||||||||||||
Distribution av ljusstyrkan: 87 %
Mitt på batteriet: 499 cd/m²
Kontrast: 1018:1 (Svärta: 0.49 cd/m²)
ΔE ColorChecker Calman: 0.97 | ∀{0.5-29.43 Ø4.73}
ΔE Greyscale Calman: 0.9 | ∀{0.09-98 Ø4.97}
97.8% sRGB (Calman 2D)
Gamma: 2.135
CCT: 6571 K
| Apple iPad 7 2019 IPS, 2160x1620, 10.2" | Apple iPad 6 2018 IPS, 2048x1536, 9.7" | Apple iPad Air 3 2019 IPS, 2224x1668, 10.5" | Apple iPad Pro 11 2018 IPS, 2388x1668, 11" | Huawei MediaPad M5 10.8 Pro IPS, 2560x1600, 10.8" | Samsung Galaxy Tab S5e SM-T720 Super AMOLED, 2560x1600, 10.5" | |
|---|---|---|---|---|---|---|
| Screen | -14% | -44% | 4% | -255% | -57% | |
| Brightness middle (cd/m²) | 499 | 530 6% | 515 3% | 639 28% | 384 -23% | 452 -9% |
| Brightness (cd/m²) | 470 | 513 9% | 483 3% | 591 26% | 360 -23% | 453 -4% |
| Brightness Distribution (%) | 87 | 92 6% | 90 3% | 87 0% | 84 -3% | 90 3% |
| Black Level * (cd/m²) | 0.49 | 0.61 -24% | 0.41 16% | 0.45 8% | 0.8 -63% | |
| Contrast (:1) | 1018 | 869 -15% | 1256 23% | 1420 39% | 480 -53% | |
| Colorchecker dE 2000 * | 0.97 | 1.2 -24% | 1.6 -65% | 0.92 5% | 6.83 -604% | 1.7 -75% |
| Colorchecker dE 2000 max. * | 1.98 | 3.2 -62% | 4.4 -122% | 2.59 -31% | 12.7 -541% | 3.7 -87% |
| Greyscale dE 2000 * | 0.9 | 1 -11% | 2.8 -211% | 1.3 -44% | 7.5 -733% | 2.4 -167% |
| Gamma | 2.135 103% | 2.28 96% | 2.21 100% | 2.22 99% | 2.199 100% | 2.07 106% |
| CCT | 6571 99% | 6588 99% | 6944 94% | 6656 98% | 8544 76% | 6337 103% |
* ... mindre är bättre
Skärmflimmer / PWM (Puls-Width Modulation)
| Skärmflimmer / PWM upptäcktes inte | 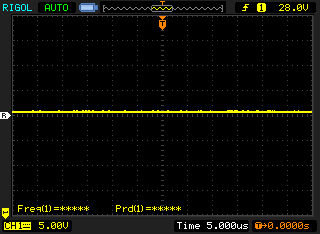 | ||
Som jämförelse: 52 % av alla testade enheter använder inte PWM för att dämpa skärmen. Om PWM upptäcktes mättes ett medelvärde av 7791 (minst: 5 - maximum: 343500) Hz. | |||
Visa svarstider
| ↔ Svarstid svart till vitt | ||
|---|---|---|
| 18 ms ... stiga ↗ och falla ↘ kombinerat | ↗ 7 ms stiga | 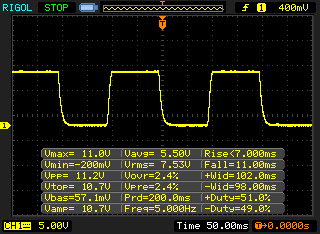 |
| ↘ 11 ms hösten | ||
| Skärmen visar bra svarsfrekvens i våra tester, men kan vara för långsam för konkurrenskraftiga spelare. I jämförelse sträcker sig alla testade enheter från 0.1 (minst) till 240 (maximalt) ms. » 40 % av alla enheter är bättre. Det betyder att den uppmätta svarstiden liknar genomsnittet av alla testade enheter (19.9 ms). | ||
| ↔ Svarstid 50 % grått till 80 % grått | ||
| 38 ms ... stiga ↗ och falla ↘ kombinerat | ↗ 19 ms stiga | 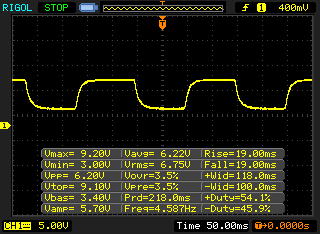 |
| ↘ 19 ms hösten | ||
| Skärmen visar långsamma svarsfrekvenser i våra tester och kommer att vara otillfredsställande för spelare. I jämförelse sträcker sig alla testade enheter från 0.165 (minst) till 636 (maximalt) ms. » 55 % av alla enheter är bättre. Detta innebär att den uppmätta svarstiden är sämre än genomsnittet av alla testade enheter (31.1 ms). | ||
| Jetstream 2 - 2.0 Total | |
| Genomsnitt av klass Tablet (35.8 - 395, n=58, senaste 2 åren) | |
| Apple iPad Air 3 2019 (Safari Mobile 12) | |
| Apple iPad 7 2019 (Safari 13) | |
| Genomsnitt Apple A10 Fusion (54.2 - 76.2, n=2) | |
| Samsung Galaxy Tab S5e SM-T720 (Chrome 74.0.3729.136) | |
| JetStream 1.1 - 1.1 Total | |
| Apple iPad Pro 11 2018 (Safari 13) | |
| Apple iPad 7 2019 (Safari 13) | |
| Genomsnitt Apple A10 Fusion (165.9 - 172.6, n=4) | |
| Apple iPad 6 2018 (Safari Mobile 11.3) | |
| Huawei MediaPad M5 10.8 Pro (Chrome 68.0.3440.91) | |
| Samsung Galaxy Tab S5e SM-T720 (Chrome 74.0.3729.136) | |
| WebXPRT 3 - Overall | |
| Genomsnitt av klass Tablet (108 - 480, n=10, senaste 2 åren) | |
| Apple iPad Pro 11 2018 (Safari 13) | |
| Apple iPad Air 3 2019 (Safari Mobile 12) | |
| Apple iPad 7 2019 (Safari 13) | |
| Genomsnitt Apple A10 Fusion (79 - 111, n=2) | |
| Apple iPad 6 2018 (Safari Mobile 10) | |
| Huawei MediaPad M5 10.8 Pro (Chrome 68.0.3440.91) | |
| Samsung Galaxy Tab S5e SM-T720 (Chrome 74.0.3729.136) | |
| Speedometer 2.0 - Result 2.0 | |
| Genomsnitt av klass Tablet (2.59 - 790, n=37, senaste 2 åren) | |
| Apple iPad Pro 11 2018 (IOS 12.1.1) | |
| Apple iPad Air 3 2019 (Safari Mobile 12) | |
| Apple iPad 7 2019 (Safari 13) | |
| Genomsnitt Apple A10 Fusion (65.5 - 66.4, n=2) | |
| Apple iPad 6 2018 (IOS 12.1.1) | |
| Samsung Galaxy Tab S5e SM-T720 (Chrome 74.0.3729.136) | |
| Octane V2 - Total Score | |
| Genomsnitt av klass Tablet (763 - 138481, n=73, senaste 2 åren) | |
| Apple iPad Pro 11 2018 (Safari 13) | |
| Apple iPad Air 3 2019 (Safari Mobile 12) | |
| Apple iPad 6 2018 (Safari Mobile 11.3) | |
| Apple iPad 7 2019 (Safari 13) | |
| Genomsnitt Apple A10 Fusion (19783 - 27967, n=5) | |
| Huawei MediaPad M5 10.8 Pro (Chrome 68.0.3440.91) | |
| Samsung Galaxy Tab S5e SM-T720 (Chrome 74.0.3729.136) | |
| Mozilla Kraken 1.1 - Total | |
| Huawei MediaPad M5 10.8 Pro (Chrome 68.0.3440.91) | |
| Samsung Galaxy Tab S5e SM-T720 (Chrome 74.0.3729.136) | |
| Genomsnitt av klass Tablet (243 - 27101, n=67, senaste 2 åren) | |
| Genomsnitt Apple A10 Fusion (1026 - 1531, n=5) | |
| Apple iPad 7 2019 (Safari 13) | |
| Apple iPad 6 2018 (Safari Mobile 11.3) | |
| Apple iPad Air 3 2019 (Safari Mobile 12) | |
| Apple iPad Pro 11 2018 (Safari 13) | |
* ... mindre är bättre
#new_benchmarks
| Apple iPad 7 2019 mAh | Apple iPad 6 2018 mAh | Apple iPad Air 3 2019 8134 mAh | Apple iPad Pro 11 2018 7736 mAh | Huawei MediaPad M5 10.8 Pro 7500 mAh | Samsung Galaxy Tab S5e SM-T720 7040 mAh | |
|---|---|---|---|---|---|---|
| Batteridrifttid | -3% | -0% | 24% | -8% | 8% | |
| Reader / Idle (h) | 24.8 | 25 1% | 34.3 38% | 20.9 -16% | 21.1 -15% | |
| H.264 (h) | 13.4 | 11.4 -15% | 16.4 22% | 10.5 -22% | 14.4 7% | |
| WiFi v1.3 (h) | 11.8 | 11.9 1% | 12.3 4% | 15.3 30% | 11.2 -5% | 10.4 -12% |
| Load (h) | 3.3 | 3.1 -6% | 3.6 9% | 3.5 6% | 3.7 12% | 5 52% |
Initial Verdict
Läs den fullständiga versionen av den här recensionen på engelska här.
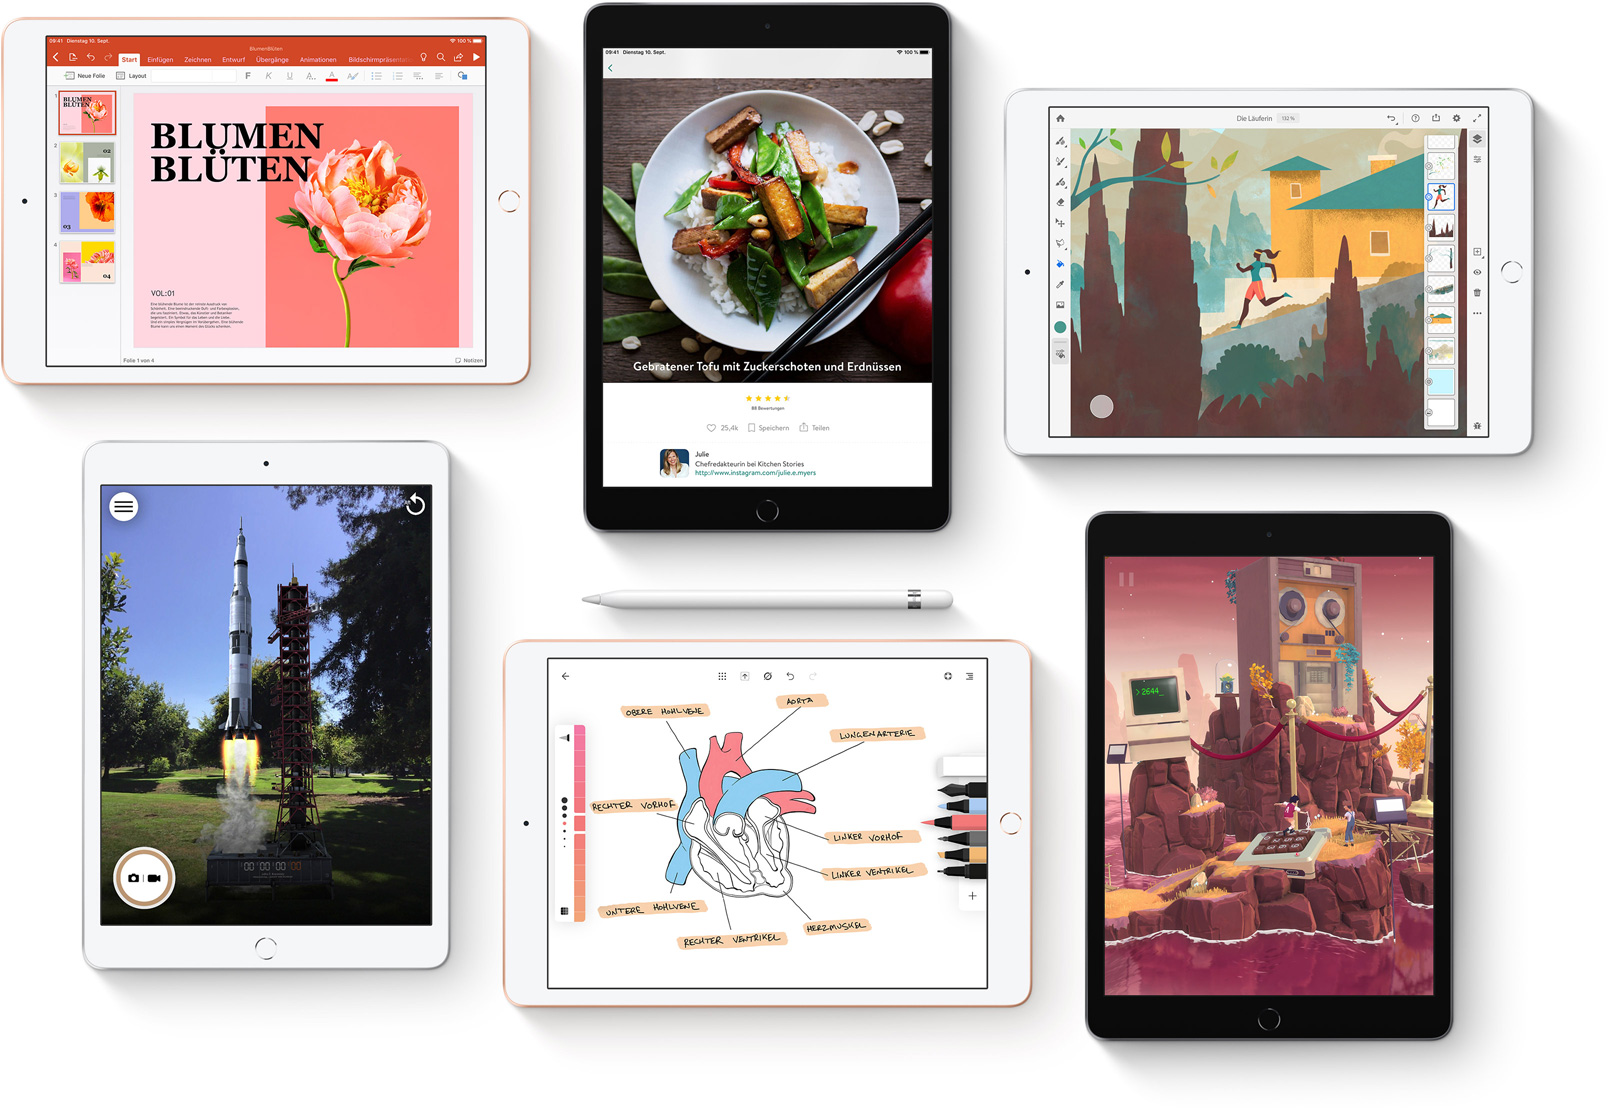
Är det fortfarande roligt att använda en iPad? Vi tycker det, men det beror i huvudsak på nya iPadOS snarare än på att iPad 7 2019 har några betydande hårdvaruförändringar.
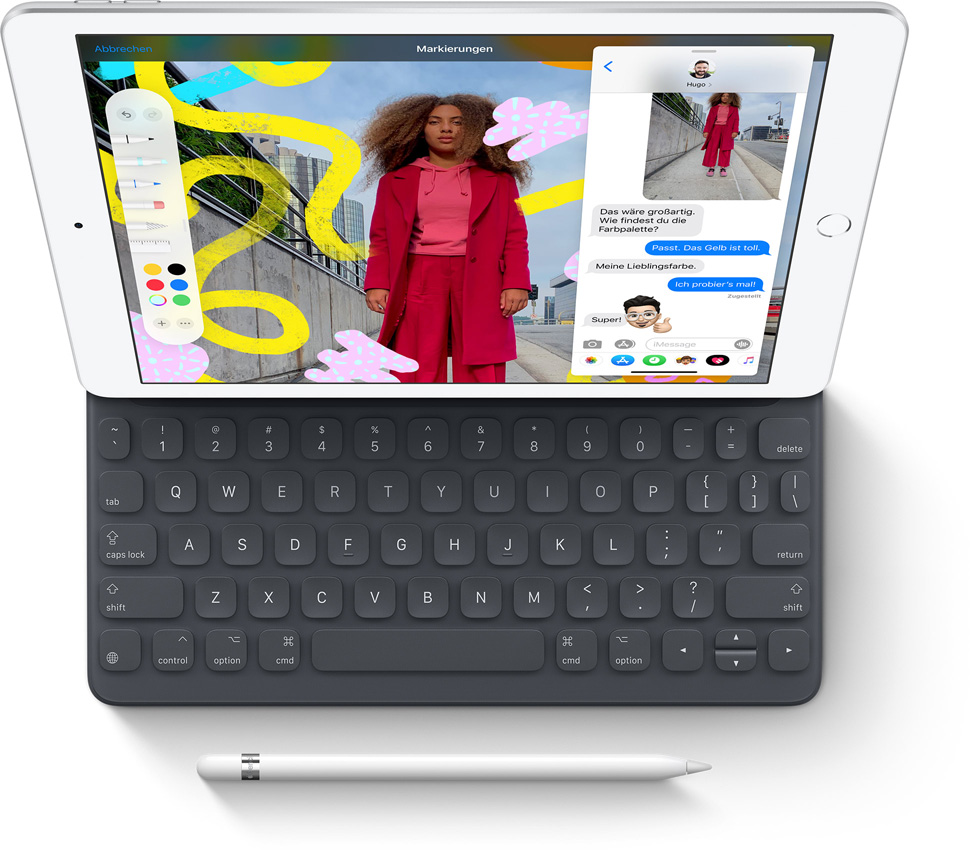
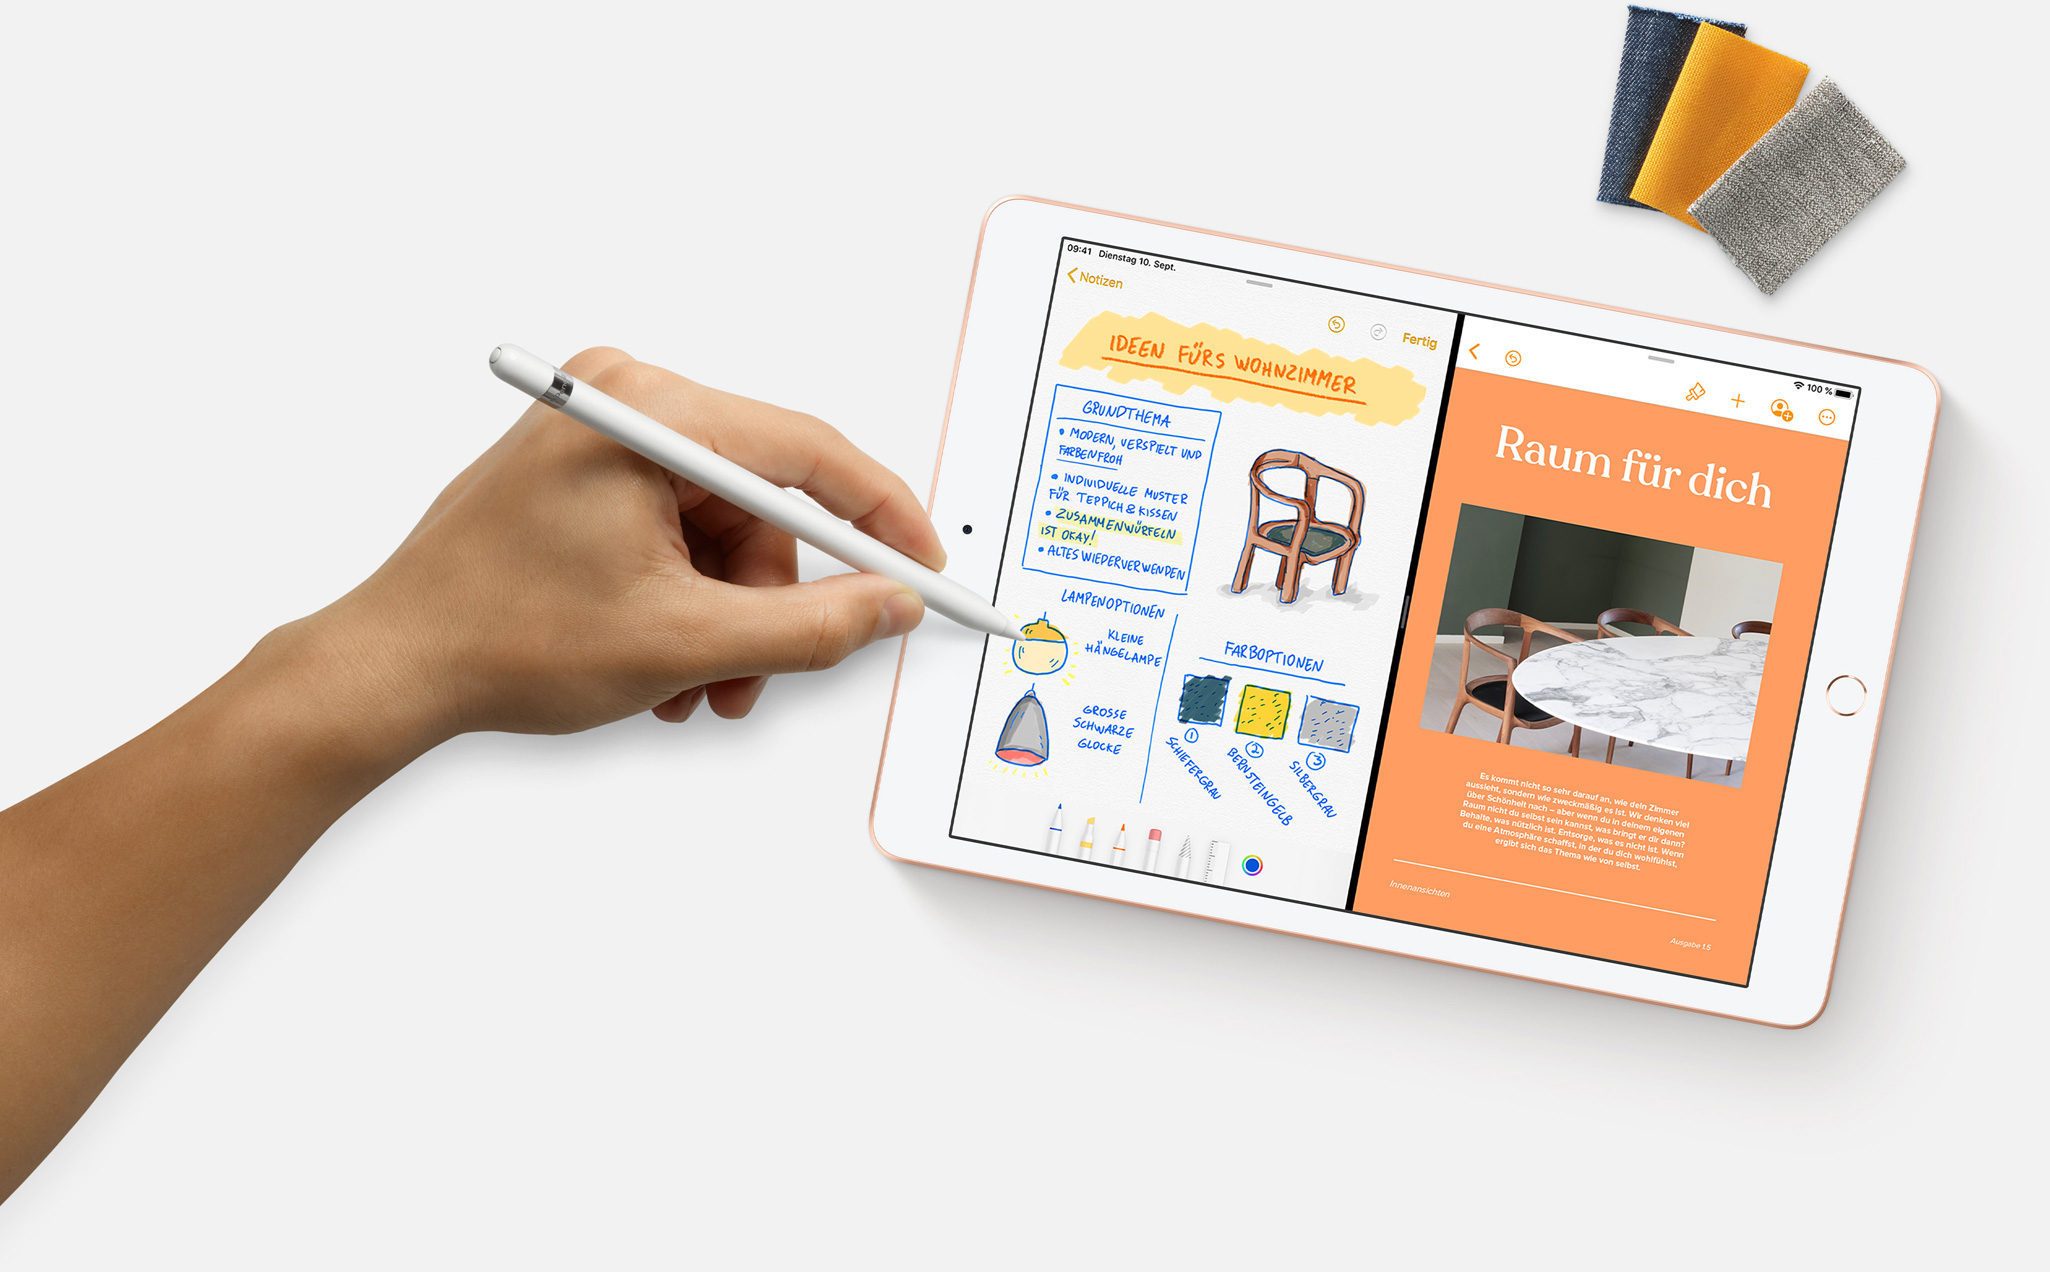
I korthet är nya iPad en aningen större version av iPad 6 med stöd för Apple Pencil och Apple Smart Keyboard. Men det har funnits tredjepartstangentbord till iPad i åratal, så stöd för Smart Keyboard är egentligen inte en anledning att uppgradera från iPad 6 till iPad 7. Smart Keyboard, även om det är välgjort, är också extremt dyrt för ett löstagbart tangentbord.
För ca 4.000 kronor är iPad 7 dessutom dyr och det är värt att komma ihåg att det priset är för modellen med 32 GB och WiFi. Apple tar 5.000 kronor för modellen med 128 GB och WiFi och ytterligare ca 2.000 kronor för LTE-anslutbarhet, vilket gör att det bara är runt 600 kronor i skillnad mellan den och WiFi-varianten av iPad Air med 256 GB lagring. Men trots detta är iPad 7 en bra surfplatta för hemmet eller skolan som har rikligt med kraft för alla appar på App Store. Lyxig design, stöd för penna, ett väloptimerat OS och skapliga kameror kommer fortfarande få folk att reagera.
Price comparison
