Test: Apple iPad Pro 12.9 (2020) - Finjustering av flaggskeppet (Sammanfattning)
Gradering | Datum | Modell | Vikt | Höjd | Storlek | Upplösning | Pris |
|---|---|---|---|---|---|---|---|
| 89.3 % v7 (old) | 05/2020 | Apple iPad Pro 12.9 2020 A12Z Bionic, A12Z Bionic GPU | 641 g | 5.9 mm | 12.90" | 2732x2048 | |
| 90.2 % v7 (old) | 11/2018 | Apple iPad Pro 12.9 2018 A12X Bionic, A12X Bionic GPU | 633 g | 5.9 mm | 12.90" | 2732x2048 | |
| 90.4 % v7 (old) | 04/2020 | Apple iPad Pro 11 2020 A12Z Bionic, A12Z Bionic GPU | 471 g | 5.9 mm | 11.00" | 2388x1668 | |
| 88.1 % v7 (old) | 02/2020 | Microsoft Surface Pro 7 i7-1065G7, Iris Plus Graphics G7 (Ice Lake 64 EU) | 790 g | 8.5 mm | 12.30" | 2736x1824 | |
| 87.8 % v7 (old) | 10/2019 | Samsung Galaxy Tab S6 SM-T860 SD 855, Adreno 640 | 420 g | 5.7 mm | 10.50" | 2560x1600 |


| |||||||||||||||||||||||||
Distribution av ljusstyrkan: 87 %
Mitt på batteriet: 625 cd/m²
Kontrast: 1330:1 (Svärta: 0.47 cd/m²)
ΔE ColorChecker Calman: 1.3 | ∀{0.5-29.43 Ø4.73}
ΔE Greyscale Calman: 1.8 | ∀{0.09-98 Ø4.97}
99.7% sRGB (Calman 2D)
Gamma: 2.23
CCT: 6765 K
| Apple iPad Pro 12.9 2020 IPS, 2732x2048, 12.9" | Apple iPad Pro 12.9 2018 IPS, 2732x2048, 12.9" | Apple iPad Pro 11 2020 IPS, 2388x1668, 11" | Microsoft Surface Pro 7 IPS, 2736x1824, 12.3" | Samsung Galaxy Tab S6 SM-T860 Super AMOLED, 2560x1600, 10.5" | |
|---|---|---|---|---|---|
| Screen | 15% | 16% | 5% | -47% | |
| Brightness middle (cd/m²) | 625 | 632 1% | 617 -1% | 435 -30% | 446 -29% |
| Brightness (cd/m²) | 599 | 605 1% | 585 -2% | 422 -30% | 445 -26% |
| Brightness Distribution (%) | 87 | 91 5% | 84 -3% | 90 3% | 86 -1% |
| Black Level * (cd/m²) | 0.47 | 0.32 32% | 0.36 23% | 0.32 32% | |
| Contrast (:1) | 1330 | 1975 48% | 1714 29% | 1359 2% | |
| Colorchecker dE 2000 * | 1.3 | 1.1 15% | 0.94 28% | 1.18 9% | 2.7 -108% |
| Colorchecker dE 2000 max. * | 2.7 | 2.4 11% | 1.87 31% | 2.27 16% | 5.4 -100% |
| Greyscale dE 2000 * | 1.8 | 1.7 6% | 1.4 22% | 1.12 38% | 2.1 -17% |
| Gamma | 2.23 99% | 2.21 100% | 2.156 102% | 2.3 96% | 2.05 107% |
| CCT | 6765 96% | 6794 96% | 6733 97% | 6502 100% | 6468 100% |
| Colorchecker dE 2000 calibrated * | 3.49 | ||||
| Color Space (Percent of AdobeRGB 1998) (%) | 60 | ||||
| Color Space (Percent of sRGB) (%) | 96 |
* ... mindre är bättre
Skärmflimmer / PWM (Puls-Width Modulation)
| Skärmflimmer / PWM upptäckt | 58820 Hz | ≤ 13 % ljusstyrka inställning | 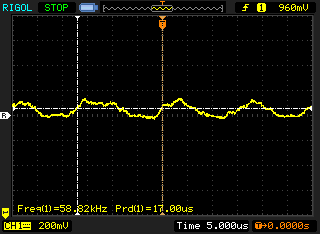 |
Displayens bakgrundsbelysning flimrar vid 58820 Hz (i värsta fall, t.ex. med PWM) Flimrande upptäckt vid en ljusstyrkeinställning på 13 % och lägre. Det ska inte finnas något flimmer eller PWM över denna ljusstyrkeinställning. Frekvensen för 58820 Hz är ganska hög, så de flesta användare som är känsliga för PWM bör inte märka något flimmer. Som jämförelse: 52 % av alla testade enheter använder inte PWM för att dämpa skärmen. Om PWM upptäcktes mättes ett medelvärde av 7794 (minst: 5 - maximum: 343500) Hz. | |||
Visa svarstider
| ↔ Svarstid svart till vitt | ||
|---|---|---|
| 24.4 ms ... stiga ↗ och falla ↘ kombinerat | ↗ 8.4 ms stiga | 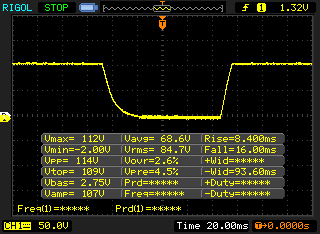 |
| ↘ 16 ms hösten | ||
| Skärmen visar bra svarsfrekvens i våra tester, men kan vara för långsam för konkurrenskraftiga spelare. I jämförelse sträcker sig alla testade enheter från 0.1 (minst) till 240 (maximalt) ms. » 57 % av alla enheter är bättre. Detta innebär att den uppmätta svarstiden är sämre än genomsnittet av alla testade enheter (19.9 ms). | ||
| ↔ Svarstid 50 % grått till 80 % grått | ||
| 46.8 ms ... stiga ↗ och falla ↘ kombinerat | ↗ 18.4 ms stiga | 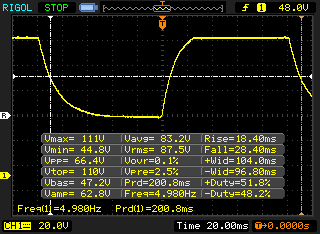 |
| ↘ 28.4 ms hösten | ||
| Skärmen visar långsamma svarsfrekvenser i våra tester och kommer att vara otillfredsställande för spelare. I jämförelse sträcker sig alla testade enheter från 0.165 (minst) till 636 (maximalt) ms. » 80 % av alla enheter är bättre. Detta innebär att den uppmätta svarstiden är sämre än genomsnittet av alla testade enheter (31.1 ms). | ||
| 3DMark | |
| 1280x720 offscreen Ice Storm Unlimited Score | |
| Apple iPad Pro 11 2020 | |
| Genomsnitt Apple A12Z Bionic (110582 - 110846, n=2) | |
| Apple iPad Pro 12.9 2020 | |
| Apple iPad Pro 12.9 2018 | |
| Samsung Galaxy Tab S6 SM-T860 | |
| 1280x720 offscreen Ice Storm Unlimited Graphics Score | |
| Apple iPad Pro 11 2020 | |
| Genomsnitt Apple A12Z Bionic (220422 - 221941, n=2) | |
| Apple iPad Pro 12.9 2020 | |
| Apple iPad Pro 12.9 2018 | |
| Samsung Galaxy Tab S6 SM-T860 | |
| 1280x720 offscreen Ice Storm Unlimited Physics | |
| Apple iPad Pro 12.9 2020 | |
| Genomsnitt Apple A12Z Bionic (40279 - 40299, n=2) | |
| Apple iPad Pro 11 2020 | |
| Apple iPad Pro 12.9 2018 | |
| Samsung Galaxy Tab S6 SM-T860 | |
| AnTuTu v8 - Total Score | |
| Apple iPad Pro 12.9 2020 | |
| Genomsnitt Apple A12Z Bionic (712218 - 751846, n=2) | |
| Apple iPad Pro 11 2020 | |
| Basemark ES 3.1 / Metal - offscreen Overall Score | |
| Apple iPad Pro 12.9 2020 | |
| Genomsnitt Apple A12Z Bionic (5657 - 5709, n=2) | |
| Apple iPad Pro 11 2020 | |
| Apple iPad Pro 12.9 2018 | |
| Genomsnitt av klass Tablet (255 - 5784, n=7, senaste 2 åren) | |
| Jetstream 2 - 2.0 Total | |
| Genomsnitt av klass Tablet (35.8 - 395, n=58, senaste 2 åren) | |
| Apple iPad Pro 11 2020 (Safari 14.1) | |
| Apple iPad Pro 11 2020 (Chrome 80) | |
| Apple iPad Pro 12.9 2020 (Safari 13) | |
| Genomsnitt Apple A12Z Bionic (124.5 - 127.4, n=3) | |
| Samsung Galaxy Tab S6 SM-T860 (Chrome 77.0.3865.116) | |
| JetStream 1.1 - 1.1 Total | |
| Apple iPad Pro 12.9 2018 (Safari Mobile 12) | |
| Apple iPad Pro 11 2020 (Chrome 80) | |
| Genomsnitt Apple A12Z Bionic (272 - 274, n=2) | |
| Apple iPad Pro 12.9 2020 (Safari 13) | |
| Microsoft Surface Pro 7 (Microsoft Edge 44.18362.449.0) | |
| Samsung Galaxy Tab S6 SM-T860 (Chrome 77.0.3865.116) | |
| WebXPRT 3 - Overall | |
| Genomsnitt av klass Tablet (108 - 480, n=10, senaste 2 åren) | |
| Apple iPad Pro 11 2020 (Safari 14.1) | |
| Apple iPad Pro 11 2020 (Chrome 80) | |
| Apple iPad Pro 12.9 2018 (Safari Mobile 12) | |
| Genomsnitt Apple A12Z Bionic (140 - 194, n=3) | |
| Apple iPad Pro 12.9 2020 (Safari 13) | |
| Samsung Galaxy Tab S6 SM-T860 (Chrome 77.0.3865.116) | |
| Speedometer 2.0 - Result 2.0 | |
| Genomsnitt av klass Tablet (2.59 - 790, n=37, senaste 2 åren) | |
| Apple iPad Pro 11 2020 (Safari 14.1) | |
| Genomsnitt Apple A12Z Bionic (135 - 154, n=2) | |
| Apple iPad Pro 12.9 2020 (Safari 13) | |
| Samsung Galaxy Tab S6 SM-T860 (Chrome 77.0.3865.116) | |
| Octane V2 - Total Score | |
| Genomsnitt av klass Tablet (763 - 138481, n=73, senaste 2 åren) | |
| Apple iPad Pro 12.9 2018 (Safari Mobile 12) | |
| Apple iPad Pro 12.9 2020 (Safari 13) | |
| Genomsnitt Apple A12Z Bionic (42372 - 43057, n=3) | |
| Apple iPad Pro 11 2020 (Safari 14.1) | |
| Apple iPad Pro 11 2020 (Chrome 80) | |
| Microsoft Surface Pro 7 (Microsoft Edge 44.18362.449.0) | |
| Samsung Galaxy Tab S6 SM-T860 (Chrome 77.0.3865.116) | |
| Mozilla Kraken 1.1 - Total | |
| Genomsnitt av klass Tablet (243 - 27101, n=67, senaste 2 åren) | |
| Samsung Galaxy Tab S6 SM-T860 (Chrome 77.0.3865.116) | |
| Microsoft Surface Pro 7 (Microsoft Edge 44.18362.449.0) | |
| Apple iPad Pro 11 2020 (Chrome 80) | |
| Apple iPad Pro 12.9 2020 (Safari 13) | |
| Genomsnitt Apple A12Z Bionic (646 - 646, n=2) | |
| Apple iPad Pro 12.9 2018 (Safari Mobile 12) | |
* ... mindre är bättre
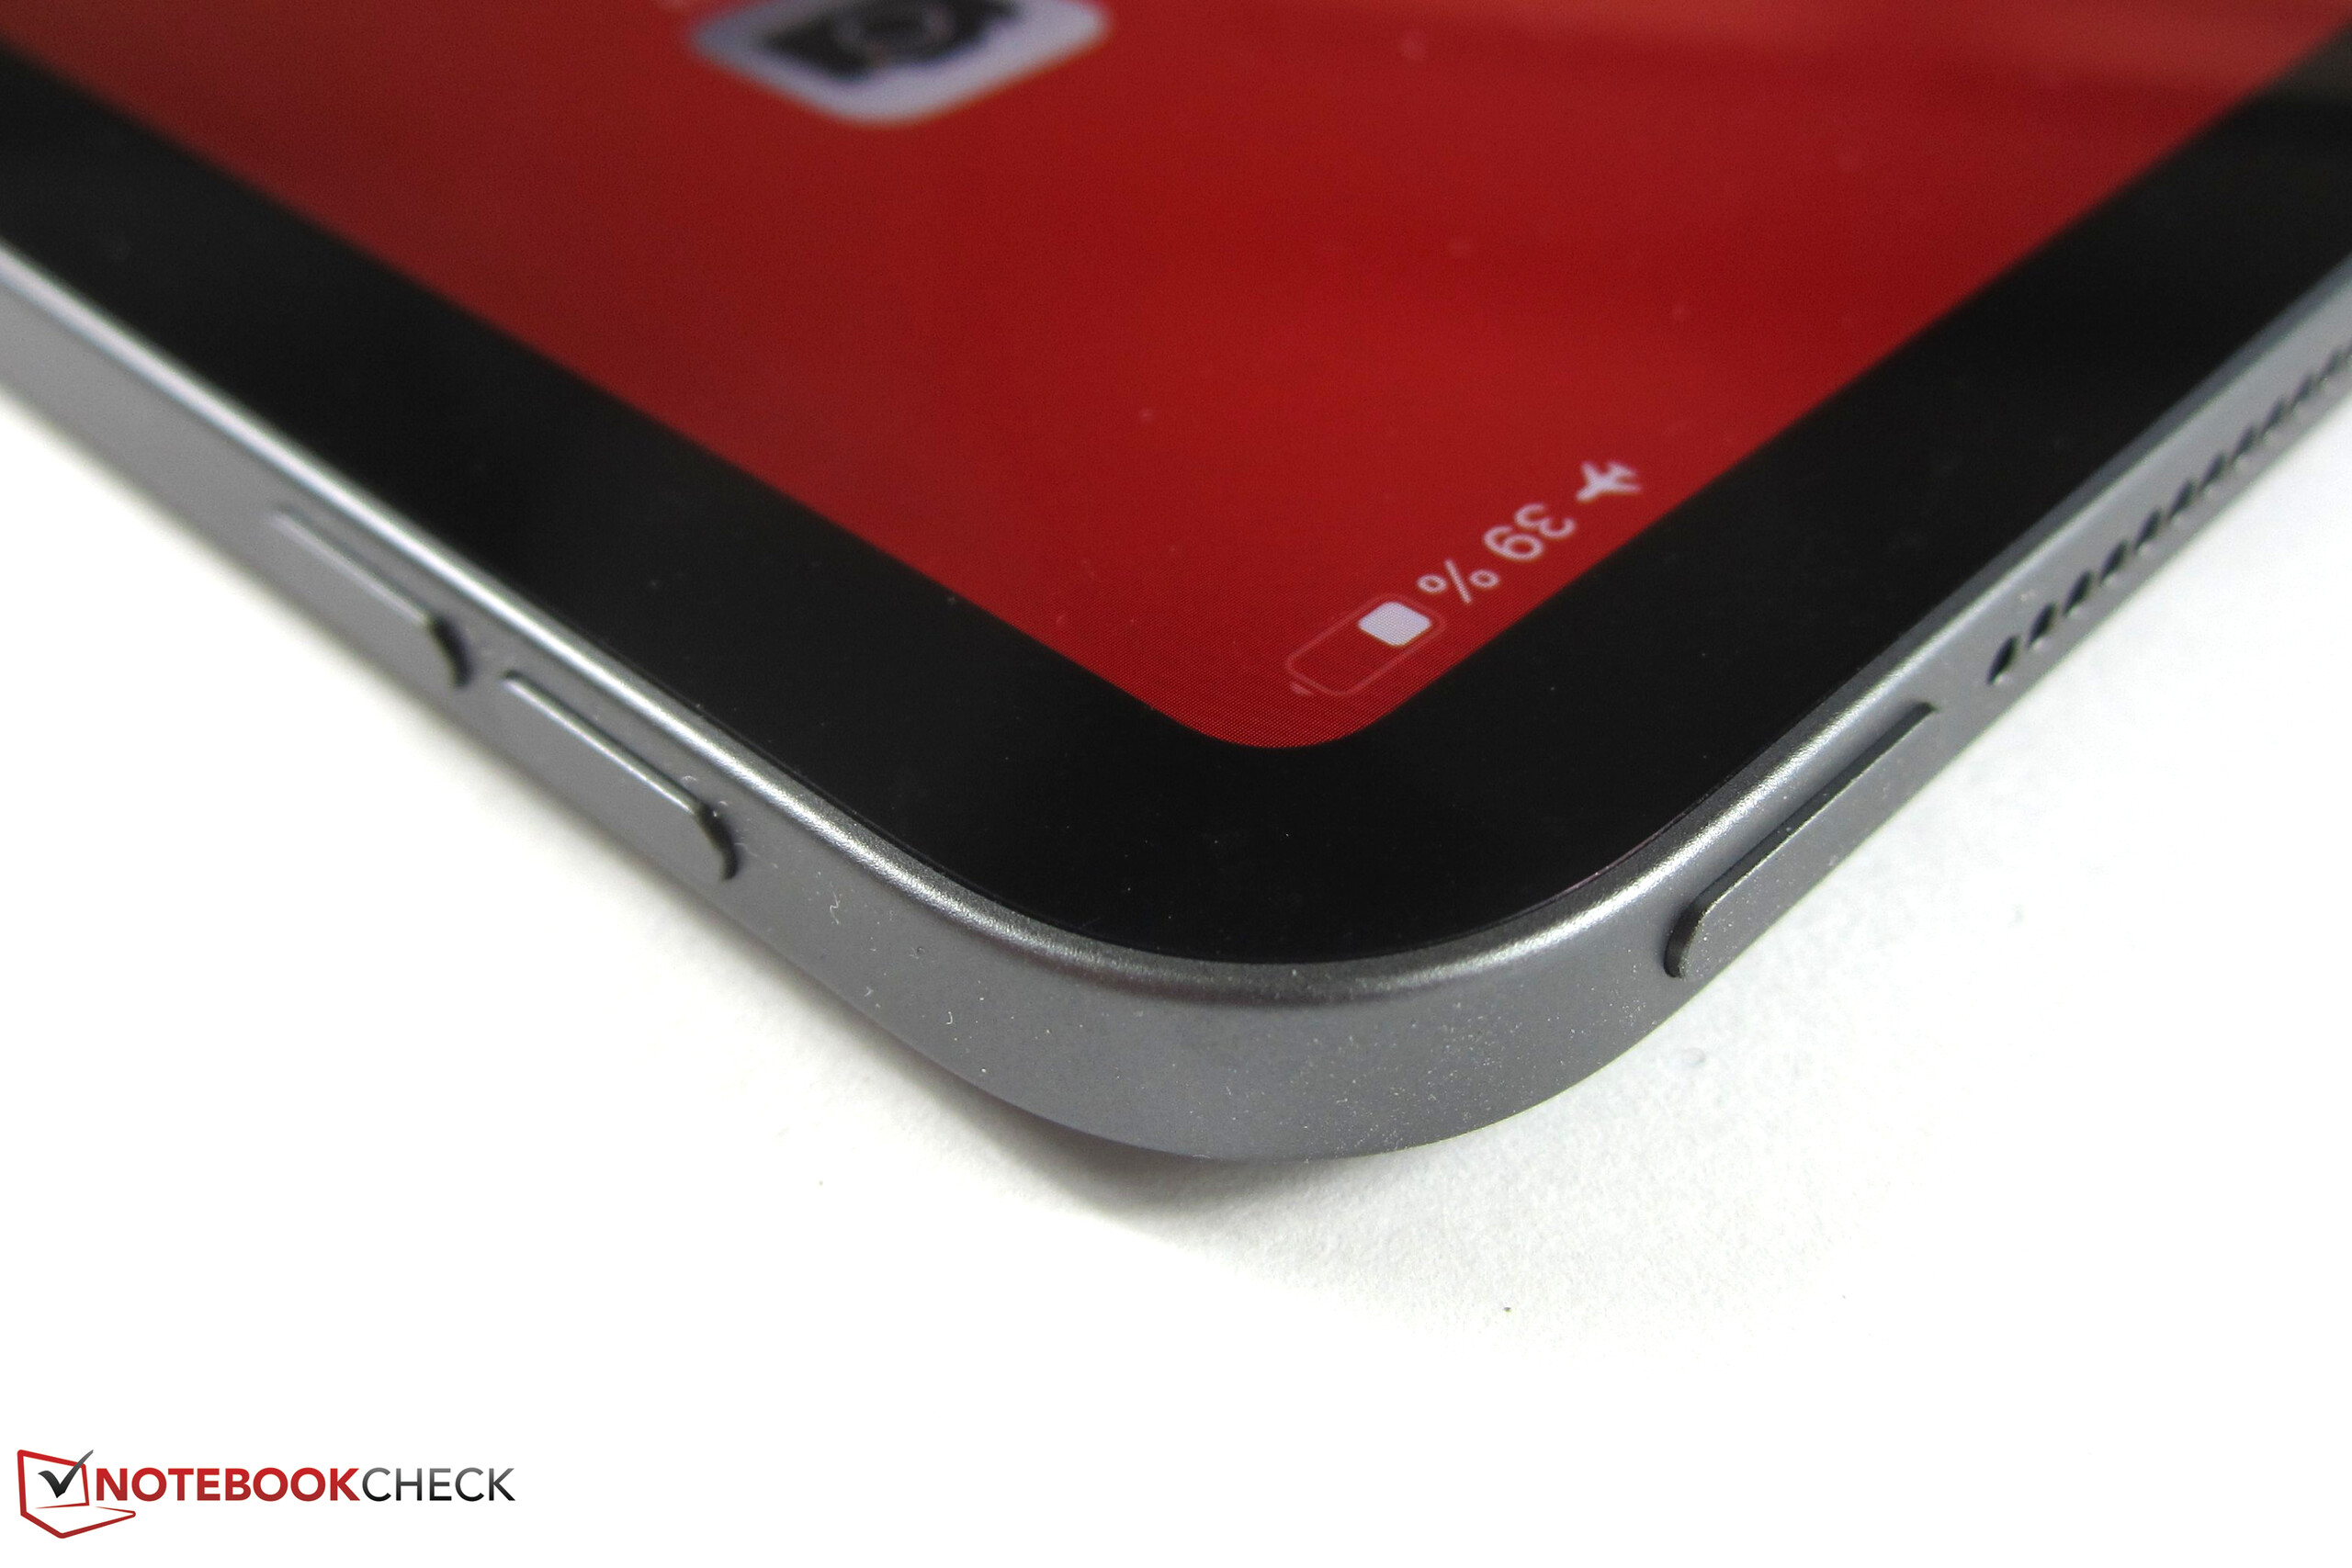
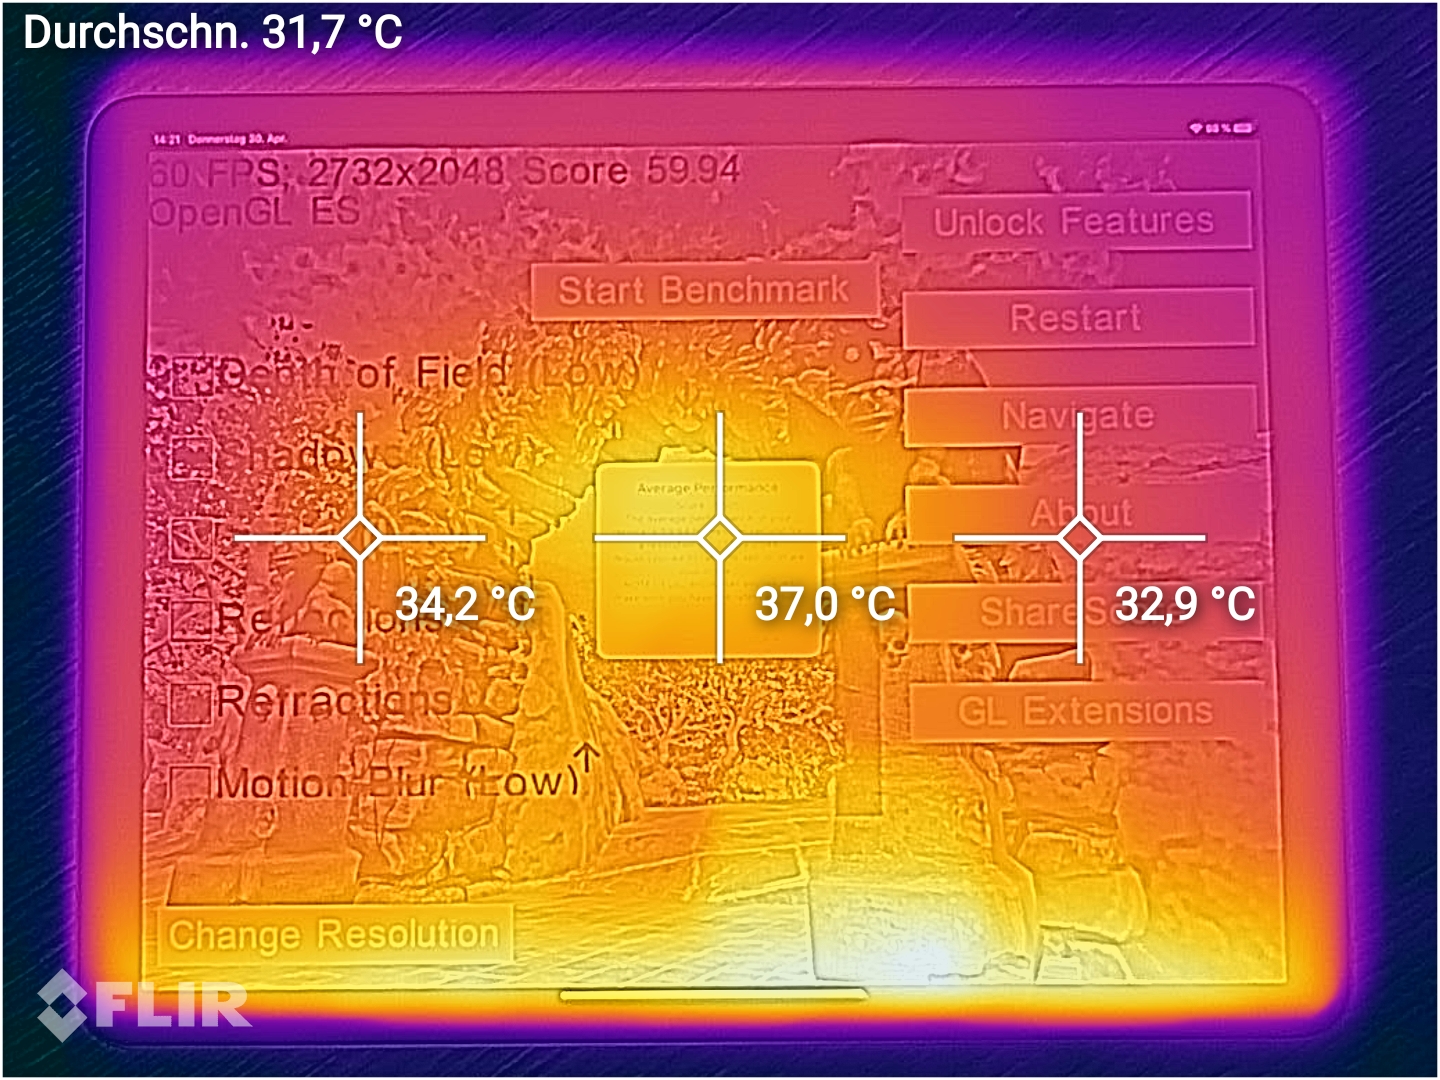
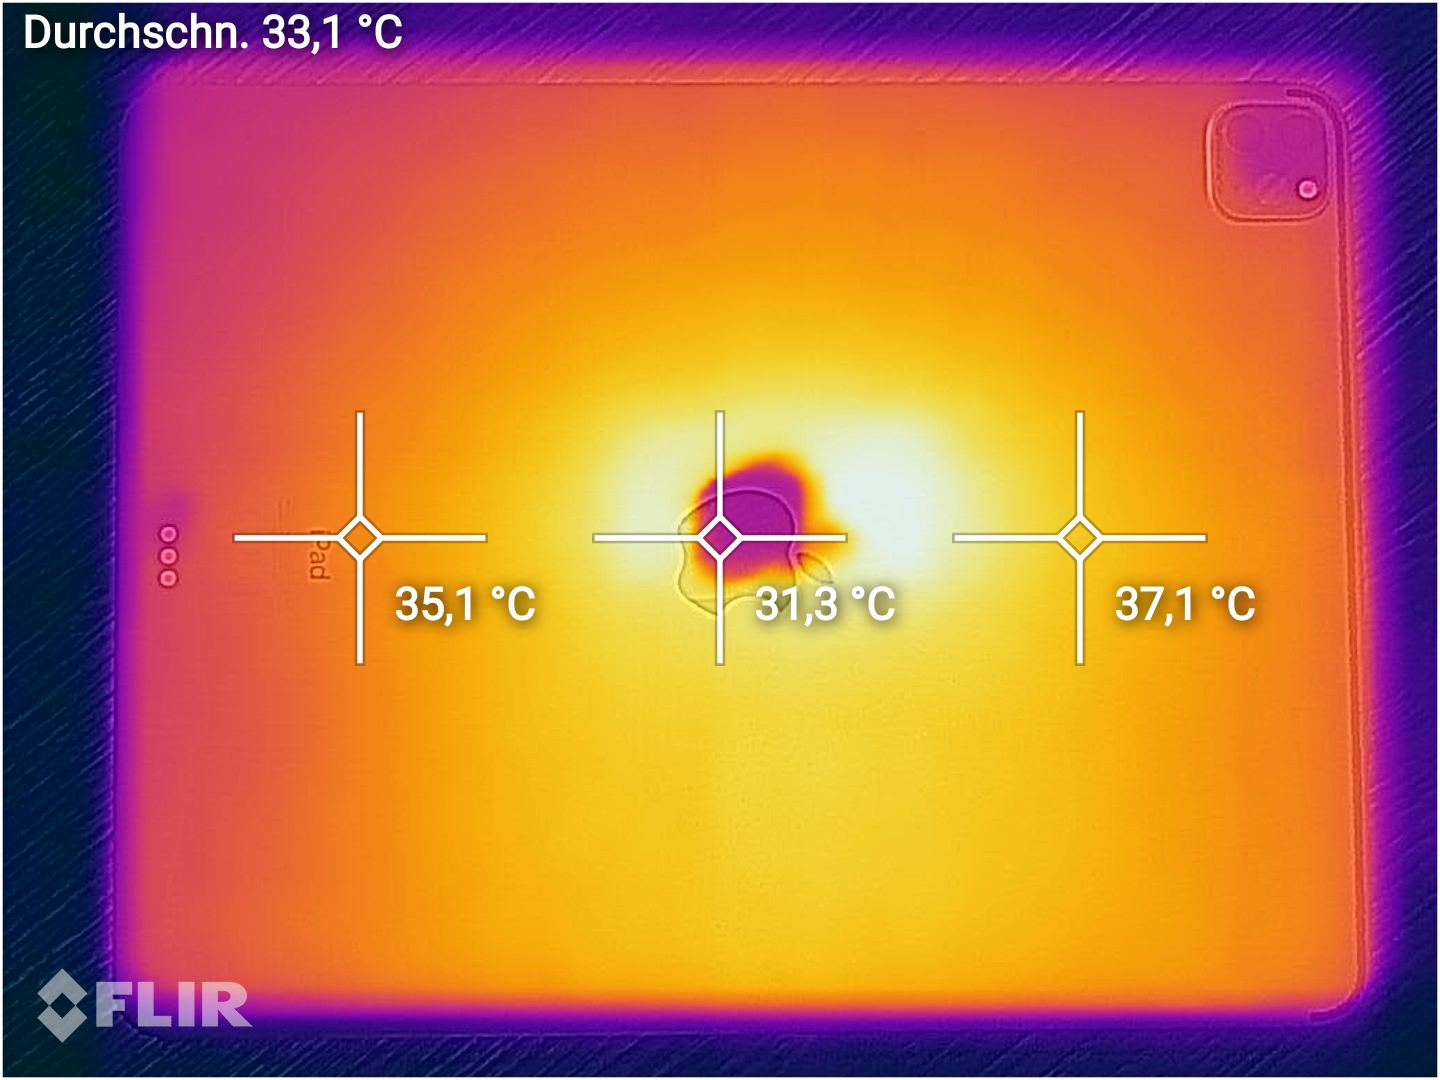
(+) Den maximala temperaturen på ovansidan är 39.1 °C / 102 F, jämfört med genomsnittet av 33.6 °C / 92 F , allt från 20.7 till 53.2 °C för klassen Tablet.
(+) Botten värms upp till maximalt 37.4 °C / 99 F, jämfört med genomsnittet av 33.2 °C / 92 F
(±) Vid tomgångsbruk är medeltemperaturen för ovansidan 33.6 °C / 92 F, jämfört med enhetsgenomsnittet på 30 °C / ### class_avg_f### F.
Apple iPad Pro 12.9 2020 ljudanalys
(±) | högtalarljudstyrkan är genomsnittlig men bra (81 dB)
Bas 100 - 315 Hz
(±) | reducerad bas - i genomsnitt 6.6% lägre än medianen
(±) | linjäriteten för basen är genomsnittlig (10.6% delta till föregående frekvens)
Mellan 400 - 2000 Hz
(+) | balanserad mellan - endast 4.2% från medianen
(+) | mids är linjära (4.6% delta till föregående frekvens)
Högsta 2 - 16 kHz
(+) | balanserade toppar - endast 4.1% från medianen
(+) | toppar är linjära (5.5% delta till föregående frekvens)
Totalt 100 - 16 000 Hz
(+) | det totala ljudet är linjärt (11.2% skillnad mot median)
Jämfört med samma klass
» 11% av alla testade enheter i den här klassen var bättre, 4% liknande, 85% sämre
» Den bästa hade ett delta på 7%, genomsnittet var 20%, sämst var 129%
Jämfört med alla testade enheter
» 7% av alla testade enheter var bättre, 2% liknande, 91% sämre
» Den bästa hade ett delta på 4%, genomsnittet var 24%, sämst var 134%
Microsoft Surface Pro 7 ljudanalys
(-) | inte särskilt höga högtalare (65.2 dB)
Bas 100 - 315 Hz
(±) | reducerad bas - i genomsnitt 10.2% lägre än medianen
(±) | linjäriteten för basen är genomsnittlig (12.1% delta till föregående frekvens)
Mellan 400 - 2000 Hz
(+) | balanserad mellan - endast 4.6% från medianen
(±) | linjäriteten för mids är genomsnittlig (10.2% delta till föregående frekvens)
Högsta 2 - 16 kHz
(+) | balanserade toppar - endast 3.1% från medianen
(+) | toppar är linjära (6.8% delta till föregående frekvens)
Totalt 100 - 16 000 Hz
(±) | linjäriteten för det totala ljudet är genomsnittlig (21.5% skillnad mot median)
Jämfört med samma klass
» 58% av alla testade enheter i den här klassen var bättre, 11% liknande, 32% sämre
» Den bästa hade ett delta på 6%, genomsnittet var 20%, sämst var 57%
Jämfört med alla testade enheter
» 61% av alla testade enheter var bättre, 7% liknande, 33% sämre
» Den bästa hade ett delta på 4%, genomsnittet var 24%, sämst var 134%
| Av/Standby | |
| Låg belastning | |
| Hög belastning |
|
Förklaring:
min: | |
| Apple iPad Pro 12.9 2020 9720 mAh | Apple iPad Pro 12.9 2018 mAh | Apple iPad Pro 11 2020 7538 mAh | Microsoft Surface Pro 7 mAh | Samsung Galaxy Tab S6 SM-T860 7040 mAh | |
|---|---|---|---|---|---|
| Power Consumption | -8% | 11% | -169% | 30% | |
| Idle Minimum * (Watt) | 1.22 | 1.42 -16% | 1.3 -7% | 4.4 -261% | 1.96 -61% |
| Idle Average * (Watt) | 8.68 | 9.35 -8% | 3.5 60% | 8.7 -0% | 2.8 68% |
| Idle Maximum * (Watt) | 8.75 | 9.38 -7% | 5.6 36% | 9.6 -10% | 2.82 68% |
| Load Average * (Watt) | 11.72 | 12.75 -9% | 12.5 -7% | 44 -275% | 5.31 55% |
| Load Maximum * (Watt) | 15.25 | 14.96 2% | 19.2 -26% | 61 -300% | 11.91 22% |
* ... mindre är bättre
| Apple iPad Pro 12.9 2020 9720 mAh | Apple iPad Pro 12.9 2018 mAh | Apple iPad Pro 11 2020 7538 mAh | Microsoft Surface Pro 7 mAh | Samsung Galaxy Tab S6 SM-T860 7040 mAh | |
|---|---|---|---|---|---|
| Batteridrifttid | 6% | 14% | -44% | 14% | |
| Reader / Idle (h) | 30.5 | 31.5 3% | 33.4 10% | 11.5 -62% | 21.3 -30% |
| H.264 (h) | 12.3 | 15 22% | 15.6 27% | 6.7 -46% | 14.5 18% |
| WiFi v1.3 (h) | 15.1 | 13.3 -12% | 15 -1% | 9.8 -35% | 9.3 -38% |
| Load (h) | 2.8 | 3.1 11% | 3.3 18% | 1.9 -32% | 5.7 104% |
För
Emot
Omdöme: Ökar sin ledning

Läs den fullständiga versionen av den här recensionen på engelska här.
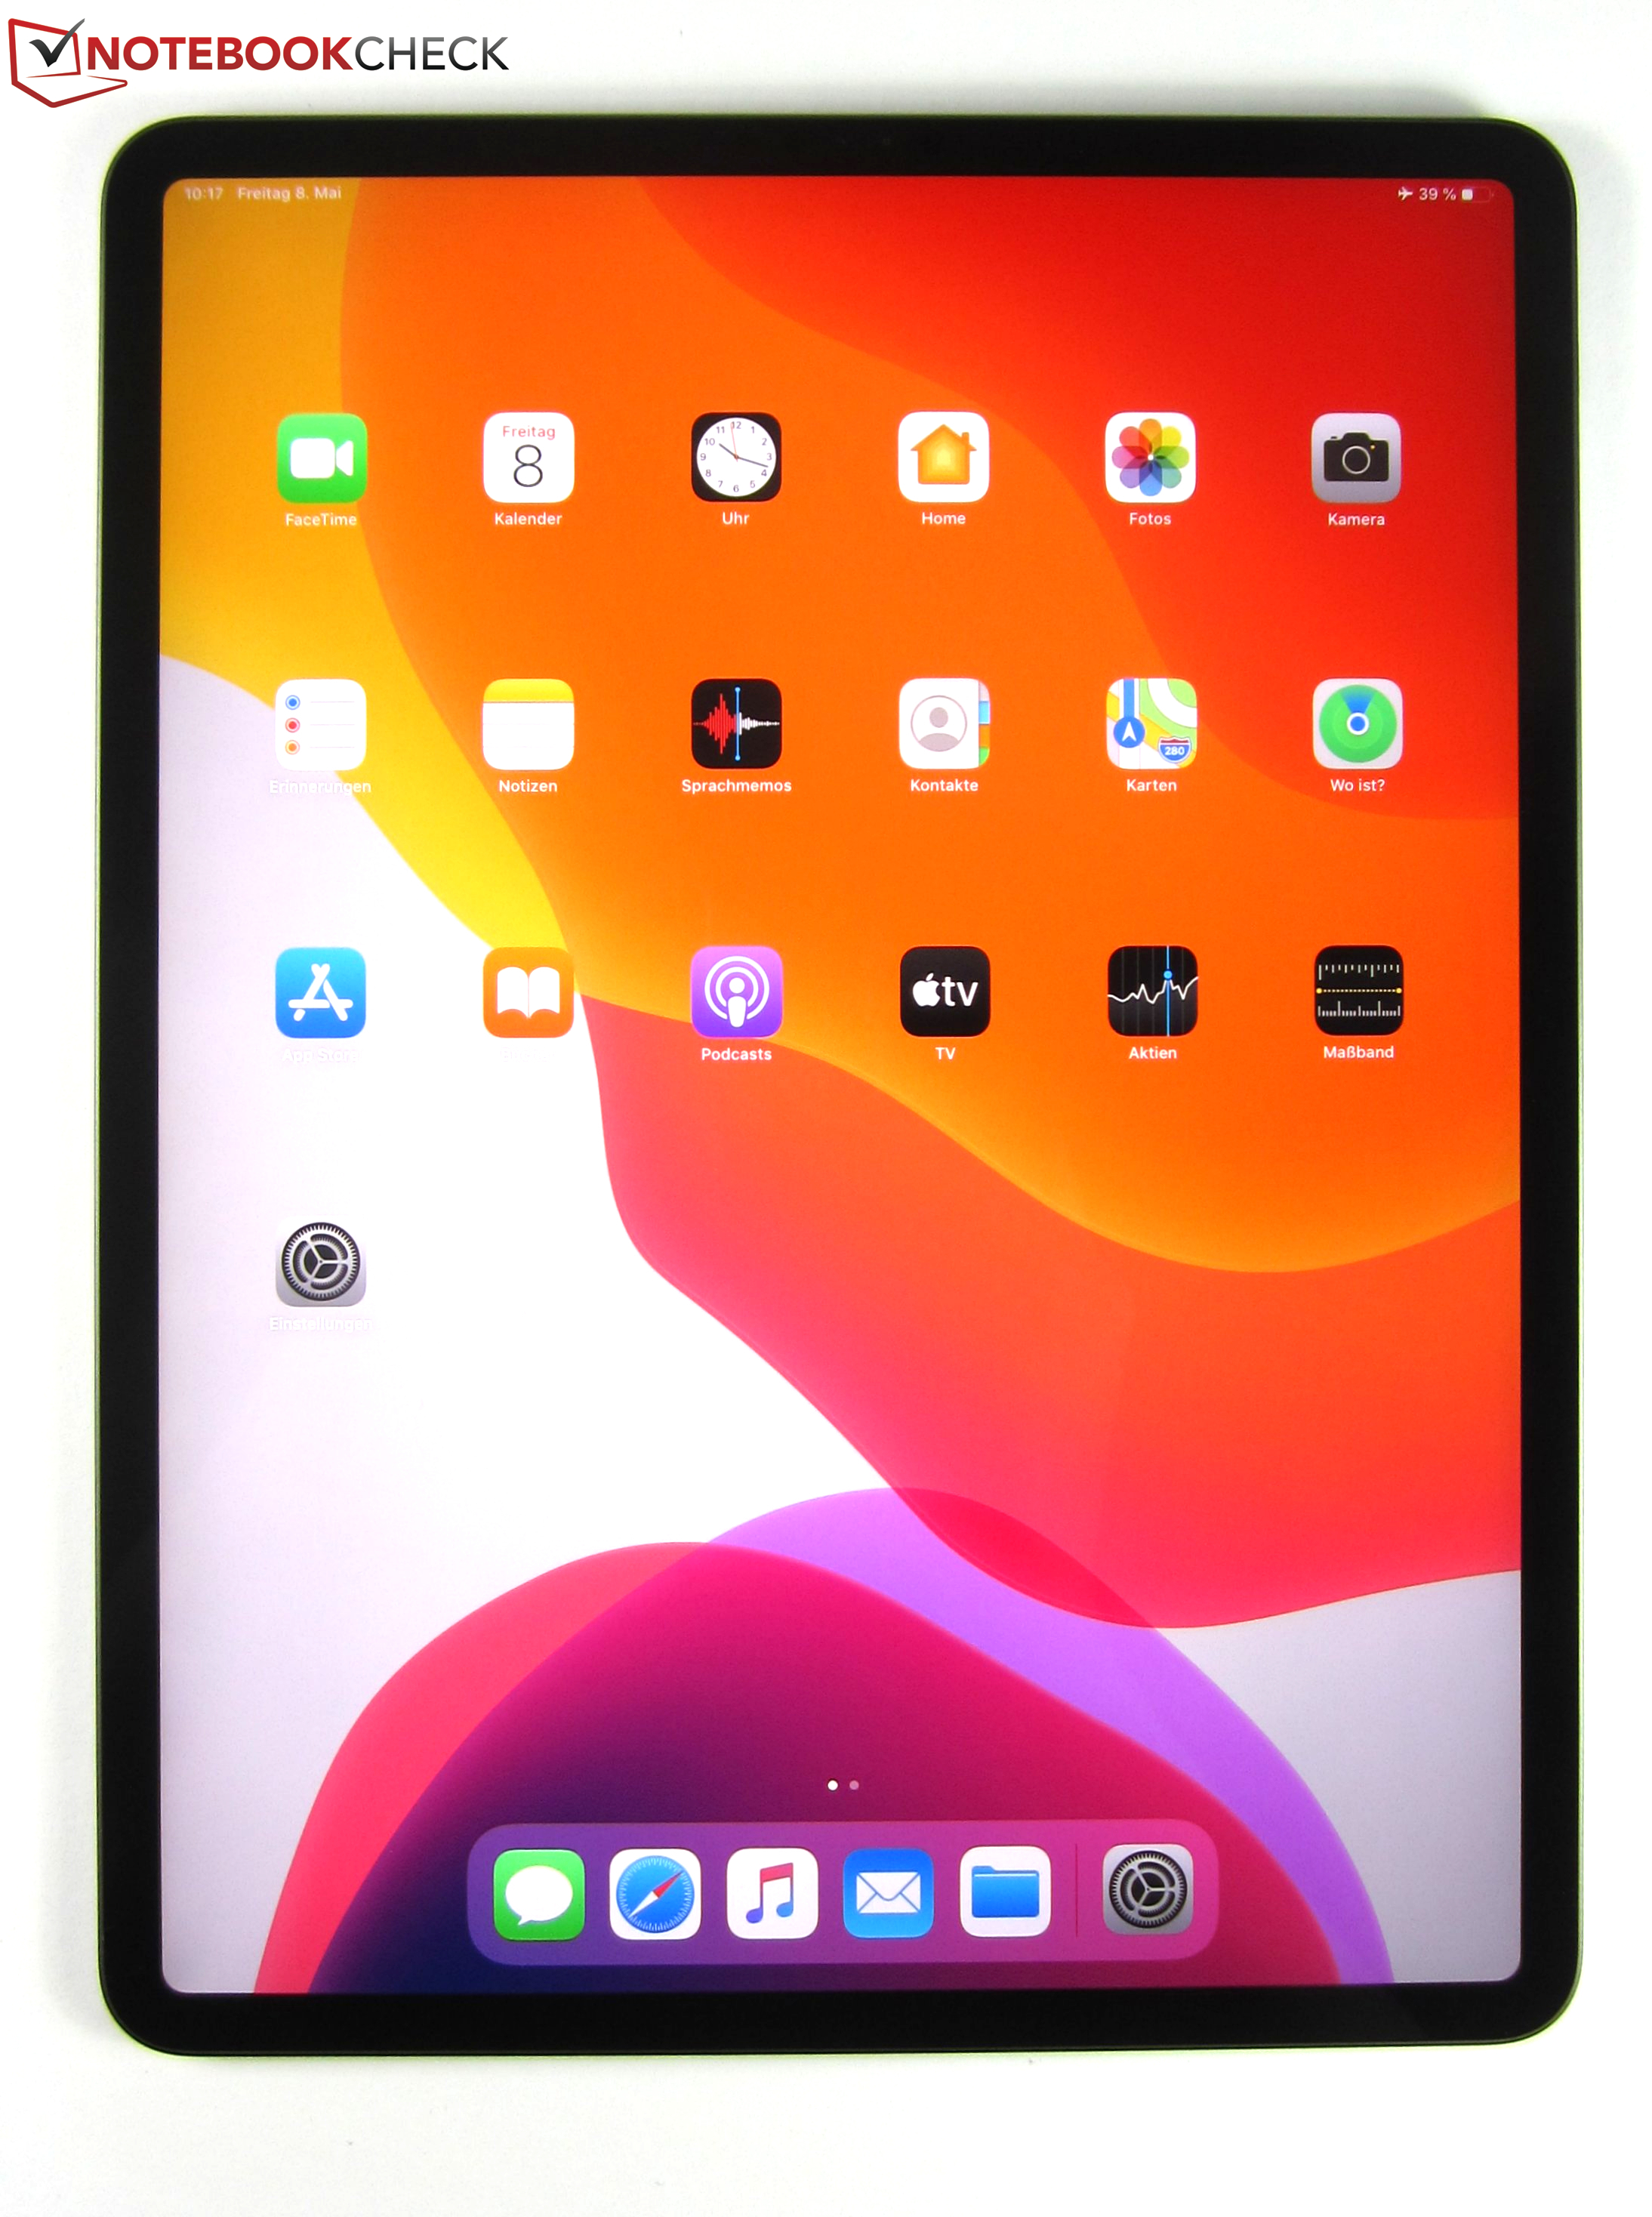
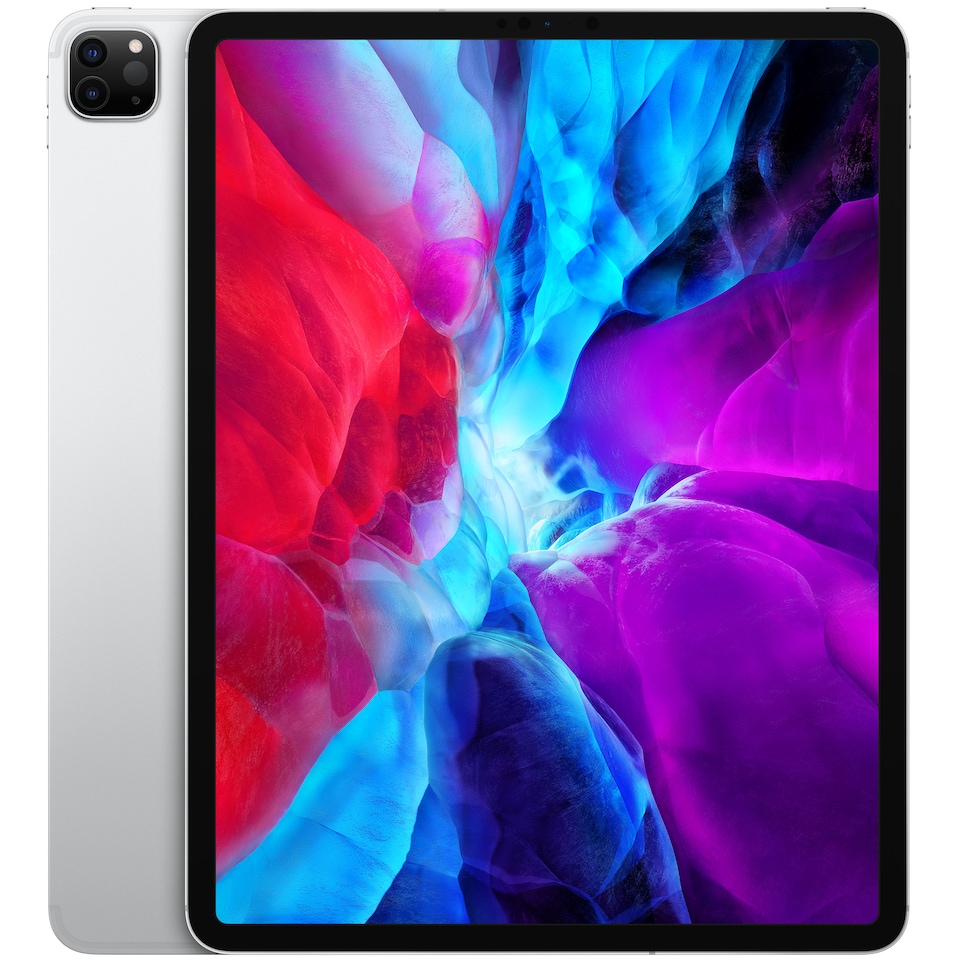
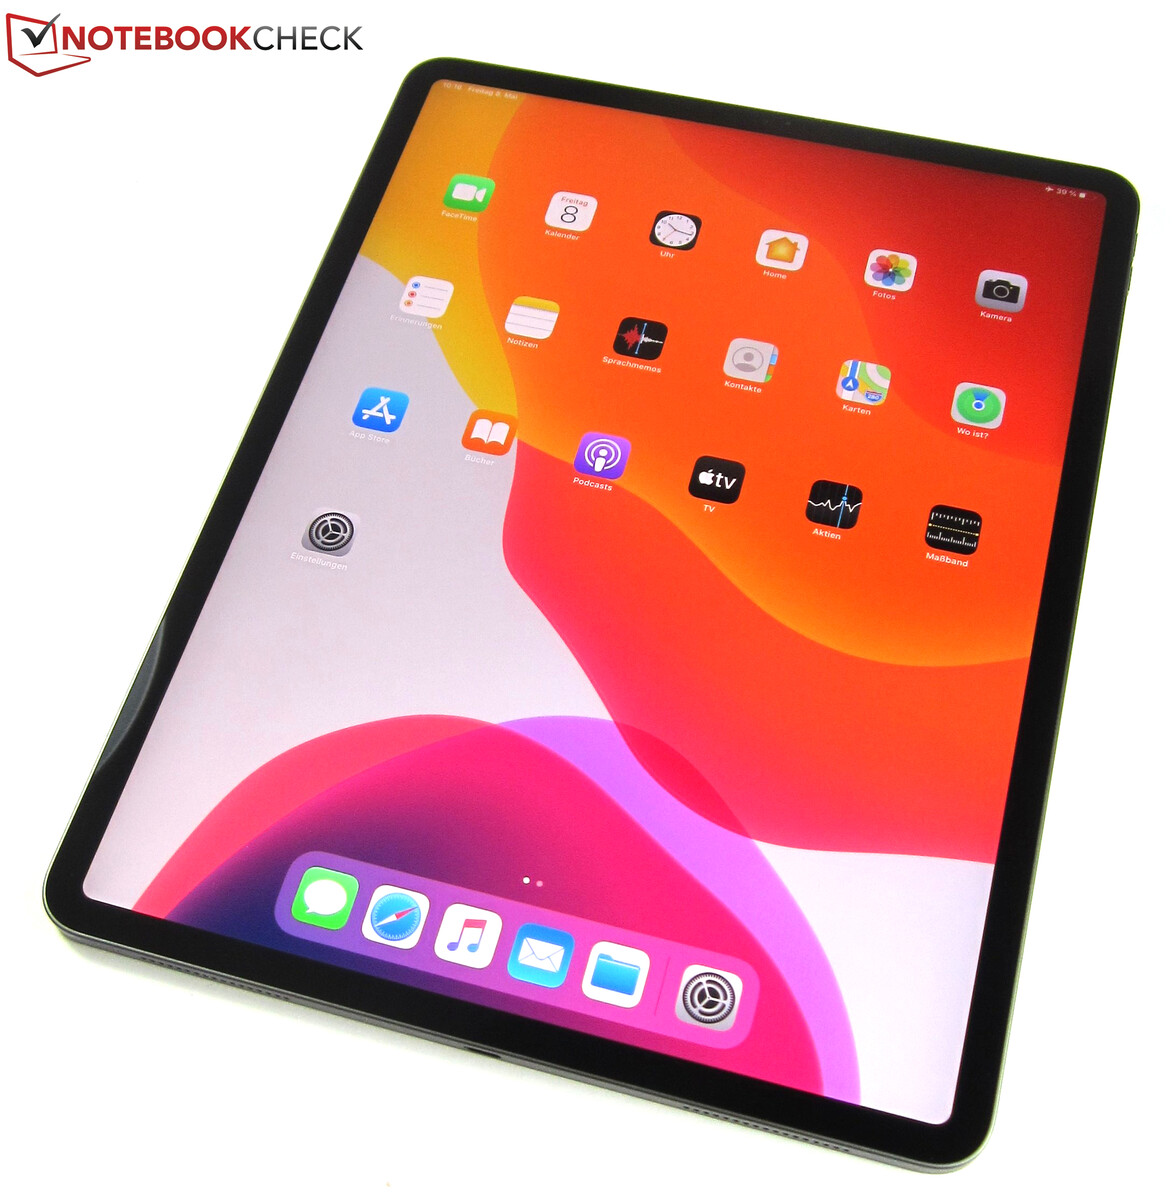
iPad Pro är den för tillfället bästa surfplattan på marknaden. Den är extremt snabb, den välkalibrerade True Tone-skärmen är en välsignelse för kreatörer, användarupplevelsen är fantastiskt smidigt, de fyra inbyggda högtalarna ger utmärkt stereoljud och plattan är dessutom bland de bästa när det kommer till batteritid.
Apple har med några försiktiga uppdateringar ytterligare optimerat vad som redan var marknadens bästa surfplatta.
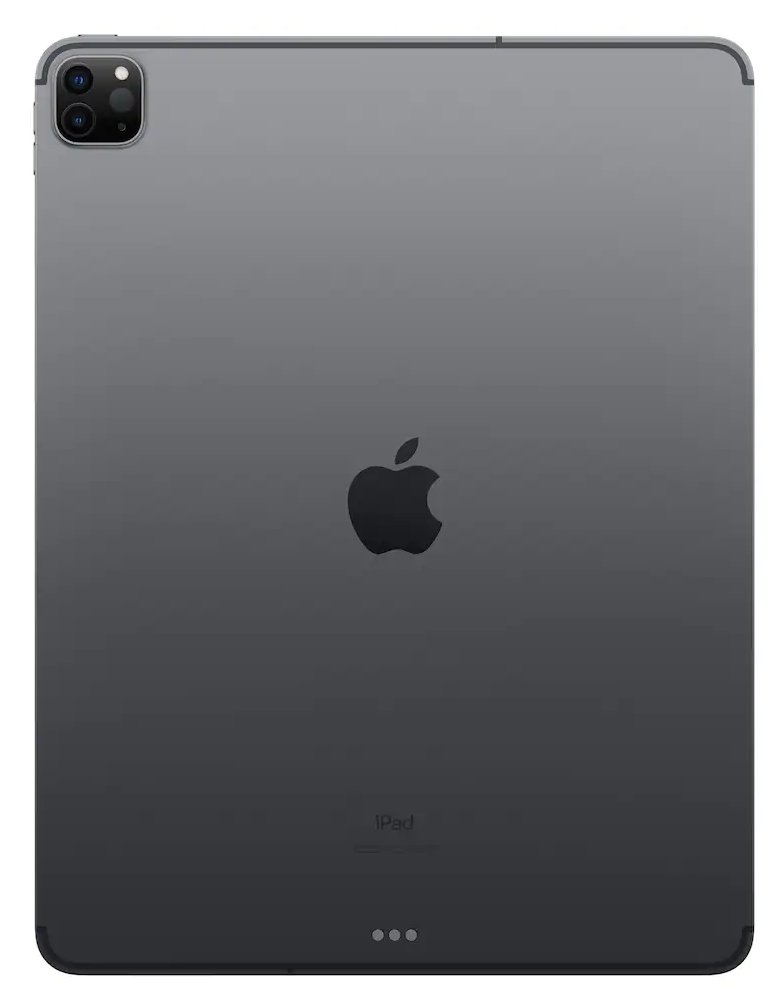
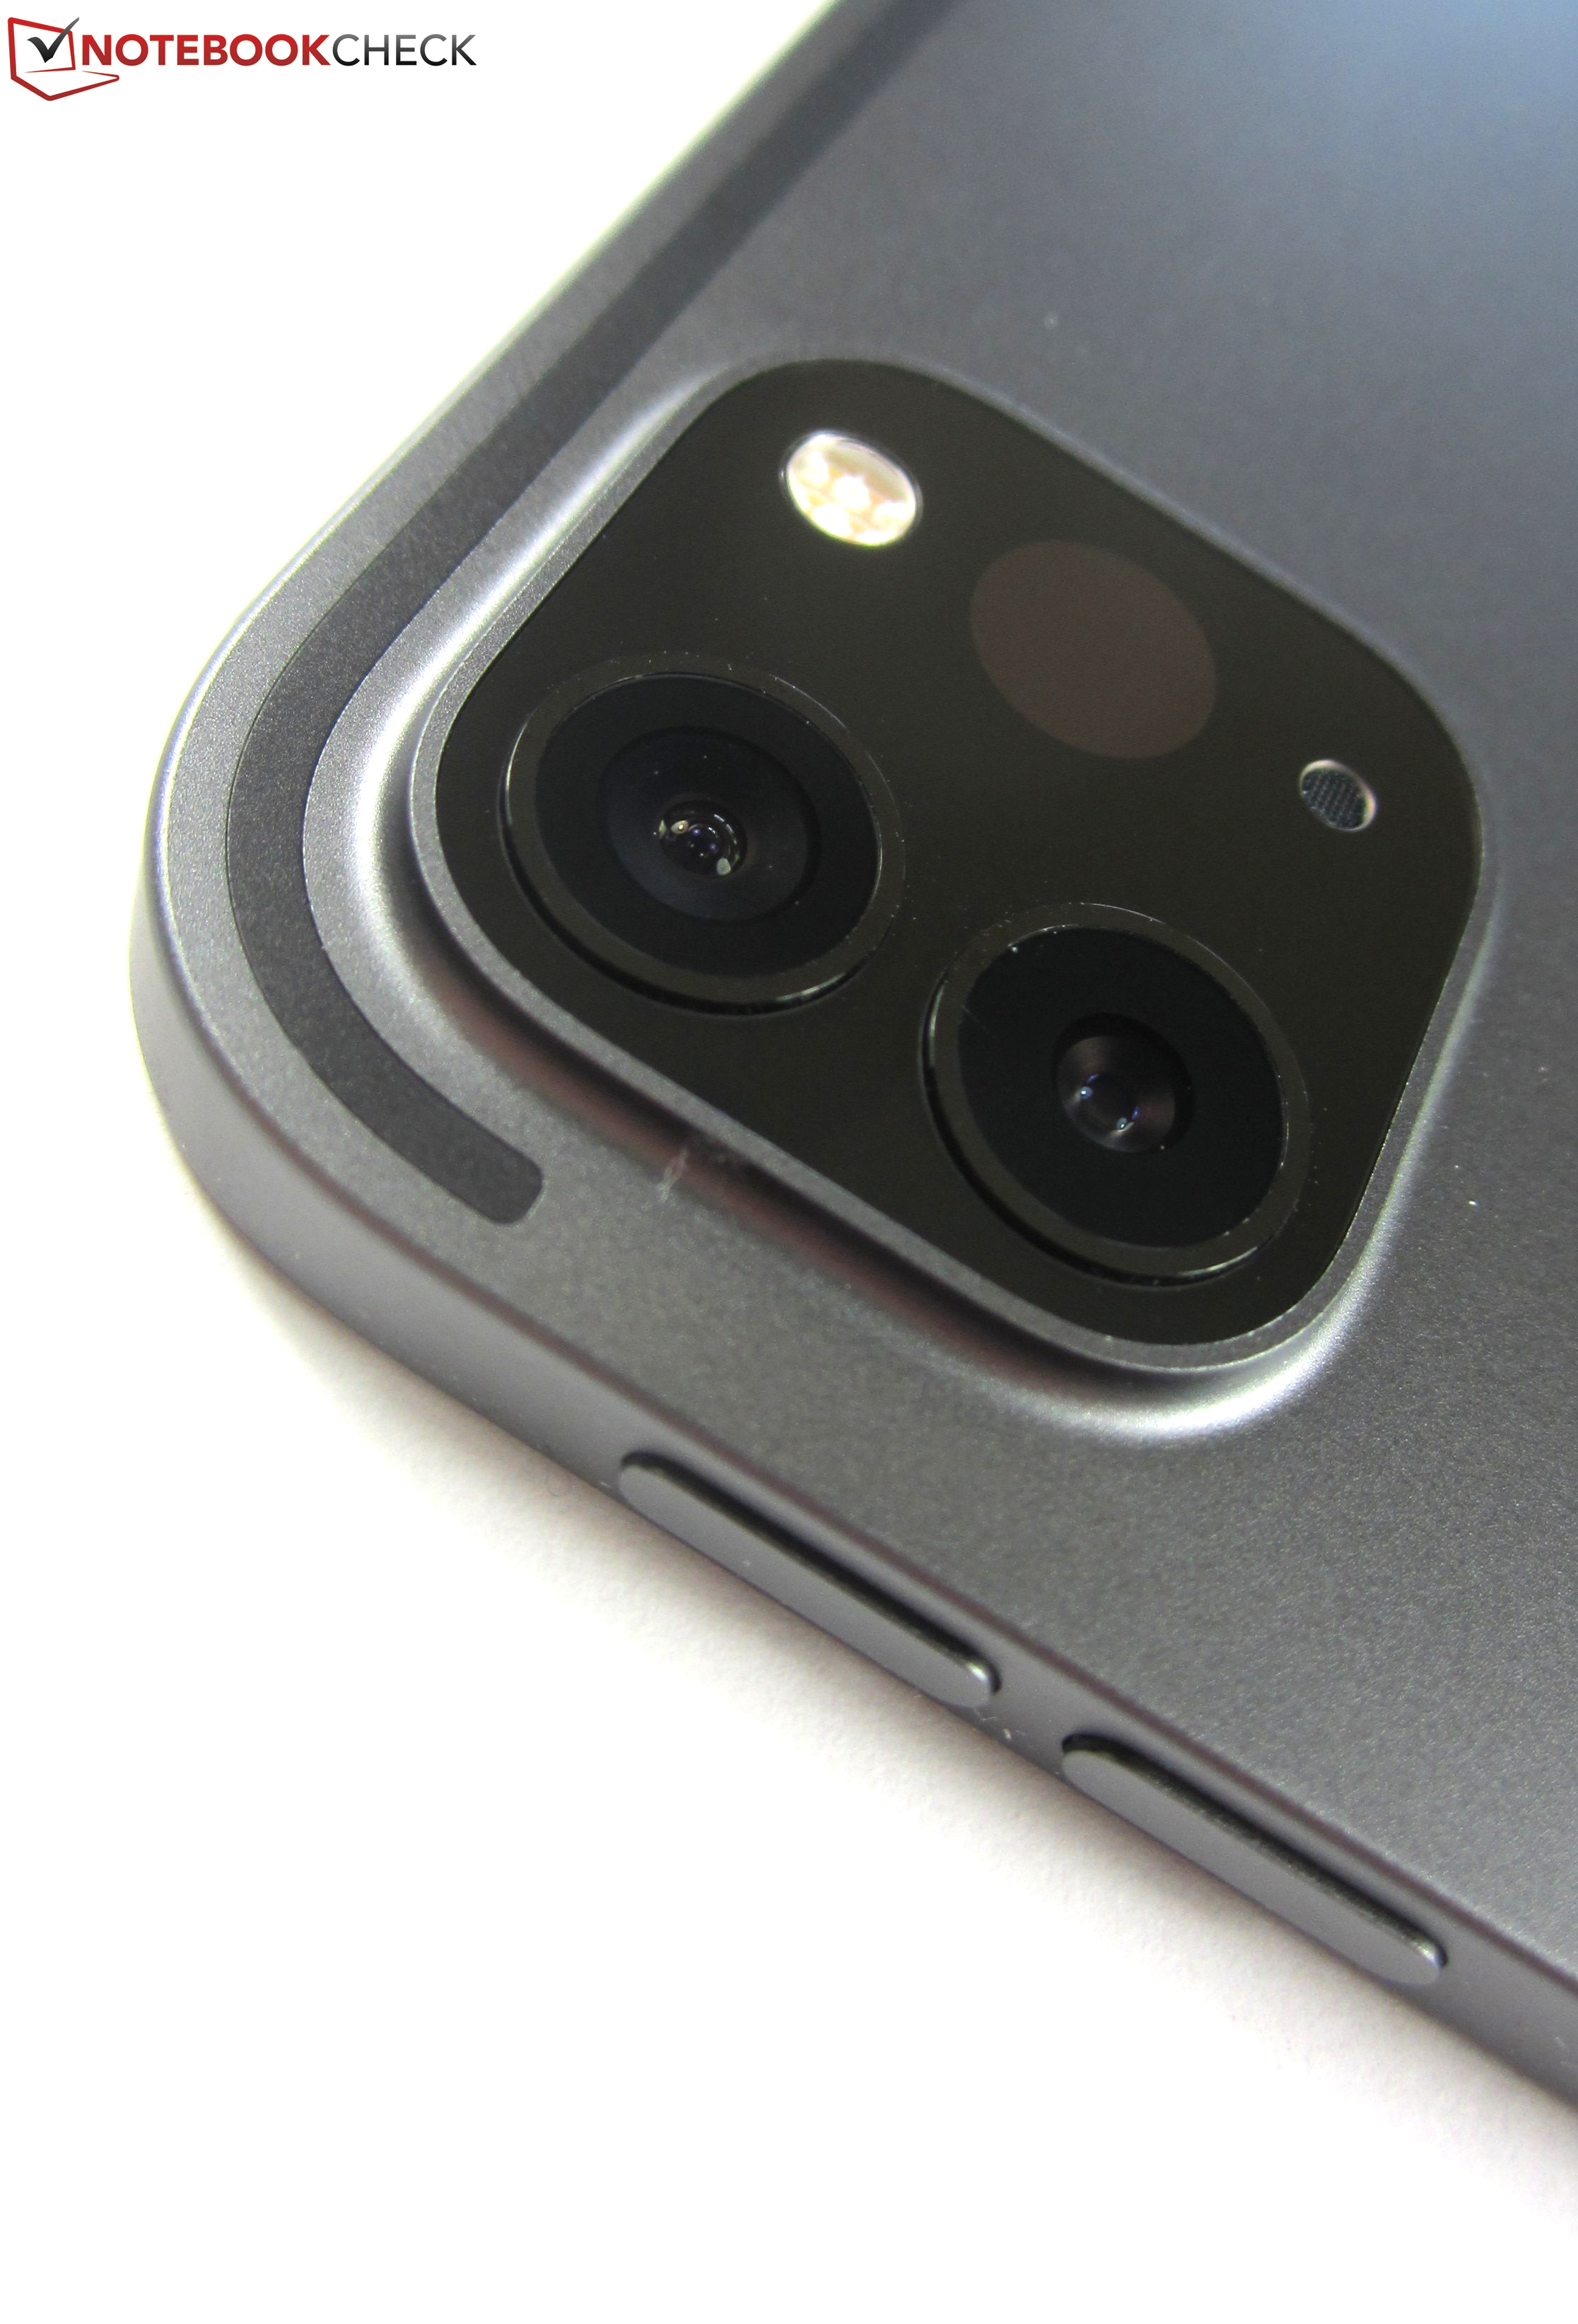
Alla dessa saker fanns redan på den tidigare versionen. Men ett fåtal konservativa uppdateringar som en uppdaterad kamera med LiDAR-sensor, en aningen snabbare CPU och 6 GB RAM som standard oavsett lagringskonfiguration får iPad Pro att skilja sig ytterligare från Apples andra surfplattor, för att inte tala om Android-alternativen.
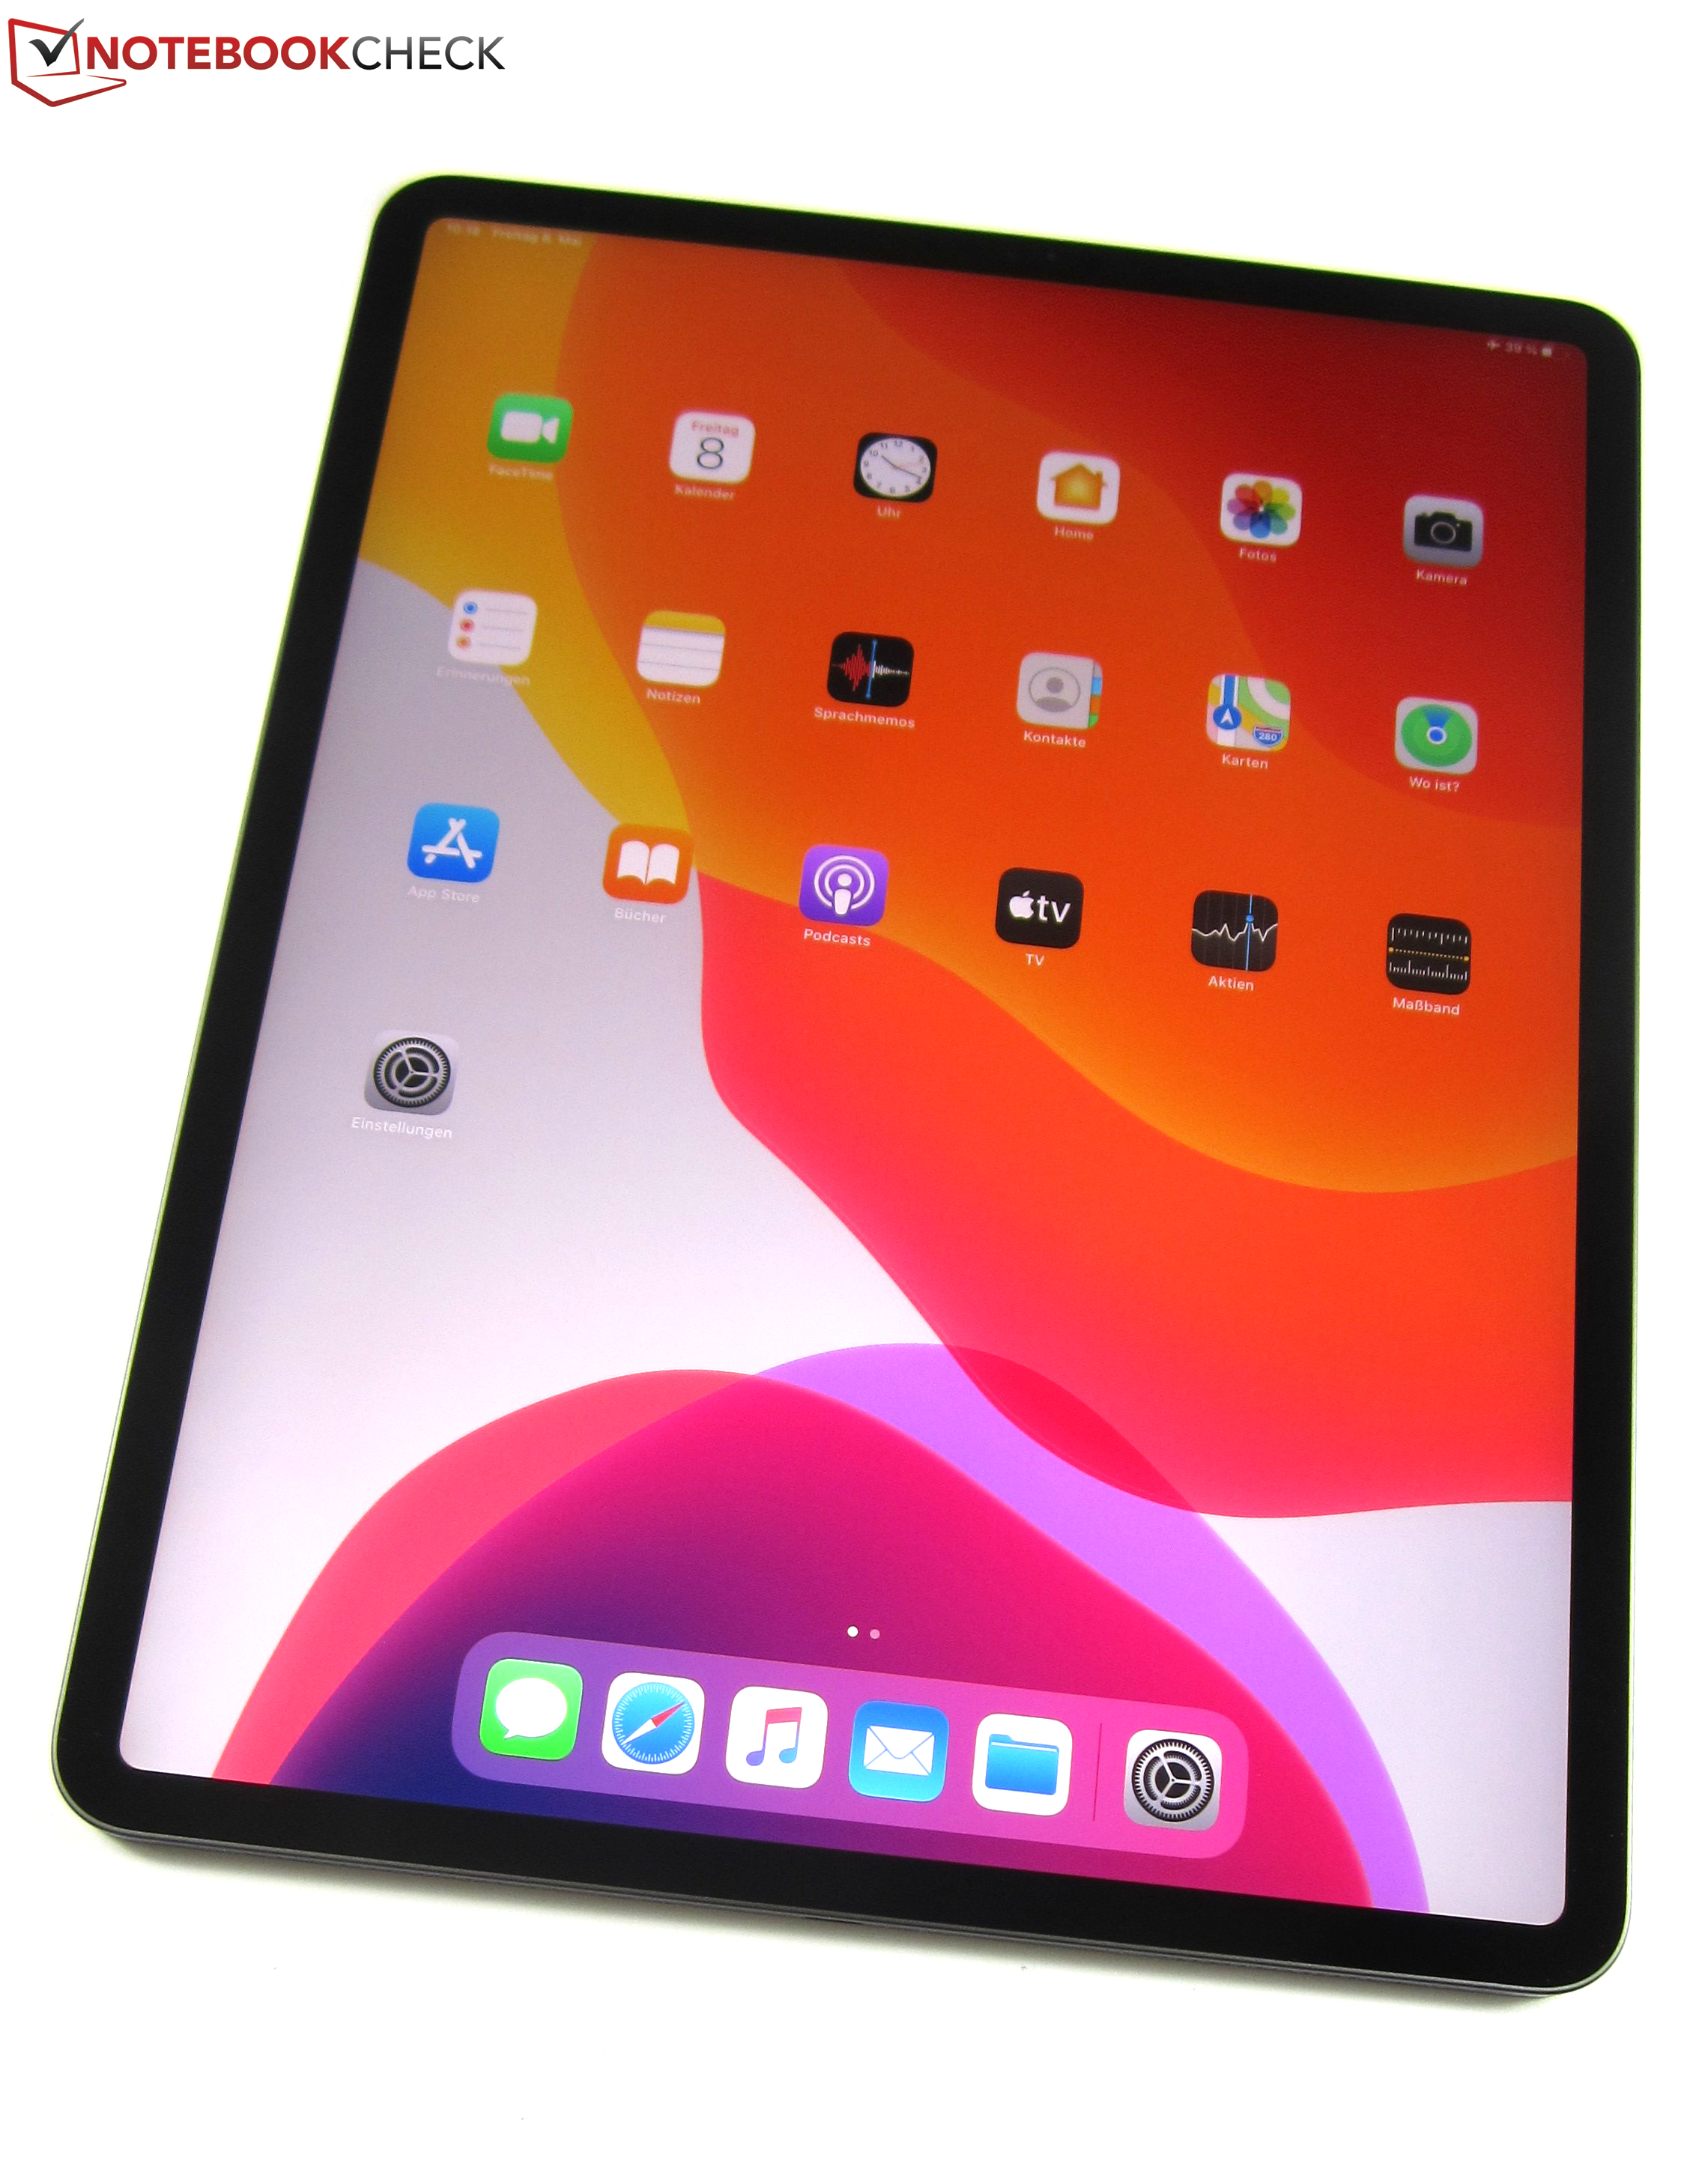
Tack vare en större skärm är iPad Pro 12.9 (2020), i egenskap av att vara det senaste flaggskeppet från iPad Pro-serien, ännu bättre lämpad för proffsbruk än iPad Pro 11 (2020). Men med det sagt går dess fulla potential bara att komma åt genom tillbehör, vilka precis som själva surfplattan är ganska dyra. Magic Keyboard, som släpps i slutet av Maj, bör göra den ganska lik en laptop.
Apple iPad Pro 12.9 2020
- 05/13/2020 v7 (old)
Manuel Masiero
Price comparison
