Recension av Intel NUC 13 Extreme Raptor Canyon - Minidator med Core i9-13900K och GeForce RTX 3080 Ti
")
Efter Beast Canyon och Dragon Canyon avviker Intels senaste Raptor Canyon NUC Extreme Kit avsevärt från designen hos sina föregångare. Intel siktar dock fortfarande på en mycket kompakt dator som knappt lämnar något att önska. Dessutom kan ett fullskaligt grafikkort installeras. För processorn finns modeller från Intels nuvarande Raptor Lake-utbud tillgängliga. Användare kan naturligtvis också välja sin egen CPU, eftersom processorn inte är lödd. I den här recensionen använder vår NUC 13 Extreme Raptor Canyon en Intel Core i9-13900K. Dessutom har Nvidia GeForce RTX 3080 Ti tillräcklig 3D-prestanda även för krävande spelare.
Det bör noteras att Intel NUC 13 Extreme Kit är ett barebone-system som levereras utan SSD, RAM-minne eller grafikkort. Priset beror på den medföljande processorn. Basmodellen med denIntel Core i5-13600K kostar 1179 USD, medan den högsta konfigurationen finns tillgänglig för 1549 USD.
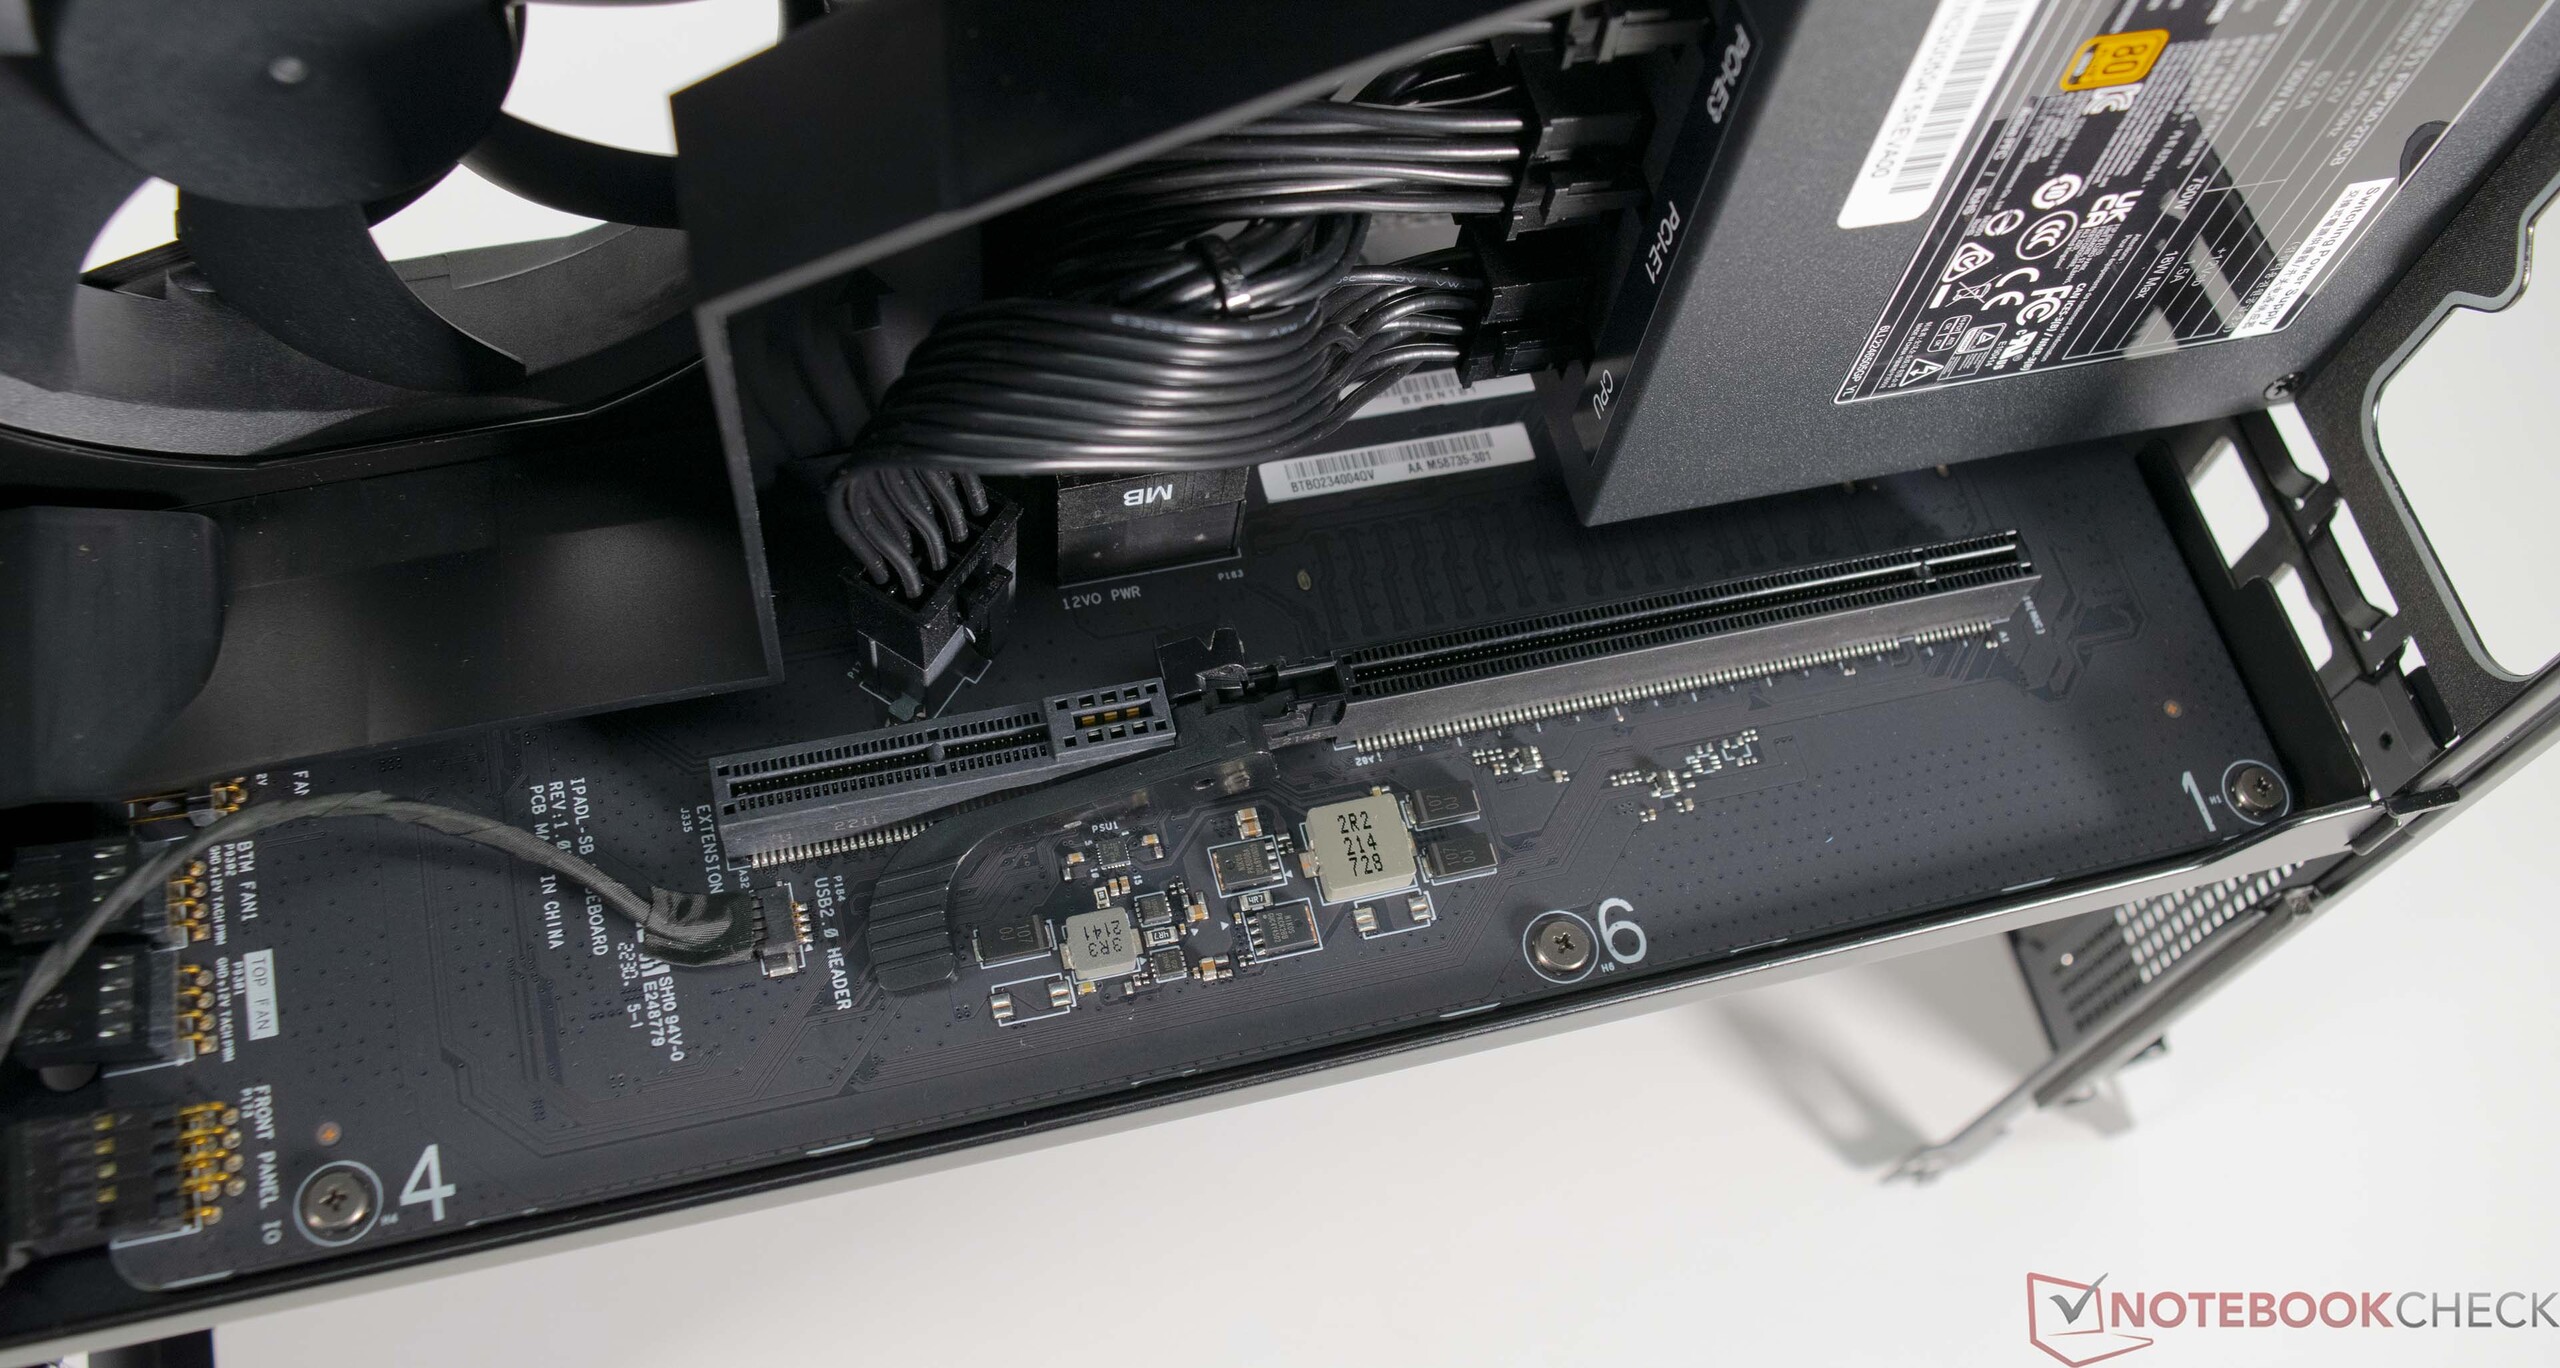
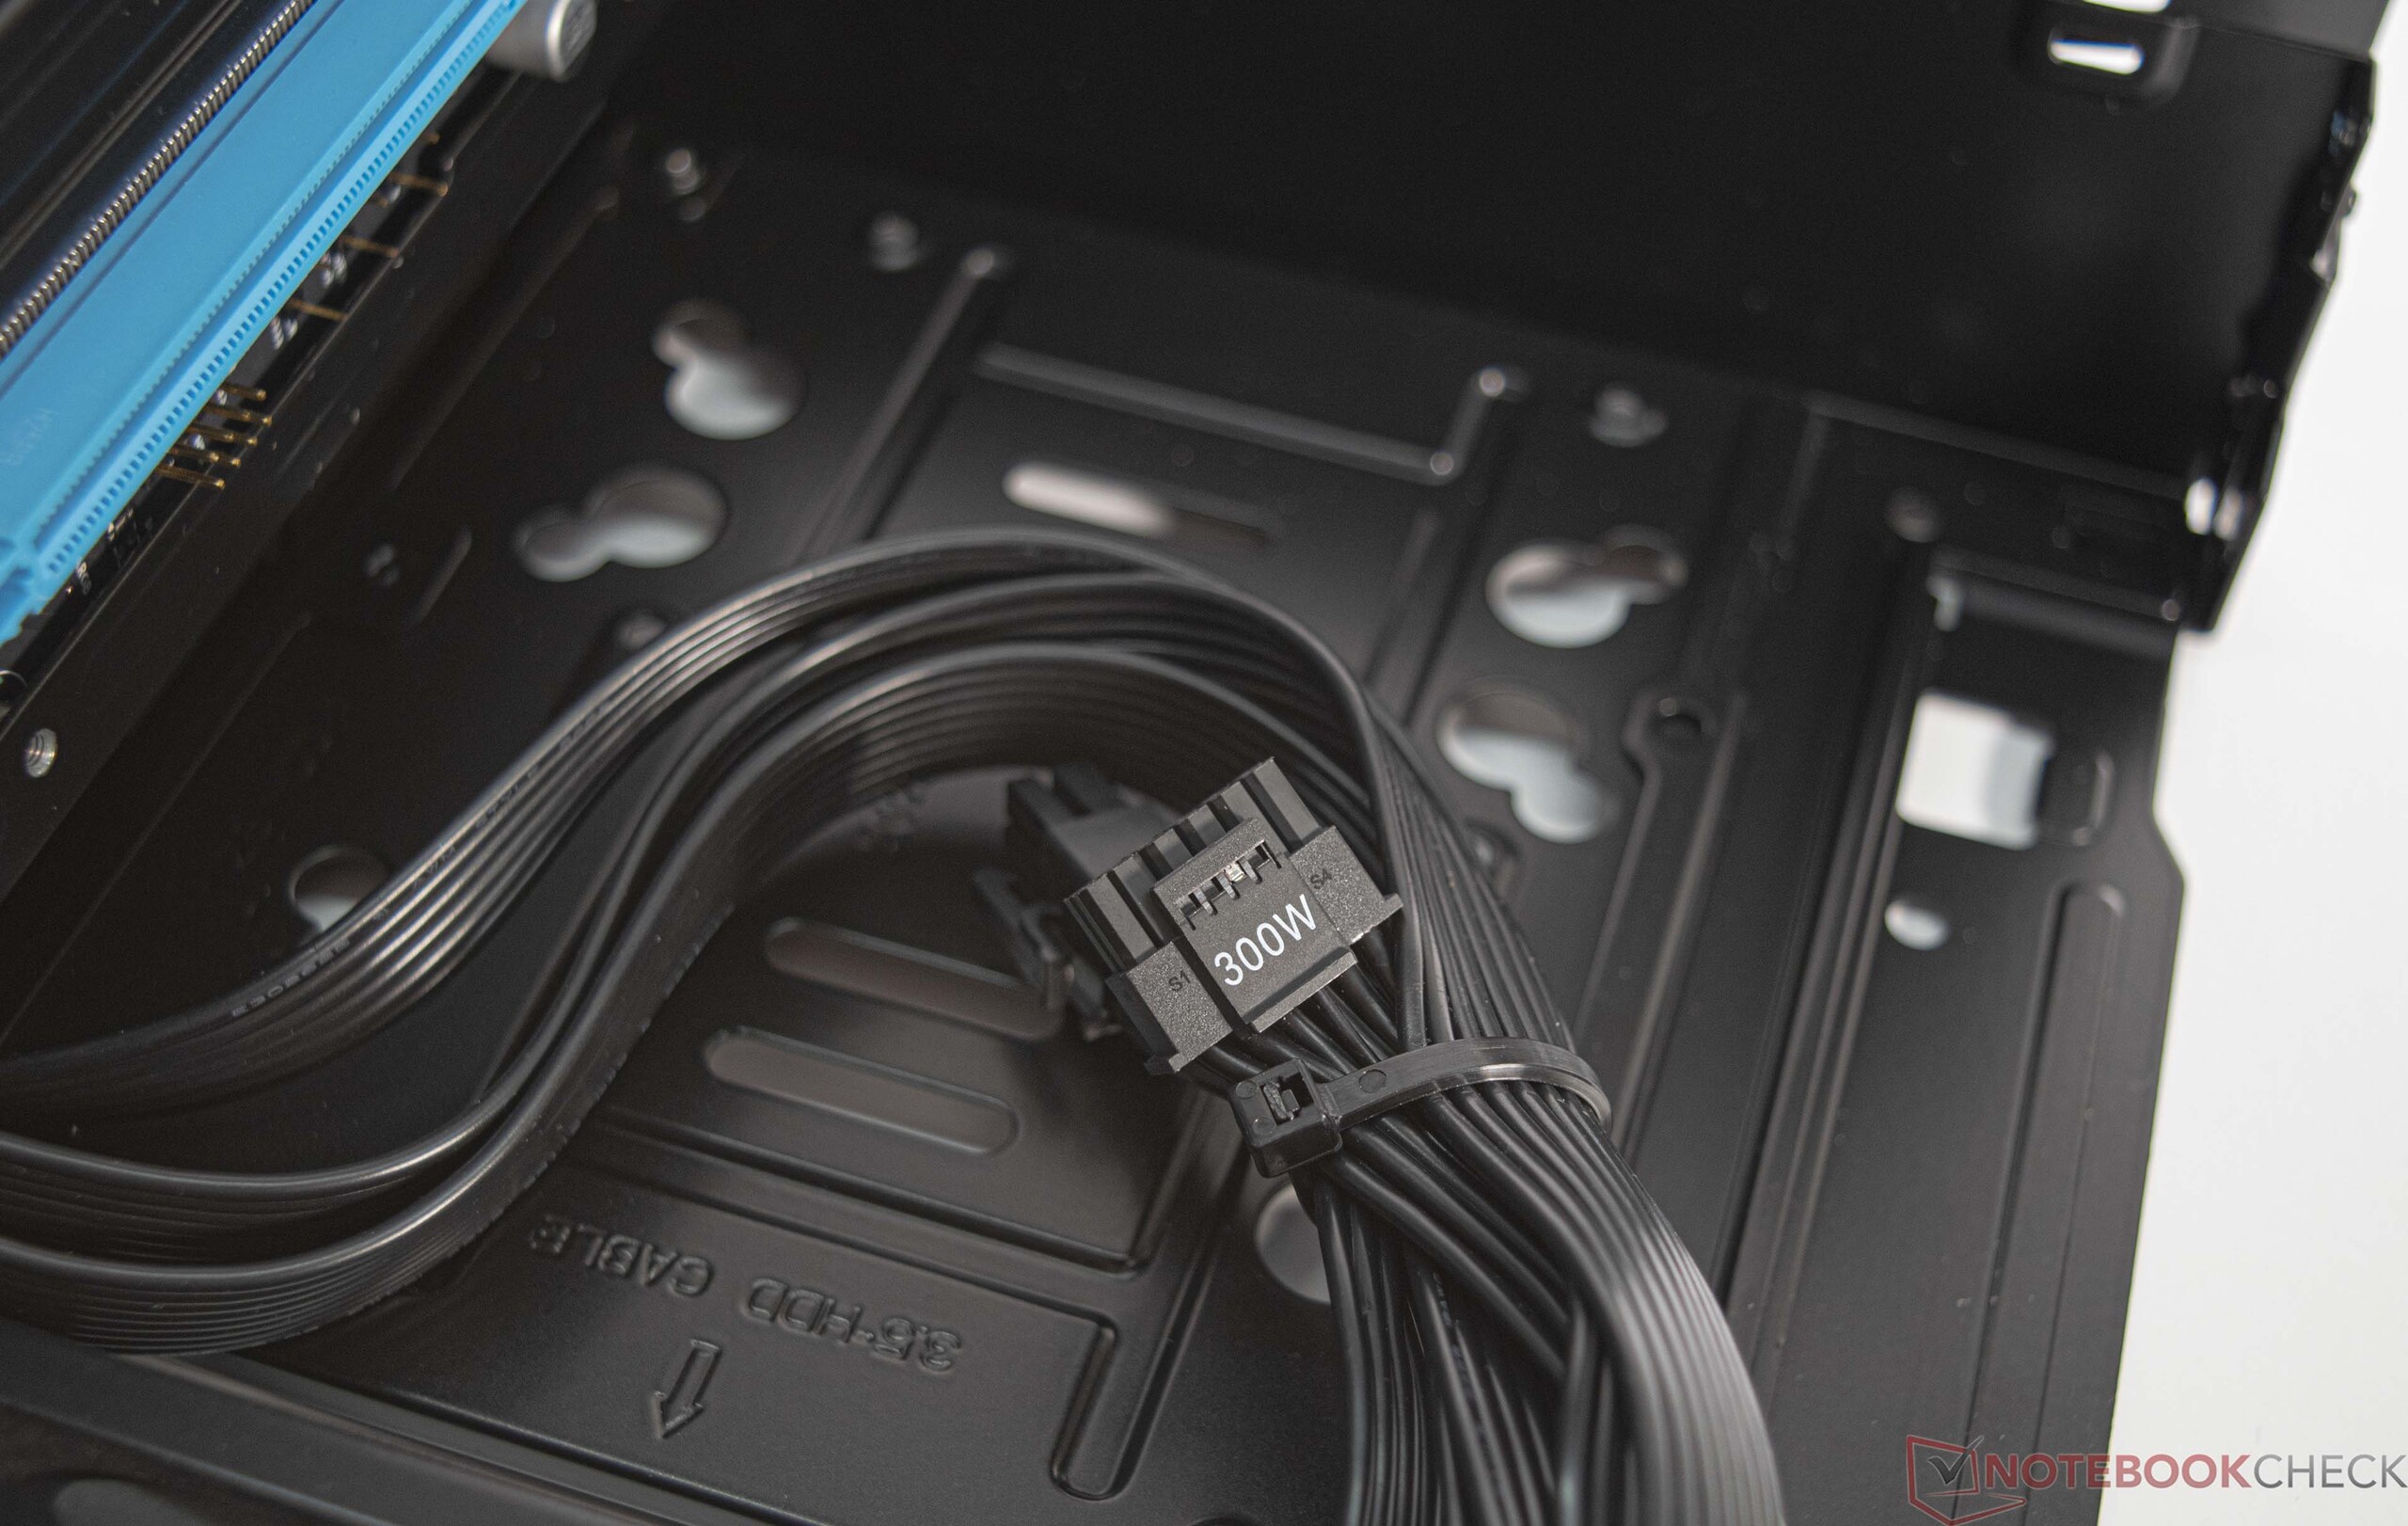
Dedikerade grafiklösningar med en maximal längd på 31 cm (~12 tum) stöds. Tack vare det medföljande 750-watts SFX-strömförsörjningsaggregatet kan även aktuella avancerade GPU-modeller användas. Teoretiskt sett är det möjligt att passa även en Nvidia GeForce RTX 4090 FE. Problemet är 12VHPWR-kabeln, som endast kan leverera upp till 300 watt. Eftersom nätaggregatet endast levereras med tre 6+2-kablar för GPU:n är effektbudgeten ändå begränsad till 450 watt.
Intel NUC 13 Extreme Raptor Canyon

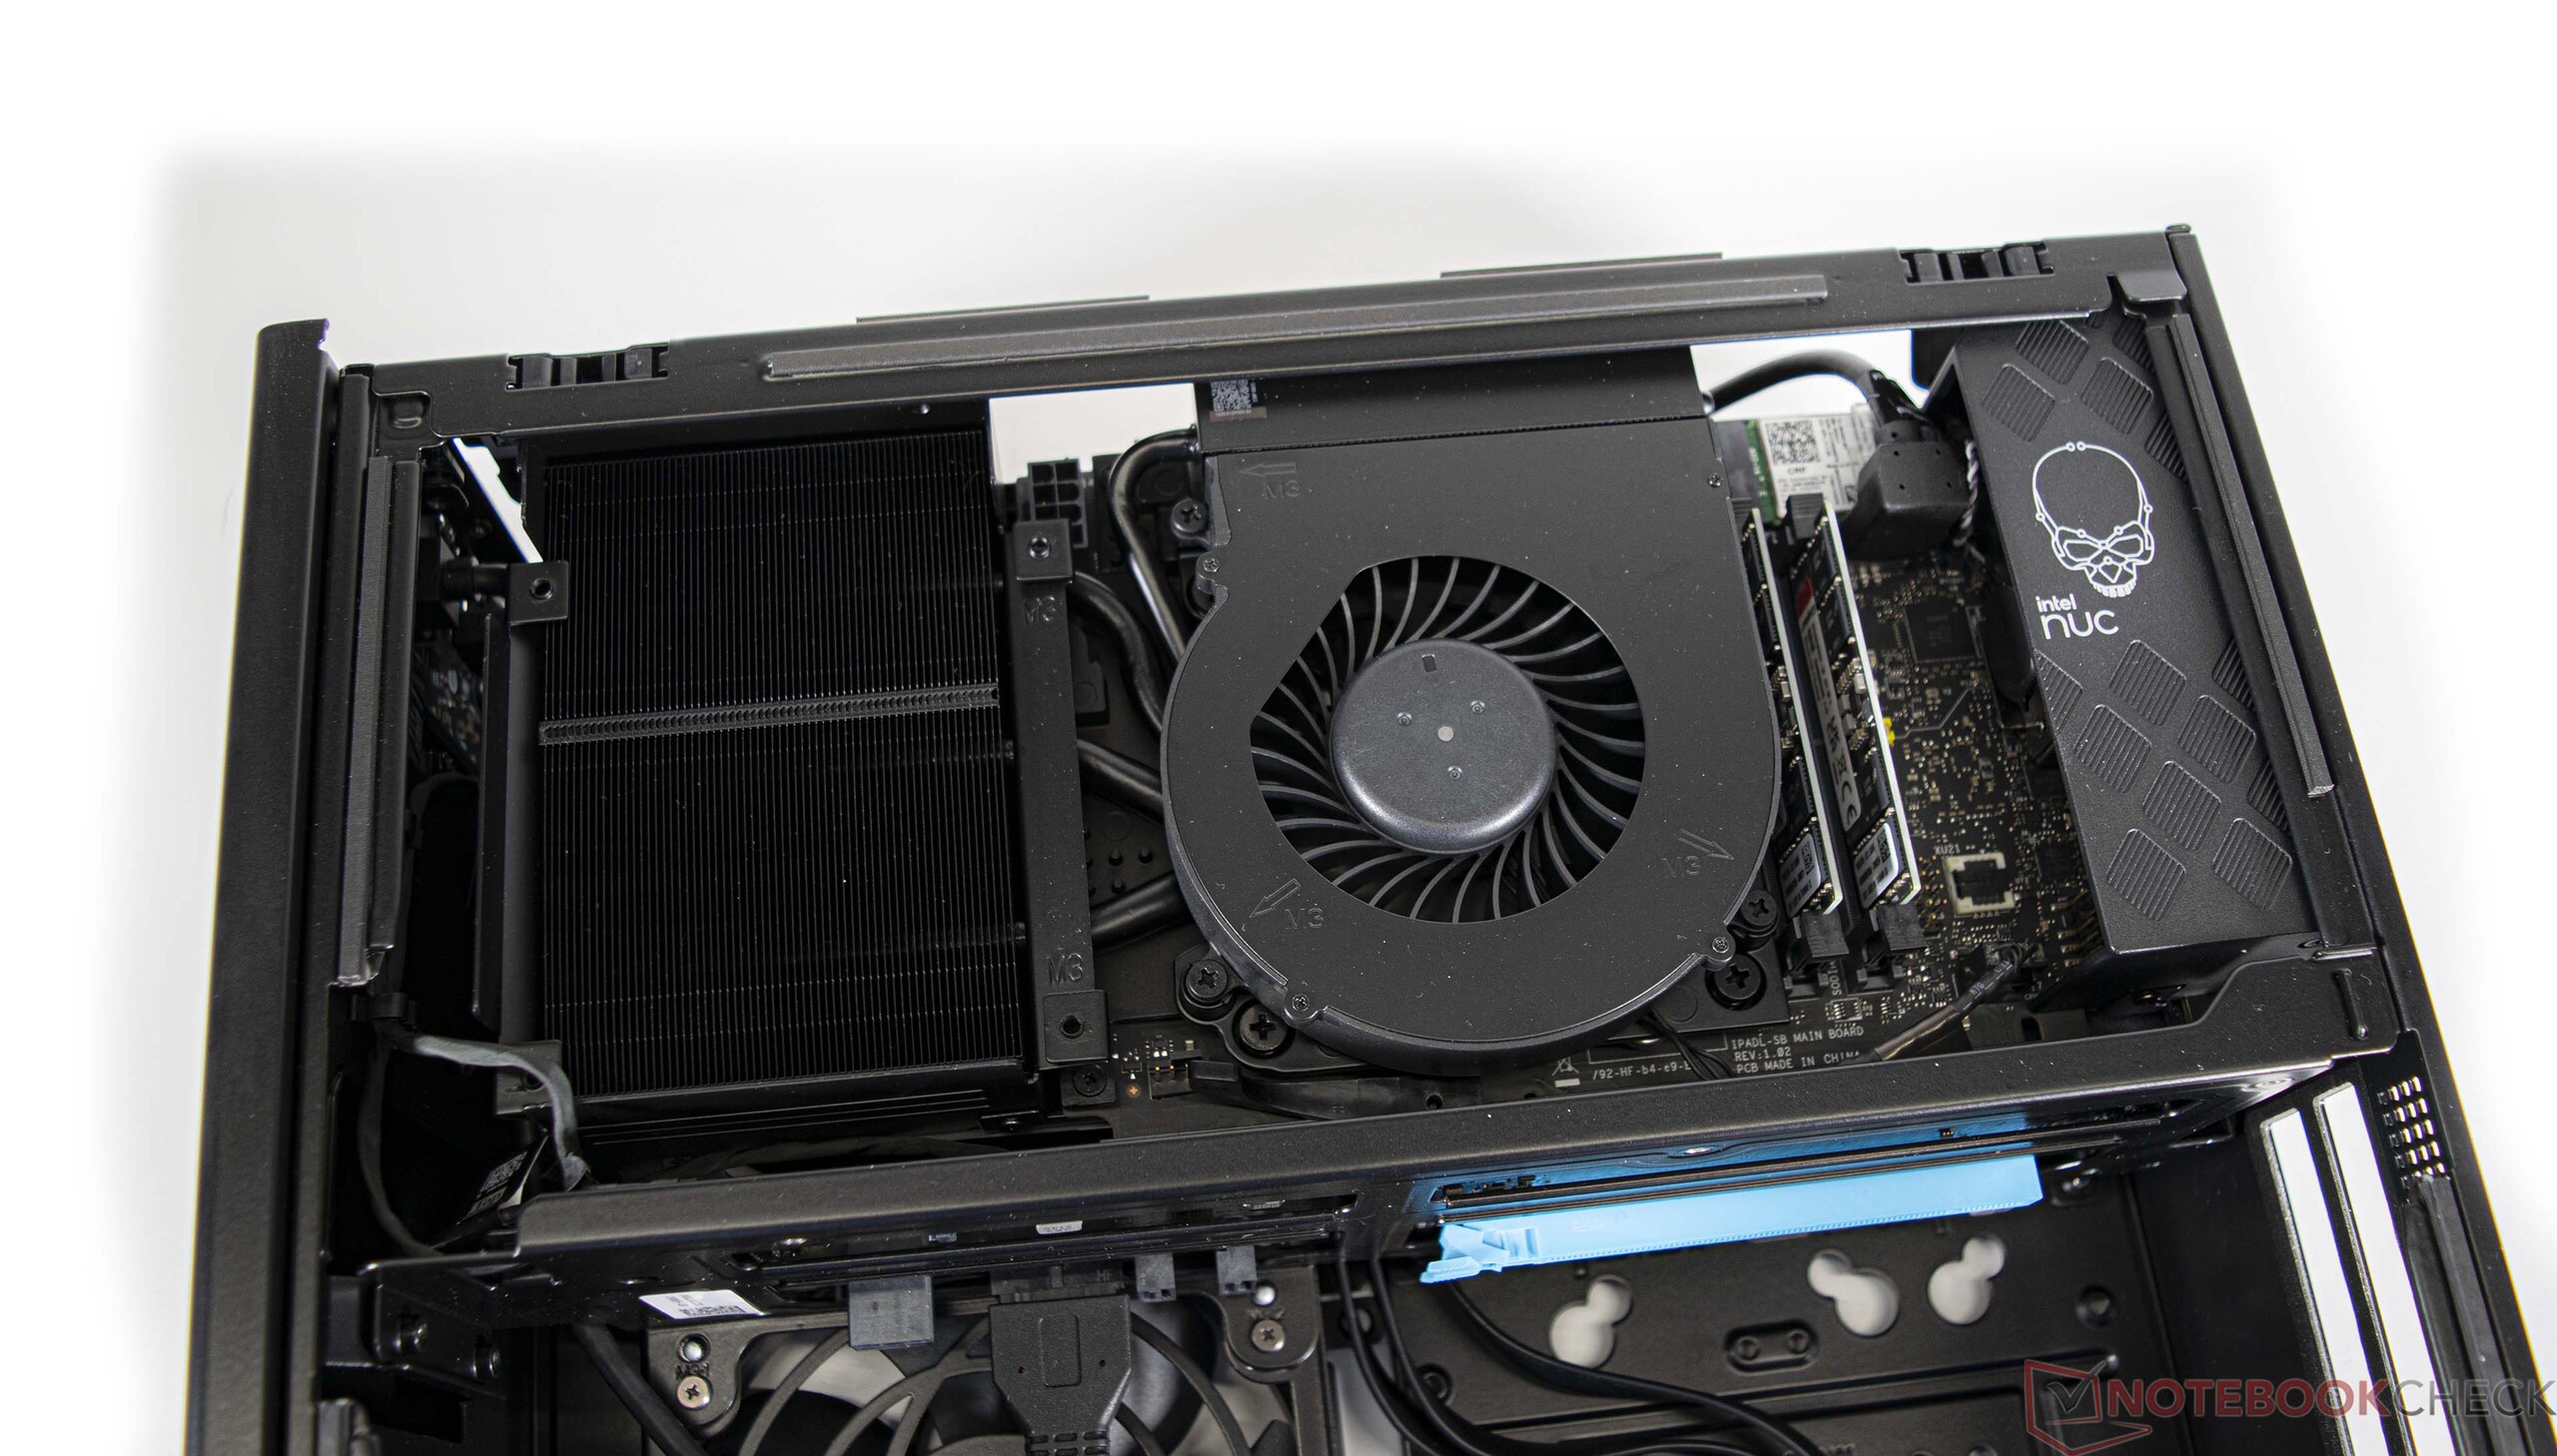

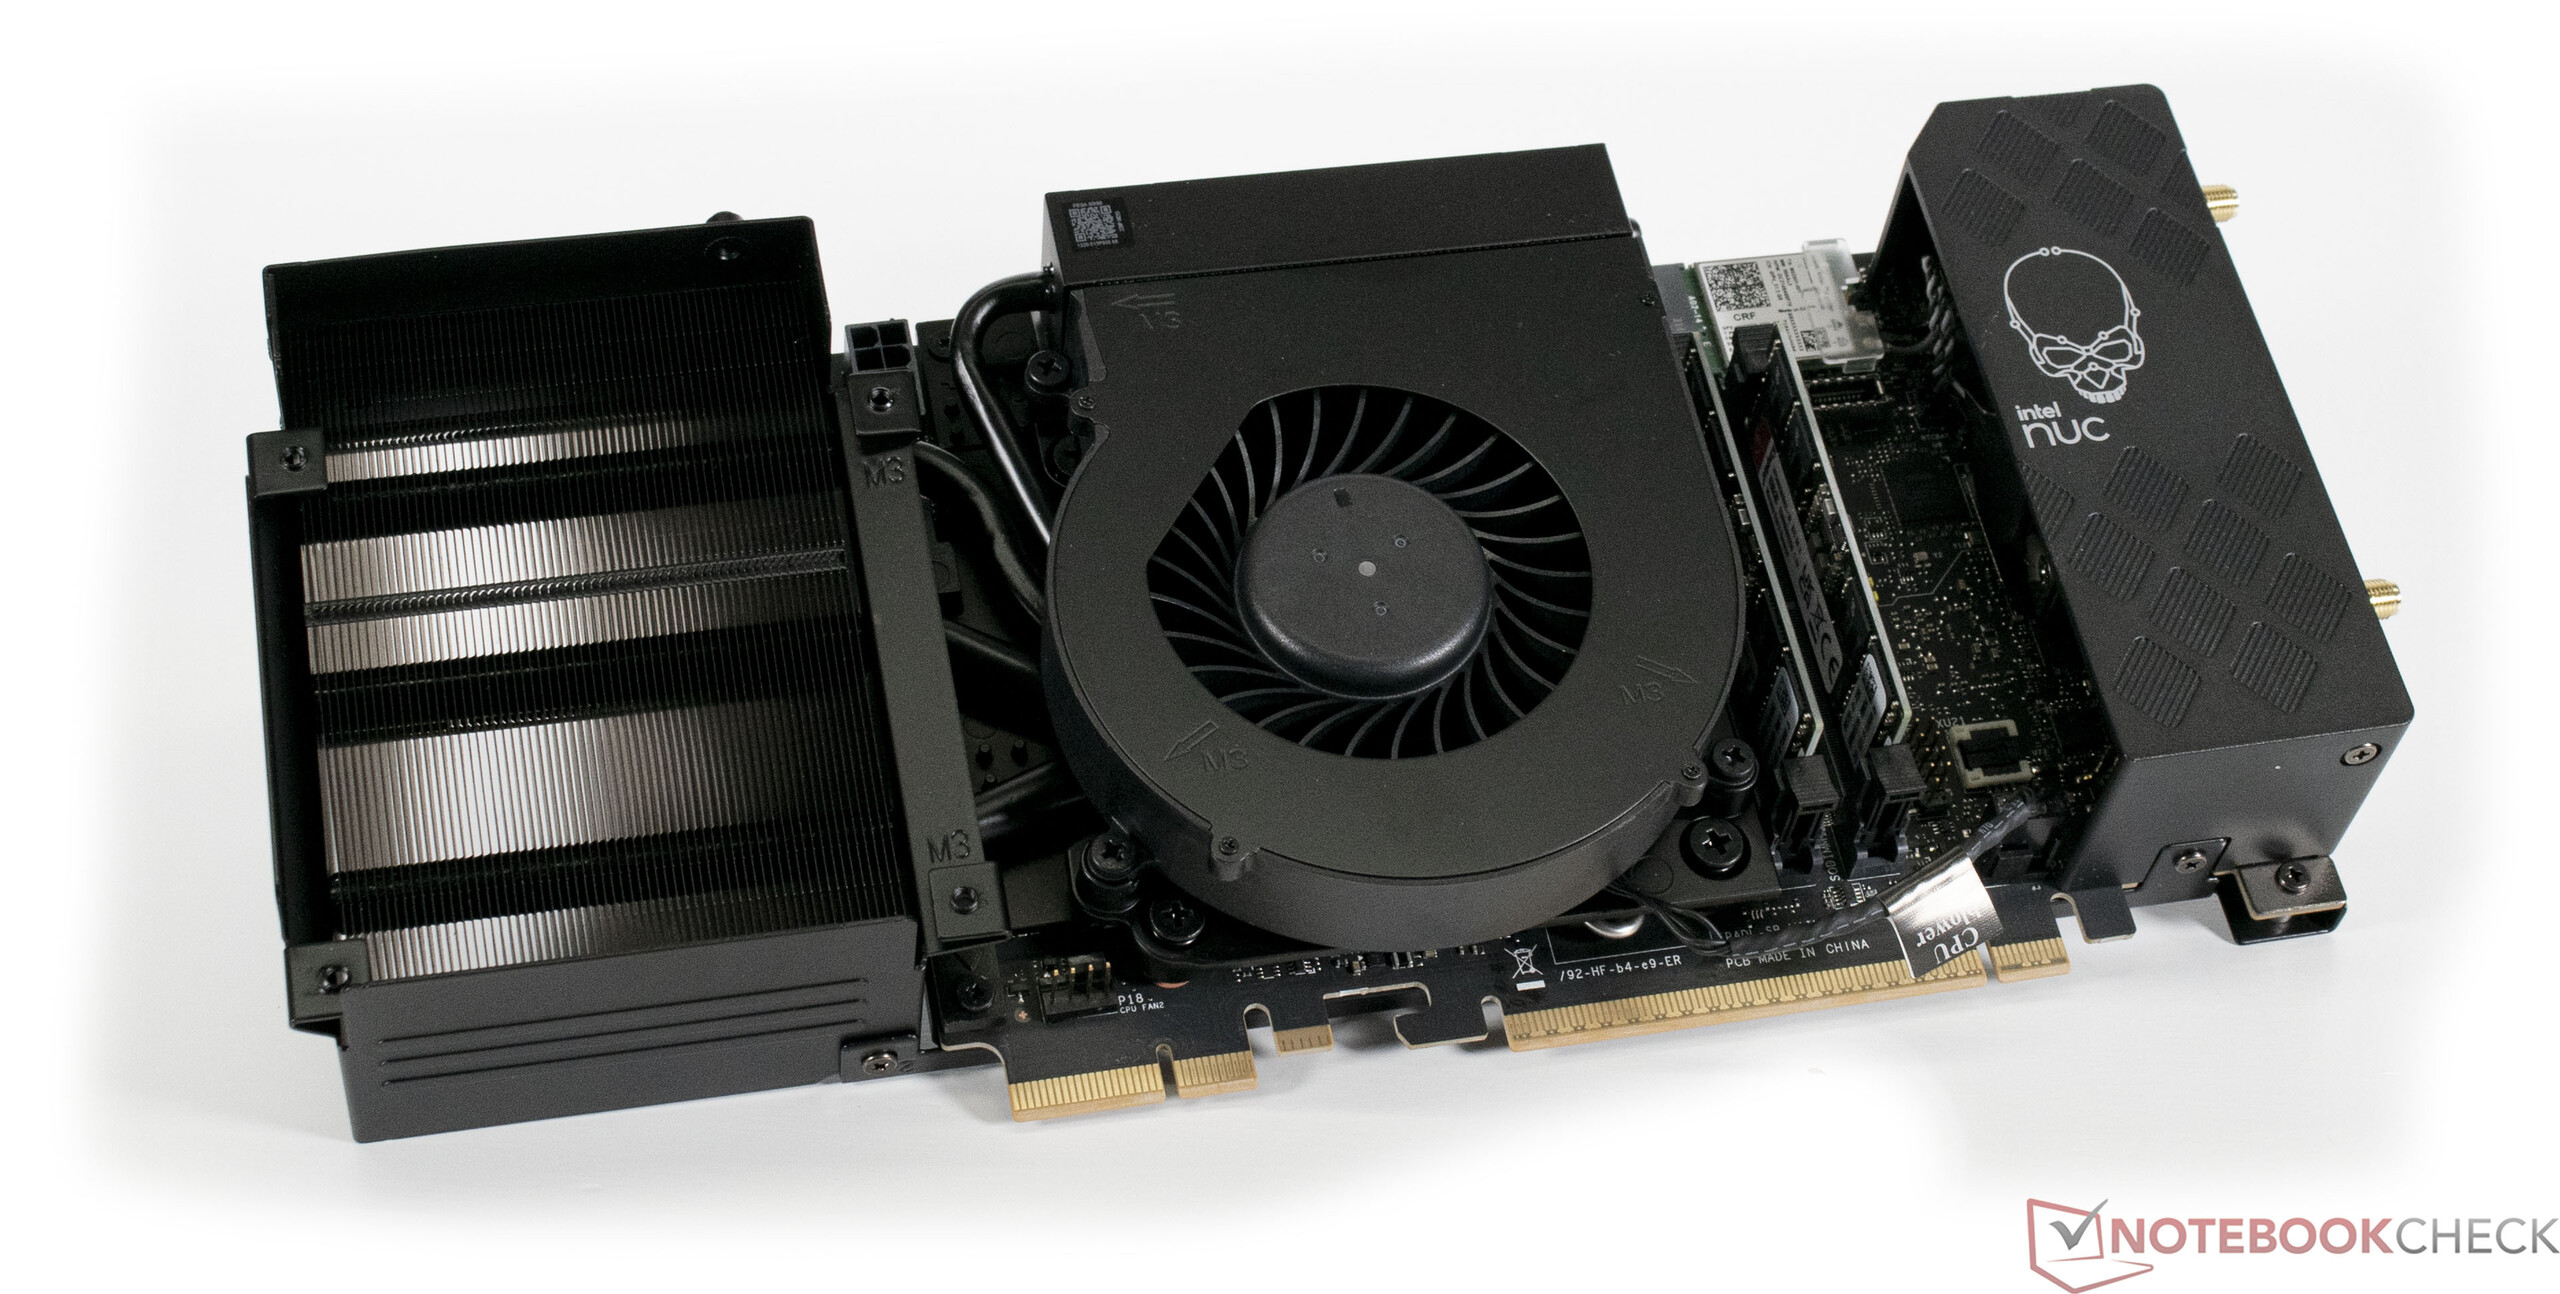
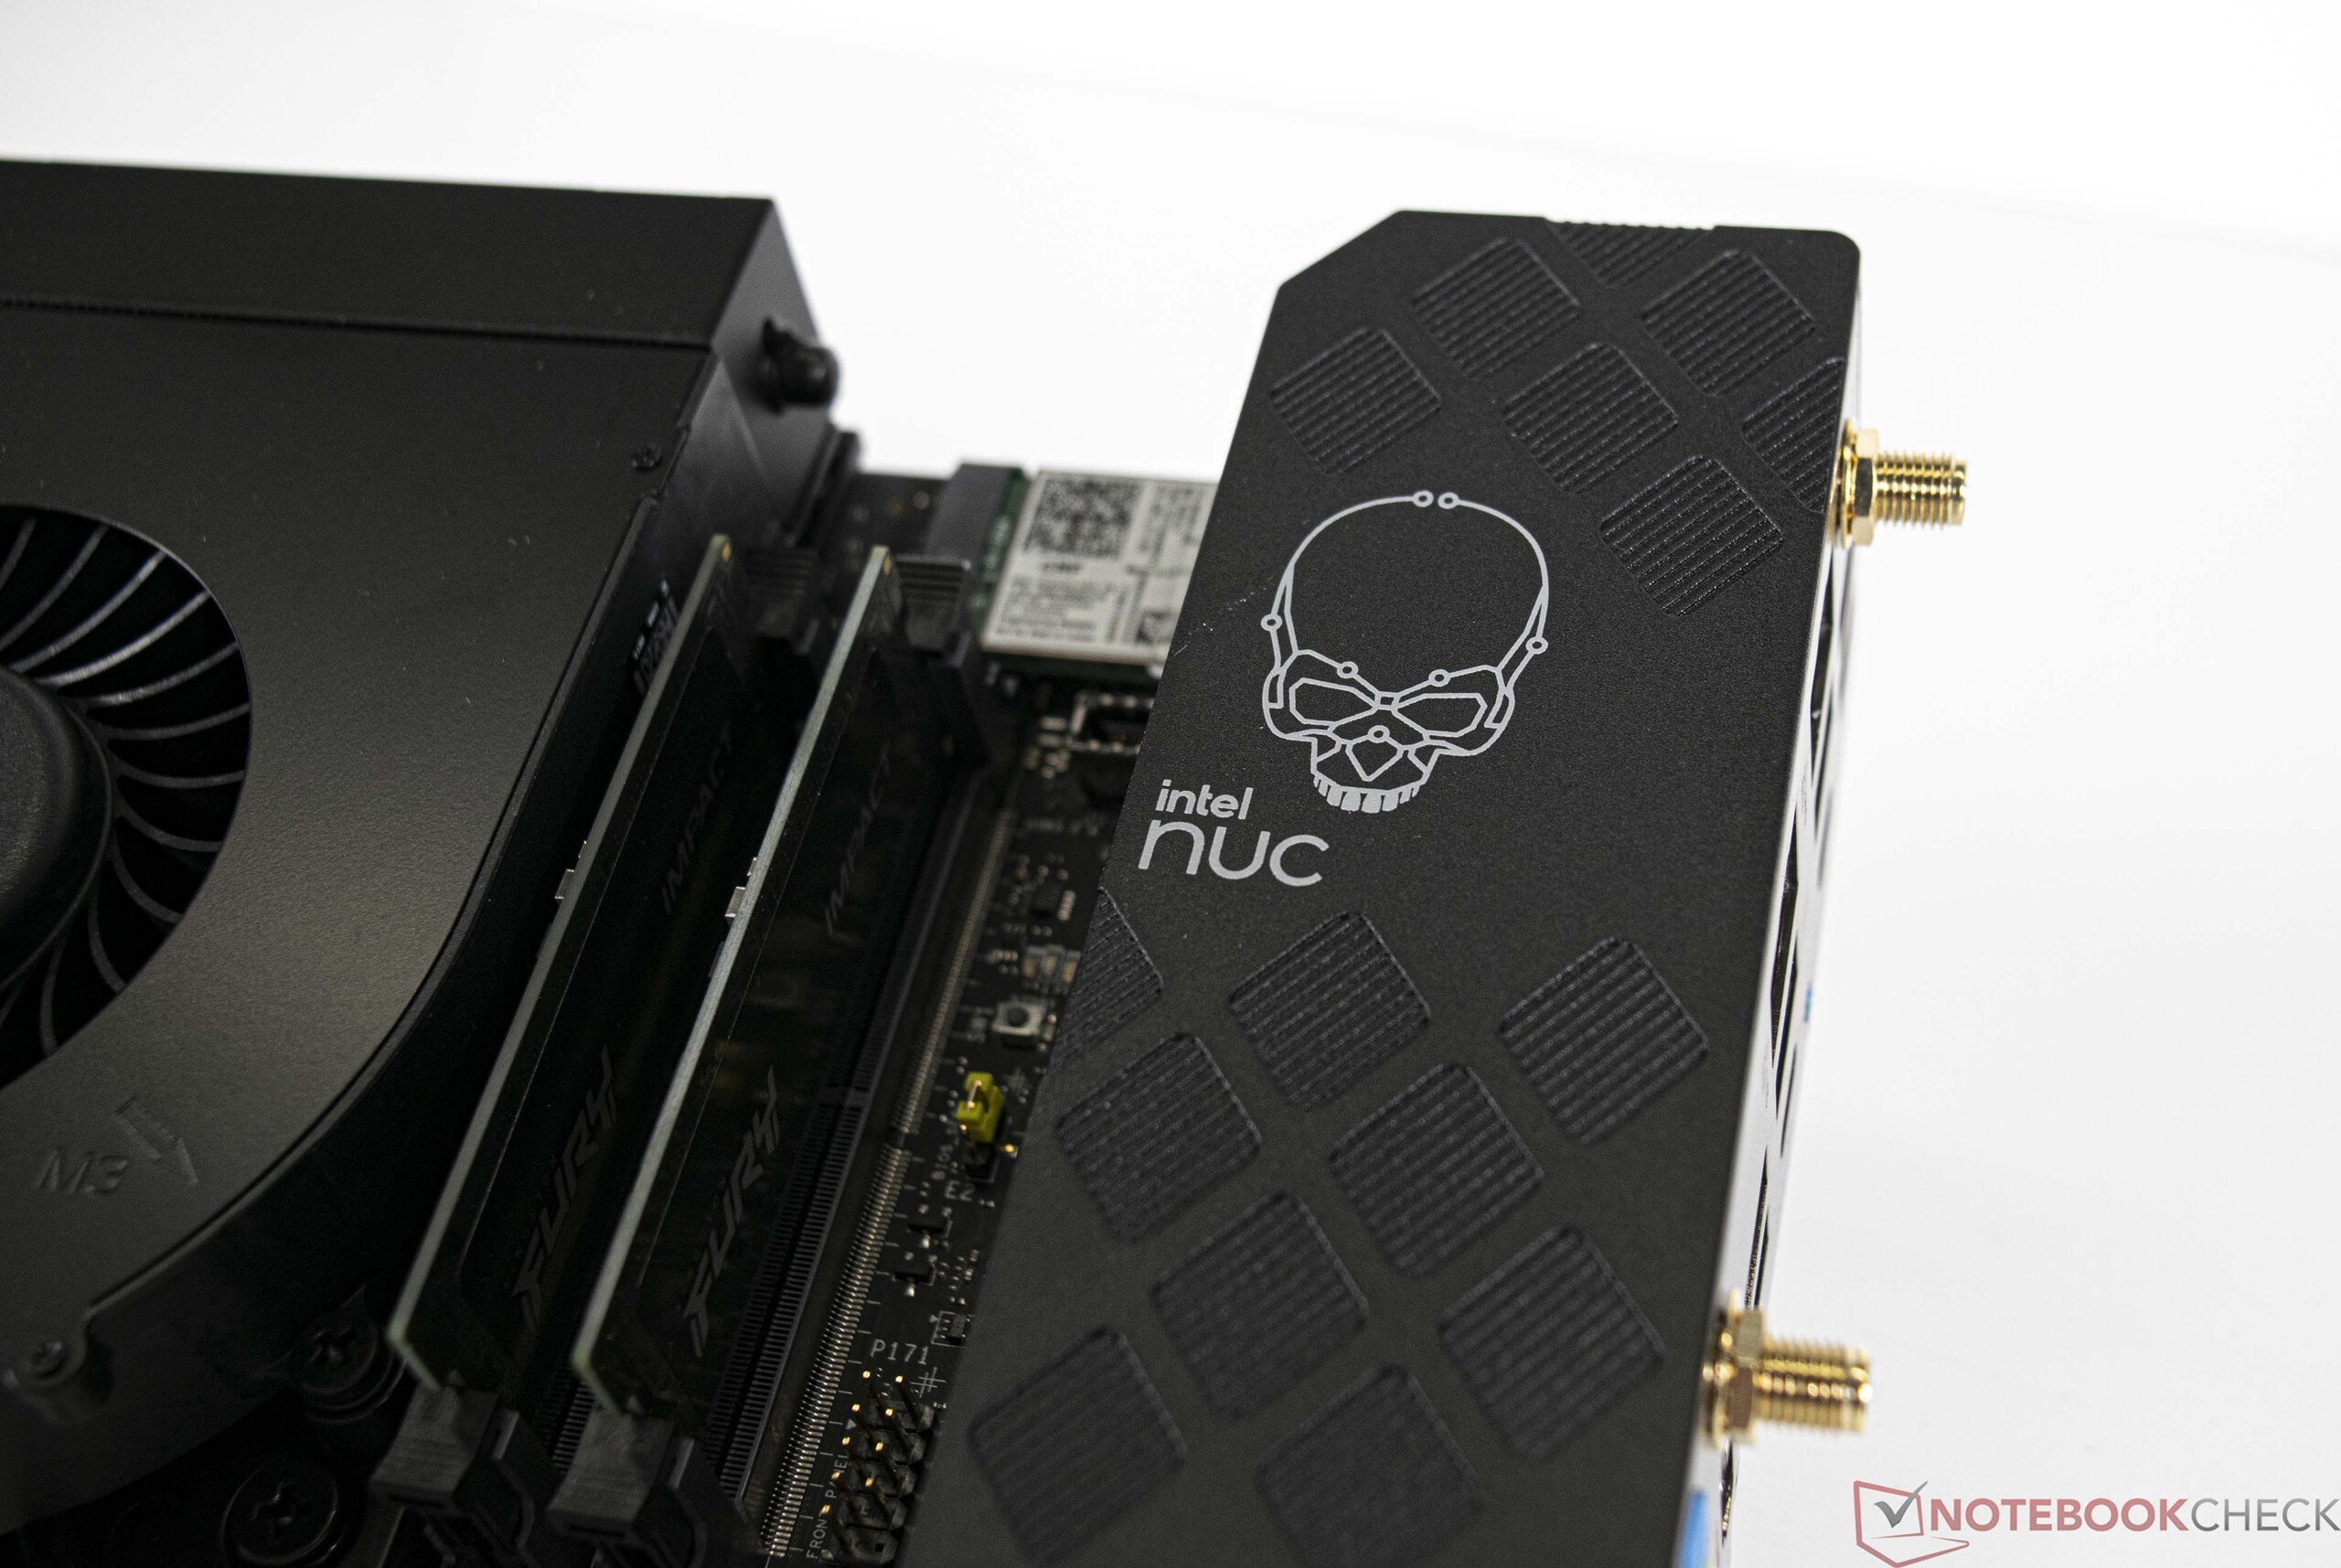
Intel NUC 13 Extreme Compute Element i detalj
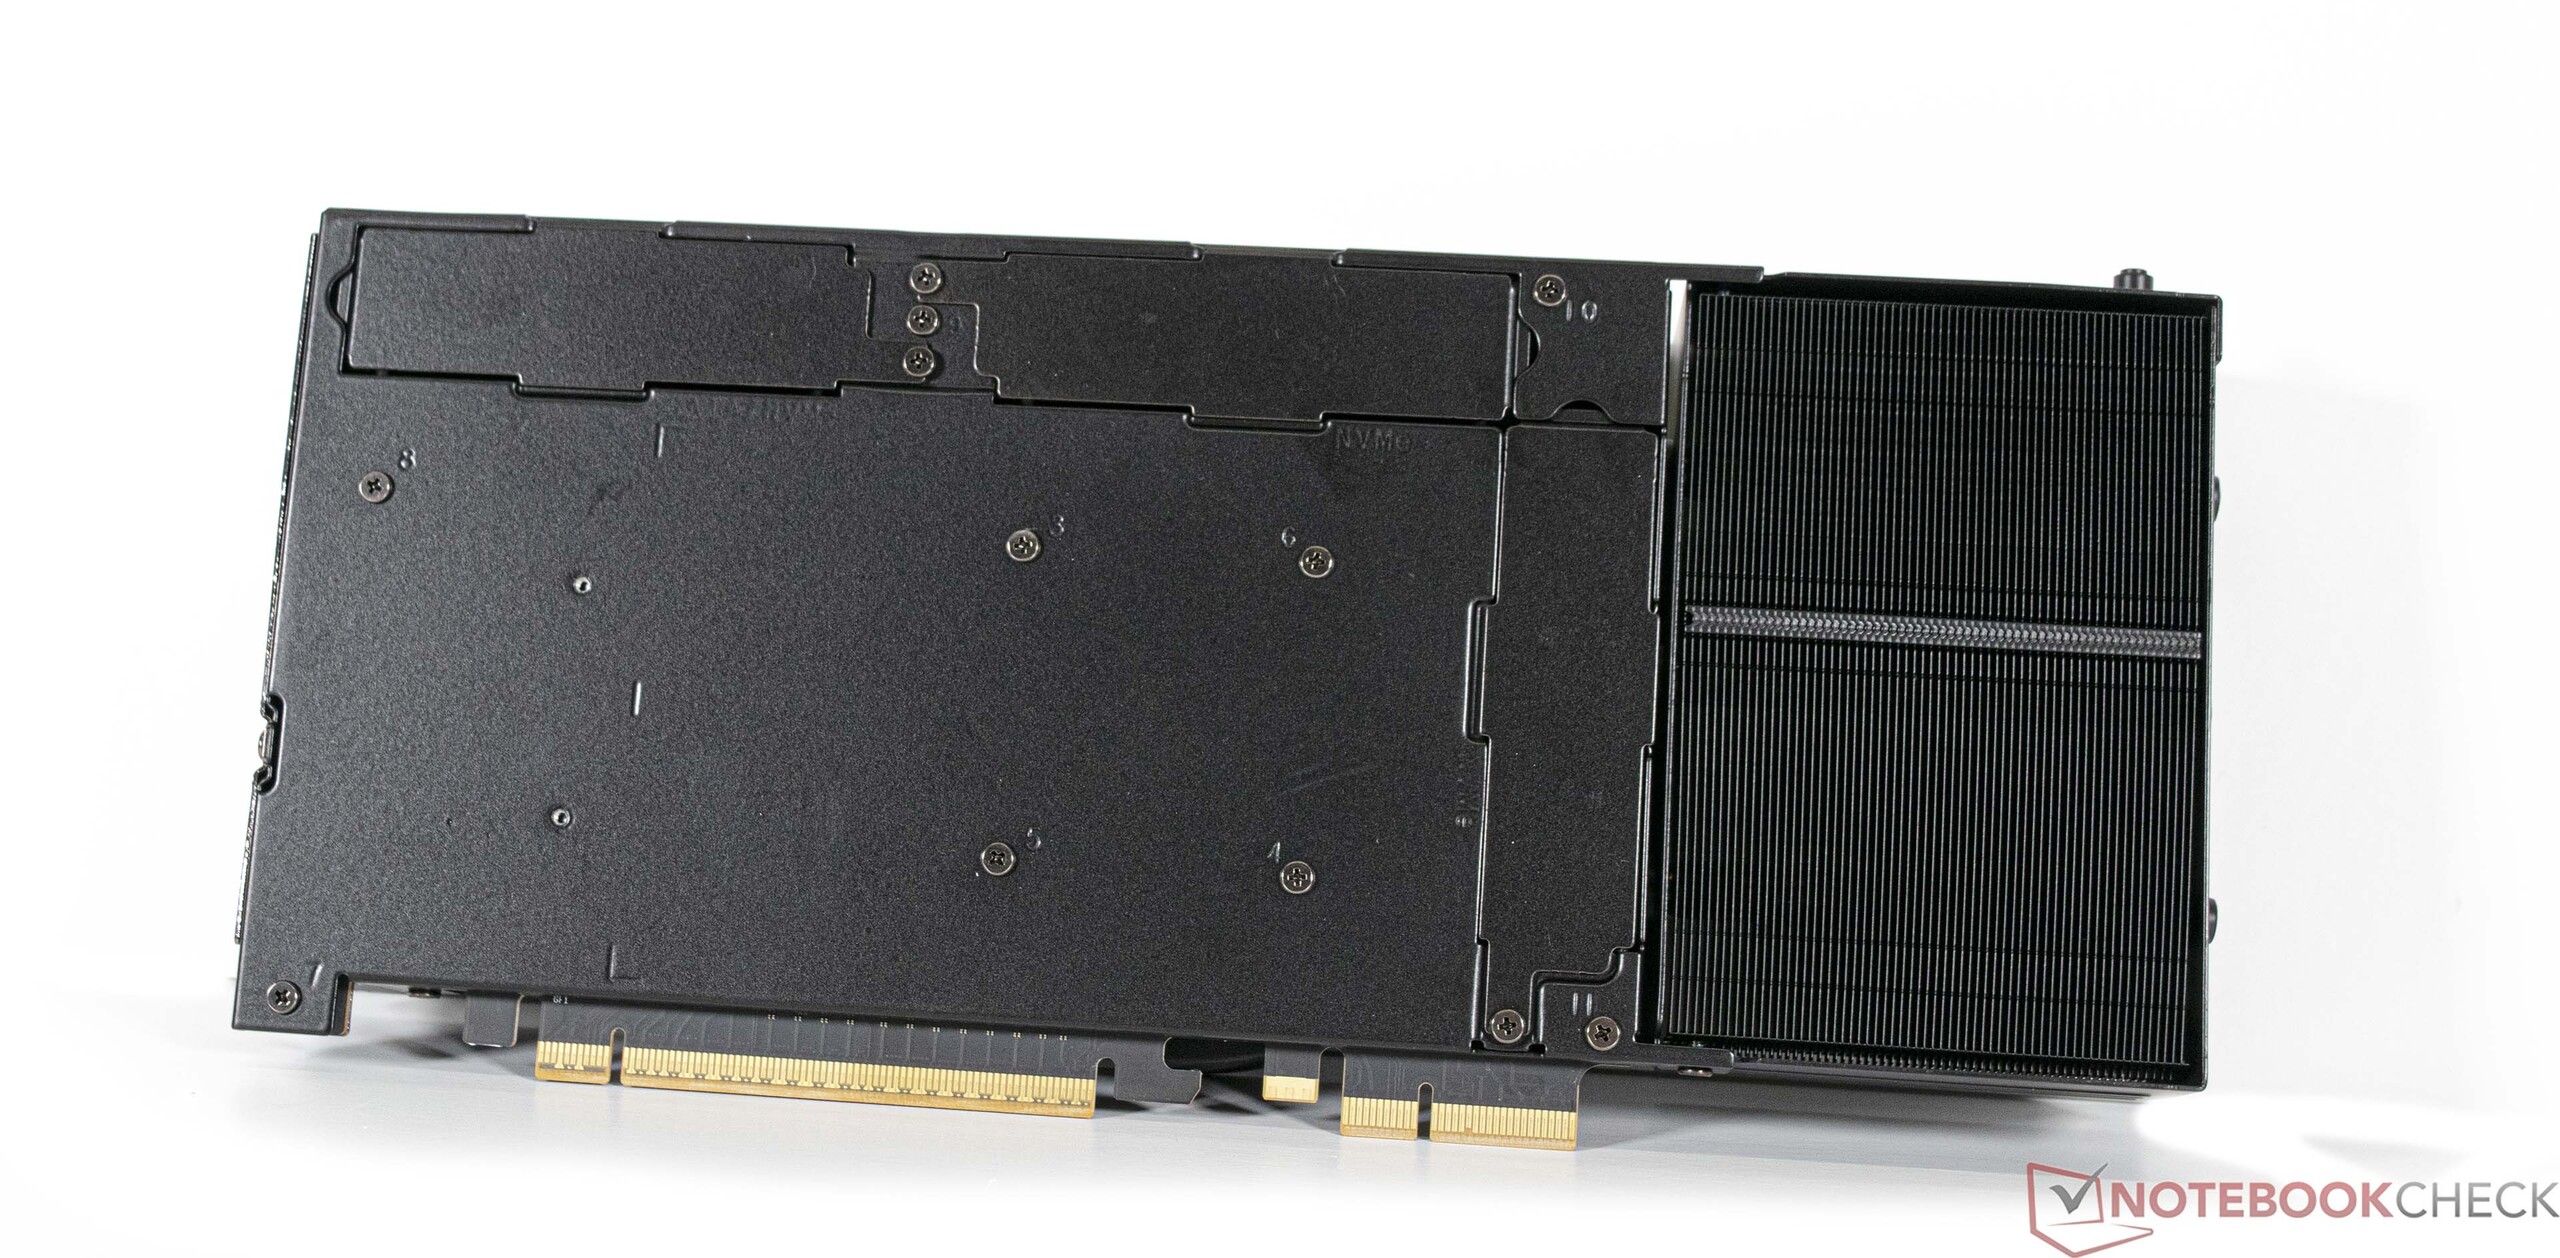
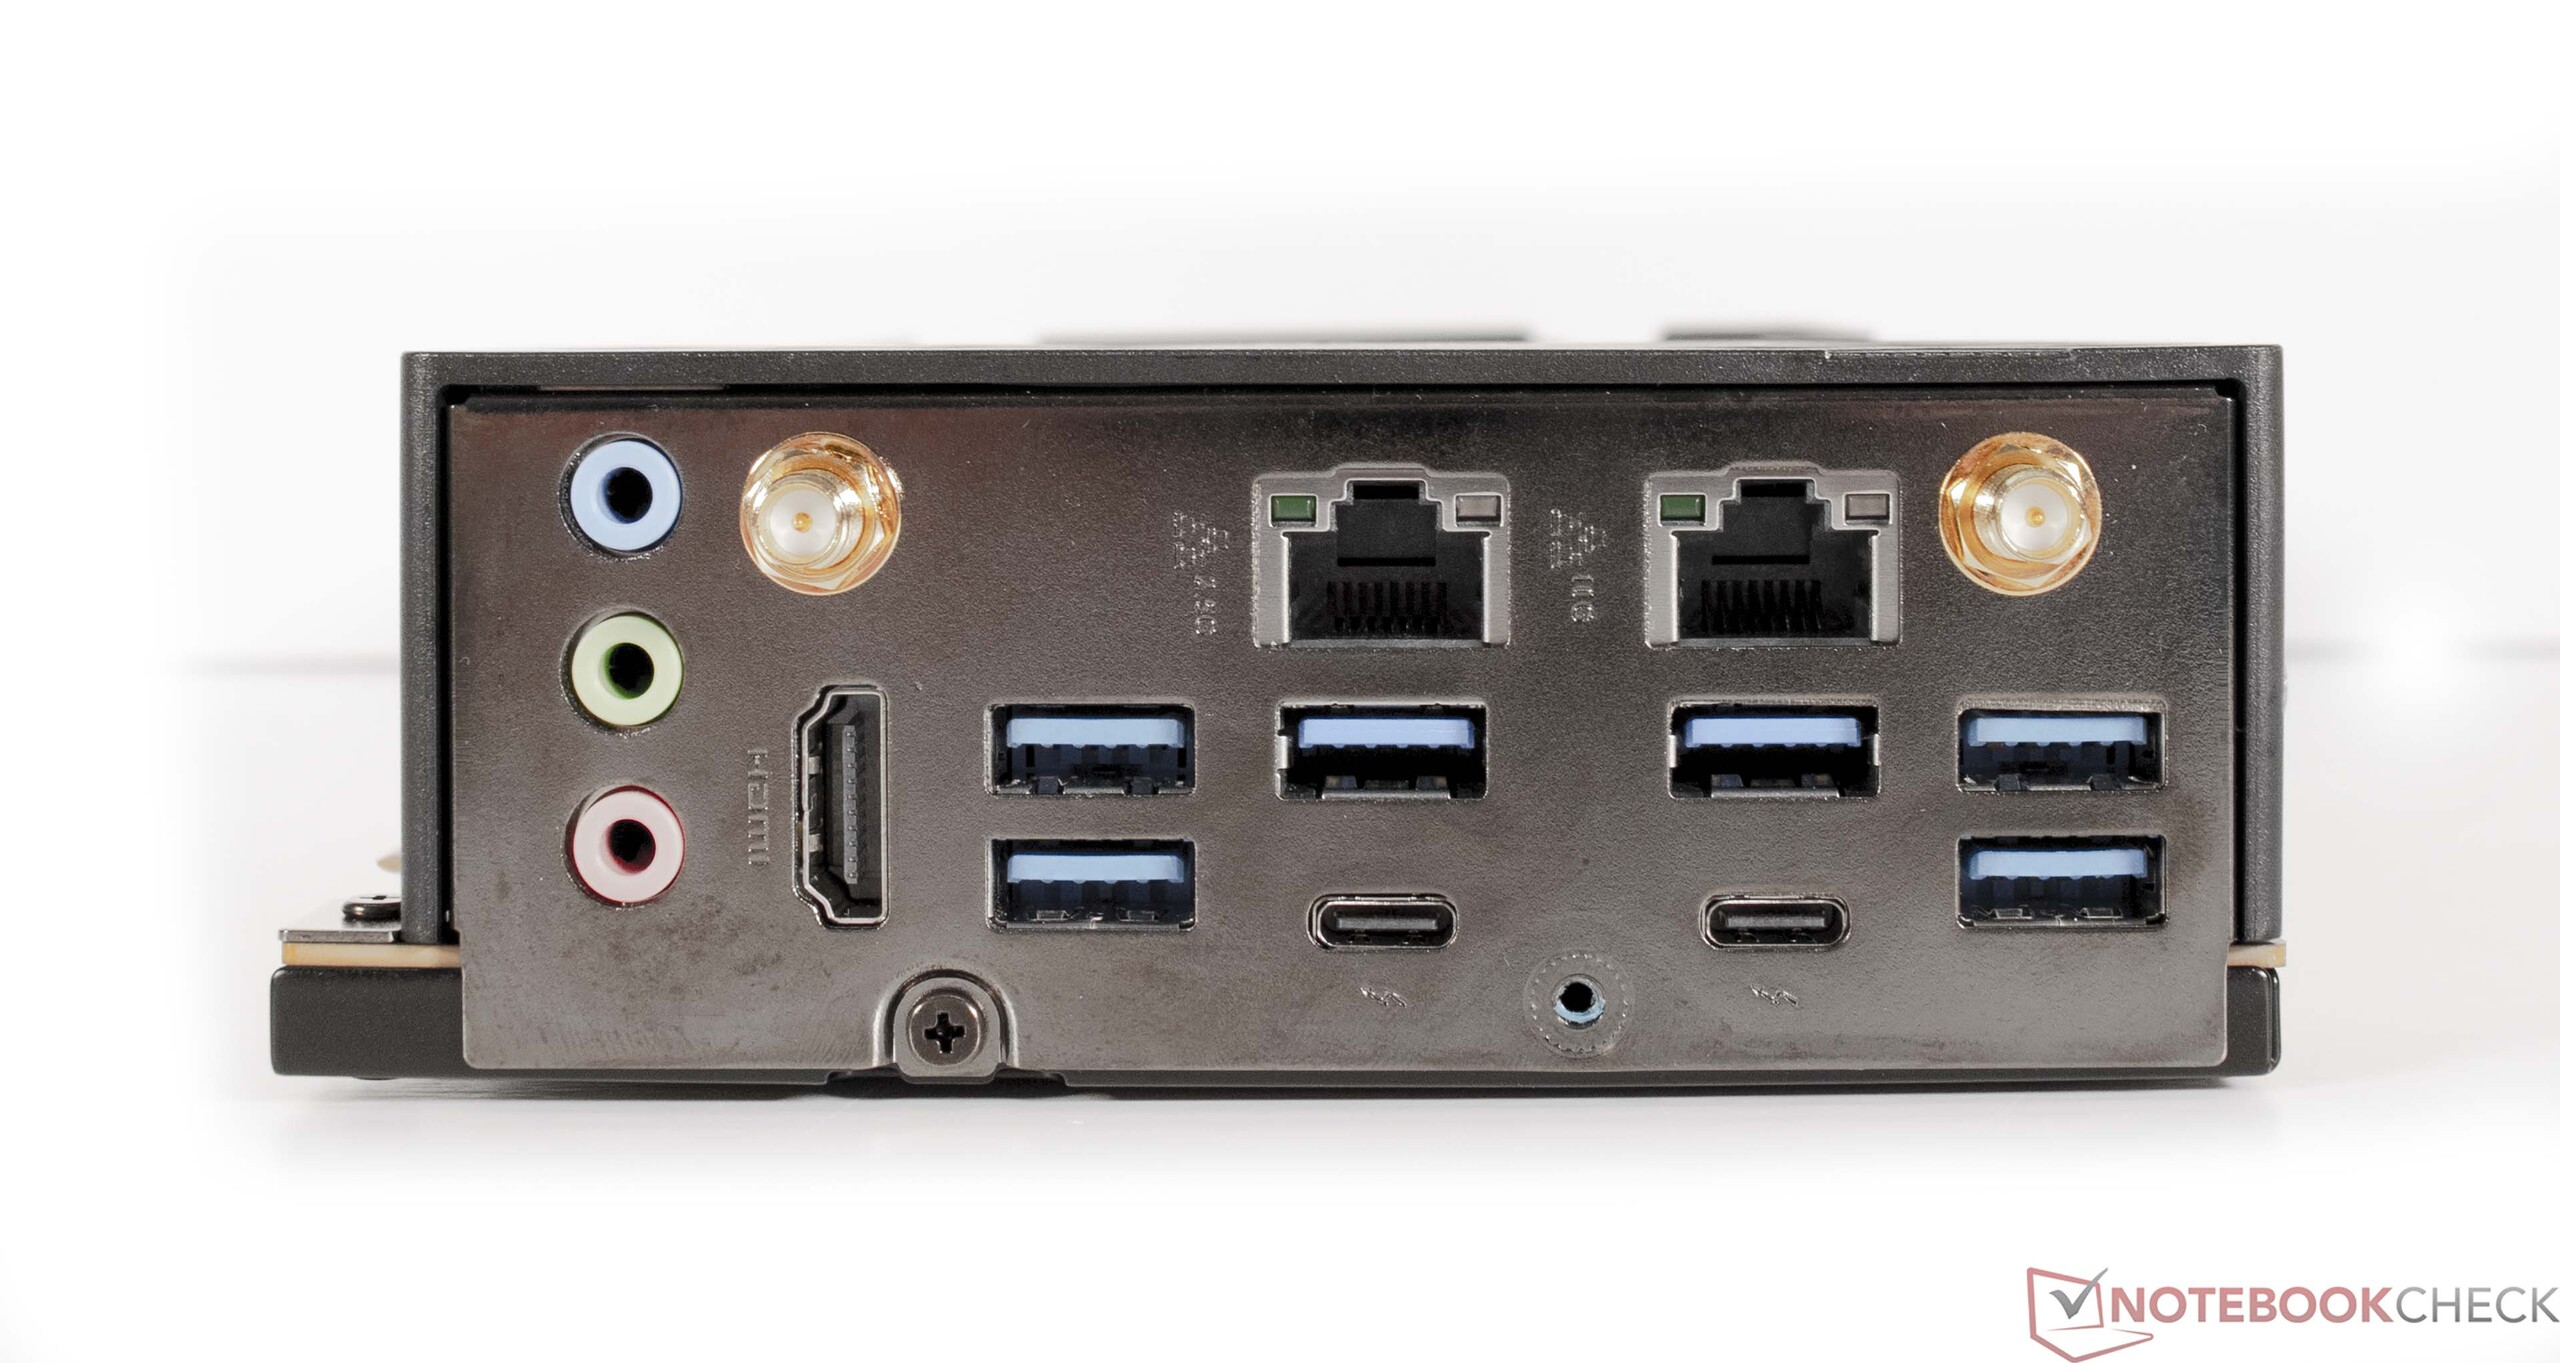
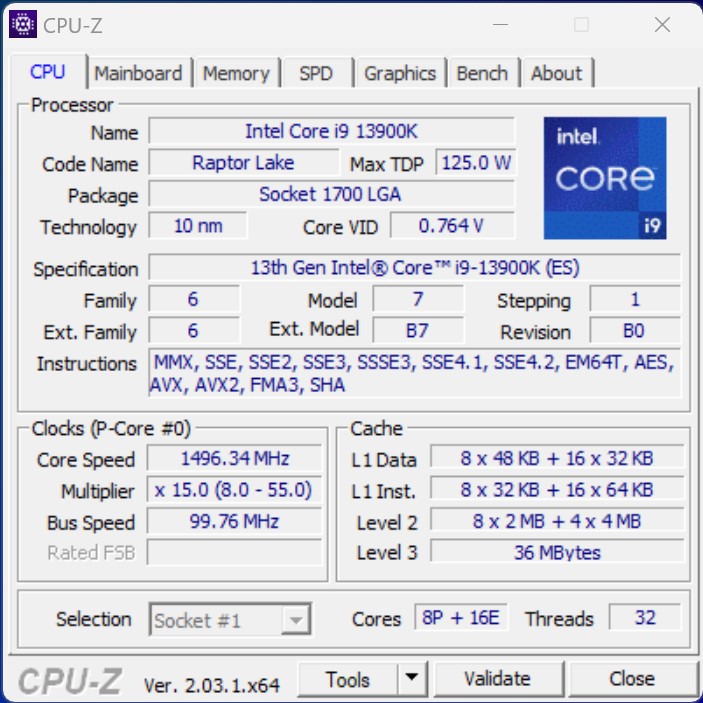
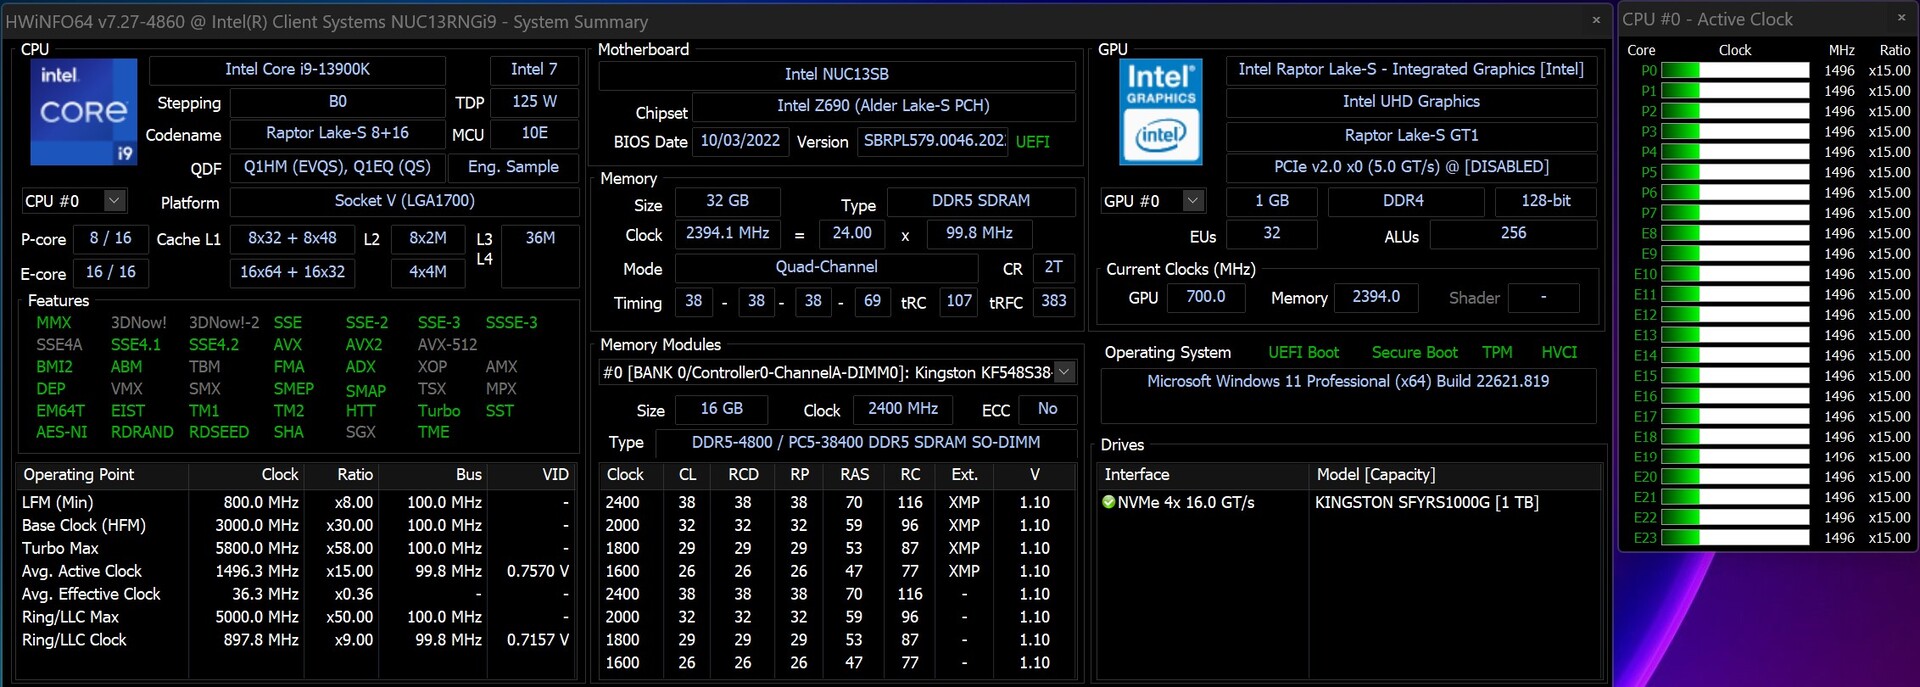
Med hjälp av Intel Core i9-13900Khar vår konfiguration av Intel NUC 13 Extreme den snabbaste spelprocessorn som finns tillgänglig just nu. Den har totalt 24 kärnor och 32 trådar. Det har blivit allmänt känt att Raptor Lake-generationens CPU:er använder en hybriddesign med E- och P-kärnor. Precis som på Intel NUC 12 Extreme innehåller dess föregångare även en vanlig skrivbordsprocessor. Dessutom kommer Compute Element med alla nödvändiga portar. Det finns tre NVMe SSD-fack på undersidan av kretskortet och alla externa gränssnitt på sidan.
Wi-Fi-prestanda
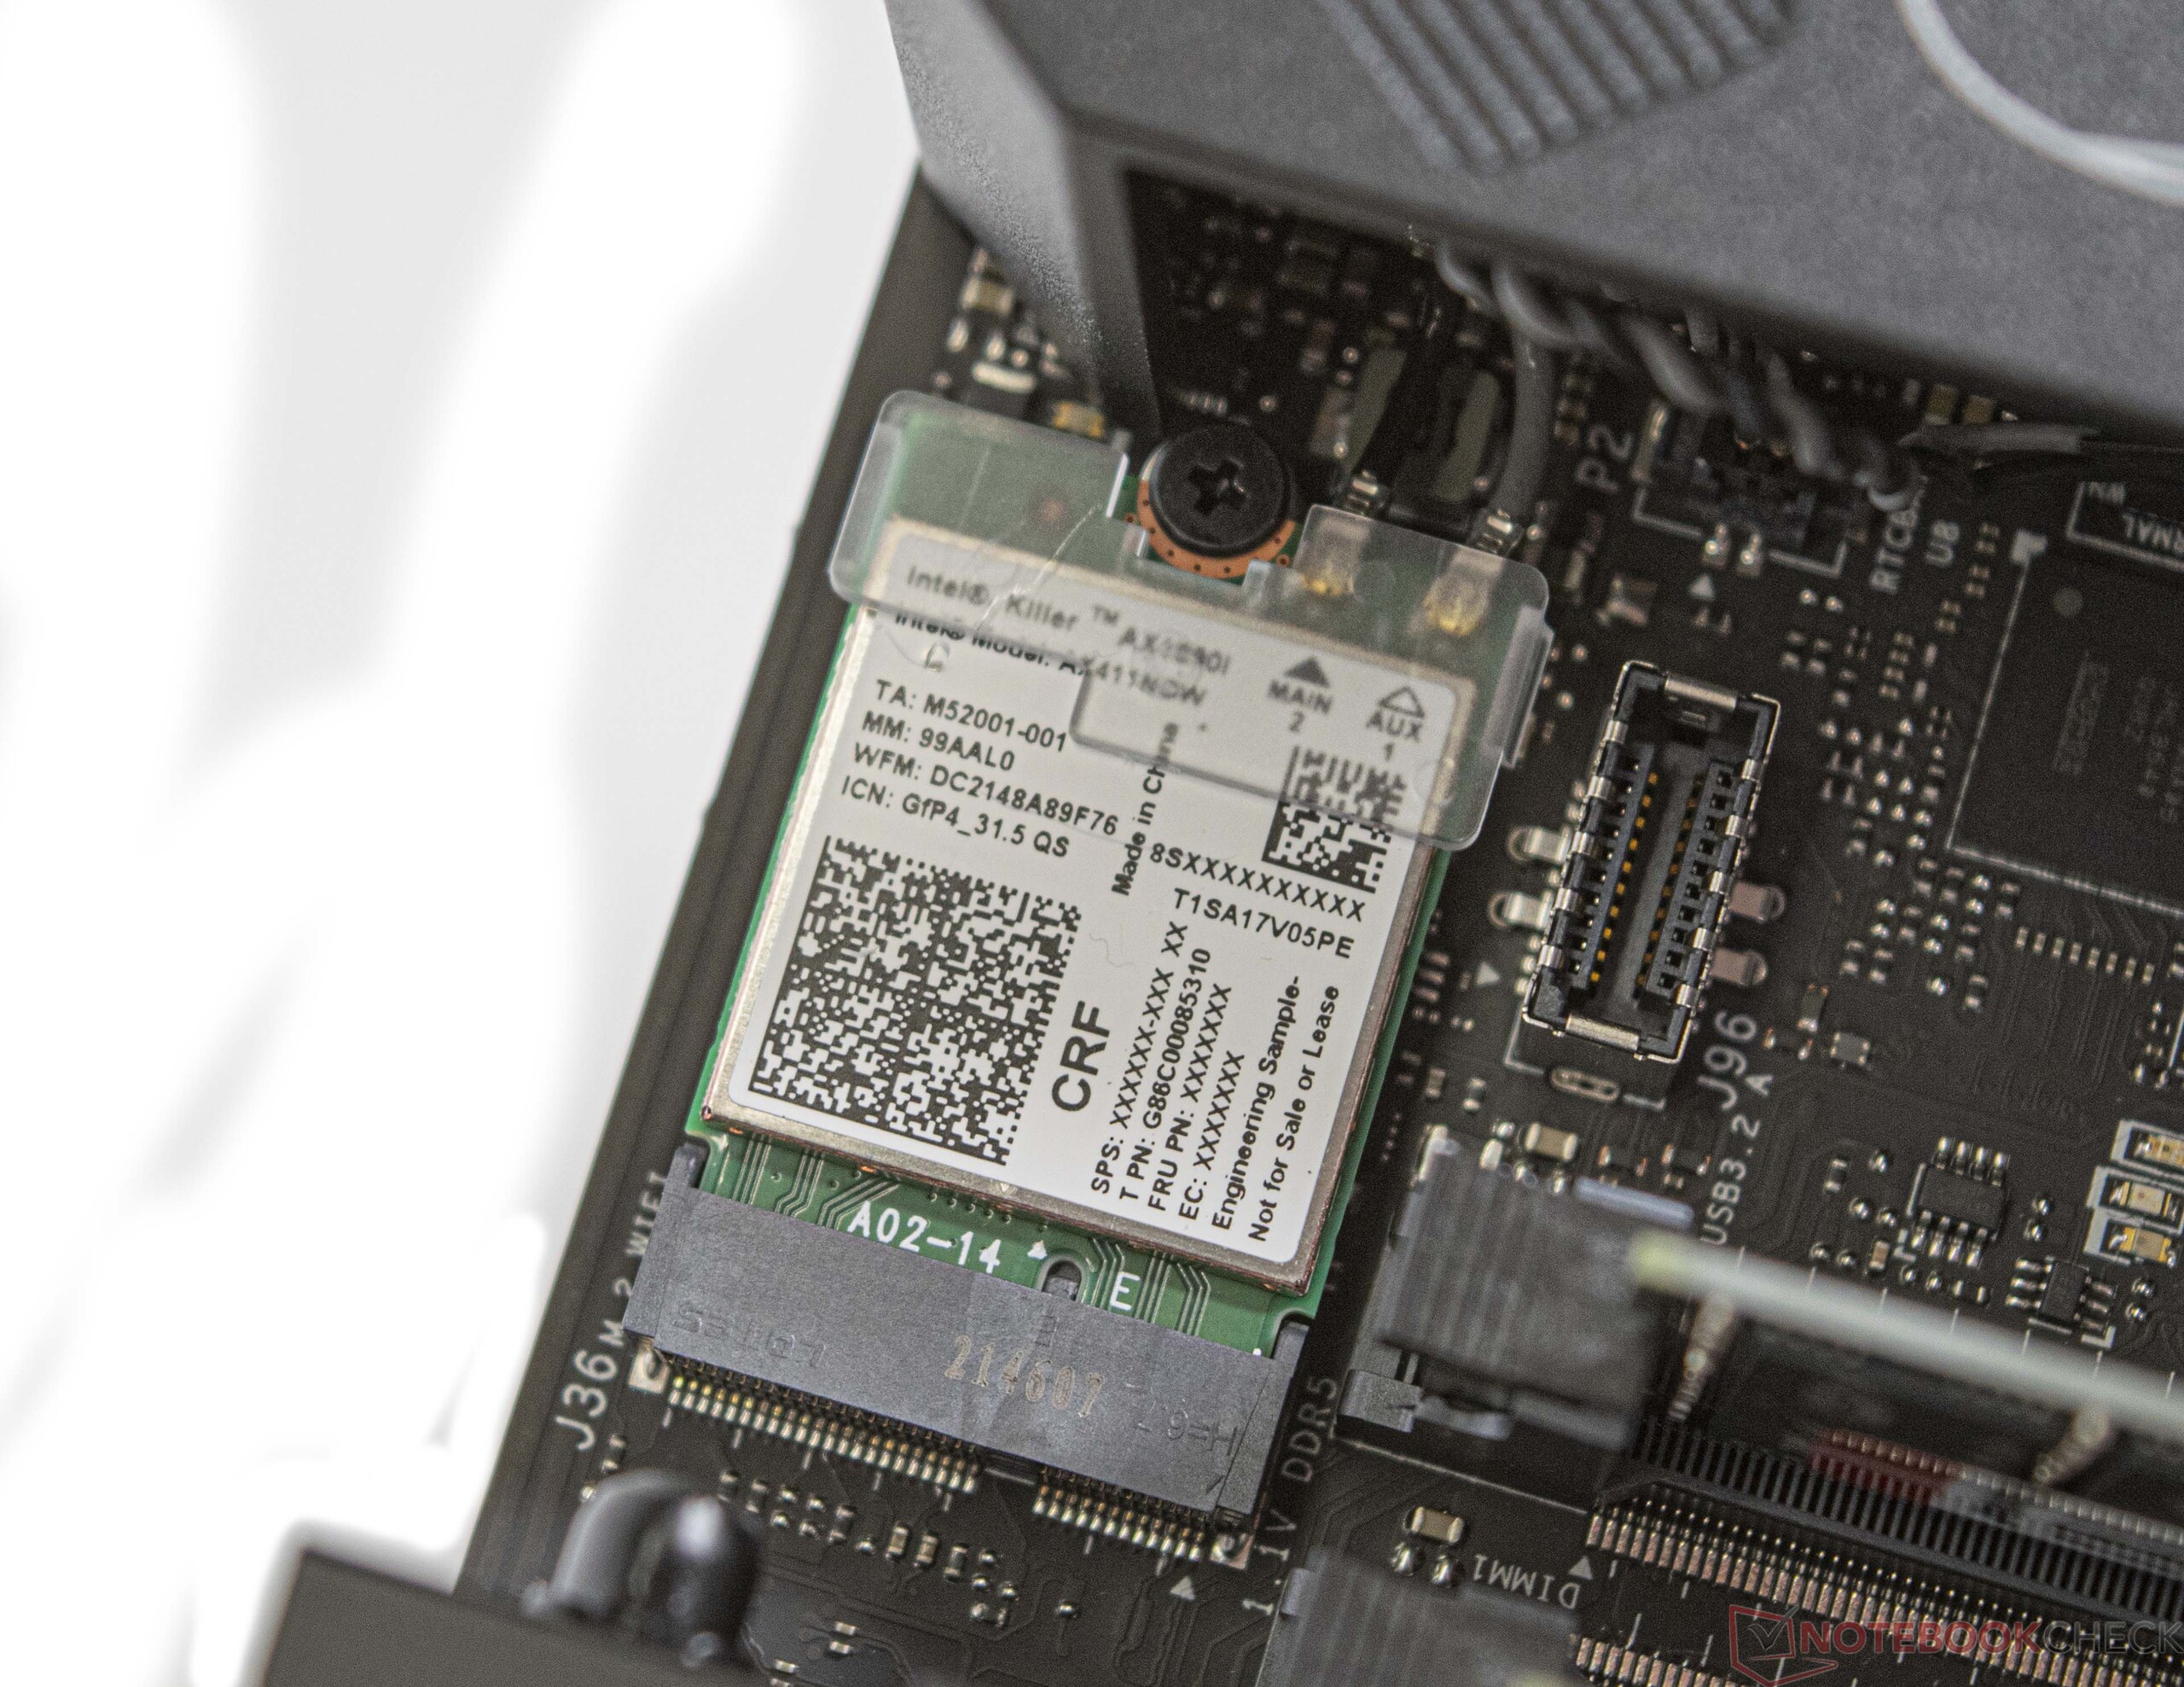
Intel NUC 13 Extreme Raptor Canyon har en Killer Wi-Fi 6E AX1690i Wi-Fi-modul. Tillsammans med vår referensrouter Asus ROG Rapture GT-AXE11000 mäter vi bra upp- och nedladdningshastigheter. Wi-Fi-enheten är en modul på Compute Element och kan därmed bytas ut av användaren. För trådbunden kommunikation finns både ett 10 Gb/s och ett 2,5 Gb/s gränssnitt.
Observera
Vi kunde inte få en stabil Wi-Fi 6G-anslutning med vår testenhet. Uppdatering av komponenterna med de senaste drivrutinerna och firmwareuppdateringarna för Intel NUC 13 Extreme Raptor Canyon samt vår testrouter förbättrade inte saken. Vi kommer att revidera den här delen av recensionen om situationen förändras inom de närmaste dagarna innan vi måste returnera enheten.
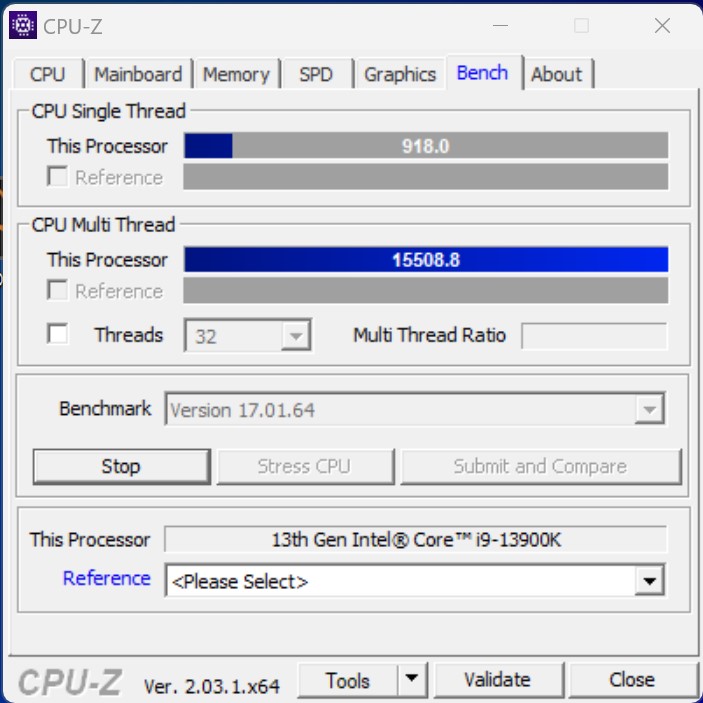
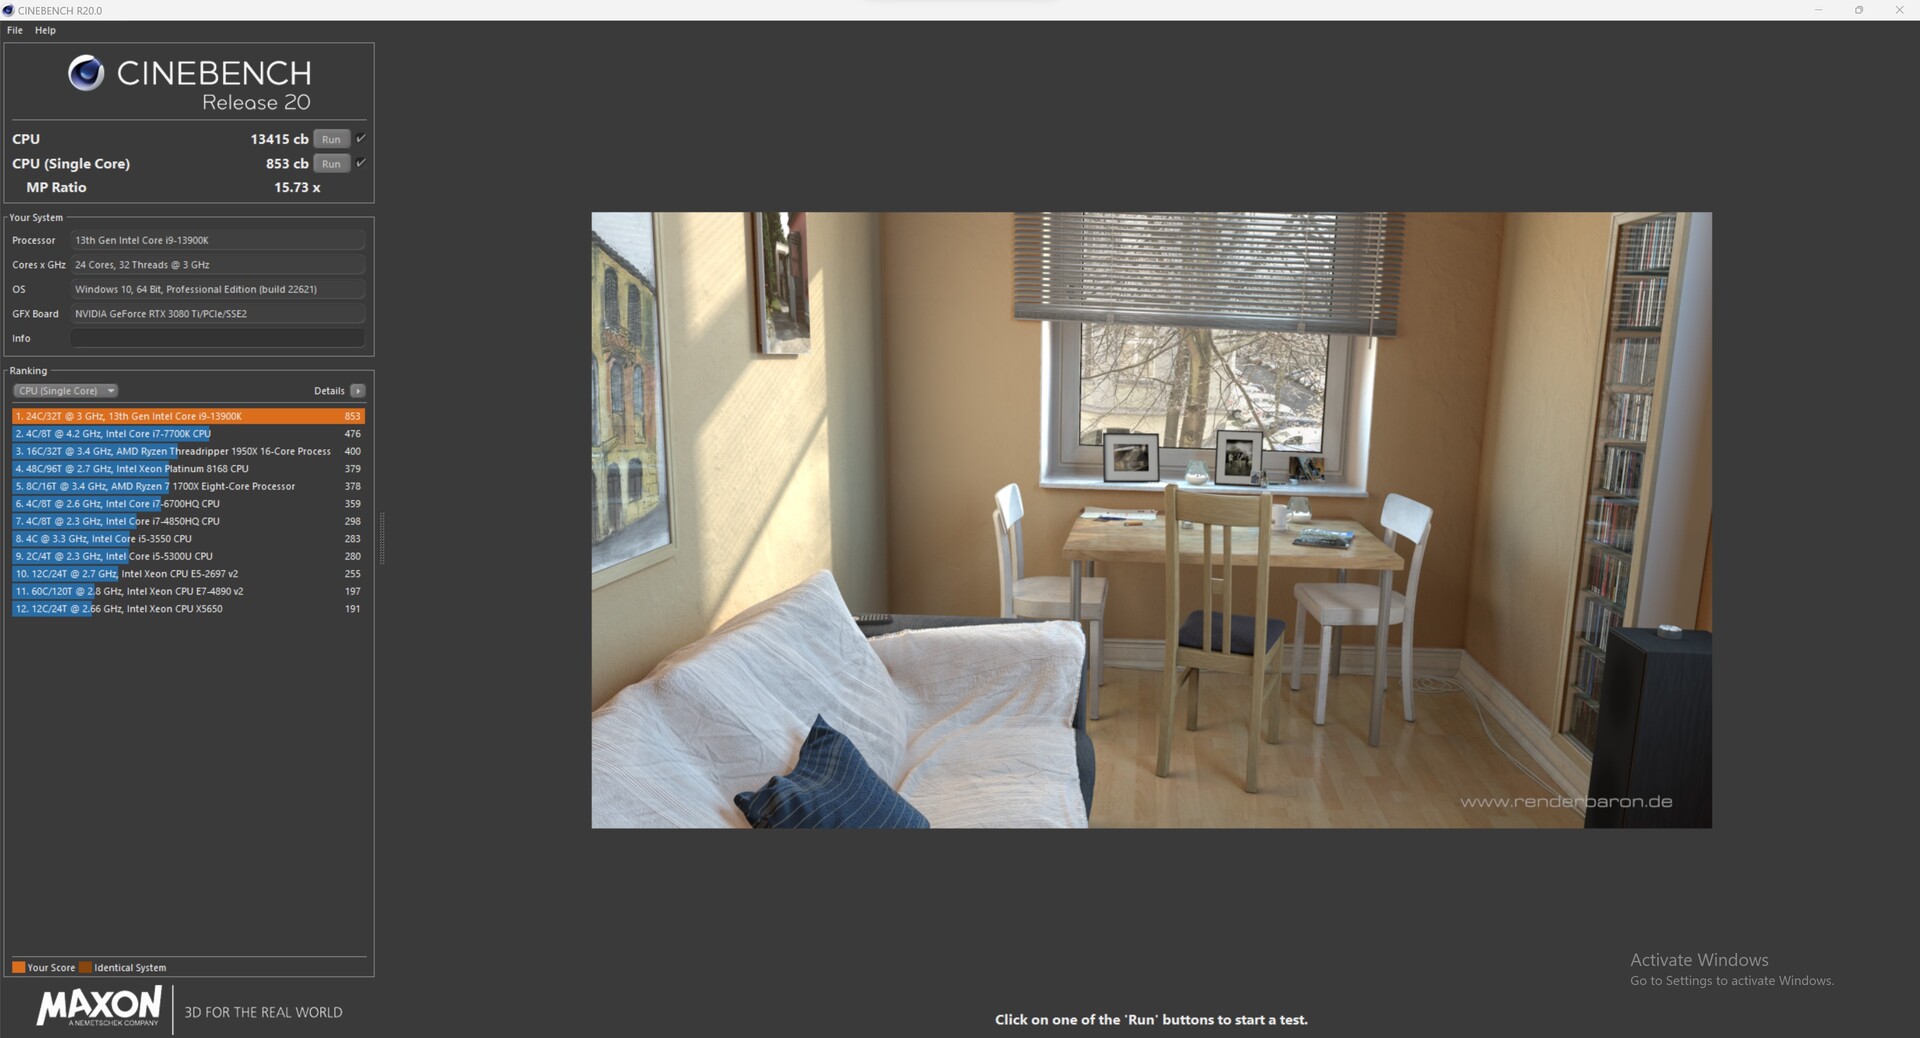
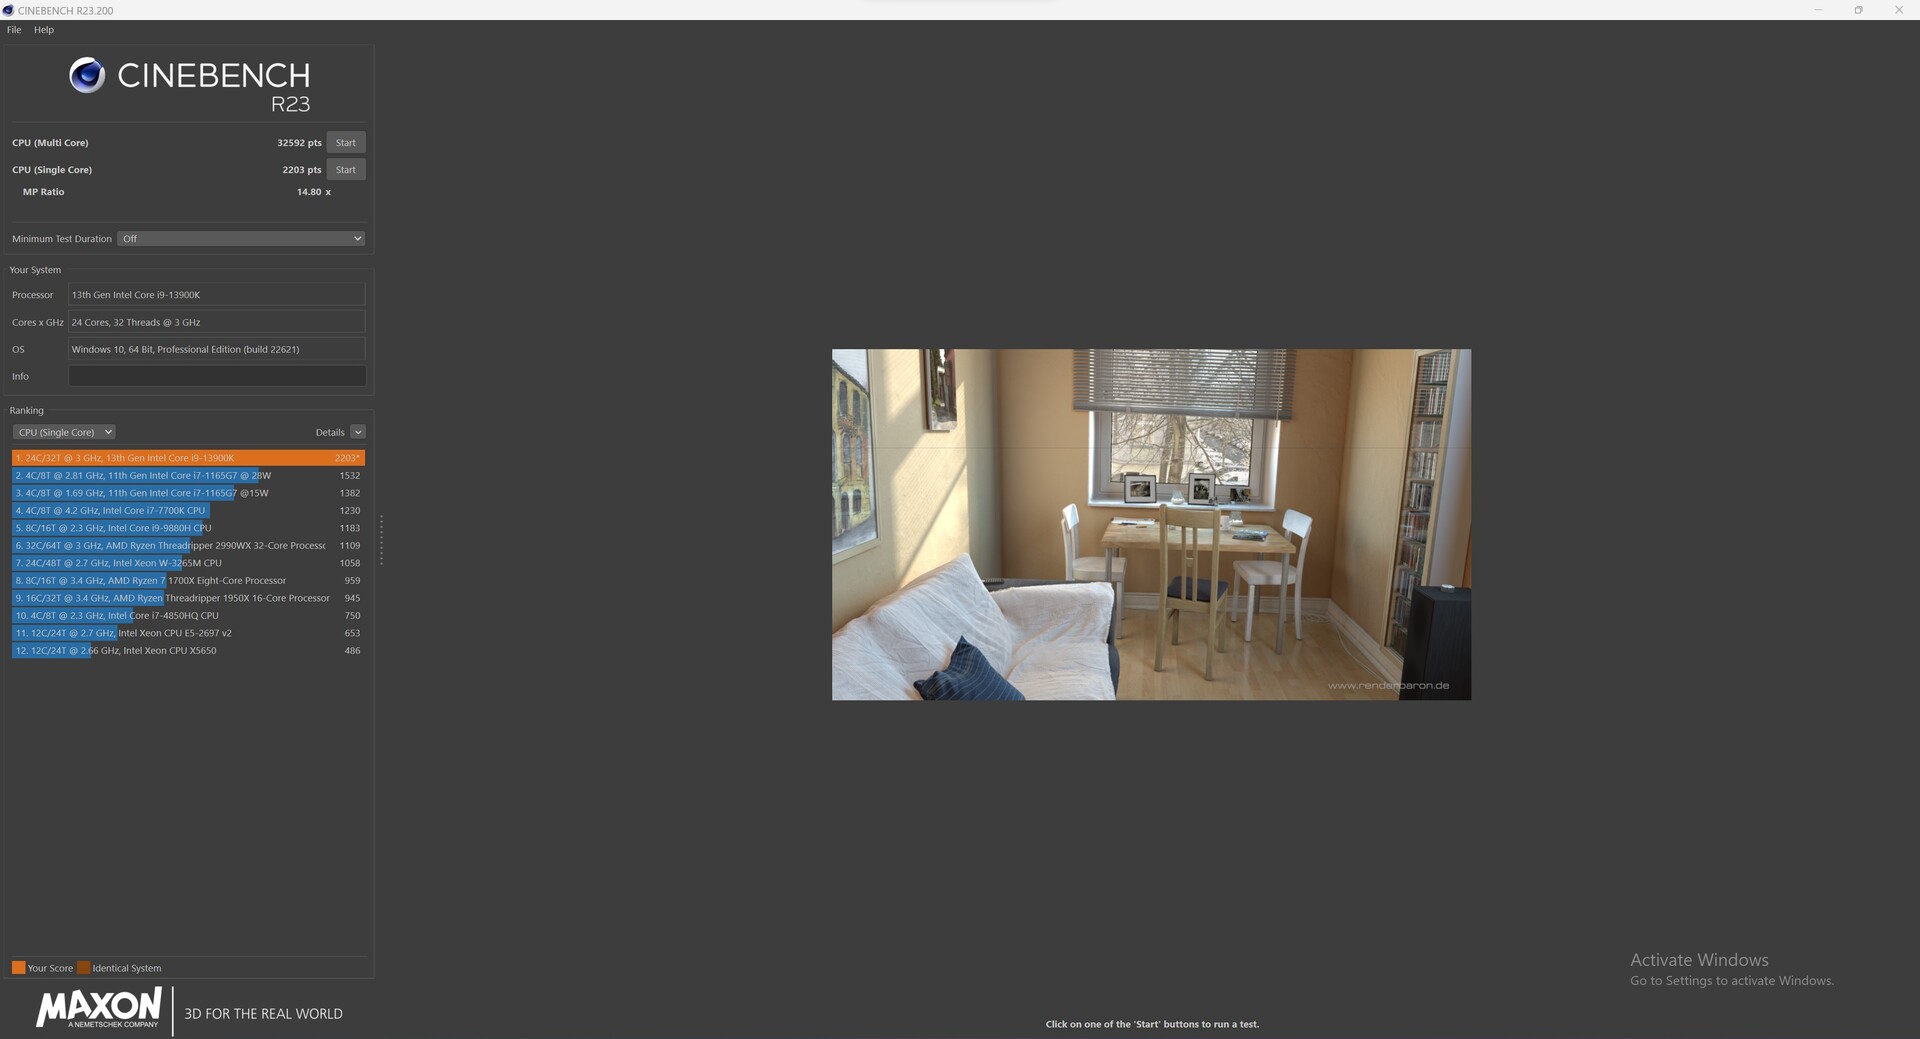
Benchmarks för processorer
Med Intel Core i9-13900K använder Intel NUC 13 Extreme Raptor Canyon Intels snabbaste spelprocessor. Som sådan stämmer de goda resultaten i benchmark med våra förväntningar. Trots den relativt lilla kylningslösningen mäter vi ett prestandaförlust på endast 7 % jämfört med ett annat stationärt system med en kraftfull vätskekylare.
När det gäller effektgränserna finns det några små begränsningar och 150-wattsgränsen förklarar den lilla skillnaden. De flesta tillämpningar kommer inte att utnyttja hela 250 watt. När man kombinerar Intel NUC 13 Extreme Raptor Canyon med den mindre kraftfulla Intel Core i5-13600K bör prestandanivån matcha resultaten i vår jämförelsetabell. Den lägre PL2 (181 watt) kommer sannolikt att kompensera en del av underskottet vid full belastning.
Fler processorbenchmarks finns att hitta här.
| Performance rating - Percent | |
| Intel Core i9-13900K | |
| AMD Ryzen 9 7950X | |
| Intel Core i9-13900K | |
| AMD Ryzen 9 7900X | |
| Intel Core i9-12900K | |
| Intel Core i5-13600K | |
| AMD Ryzen 5 7600X | |
| Intel Core i5-12600K | |
| Cinebench R15 | |
| CPU Single 64Bit | |
| AMD Ryzen 9 7950X | |
| Intel Core i9-13900K | |
| AMD Ryzen 9 7900X | |
| Intel Core i9-13900K | |
| AMD Ryzen 5 7600X | |
| Intel Core i5-13600K | |
| Intel Core i9-12900K | |
| Intel Core i5-12600K | |
| CPU Multi 64Bit | |
| AMD Ryzen 9 7950X | |
| Intel Core i9-13900K | |
| Intel Core i9-13900K | |
| AMD Ryzen 9 7900X | |
| Intel Core i9-12900K | |
| Intel Core i5-13600K | |
| Intel Core i5-12600K | |
| AMD Ryzen 5 7600X | |
| Cinebench R20 | |
| CPU (Single Core) | |
| Intel Core i9-13900K | |
| Intel Core i9-13900K | |
| AMD Ryzen 9 7950X | |
| AMD Ryzen 9 7900X | |
| Intel Core i5-13600K | |
| Intel Core i9-12900K | |
| AMD Ryzen 5 7600X | |
| Intel Core i5-12600K | |
| CPU (Multi Core) | |
| Intel Core i9-13900K | |
| AMD Ryzen 9 7950X | |
| Intel Core i9-13900K | |
| AMD Ryzen 9 7900X | |
| Intel Core i9-12900K | |
| Intel Core i5-13600K | |
| Intel Core i5-12600K | |
| AMD Ryzen 5 7600X | |
| Cinebench R23 | |
| Single Core | |
| Intel Core i9-13900K | |
| Intel Core i9-13900K | |
| AMD Ryzen 9 7950X | |
| AMD Ryzen 9 7900X | |
| Intel Core i5-13600K | |
| Intel Core i9-12900K | |
| AMD Ryzen 5 7600X | |
| Intel Core i5-12600K | |
| Multi Core | |
| Intel Core i9-13900K | |
| AMD Ryzen 9 7950X | |
| Intel Core i9-13900K | |
| AMD Ryzen 9 7900X | |
| Intel Core i9-12900K | |
| Intel Core i5-13600K | |
| Intel Core i5-12600K | |
| AMD Ryzen 5 7600X | |
| Cinebench R11.5 | |
| CPU Single 64Bit | |
| Intel Core i9-13900K | |
| AMD Ryzen 9 7950X | |
| AMD Ryzen 9 7900X | |
| Intel Core i9-13900K | |
| AMD Ryzen 5 7600X | |
| Intel Core i9-12900K | |
| Intel Core i5-13600K | |
| Intel Core i5-12600K | |
| CPU Multi 64Bit | |
| Intel Core i9-13900K | |
| AMD Ryzen 9 7950X | |
| Intel Core i9-13900K | |
| AMD Ryzen 9 7900X | |
| Intel Core i9-12900K | |
| Intel Core i5-13600K | |
| Intel Core i5-12600K | |
| AMD Ryzen 5 7600X | |
| Cinebench R10 | |
| Rendering Single CPUs 64Bit | |
| Intel Core i9-13900K | |
| Intel Core i9-13900K | |
| AMD Ryzen 9 7900X | |
| AMD Ryzen 9 7950X | |
| Intel Core i5-13600K | |
| Intel Core i9-12900K | |
| AMD Ryzen 5 7600X | |
| Intel Core i5-12600K | |
| Rendering Multiple CPUs 64Bit | |
| Intel Core i9-13900K | |
| Intel Core i9-13900K | |
| AMD Ryzen 9 7950X | |
| AMD Ryzen 9 7900X | |
| Intel Core i9-12900K | |
| Intel Core i5-13600K | |
| AMD Ryzen 5 7600X | |
| Intel Core i5-12600K | |
| Blender - v2.79 BMW27 CPU | |
| AMD Ryzen 5 7600X | |
| Intel Core i5-12600K | |
| Intel Core i5-13600K | |
| Intel Core i9-12900K | |
| AMD Ryzen 9 7900X | |
| Intel Core i9-13900K | |
| AMD Ryzen 9 7950X | |
| Intel Core i9-13900K | |
| X264 HD Benchmark 4.0 | |
| Pass 1 | |
| Intel Core i9-13900K | |
| Intel Core i9-13900K | |
| Intel Core i5-13600K | |
| AMD Ryzen 9 7950X | |
| AMD Ryzen 9 7900X | |
| Intel Core i9-12900K | |
| AMD Ryzen 5 7600X | |
| Intel Core i5-12600K | |
| Pass 2 | |
| Intel Core i9-13900K | |
| AMD Ryzen 9 7950X | |
| Intel Core i9-13900K | |
| AMD Ryzen 9 7900X | |
| Intel Core i9-12900K | |
| Intel Core i5-13600K | |
| Intel Core i5-12600K | |
| AMD Ryzen 5 7600X | |
| WinRAR - Result | |
| AMD Ryzen 9 7900X | |
| AMD Ryzen 9 7950X | |
| AMD Ryzen 5 7600X | |
| Intel Core i9-13900K | |
| Intel Core i9-13900K | |
| Intel Core i5-13600K | |
| Intel Core i9-12900K | |
| Intel Core i5-12600K | |
| TrueCrypt | |
| AES Mean 100MB | |
| AMD Ryzen 9 7950X | |
| Intel Core i9-13900K | |
| Intel Core i9-13900K | |
| Intel Core i5-13600K | |
| Intel Core i9-12900K | |
| AMD Ryzen 9 7900X | |
| AMD Ryzen 5 7600X | |
| Intel Core i5-12600K | |
| Twofish Mean 100MB | |
| Intel Core i9-13900K | |
| Intel Core i9-13900K | |
| AMD Ryzen 9 7950X | |
| Intel Core i9-12900K | |
| Intel Core i5-13600K | |
| AMD Ryzen 9 7900X | |
| Intel Core i5-12600K | |
| AMD Ryzen 5 7600X | |
| Serpent Mean 100MB | |
| Intel Core i9-13900K | |
| AMD Ryzen 9 7950X | |
| Intel Core i9-13900K | |
| Intel Core i9-12900K | |
| Intel Core i5-13600K | |
| AMD Ryzen 9 7900X | |
| Intel Core i5-12600K | |
| AMD Ryzen 5 7600X | |
| Geekbench 5.5 | |
| Multi-Core | |
| AMD Ryzen 9 7950X | |
| Intel Core i9-13900K | |
| Intel Core i9-13900K | |
| AMD Ryzen 9 7900X | |
| Intel Core i9-12900K | |
| Intel Core i5-13600K | |
| Intel Core i5-12600K | |
| AMD Ryzen 5 7600X | |
| Single-Core | |
| AMD Ryzen 9 7950X | |
| Intel Core i9-13900K | |
| AMD Ryzen 9 7900X | |
| AMD Ryzen 5 7600X | |
| Intel Core i9-13900K | |
| Intel Core i9-12900K | |
| Intel Core i5-13600K | |
| Intel Core i5-12600K | |
| Geekbench 5.0 | |
| 5.0 Multi-Core | |
| AMD Ryzen 9 7950X | |
| Intel Core i9-13900K | |
| Intel Core i9-13900K | |
| AMD Ryzen 9 7900X | |
| Intel Core i9-12900K | |
| Intel Core i5-13600K | |
| Intel Core i5-12600K | |
| AMD Ryzen 5 7600X | |
| 5.0 Single-Core | |
| AMD Ryzen 9 7950X | |
| Intel Core i9-13900K | |
| AMD Ryzen 9 7900X | |
| Intel Core i9-13900K | |
| AMD Ryzen 5 7600X | |
| Intel Core i9-12900K | |
| Intel Core i5-13600K | |
| Intel Core i5-12600K | |
| Geekbench 4.4 | |
| 64 Bit Single-Core Score | |
| Intel Core i9-13900K | |
| AMD Ryzen 9 7950X | |
| Intel Core i9-13900K | |
| AMD Ryzen 9 7900X | |
| AMD Ryzen 5 7600X | |
| Intel Core i9-12900K | |
| Intel Core i5-13600K | |
| Intel Core i5-12600K | |
| 64 Bit Multi-Core Score | |
| AMD Ryzen 9 7950X | |
| Intel Core i9-13900K | |
| Intel Core i9-13900K | |
| AMD Ryzen 9 7900X | |
| Intel Core i9-12900K | |
| Intel Core i5-13600K | |
| AMD Ryzen 5 7600X | |
| Intel Core i5-12600K | |
| 3DMark 11 - 1280x720 Performance Physics | |
| Intel Core i9-13900K | |
| Intel Core i5-13600K | |
| Intel Core i9-13900K | |
| AMD Ryzen 9 7900X | |
| AMD Ryzen 9 7950X | |
| Intel Core i9-12900K | |
| AMD Ryzen 5 7600X | |
| Intel Core i5-12600K | |
| HWBOT x265 Benchmark v2.2 - 4k Preset | |
| AMD Ryzen 9 7950X | |
| Intel Core i9-13900K | |
| AMD Ryzen 9 7900X | |
| Intel Core i9-13900K | |
| Intel Core i5-12600K | |
| Intel Core i9-12900K | |
| Intel Core i5-13600K | |
| AMD Ryzen 5 7600X | |
| R Benchmark 2.5 - Overall mean | |
| Intel Core i5-12600K | |
| Intel Core i9-12900K | |
| Intel Core i5-13600K | |
| Intel Core i9-13900K | |
| AMD Ryzen 5 7600X | |
| AMD Ryzen 9 7900X | |
| AMD Ryzen 9 7950X | |
| Intel Core i9-13900K | |
| LibreOffice - 20 Documents To PDF | |
| Intel Core i5-12600K | |
| Intel Core i9-13900K | |
| Intel Core i9-12900K | |
| AMD Ryzen 5 7600X | |
| Intel Core i9-13900K | |
| AMD Ryzen 9 7950X | |
| Intel Core i5-13600K | |
| AMD Ryzen 9 7900X | |
| WebXPRT 3 - Overall | |
| AMD Ryzen 9 7900X | |
| AMD Ryzen 9 7950X | |
| AMD Ryzen 5 7600X | |
| Intel Core i9-13900K | |
| Intel Core i9-13900K | |
| Intel Core i5-13600K | |
| Intel Core i9-12900K | |
| Intel Core i5-12600K | |
| Mozilla Kraken 1.1 - Total | |
| Intel Core i5-12600K | |
| Intel Core i9-12900K | |
| Intel Core i5-13600K | |
| AMD Ryzen 5 7600X | |
| Intel Core i9-13900K | |
| AMD Ryzen 9 7950X | |
| Intel Core i9-13900K | |
| AMD Ryzen 9 7900X | |
| 3DMark | |
| 3840x2160 Fire Strike Ultra Physics | |
| Intel Core i9-13900K | |
| Intel Core i9-13900K | |
| AMD Ryzen 9 7900X | |
| AMD Ryzen 9 7950X | |
| Intel Core i9-12900K | |
| Intel Core i5-13600K | |
| AMD Ryzen 5 7600X | |
| Intel Core i5-12600K | |
| 1920x1080 Fire Strike Physics | |
| Intel Core i9-13900K | |
| Intel Core i9-13900K | |
| AMD Ryzen 9 7900X | |
| AMD Ryzen 9 7950X | |
| Intel Core i9-12900K | |
| Intel Core i5-13600K | |
| AMD Ryzen 5 7600X | |
| Intel Core i5-12600K | |
| 2560x1440 Time Spy CPU | |
| Intel Core i9-13900K | |
| Intel Core i9-12900K | |
| Intel Core i5-13600K | |
| AMD Ryzen 9 7900X | |
| AMD Ryzen 9 7950X | |
| Intel Core i9-13900K | |
| Intel Core i5-12600K | |
| AMD Ryzen 5 7600X | |
* ... mindre är bättre
AIDA64: FP32 Ray-Trace | FPU Julia | CPU SHA3 | CPU Queen | FPU SinJulia | FPU Mandel | CPU AES | CPU ZLib | FP64 Ray-Trace | CPU PhotoWorxx
| Performance rating | |
| AMD Ryzen 9 7950X | |
| Intel Core i9-13900K | |
| AMD Ryzen 9 7900X | |
| Genomsnitt av klass Desktop | |
| Intel Core i9-13900K | |
| Intel Core i5-13600K | |
| Intel Core i9-12900K | |
| AMD Ryzen 5 7600X | |
| AMD Ryzen 9 5900HX | |
| Intel Core i5-12600K | |
| Intel Core i7-11800H | |
| AIDA64 / FP32 Ray-Trace | |
| AMD Ryzen 9 7950X | |
| Genomsnitt av klass Desktop (12248 - 84577, n=21, senaste 2 åren) | |
| Intel Core i9-13900K | |
| AMD Ryzen 9 7900X | |
| Intel Core i9-13900K | |
| Intel Core i5-13600K | |
| AMD Ryzen 5 7600X | |
| AMD Ryzen 9 5900HX | |
| Intel Core i9-12900K | |
| Intel Core i7-11800H | |
| Intel Core i5-12600K | |
| AIDA64 / FPU Julia | |
| AMD Ryzen 9 7950X | |
| AMD Ryzen 9 7900X | |
| Intel Core i9-13900K | |
| Genomsnitt av klass Desktop (65152 - 246125, n=21, senaste 2 åren) | |
| Intel Core i9-13900K | |
| Intel Core i5-13600K | |
| AMD Ryzen 5 7600X | |
| AMD Ryzen 9 5900HX | |
| Intel Core i9-12900K | |
| Intel Core i7-11800H | |
| Intel Core i5-12600K | |
| AIDA64 / CPU SHA3 | |
| AMD Ryzen 9 7950X | |
| Intel Core i9-13900K | |
| AMD Ryzen 9 7900X | |
| Genomsnitt av klass Desktop (2982 - 10804, n=21, senaste 2 åren) | |
| Intel Core i9-13900K | |
| Intel Core i5-13600K | |
| Intel Core i9-12900K | |
| Intel Core i7-11800H | |
| AMD Ryzen 5 7600X | |
| AMD Ryzen 9 5900HX | |
| Intel Core i5-12600K | |
| AIDA64 / CPU Queen | |
| AMD Ryzen 9 7950X | |
| AMD Ryzen 9 7900X | |
| Intel Core i9-13900K | |
| Intel Core i9-13900K | |
| Genomsnitt av klass Desktop (76512 - 187912, n=18, senaste 2 åren) | |
| Intel Core i5-13600K | |
| Intel Core i9-12900K | |
| AMD Ryzen 5 7600X | |
| AMD Ryzen 9 5900HX | |
| Intel Core i7-11800H | |
| Intel Core i5-12600K | |
| AIDA64 / FPU SinJulia | |
| AMD Ryzen 9 7950X | |
| AMD Ryzen 9 7900X | |
| Intel Core i9-13900K | |
| Genomsnitt av klass Desktop (6443 - 35251, n=21, senaste 2 åren) | |
| Intel Core i9-13900K | |
| Intel Core i9-12900K | |
| AMD Ryzen 5 7600X | |
| AMD Ryzen 9 5900HX | |
| Intel Core i5-13600K | |
| Intel Core i7-11800H | |
| Intel Core i5-12600K | |
| AIDA64 / FPU Mandel | |
| AMD Ryzen 9 7950X | |
| AMD Ryzen 9 7900X | |
| Intel Core i9-13900K | |
| Genomsnitt av klass Desktop (31697 - 129745, n=21, senaste 2 åren) | |
| Intel Core i9-13900K | |
| Intel Core i5-13600K | |
| AMD Ryzen 9 5900HX | |
| AMD Ryzen 5 7600X | |
| Intel Core i9-12900K | |
| Intel Core i7-11800H | |
| Intel Core i5-12600K | |
| AIDA64 / CPU AES | |
| AMD Ryzen 9 7950X | |
| Intel Core i9-13900K | |
| AMD Ryzen 9 7900X | |
| Intel Core i5-13600K | |
| Genomsnitt av klass Desktop (57777 - 513073, n=21, senaste 2 åren) | |
| AMD Ryzen 5 7600X | |
| AMD Ryzen 9 5900HX | |
| Intel Core i9-13900K | |
| Intel Core i7-11800H | |
| Intel Core i9-12900K | |
| Intel Core i5-12600K | |
| AIDA64 / CPU ZLib | |
| Intel Core i9-13900K | |
| AMD Ryzen 9 7950X | |
| Intel Core i9-13900K | |
| AMD Ryzen 9 7900X | |
| Genomsnitt av klass Desktop (887 - 2674, n=21, senaste 2 åren) | |
| Intel Core i9-12900K | |
| Intel Core i5-13600K | |
| Intel Core i5-12600K | |
| AMD Ryzen 5 7600X | |
| AMD Ryzen 9 5900HX | |
| Intel Core i7-11800H | |
| AIDA64 / FP64 Ray-Trace | |
| AMD Ryzen 9 7950X | |
| Genomsnitt av klass Desktop (6471 - 44013, n=21, senaste 2 åren) | |
| Intel Core i9-13900K | |
| AMD Ryzen 9 7900X | |
| Intel Core i9-13900K | |
| Intel Core i5-13600K | |
| AMD Ryzen 5 7600X | |
| Intel Core i9-12900K | |
| AMD Ryzen 9 5900HX | |
| Intel Core i7-11800H | |
| Intel Core i5-12600K | |
| AIDA64 / CPU PhotoWorxx | |
| Intel Core i9-13900K | |
| Intel Core i5-12600K | |
| Intel Core i5-13600K | |
| Intel Core i9-12900K | |
| Genomsnitt av klass Desktop (38071 - 63949, n=21, senaste 2 åren) | |
| Intel Core i9-13900K | |
| AMD Ryzen 9 7950X | |
| AMD Ryzen 9 7900X | |
| AMD Ryzen 5 7600X | |
| Intel Core i7-11800H | |
| AMD Ryzen 9 5900HX | |
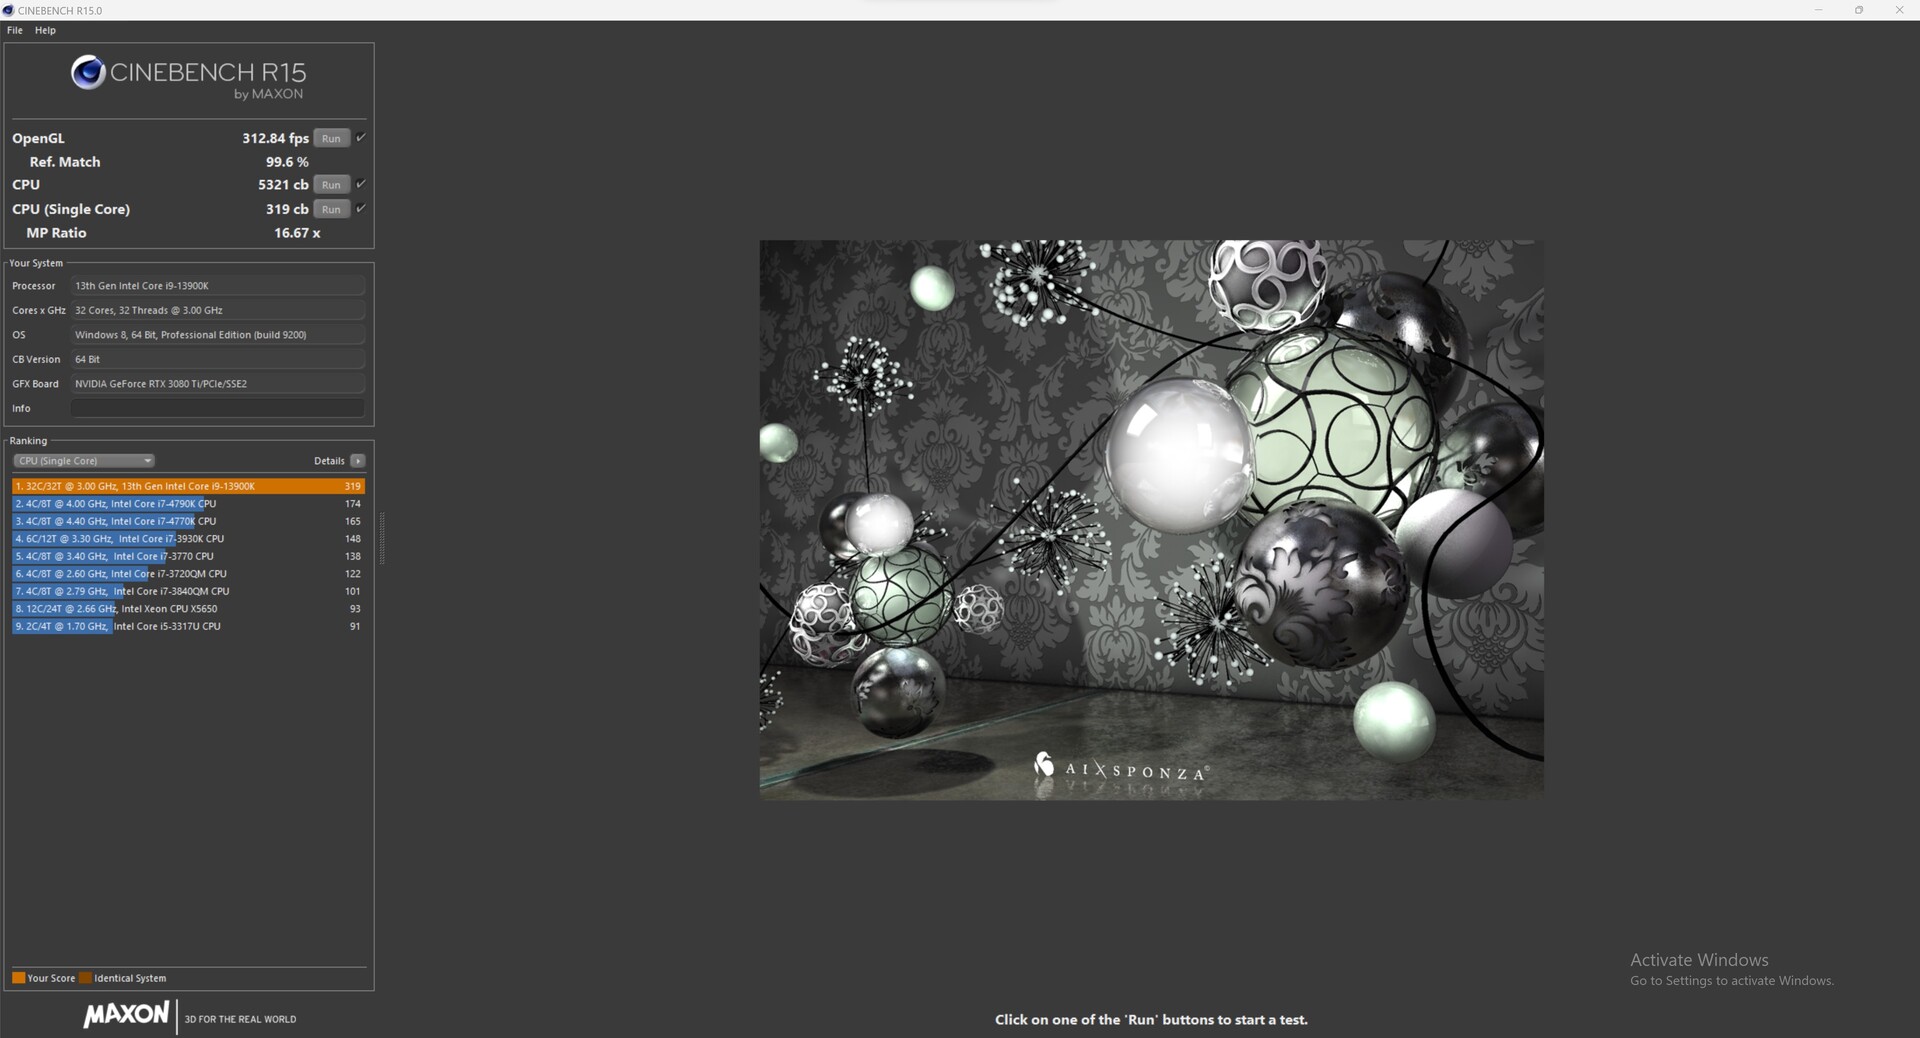
Intel NUC 13 Extreme Kit: Cinebench R15 Multi Loop
Vår Cinebench R15 Multi-slinga visar att prestandan sjunker betydligt efter den första slingan. På grund av den kompakta kylningslösningen och effektbegränsningarna ser vi en lägre prestandanivå jämfört med en Intel Core i9-13900K i ett alternativt system med Intel Core i9-13900K under kontinuerlig CPU-belastning. Med detta sagt är resultatet på 4779 poäng fortfarande betydligt högre än resultatet för Intel Dragon Canyon NUC.
Systemets prestanda
När det gäller syntetiska benchmarks briljerar Intel NUC 13 Extreme Raptor Canyon med en mycket snabb systemprestanda. Här kanIntel Core i9-13900K med bättre kylning fortfarande ett litet försprång. Konkurrenter från Minisforum och direkta föregångare från NUC-serien har dock ingen chans. Subjektivt sett är vårt testsystem mycket snabbt och responsivt och det finns inga märkbara fördröjningar.
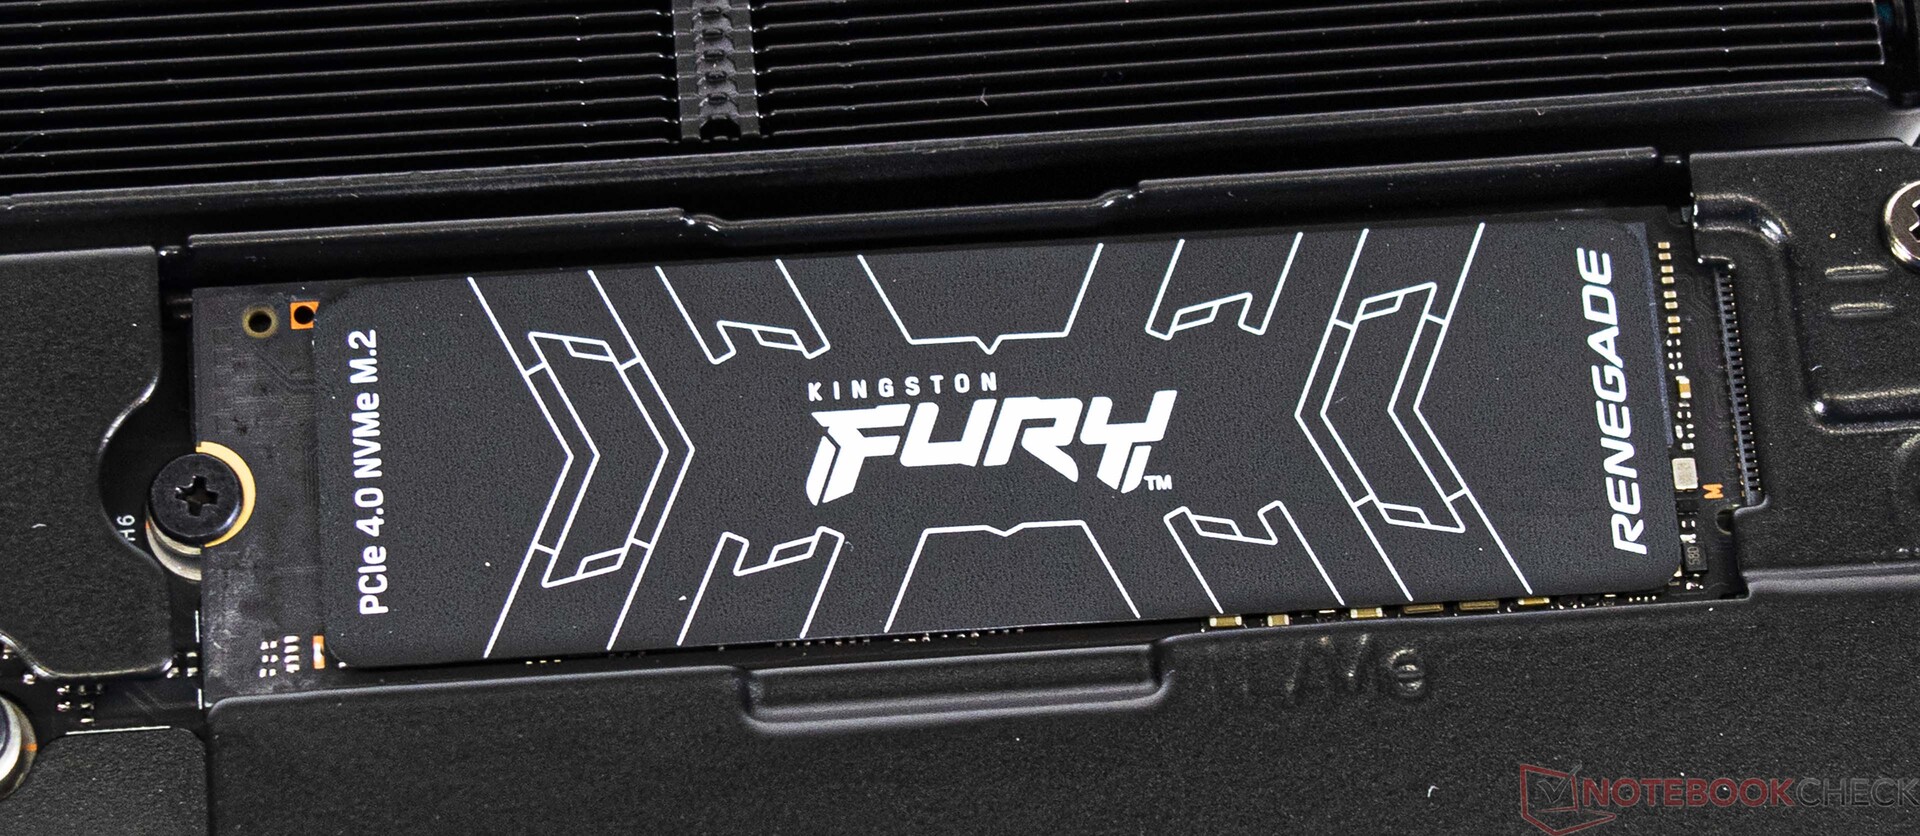
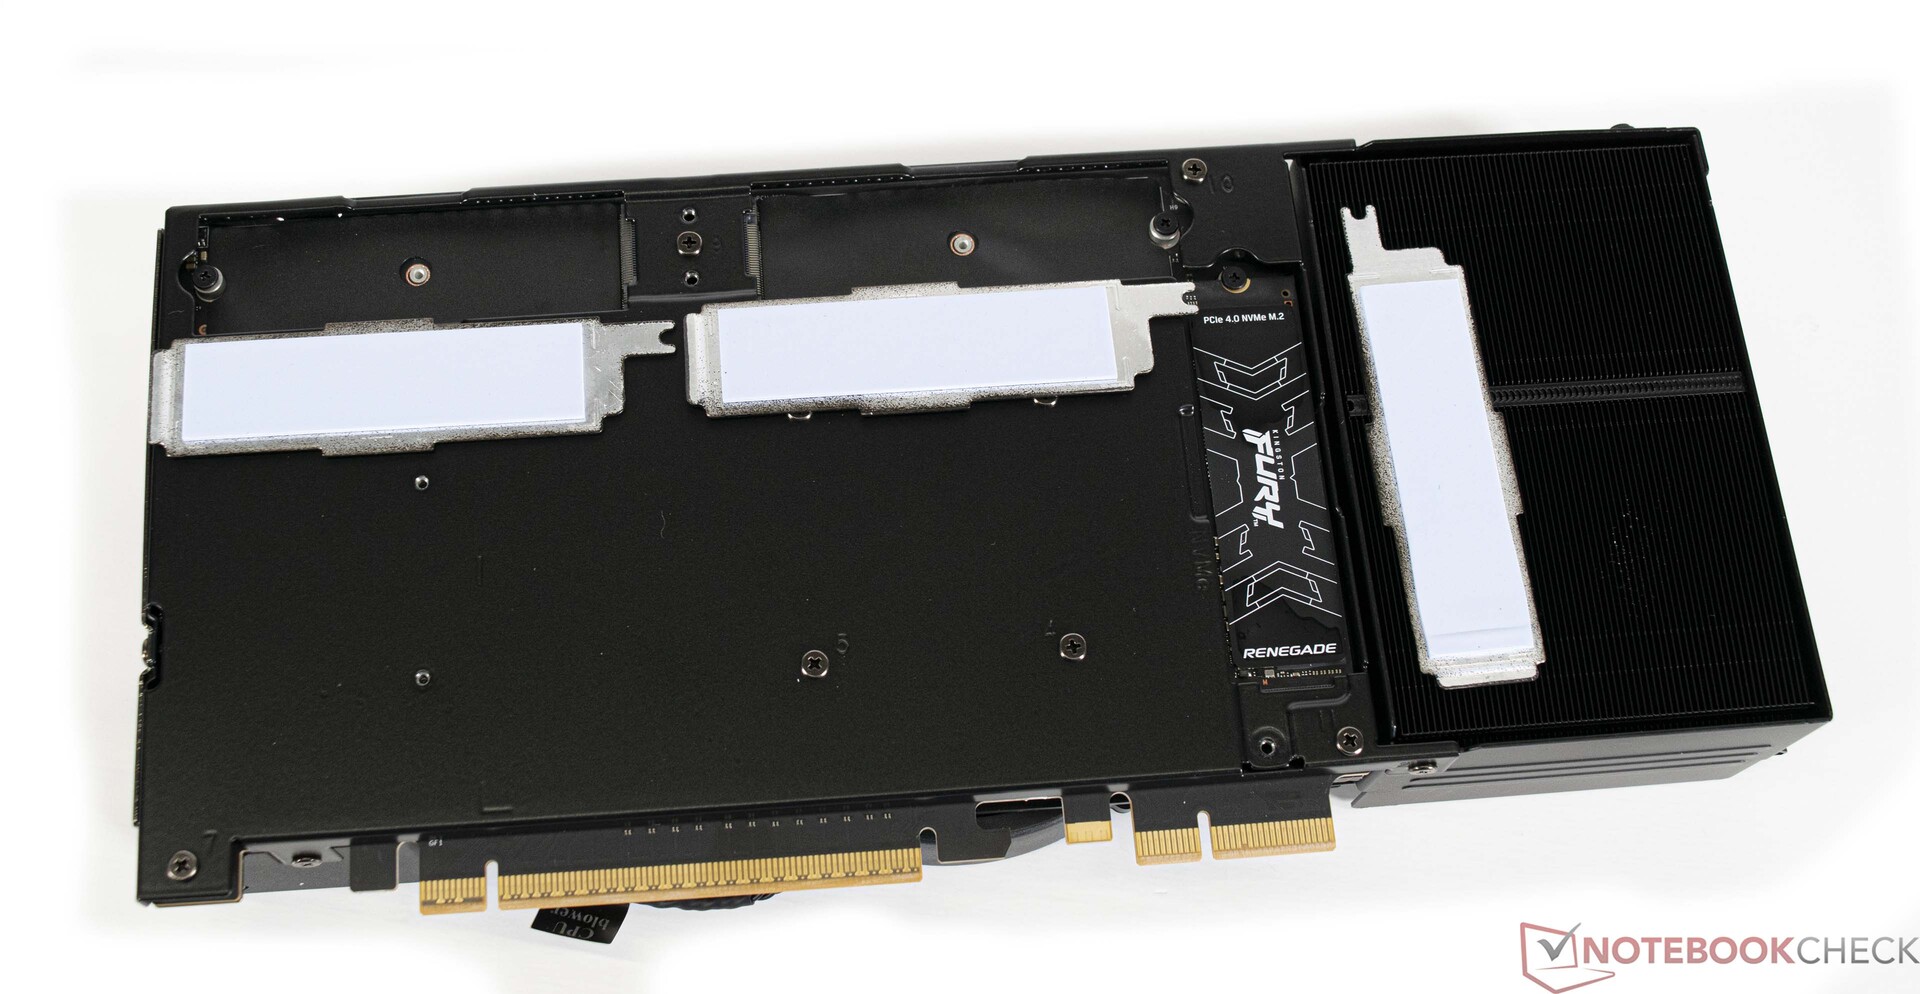
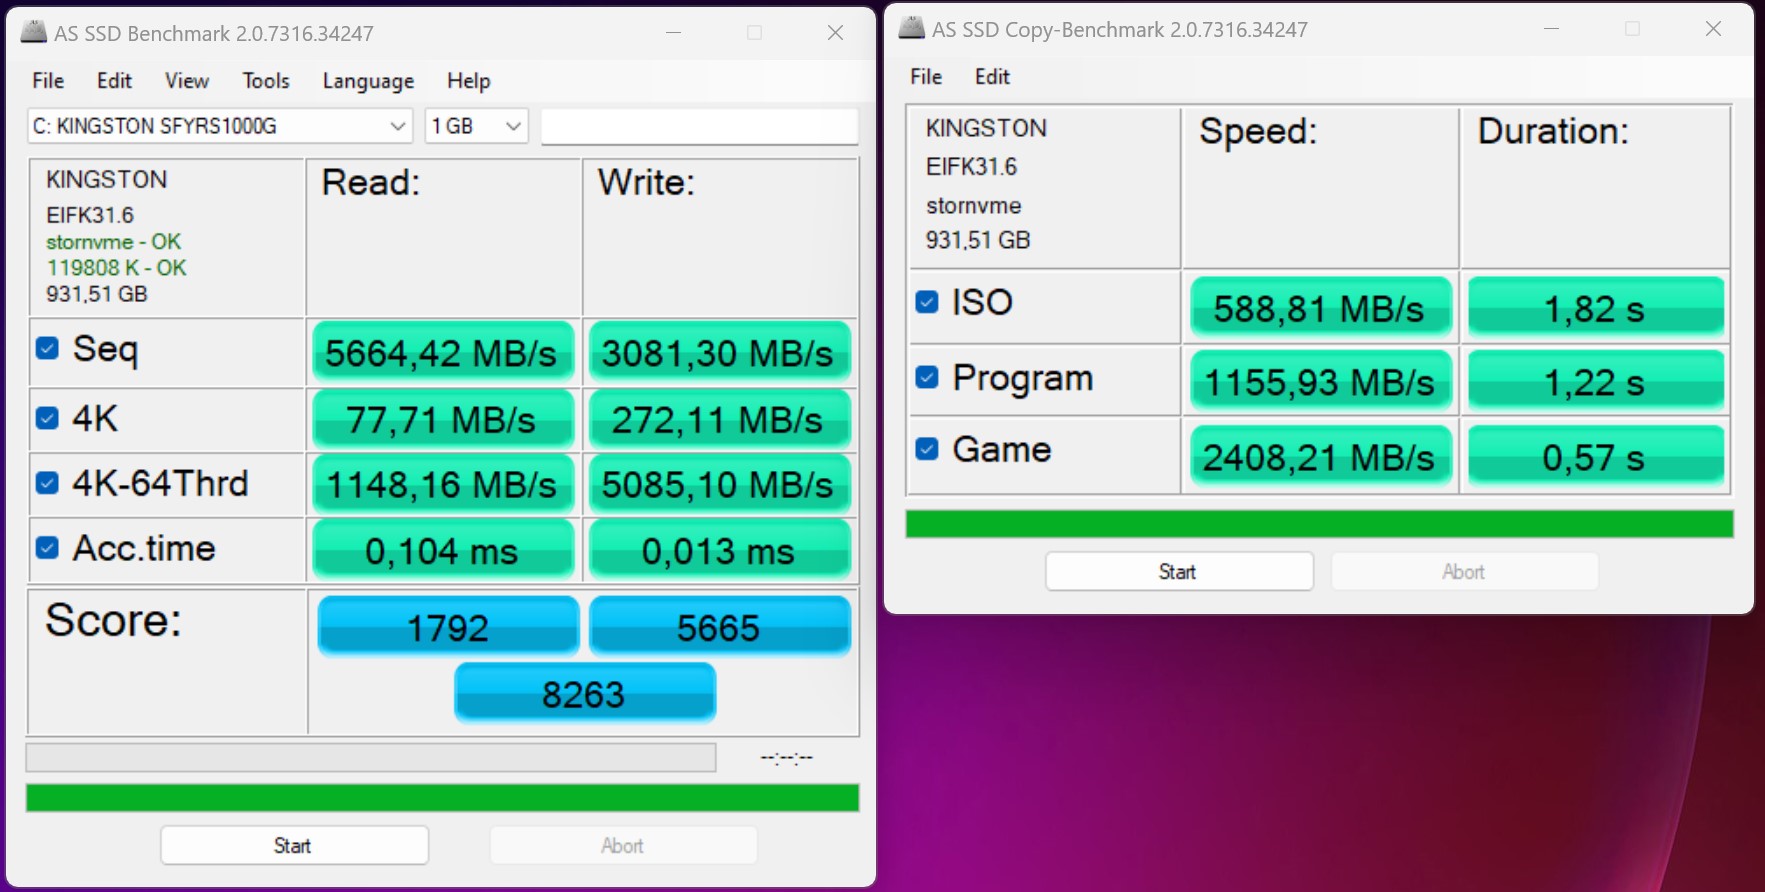
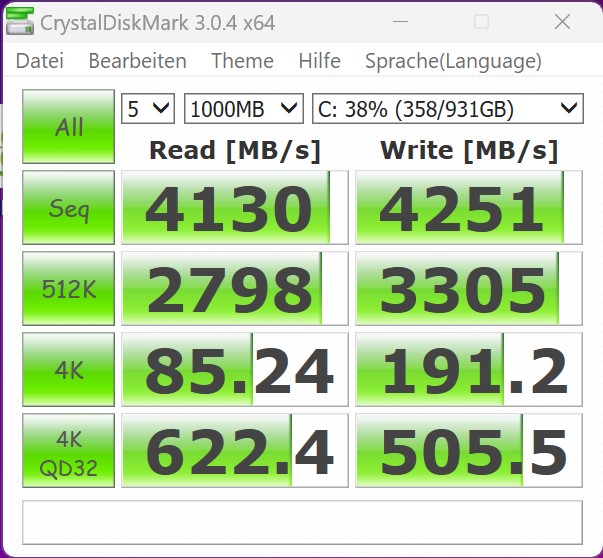
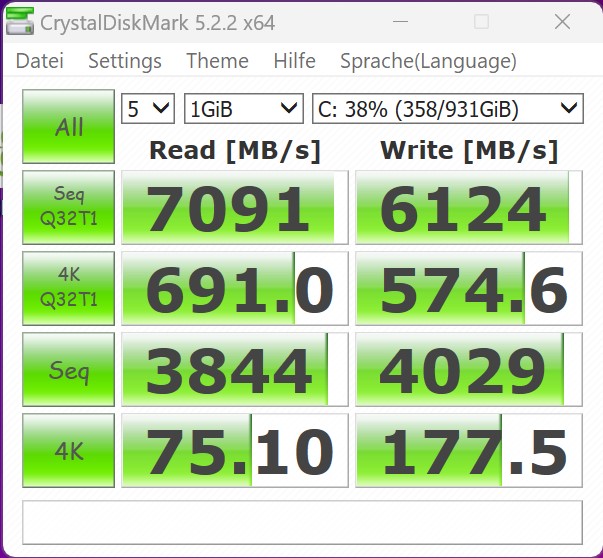
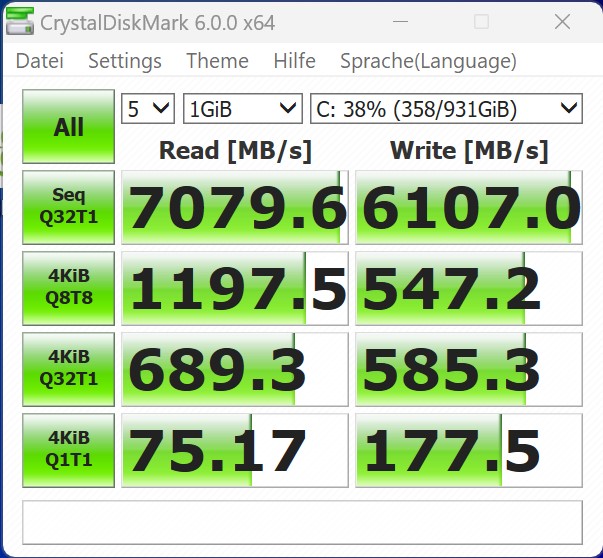
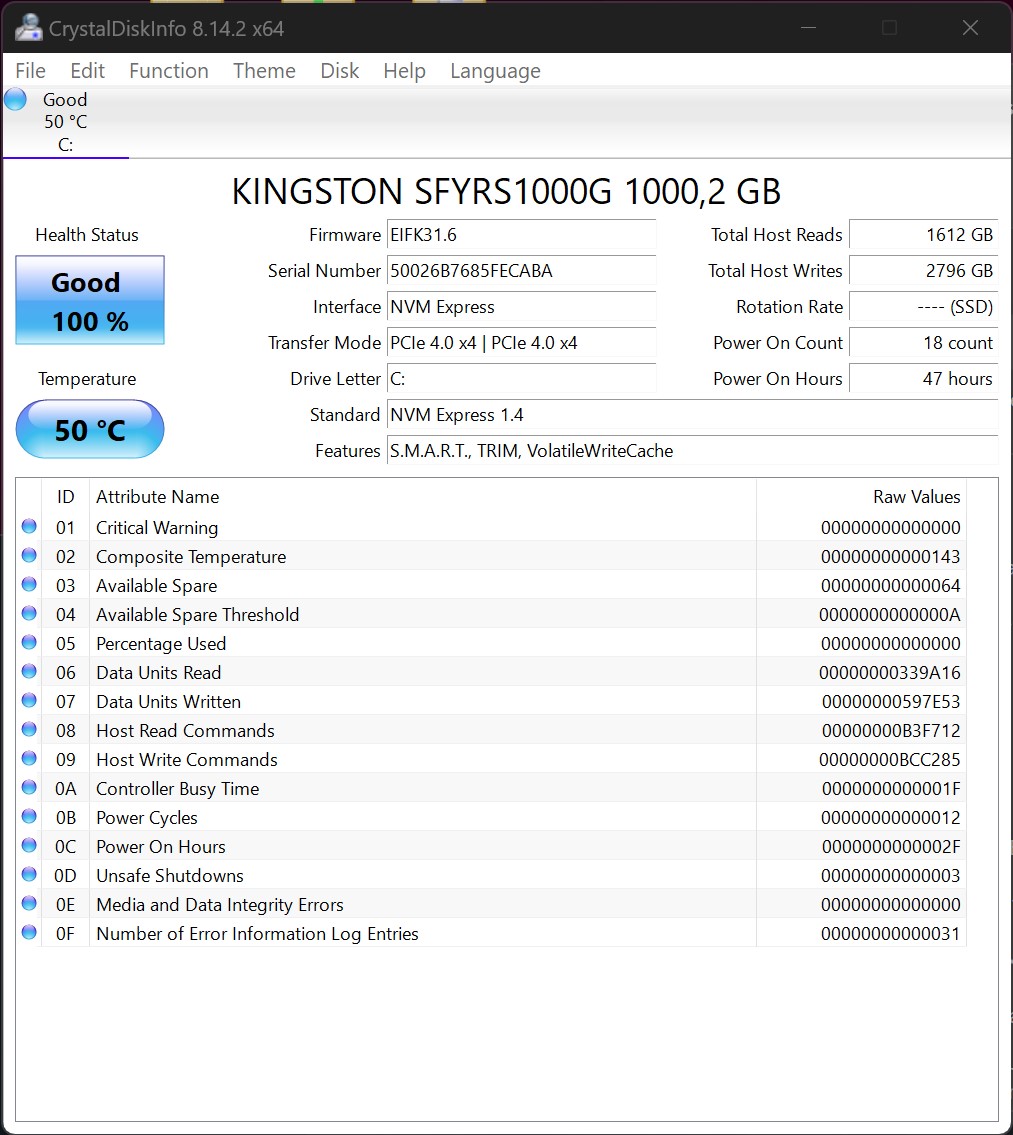
Lagringslösning
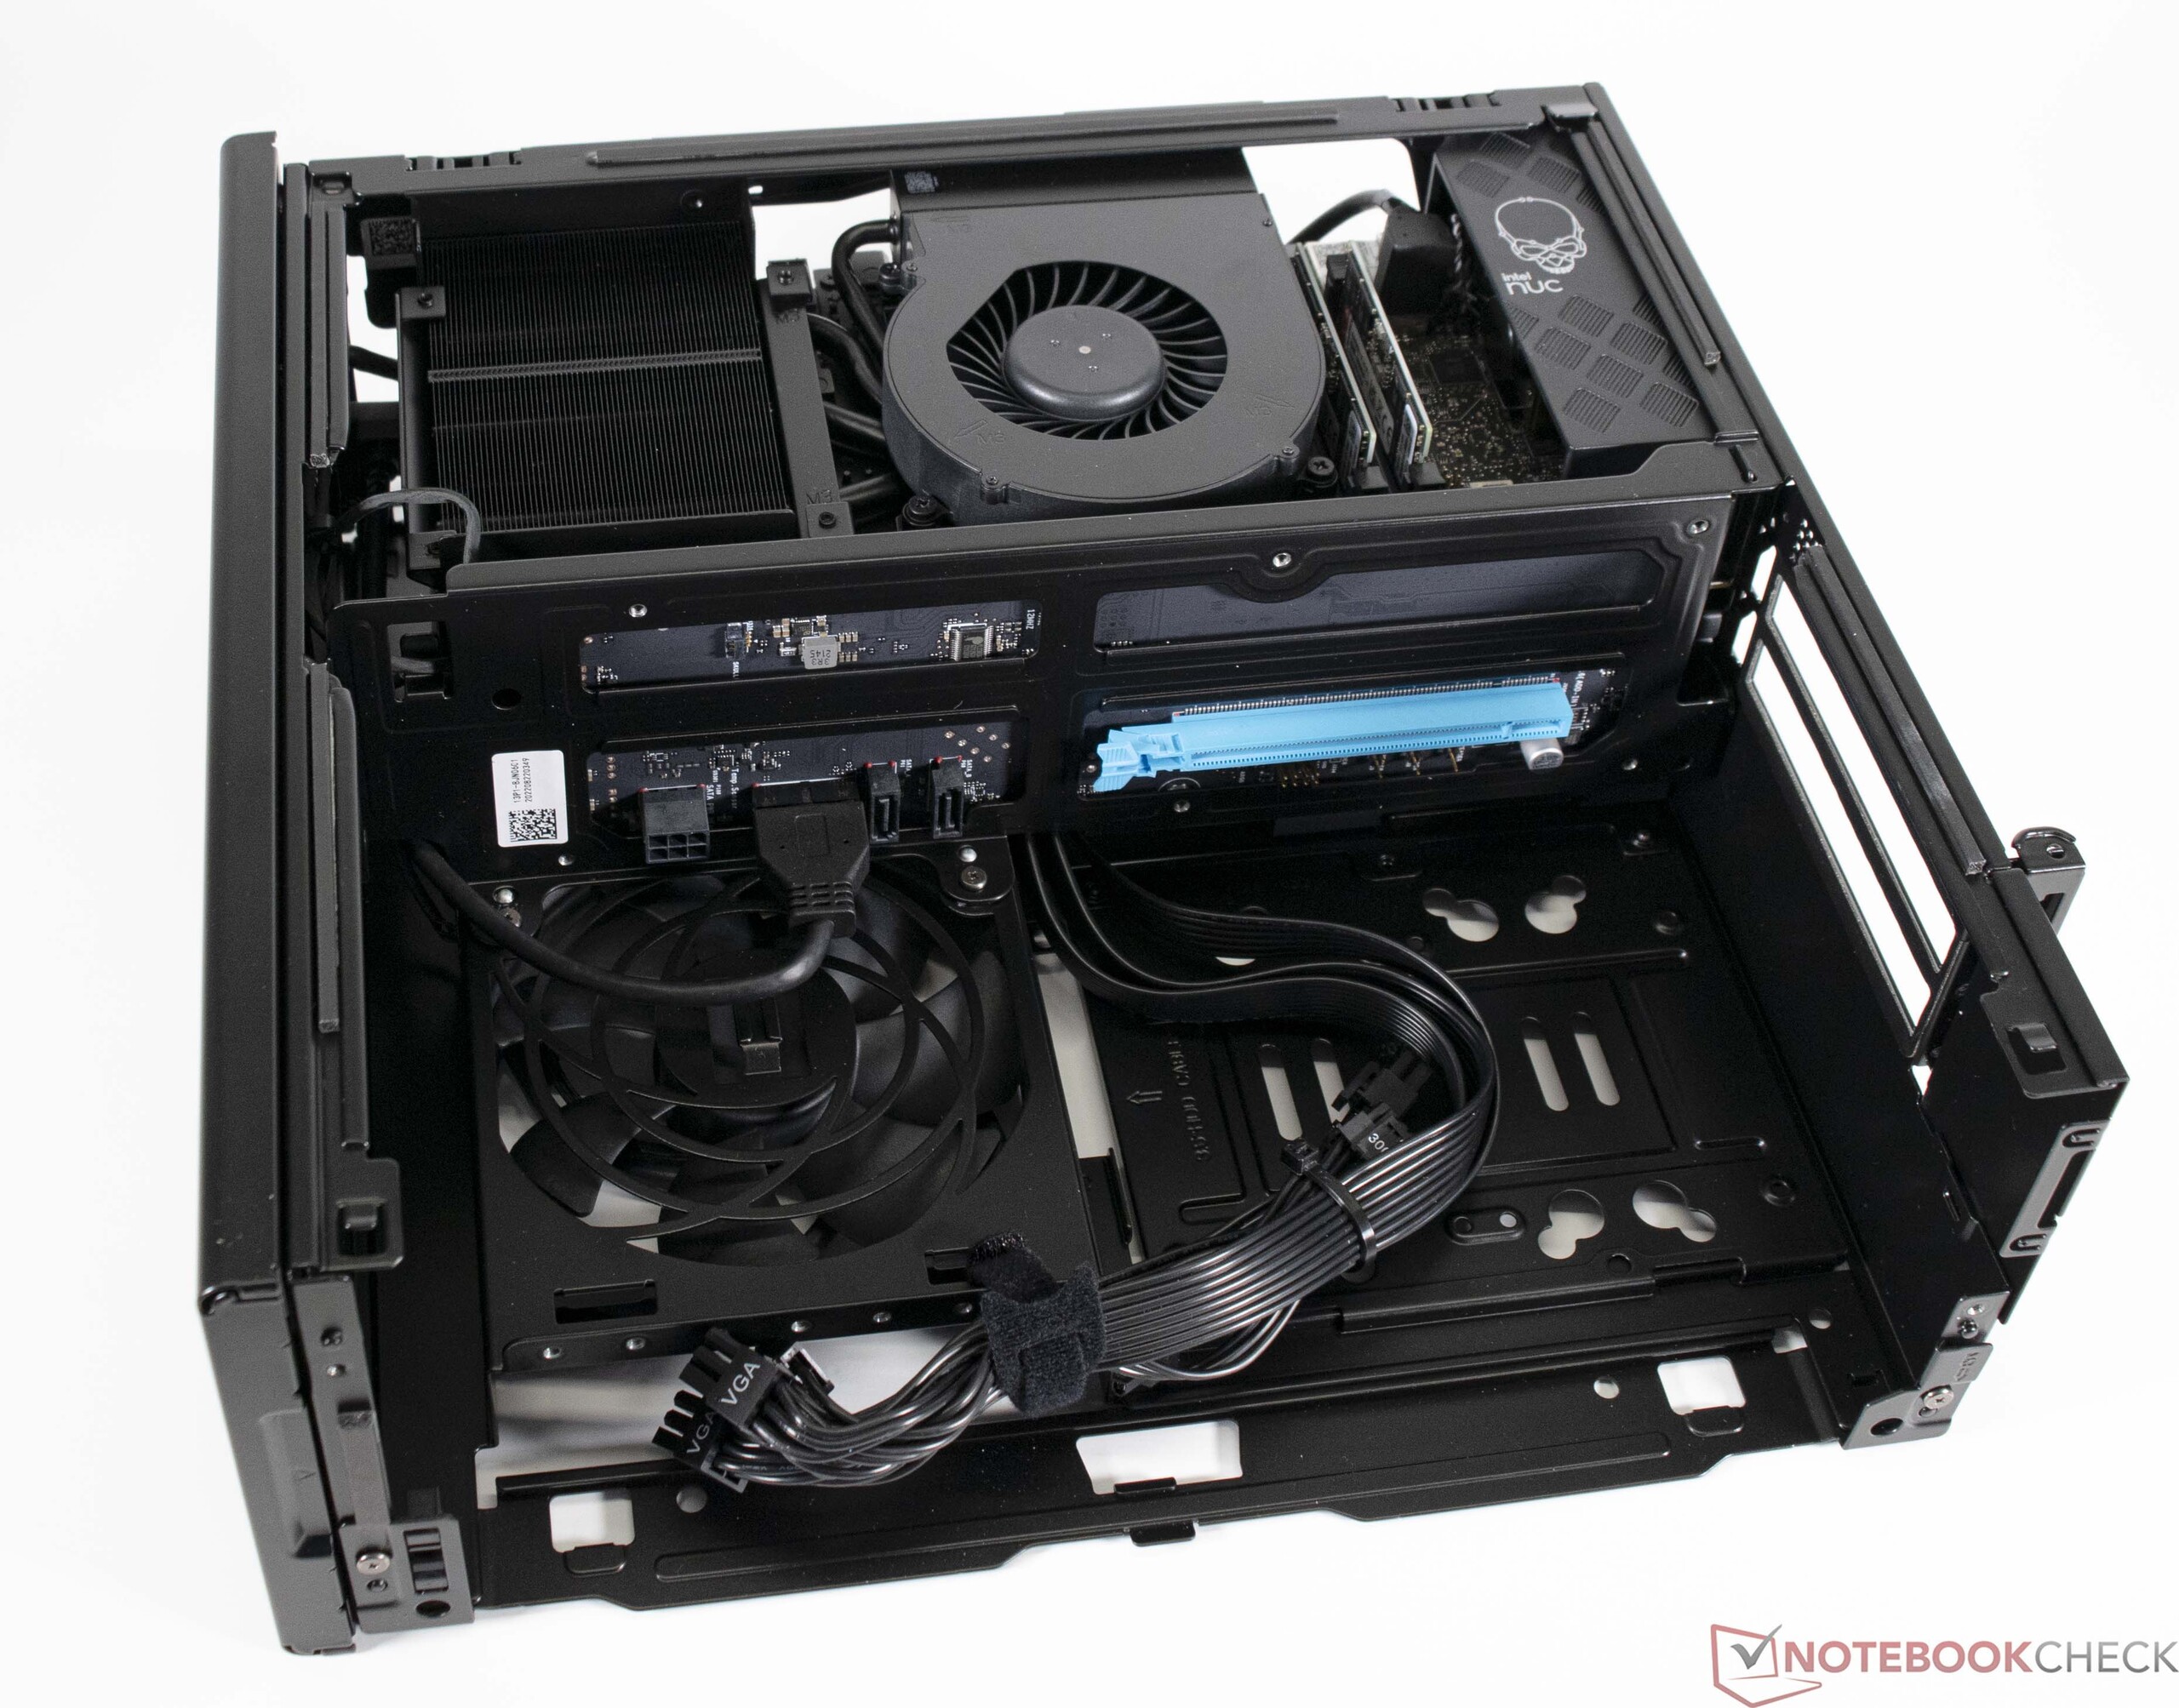
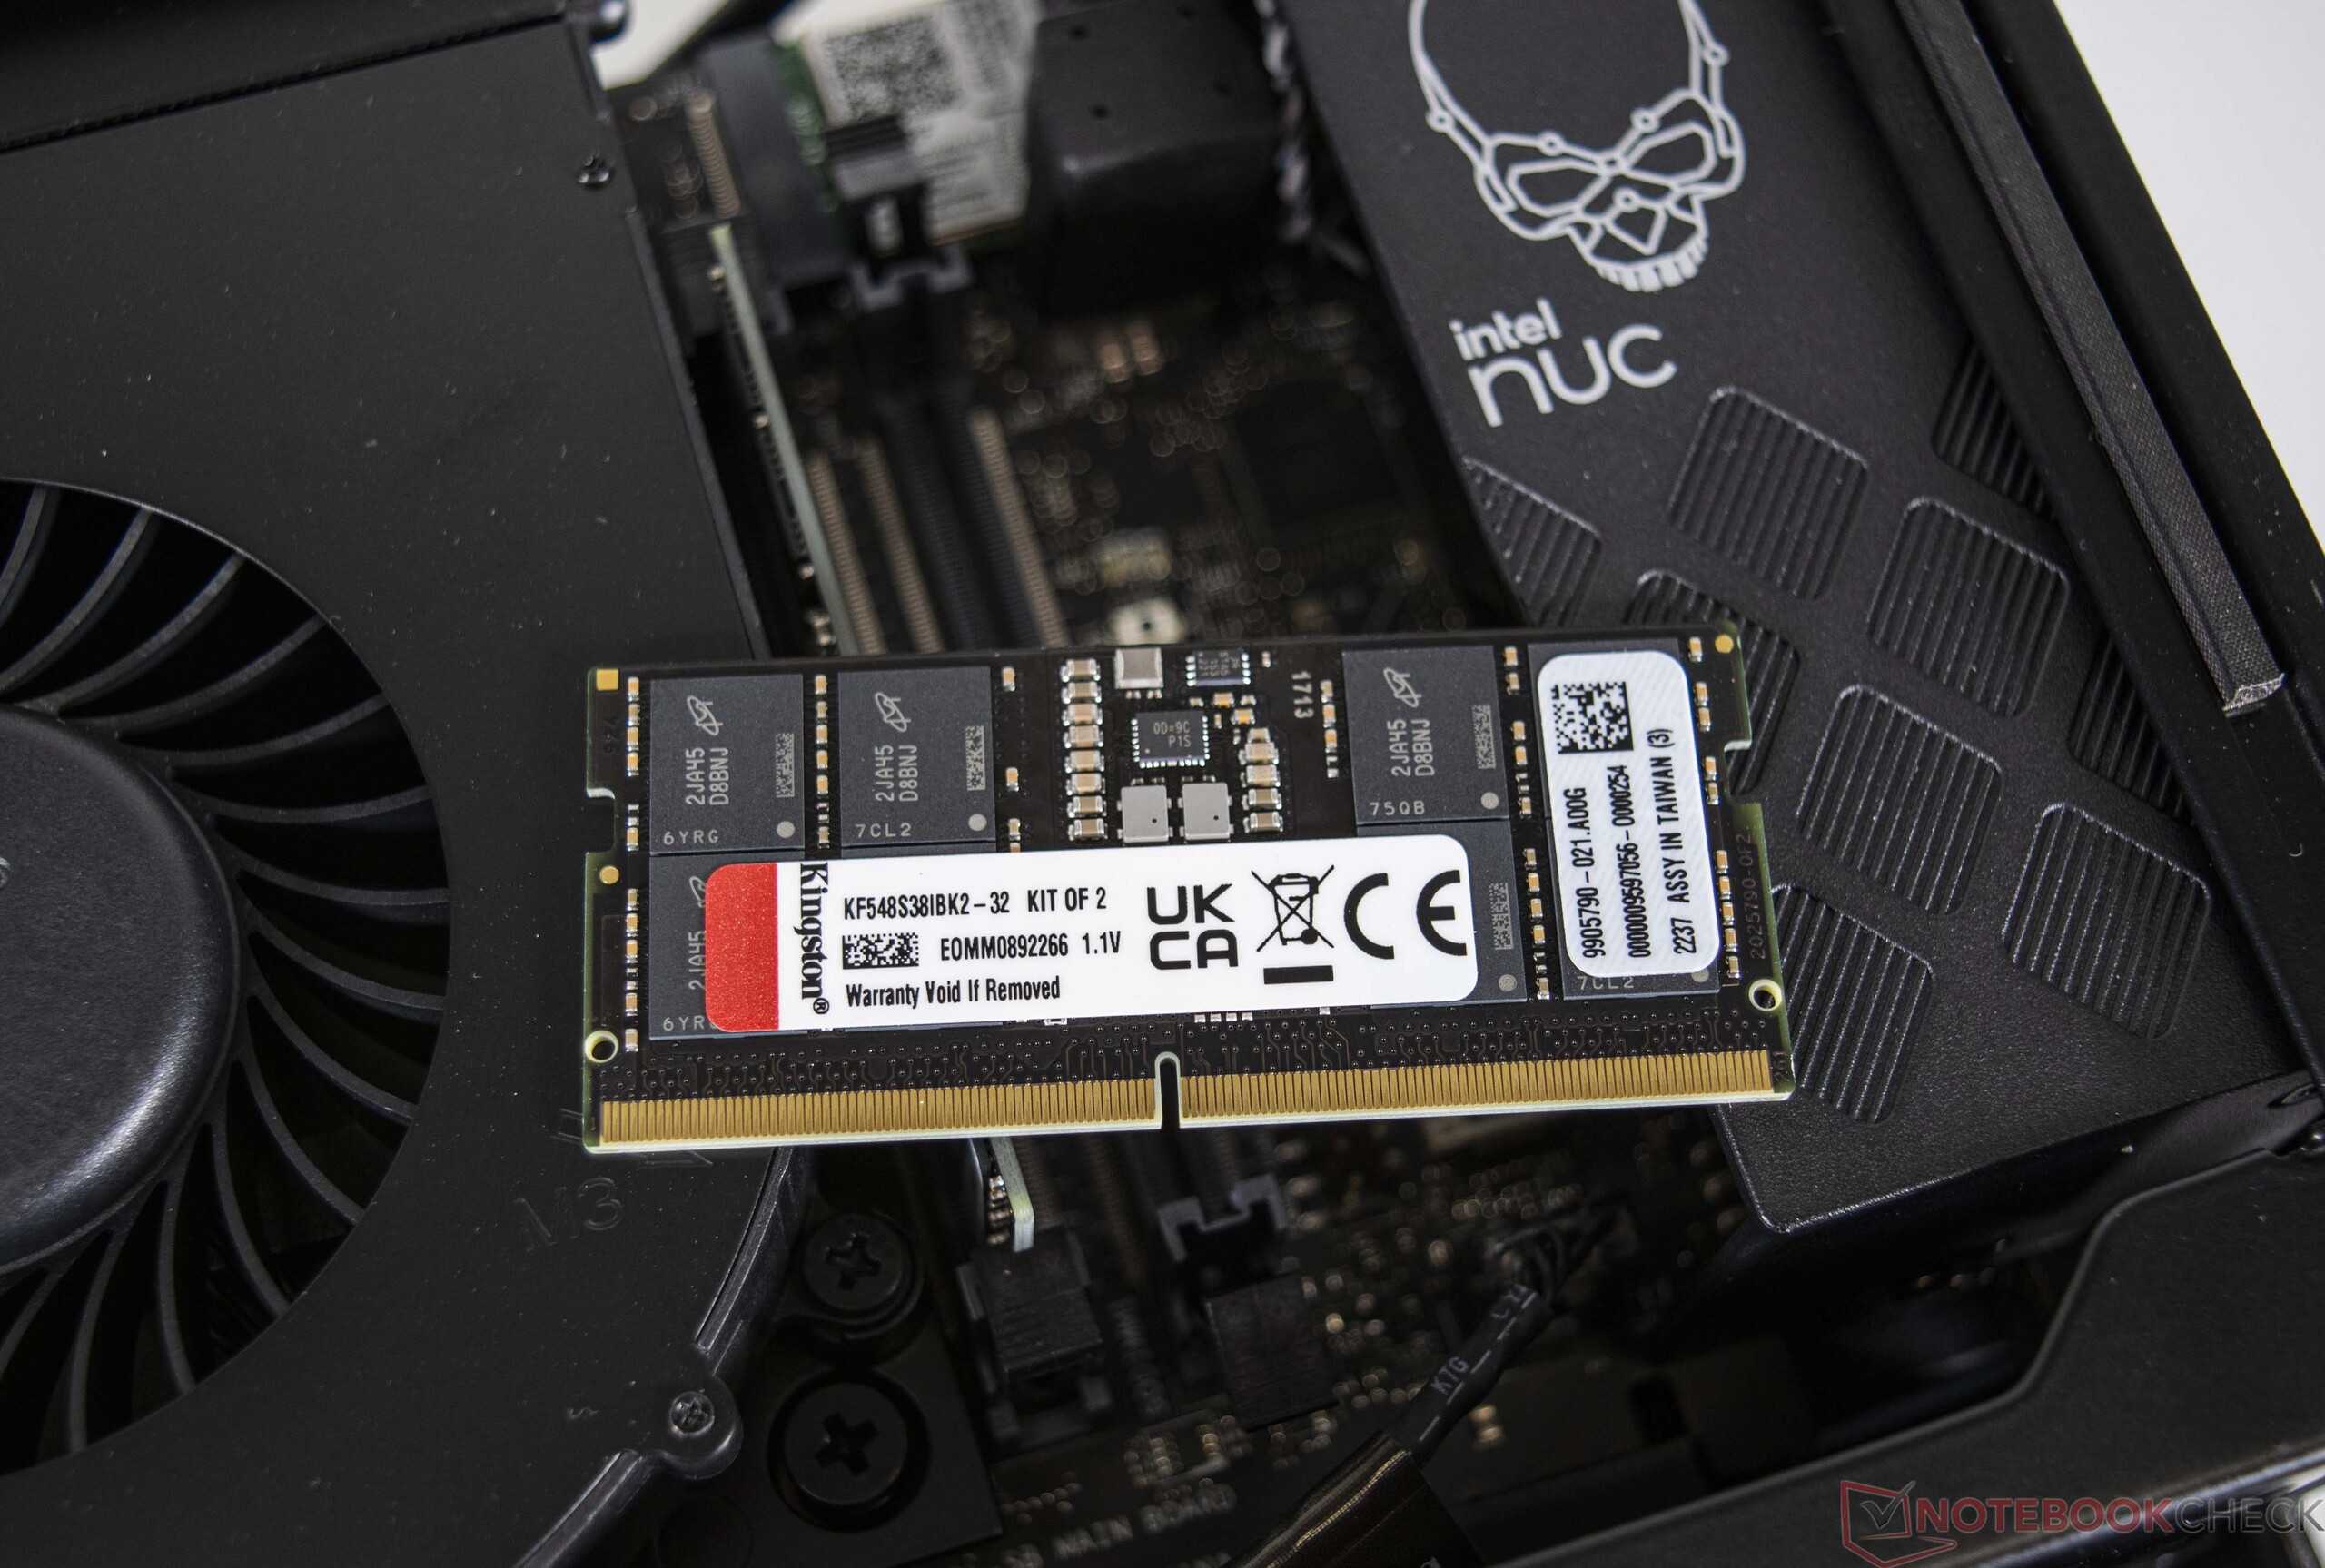
I vårt testprov används en mycket snabb Kingston NVMe SSD-enhet som systemenhet. Modellen presterar mycket bra och uppnår mycket snabba överföringshastigheter i både AS SSD och DiskSpd. Eftersom Intel NUC 13 Extreme Raptor Canyon är ett barebone-system kan användarna välja vilken SSD-enhet de vill installera. Compute Element har stöd för upp till tre M.2 SSD-enheter totalt. Att installera SSD-enheterna är lite krångligt, eftersom Compute Element först måste tas bort helt från NUC 13.
Fler jämförelser och riktmärken hittar du i vår jämförelsetabell.

* ... mindre är bättre
Disk Throttling: DiskSpd Read Loop, Queue Depth 8
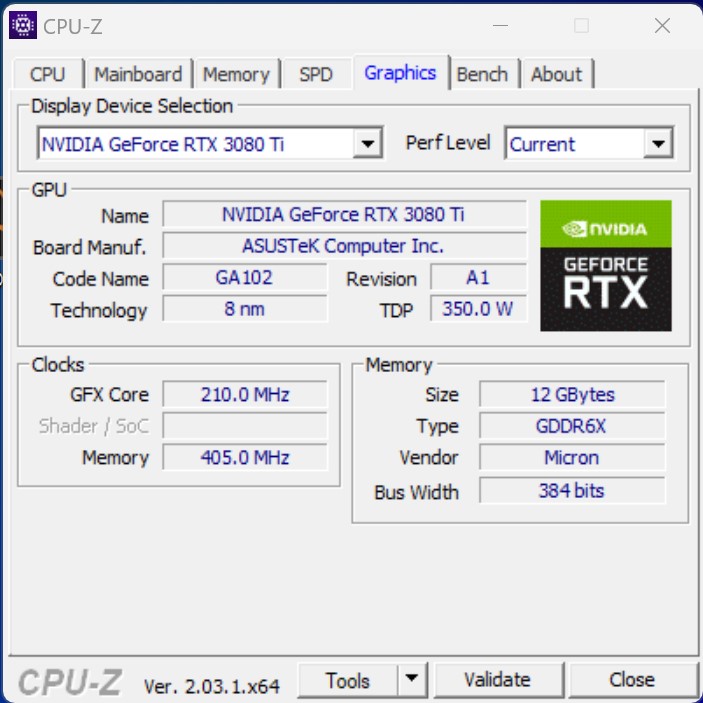
GPU-prestanda
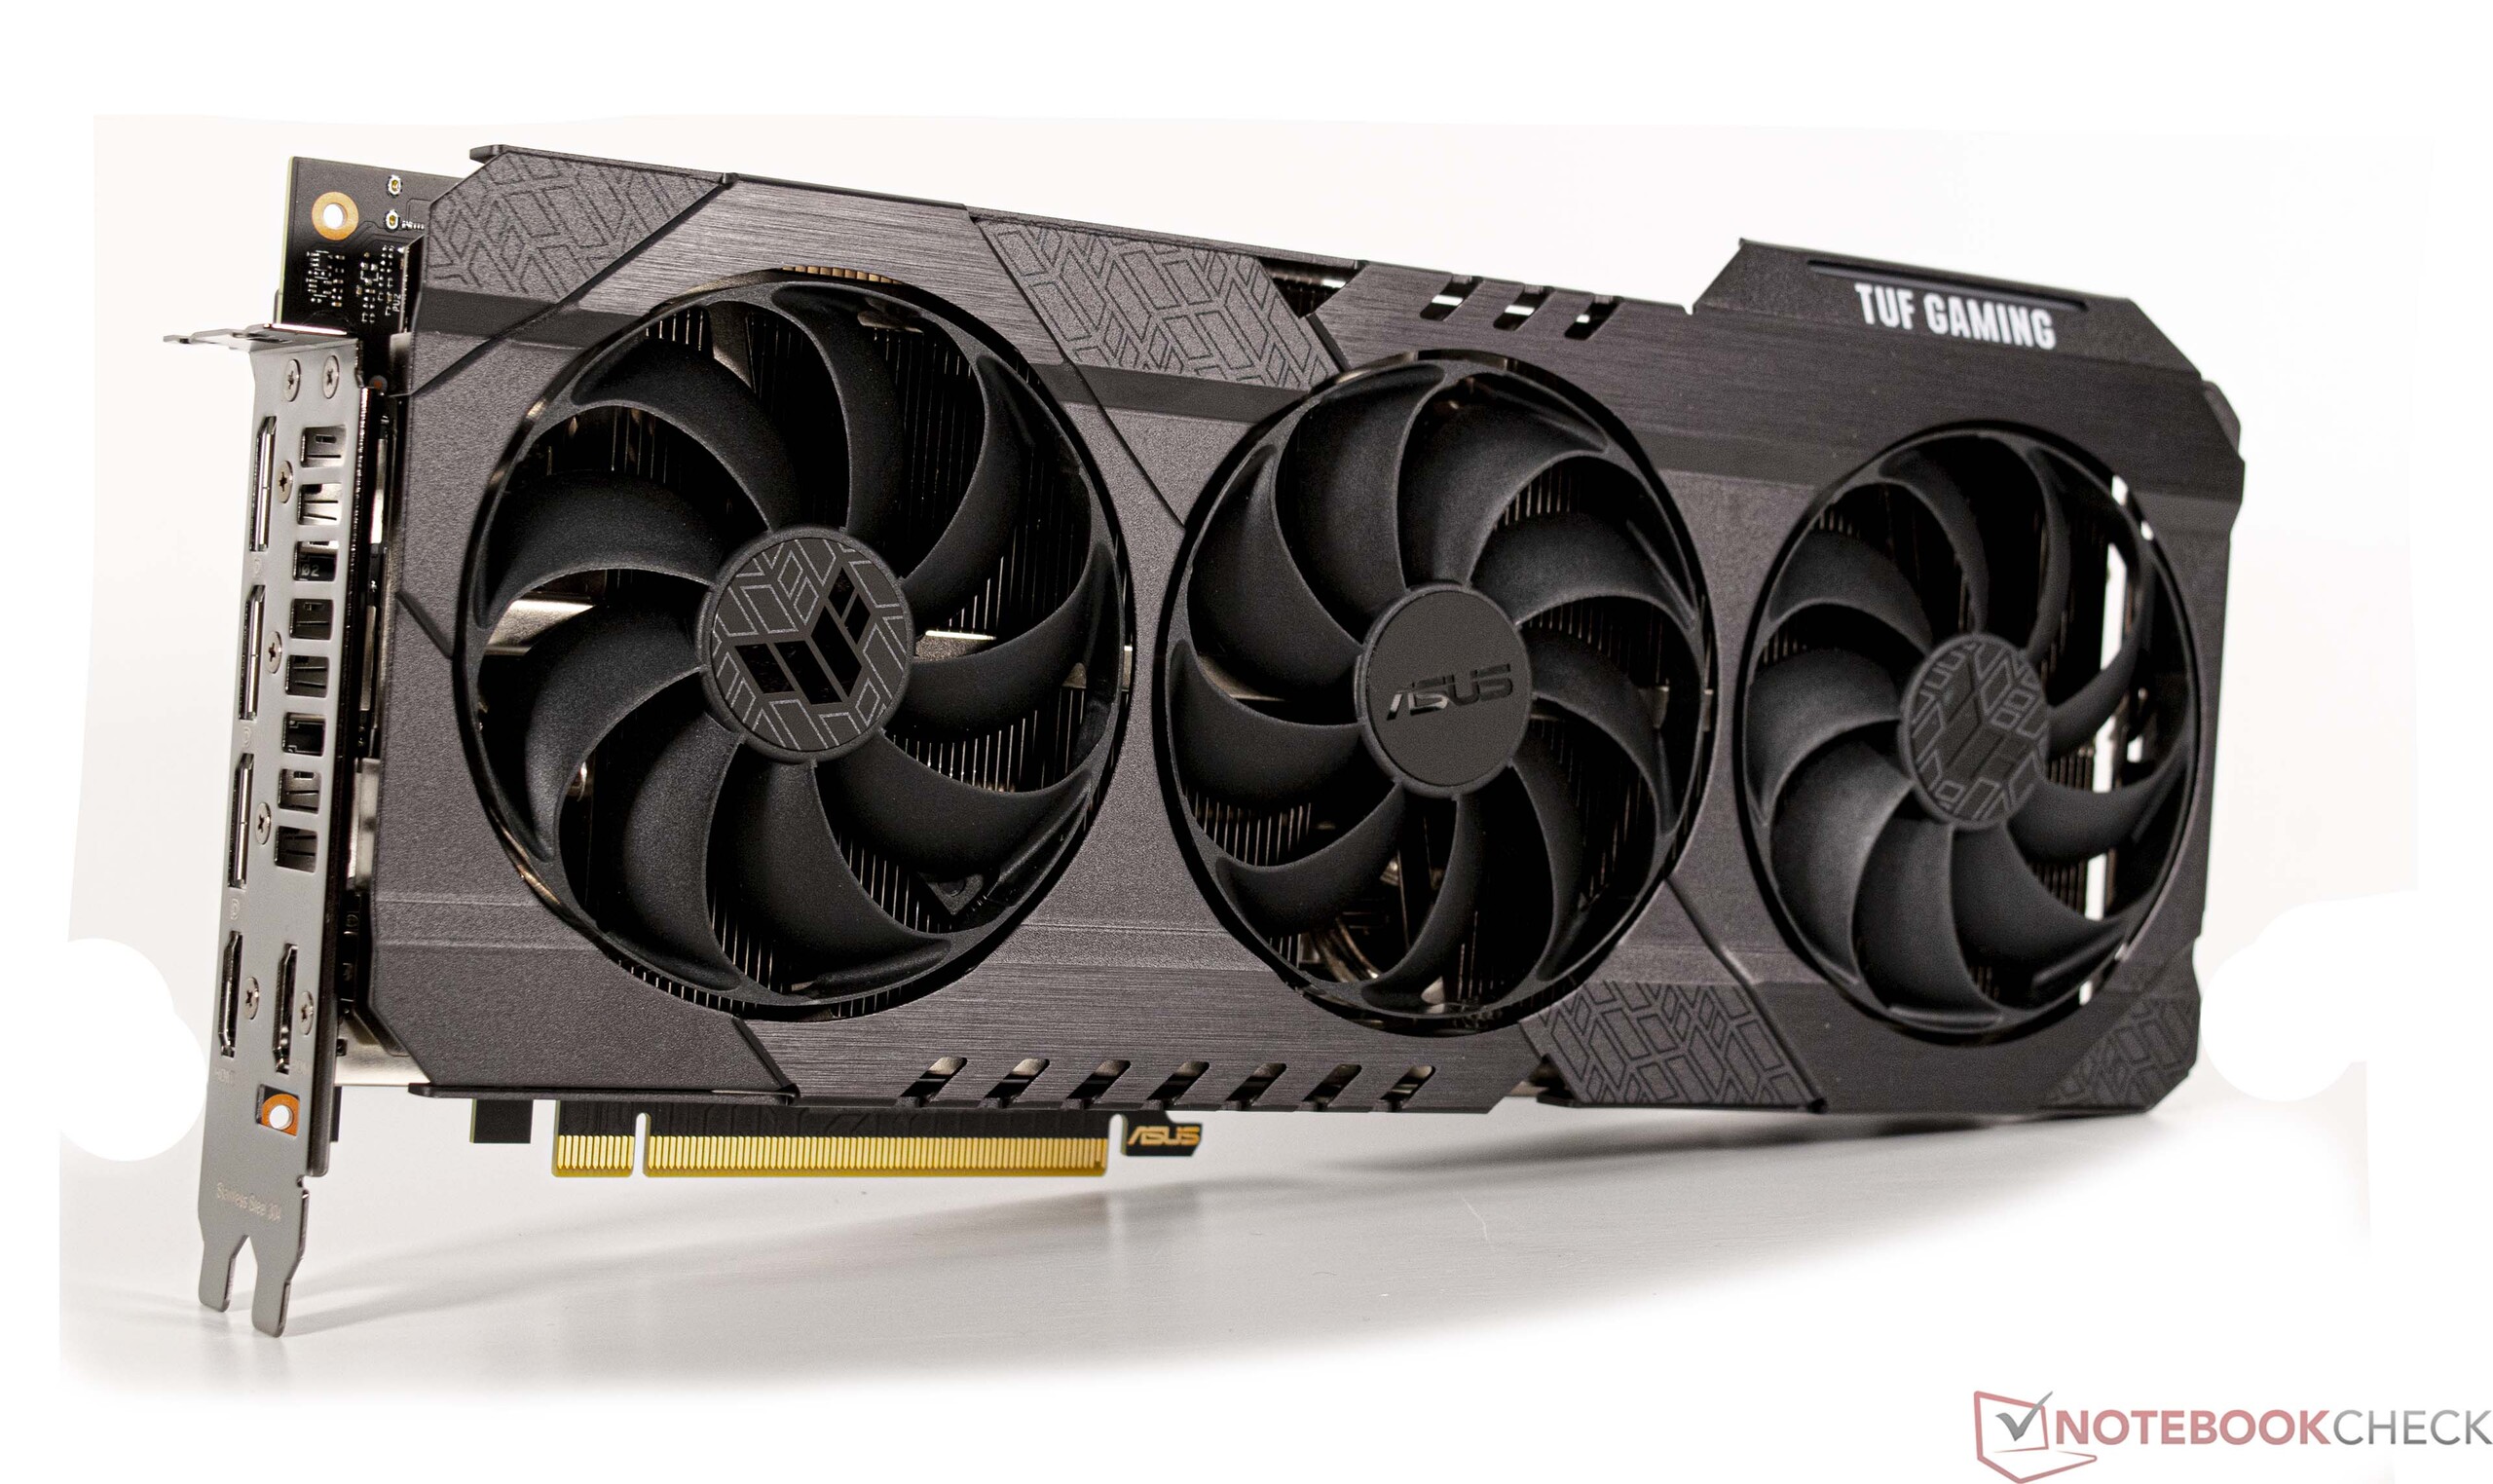
Intel utrustar vårt testprov med en Nvidia GeForce RTX 3080 Ti. GPU:n erbjuder bra prestanda och matchar nästan Nvidia GeForce RTX 3090. Även om den med 12 GB VRAM har hälften så mycket VRAM som RTX 3090, är det ändå tillräckligt i de flesta fall. Med 350 watt kör den installerade modellen på gränsen för vad vi anser vara rimligt och vi rekommenderar inte att använda ännu större GPU:er i det kompakta systemet. Detta gäller endast för strömförbrukningen, eftersom systemet fysiskt stöder även den Nvidia GeForce RTX 4090. Användare som insisterar på ett kort i GeForce-RTX-4000-serien kan vara bättre med ett Nvidia GeForce RTX 4080. Med en TGP på upp till 320 watt är det mer ekonomiskt och betydligt snabbare än vårt GeForce RTX 3080 Ti från Asus.
Fler jämförelser och riktmärken finns på vår GPU-sida.
| 3DMark 05 Standard | 82816 poäng | |
| 3DMark 06 Standard Score | 71555 poäng | |
| 3DMark Vantage P Result | 118753 poäng | |
| 3DMark 11 Performance | 46806 poäng | |
| 3DMark Ice Storm Standard Score | 288716 poäng | |
| 3DMark Cloud Gate Standard Score | 76027 poäng | |
| 3DMark Fire Strike Score | 37178 poäng | |
| 3DMark Fire Strike Extreme Score | 23232 poäng | |
| 3DMark Time Spy Score | 18822 poäng | |
Hjälp | ||
Spelprestanda
Även om Nvidia GeForce RTX 3080 Ti inte längre är ett av de senaste grafikkorten är modellen verkligen inget dåligt val. En kombination av Intel Core i9-13900K och GeForce RTX 3080 Ti är fortfarande mycket vettig, eftersom den kan visa även nyare spel smidigt vid maximala inställningar. Prestandaunderskottet jämfört med den snabbare Nvidia GeForce RTX 3090 är marginell. I ett system baserat påAMD Ryzen 9 7950X, som vi byggde för att jämföra, kan samma Nvidia GeForce RTX 3080 Ti inte uppnå ett större prestandasprång, eftersom processorns prestanda blir mindre viktig när GPU:n är nära full belastning.
När det gäller val av grafikkort rekommenderar vi användare att kontrollera om deras favoritmodell är kompatibel, eftersom den maximala längden som stöds är begränsad. Grafiklösningar får inte överskrida den maximala längden på 31,3 cm (~12,32 tum). När det gäller tjocklek tillåter fodralet upp till tre kortplatser.
| The Witcher 3 | |
| 1920x1080 Ultra Graphics & Postprocessing (HBAO+) | |
| ASUS TUF Gaming GeForce RTX 3080 Ti OC | |
| Corsair One i300 | |
| Intel Core i9-13900K | |
| Intel NUC13 Raptor Canyon | |
| Minisforum NUCX i7 | |
| Intel Dragon Canyon NUC - RTX 3060 | |
| Minisforum Neptune Series HX90G | |
| 3840x2160 High Graphics & Postprocessing (Nvidia HairWorks Off) | |
| Intel NUC13 Raptor Canyon | |
| ASUS TUF Gaming GeForce RTX 3080 Ti OC | |
| Intel Core i9-13900K | |
| Corsair One i300 | |
| Minisforum NUCX i7 | |
| Intel Dragon Canyon NUC - RTX 3060 | |
| Minisforum Neptune Series HX90G | |
| Far Cry 6 | |
| 1920x1080 Ultra Graphics Quality + HD Textures AA:T | |
| ASUS TUF Gaming GeForce RTX 3080 Ti OC | |
| Intel Core i9-13900K | |
| Corsair One i300 | |
| Intel NUC13 Raptor Canyon | |
| Minisforum NUCX i7 | |
| Intel Dragon Canyon NUC - RTX 3060 | |
| Intel Beast Canyon NUC | |
| Minisforum Neptune Series HX90G | |
| 3840x2160 Ultra Graphics Quality + HD Textures AA:T | |
| ASUS TUF Gaming GeForce RTX 3080 Ti OC | |
| Intel NUC13 Raptor Canyon | |
| Intel Core i9-13900K | |
| Corsair One i300 | |
| Intel Dragon Canyon NUC - RTX 3060 | |
| Intel Beast Canyon NUC | |
| Minisforum Neptune Series HX90G | |
| F1 2021 | |
| 1920x1080 Ultra High Preset + Raytracing AA:T AF:16x | |
| ASUS TUF Gaming GeForce RTX 3080 Ti OC | |
| Intel NUC13 Raptor Canyon | |
| Intel Core i9-13900K | |
| Corsair One i300 | |
| Minisforum NUCX i7 | |
| Intel Beast Canyon NUC | |
| Intel Dragon Canyon NUC - RTX 3060 | |
| Minisforum Neptune Series HX90G | |
| 3840x2160 Ultra High Preset + Raytracing AA:T AF:16x | |
| ASUS TUF Gaming GeForce RTX 3080 Ti OC | |
| Intel Core i9-13900K | |
| Intel NUC13 Raptor Canyon | |
| Corsair One i300 | |
| Minisforum NUCX i7 | |
| Intel Beast Canyon NUC | |
| Intel Dragon Canyon NUC - RTX 3060 | |
| Minisforum Neptune Series HX90G | |
| låg | med. | hög | ultra | QHD | 4K | |
|---|---|---|---|---|---|---|
| GTA V (2015) | 187.6 | 187.4 | 187 | 161.5 | 152.8 | 182 |
| The Witcher 3 (2015) | 702 | 564 | 374 | 179.1 | 156.8 | |
| Dota 2 Reborn (2015) | 278.9 | 242.4 | 234.1 | 216.6 | 211.1 | |
| Final Fantasy XV Benchmark (2018) | 234 | 229 | 180.6 | 141 | 84.2 | |
| X-Plane 11.11 (2018) | 232 | 202 | 148.8 | 127.3 | ||
| Far Cry 5 (2018) | 239 | 208 | 198 | 186 | 176 | 109 |
| Strange Brigade (2018) | 613 | 489 | 407 | 359 | 269 | 161 |
| Far Cry New Dawn (2019) | 200 | 174 | 167 | 150 | 144 | 109 |
| Metro Exodus (2019) | 241 | 200 | 165.8 | 134 | 115 | 76.5 |
| Borderlands 3 (2019) | 229 | 195.3 | 179.7 | 160 | 128.7 | 74 |
| F1 2020 (2020) | 520 | 448 | 419 | 310 | 240 | 145.2 |
| F1 2021 (2021) | 615 | 525 | 428 | 225 | 174.3 | 103.2 |
| Far Cry 6 (2021) | 211 | 180.4 | 160.6 | 120.7 | 136 | 86 |
| Forza Horizon 5 (2021) | 256 | 191 | 182 | 129 | 117 | 87 |
| God of War (2022) | 229 | 200 | 166.6 | 119.6 | 105.8 | 77.5 |
| Tiny Tina's Wonderlands (2022) | 355 | 291 | 211 | 168.5 | 123.1 | 70 |
| F1 22 (2022) | 367 | 342 | 321 | 128.8 | 85.6 | 43 |
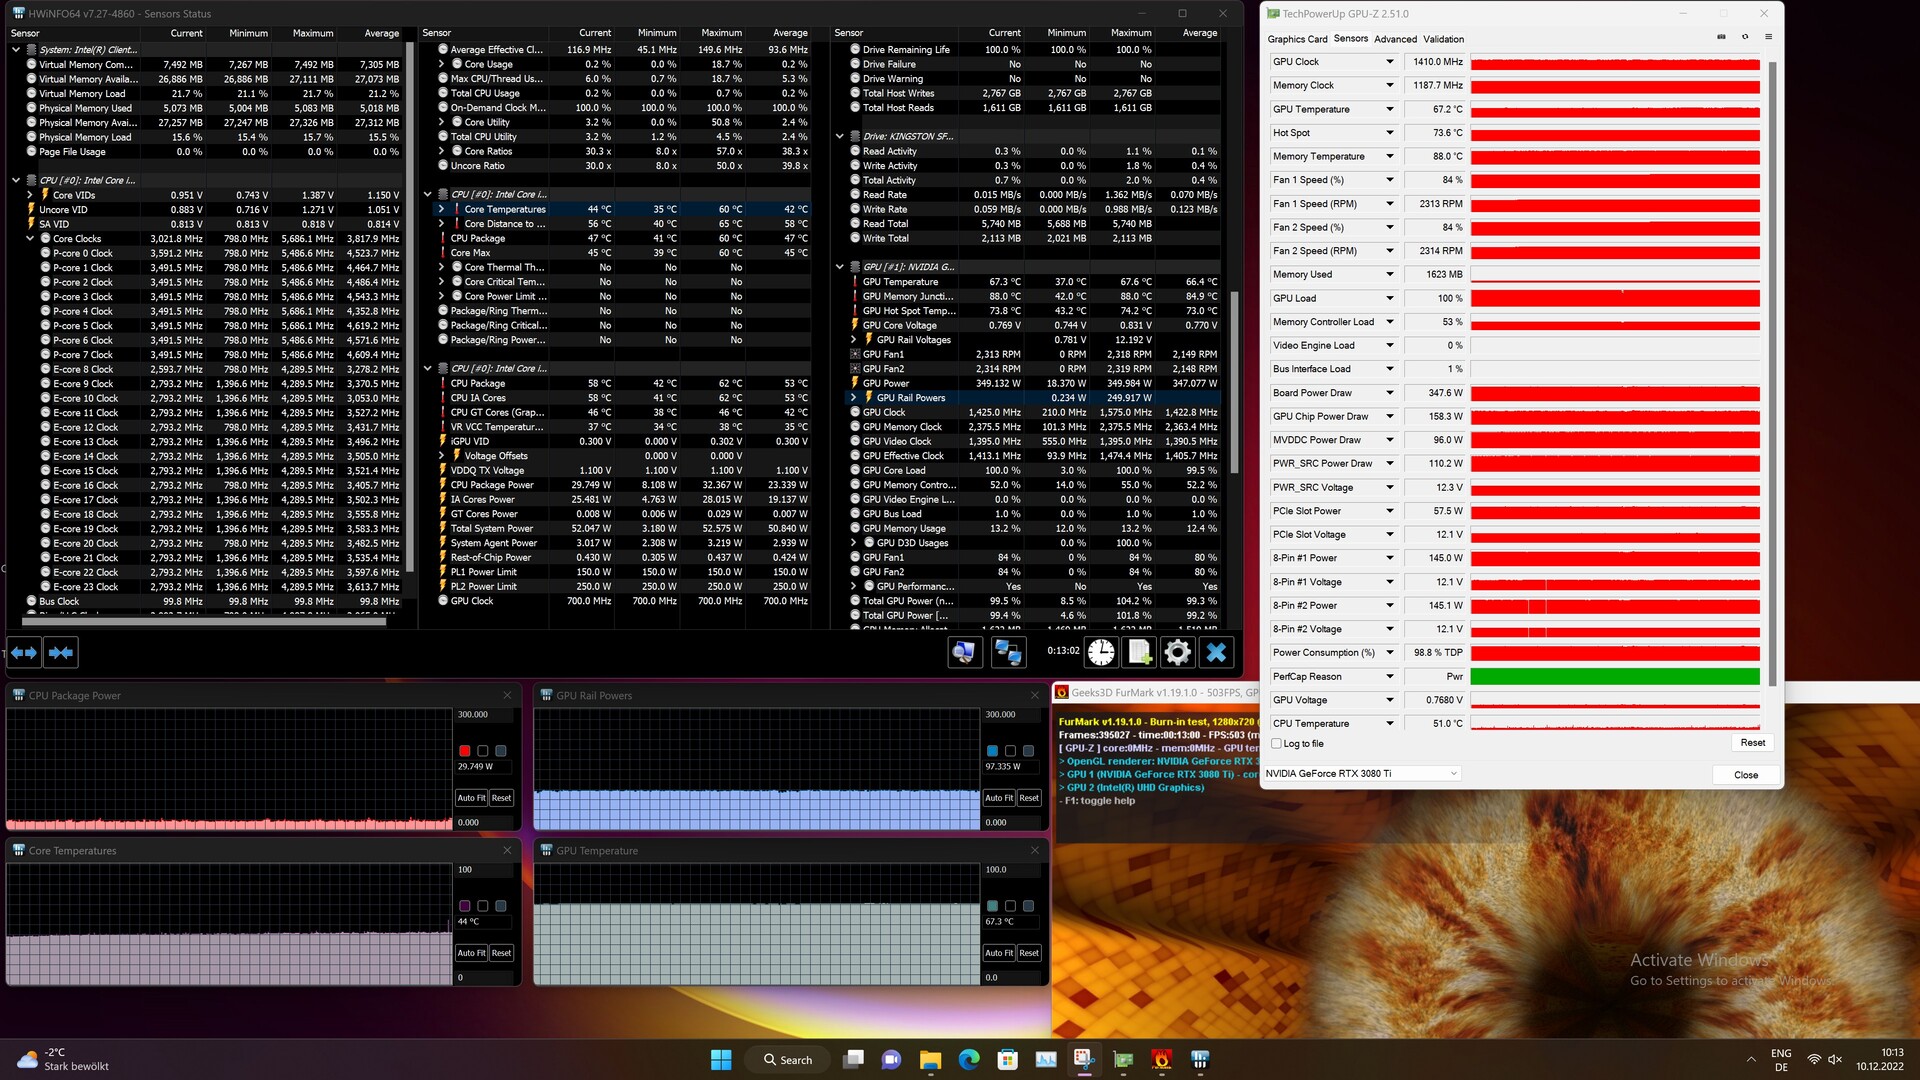
Utsläpp
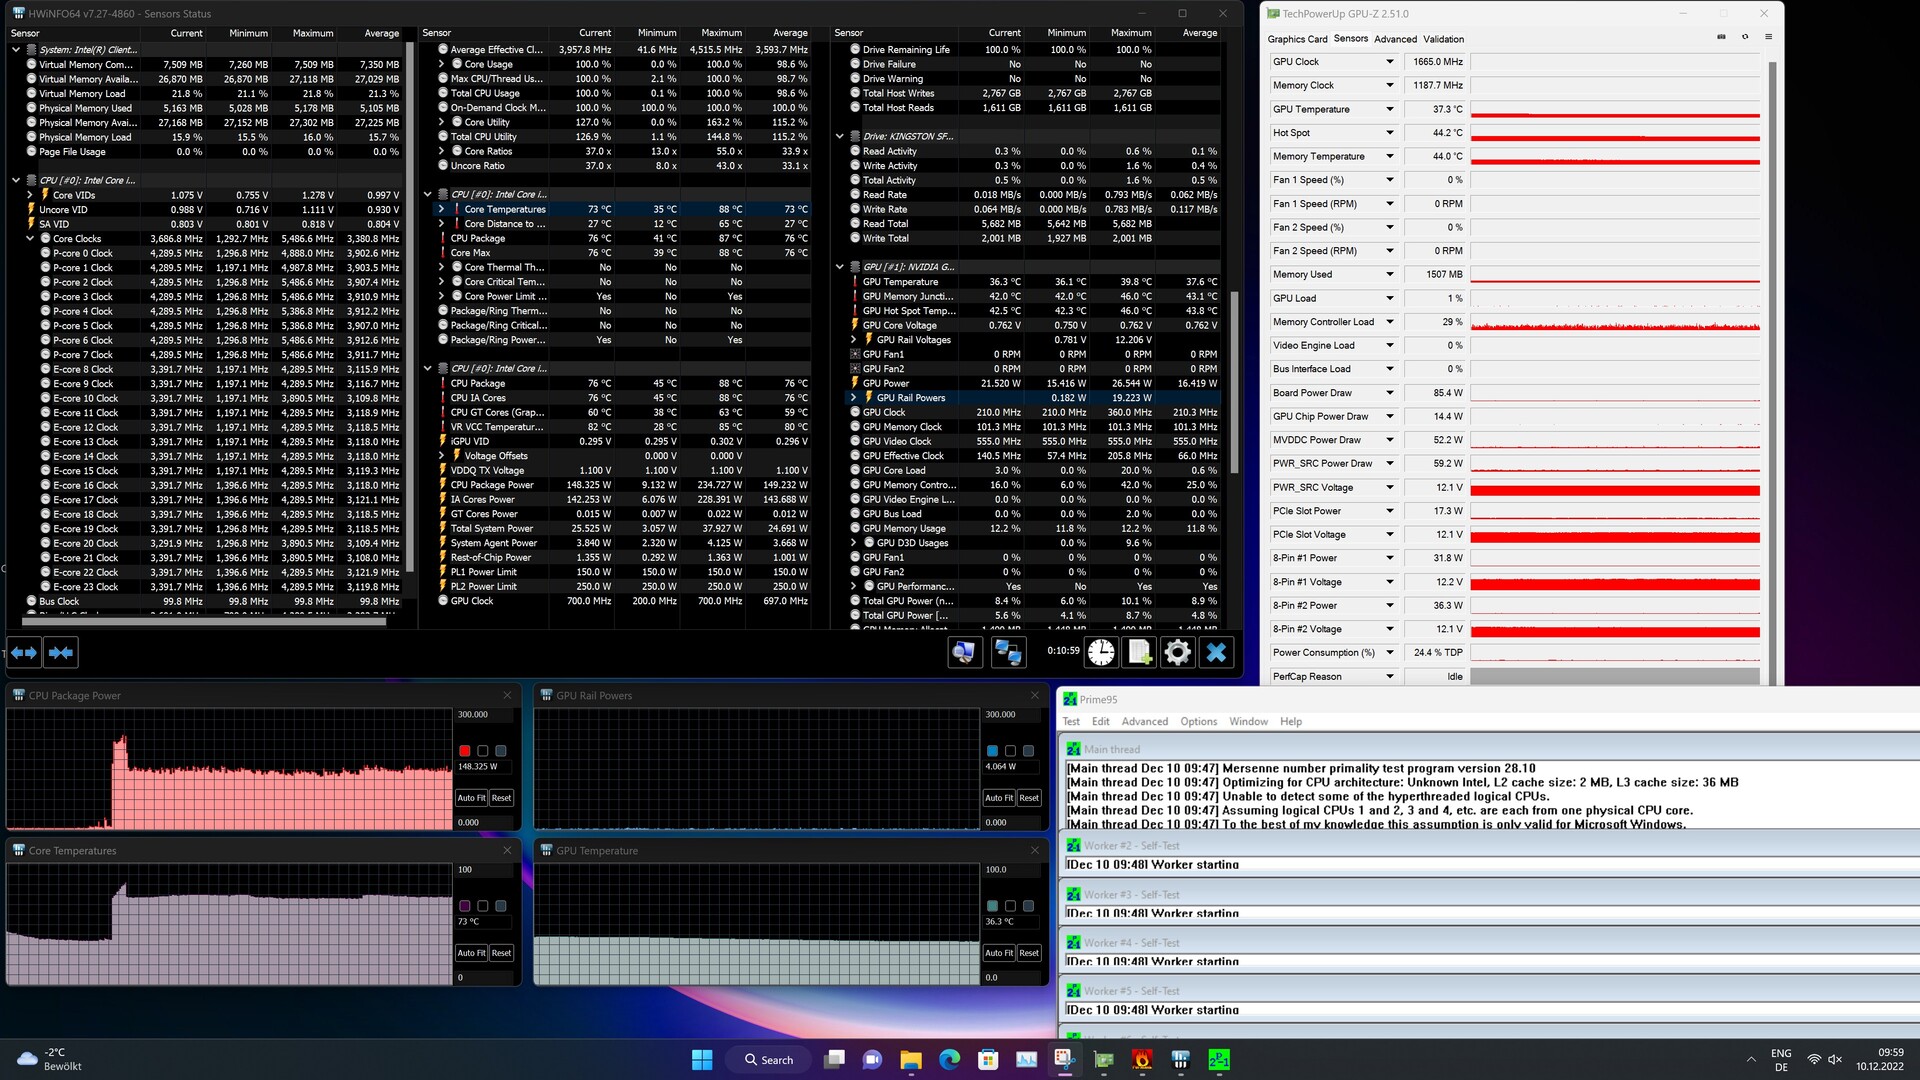
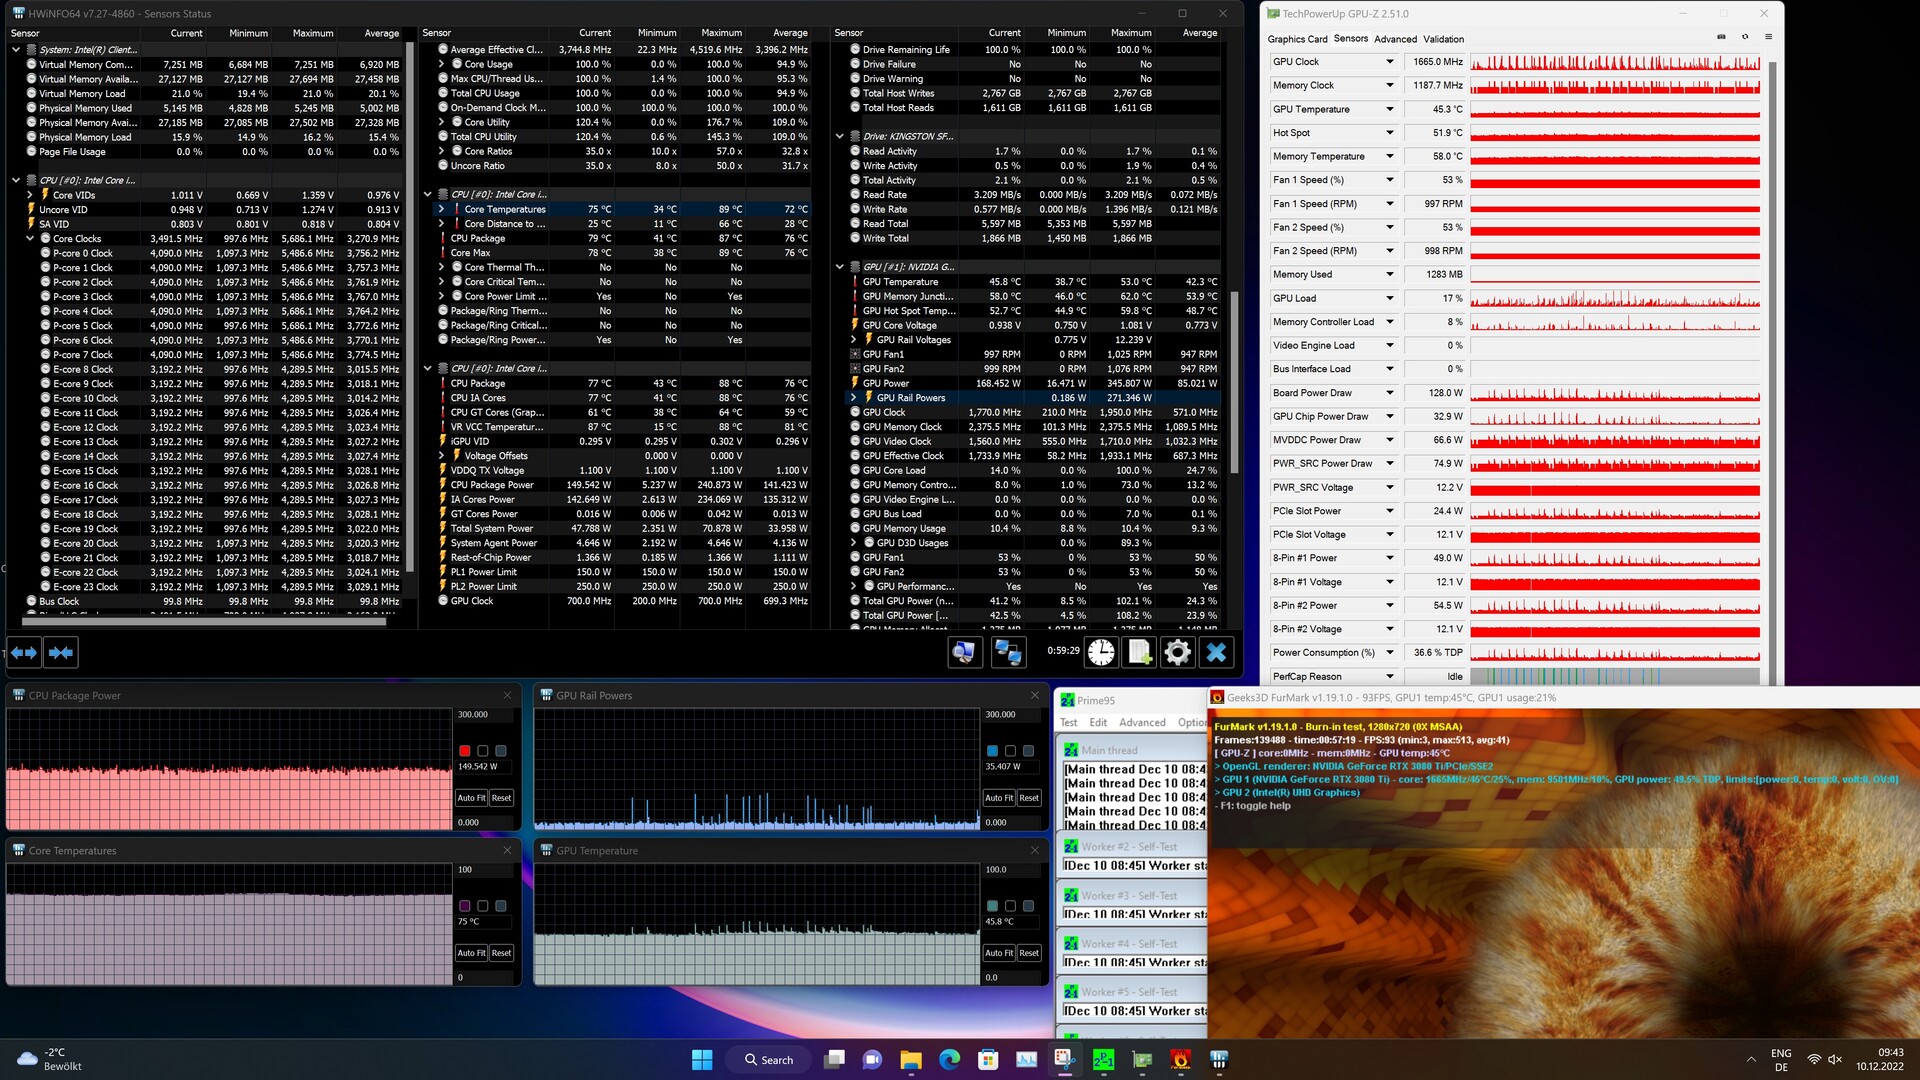
Temperaturer och systembrus
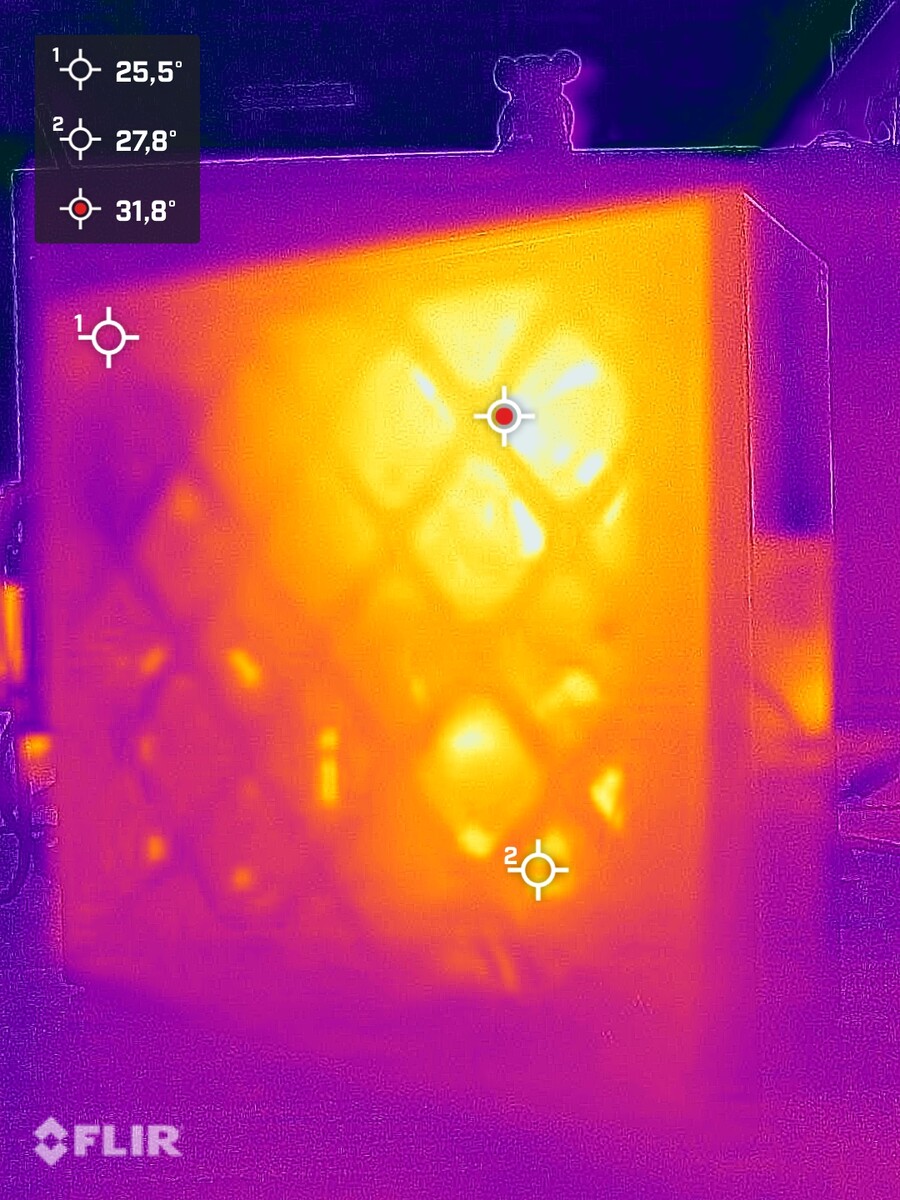
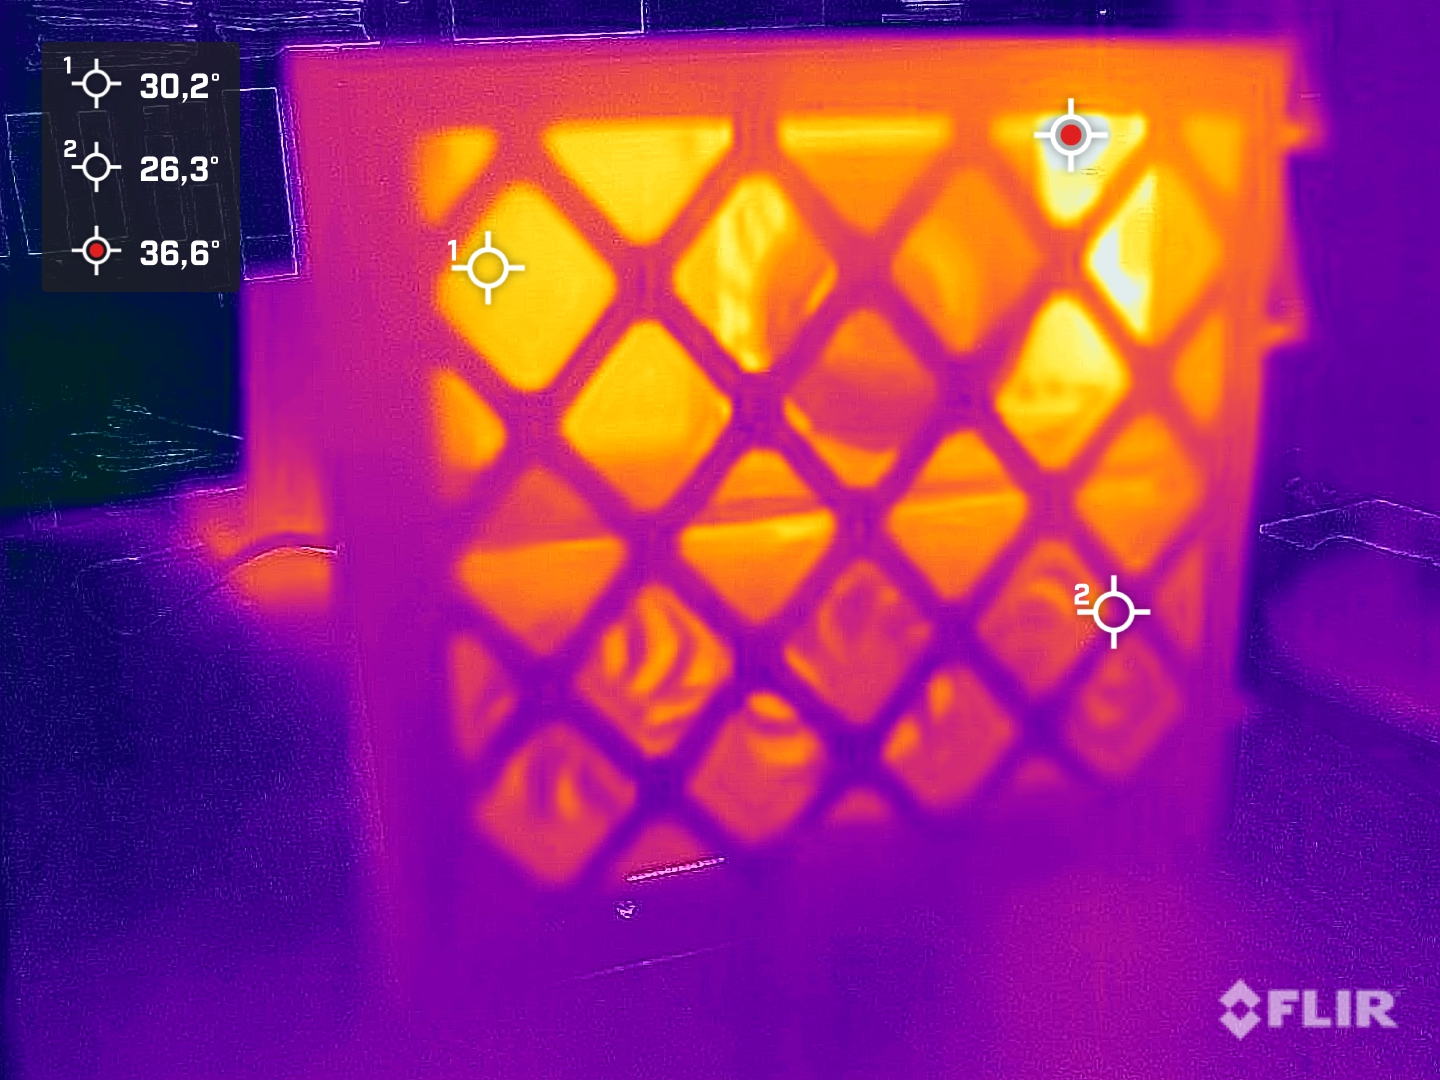
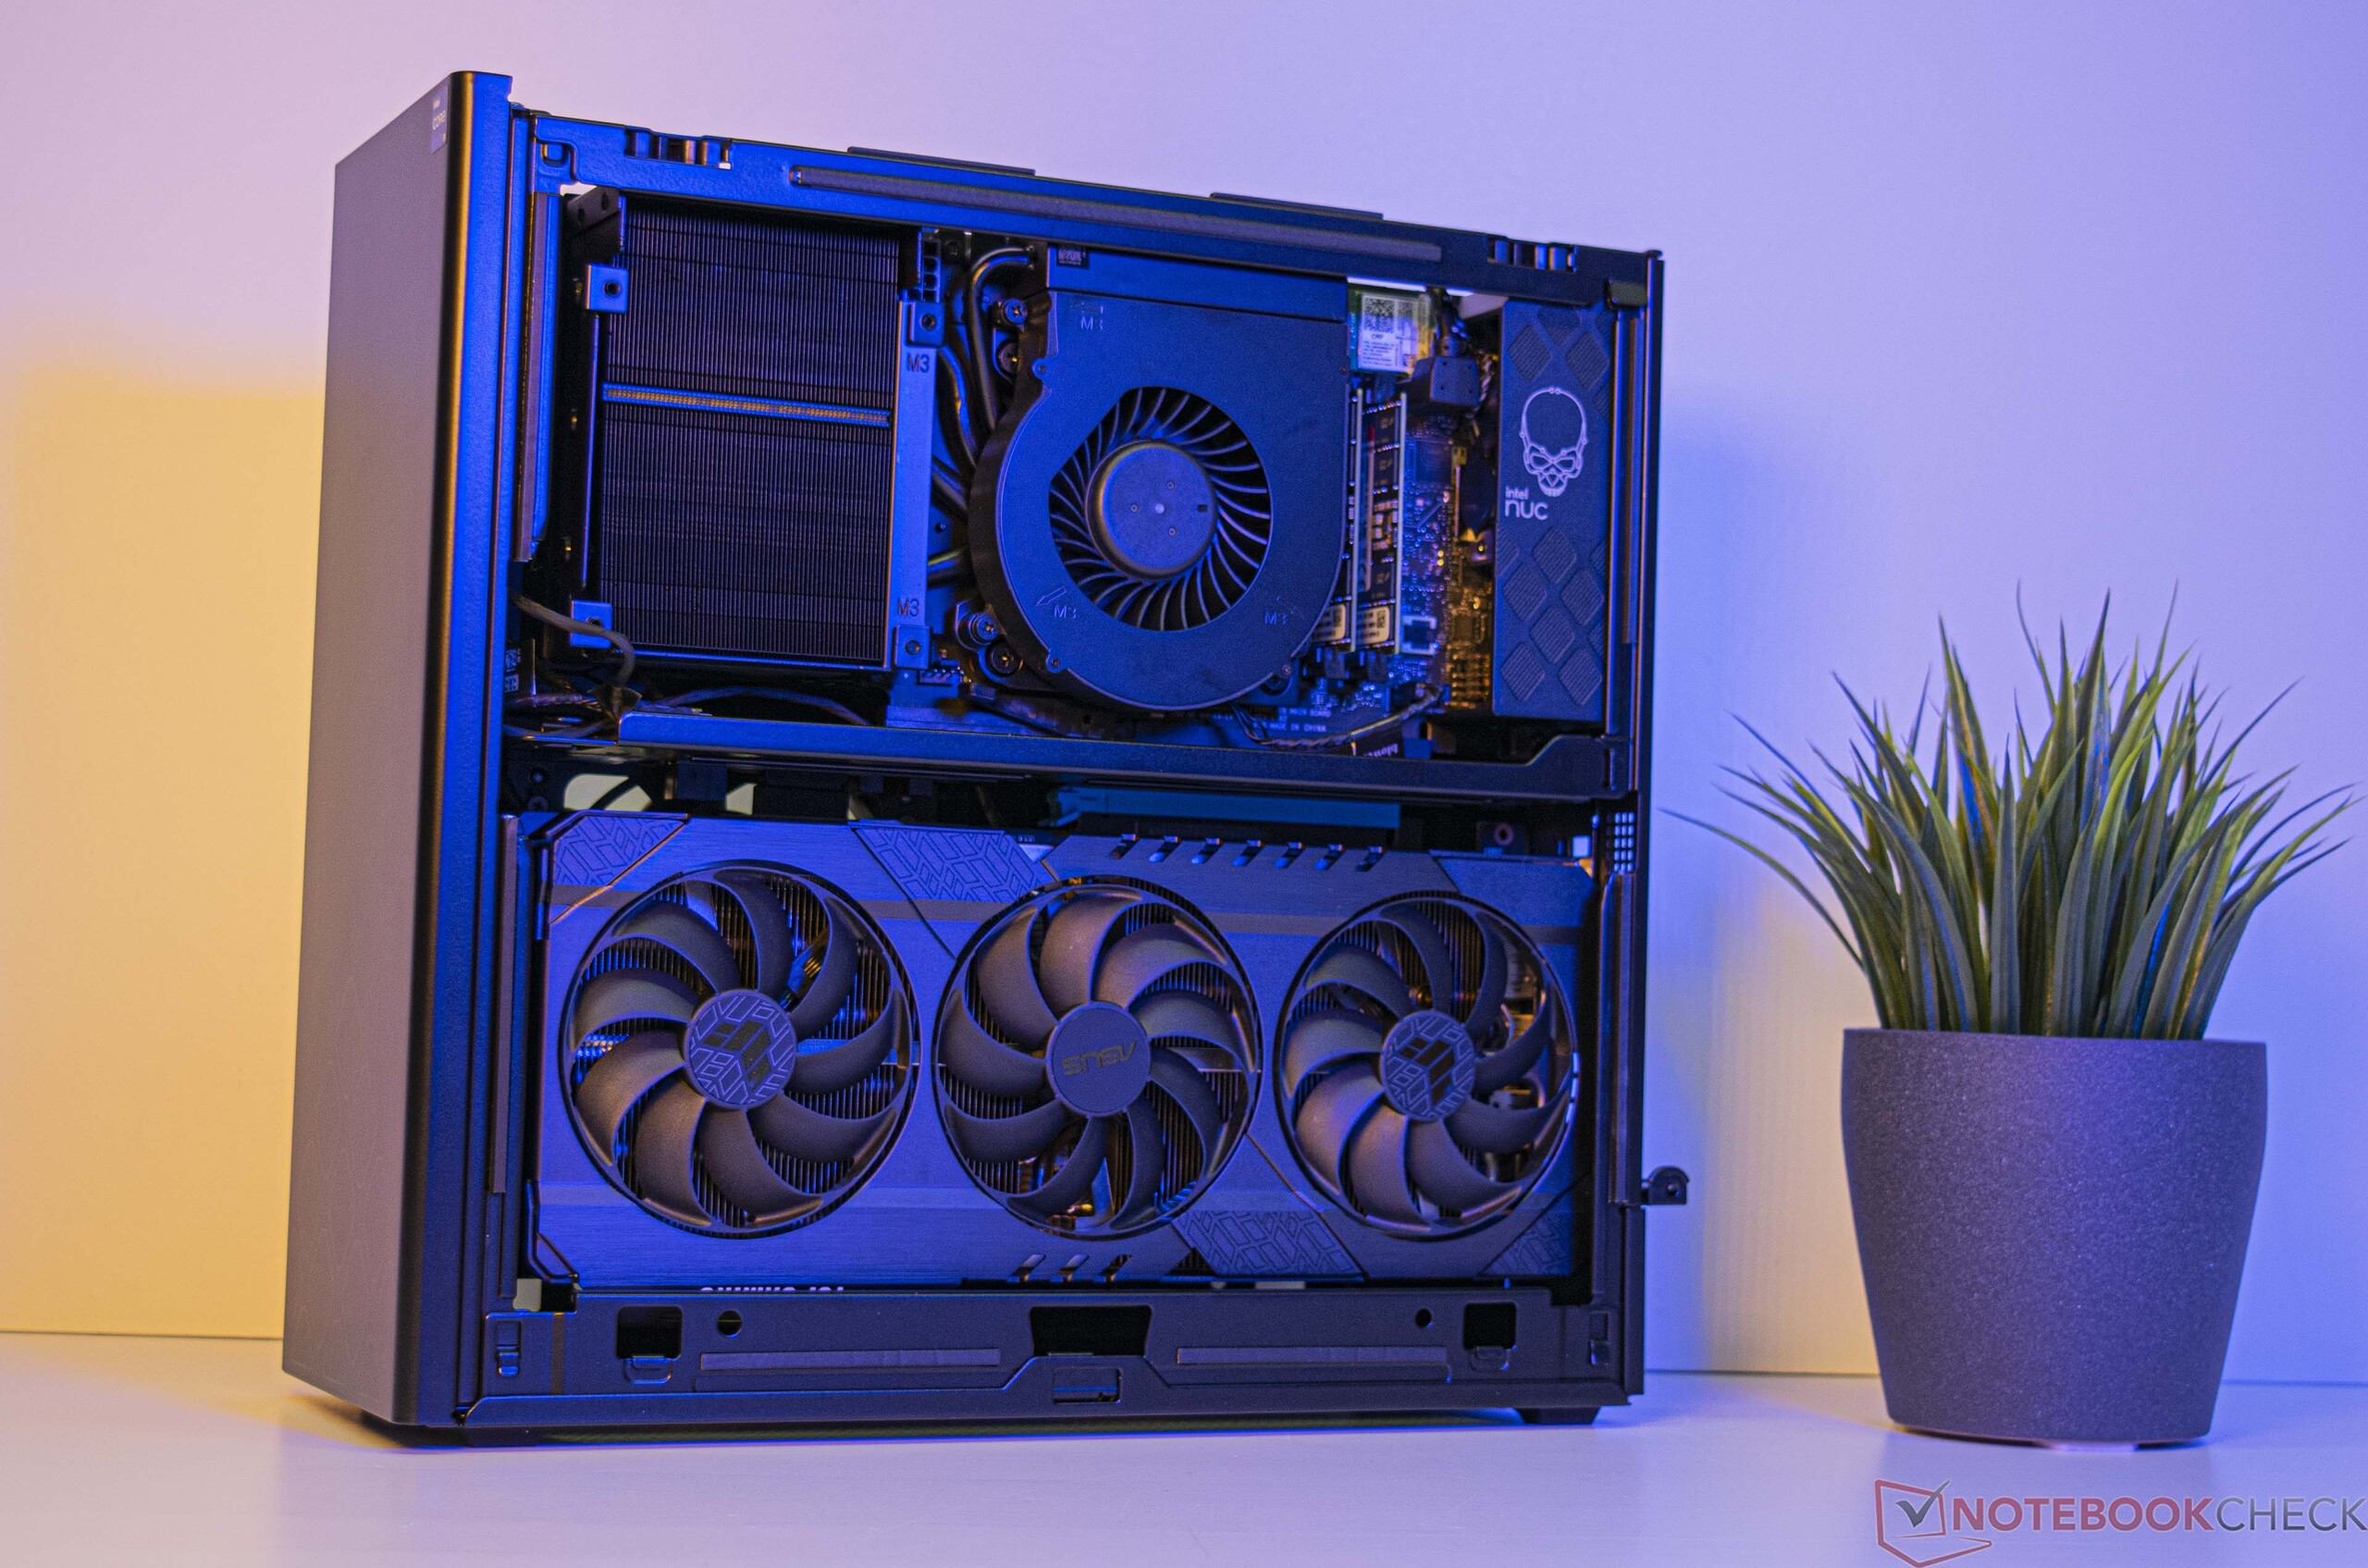
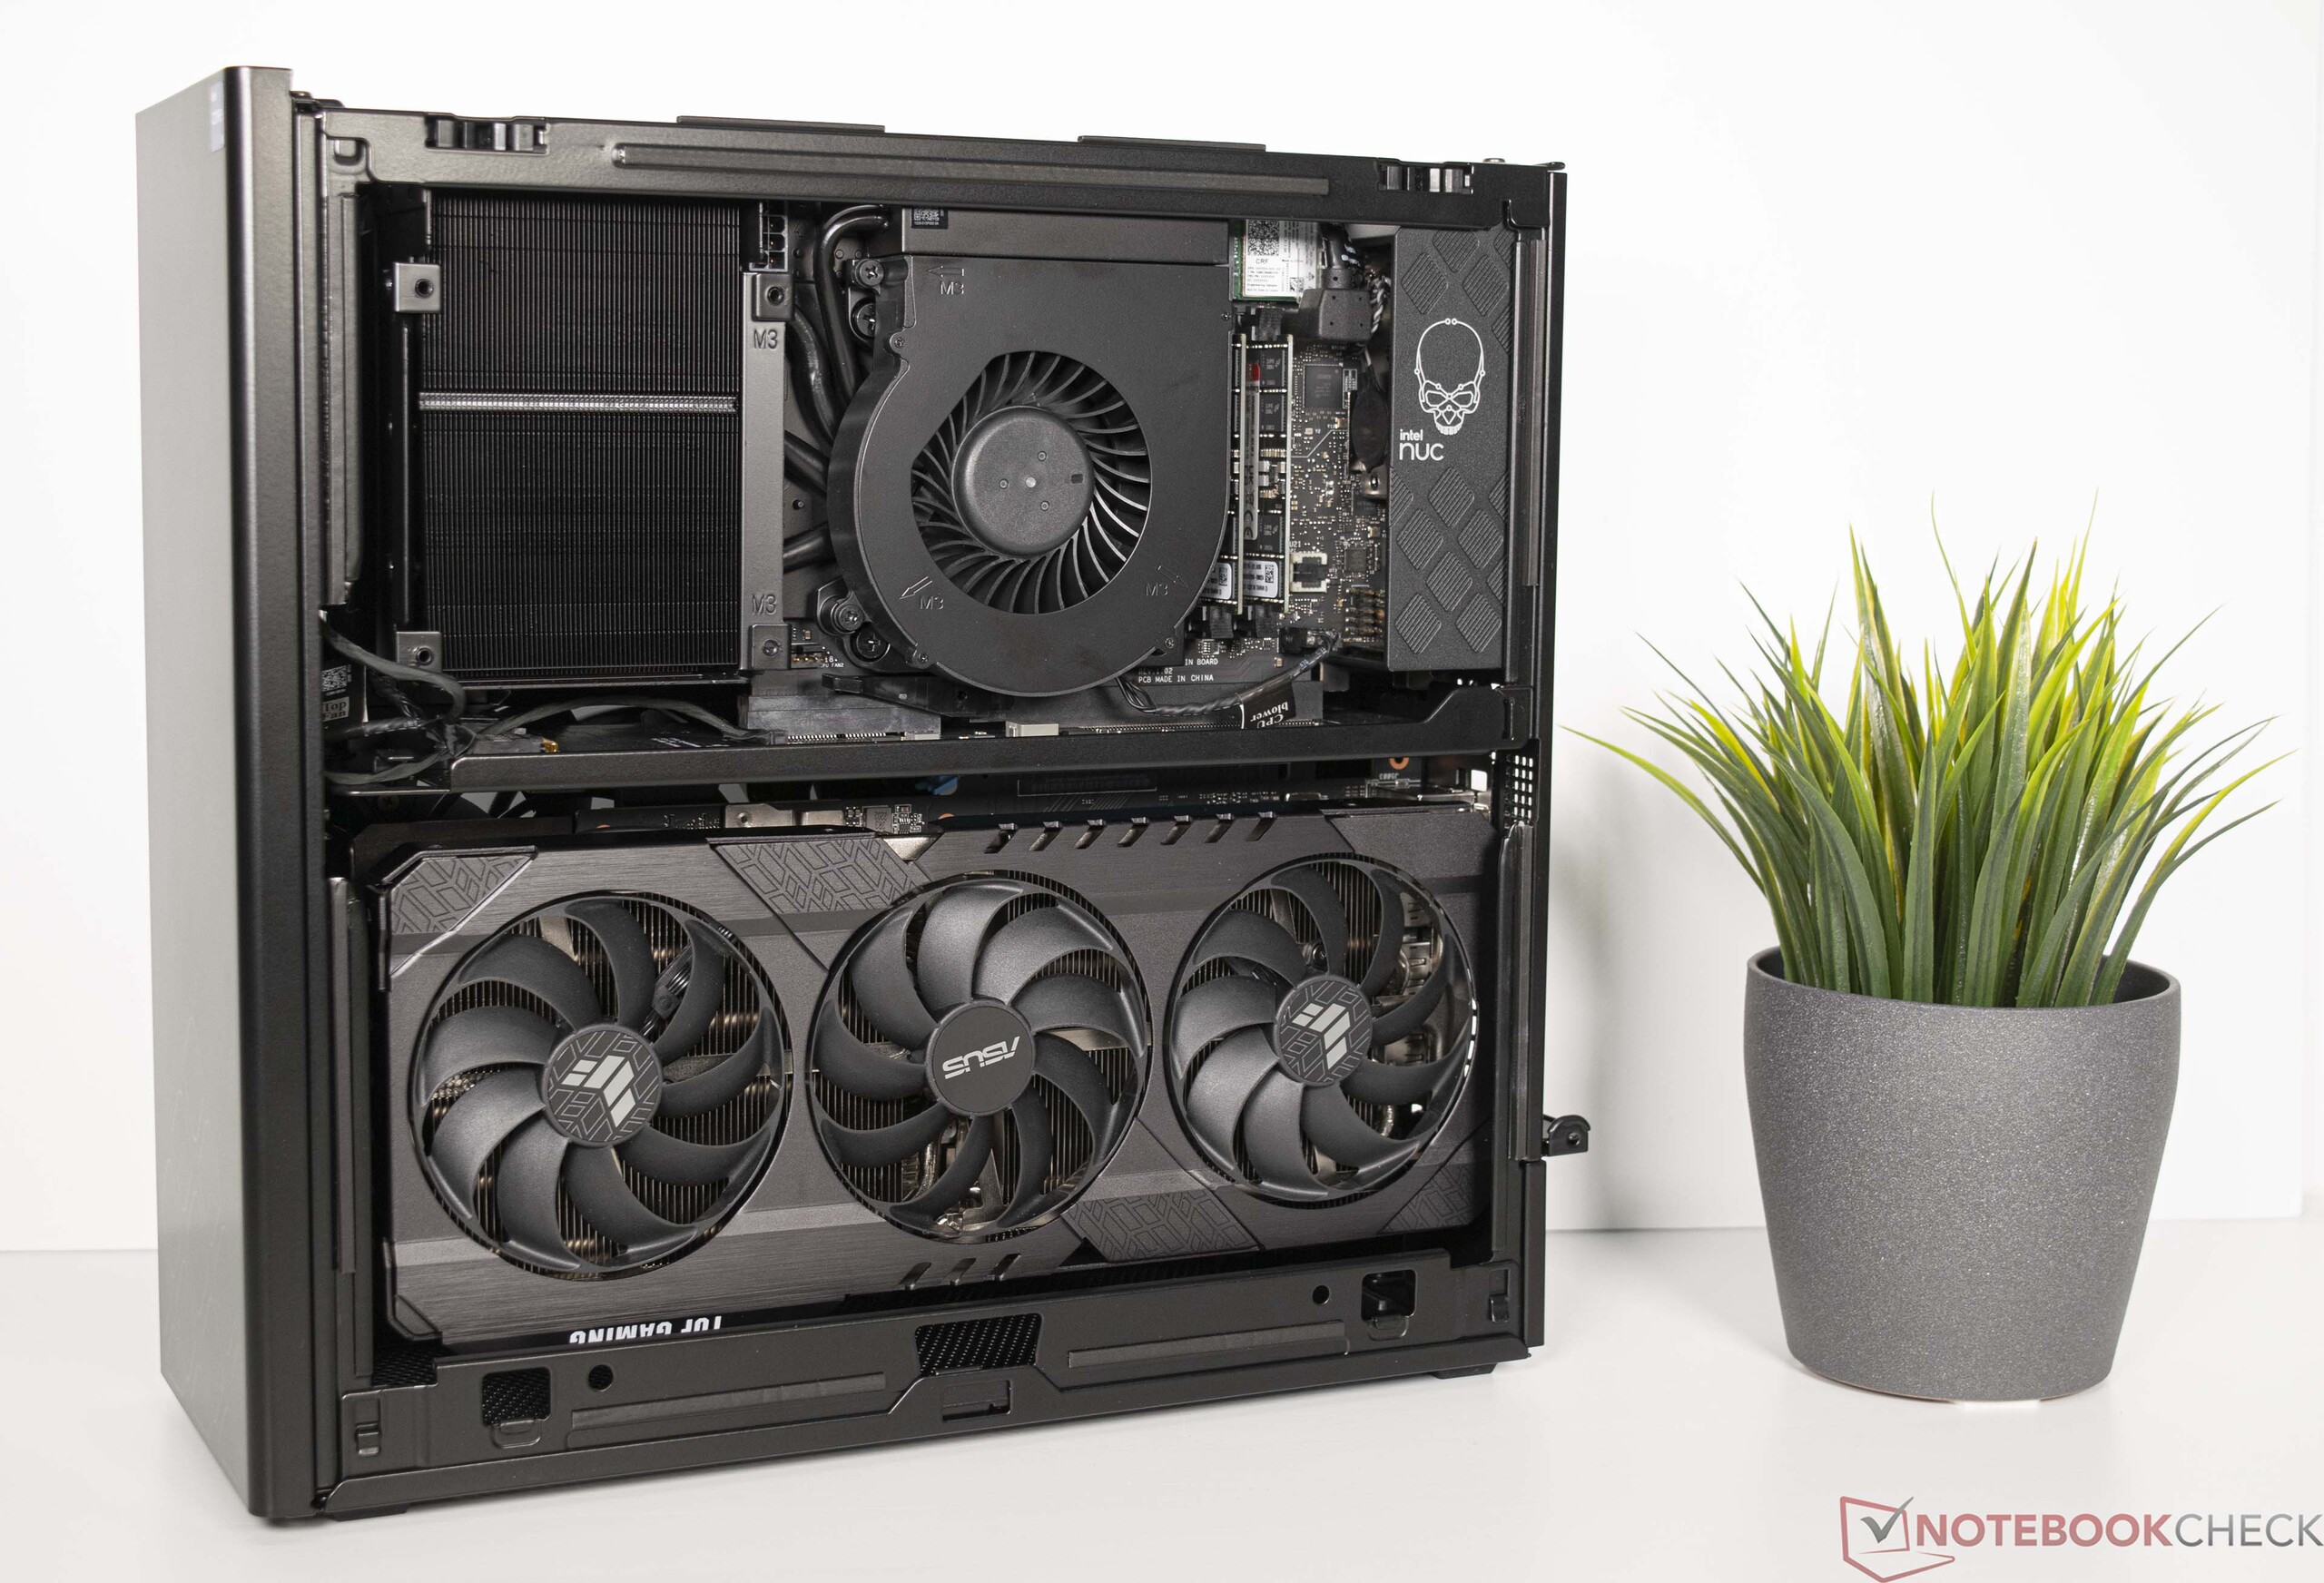
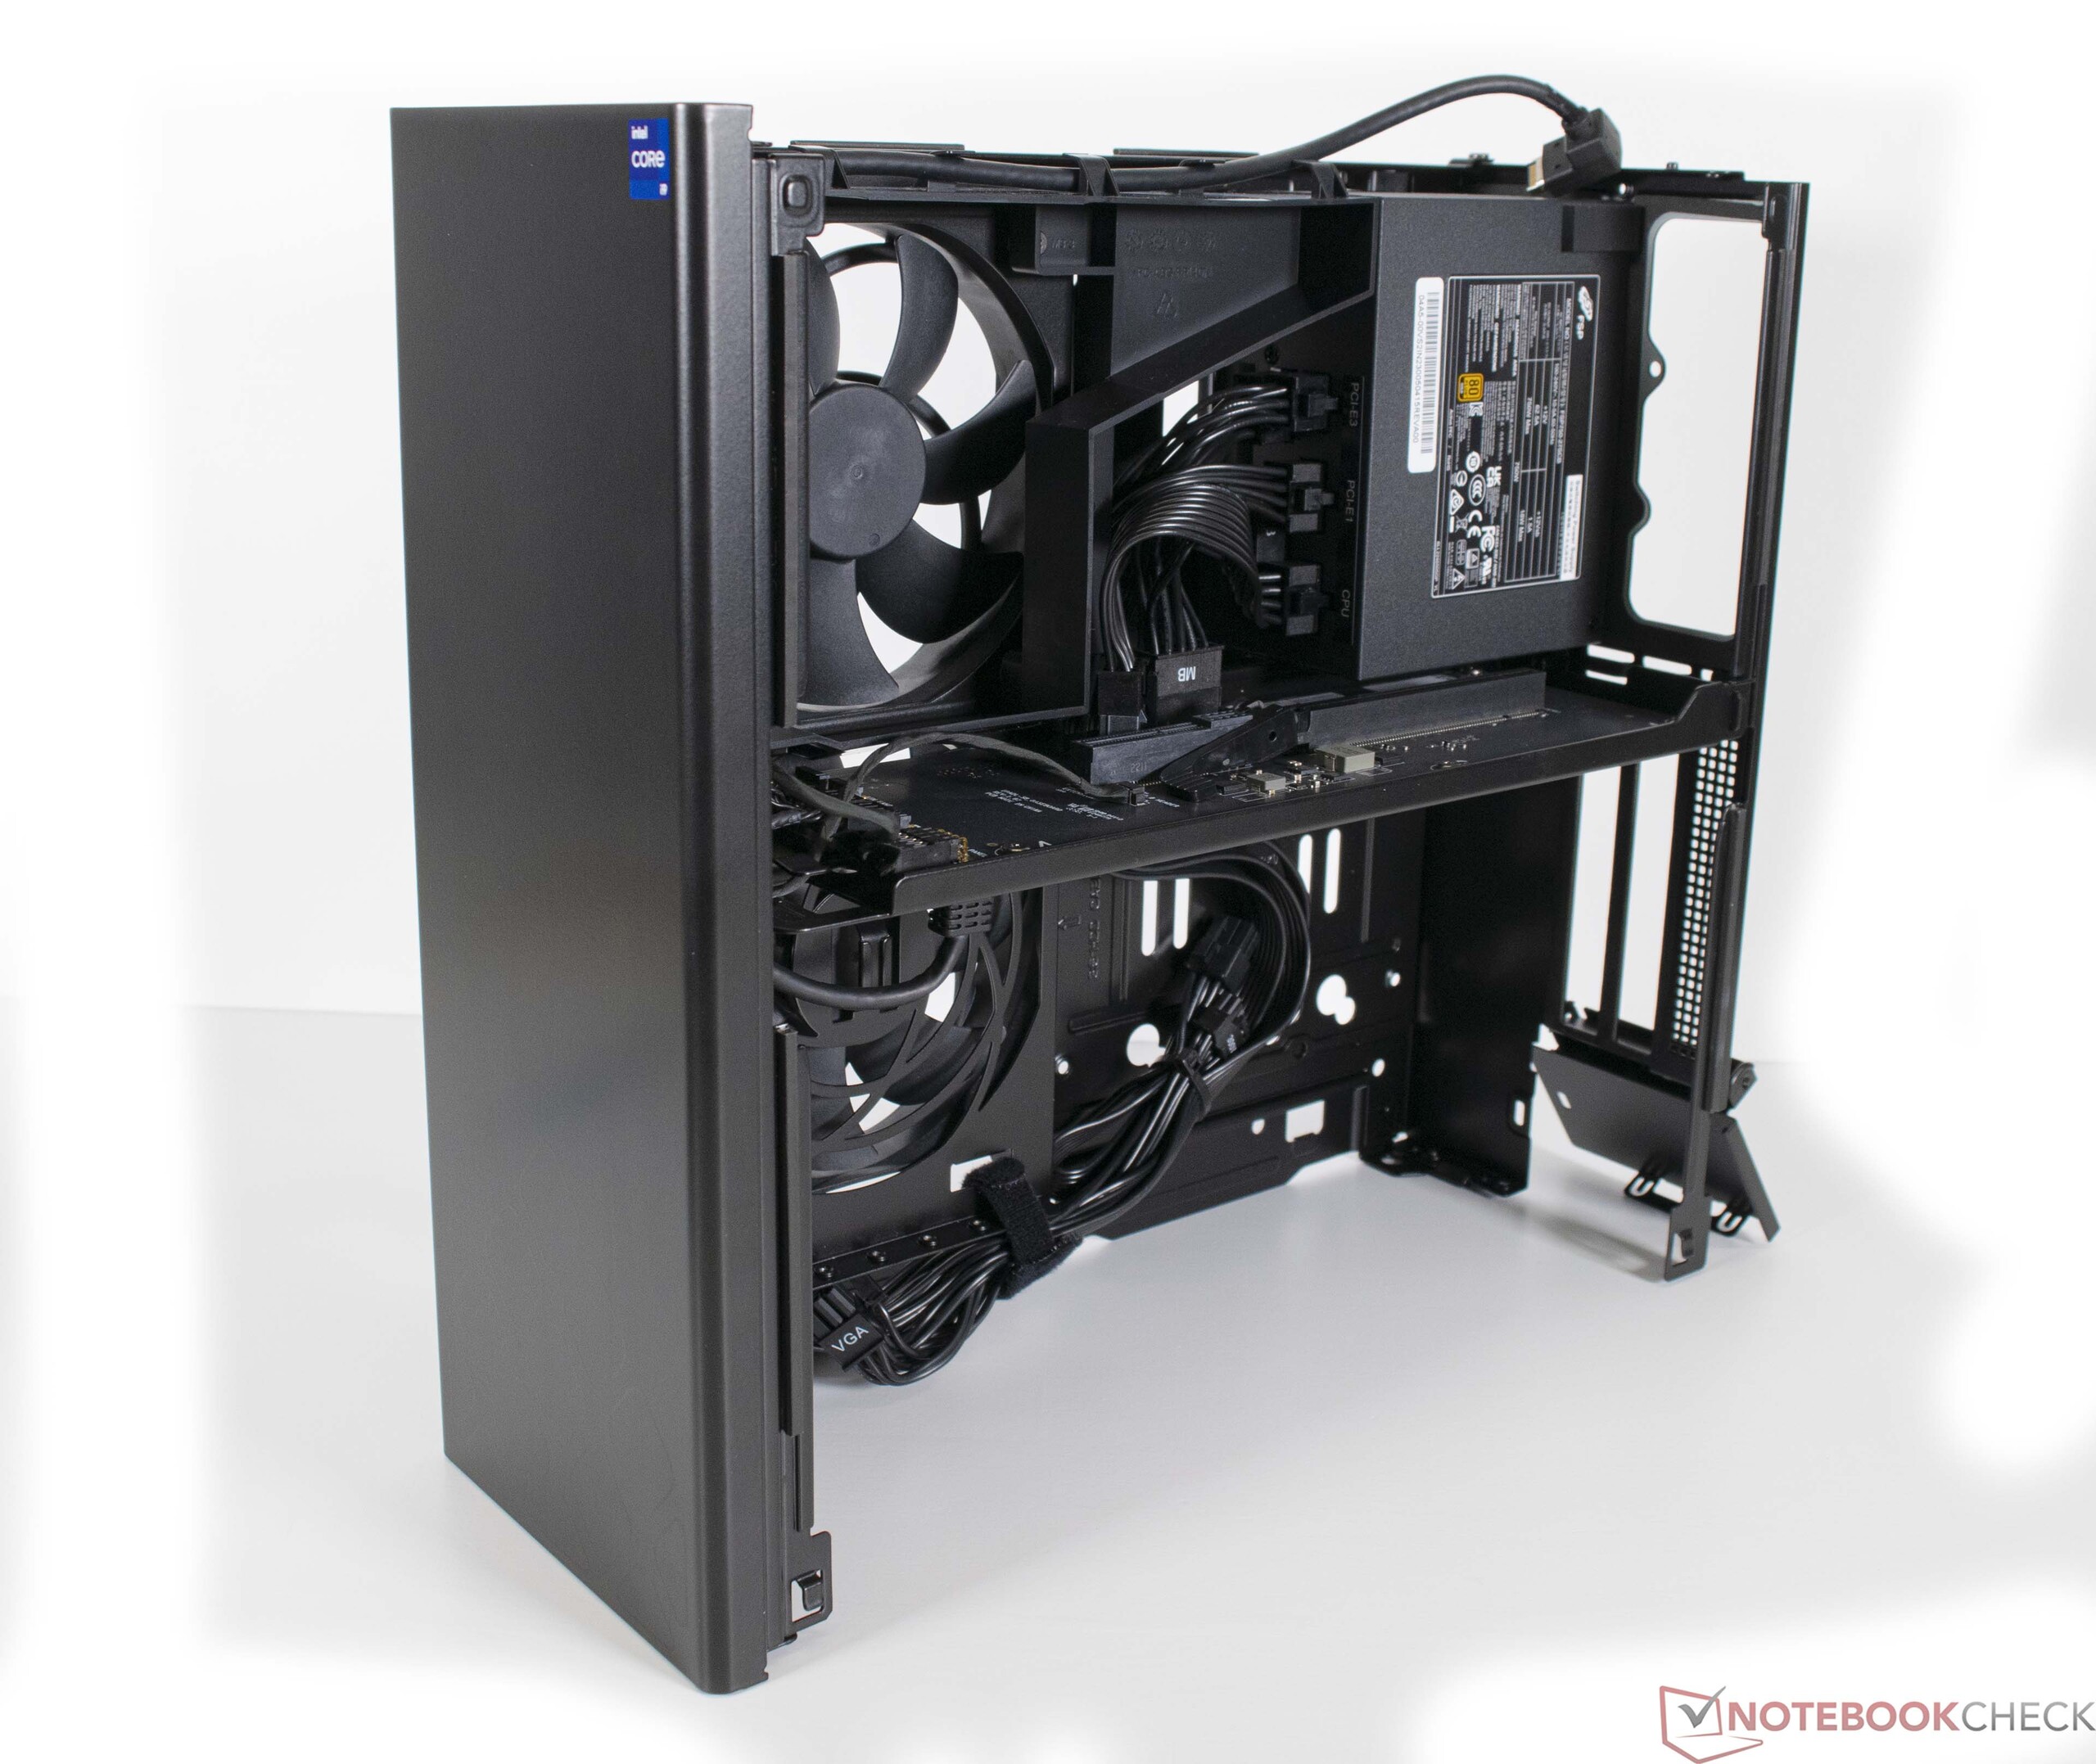
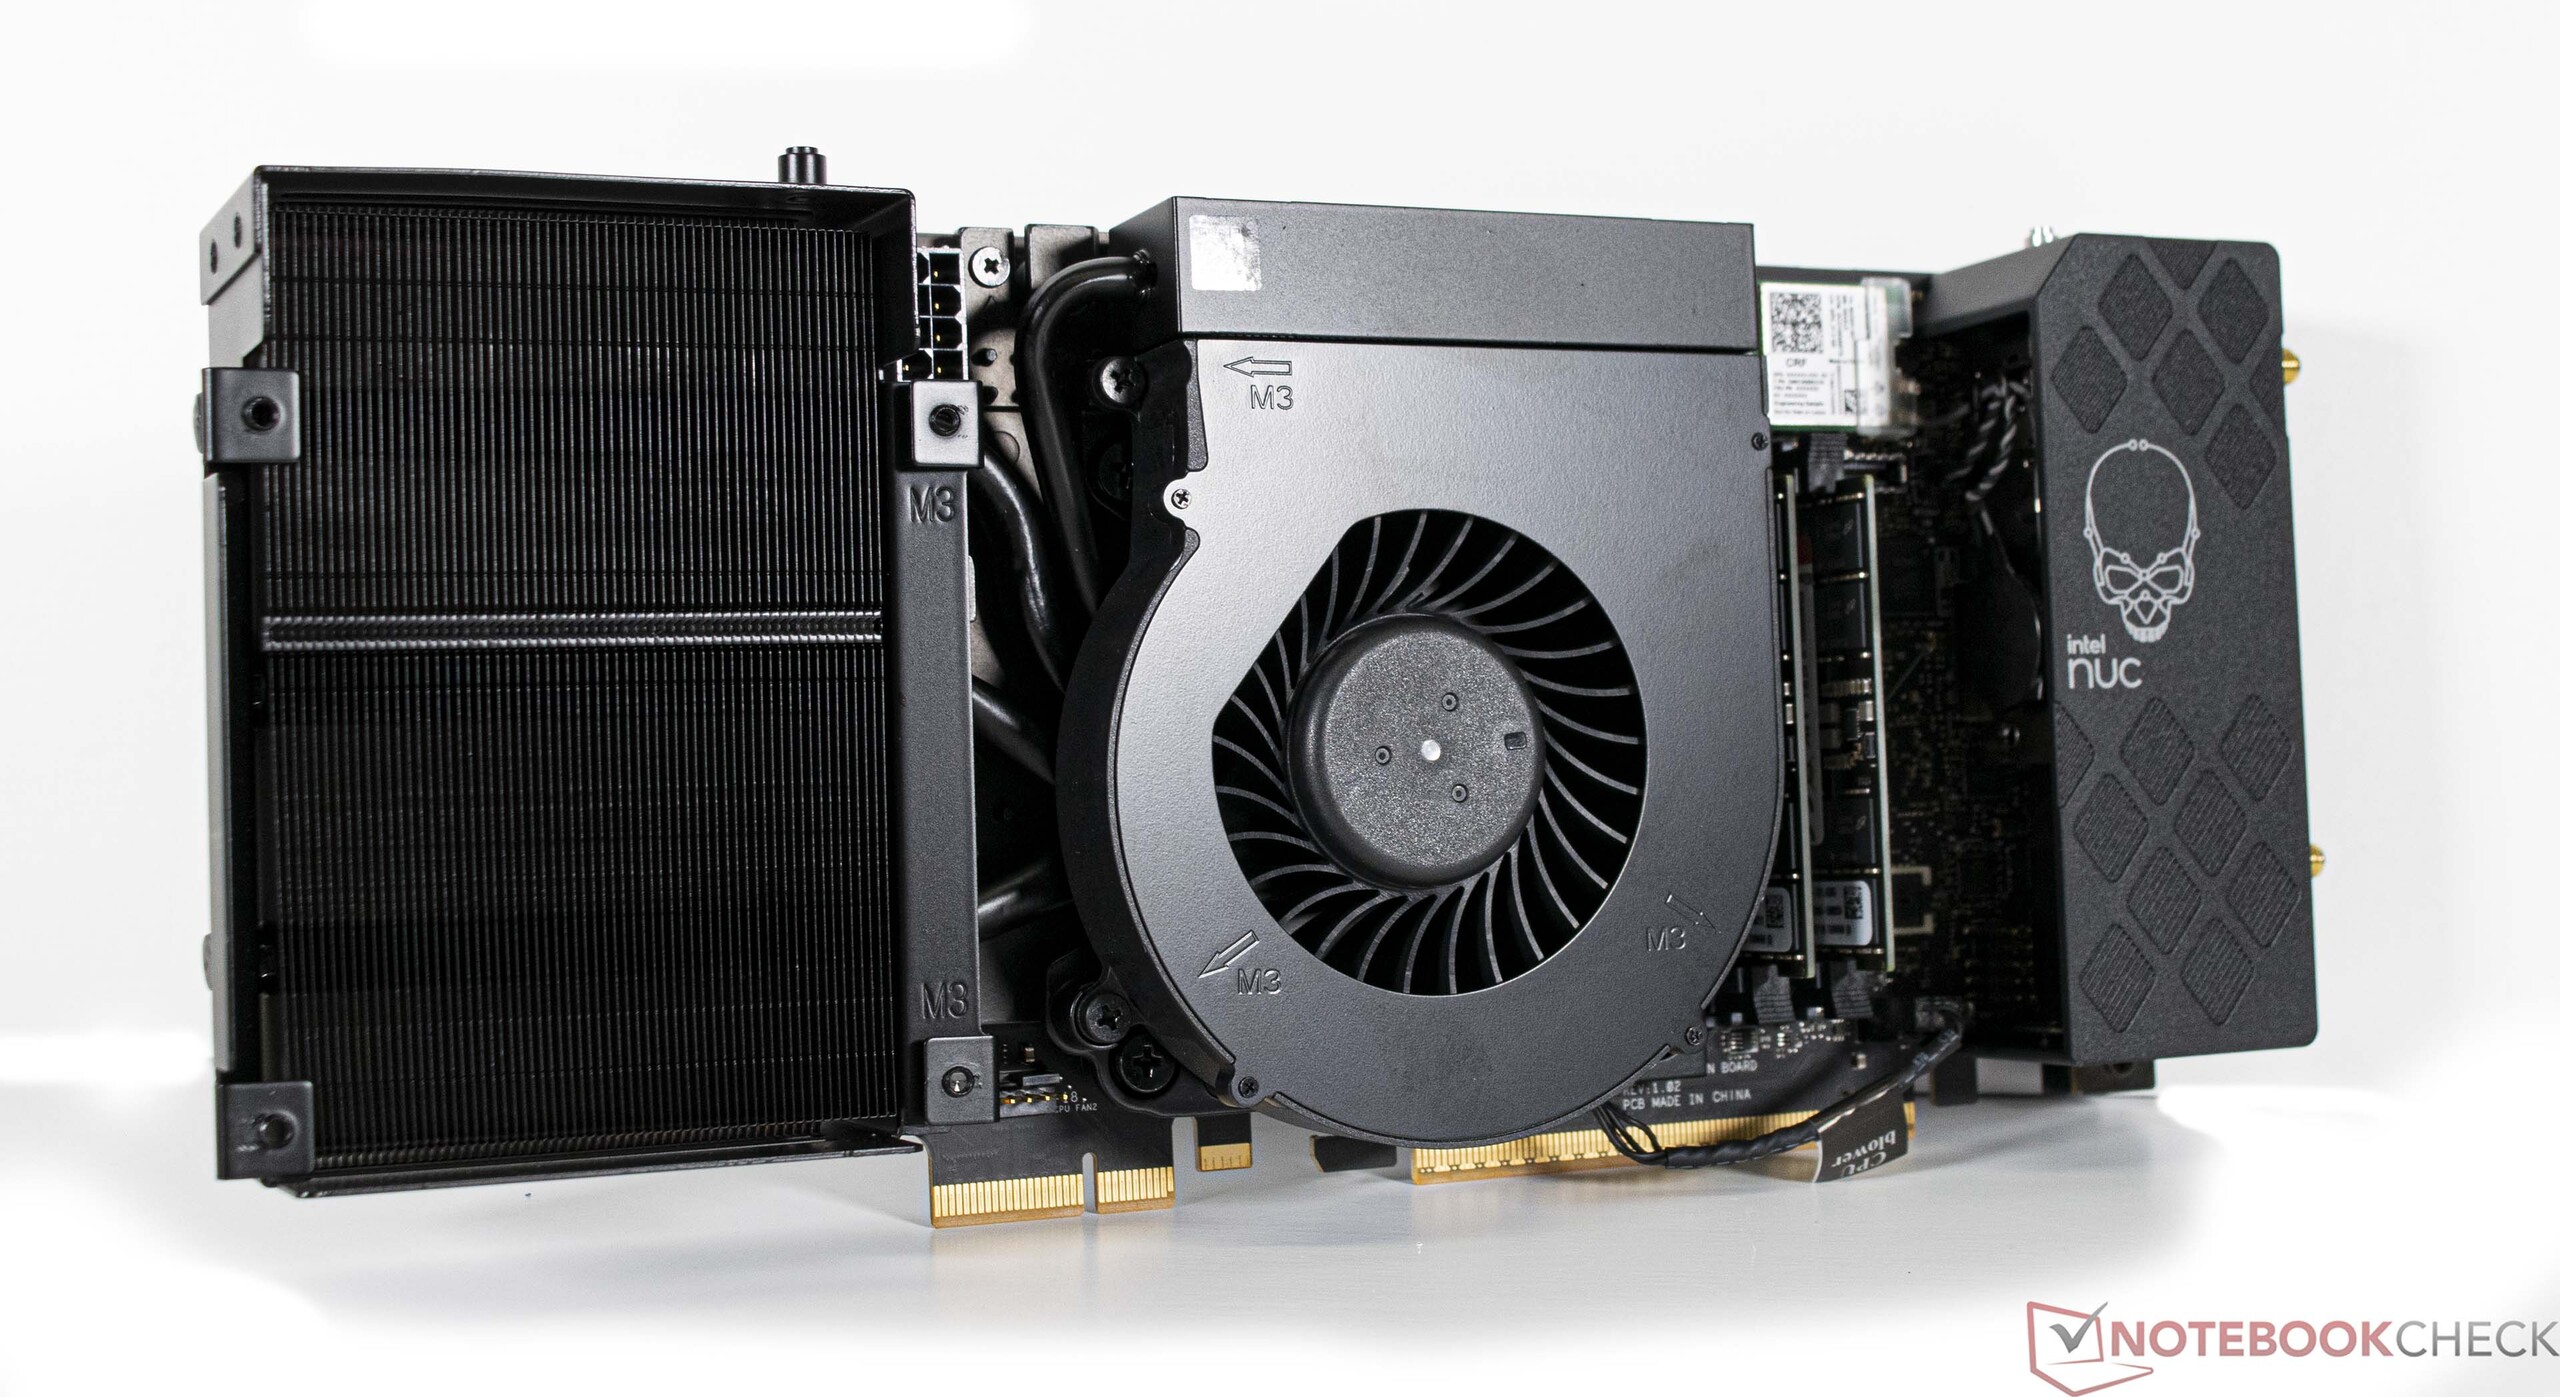
Höljet till Intel NUC 13 Extreme Raptor Canyon är uppdelat i två kamrar. Den övre delen rymmer Compute Element, som innehåller CPU, RAM och SSD samt strömförsörjningen, medan den nedre delen är reserverad helt och hållet för ett dedikerat grafikkort. Även om det här konceptet fungerar bra i praktiken är PL2 av den Intel Core i9-13900K bara kan upprätthållas under en kort tid. Processorn når oundvikligen 100 °C under belastning. Med detta sagt når dock CPU:n sällan denna temperatur under mycket korta perioder. I genomsnitt stabiliseras CPU-temperaturen mellan 60 och 90 °C, beroende på scenariot.
När det gäller bulleremissioner är vår konfiguration av systemet relativt tyst. Även om ljudet från systemet med 39 dB(A) är märkbart vid full belastning är det långt ifrån störande. Vi mäter ett liknande värde på strax över 38 dB(A) när vi spelar. Det installerade grafikkortet är alltså den huvudsakliga källan till buller under belastning. Det är möjligt att skapa ett mycket tyst system med en tystare modell.
Ljudnivå
| Låg belastning |
| 32.1 / 32.1 / 32.1 dB(A) |
| Hög belastning |
| 33.4 / 39 dB(A) |
 | ||
30 dB tyst 40 dB(A) hörbar 50 dB(A) högt ljud |
||
min: | ||
Energiförbrukning
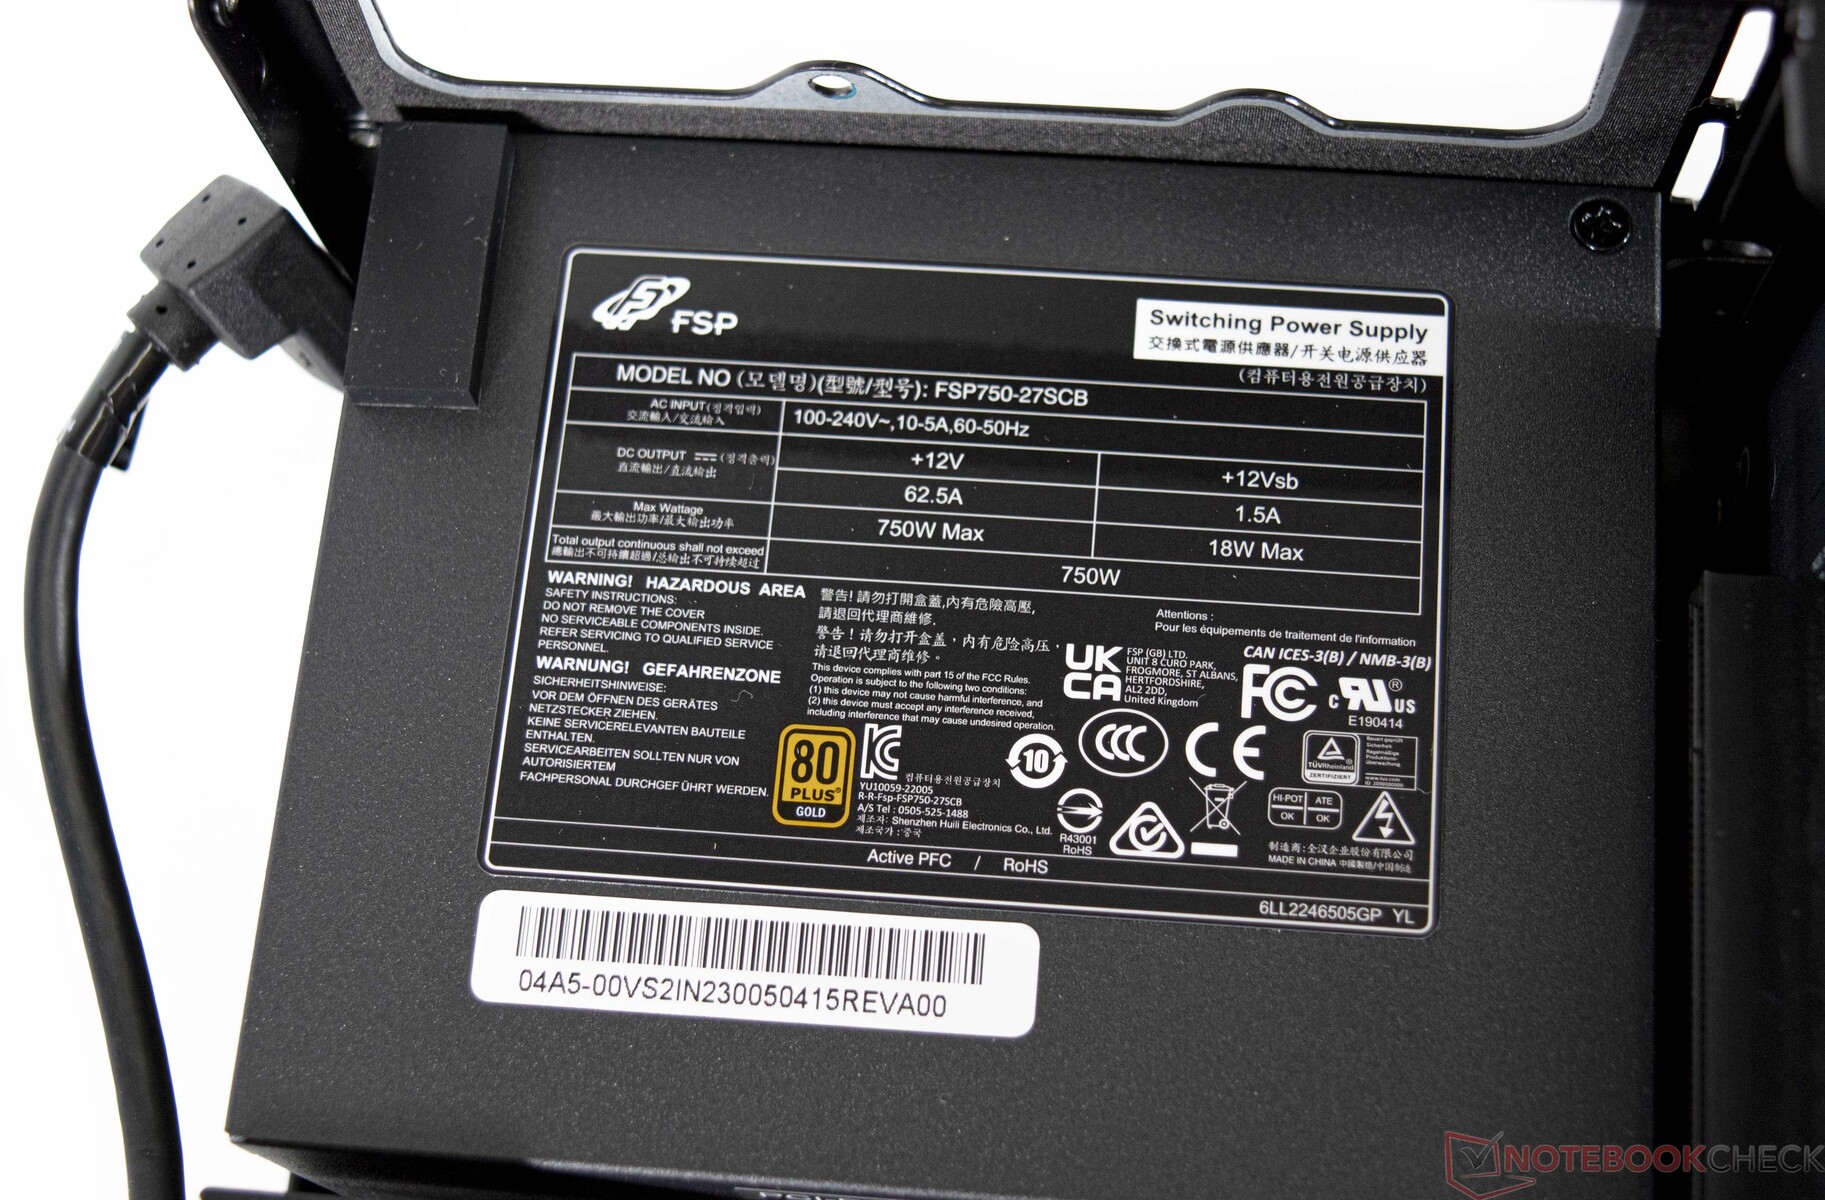
Ett 750-watts SFX-aggregat sköter växelströmskonverteringen. Eftersom vi uppmätte ett maximalt effektuttag på 499 watt när vi spelade, behöver användarna inte oroa sig även när systemet är fullt belastat. Vi observerade även toppar på 544 watt under våra tester, vilket inte ledde till några problem. Med 350 watt förbrukar grafikkortet lejonparten av strömmen under spelandet. Vi avråder från att använda grafikkort med en ännu högre TGP. Den nya 21VHPWR-kabeln kan ändå bara leverera upp till 300 watt - åtminstone enligt legenden på kontakten. Totalt finns det tre 6+2-PCIe-kablar.
| Intel NUC13 Raptor Canyon i9-13900K, GeForce RTX 3080 Ti | Minisforum Neptune Series HX90G R9 5900HX, Radeon RX 6600M | Minisforum NUCX i7 i7-11800H, GeForce RTX 3070 Laptop GPU | Genomsnitt NVIDIA GeForce RTX 3080 Ti | Genomsnitt av klass Desktop | |
|---|---|---|---|---|---|
| Power Consumption | 51% | 36% | 0% | 40% | |
| Idle Minimum * (Watt) | 39 | 17.8 54% | 28.2 28% | 39 ? -0% | 17.9 ? 54% |
| Idle Average * (Watt) | 42 | 17.9 57% | 29.9 29% | 42 ? -0% | 37.2 ? 11% |
| Idle Maximum * (Watt) | 52 | 18.1 65% | 36.2 30% | 52 ? -0% | 41.3 ? 21% |
| Load Average * (Watt) | 228 | 82.1 64% | 83.2 64% | 228 ? -0% | 96.7 ? 58% |
| Load Maximum * (Watt) | 308 | 262 15% | 215.7 30% | 308 ? -0% | 141.6 ? 54% |
| Witcher 3 ultra * (Watt) | 167 | ||||
| Cyberpunk 2077 ultra external monitor * (Watt) | 177 |
* ... mindre är bättre
| Av/Standby | |
| Låg belastning | |
| Hög belastning |
|
Förklaring:
min: | |
Consumption External Monitor
För
Emot
Bedömning - Massor av förbättringar och betydligt bättre prestanda
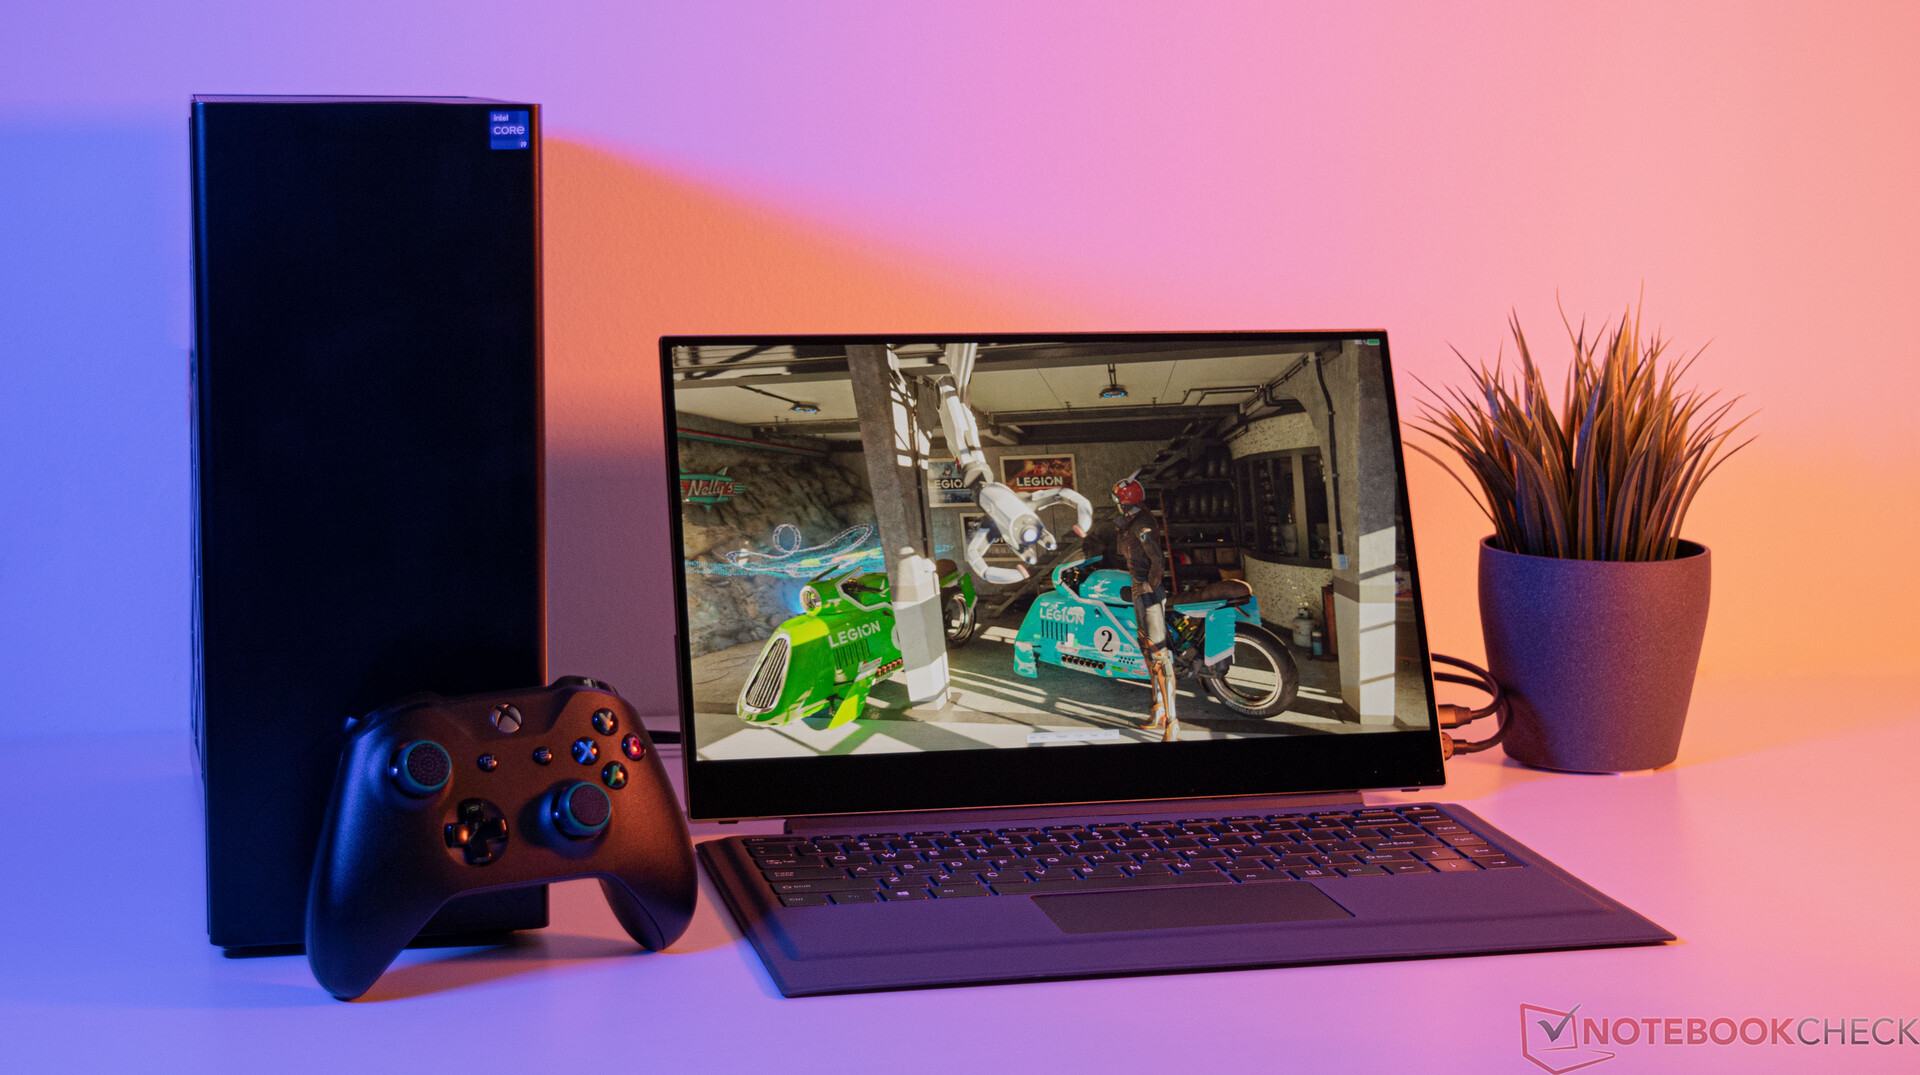

Intel NUC 13 Extreme Raptor Canyon klarar sig bra i många avseenden. Med de aktuella Raptor Lake-modellerna uppdaterar tillverkaren inte bara hårdvaran utan ser även över fallet. Det är nu betydligt större än tidigare. Som ett resultat av detta anser vi inte längre att det här systemet är en minidator, även om Intel kanske inte håller med. Med en volym på 14 liter konkurrerar Intel NUC 13 Extreme Raptor Canyon med Intel NUC 13 Extreme Raptor Canyon mot Corsair-One-i300-seriensom är något mer kompakt med en volym på 12 liter.
Vår konfiguration av systemet kommer med tillräcklig prestanda för alla nyare titlar vid 2160p. På grund av NUC 13 Raptor Canyons barebone-natur kan enheten anpassas enligt användarens krav och preferenser. Intel Core i9-13900K presterar exceptionellt bra, vilket är något som vi inte hade förväntat oss. Dessutom förblir enheten relativt tyst även under belastning.
Intel NUC 13 Extreme Kit är baserad på Intel Core i9-13900K och erbjuder mycket hög prestanda. Tillsammans med en lämplig grafikprocessor kan den bli ett utmärkt spelsystem eller en högklassig arbetsstation.
Systemet, som inkluderar CPU:n, kostar för närvarande 1550 USD. Om man lägger till RAM-minne, en SSD och en GPU kan priset snabbt stiga till svindlande höjder. Med detta sagt är konkurrenter som den tidigare nämnda Corsair One i300 också prissatta upp till cirka 5000 USD.
Det nya fodralet ser snyggt ut och känns robust tack vare de förstklassiga materialen. Dessutom har det en funktionell design, vilket gynnar kylningsmöjligheterna. Oavsett detta finns det nackdelar som de svåråtkomliga SSD-enheterna och avsaknaden av en kortläsare. Förra årets modell innehöll fortfarande den sistnämnda och erbjuder snabba UHS-II-hastigheter.
Pris och tillgänglighet
I Kina kommer Intel NUC 13 Extreme Raptor Canyon att släppas under fjärde kvartalet 2022. En global lansering kommer att följa under första kvartalet 2023. Beroende på konfiguration kostar NUC 13 Extreme mellan 1179 USD och 1549 USD utan GPU, RAM eller SSD - detta är normalt för NUCs. Compute Element finns också separat utan PC-väska för 760 till 1100 USD.
Intel har försett oss med Intel NUC 13 Extreme Raptor Canyon för den här recensionen.

