Recension av arbetsstationen Dell Precision 7670 - Debut för Core i7-12850HX och CAMM RAM

I Precision 7000-serien finns Dells flaggskepp bland de mobila arbetsstationerna, till skillnad från mellanklassen Precision 5000-serien och budgetmodellen Precision 3000-serien. Precision 7670 är den första 16-tumsmodellen i familjen och ligger mellan 15,6-tumsmodellen Precision 7560 och 17,3-tumsmodellen Precision 7760. Förvirrande nog tillverkar Dell två varianter av Precision 7670 som kallas "Performance base" och "Thin base". Den här specifika granskningen gäller varianten "Thin base" och granskningen av "Performance base" kommer senare.
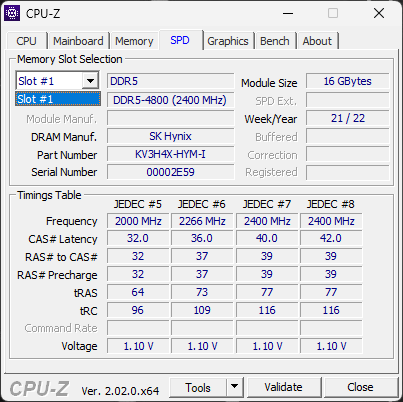
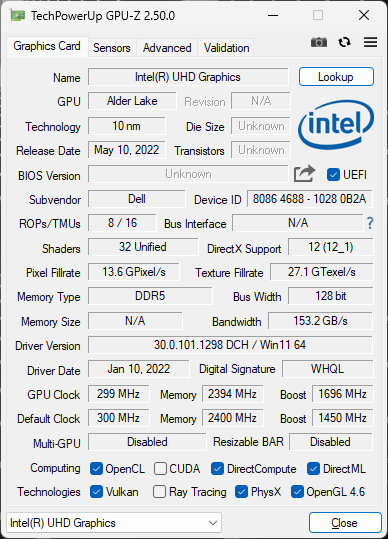
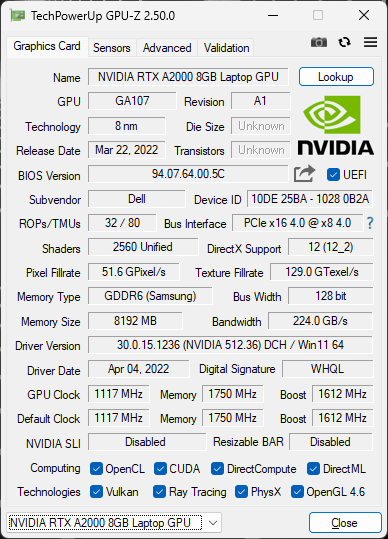
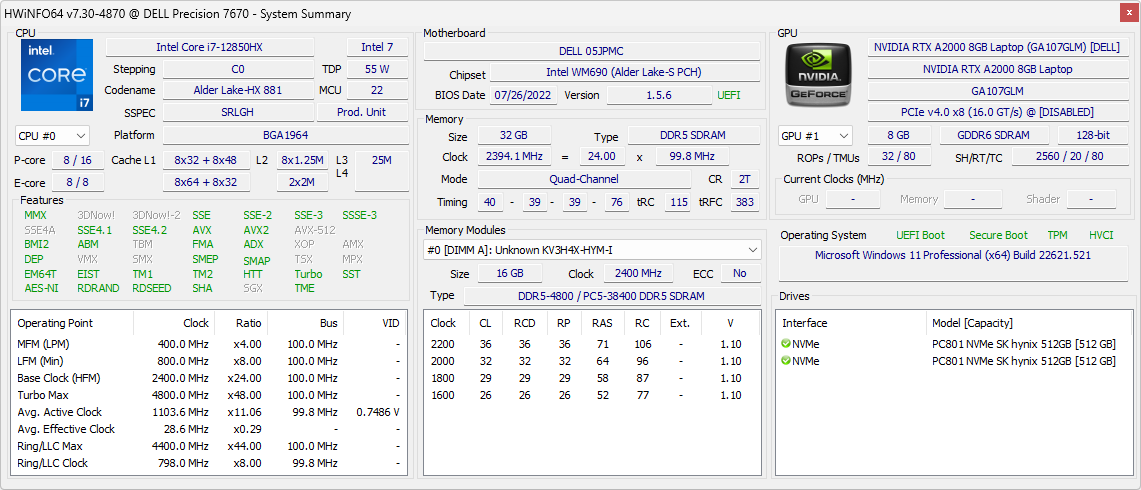
Alternativen är mycket breda och sträcker sig från Core i5-12600HX till i9-12950HX, Iris Xe-grafik upp till diskreta Nvidia RTX A5500, FHD IPS till 4K OLED-skärm och även SODIMM- eller CAMM RAM upp till 128 GB. Vår specifika granskningsenhet är en mellankonfiguration med i7-12850HX, 95 W RTX A2000 och 4K OLED pekskärm för cirka 4100 USD.
Det finns tyvärr inga Xeon- eller ECC RAM-alternativ för Precision 7670 för tillfället, men vPro stöds på alla SKU:er.
Det finns få direkta konkurrenter för tillfället eftersom 16-tums arbetsstationsutrymmet fortfarande är relativt nytt. Bland de nuvarande alternativen finns följande Asus ProArt StudioBook Pro 16, Lenovo ThinkPad P1 G4och HP ZBook Fury 16.
Fler recensioner av Dell:
Potentiella konkurrenter i jämförelse
Gradering | Datum | Modell | Vikt | Höjd | Storlek | Upplösning | Pris |
|---|---|---|---|---|---|---|---|
| 88.4 % v7 (old) | 10/2022 | Dell Precision 7670 i7-12850HX, RTX A2000 Laptop GPU | 2.7 kg | 24.7 mm | 16.00" | 3840x2400 | |
| 89.3 % v7 (old) | 02/2022 | Lenovo ThinkPad P1 G4-20Y4Z9DVUS i7-11800H, T1200 Laptop GPU | 1.8 kg | 17.7 mm | 16.00" | 2560x1600 | |
v (old) | 12/2021 | Asus ProArt StudioBook 16 W7600H5A-2BL2 W-11955M, RTX A5000 Laptop GPU | 2.4 kg | 21.4 mm | 16.00" | 3840x2400 | |
| 88.3 % v7 (old) | 12/2021 | Dell Precision 5000 5560 i7-11850H, RTX A2000 Laptop GPU | 2 kg | 18 mm | 15.60" | 3840x2400 | |
| 87.8 % v7 (old) | 12/2020 | Dell Precision 7550 W-10885M, Quadro RTX 5000 Max-Q | 2.8 kg | 27.36 mm | 15.60" | 3840x2160 | |
| 90.3 % v7 (old) | 12/2021 | HP ZBook Fury 15 G8 i9-11950H, RTX A5000 Laptop GPU | 2.5 kg | 25.9 mm | 15.60" | 3840x2160 |
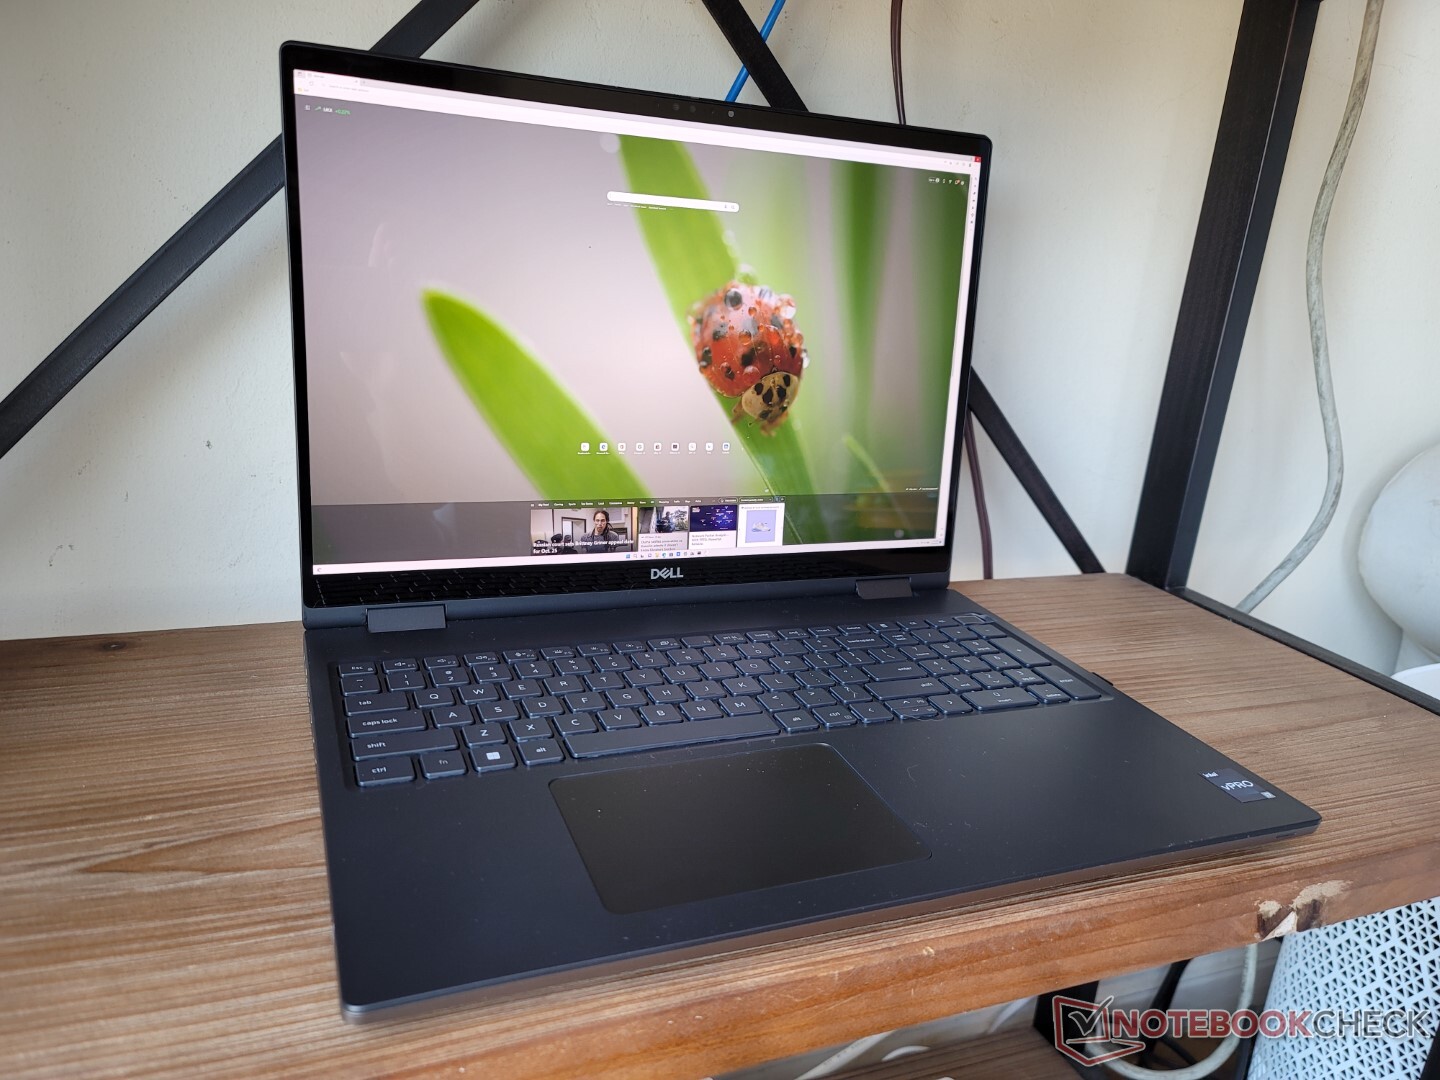
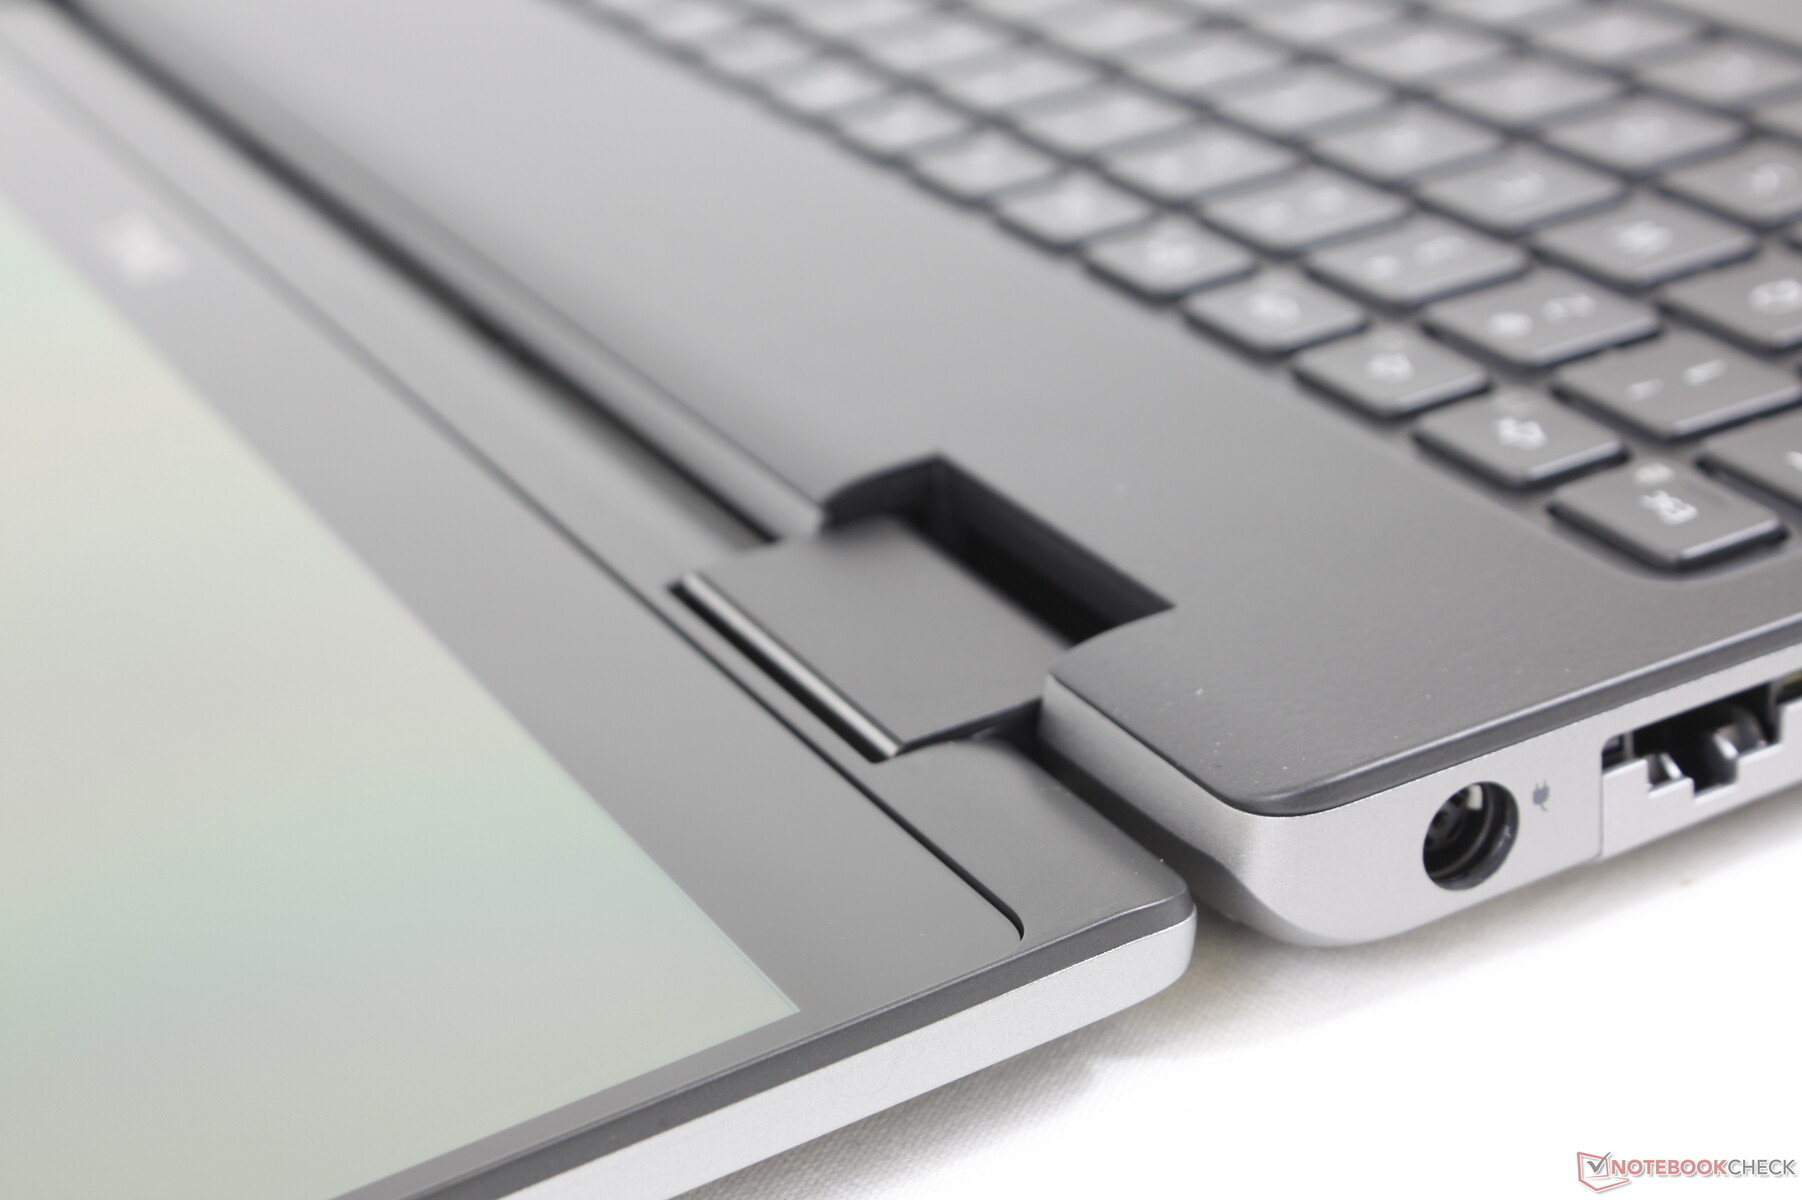
Hölje - Klassiskt Precision-utseende och känsla
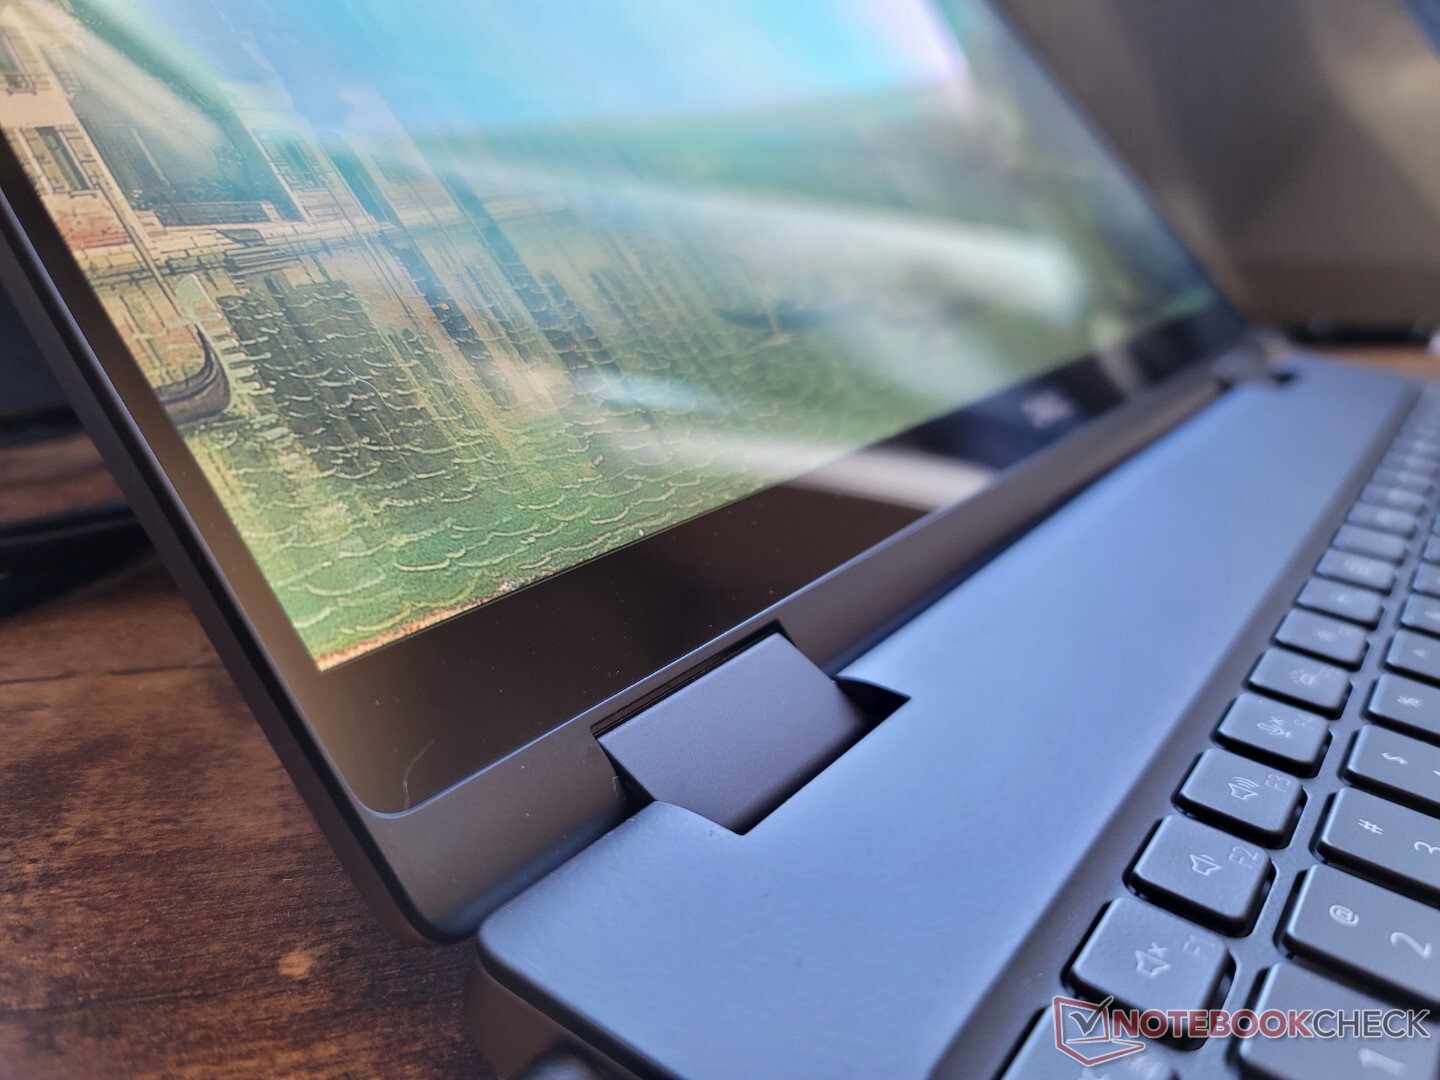
Chassiets utformning och material överensstämmer nära med 2020 års modell Precision 7550. Det svarta tangentbordsdäcket, till exempel, är fortfarande något gummerat för en premiumkänsla medan det yttre metallskelettet är tjockt för att ge ett starkare första intryck än den ThinkPad P1 G4 eller Asus ProArt StudioBook. Om du utövar tryck på tangentbordets mitt eller det yttre locket kommer deras ytor att förvrängas något mer än på en HP ZBook Studio, men vi kan i övrigt inte märka några knarrande eller större svaga punkter.
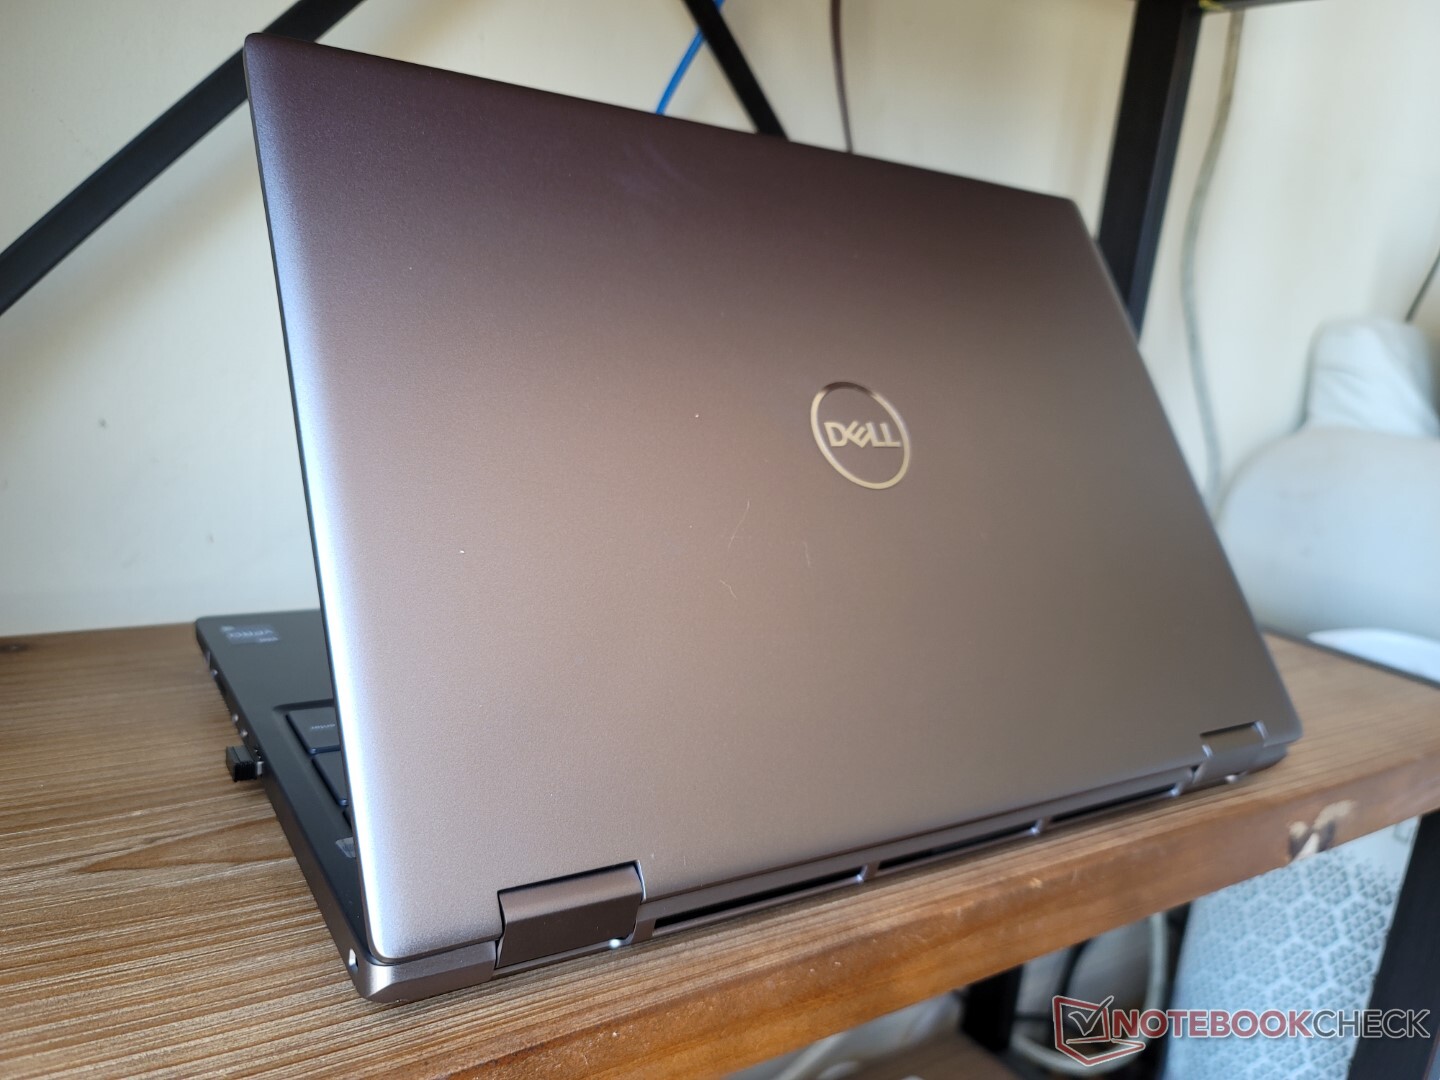
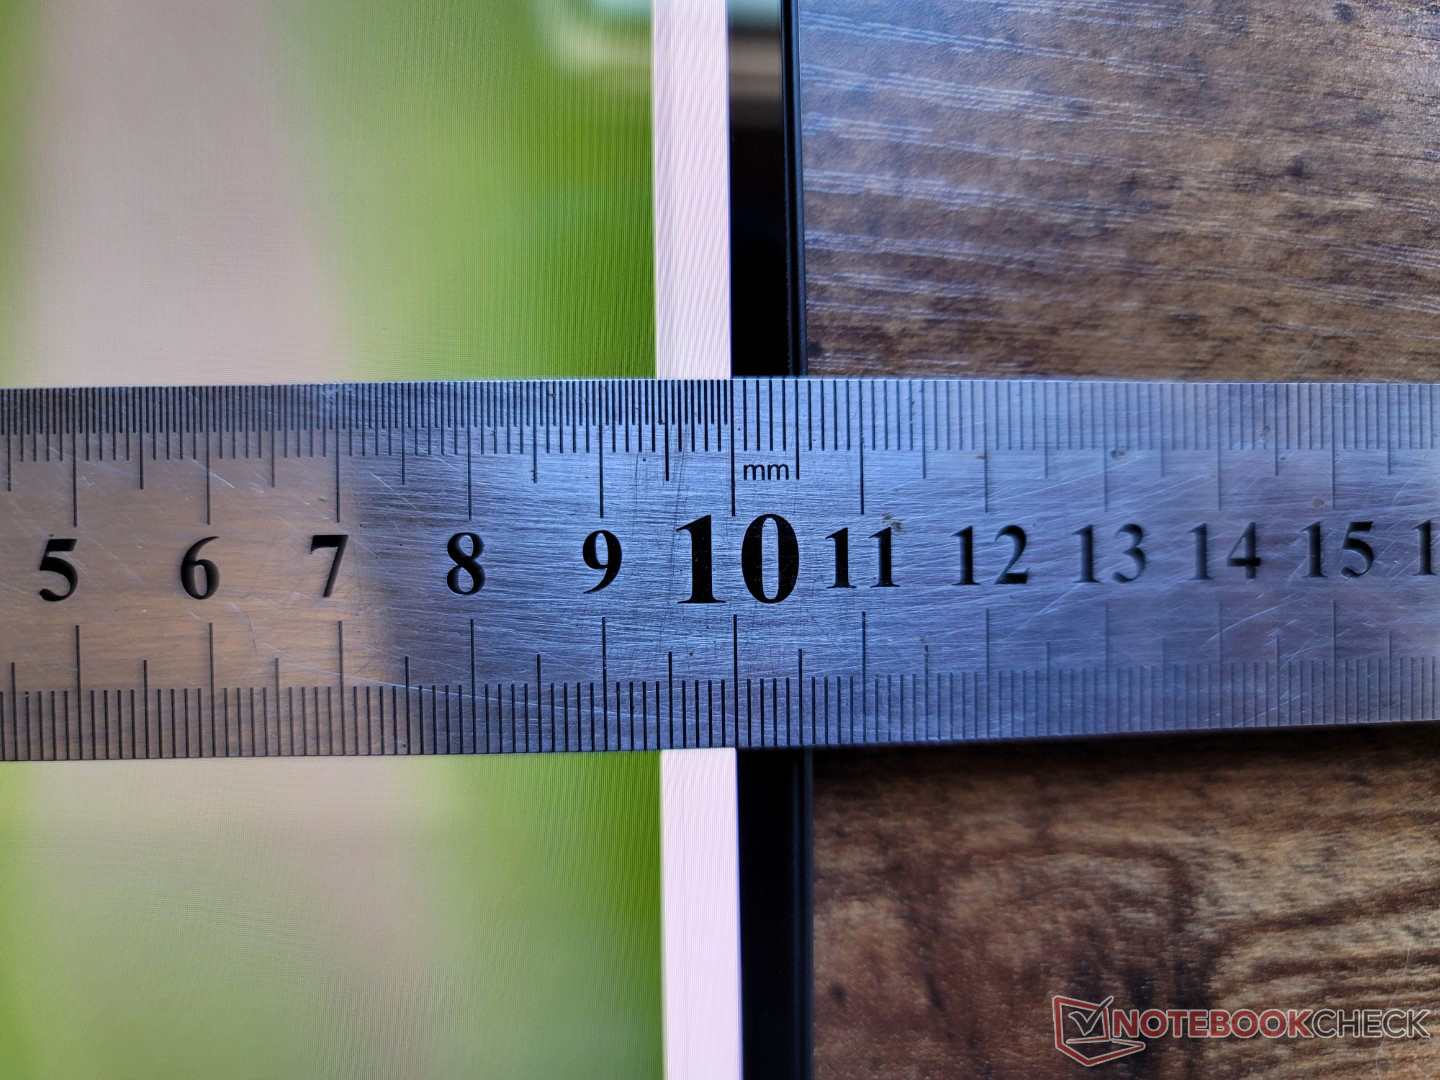
Precision 7670 är fortfarande relativt stor och tung trots att vår testenhet är en "Thin base"-version. Med en tjocklek på 24,7 mm är systemet tjockare än Asus ProArt StudioBook 16 och bara en hårsmån tunnare än HP ZBook Fury 15 G8. Det är också mycket tyngre med flera hundra gram vardera, delvis på grund av den större 16-tums 16:10-formfaktorn.
"Performance base" är cirka 3 mm tjockare och minst 70 g tyngre än "Thin base" beroende på konfiguration.
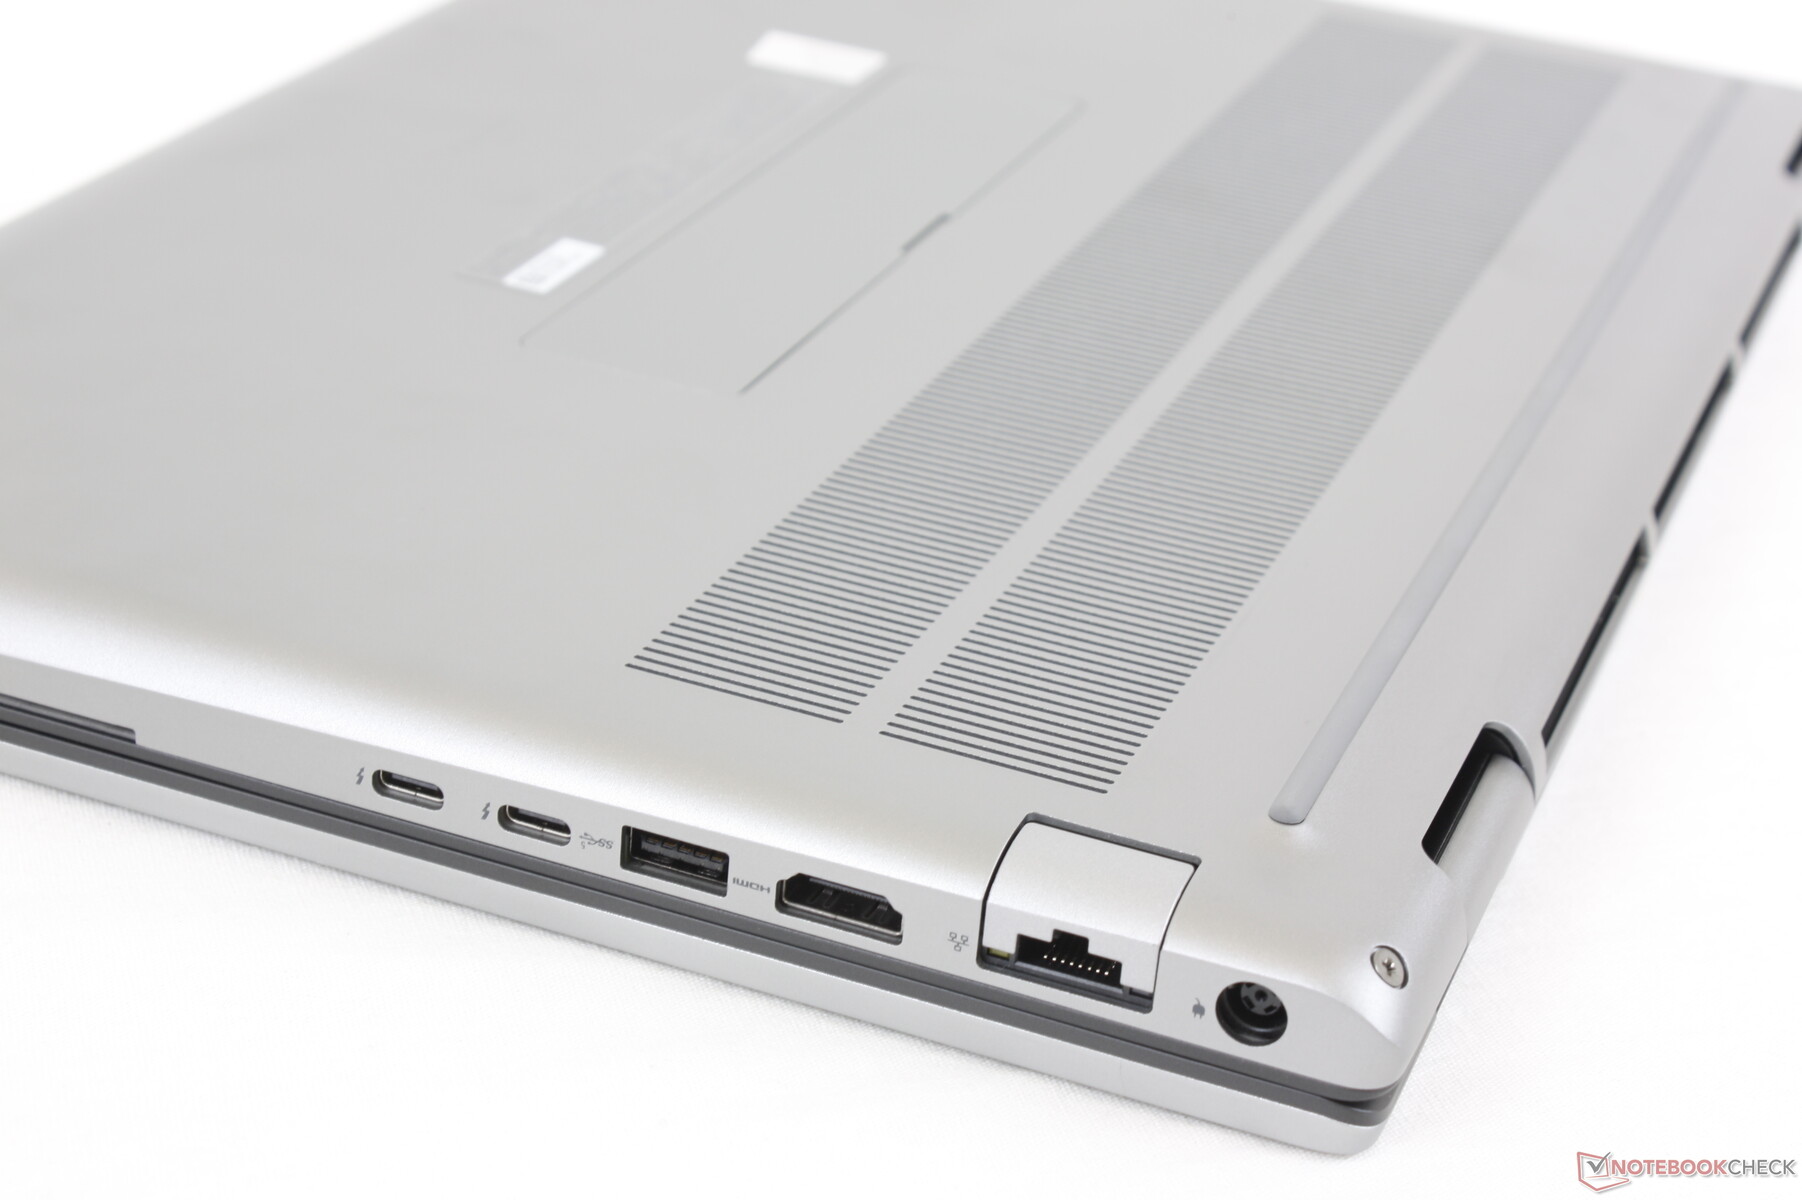
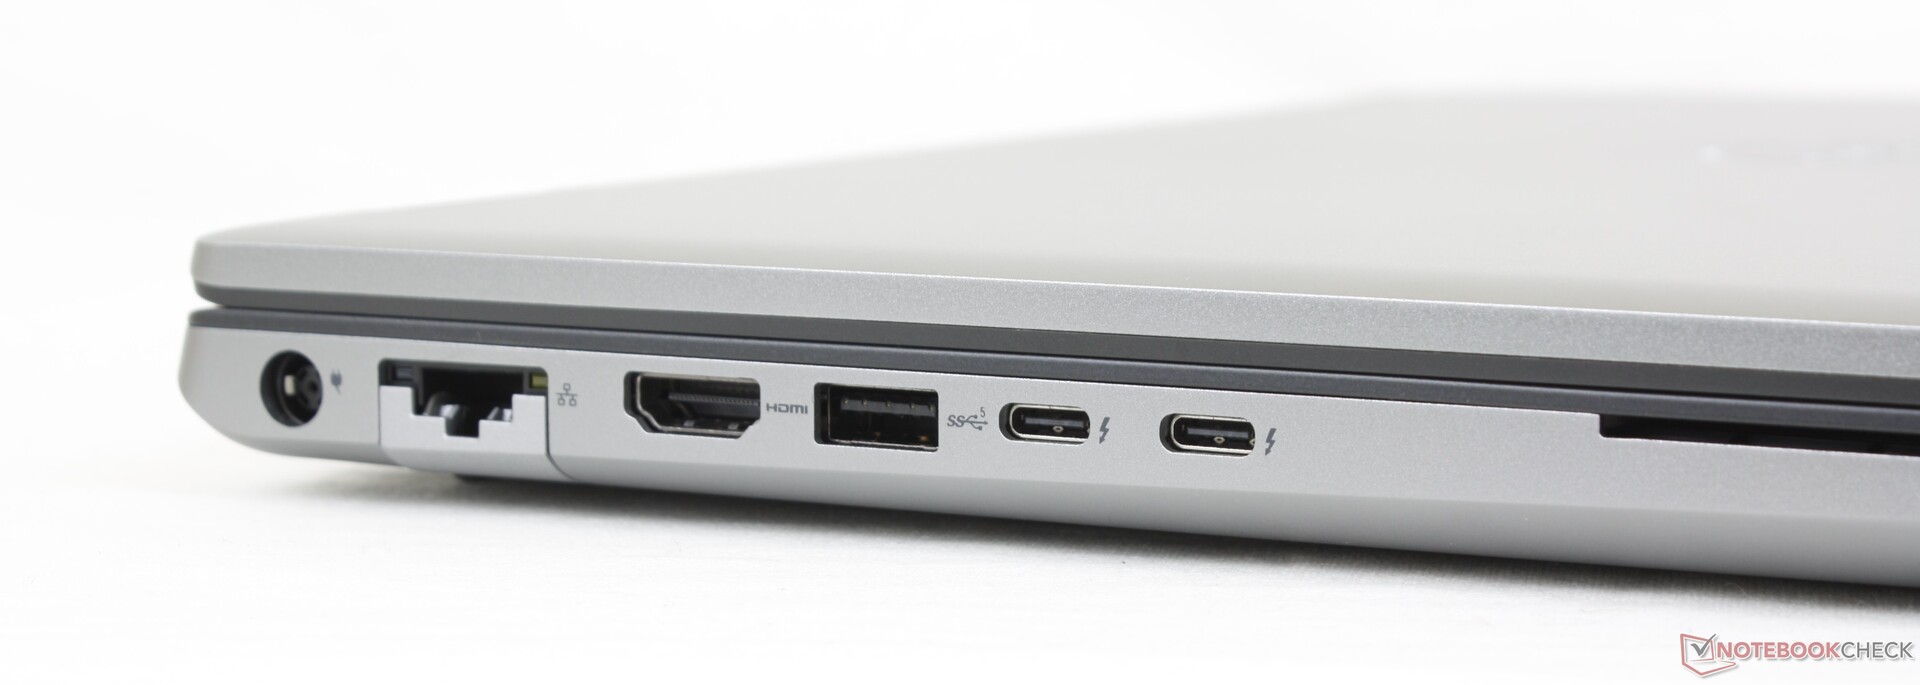
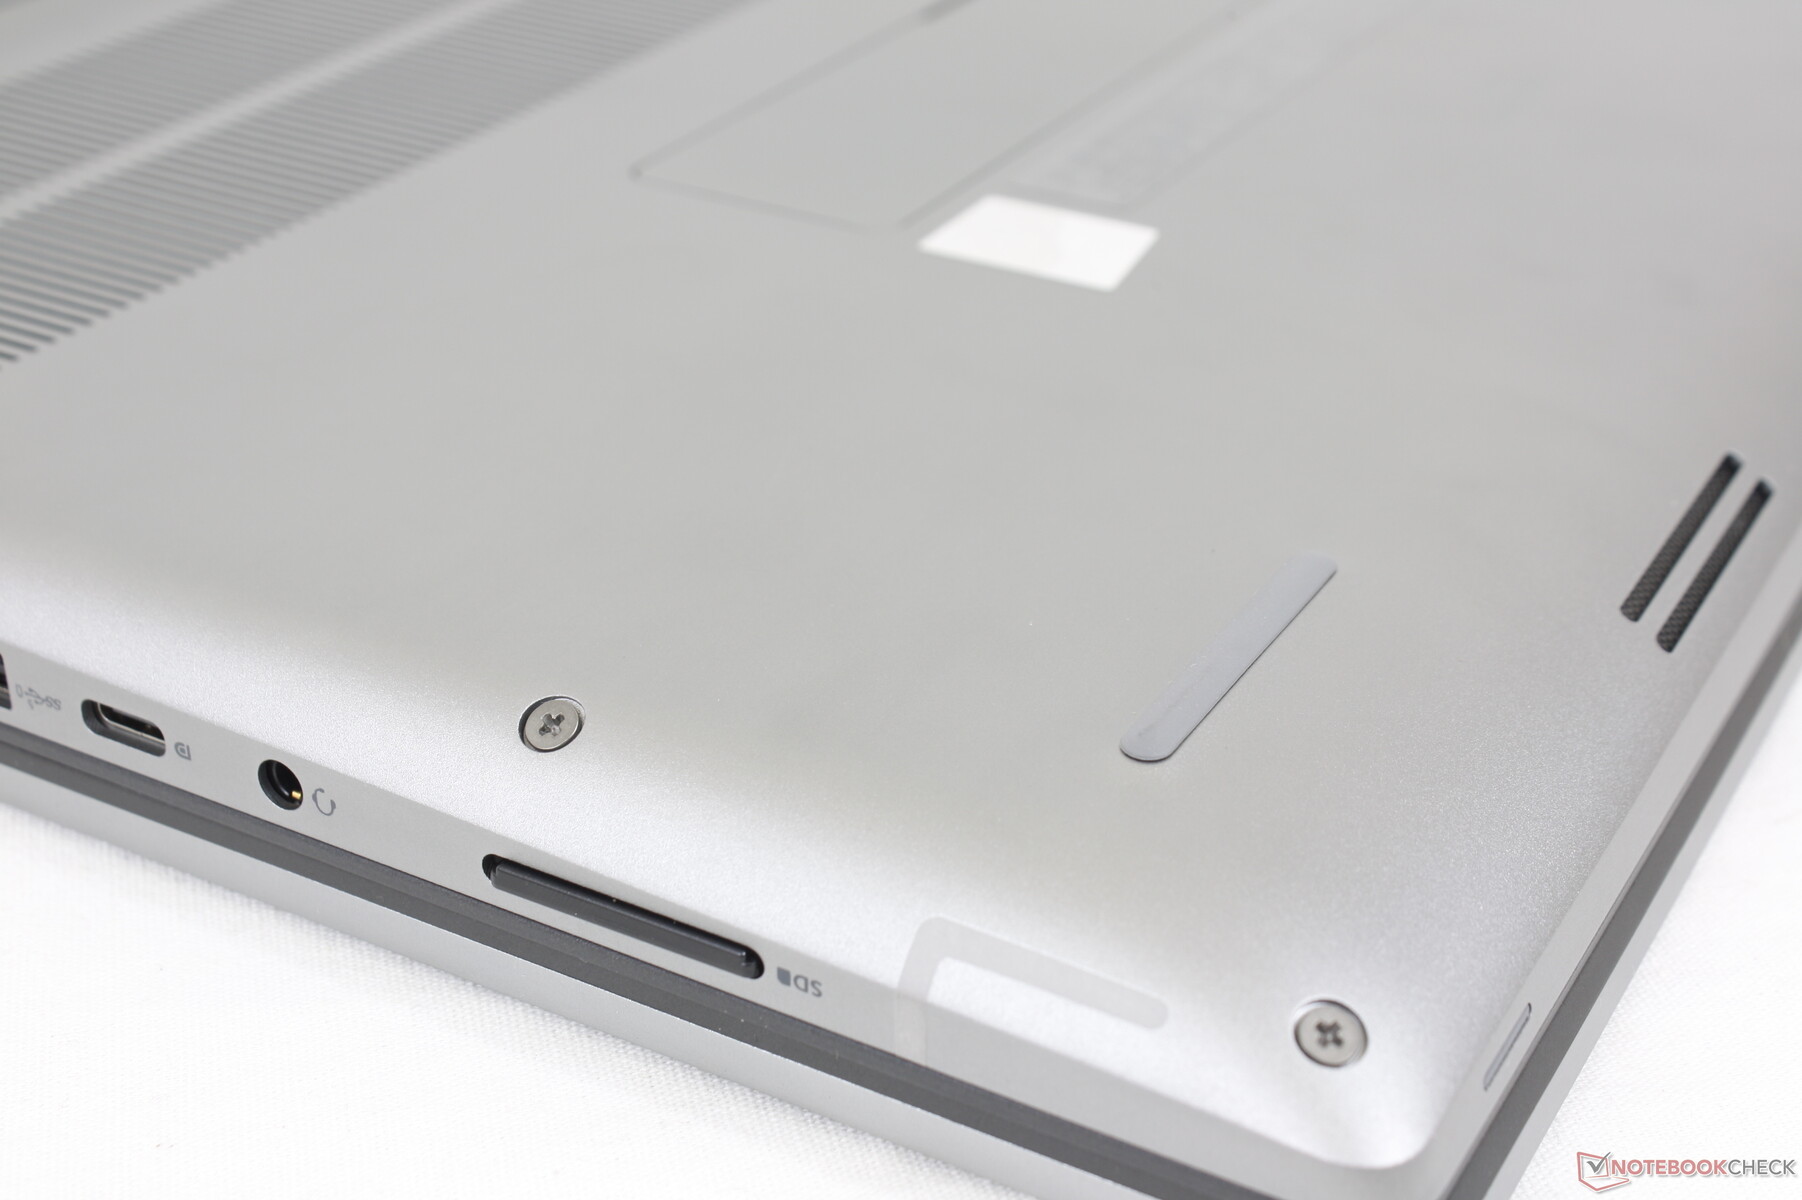
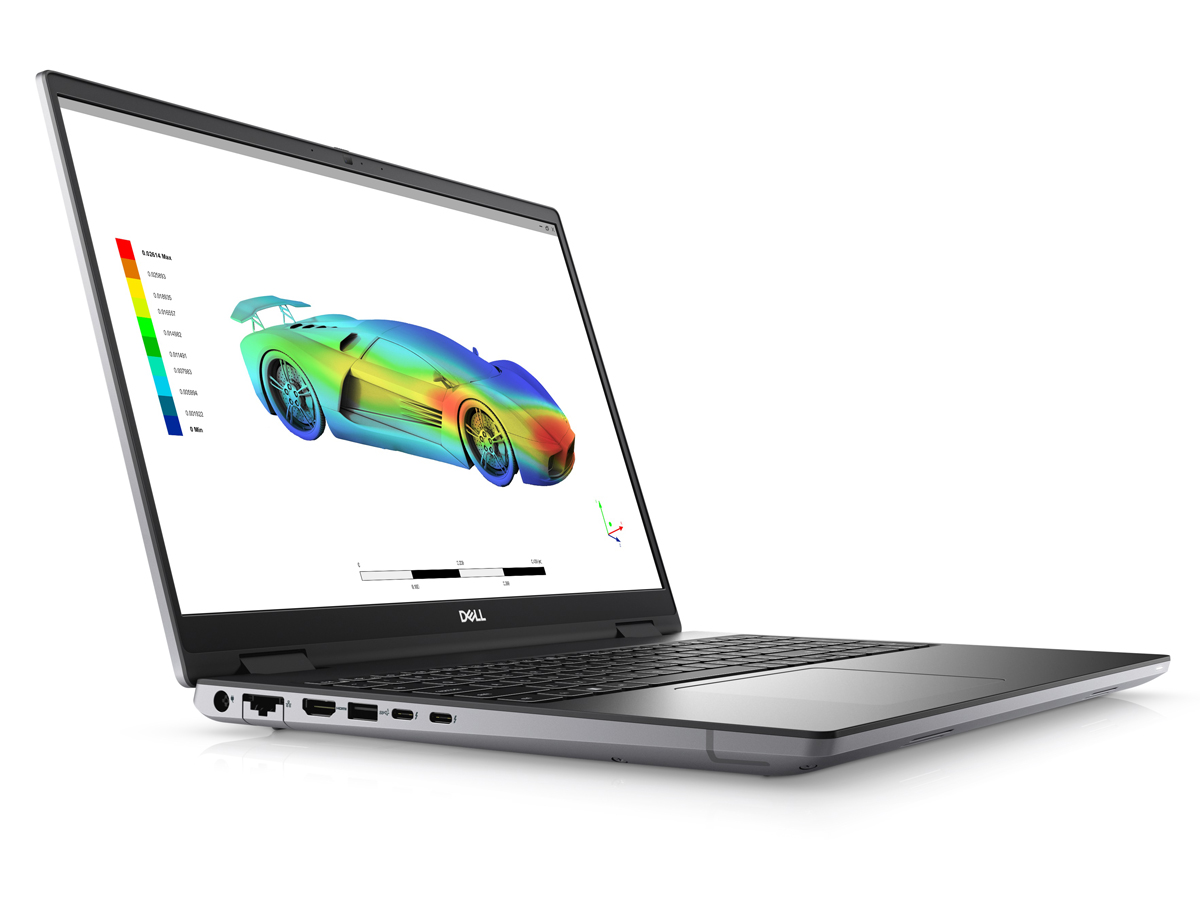
Anslutningar - Thunderbolt 4 men ingen PD-In
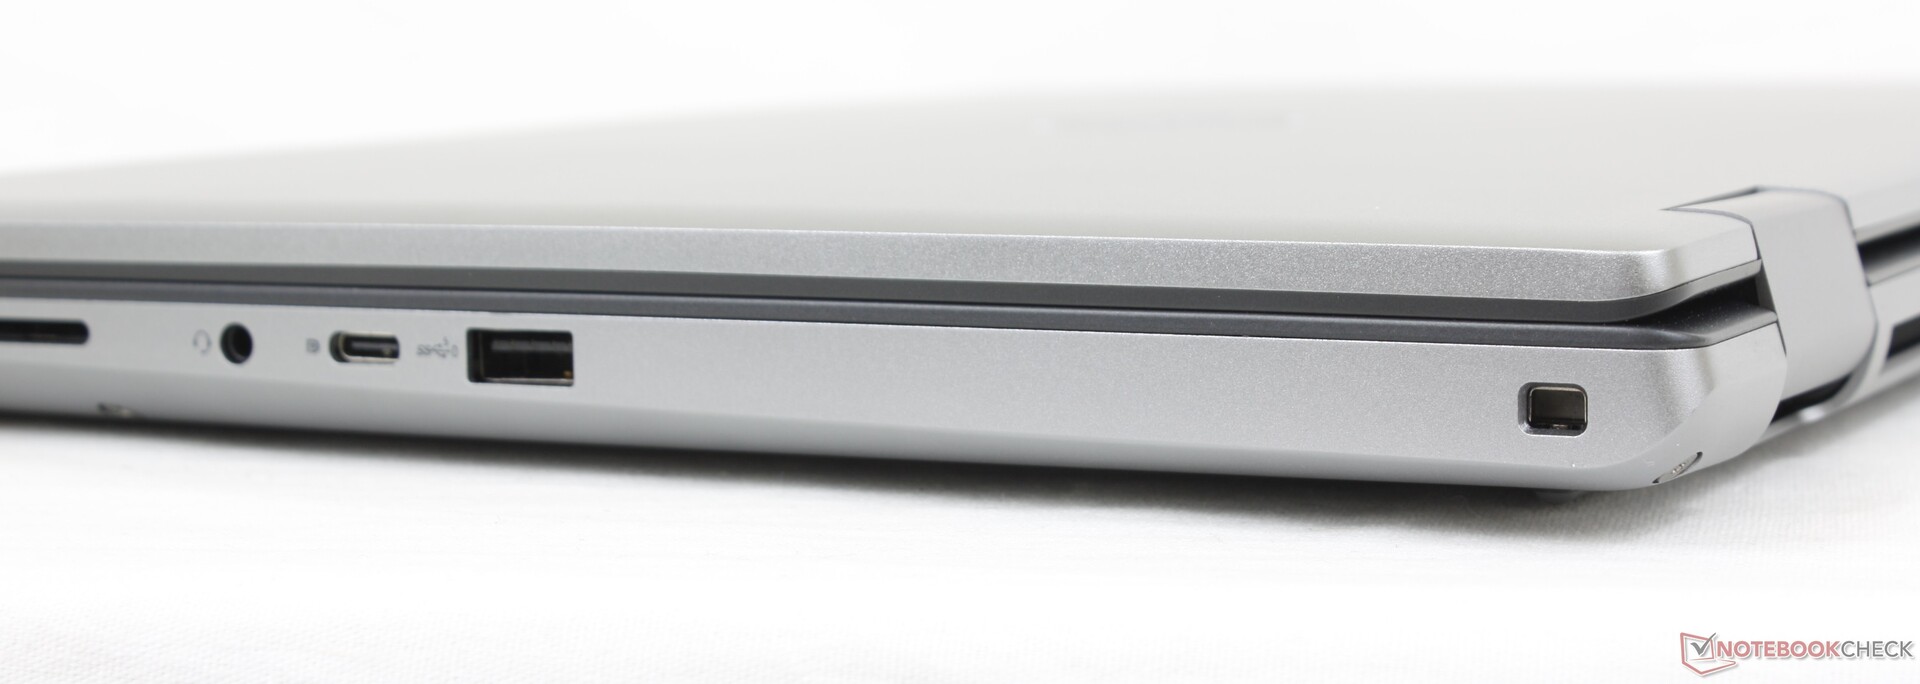
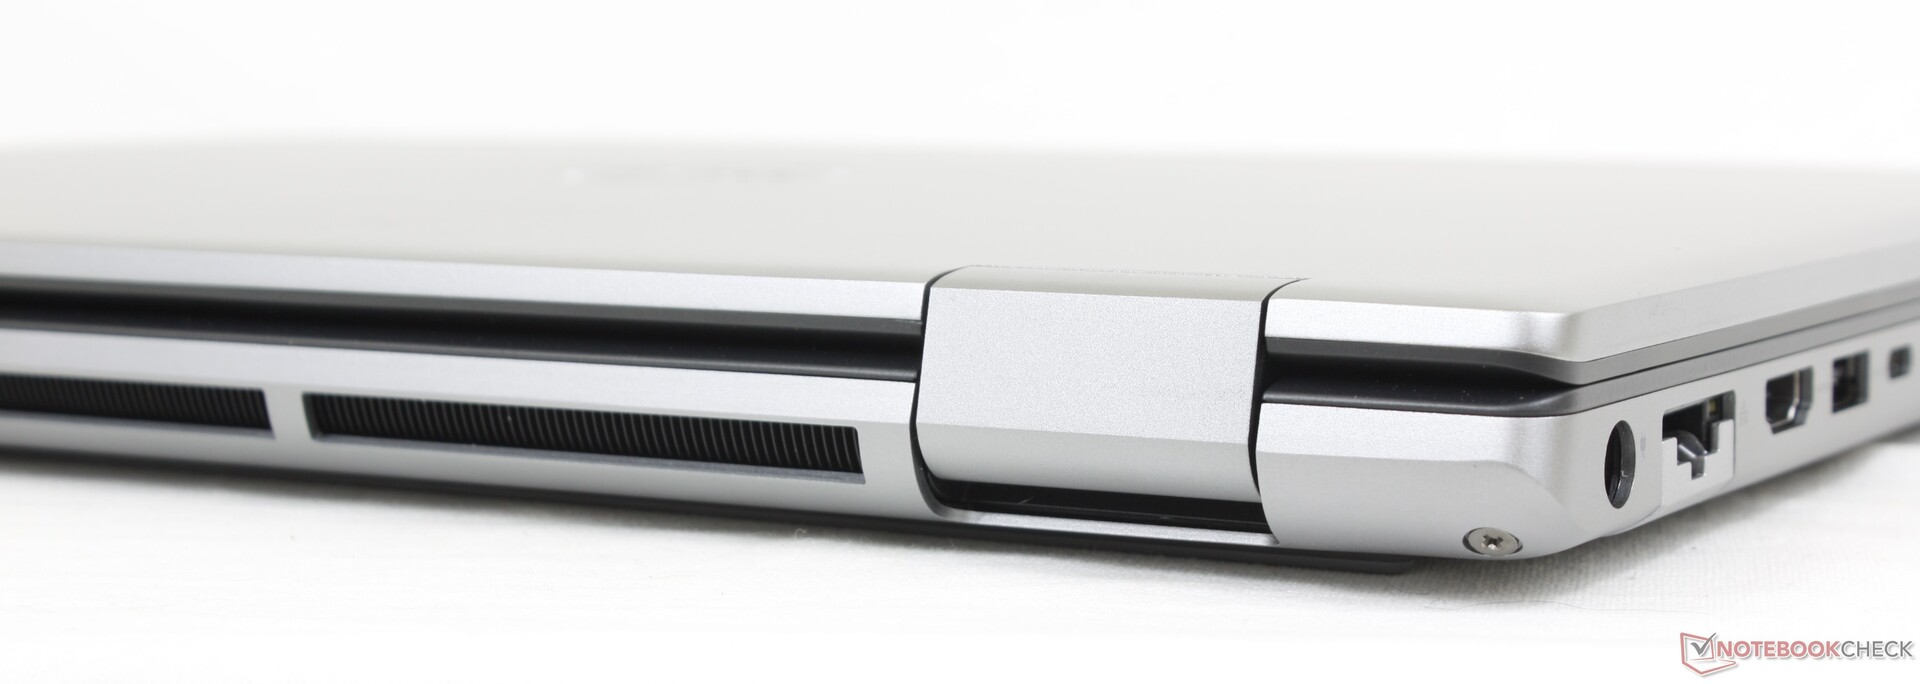
Portalternativen är utmärkta, särskilt eftersom det finns fler USB-portar än på de flesta andra arbetsstationer. Många av portarna ligger längs vänsterkanten medan portarna på högerkanten ligger ganska nära framsidan. Observera att RJ-45-porten endast stöder hastigheter på upp till 1 Gbps i stället för 10 Gbps.
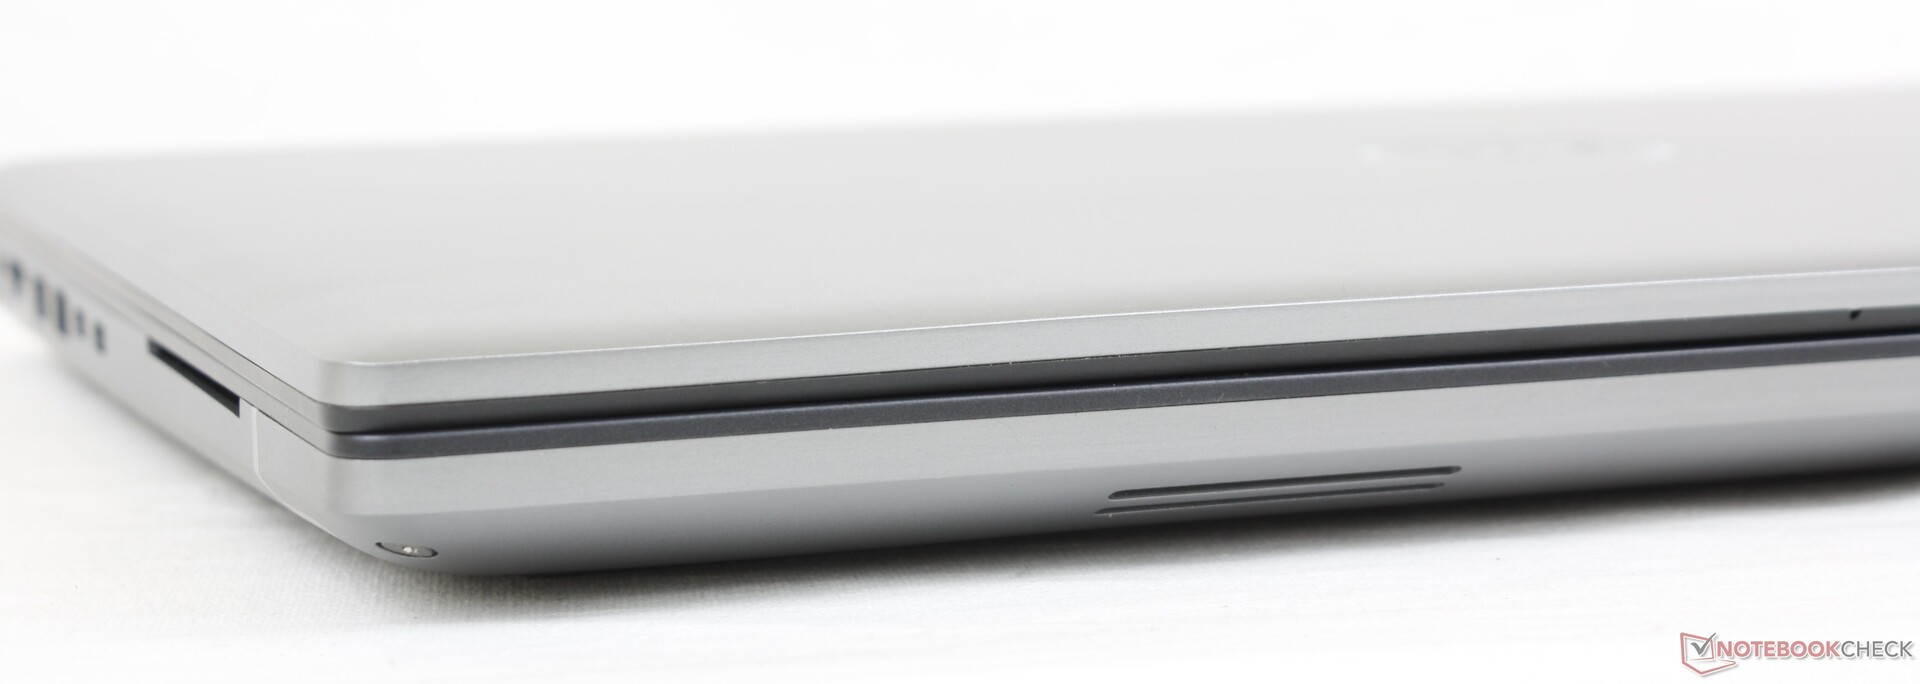
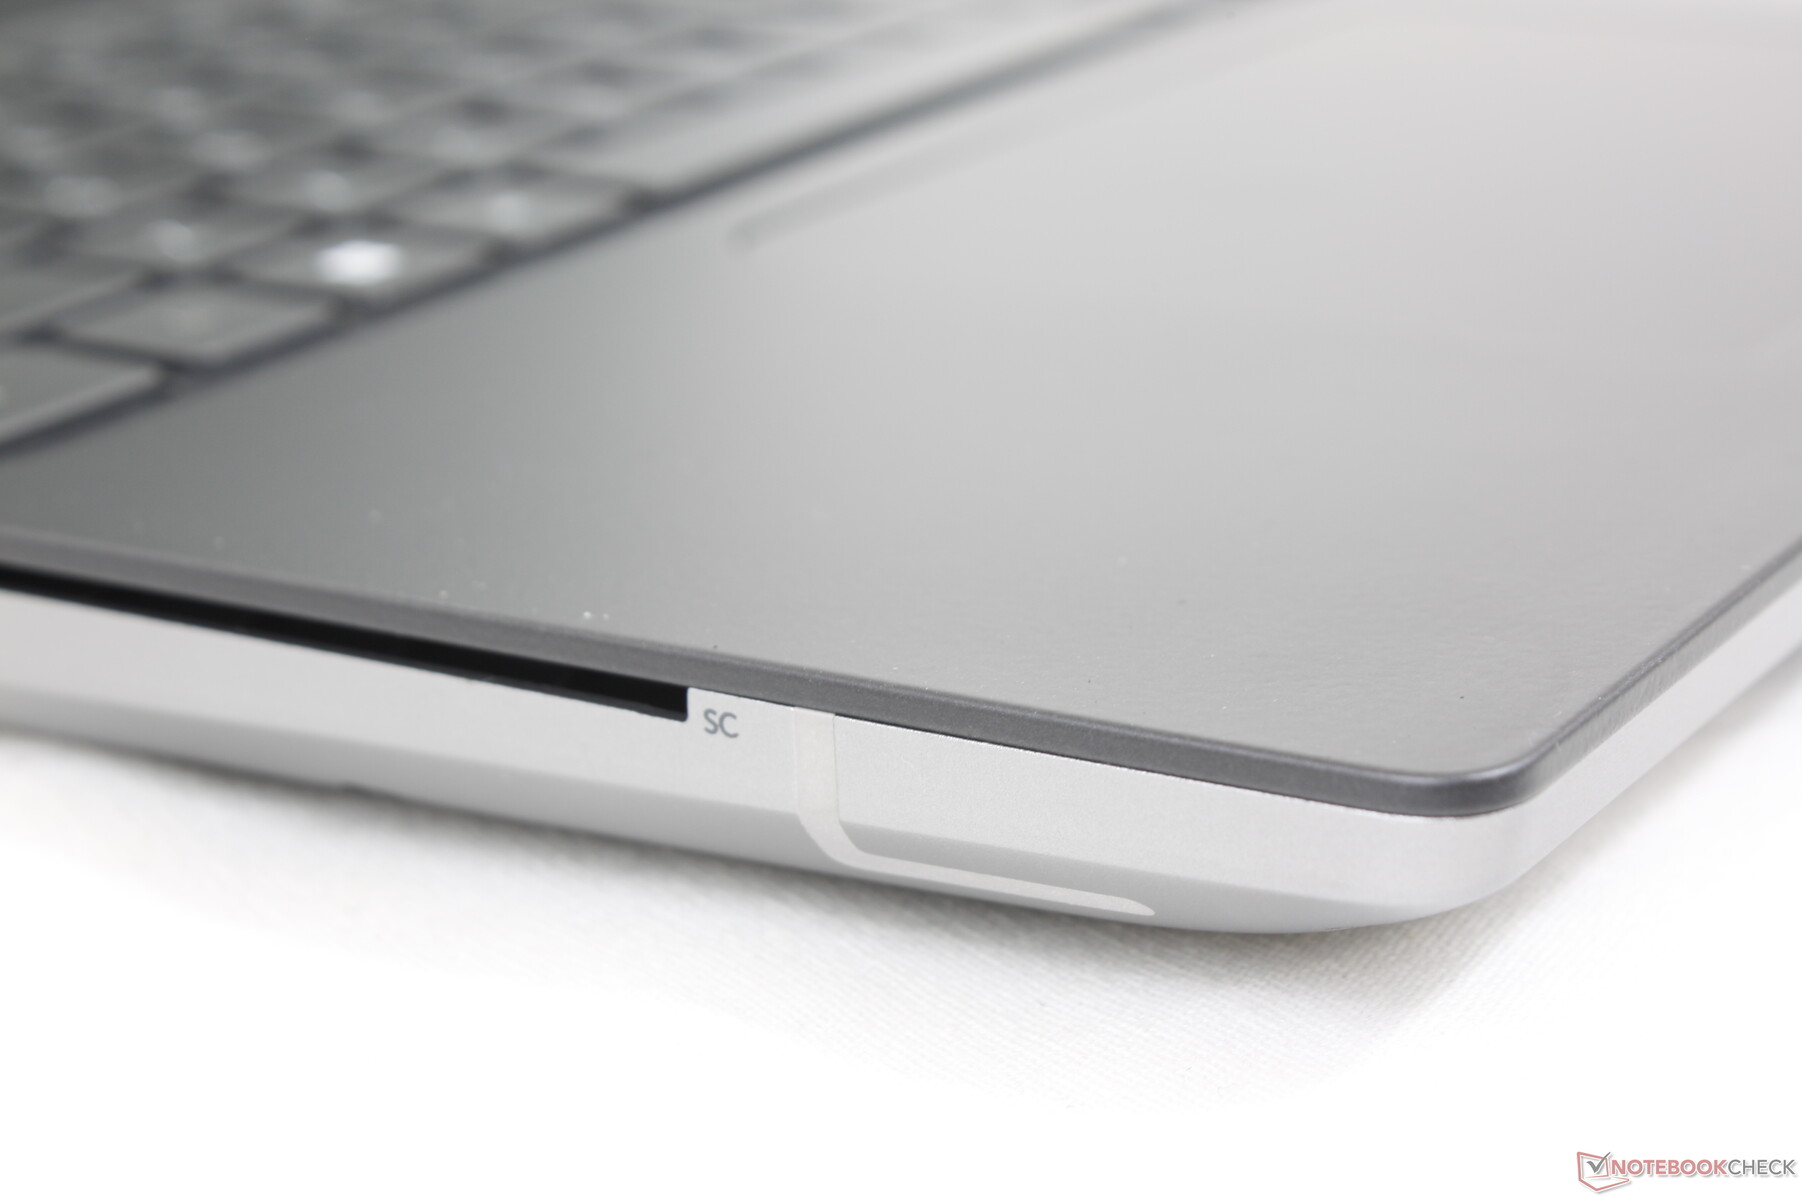
SD-kortläsare
Överföringshastigheten med den fjäderbelastade SD-läsaren är lika snabb som på Precision 7550 eller mer än dubbelt så snabb som på HP ZBook Fury G8. Att flytta 1 GB bilder från vårt UHS-II-kort till skrivbordet tar bara 5-6 sekunder.
| SD Card Reader | |
| average JPG Copy Test (av. of 3 runs) | |
| Lenovo ThinkPad P1 G4-20Y4Z9DVUS (Angelbird AV Pro V60) | |
| Dell Precision 5000 5560 (AV Pro V60) | |
| Dell Precision 7670 (Toshiba Exceria Pro SDXC 64 GB UHS-II) | |
| Dell Precision 7550 (Toshiba Exceria Pro SDXC 64 GB UHS-II) | |
| HP ZBook Fury 15 G8 (AV Pro V60) | |
| Asus ProArt StudioBook 16 W7600H5A-2BL2 (AV Pro SD microSD 128 GB V60) | |
| maximum AS SSD Seq Read Test (1GB) | |
| Dell Precision 5000 5560 (AV Pro V60) | |
| Dell Precision 7550 (Toshiba Exceria Pro SDXC 64 GB UHS-II) | |
| Dell Precision 7670 (Toshiba Exceria Pro SDXC 64 GB UHS-II) | |
| Lenovo ThinkPad P1 G4-20Y4Z9DVUS (Angelbird AV Pro V60) | |
| HP ZBook Fury 15 G8 (AV Pro V60) | |
| Asus ProArt StudioBook 16 W7600H5A-2BL2 (AV Pro SD microSD 128 GB V60) | |
Kommunikation
En Intel AX211 är standard för Wi-Fi 6E-anslutning och Bluetooth som tillval. Tyvärr är Wi-Fi 6E inte nödvändigtvis snabbare än Wi-Fi 6 i många situationer. Överföringshastigheterna verkar variera mycket mer på vår Precision 7670 jämfört med de flesta andra arbetsstationer, även när de bara är en till två meter från vår 6 GHz-åtkomstpunkt.
| Networking | |
| iperf3 transmit AX12 | |
| Lenovo ThinkPad P1 G4-20Y4Z9DVUS | |
| HP ZBook Fury 15 G8 | |
| Dell Precision 7550 | |
| Dell Precision 5000 5560 | |
| Asus ProArt StudioBook 16 W7600H5A-2BL2 | |
| iperf3 receive AX12 | |
| Dell Precision 5000 5560 | |
| Lenovo ThinkPad P1 G4-20Y4Z9DVUS | |
| Dell Precision 7550 | |
| HP ZBook Fury 15 G8 | |
| Asus ProArt StudioBook 16 W7600H5A-2BL2 | |
| iperf3 receive AXE11000 6GHz | |
| Dell Precision 7670 | |
| iperf3 transmit AXE11000 6GHz | |
| Dell Precision 7670 | |
Webbkamera
Webbkameran med 2 MP är en uppgradering från webbkamerorna med 1 MP på de flesta XPS-system. Den är dock fortfarande svag i jämförelse med de 5 MP-kameror som finns på de flesta av HP:s nyaste bärbara datorer
Både IR och en slutare ingår för Windows Hello-stöd respektive integritet.


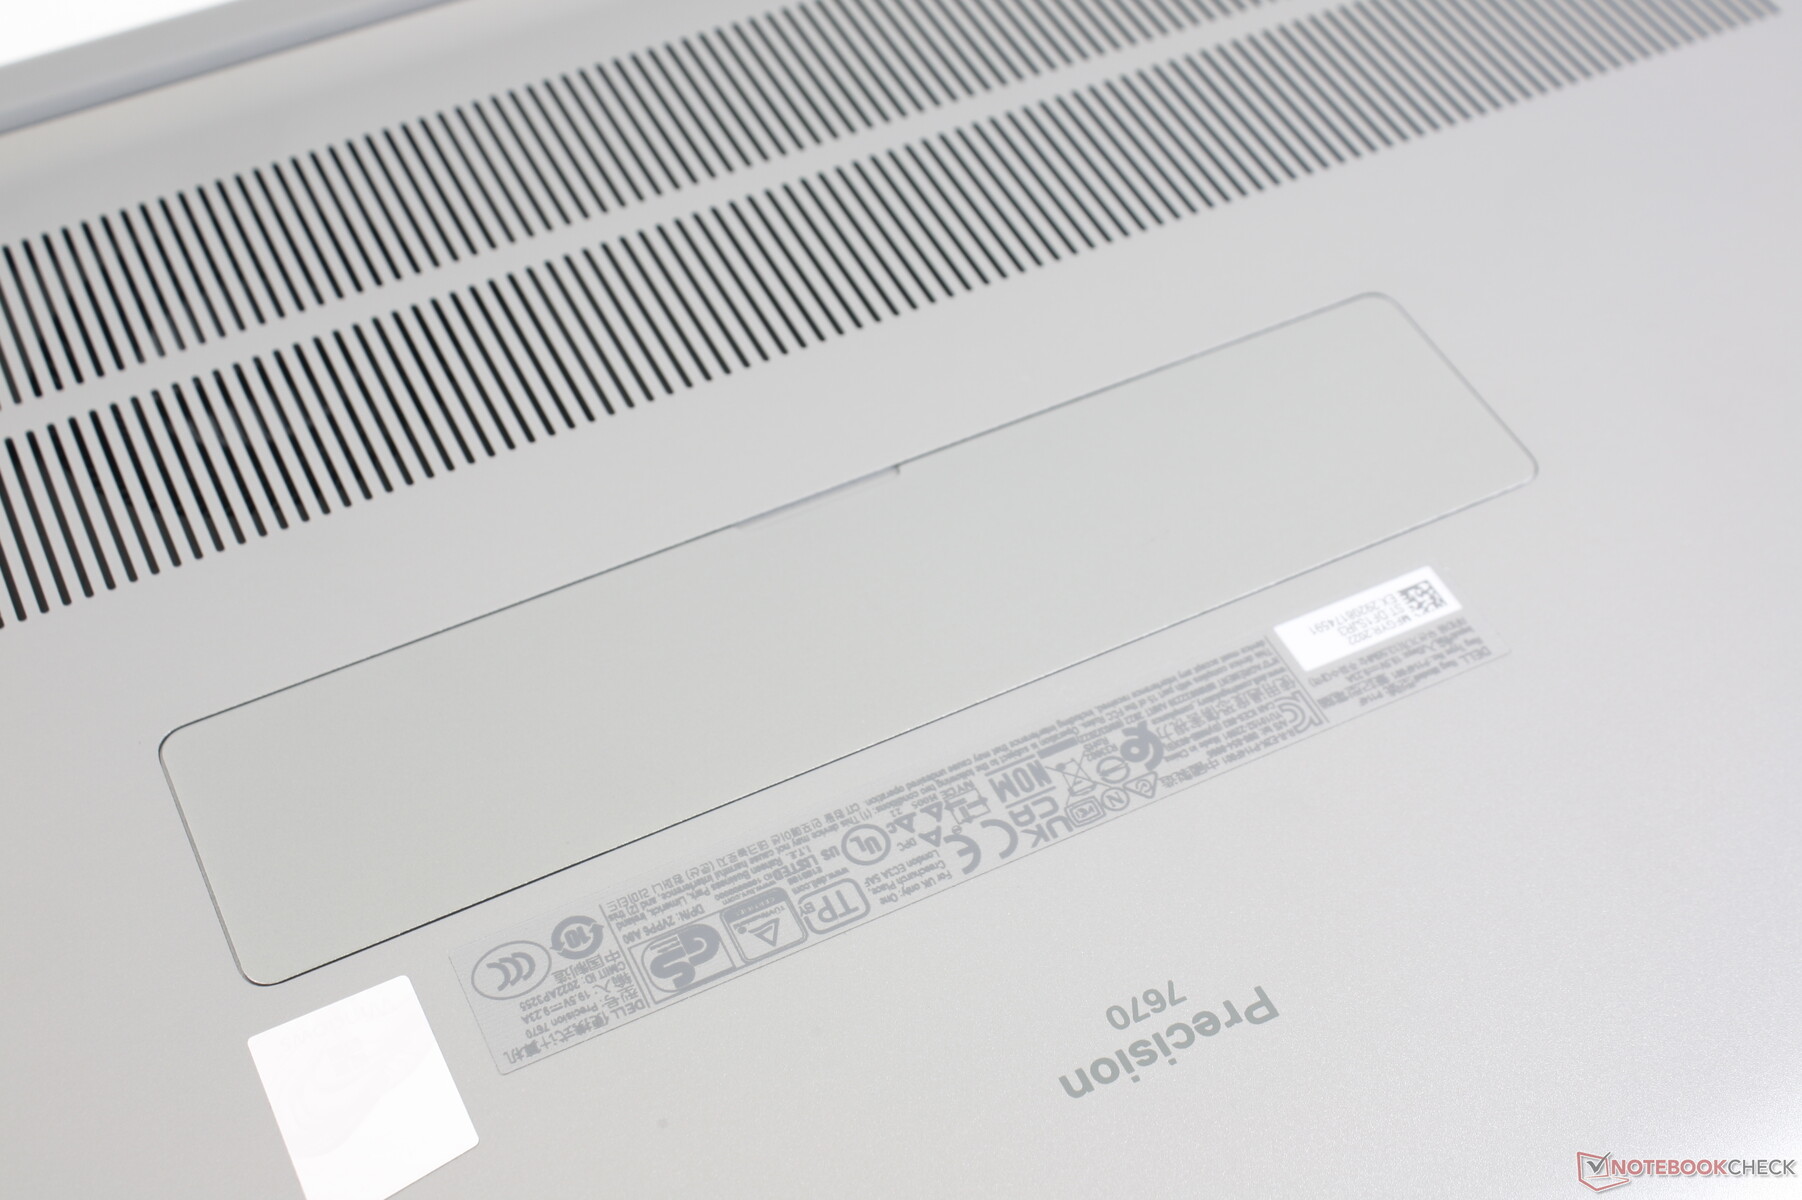
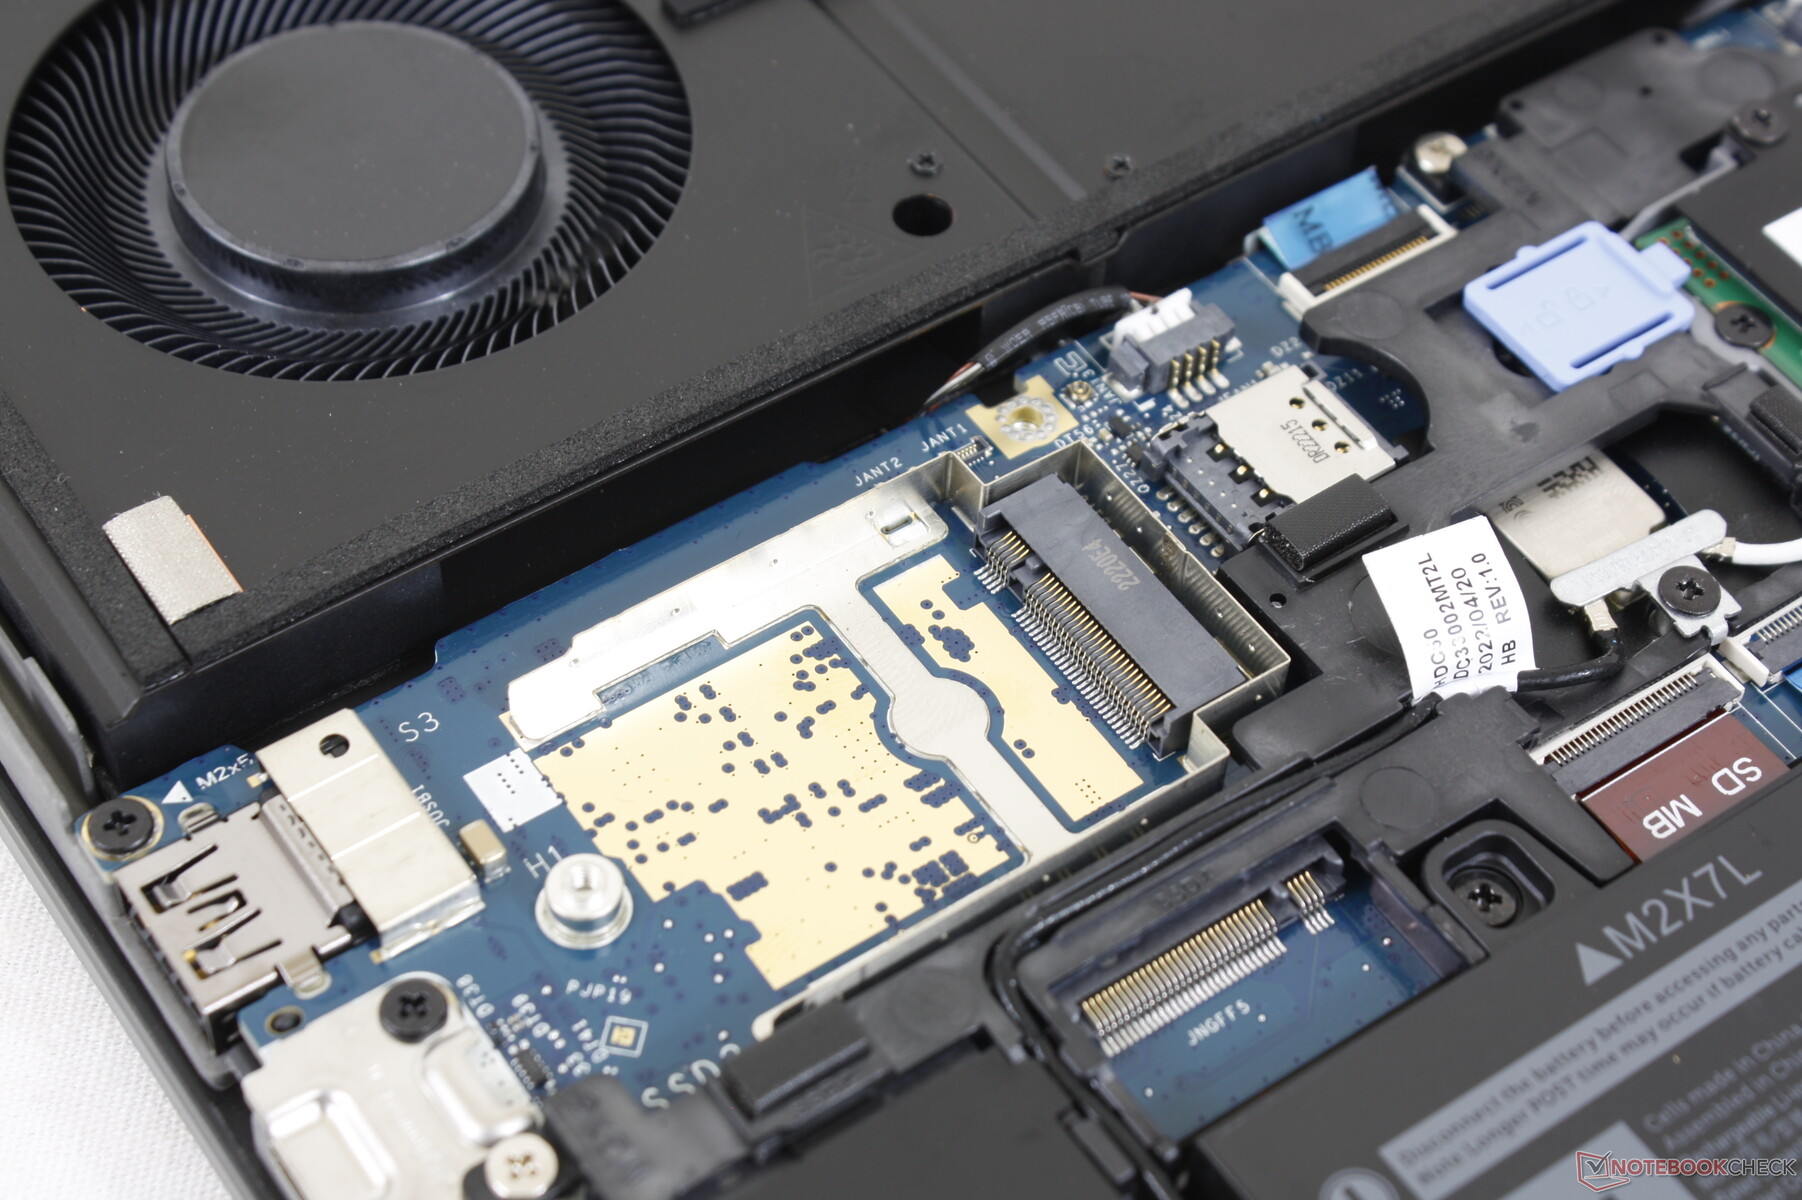
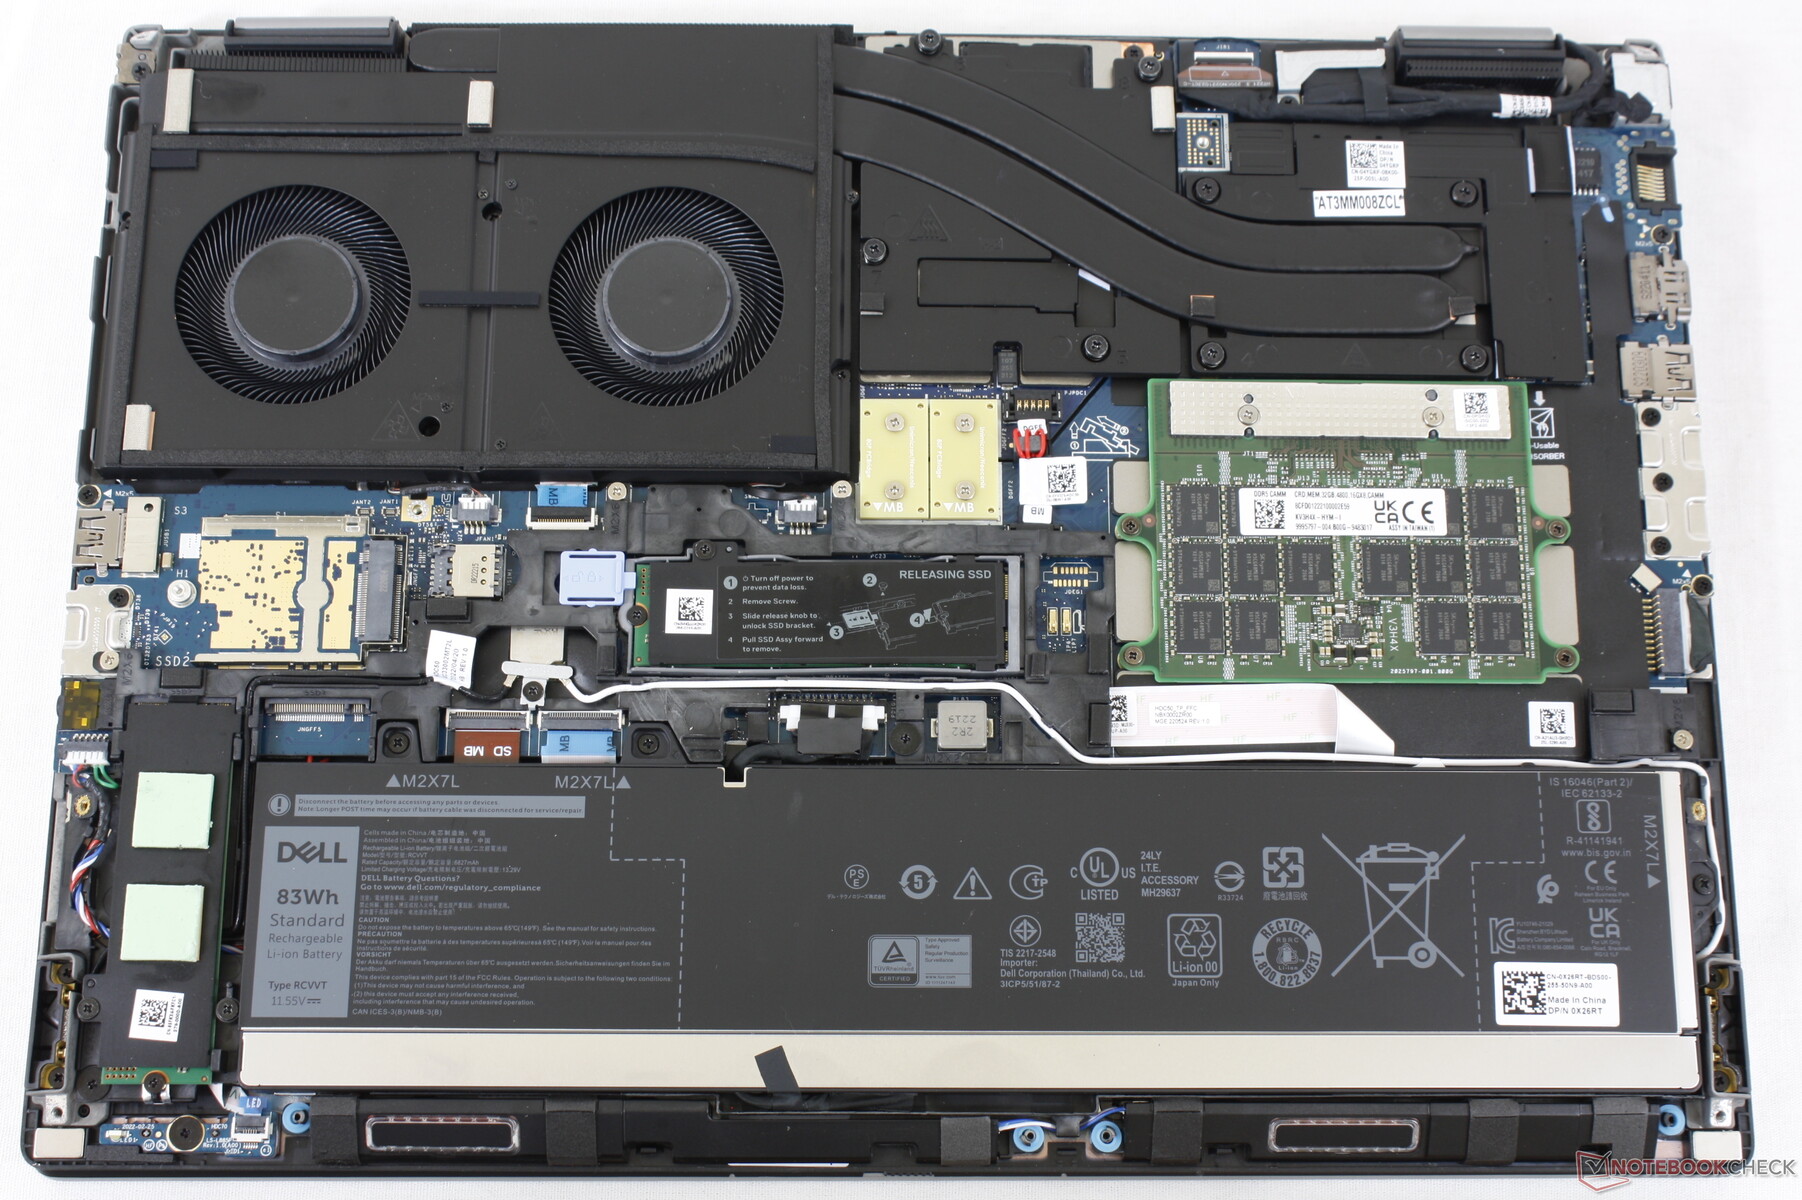
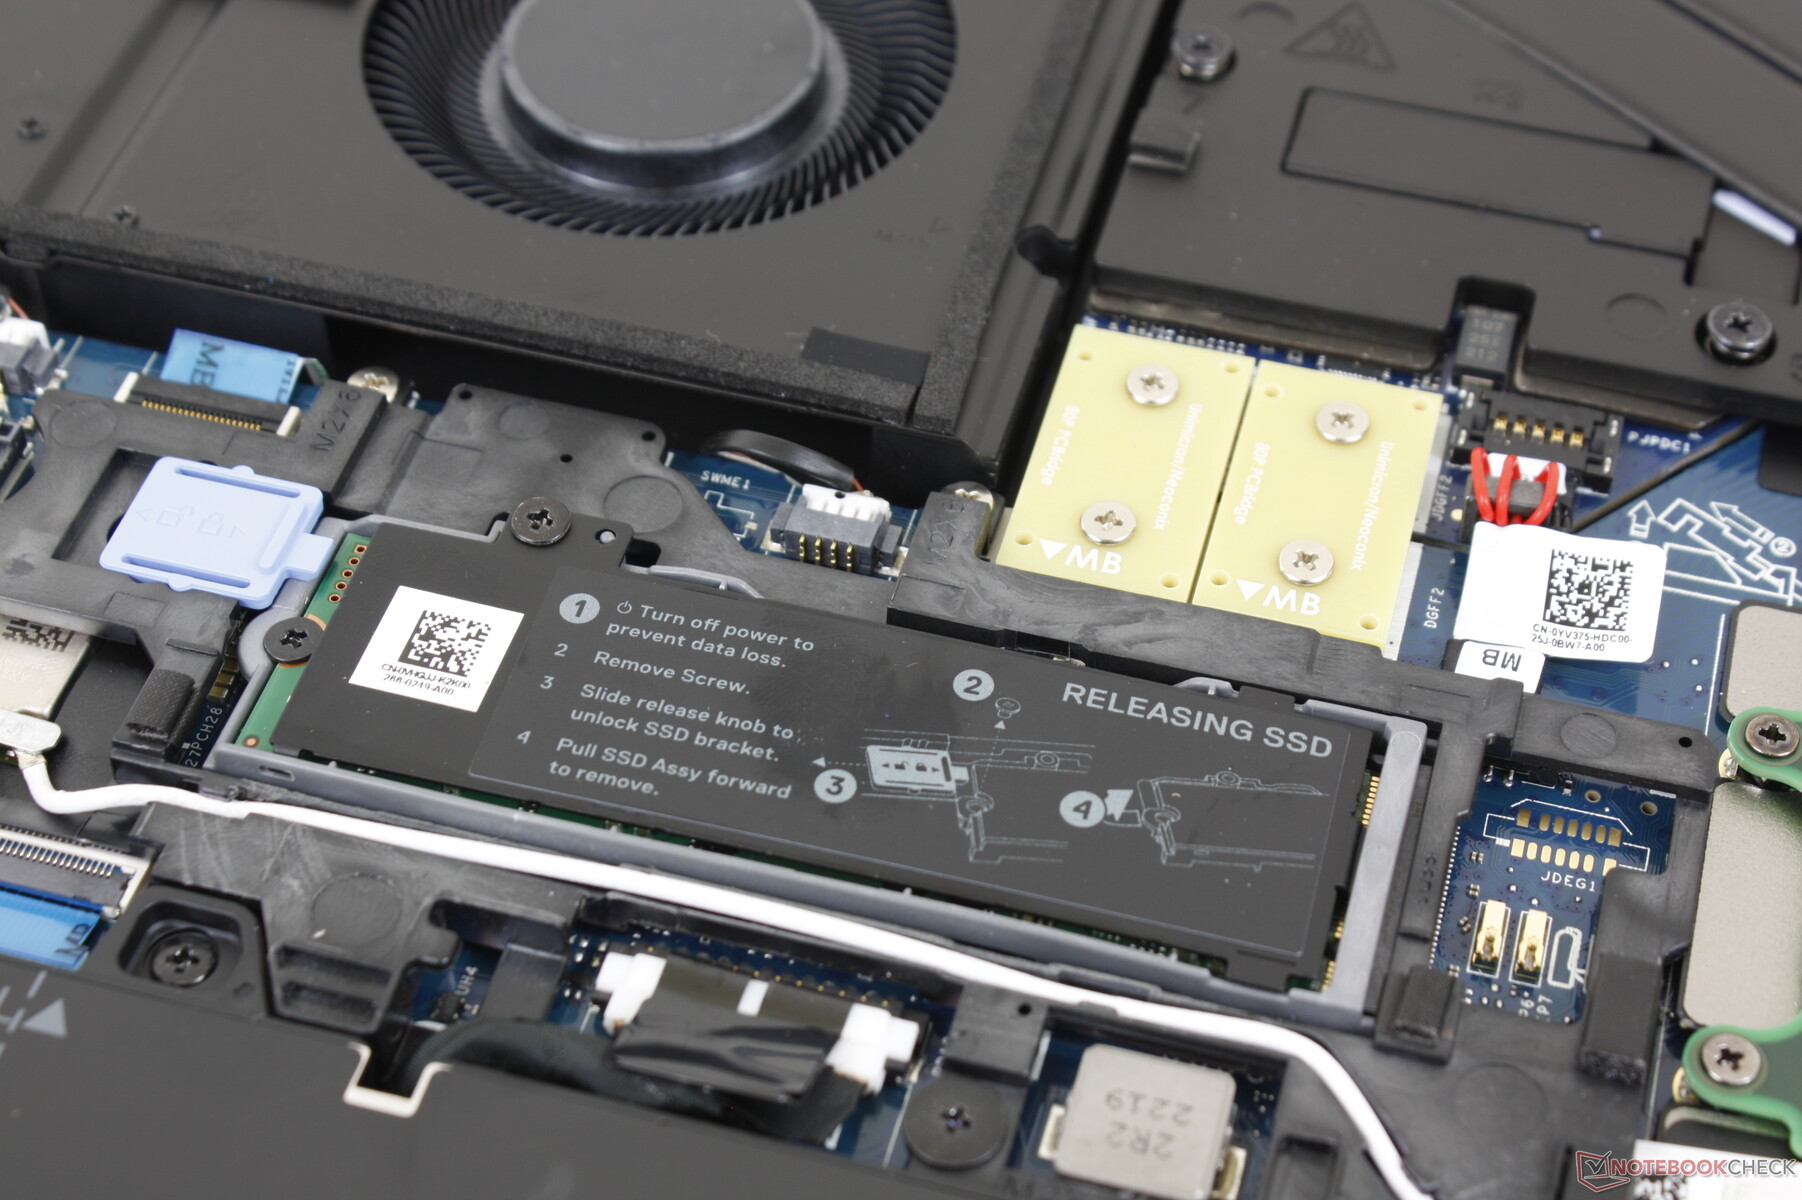
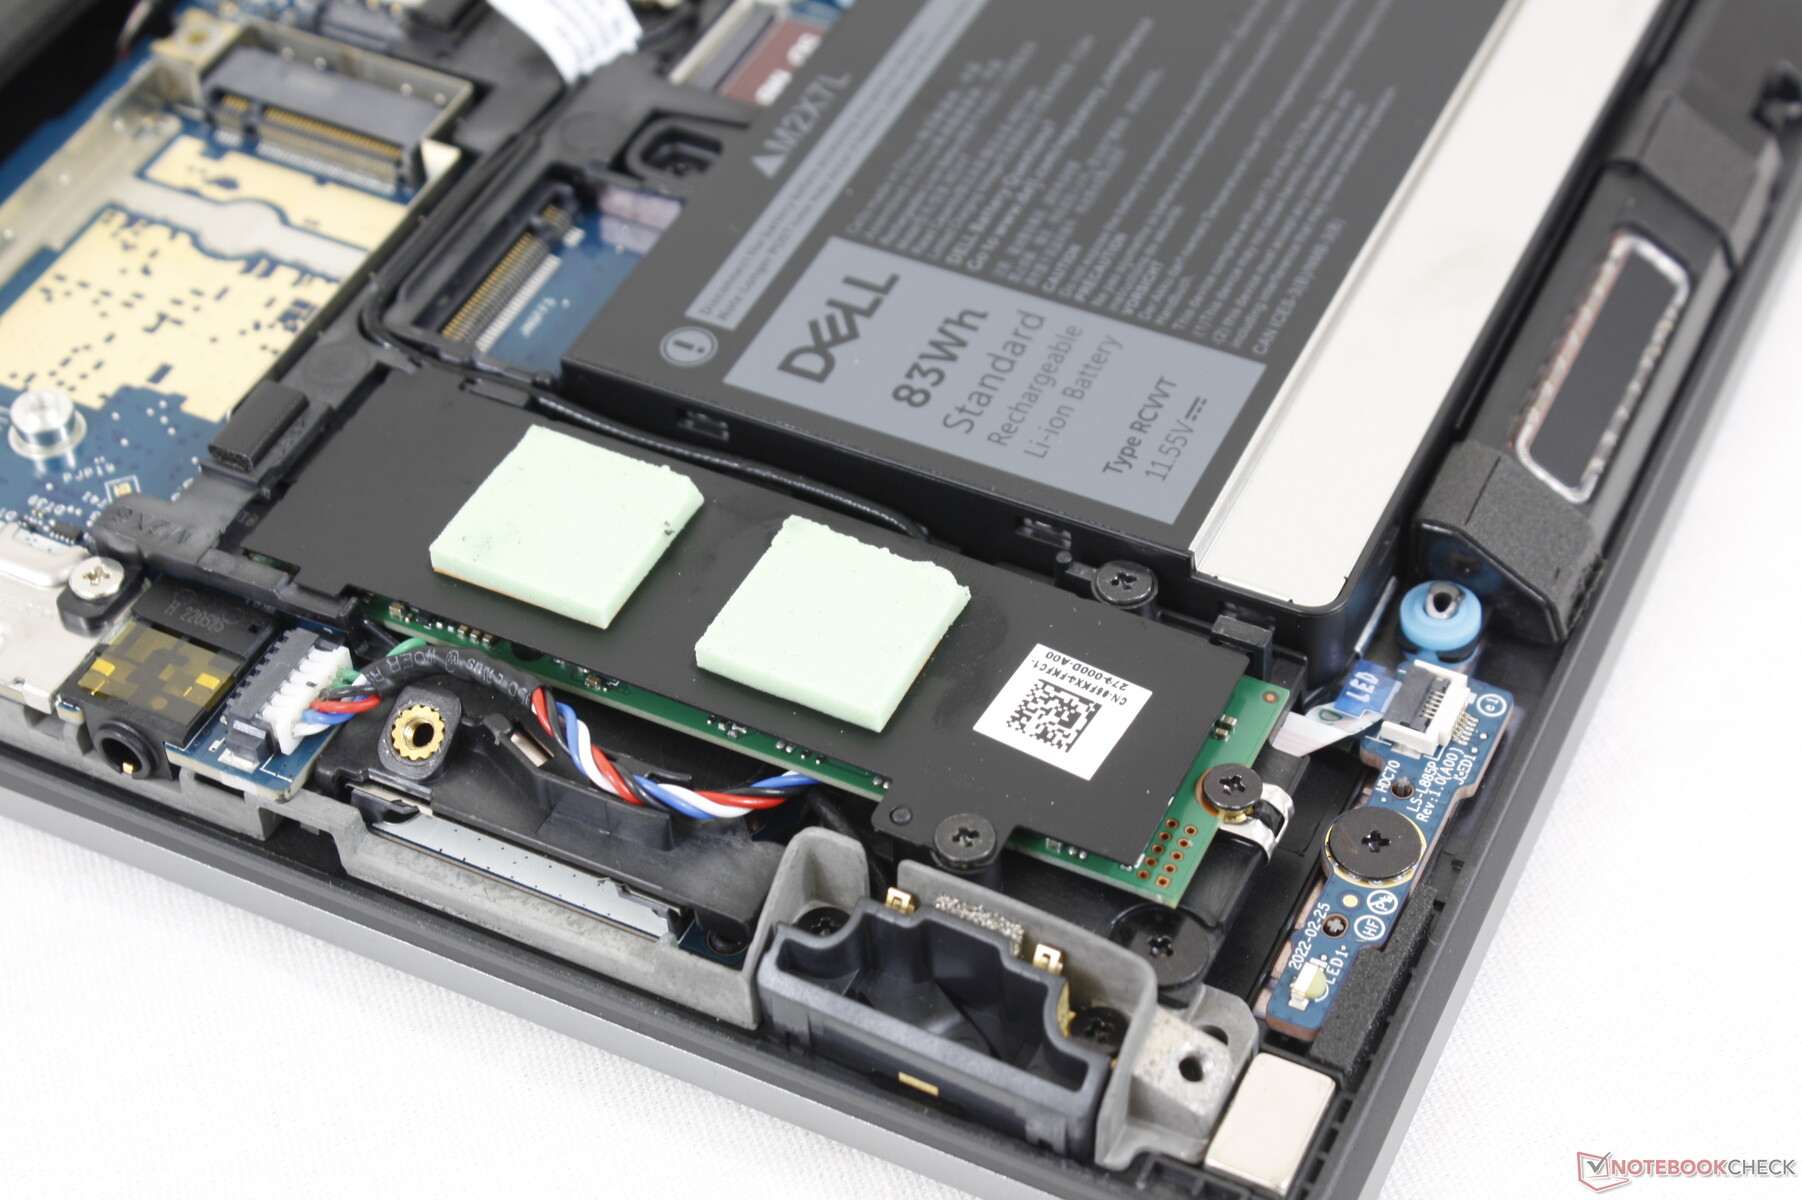
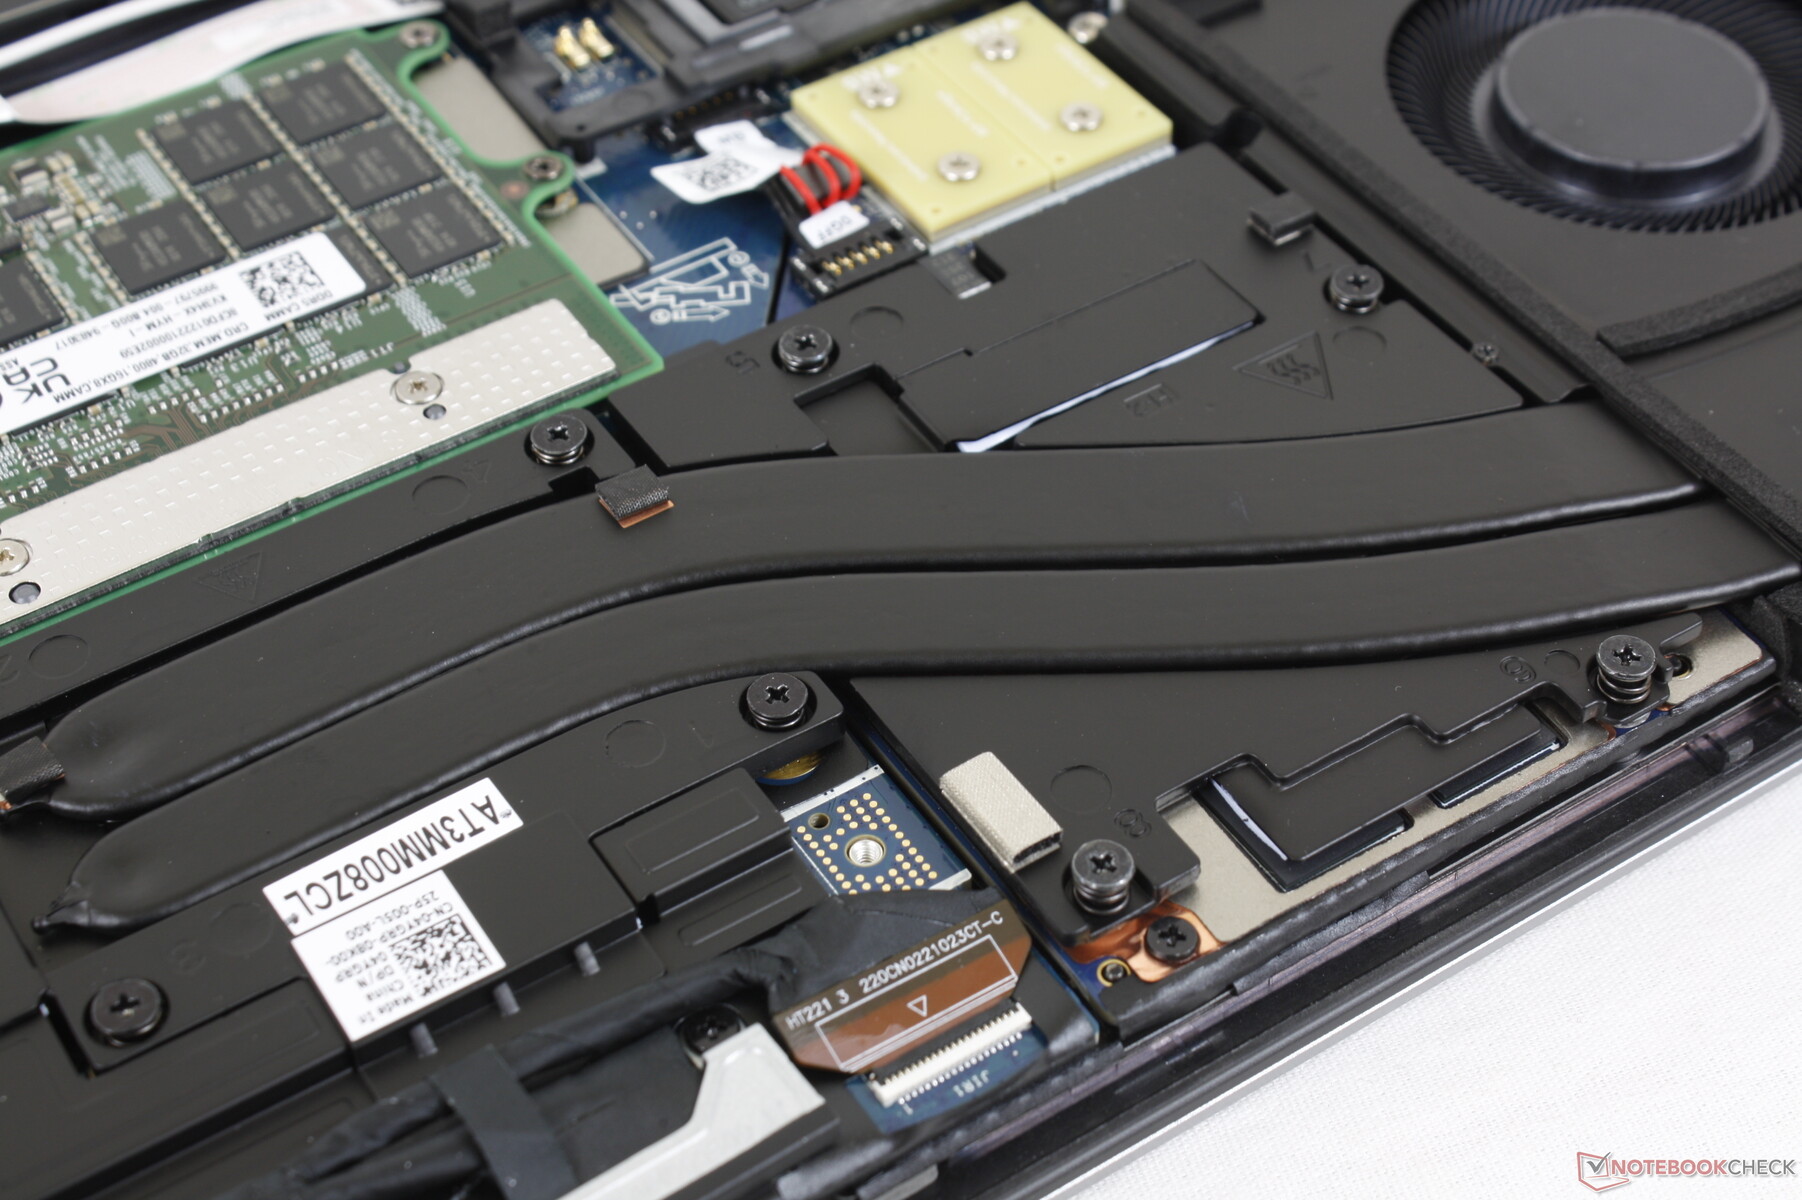
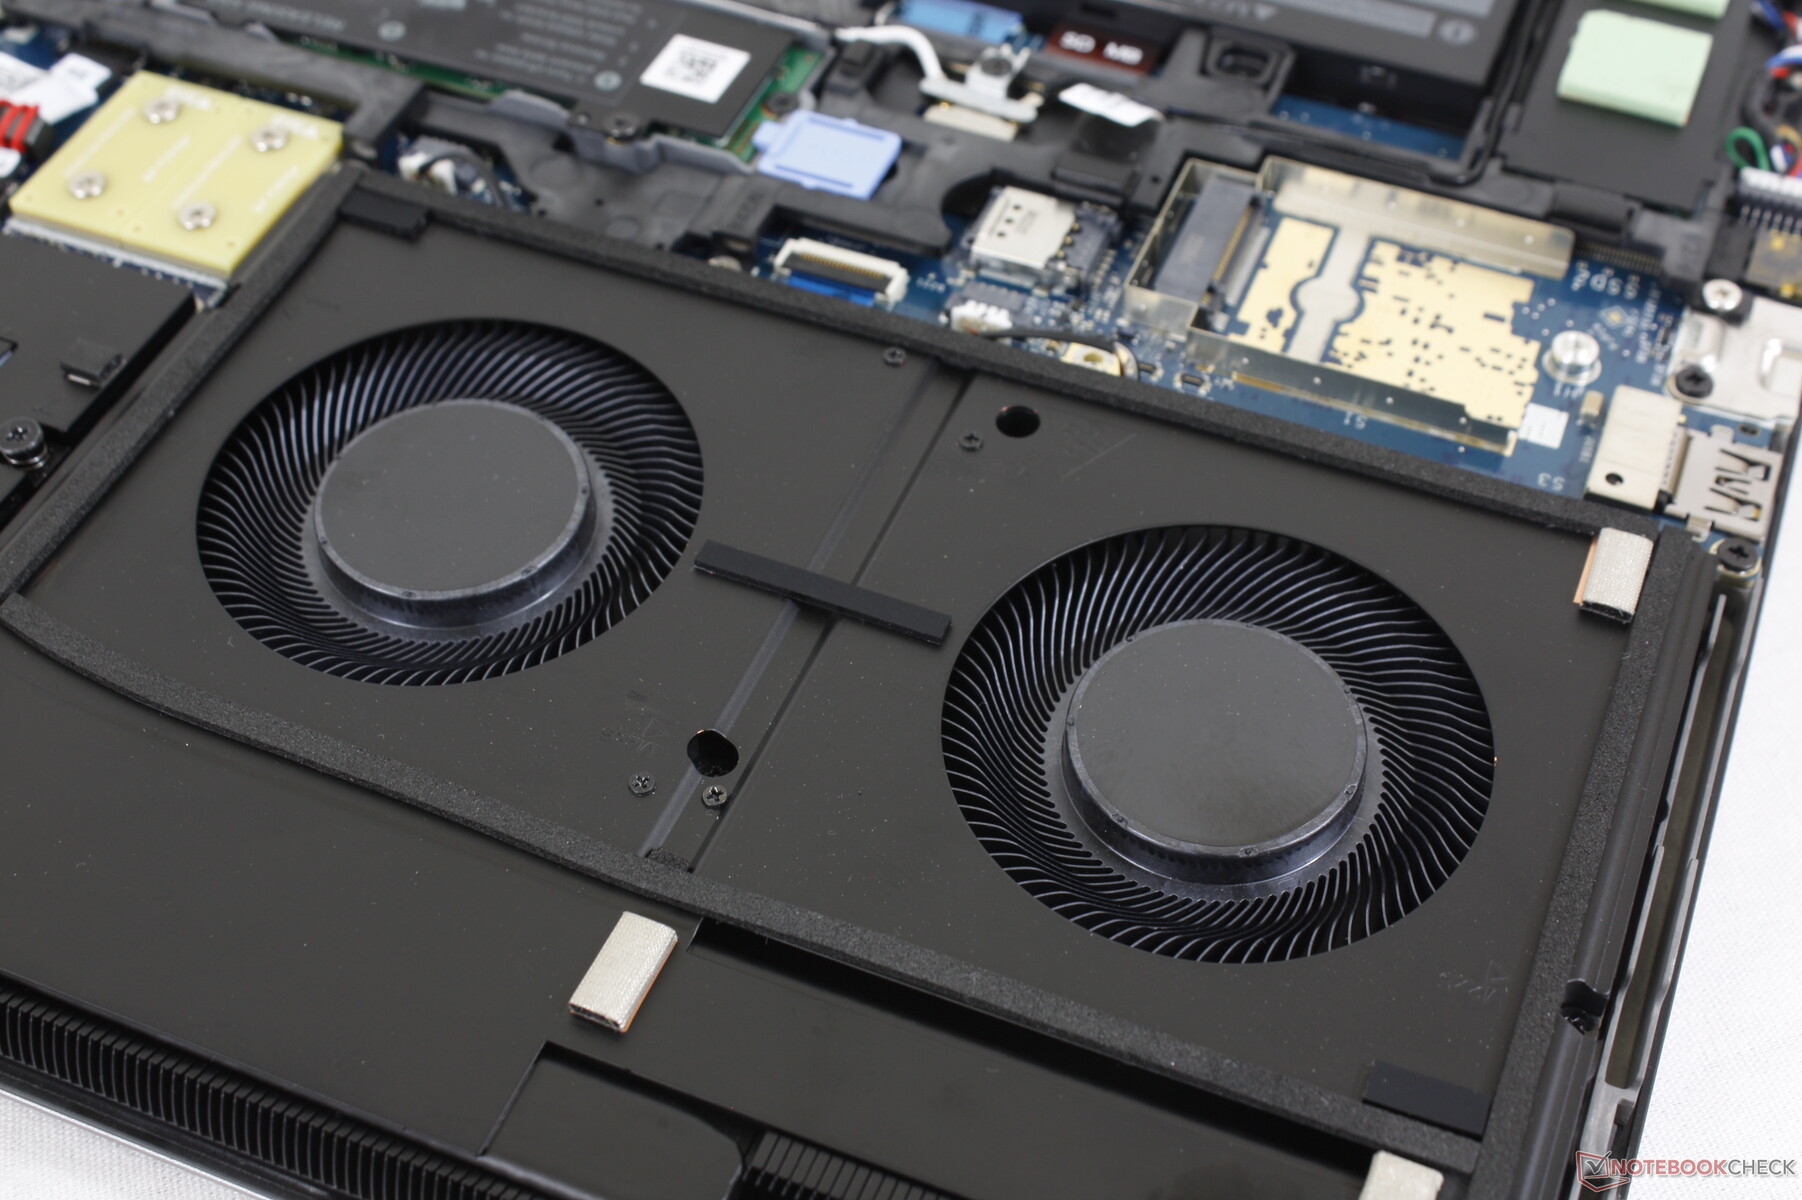
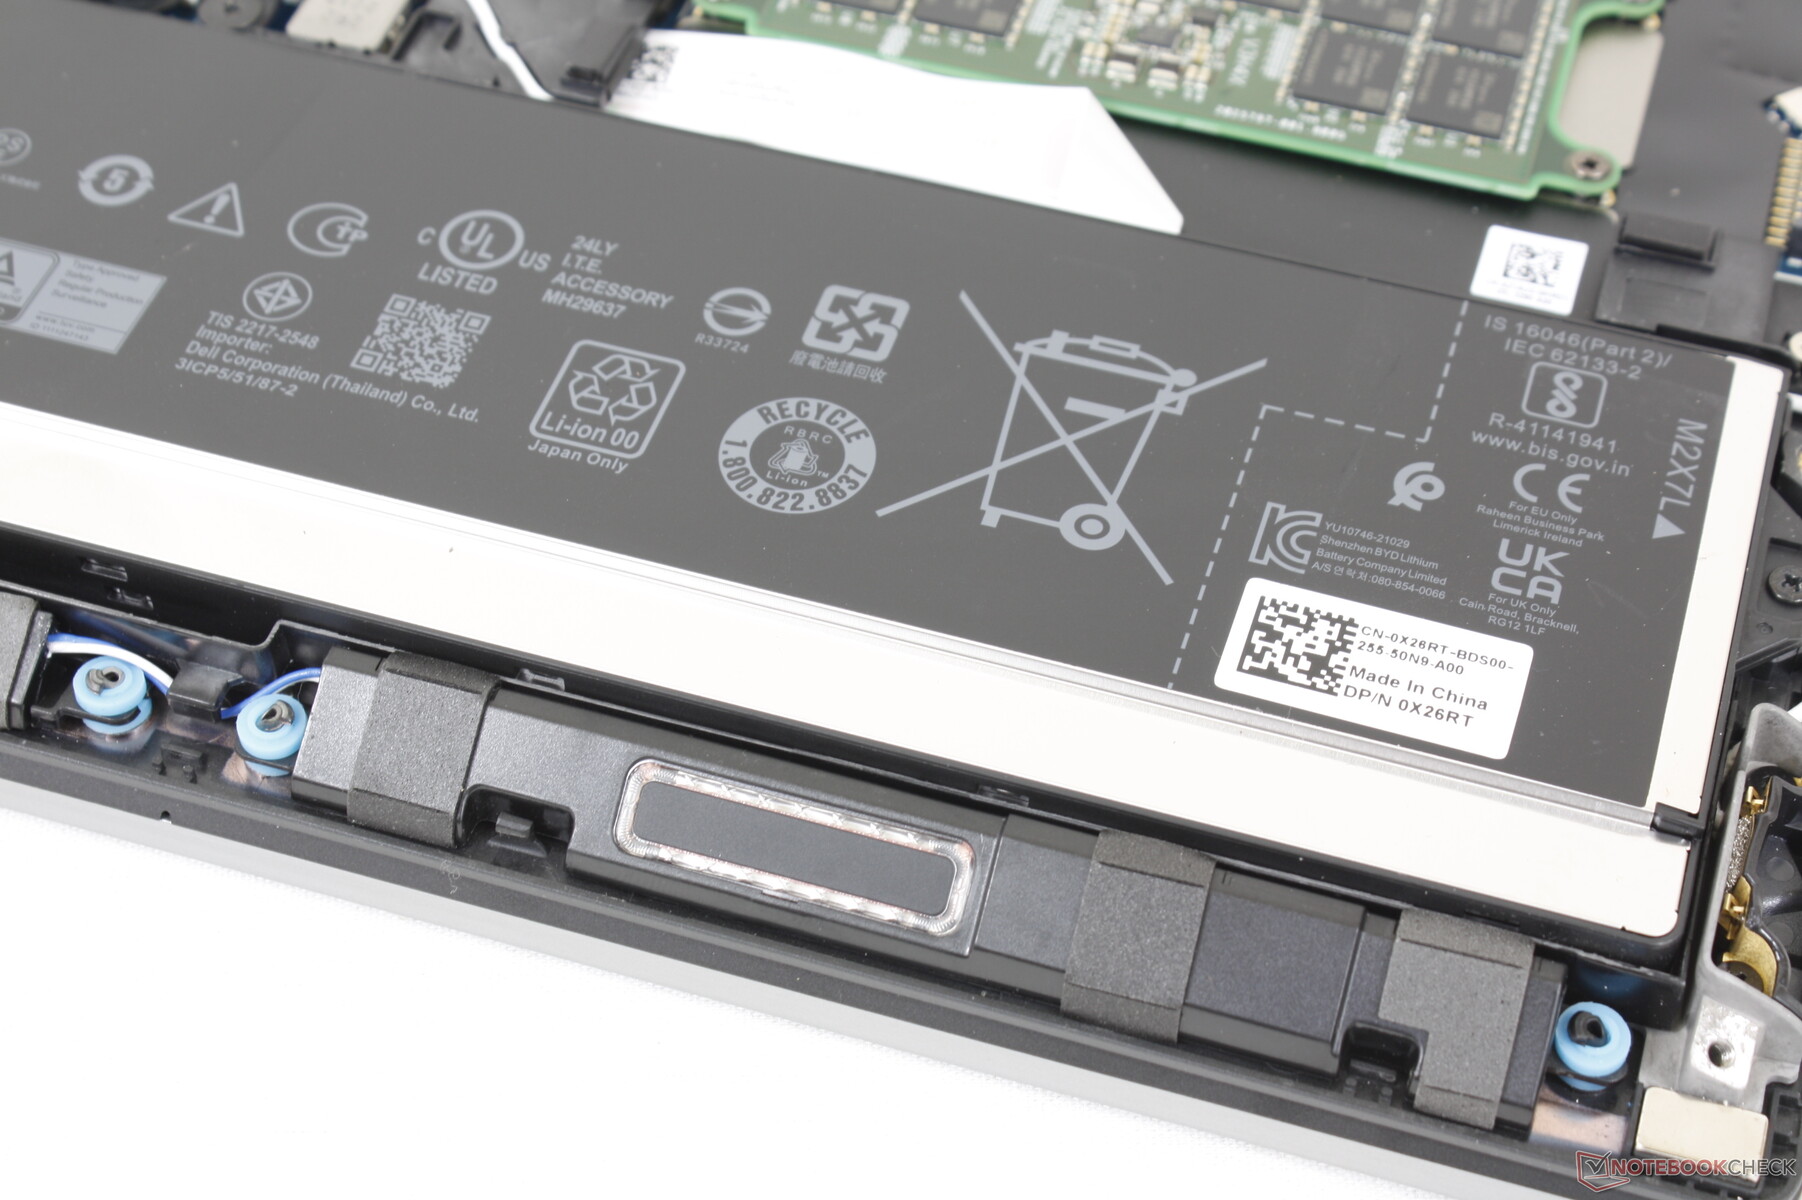
Underhåll - Enkel åtkomst
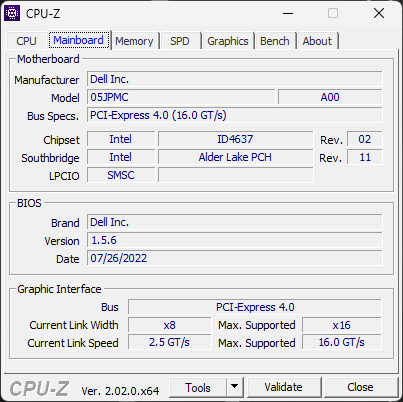
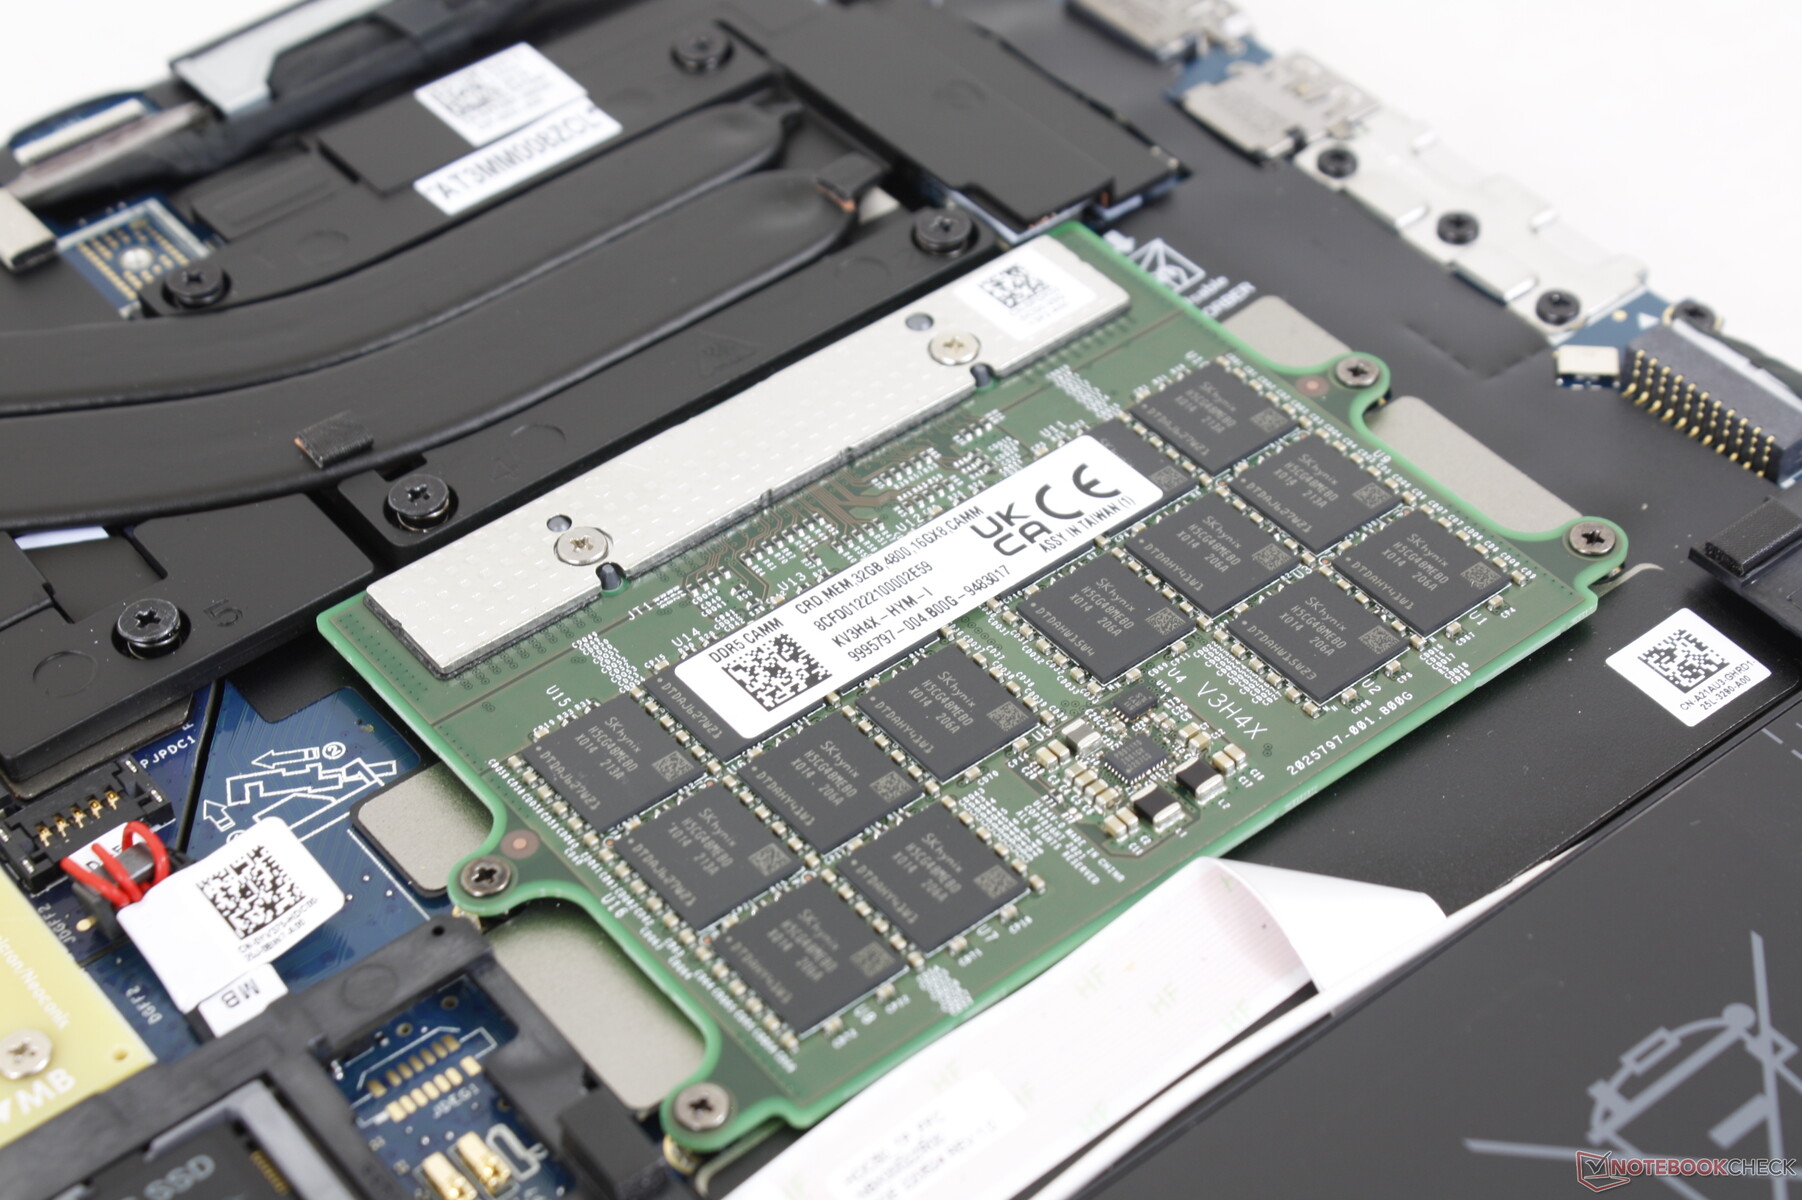
Bottenpanelen är säkrad med 6 Philips-skruvar för enkel service. Användarna har tillgång till två M.2 PCIe4 x4 2280-fack, WAN-fack, Nano-SIM-fack och antingen SODIMM- eller CAMM-fack beroende på konfigurationen. WLAN-modulen är inte avtagbar.
Vissa konfigurationer kan rymma upp till tre M.2-SSD-enheter, vilket exemplifieras av den tredje M.2-platsen nära batteriets kant.
Mer information om CAMM RAM finns på vår förhandsvisningssida här.
Tillbehör och garanti
Det finns inga extra tillbehör i lådan förutom nätadapter och papper. En treårig begränsad tillverkargaranti är standard om den köps direkt från Dell.
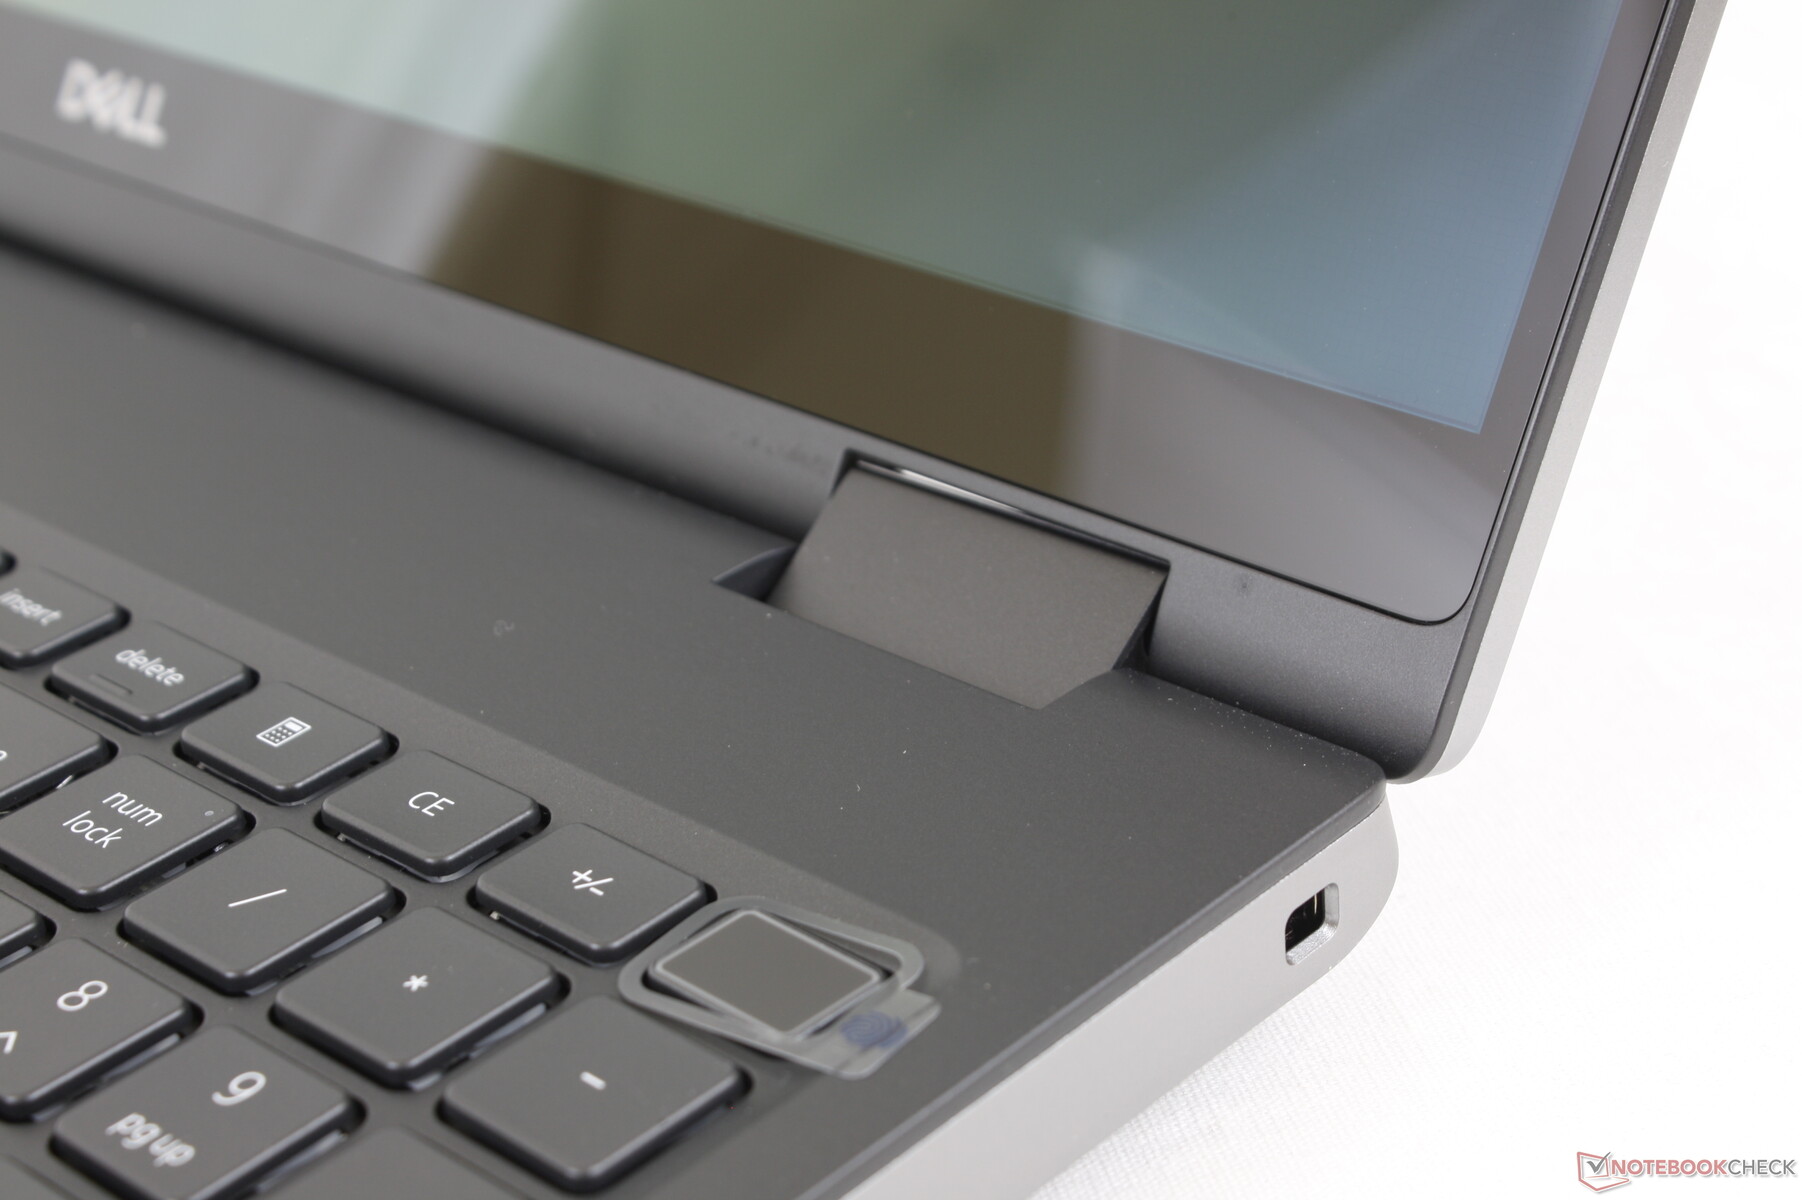
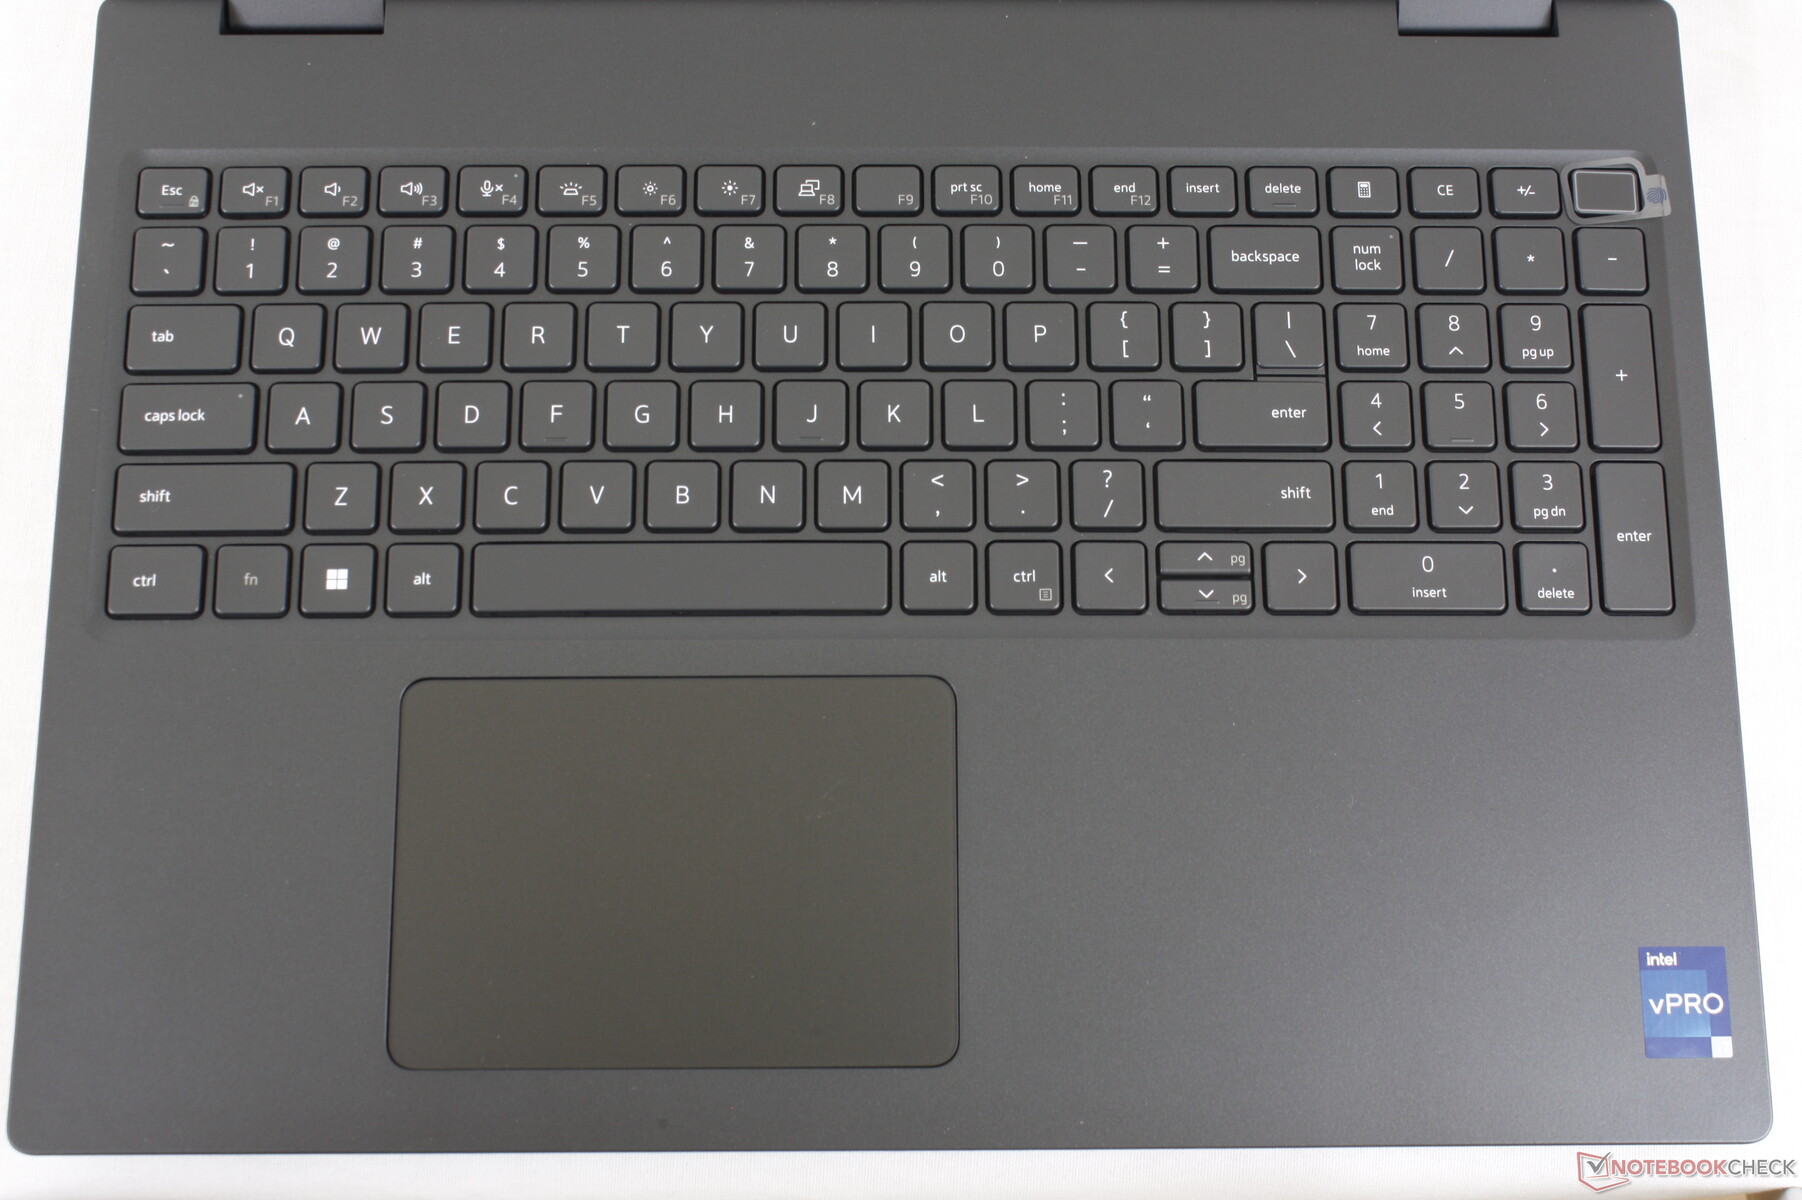
Inmatningsenheter - Stor klickplatta med ett bekvämt tangentbord
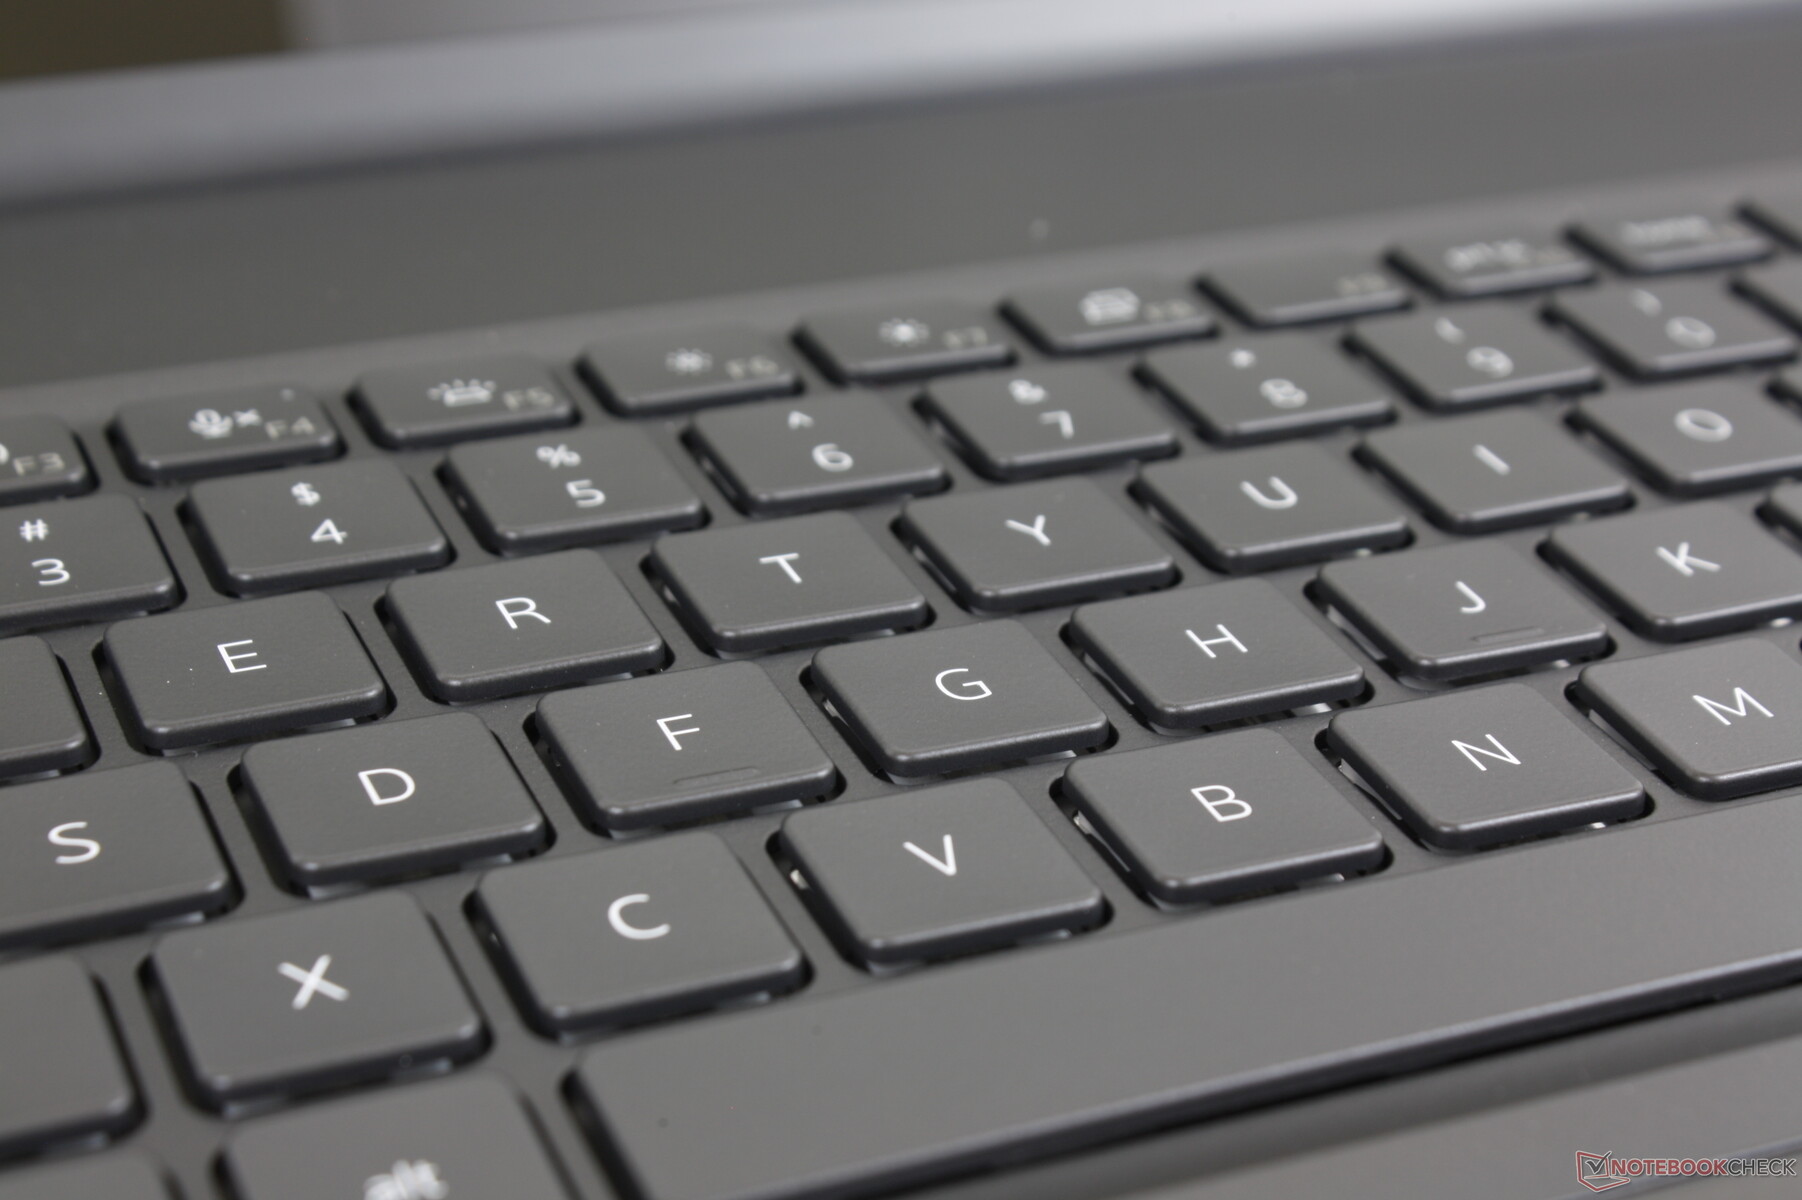
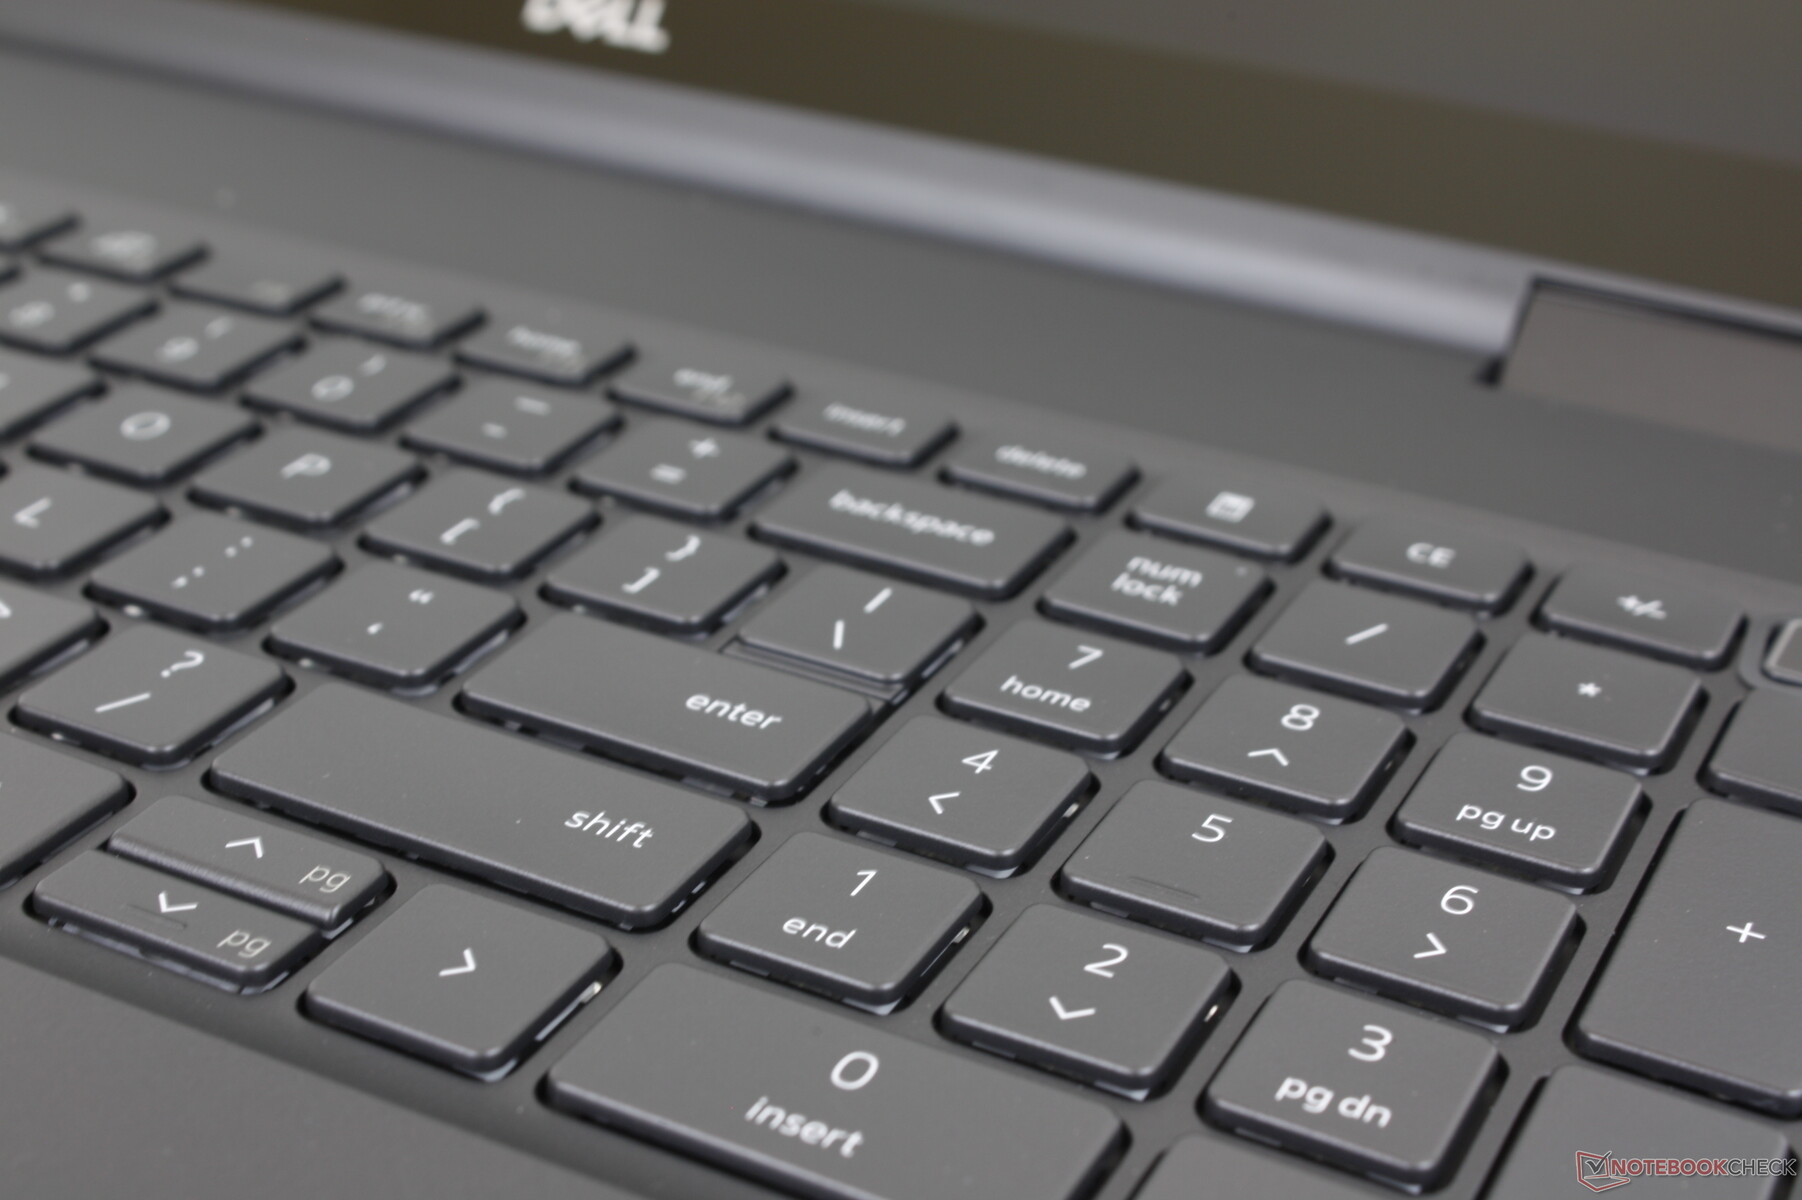
Tangentbord
Nyckellayout och återkoppling har inte ändrats från den Precision 7550. Vi tycker att tangenterna är något högre än tangenterna på XPS-serien, men med både starkare feedback och djupare slaglängd. Piltangenterna är dock fortfarande trånga till skillnad från de större piltangenterna på ThinkPad P1 G4 eller Asus ProArt StudioBook.
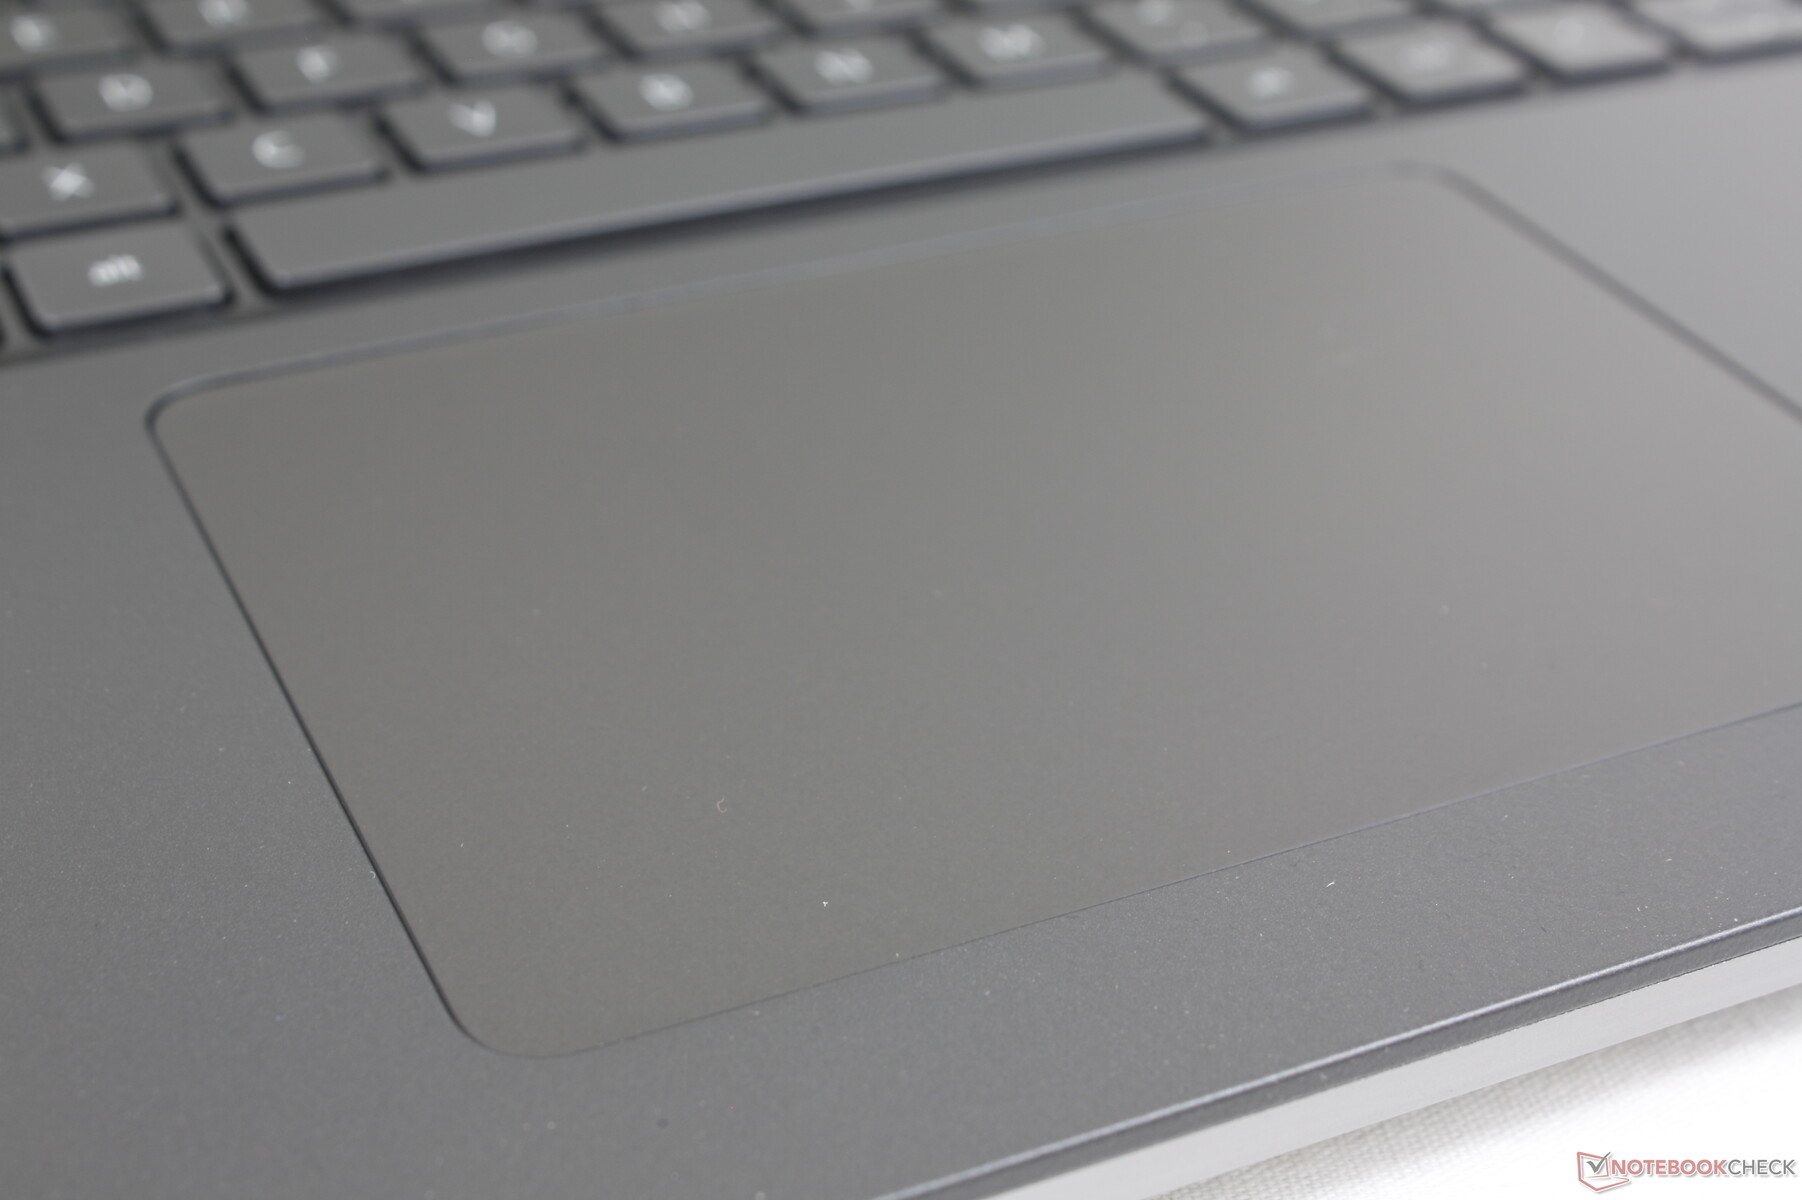
Pekplatta
Klickplattan är större än den på Precision 7550 (11,5 x 8 cm jämfört med 10 x 6,5 cm). Det finns dock inga fler dedikerade musknappar, och därför ligger användarupplevelsen närmare en traditionell Ultrabook än en affärsinriktad ThinkPad eller ZBook där musknapparna fortfarande är framträdande. Personligen föredrar vi dedikerade knappar eftersom dra-och-släpp-åtgärder blir enklare, men avsaknaden av knappar har resulterat i en större klickplattayta som andra kanske uppskattar.
Skärm - Inga 120 Hz-alternativ
Dell erbjuder tre skärmalternativ i skrivande stund
- 1200p, 60 Hz, 60 procent sRGB, 250 nits, utan pekfunktion
- 1200p, 60 Hz, 99 procent DCI-P3, 500 nits, utan beröring, IPS
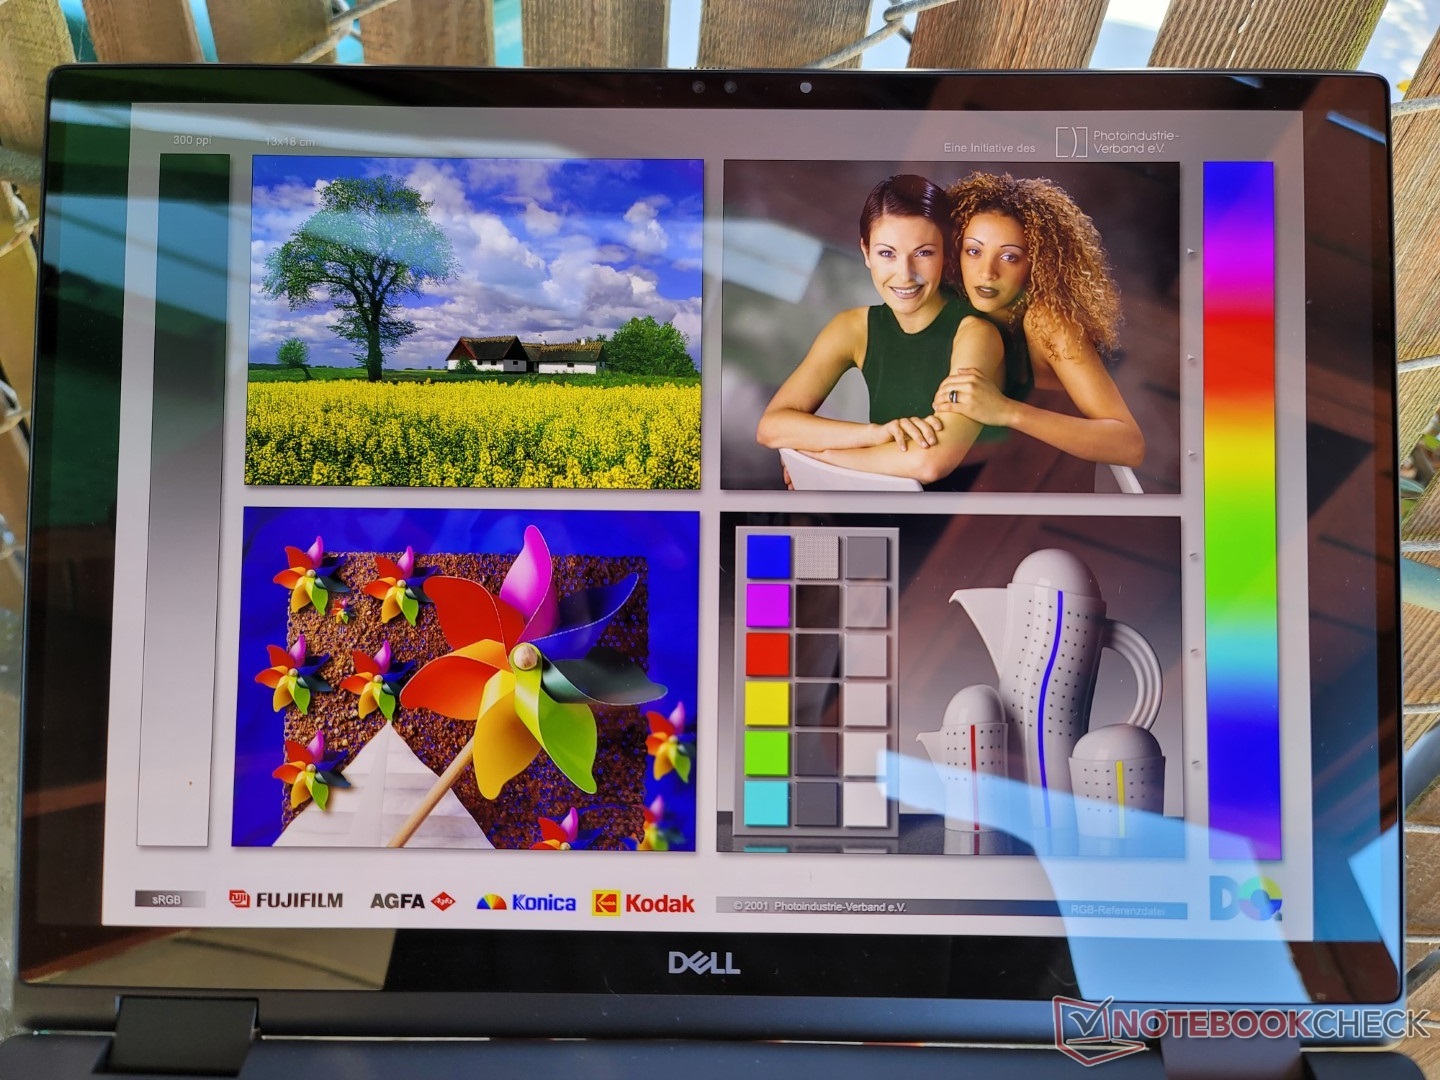
- 2400p, 60 Hz, 100 procent DCI-P3, 400 nits, touch, OLED
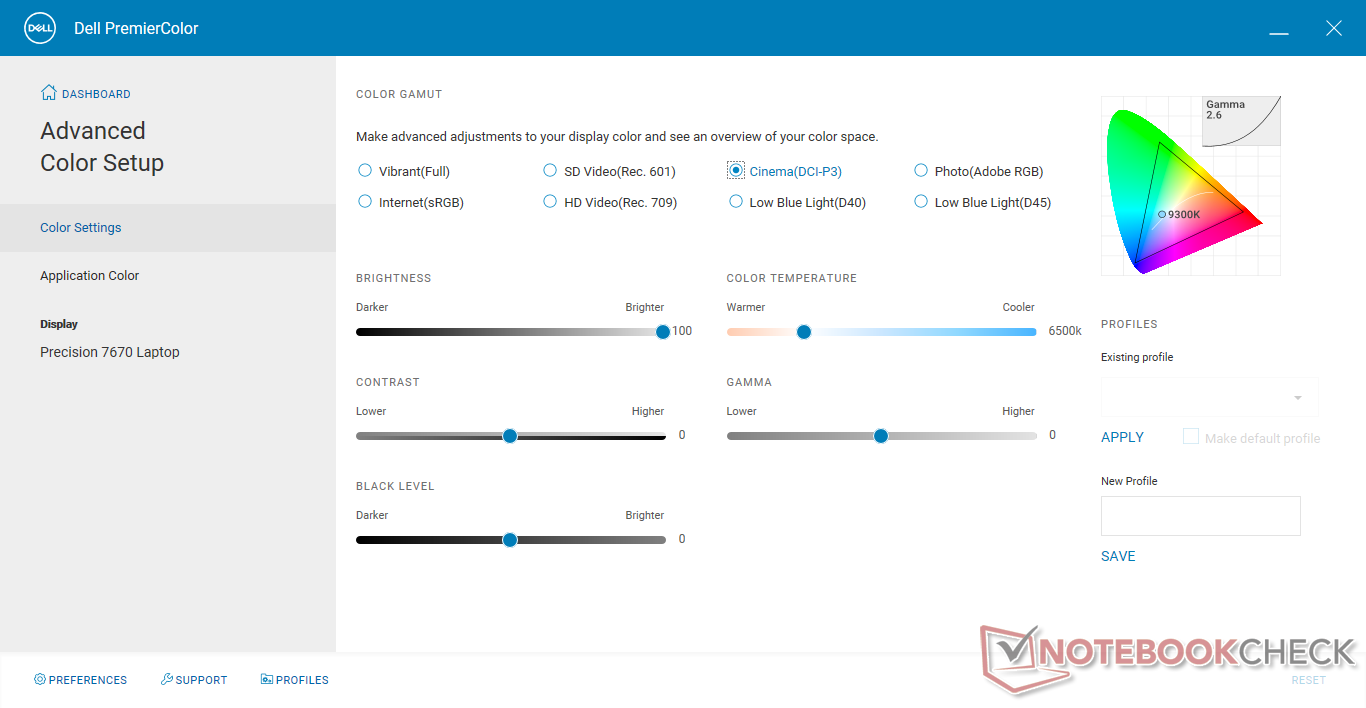
Våra oberoende mätningar nedan återspeglar endast det fetstilade alternativet ovan. Om exakta färger är viktiga för dina arbetsuppgifter rekommenderar vi starkt att du undviker basalternativet med 250 nit, eftersom dess färgåtergivning är lika dålig som många bärbara konsumentdatorer i budgetklassen. Ägare bör bekanta sig med programvaran Dell PremierColor för att justera skärmens färgprofil
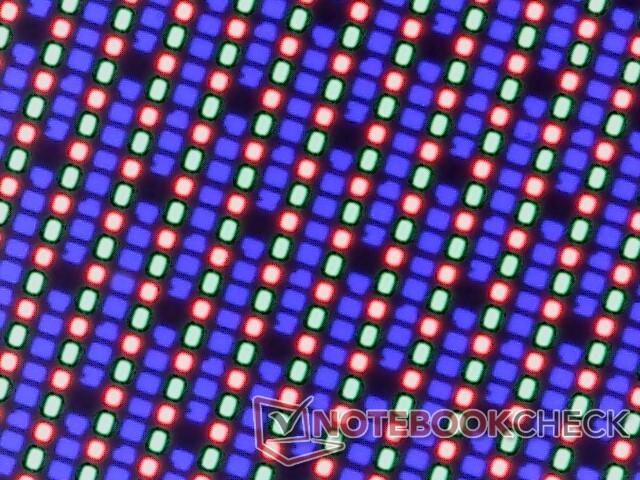
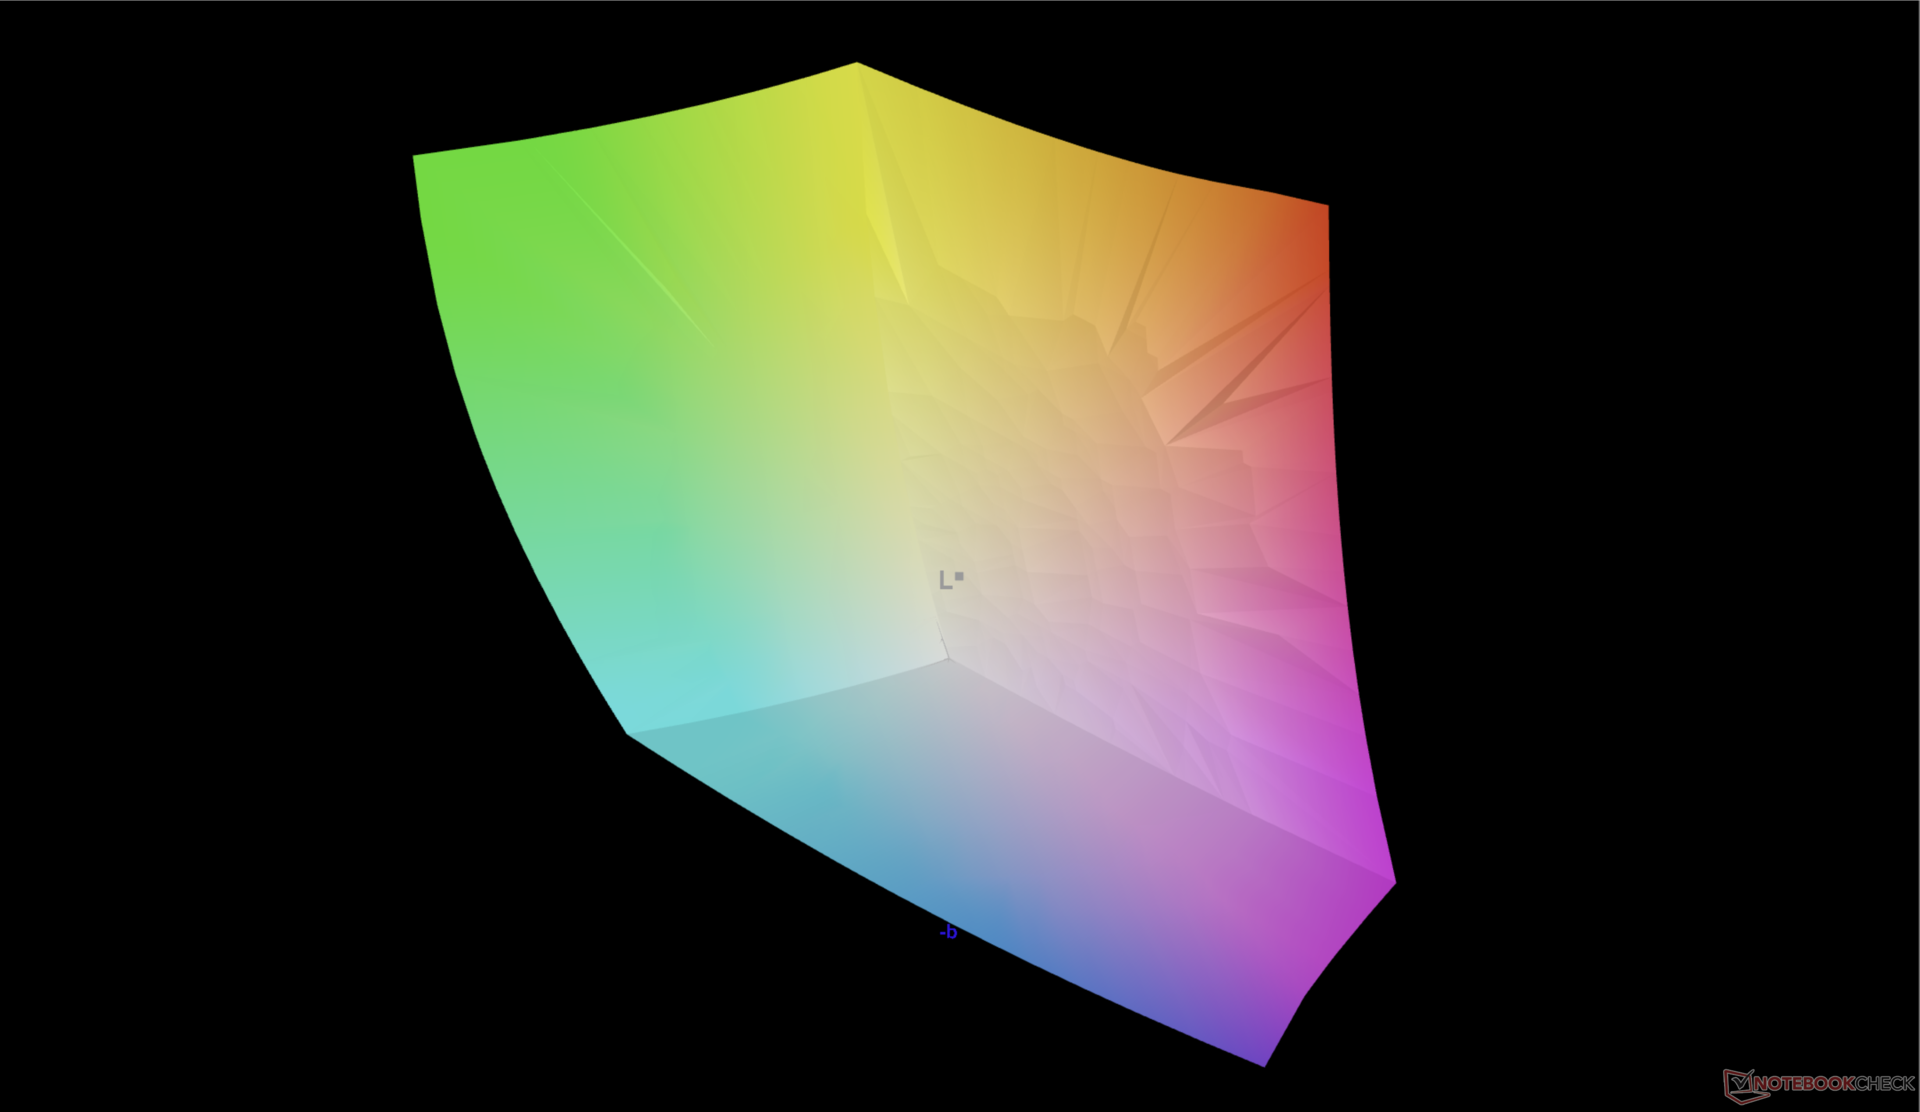
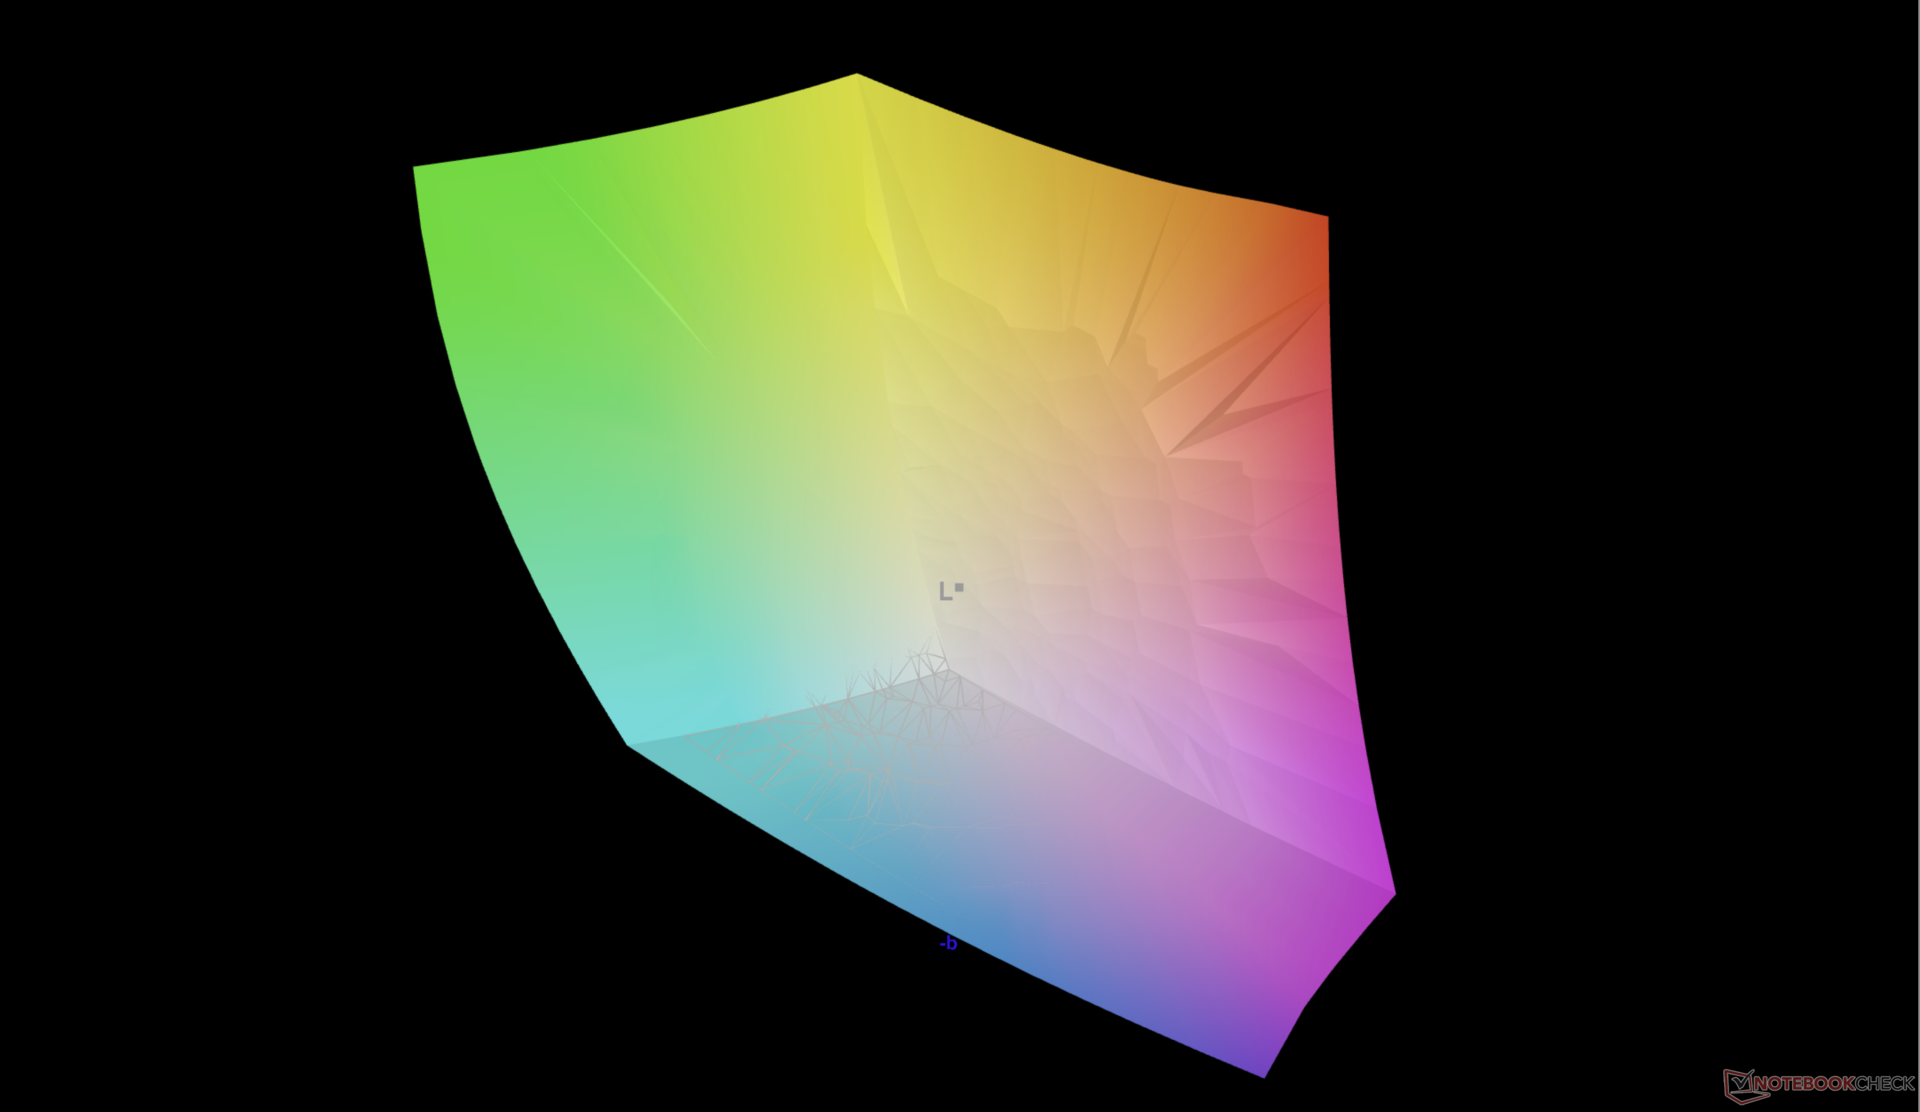
Även om vi kan bekräfta OLED-panelens fullständiga DCI-P3-täckning med vår egen X-Rite-kolorimeter, är skärmens maximala ljusstyrka endast cirka 340 nits jämfört med de annonserade 400 nits även efter att ha inaktiverat den automatiska ljusstyrkan. Detta gör vår skärm svagare än på de flesta andra arbetsstationer där en ljusstyrka på 450 nit eller mer är vanligt förekommande.
| |||||||||||||||||||||||||
Distribution av ljusstyrkan: 98 %
Mitt på batteriet: 340.1 cd/m²
Kontrast: ∞:1 (Svärta: 0 cd/m²)
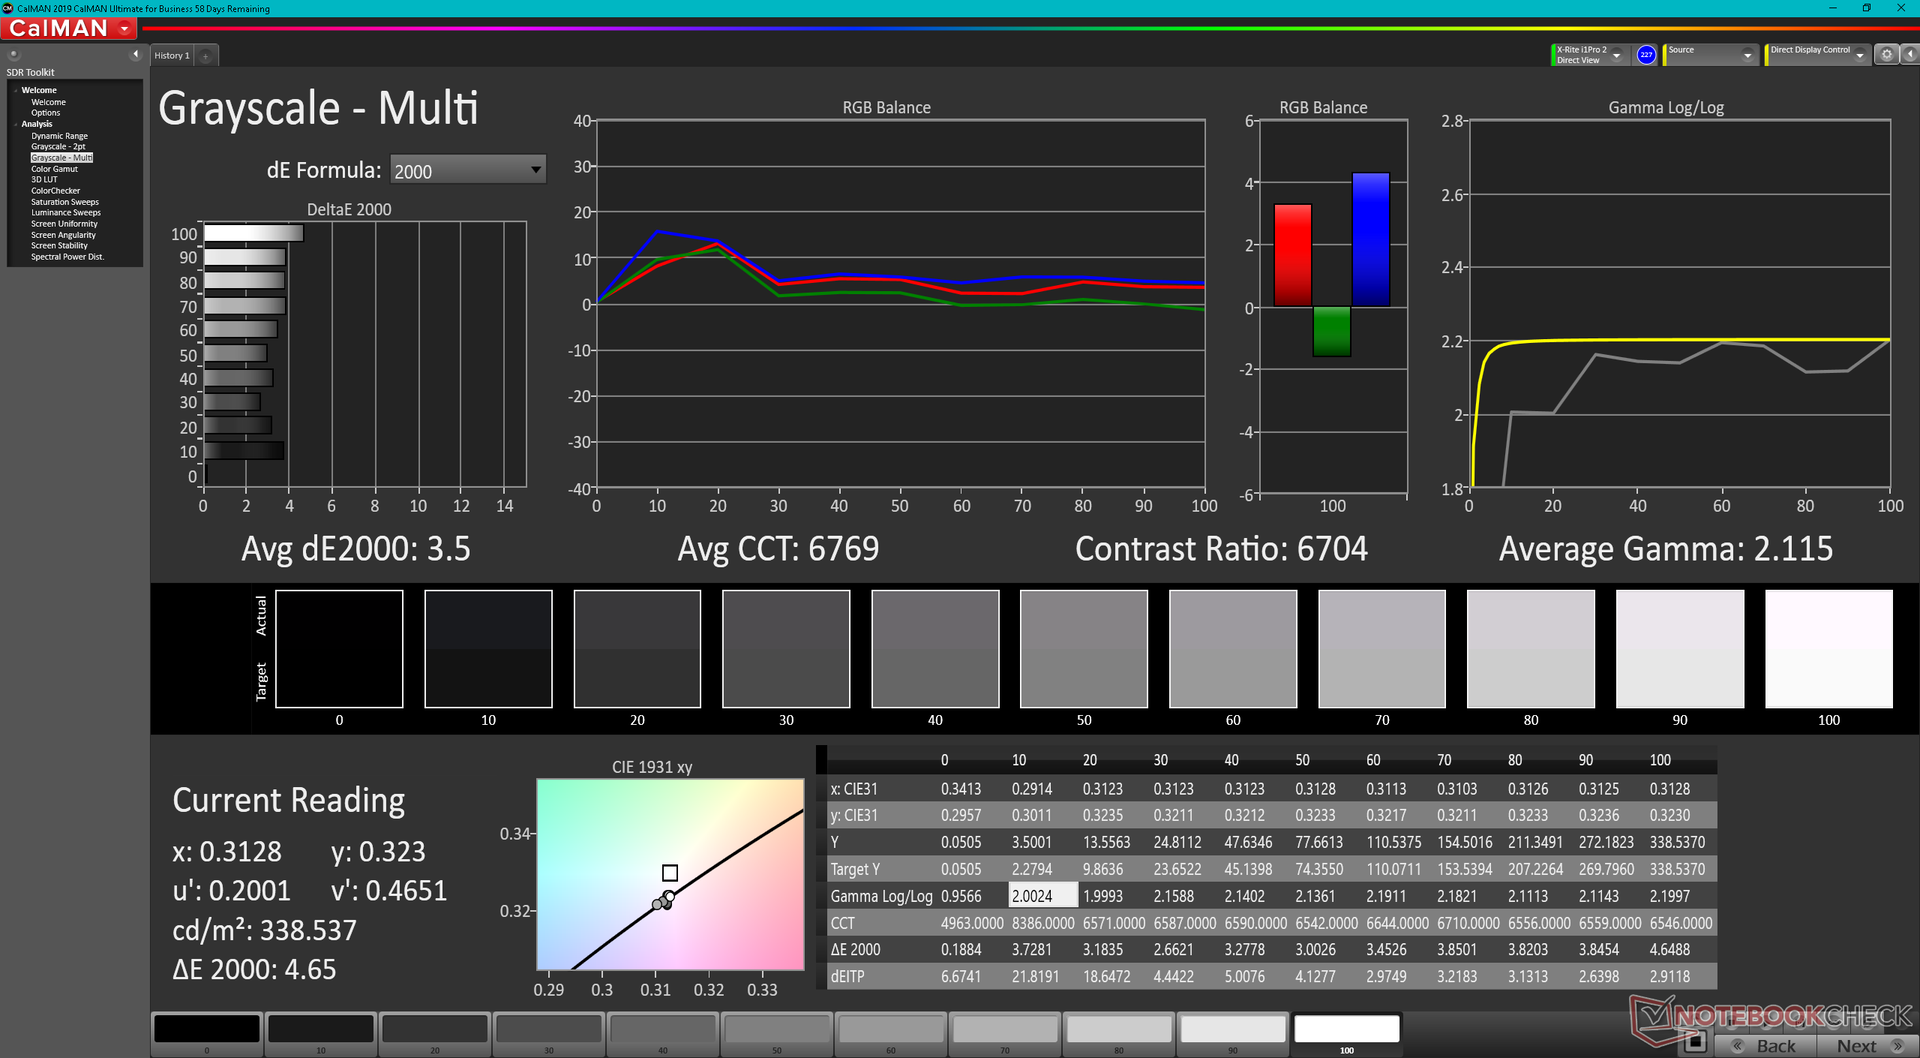
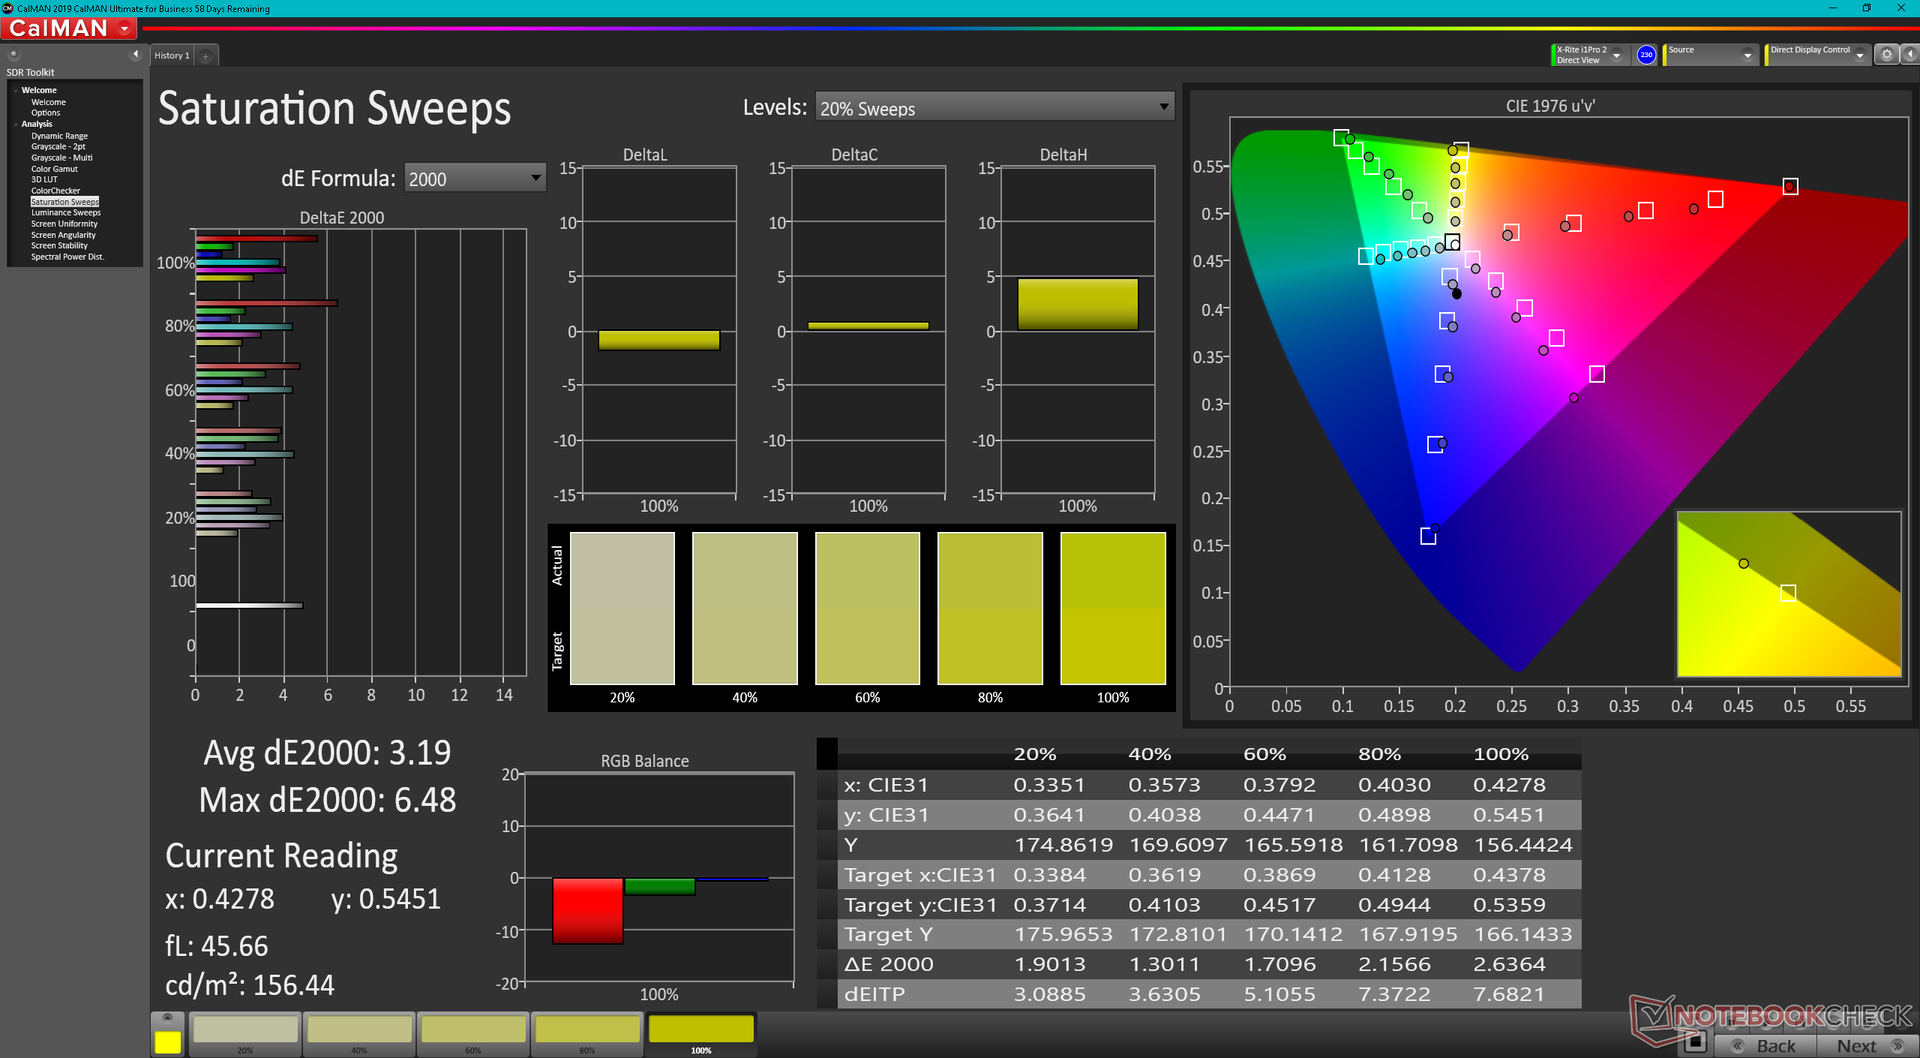
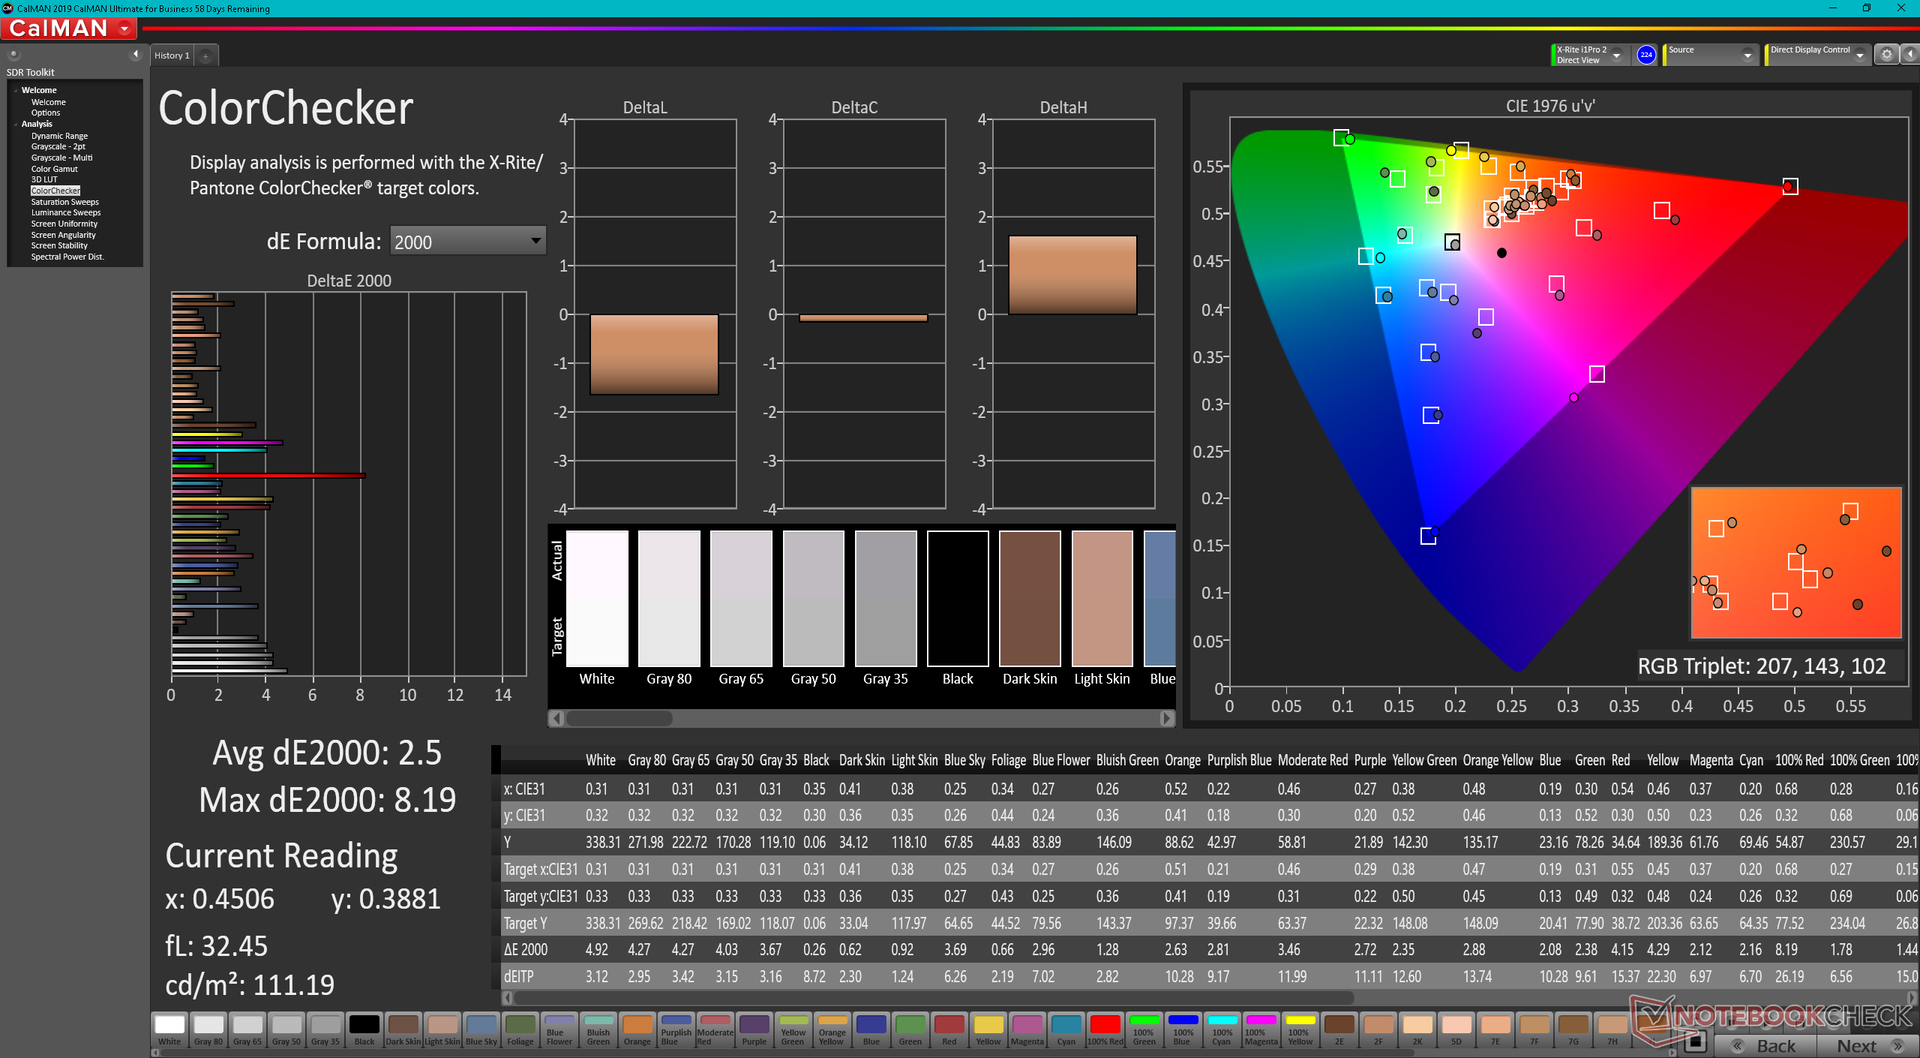
ΔE ColorChecker Calman: 2.5 | ∀{0.5-29.43 Ø4.71}
ΔE Greyscale Calman: 3.5 | ∀{0.09-98 Ø4.96}
97.5% AdobeRGB 1998 (Argyll 3D)
100% sRGB (Argyll 3D)
99.9% Display P3 (Argyll 3D)
Gamma: 2.12
CCT: 6704 K
| Dell Precision 7670 Samsung 160YV03, OLED, 3840x2400, 16" | Lenovo ThinkPad P1 G4-20Y4Z9DVUS NE160QDM-N63, IPS, 2560x1600, 16" | Asus ProArt StudioBook 16 W7600H5A-2BL2 ATNA60YV02-0, OLED, 3840x2400, 16" | Dell Precision 5000 5560 Sharp LQ156R1, IPS, 3840x2400, 15.6" | Dell Precision 7550 AU Optronics B156ZAN, IPS, 3840x2160, 15.6" | HP ZBook Fury 15 G8 BOE0969, IPS, 3840x2160, 15.6" | |
|---|---|---|---|---|---|---|
| Display | -17% | 0% | -1% | -6% | -5% | |
| Display P3 Coverage (%) | 99.9 | 72.7 -27% | 99.9 0% | 94.9 -5% | 82.1 -18% | 95.9 -4% |
| sRGB Coverage (%) | 100 | 99.3 -1% | 100 0% | 100 0% | 99.6 0% | 100 0% |
| AdobeRGB 1998 Coverage (%) | 97.5 | 74.7 -23% | 98.6 1% | 100 3% | 96.8 -1% | 87.3 -10% |
| Response Times | -1494% | -3% | -1902% | -2098% | -565% | |
| Response Time Grey 50% / Grey 80% * (ms) | 1.9 ? | 40.8 -2047% | 2 ? -5% | 47.2 ? -2384% | 51.2 ? -2595% | 14.8 ? -679% |
| Response Time Black / White * (ms) | 2 ? | 20.8 -940% | 2 ? -0% | 30.4 ? -1420% | 34 ? -1600% | 11 ? -450% |
| PWM Frequency (Hz) | 59.5 ? | 240 ? | ||||
| Screen | 7% | 18% | -4% | -16% | -10% | |
| Brightness middle (cd/m²) | 340.1 | 441 30% | 353 4% | 501.5 47% | 473.5 39% | 626 84% |
| Brightness (cd/m²) | 342 | 420 23% | 360 5% | 467 37% | 461 35% | 589 72% |
| Brightness Distribution (%) | 98 | 90 -8% | 96 -2% | 83 -15% | 90 -8% | 87 -11% |
| Black Level * (cd/m²) | 0.27 | 0.44 | 0.55 | 0.58 | ||
| Colorchecker dE 2000 * | 2.5 | 2.6 -4% | 2.45 2% | 4.73 -89% | 4.8 -92% | 5.41 -116% |
| Colorchecker dE 2000 max. * | 8.19 | 6 27% | 3.75 54% | 8.45 -3% | 8.73 -7% | 9.05 -11% |
| Greyscale dE 2000 * | 3.5 | 4.5 -29% | 1.88 46% | 3.6 -3% | 5.6 -60% | 6.2 -77% |
| Gamma | 2.12 104% | 2.18 101% | 2.31 95% | 2.08 106% | 2.34 94% | 2.66 83% |
| CCT | 6704 97% | 6623 98% | 6441 101% | 6447 101% | 7549 86% | 6101 107% |
| Contrast (:1) | 1633 | 1140 | 861 | 1079 | ||
| Colorchecker dE 2000 calibrated * | 1.2 | 2.77 | 0.51 | 3.08 | 0.6 | |
| Color Space (Percent of AdobeRGB 1998) (%) | 86.4 | |||||
| Color Space (Percent of sRGB) (%) | 99.7 | |||||
| Totalt genomsnitt (program/inställningar) | -501% /
-273% | 5% /
10% | -636% /
-348% | -707% /
-392% | -193% /
-109% |
* ... mindre är bättre
Ingenstans i Dells annonser eller material nämns en förkalibrerad bildskärm från fabriken. Gråskala och färger är fortfarande ganska exakta på vår OLED-panel med genomsnittliga deltaE-värden på endast 3,5 respektive 2,5.
Visa svarstider
| ↔ Svarstid svart till vitt | ||
|---|---|---|
| 2 ms ... stiga ↗ och falla ↘ kombinerat | ↗ 0.8 ms stiga | 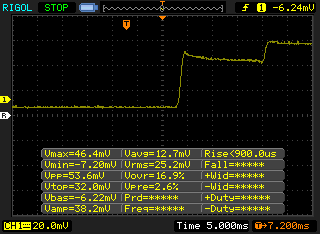 |
| ↘ 1.2 ms hösten | ||
| Skärmen visar väldigt snabba svarsfrekvenser i våra tester och borde vara mycket väl lämpad för fartfyllt spel. I jämförelse sträcker sig alla testade enheter från 0.1 (minst) till 240 (maximalt) ms. » 11 % av alla enheter är bättre. Det betyder att den uppmätta svarstiden är bättre än genomsnittet av alla testade enheter (19.8 ms). | ||
| ↔ Svarstid 50 % grått till 80 % grått | ||
| 1.9 ms ... stiga ↗ och falla ↘ kombinerat | ↗ 1.1 ms stiga | 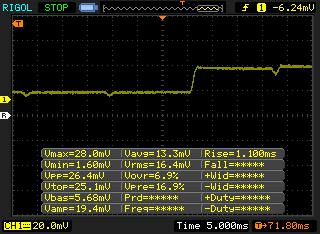 |
| ↘ 0.8 ms hösten | ||
| Skärmen visar väldigt snabba svarsfrekvenser i våra tester och borde vara mycket väl lämpad för fartfyllt spel. I jämförelse sträcker sig alla testade enheter från 0.165 (minst) till 636 (maximalt) ms. » 9 % av alla enheter är bättre. Det betyder att den uppmätta svarstiden är bättre än genomsnittet av alla testade enheter (31 ms). | ||
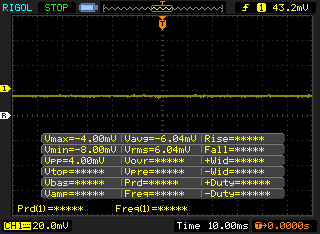
Skärmflimmer / PWM (Puls-Width Modulation)
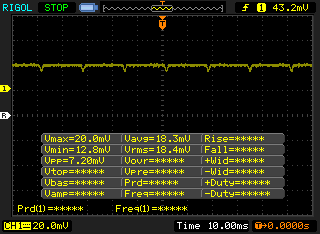
| Skärmflimmer / PWM upptäckt | 59.5 Hz | ≤ 100 % ljusstyrka inställning | 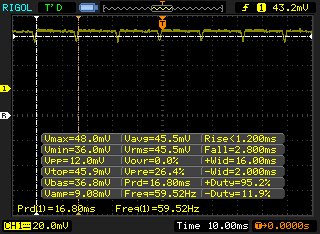 |
Displayens bakgrundsbelysning flimrar vid 59.5 Hz (i värsta fall, t.ex. med PWM) Flimrande upptäckt vid en ljusstyrkeinställning på 100 % och lägre. Det ska inte finnas något flimmer eller PWM över denna ljusstyrkeinställning. Frekvensen för 59.5 Hz är mycket låg, så flimmer kan orsaka ögon- och huvudvärk efter långvarig användning. Som jämförelse: 52 % av alla testade enheter använder inte PWM för att dämpa skärmen. Om PWM upptäcktes mättes ett medelvärde av 7757 (minst: 5 - maximum: 343500) Hz. | |||
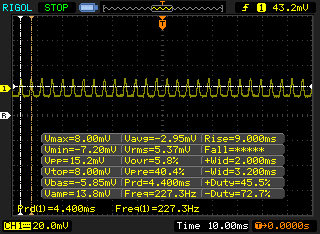
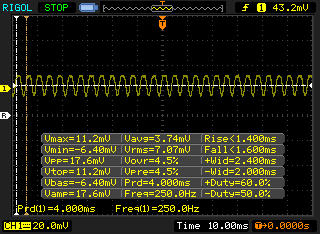
Flimmer finns på alla ljusstyrkor, precis som på de flesta andra OLED-paneler. Vi kan registrera en frekvens på 250 Hz från 1 till 56 procent ljusstyrka och 59,5 Hz från 57 procent ljusstyrka till maximal nivå.

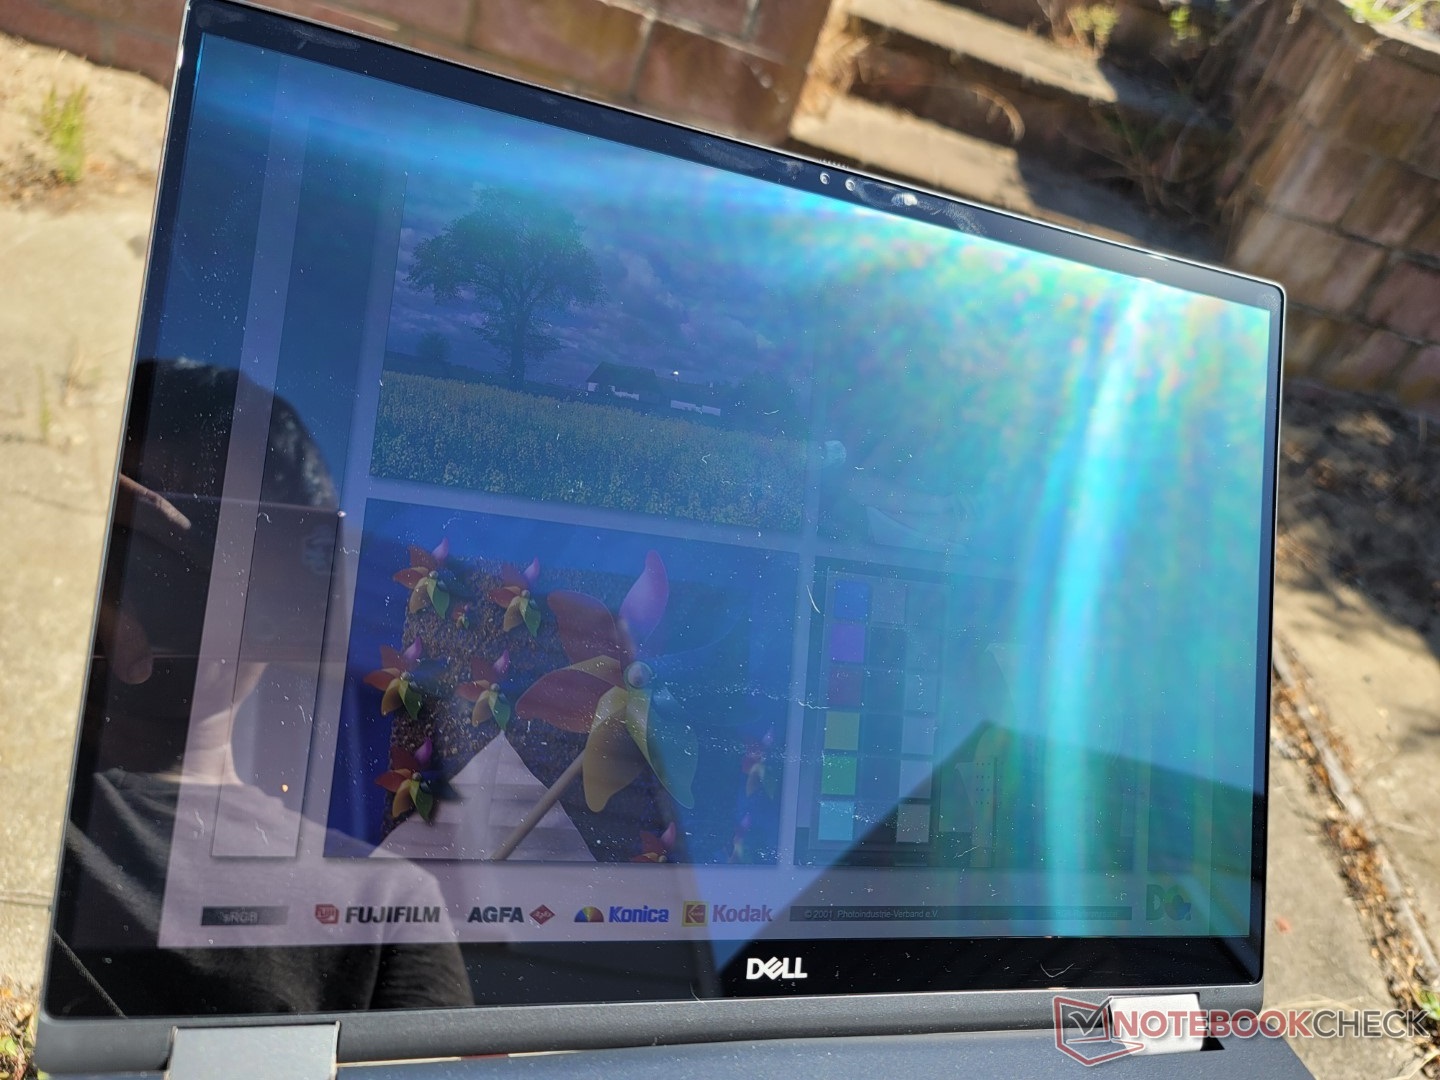
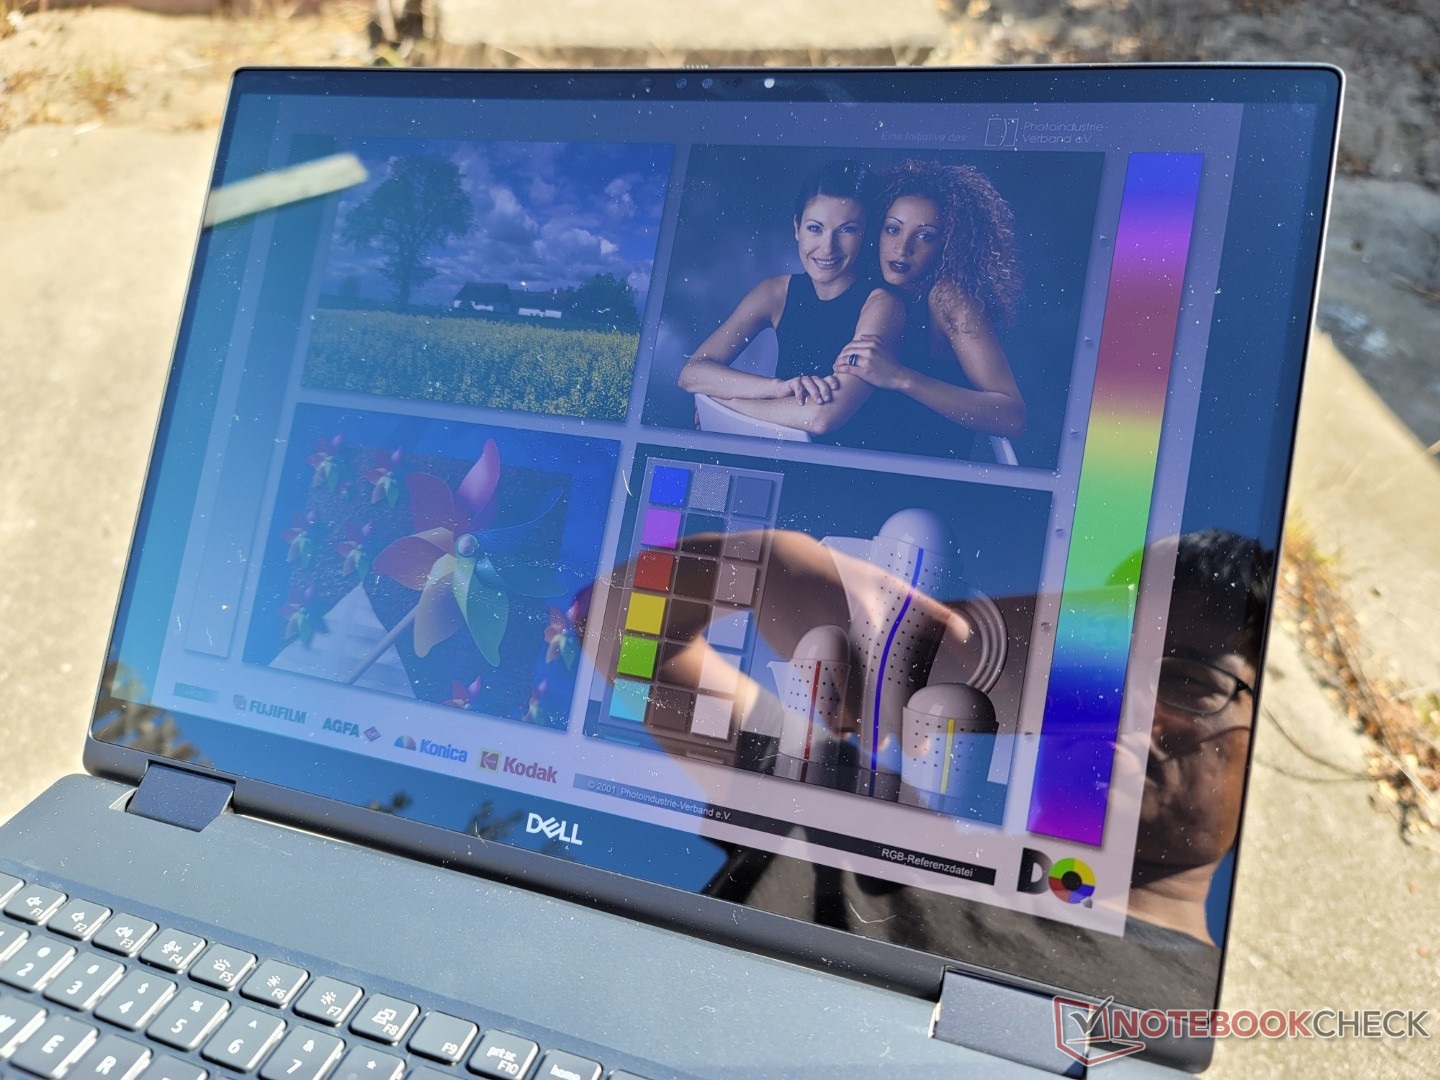
Det är mycket bländande trots att det tekniskt sett är en "antibländande" skärm. Bakgrundsbelysningen är inte tillräckligt ljus för att ge bekväm visning i de flesta utomhusmiljöer, såvida du inte råkar vara i skuggan. Om synligheten utomhus är viktig rekommenderar vi att du kollar inHP ZBook Fury 15 G8 som har en skärm som är nästan två gånger så ljusstark som vår Precision -enhet.
Prestanda - Intel vPro för alla
Provningsförhållanden
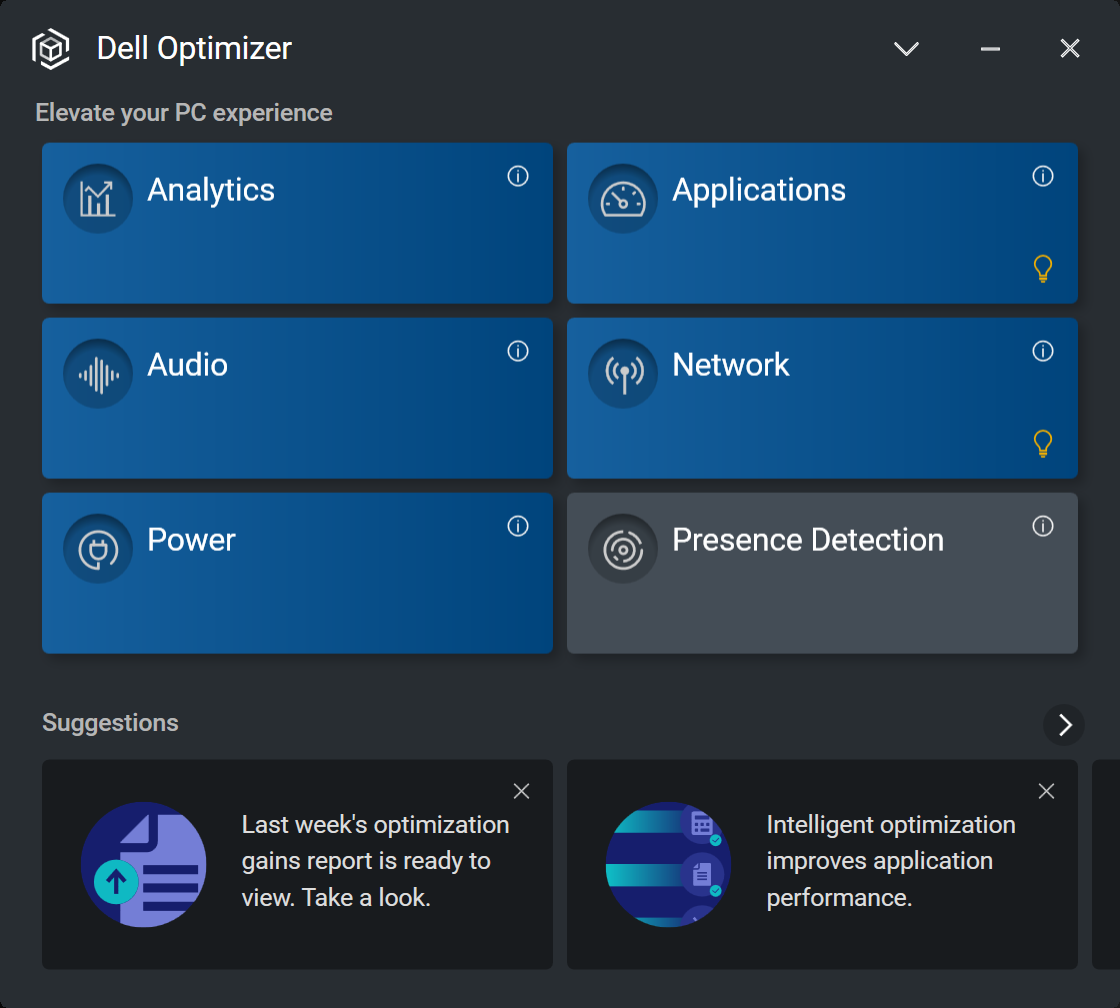
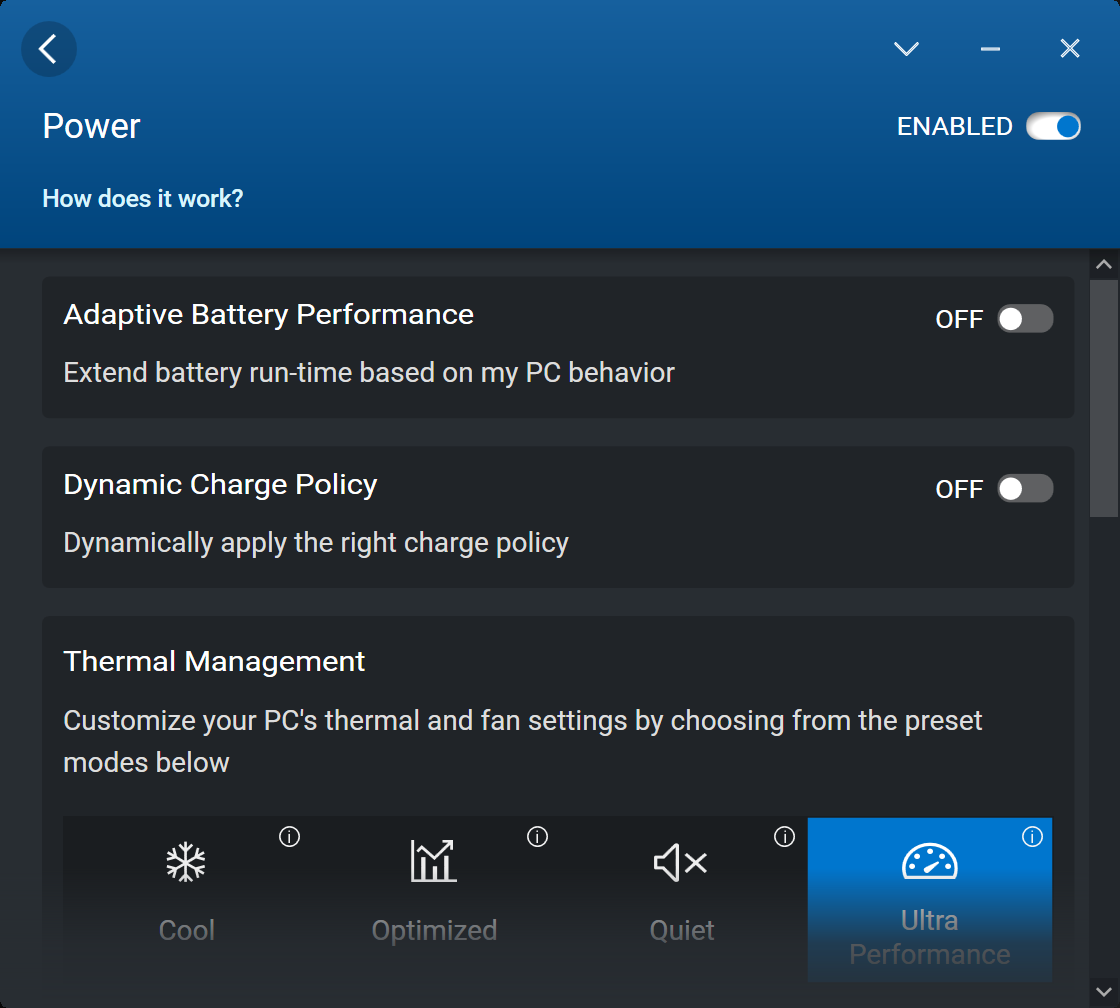
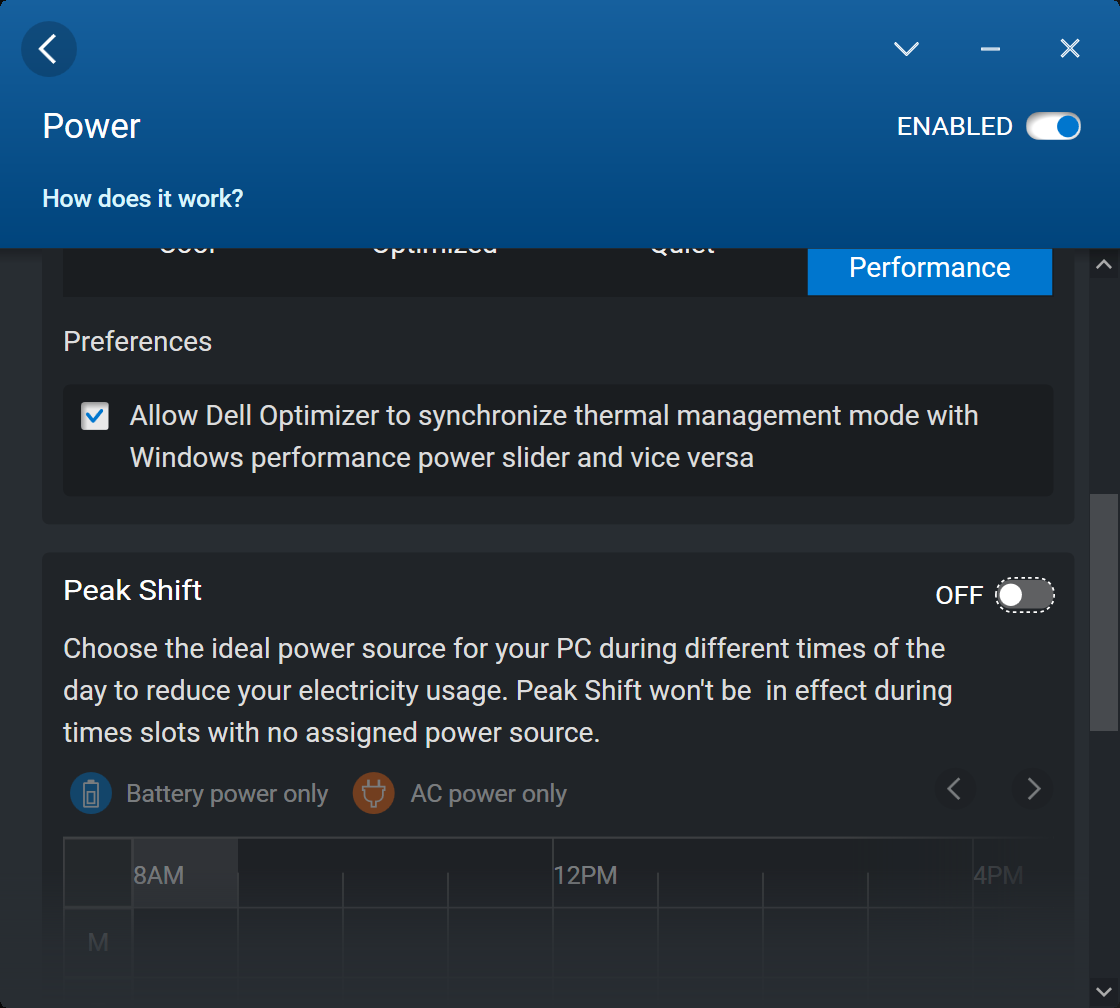
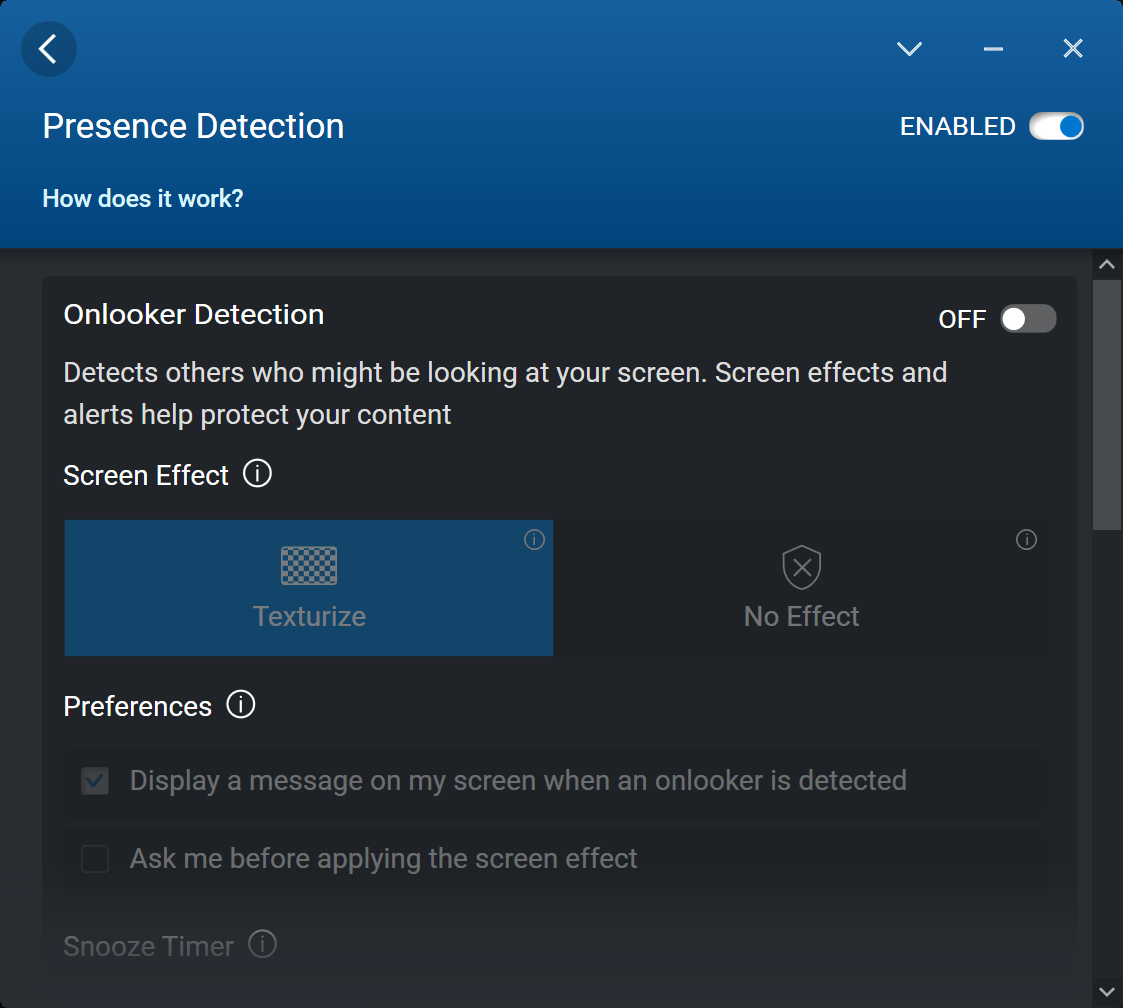
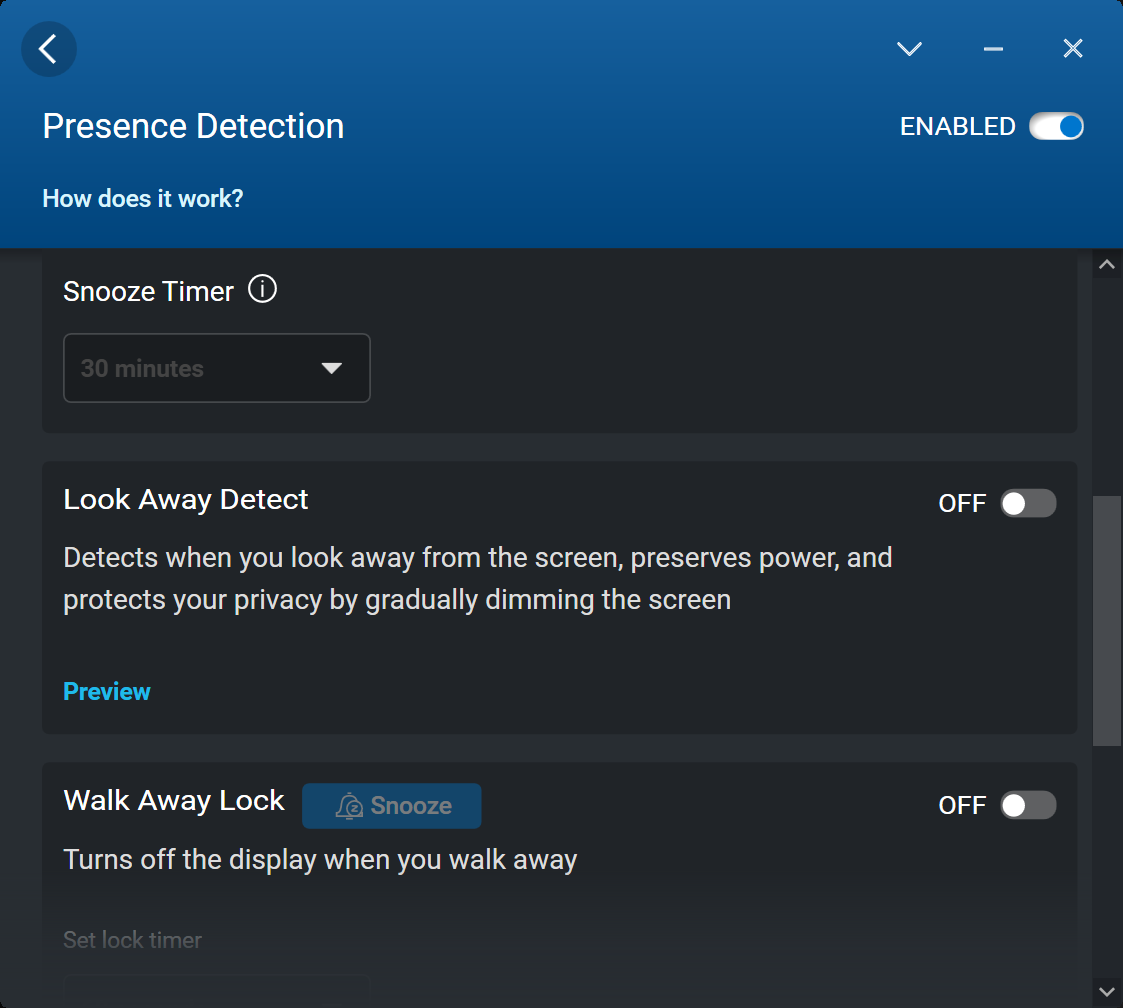
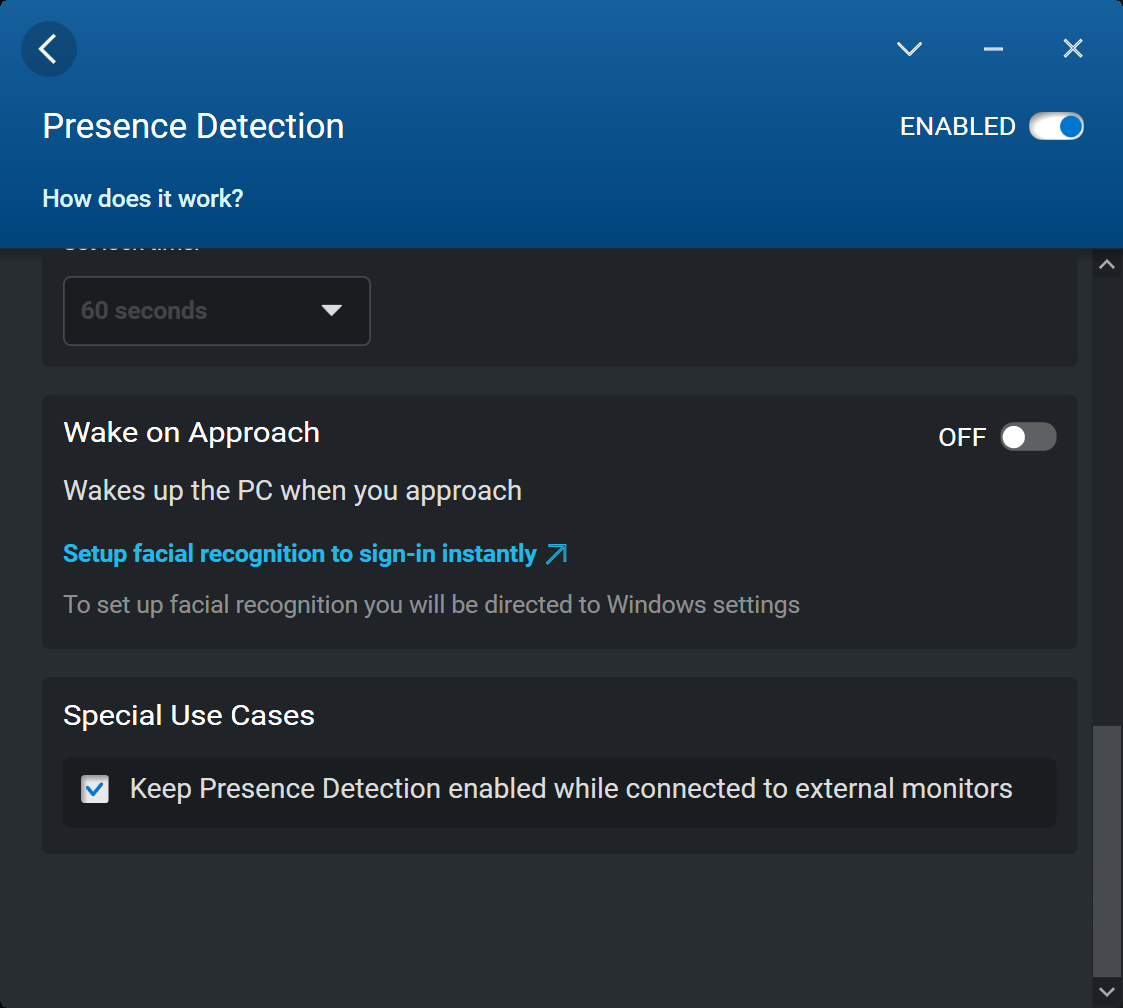
Vi ställde vår enhet till Ultra Performance-läge via Dell Optimizer-programvaran och GPU:n till diskret läge via Nvidias kontrollpanel innan vi körde några av nedanstående benchmarks. Irriterande nog kan strömprofilen ställas in via Windows, Dell Optimizer eller Dell Power Manager, vilket kan göra saker och ting mycket förvirrande. Vi rekommenderar att du aktiverar synkronisering av strömprofilen mellan de tre olika programmen via Optimizer, vilket framgår av skärmdumpen nedan.
Processor
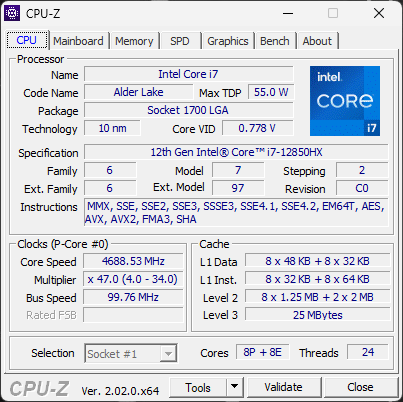
På papperet är Core i7-12850HX har liknande klockfrekvenser, antal kärnor och cachestorlekar som i7-12800HX men med extra vPro-stöd. I verkligheten kan dock deras prestanda variera ganska mycket
CPU-prestanda ligger närmare den Core i7-12800H än Core i7-12800HX. Faktum är att prestandan för flera trådar är cirka 30 procent långsammare än i7-12800HX som finns på MSI GE67 HXpå grund av dess mer kapabla kylningslösning. Trots detta är prestandan fortfarande en av de snabbaste jämfört med andra arbetsstationer eftersom många fortfarande körs på 11:e generationens Intel CPU:er.
Turbo Boost hållbarheten kunde ha varit bättre. När man körde CineBench R15 xT i en slinga sjönk prestandan med så mycket som 25 procent efter två eller tre upprepningar, vilket skulle bidra till att förklara det stora prestandaförlusten mot Core i7-12800HX som nämns ovan.
Cinebench R15 Multi Loop
Cinebench R23: Multi Core | Single Core
Cinebench R15: CPU Multi 64Bit | CPU Single 64Bit
Blender: v2.79 BMW27 CPU
7-Zip 18.03: 7z b 4 | 7z b 4 -mmt1
Geekbench 5.5: Multi-Core | Single-Core
HWBOT x265 Benchmark v2.2: 4k Preset
LibreOffice : 20 Documents To PDF
R Benchmark 2.5: Overall mean
Cinebench R23: Multi Core | Single Core
Cinebench R15: CPU Multi 64Bit | CPU Single 64Bit
Blender: v2.79 BMW27 CPU
7-Zip 18.03: 7z b 4 | 7z b 4 -mmt1
Geekbench 5.5: Multi-Core | Single-Core
HWBOT x265 Benchmark v2.2: 4k Preset
LibreOffice : 20 Documents To PDF
R Benchmark 2.5: Overall mean
* ... mindre är bättre
AIDA64: FP32 Ray-Trace | FPU Julia | CPU SHA3 | CPU Queen | FPU SinJulia | FPU Mandel | CPU AES | CPU ZLib | FP64 Ray-Trace | CPU PhotoWorxx
| Performance rating | |
| Genomsnitt Intel Core i7-12850HX | |
| HP ZBook Fury 15 G8 | |
| Lenovo ThinkPad P1 G4-20Y4Z9DVUS | |
| Dell Precision 7670 | |
| Asus ProArt StudioBook 16 W7600H5A-2BL2 -9! | |
| Dell Precision 5000 5560 -9! | |
| AIDA64 / FP32 Ray-Trace | |
| Lenovo ThinkPad P1 G4-20Y4Z9DVUS | |
| Genomsnitt Intel Core i7-12850HX (12983 - 16752, n=2) | |
| HP ZBook Fury 15 G8 | |
| Dell Precision 7670 | |
| AIDA64 / FPU Julia | |
| Genomsnitt Intel Core i7-12850HX (68219 - 87231, n=2) | |
| Dell Precision 7670 | |
| Lenovo ThinkPad P1 G4-20Y4Z9DVUS | |
| HP ZBook Fury 15 G8 | |
| AIDA64 / CPU SHA3 | |
| Lenovo ThinkPad P1 G4-20Y4Z9DVUS | |
| HP ZBook Fury 15 G8 | |
| Genomsnitt Intel Core i7-12850HX (3098 - 3818, n=2) | |
| Dell Precision 7670 | |
| AIDA64 / CPU Queen | |
| HP ZBook Fury 15 G8 | |
| Lenovo ThinkPad P1 G4-20Y4Z9DVUS | |
| Genomsnitt Intel Core i7-12850HX (26716 - 95664, n=2) | |
| Dell Precision 7670 | |
| AIDA64 / FPU SinJulia | |
| Genomsnitt Intel Core i7-12850HX (9869 - 11286, n=2) | |
| HP ZBook Fury 15 G8 | |
| Dell Precision 7670 | |
| Lenovo ThinkPad P1 G4-20Y4Z9DVUS | |
| AIDA64 / FPU Mandel | |
| Genomsnitt Intel Core i7-12850HX (34218 - 42580, n=2) | |
| Lenovo ThinkPad P1 G4-20Y4Z9DVUS | |
| HP ZBook Fury 15 G8 | |
| Dell Precision 7670 | |
| AIDA64 / CPU AES | |
| Lenovo ThinkPad P1 G4-20Y4Z9DVUS | |
| HP ZBook Fury 15 G8 | |
| Genomsnitt Intel Core i7-12850HX (63362 - 80775, n=2) | |
| Dell Precision 7670 | |
| AIDA64 / CPU ZLib | |
| Genomsnitt Intel Core i7-12850HX (817 - 1102, n=2) | |
| Dell Precision 7670 | |
| Lenovo ThinkPad P1 G4-20Y4Z9DVUS | |
| HP ZBook Fury 15 G8 | |
| Asus ProArt StudioBook 16 W7600H5A-2BL2 | |
| Asus ProArt StudioBook 16 W7600H5A-2BL2 | |
| Dell Precision 5000 5560 | |
| AIDA64 / FP64 Ray-Trace | |
| Genomsnitt Intel Core i7-12850HX (7671 - 9145, n=2) | |
| Lenovo ThinkPad P1 G4-20Y4Z9DVUS | |
| HP ZBook Fury 15 G8 | |
| Dell Precision 7670 | |
| AIDA64 / CPU PhotoWorxx | |
| Dell Precision 7670 | |
| Genomsnitt Intel Core i7-12850HX (33415 - 42035, n=2) | |
| HP ZBook Fury 15 G8 | |
| Lenovo ThinkPad P1 G4-20Y4Z9DVUS | |
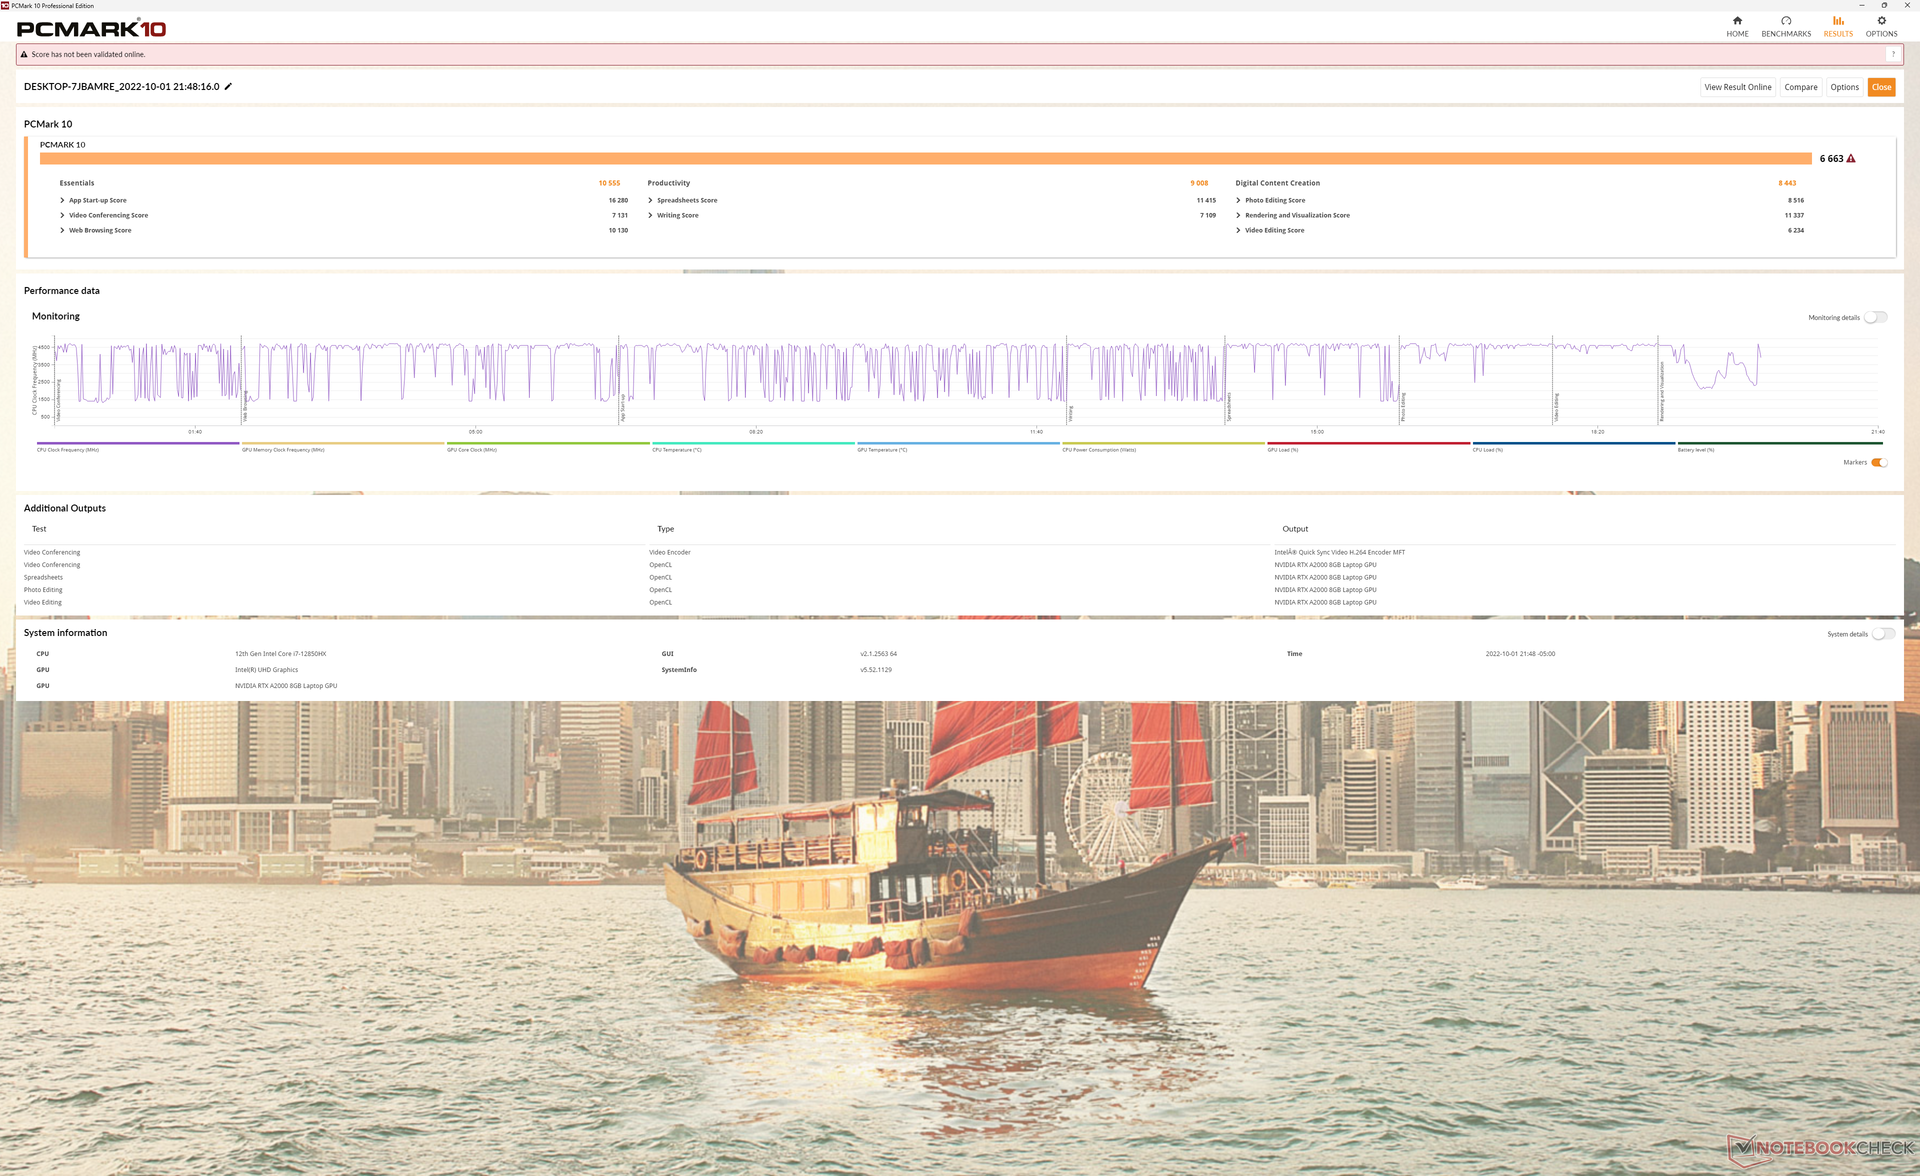
Systemets prestanda
PCMark 10-resultaten liknar andra arbetsstationer som drivs av Core H-seriens CPU:er och Nvidia Quadro GPU:er. Modeller med den snabbare RTX A5000 som HP ZBook Fury 15 G8 presterar fortfarande bättre än vår Precision 7670-testenhet i GPU-tunga riktmärken som Digital Content Creation.
CrossMark: Overall | Productivity | Creativity | Responsiveness
| PCMark 10 / Score | |
| Asus ProArt StudioBook 16 W7600H5A-2BL2 | |
| HP ZBook Fury 15 G8 | |
| Dell Precision 5000 5560 | |
| Dell Precision 7670 | |
| Lenovo ThinkPad P1 G4-20Y4Z9DVUS | |
| Dell Precision 7550 | |
| PCMark 10 / Essentials | |
| Dell Precision 5000 5560 | |
| Dell Precision 7670 | |
| Asus ProArt StudioBook 16 W7600H5A-2BL2 | |
| HP ZBook Fury 15 G8 | |
| Lenovo ThinkPad P1 G4-20Y4Z9DVUS | |
| Dell Precision 7550 | |
| PCMark 10 / Productivity | |
| Dell Precision 7670 | |
| Dell Precision 5000 5560 | |
| Asus ProArt StudioBook 16 W7600H5A-2BL2 | |
| HP ZBook Fury 15 G8 | |
| Lenovo ThinkPad P1 G4-20Y4Z9DVUS | |
| Dell Precision 7550 | |
| PCMark 10 / Digital Content Creation | |
| Asus ProArt StudioBook 16 W7600H5A-2BL2 | |
| HP ZBook Fury 15 G8 | |
| Dell Precision 5000 5560 | |
| Dell Precision 7670 | |
| Lenovo ThinkPad P1 G4-20Y4Z9DVUS | |
| Dell Precision 7550 | |
| CrossMark / Overall | |
| Lenovo ThinkPad P1 G4-20Y4Z9DVUS | |
| Dell Precision 7670 | |
| CrossMark / Productivity | |
| Lenovo ThinkPad P1 G4-20Y4Z9DVUS | |
| Dell Precision 7670 | |
| CrossMark / Creativity | |
| Dell Precision 7670 | |
| Lenovo ThinkPad P1 G4-20Y4Z9DVUS | |
| CrossMark / Responsiveness | |
| Lenovo ThinkPad P1 G4-20Y4Z9DVUS | |
| Dell Precision 7670 | |
| PCMark 10 Score | 6663 poäng | |
Hjälp | ||
| AIDA64 / Memory Copy | |
| Dell Precision 7670 | |
| HP ZBook Fury 15 G8 | |
| Lenovo ThinkPad P1 G4-20Y4Z9DVUS | |
| AIDA64 / Memory Read | |
| Dell Precision 7670 | |
| HP ZBook Fury 15 G8 | |
| Lenovo ThinkPad P1 G4-20Y4Z9DVUS | |
| AIDA64 / Memory Write | |
| Dell Precision 7670 | |
| HP ZBook Fury 15 G8 | |
| Lenovo ThinkPad P1 G4-20Y4Z9DVUS | |
| AIDA64 / Memory Latency | |
| HP ZBook Fury 15 G8 | |
| Dell Precision 7670 | |
| Lenovo ThinkPad P1 G4-20Y4Z9DVUS | |
| Asus ProArt StudioBook 16 W7600H5A-2BL2 | |
| Asus ProArt StudioBook 16 W7600H5A-2BL2 | |
* ... mindre är bättre
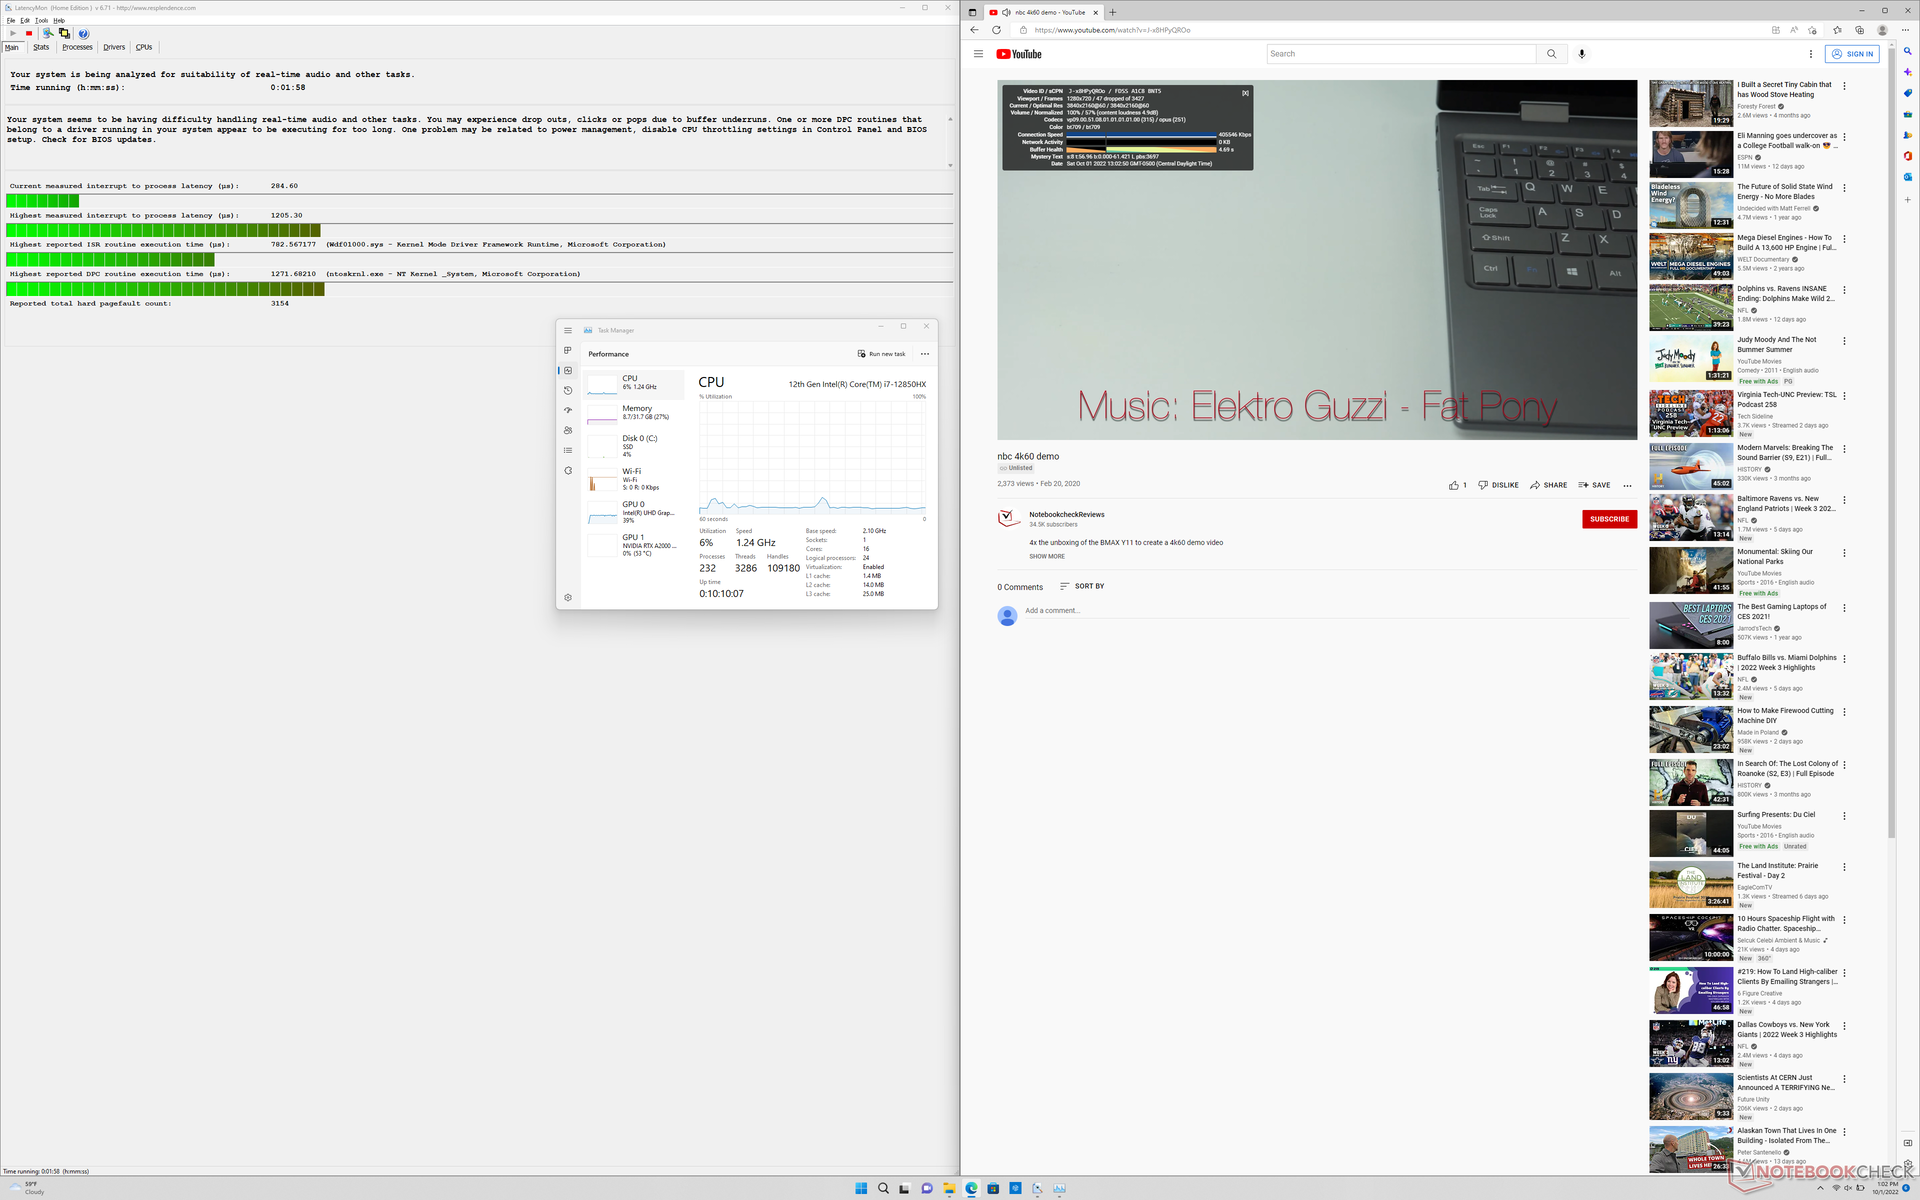
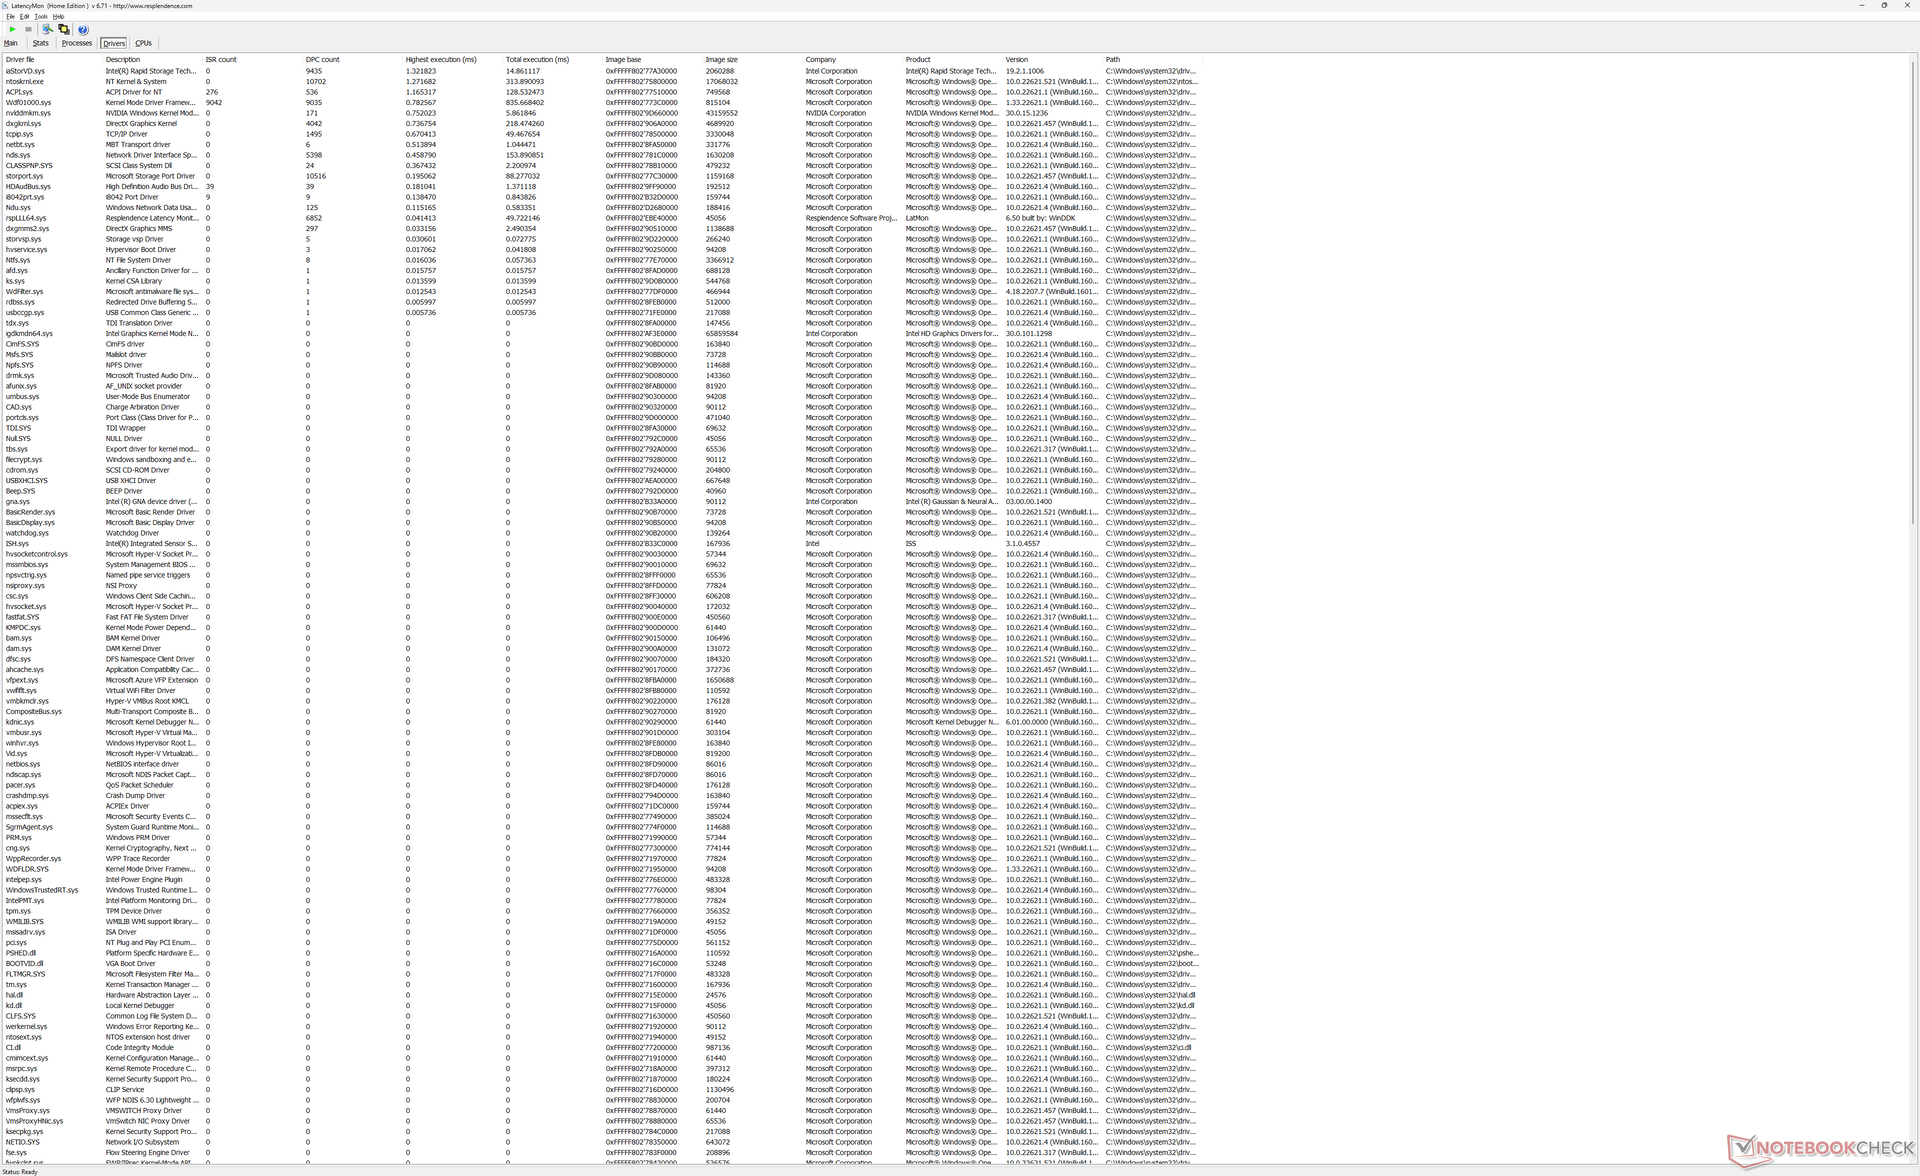
DPC-latenstid
latencyMon avslöjar mindre DPC-problem när man öppnar flera webbläsarflikar på vår hemsida. Dessutom är uppspelning av 4K-video vid 60 FPS ofullständig med 47 tappade bilder under vår minutlånga testvideo.
| DPC Latencies / LatencyMon - interrupt to process latency (max), Web, Youtube, Prime95 | |
| Dell Precision 7550 | |
| Asus ProArt StudioBook 16 W7600H5A-2BL2 | |
| Lenovo ThinkPad P1 G4-20Y4Z9DVUS | |
| Dell Precision 7670 | |
| Dell Precision 5000 5560 | |
| HP ZBook Fury 15 G8 | |
* ... mindre är bättre
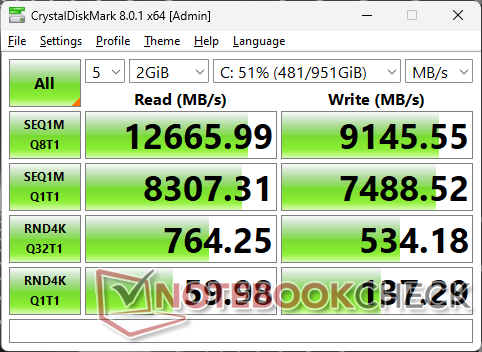
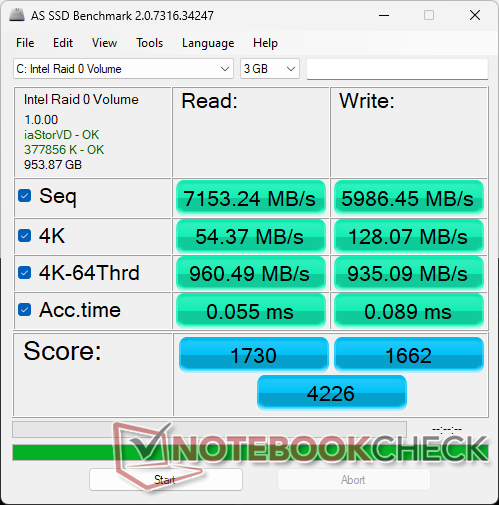
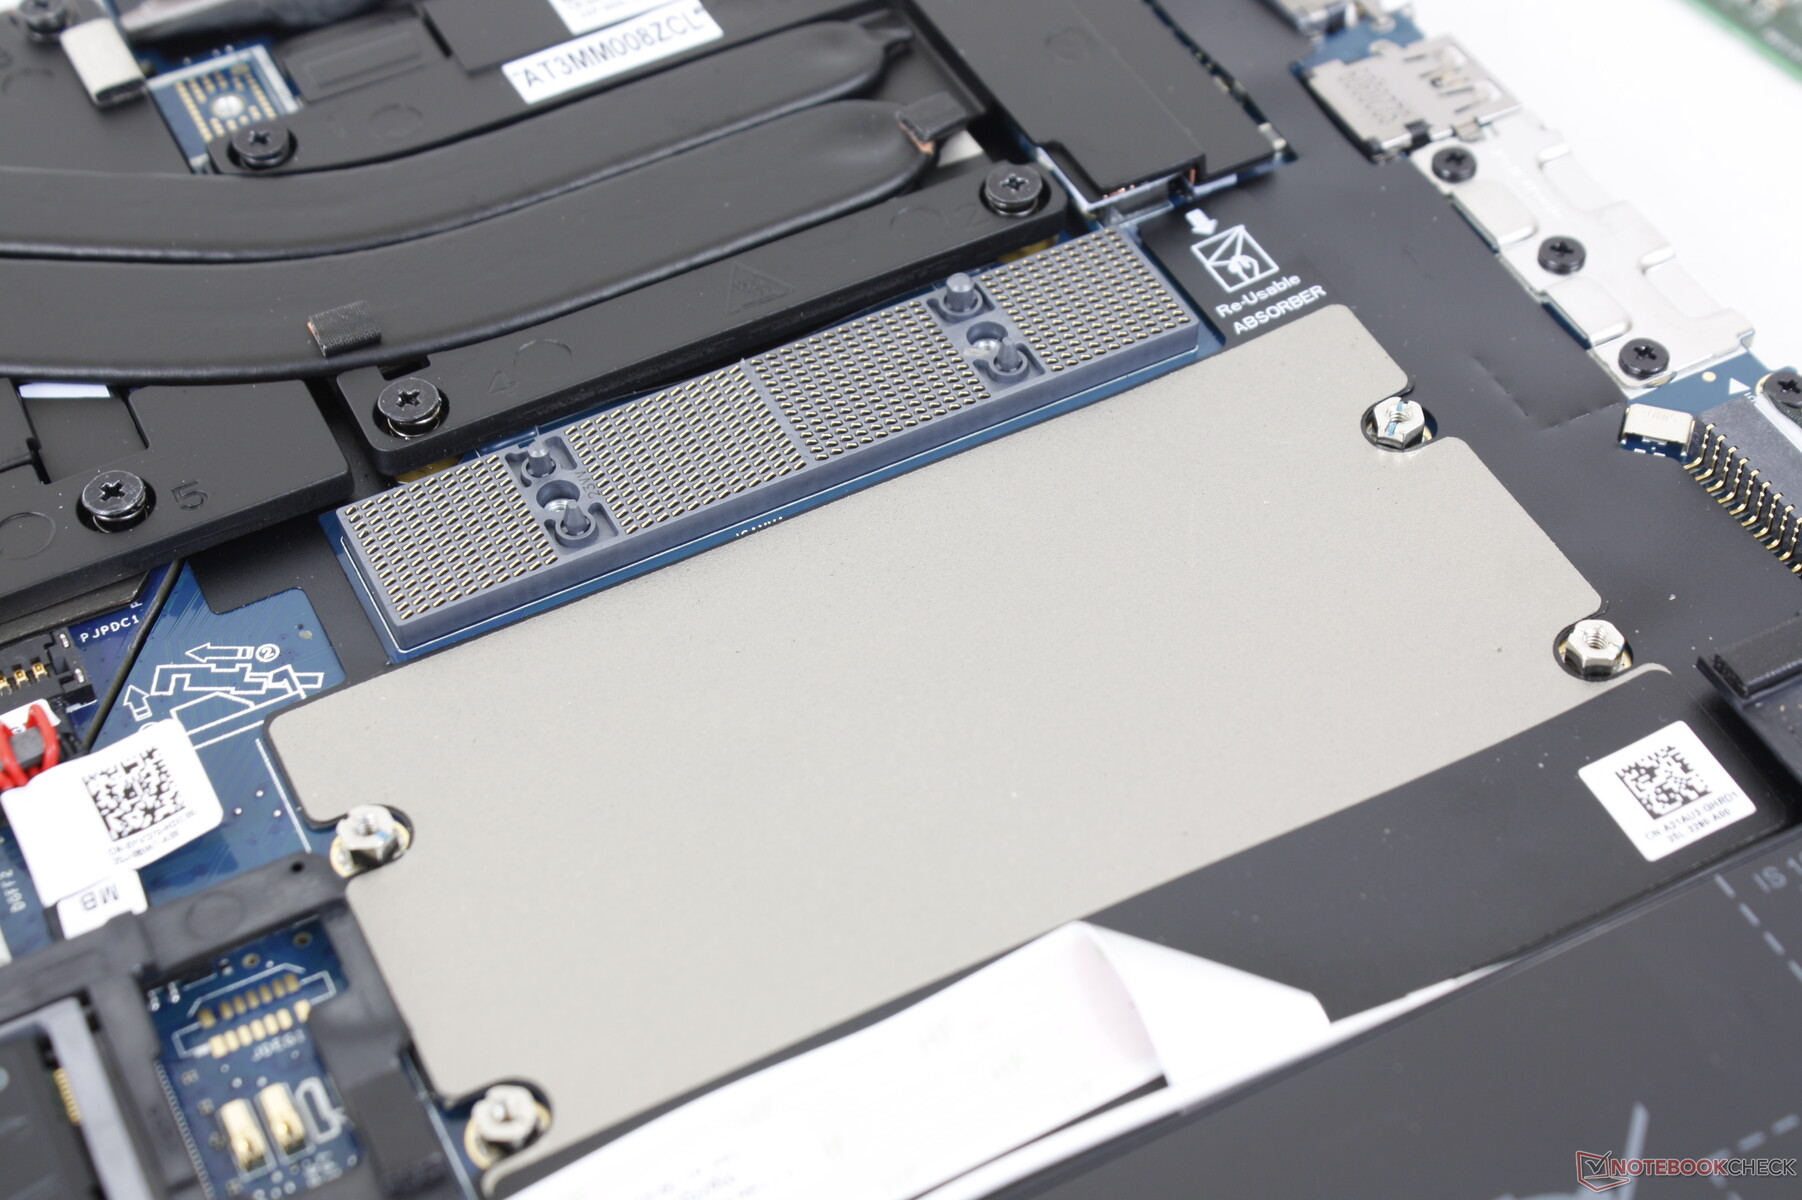
Lagringsenheter - Galna hastigheter med PCIe4 x4 RAID 0
Alla konfigurationer har stöd för upp till två M.2 SSD-enheter och vissa har stöd för upp till tre. Vår specifika testenhet är utrustad med två SK Hynix PC801 PCIe4 x4 NVMe SSD-diskar i RAID 0 för sekventiell läs- och skrivhastighet på nästan 13000 MB/s respektive 9200 MB/s. När enheterna stressades under DiskSpd visade de inga tecken på prestandakraftsbegränsning, inte ens efter långa perioder. Det finns värmespridare eller termiska kuddar ovanpå de medföljande SSD-diskarna för att underlätta värmeavledningen.

| Drive Performance rating - Percent | |
| Dell Precision 5000 5560 | |
| Dell Precision 7670 | |
| Lenovo ThinkPad P1 G4-20Y4Z9DVUS | |
| Asus ProArt StudioBook 16 W7600H5A-2BL2 | |
| HP ZBook Fury 15 G8 | |
| Dell Precision 7550 | |
* ... mindre är bättre
Disk Throttling: DiskSpd Read Loop, Queue Depth 8
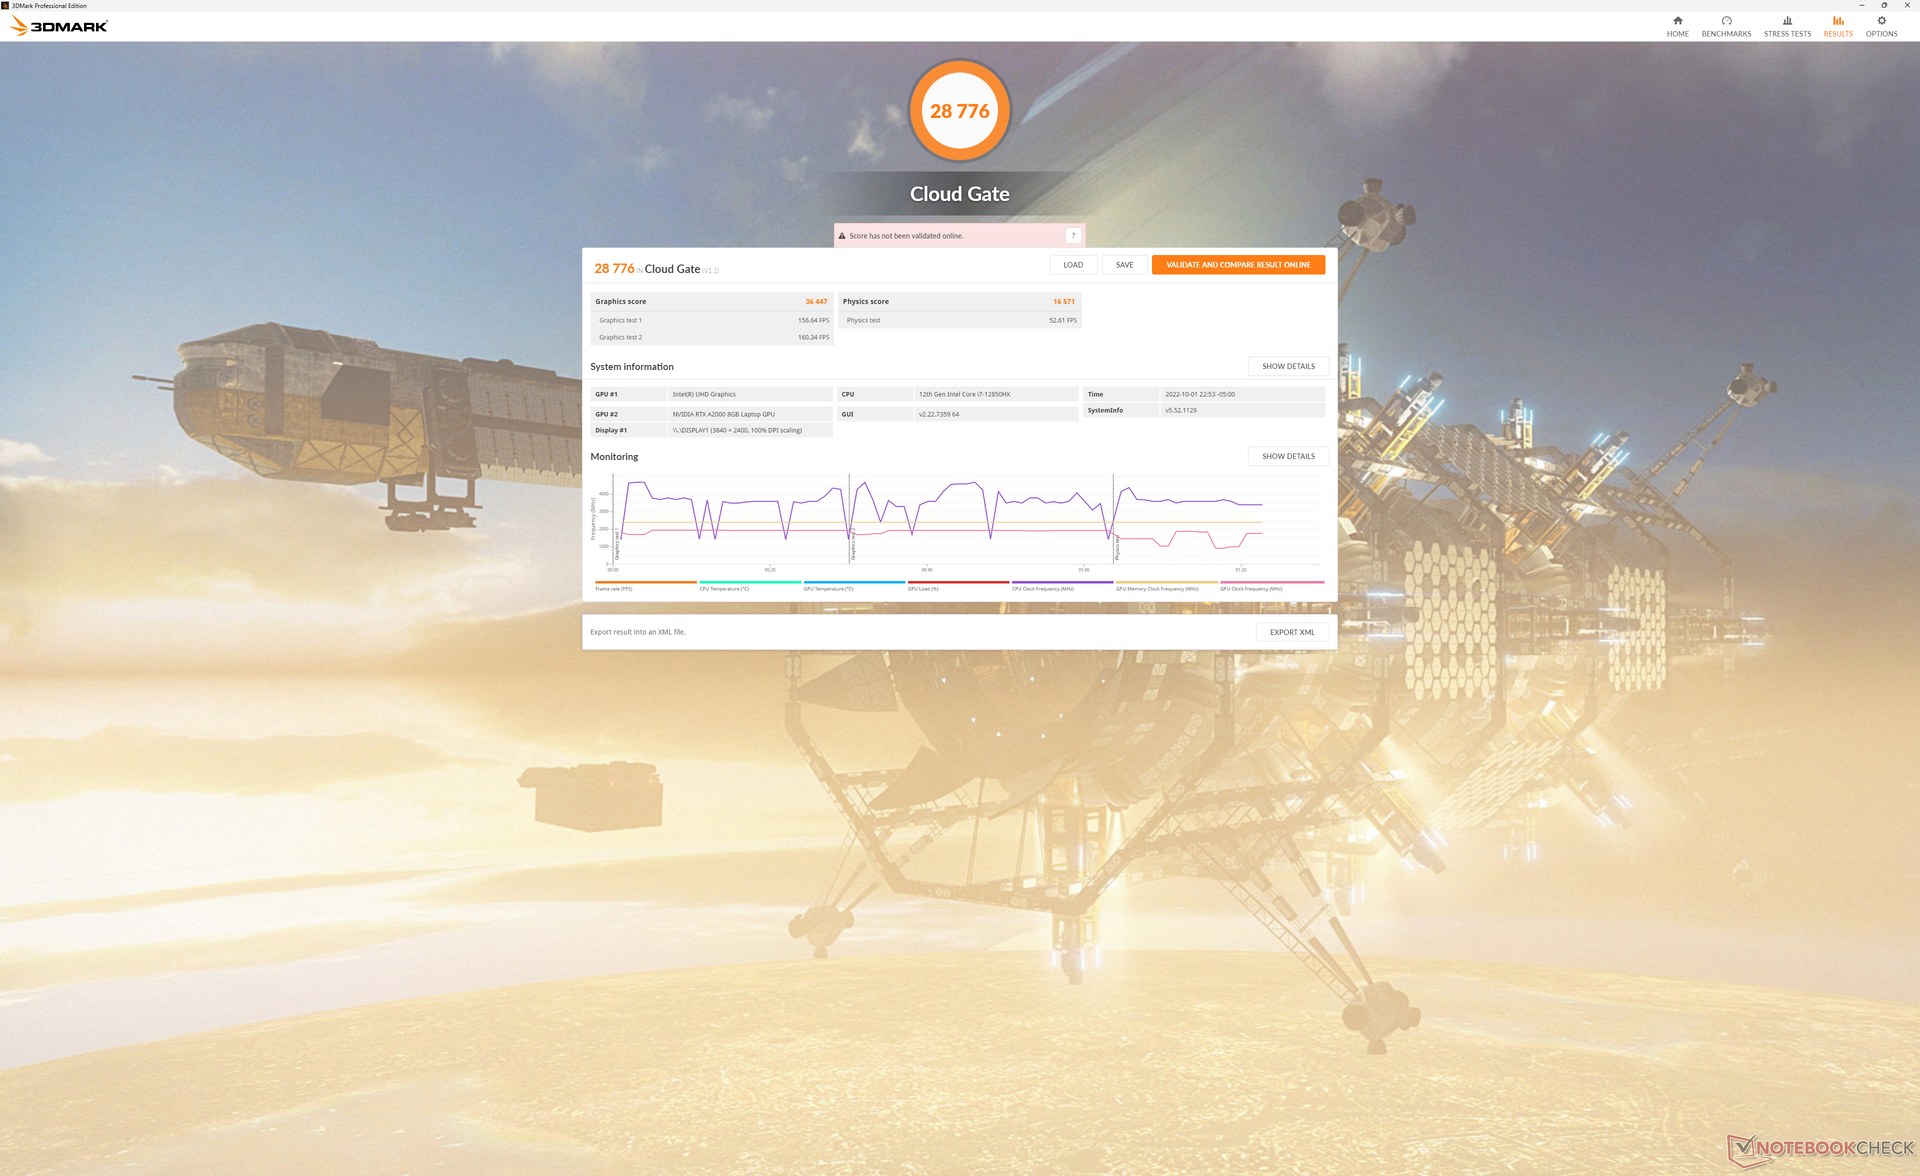
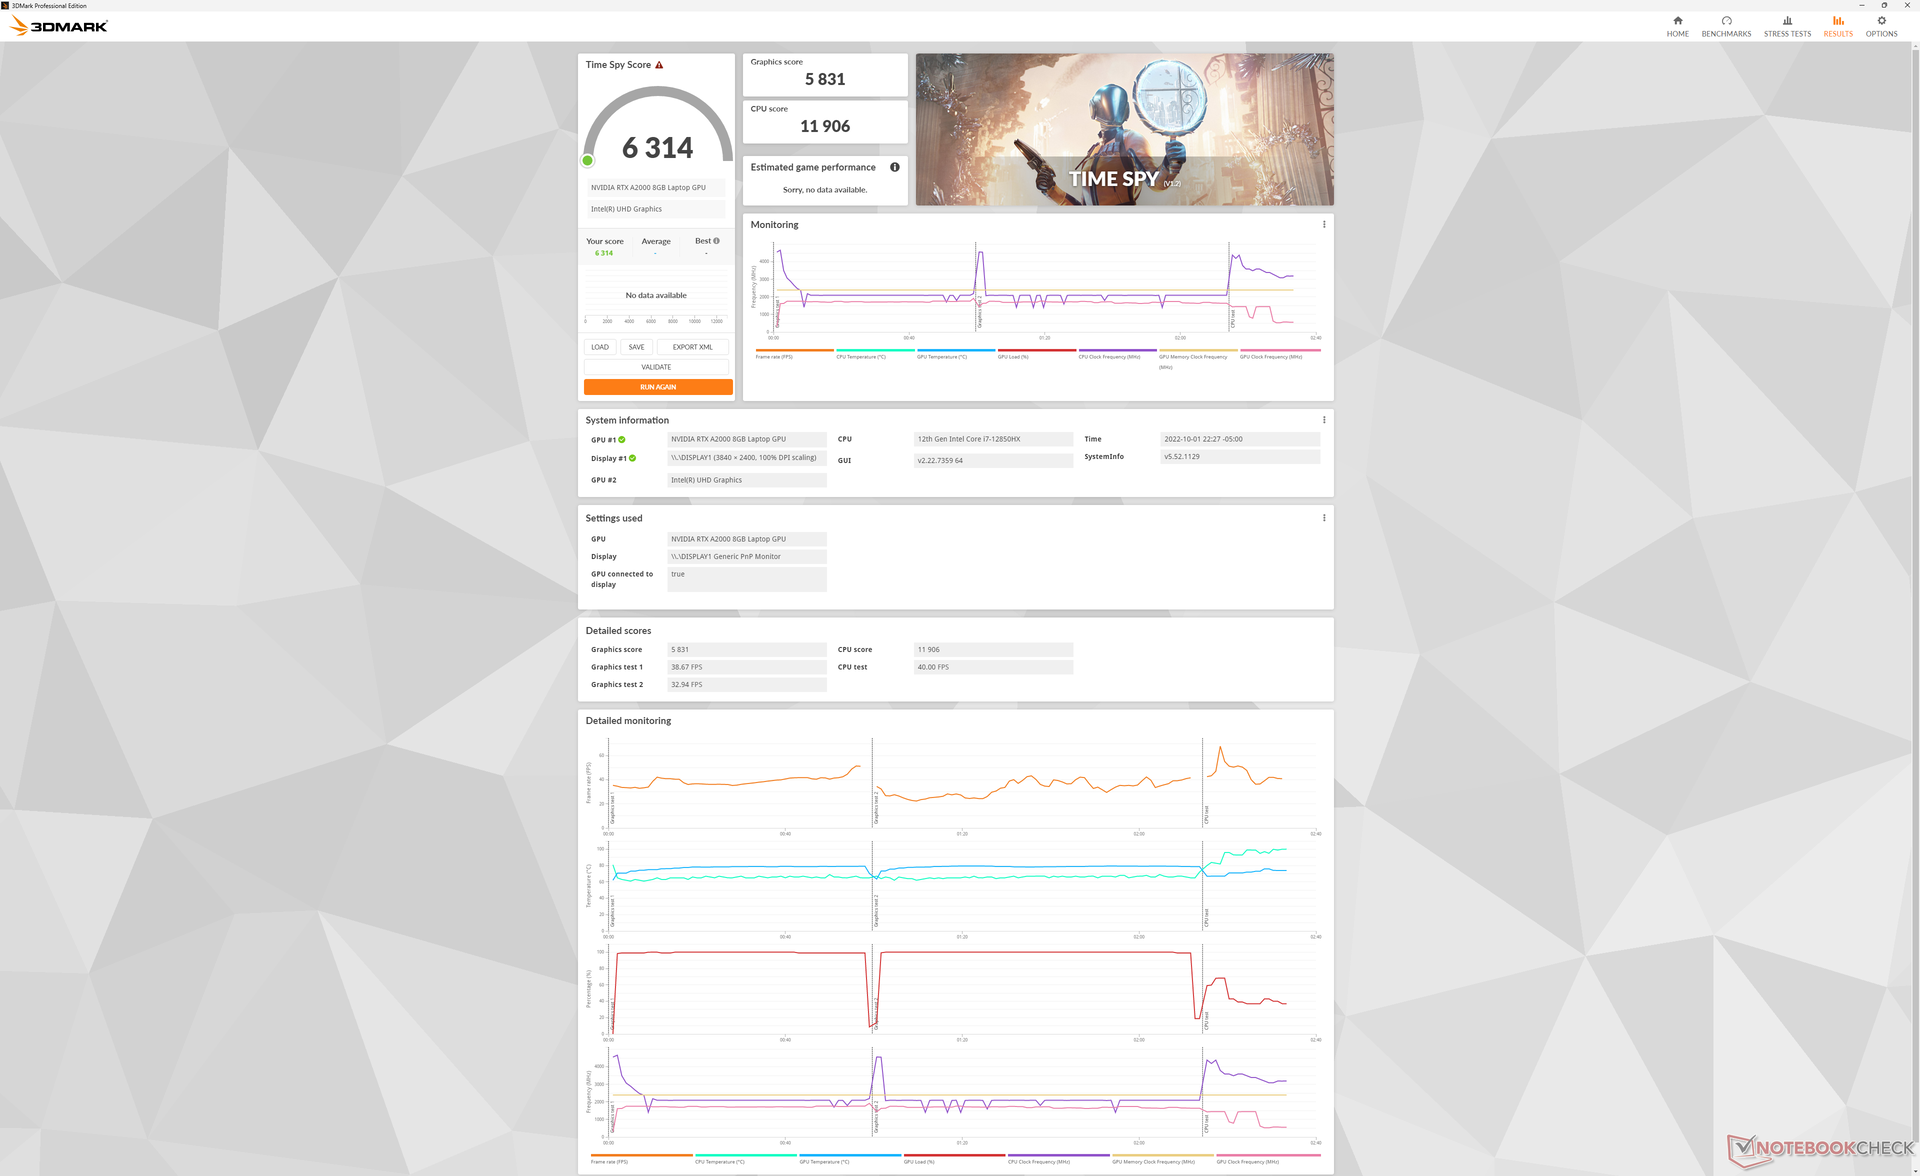
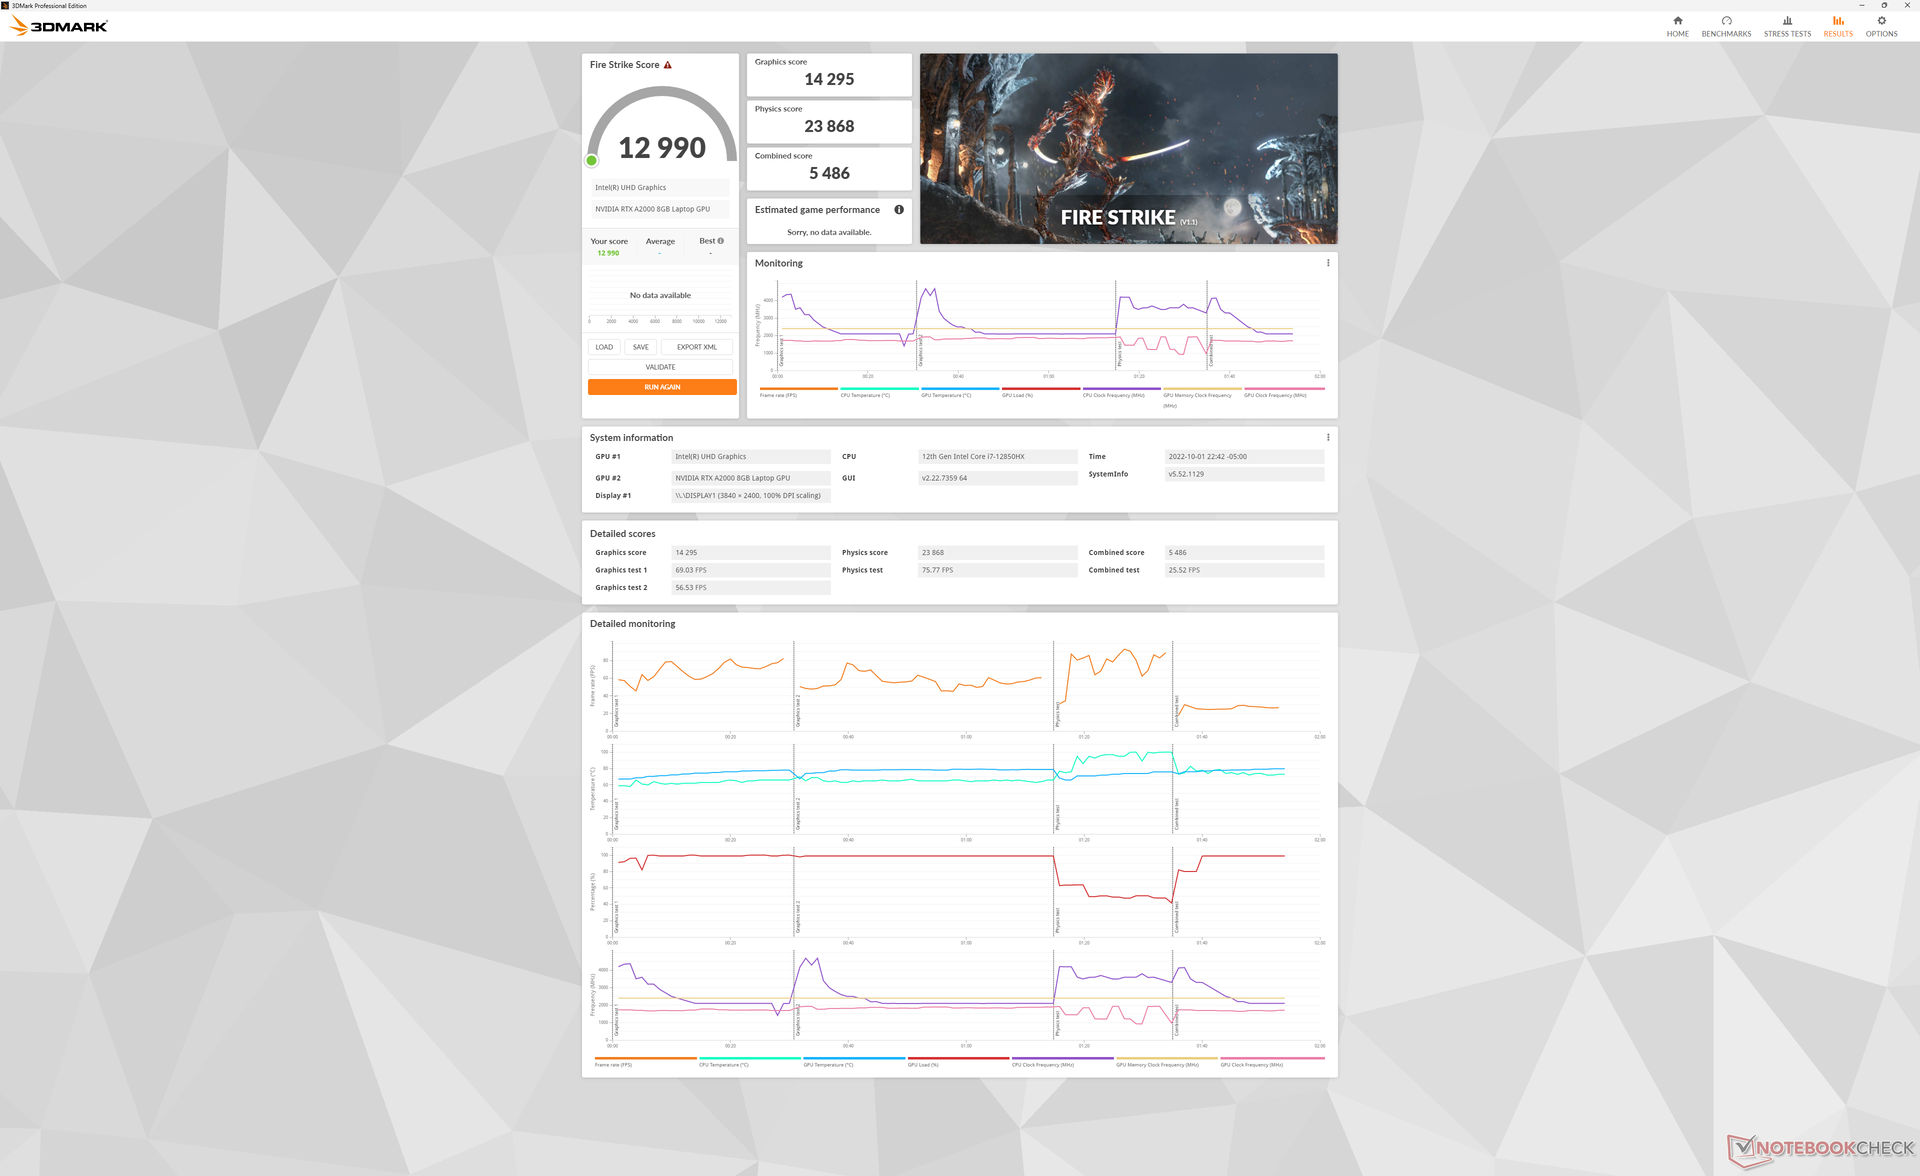
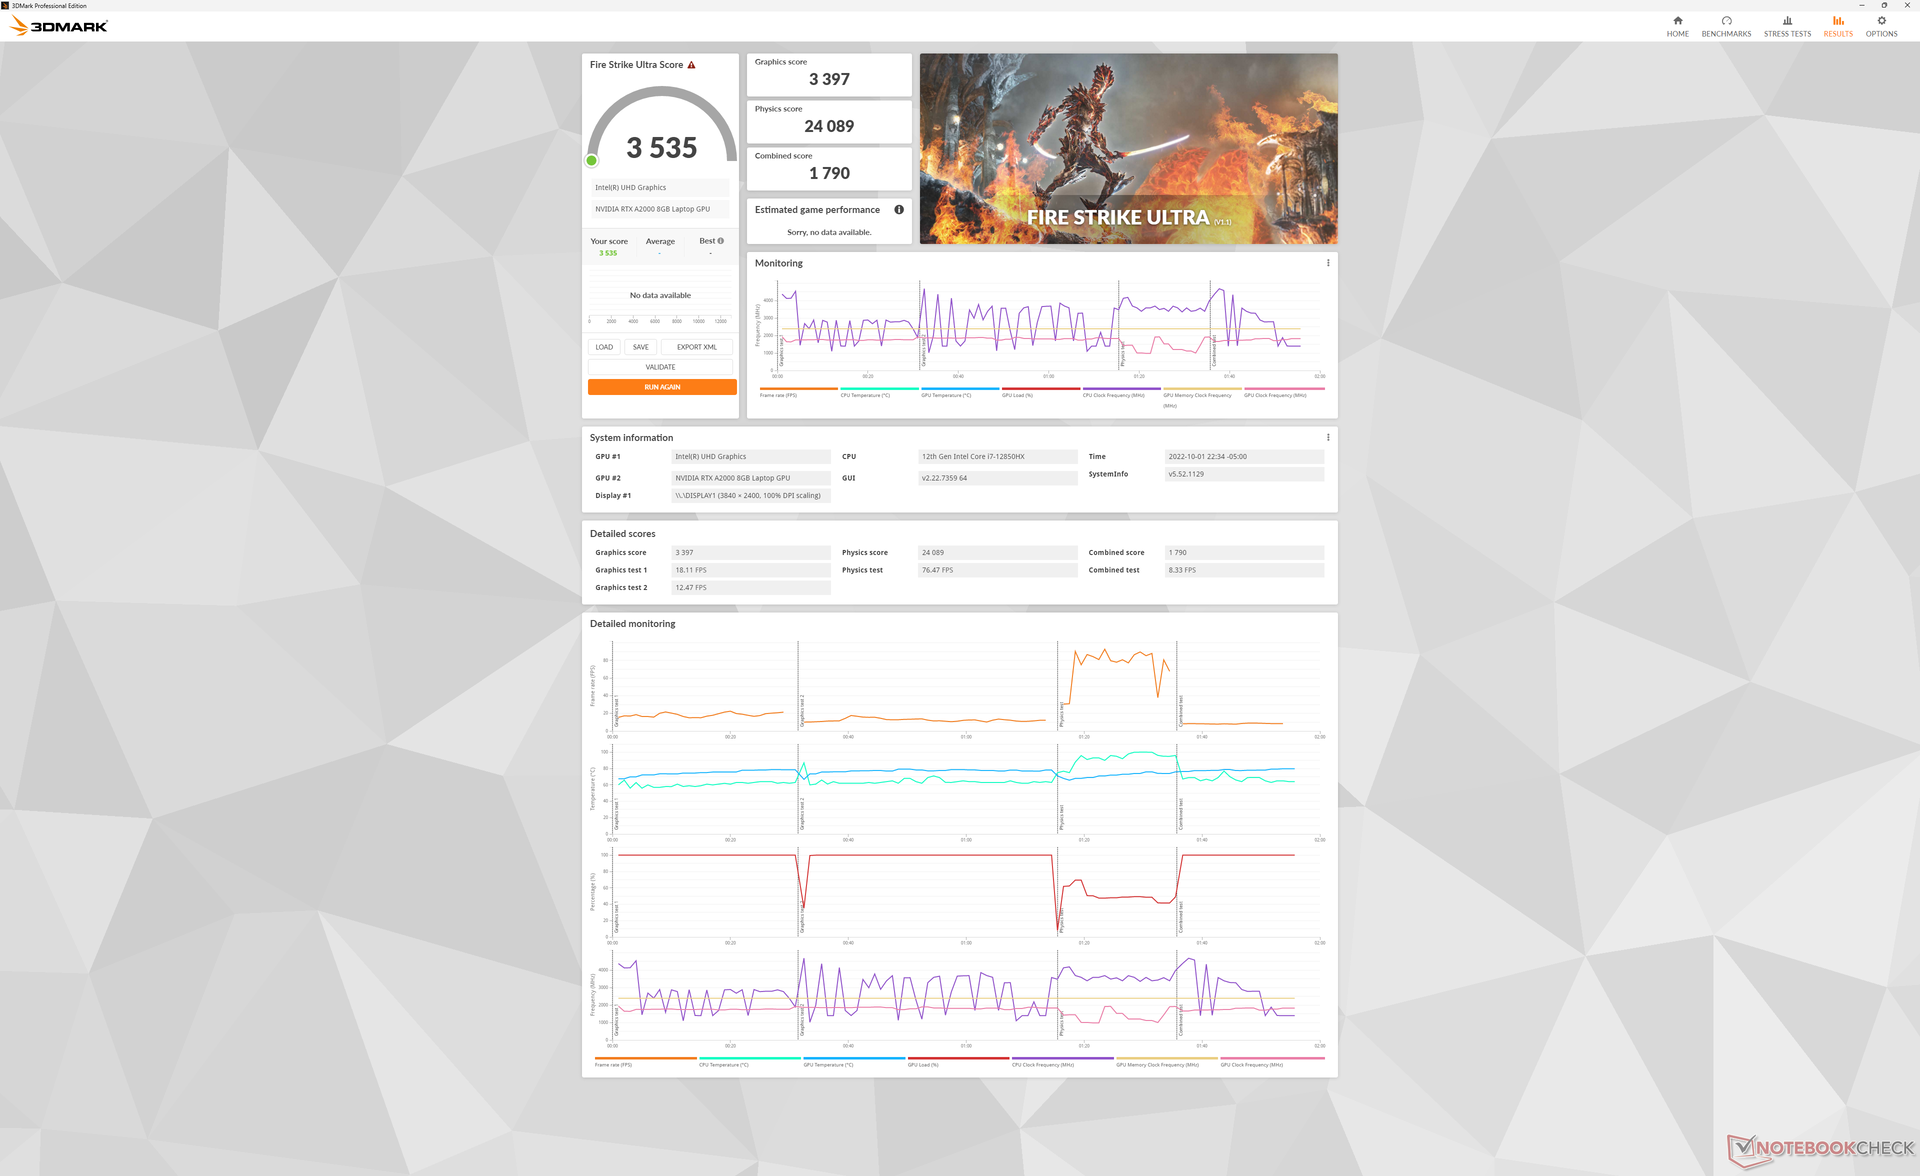
GPU-prestanda - 95 W TGP Graphics
RTX A2000 härstammar från GeForce RTX 3050 Ti och därför har båda GPU:erna liknande råprestanda. Uppgradering till RTX A3000 eller RTX A5500 förväntas öka prestandan med 15-20 procent respektive 70-90 procent.
Intressant nog är prestandan för ray-tracing Port Royal betydligt bättre än vad vi noterade på den äldrePrecision 5560 trots att de delar samma RTX A2000 GPU. Vi misstänker att detta kan bero på både det mycket högre TGP-målet (95 W jämfört med 45 W) och den nyare Nvidia-drivrutinen (512.36 jämfört med 472.12) på vår Precision 7670.
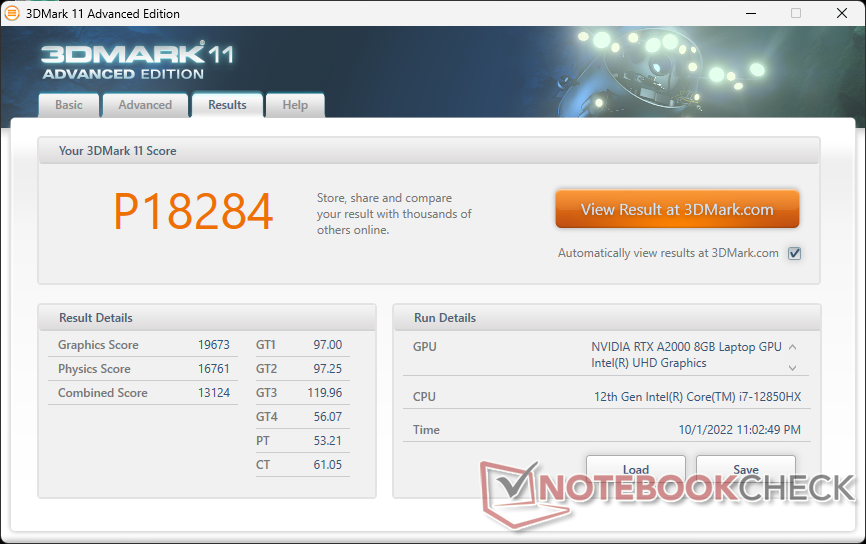

| 3DMark 11 Performance | 18284 poäng | |
| 3DMark Cloud Gate Standard Score | 28776 poäng | |
| 3DMark Fire Strike Score | 12990 poäng | |
| 3DMark Time Spy Score | 6314 poäng | |
Hjälp | ||
| Blender | |
| v3.3 Classroom HIP/AMD | |
| Lenovo Legion 7 16ARHA7 | |
| v3.3 Classroom OPTIX/RTX | |
| Dell Precision 5000 5470 | |
| HP Envy 16 h0112nr | |
| Dell Precision 7670 | |
| v3.3 Classroom CUDA | |
| Dell Precision 5000 5470 | |
| HP Envy 16 h0112nr | |
| Dell Precision 7670 | |
| v3.3 Classroom CPU | |
| HP Envy 16 h0112nr | |
| Dell Precision 5000 5470 | |
| Lenovo Legion 7 16ARHA7 | |
| Dell Precision 7670 | |
* ... mindre är bättre
Witcher 3 FPS Chart
| låg | med. | hög | ultra | QHD | 4K | |
|---|---|---|---|---|---|---|
| GTA V (2015) | 181.7 | 177.6 | 155.1 | 79.1 | 57.1 | |
| The Witcher 3 (2015) | 297.1 | 181.7 | 108.6 | 57.4 | ||
| Dota 2 Reborn (2015) | 180.8 | 159.3 | 145.1 | 128.8 | 78.5 | |
| Final Fantasy XV Benchmark (2018) | 129.5 | 80.4 | 60.6 | 44.4 | 26 | |
| X-Plane 11.11 (2018) | 135.2 | 104.1 | 85.5 | 55.1 | ||
| Strange Brigade (2018) | 325 | 151.2 | 120.9 | 103.5 | 76.8 | |
| Cyberpunk 2077 1.6 (2022) | 78.5 | 65.1 | 55 | 44.3 | 27.4 |
Utsläpp
Systembrus
Fläktarna är nästan aldrig tysta även när de går på tomgång på skrivbordet, men de är ändå tysta och svåra att märka vid låg belastning. Räkna med att ljudnivåerna håller sig under 28 dB(A) mot en tyst bakgrund på 22,7 dB(A) vid videouppspelning. Fläktljudet är ännu tystare med 24,5 dB(A) vid webbsurfning eller ordbehandling, vilket liknar vad vi observerade på ZBook Fury 15 G8 eller Precision 5560
Bullernivåerna ökar något snabbt när högre belastning introduceras. Den första benchmark-scenen i 3DMark 06, till exempel, skulle få fläktljudet att bli så högt som 49 dB(A) även när den är inställd på Balanced power-profilen. Fläktljudet skulle nå en topp på cirka 52 dB(A) om man körde extrema belastningar som Prime95 och FurMark, precis som på Precision 5560. Med andra ord är Precision 7670 tyst under de flesta förhållanden, men den blir ganska högljudd om den utsätts för minsta belastning.
Ljudnivå
| Låg belastning |
| 22.9 / 22.9 / 24.5 dB(A) |
| Hög belastning |
| 48.7 / 52.1 dB(A) |
 | ||
30 dB tyst 40 dB(A) hörbar 50 dB(A) högt ljud |
||
min: | ||
| Dell Precision 7670 RTX A2000 Laptop GPU, i7-12850HX, SK Hynix HFS001TEJ9X115N | Lenovo ThinkPad P1 G4-20Y4Z9DVUS T1200 Laptop GPU, i7-11800H, Samsung PM9A1 MZVL2512HCJQ | Asus ProArt StudioBook 16 W7600H5A-2BL2 RTX A5000 Laptop GPU, W-11955M, 2x Micron 2300 2TB MTFDHBA2T0TDV (RAID 0) | Dell Precision 5000 5560 RTX A2000 Laptop GPU, i7-11850H, Samsung PM9A1 MZVL22T0HBLB | Dell Precision 7550 Quadro RTX 5000 Max-Q, W-10885M, SK Hynix PC601A NVMe 1TB | HP ZBook Fury 15 G8 RTX A5000 Laptop GPU, i9-11950H, Samsung PM981a MZVLB1T0HBLR | |
|---|---|---|---|---|---|---|
| Noise | -3% | -3% | 11% | -9% | 3% | |
| av / miljö * (dB) | 22.7 | 24.3 -7% | 26 -15% | 23.4 -3% | 25.8 -14% | 24.1 -6% |
| Idle Minimum * (dB) | 22.9 | 24.3 -6% | 26 -14% | 23.6 -3% | 25.8 -13% | 24.1 -5% |
| Idle Average * (dB) | 22.9 | 24.3 -6% | 26 -14% | 23.6 -3% | 25.8 -13% | 24.1 -5% |
| Idle Maximum * (dB) | 24.5 | 26.6 -9% | 26.5 -8% | 23.6 4% | 25.9 -6% | 24.8 -1% |
| Load Average * (dB) | 48.7 | 46.8 4% | 42 14% | 25.8 47% | 51.2 -5% | 37.8 22% |
| Witcher 3 ultra * (dB) | 45.2 | 46.8 -4% | 40.1 11% | 51.9 -15% | 44.2 2% | |
| Load Maximum * (dB) | 52.1 | 46.8 10% | 43 17% | 41.4 21% | 51.9 -0% | 44.2 15% |
* ... mindre är bättre
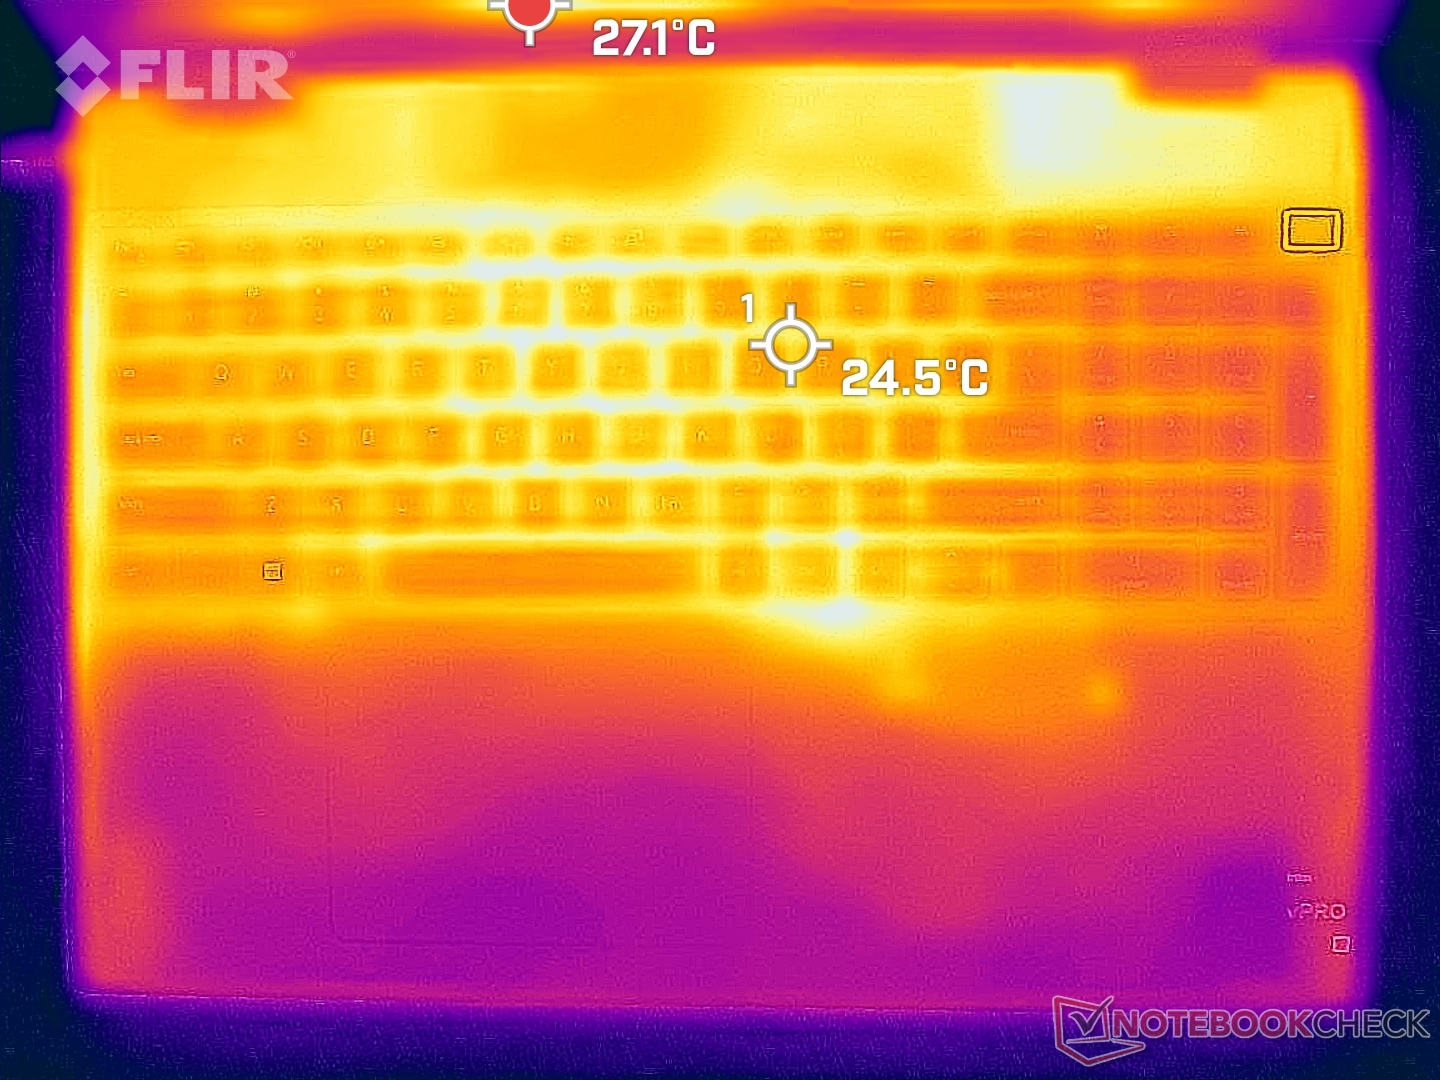
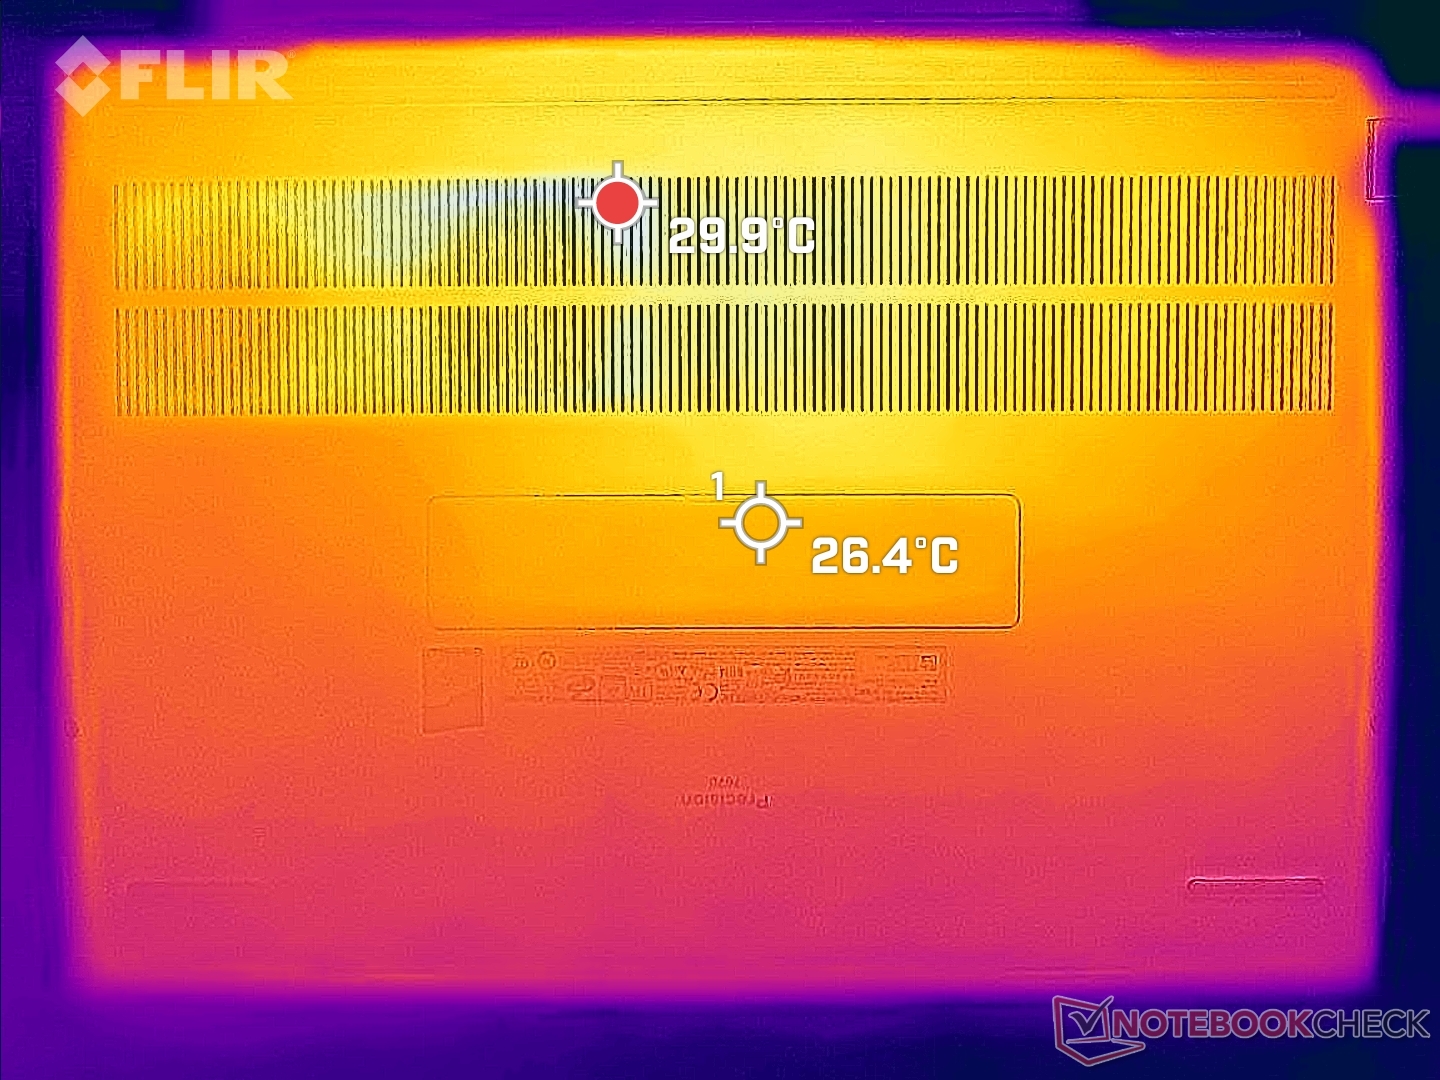
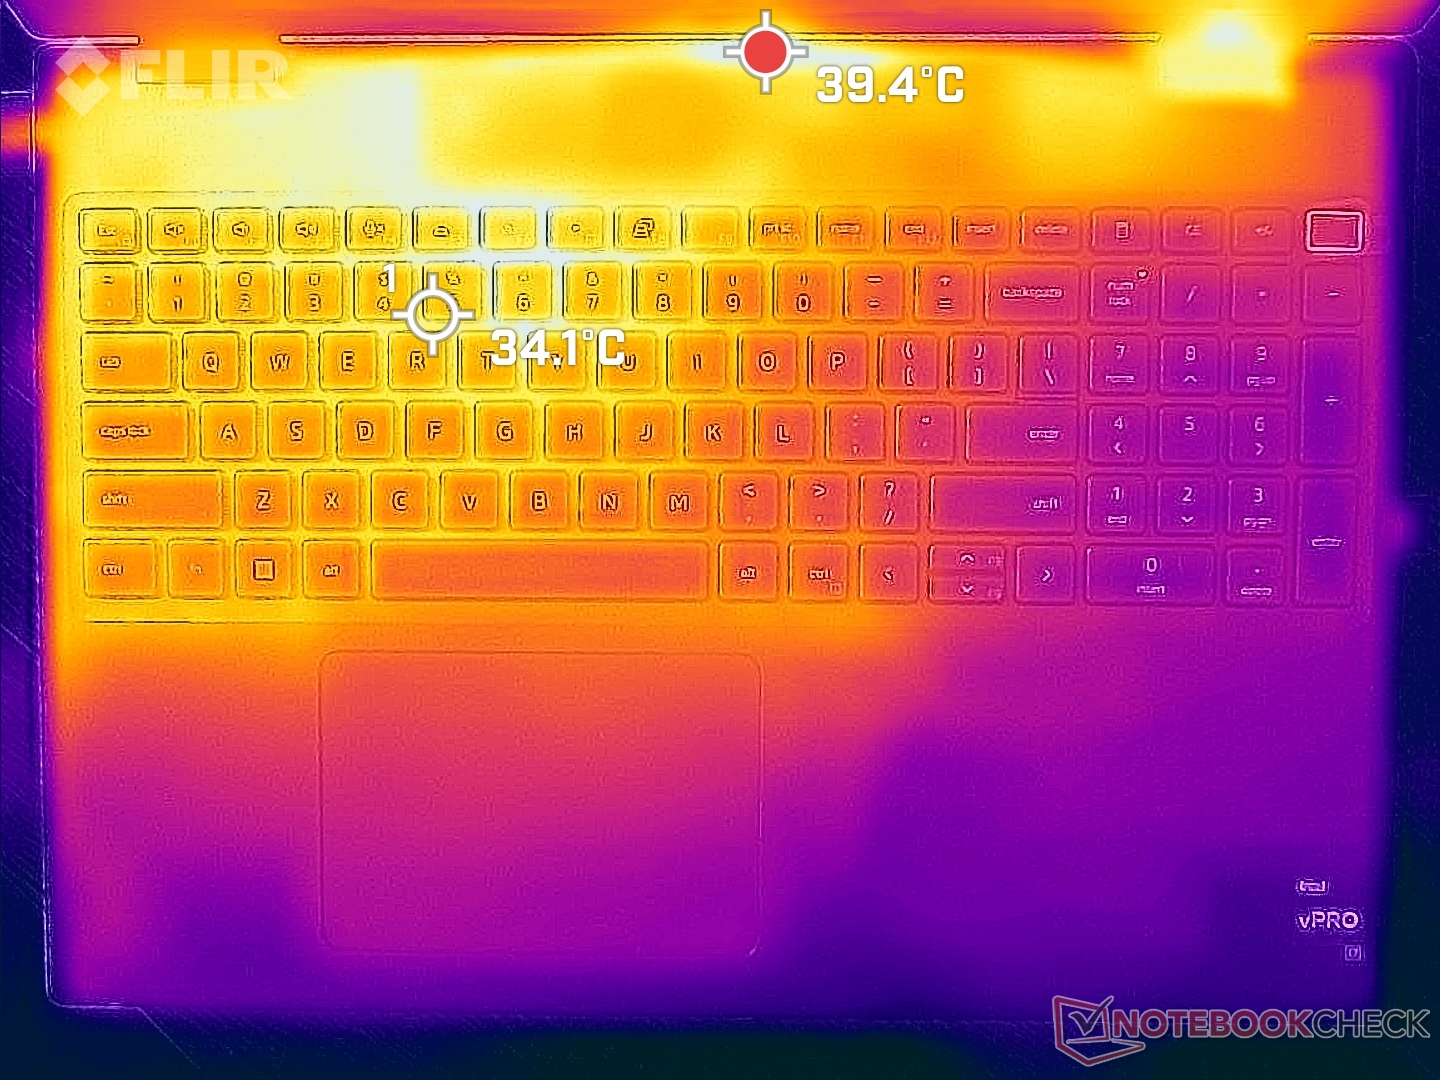
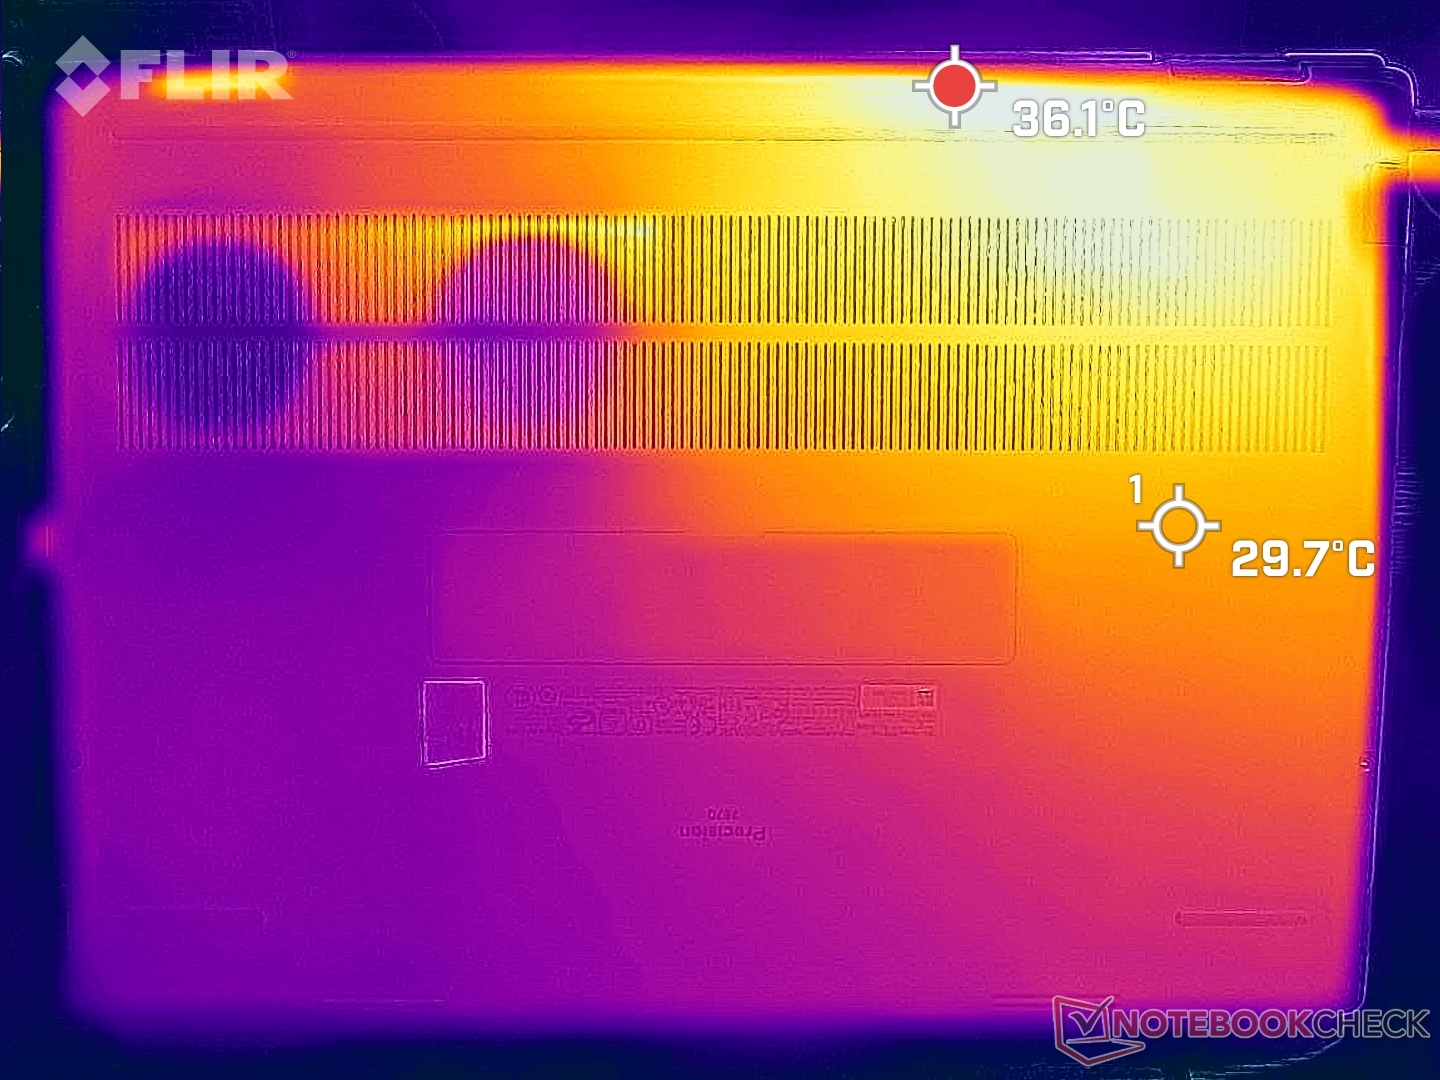
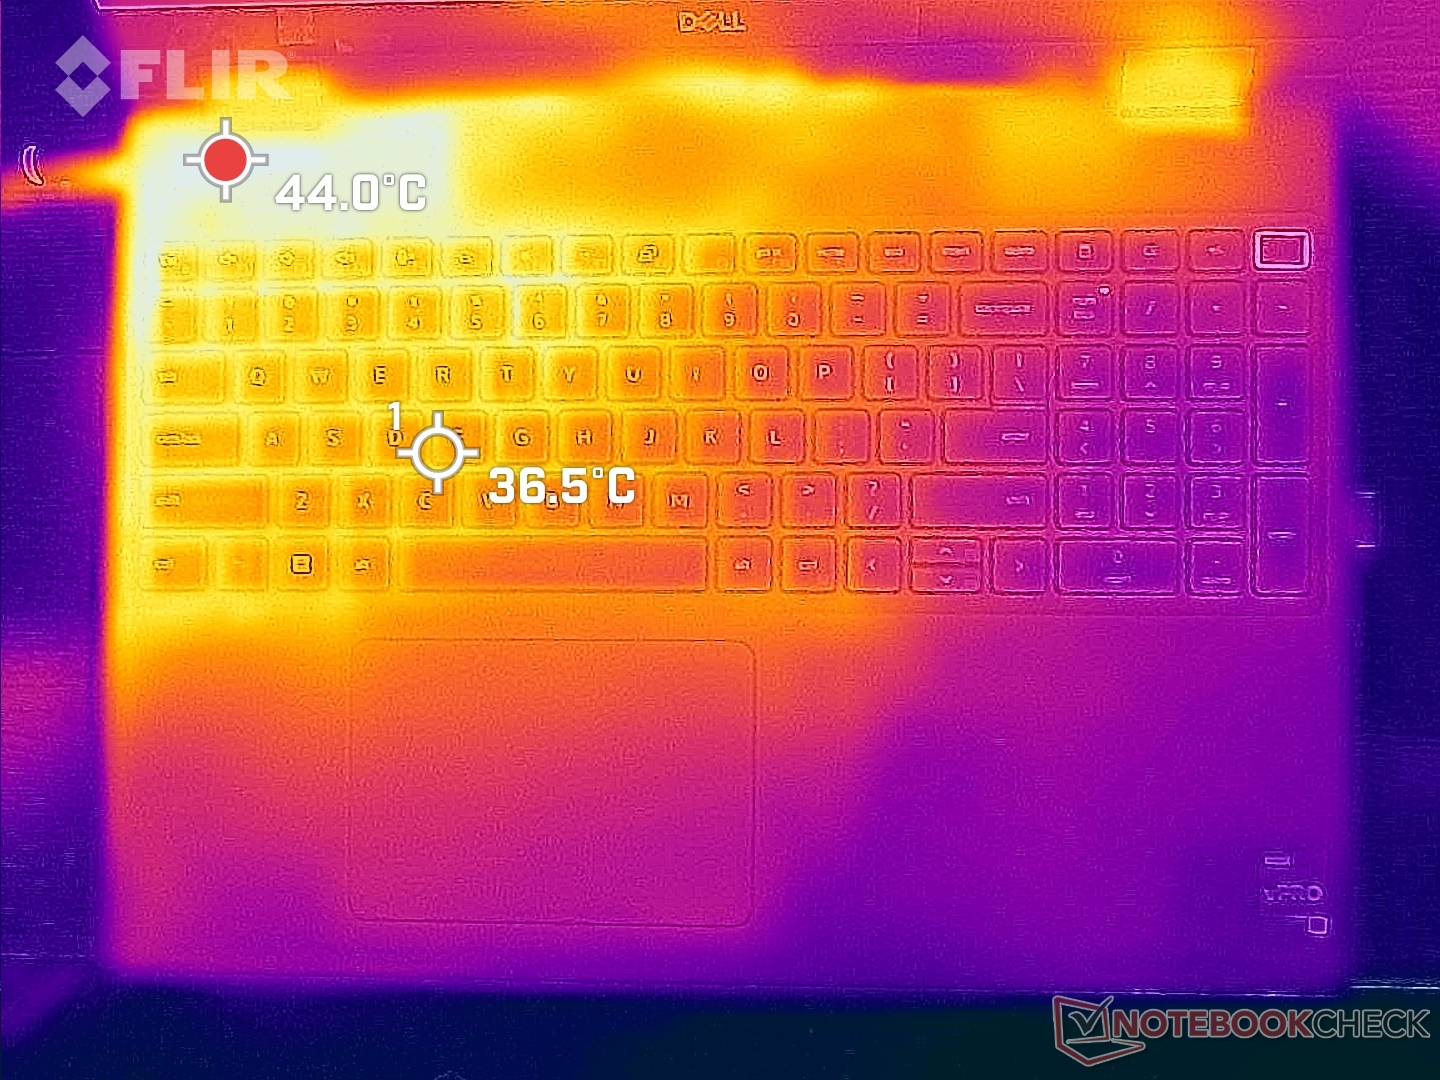
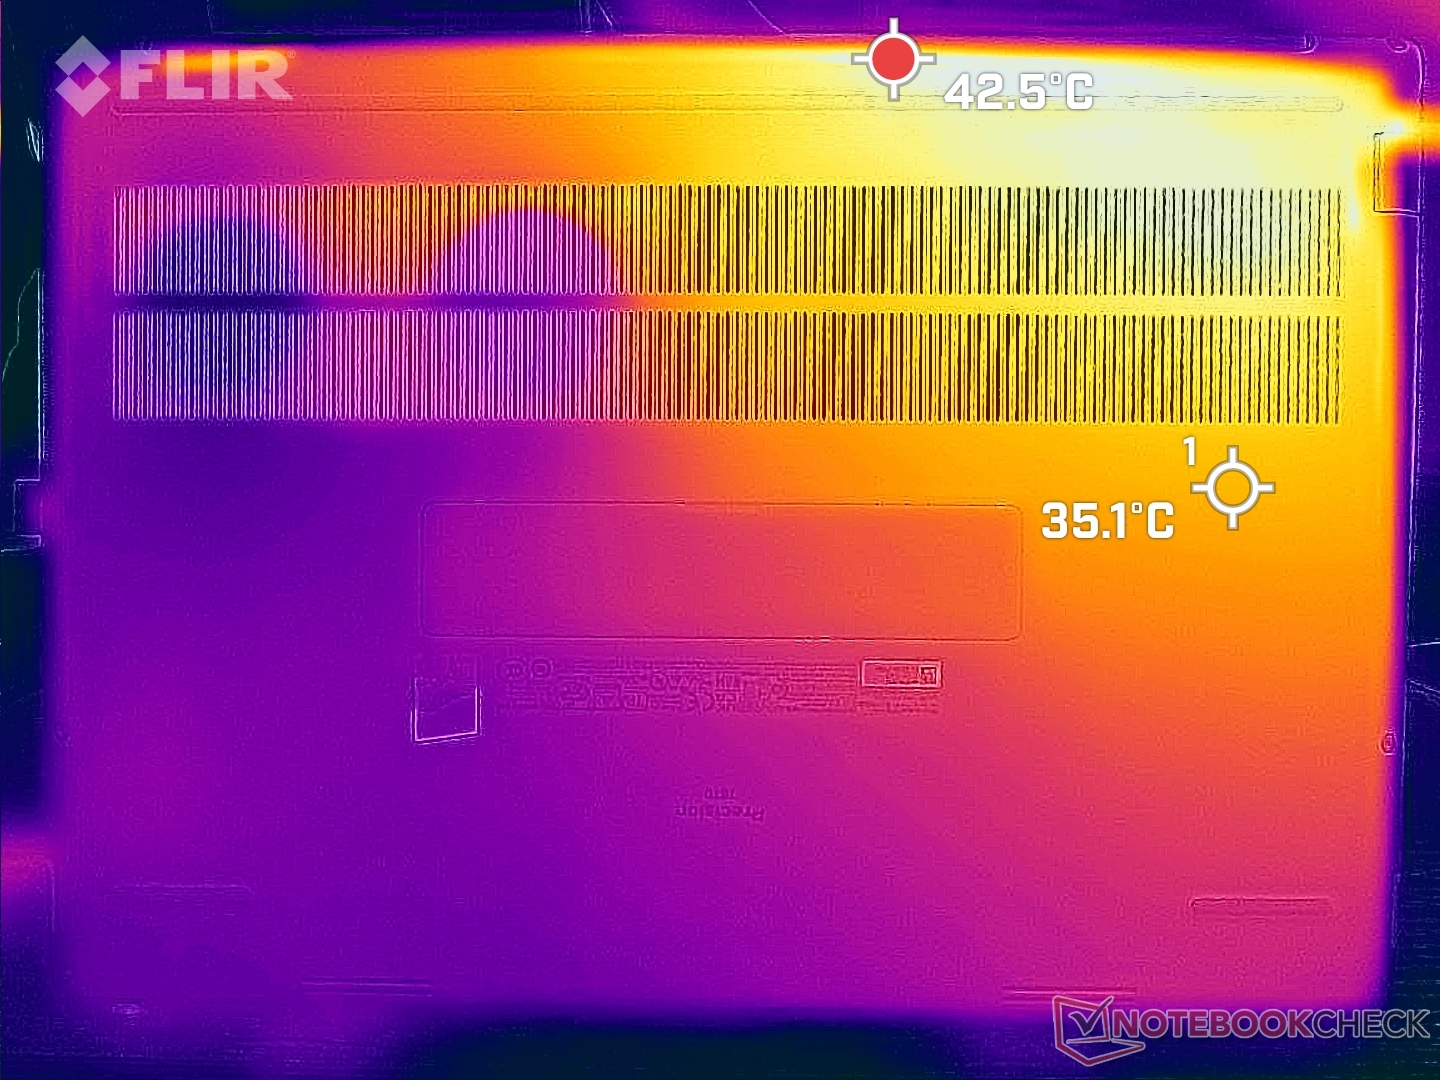
Temperatur
Yttemperaturerna är alltid varma oavsett belastning på skärmen. Vid tomgång i energisparläge skulle till exempel tangentbordsdäcket och -botten ligga på 30 C vardera jämfört med 26 C påLenovo ThinkPad P1 G4. Asus ProArt StudioBook Pro 16 kan vara ännu varmare med nästan 35 C under liknande förhållanden.
Vi kan registrera heta punkter på 51 C och 46 C på toppen respektive botten när vi kör extrema belastningar. Den vänstra halvan av chassit kommer alltid att vara varmare än den högra på grund av hur kylningslösningen och processorerna är placerade inuti.
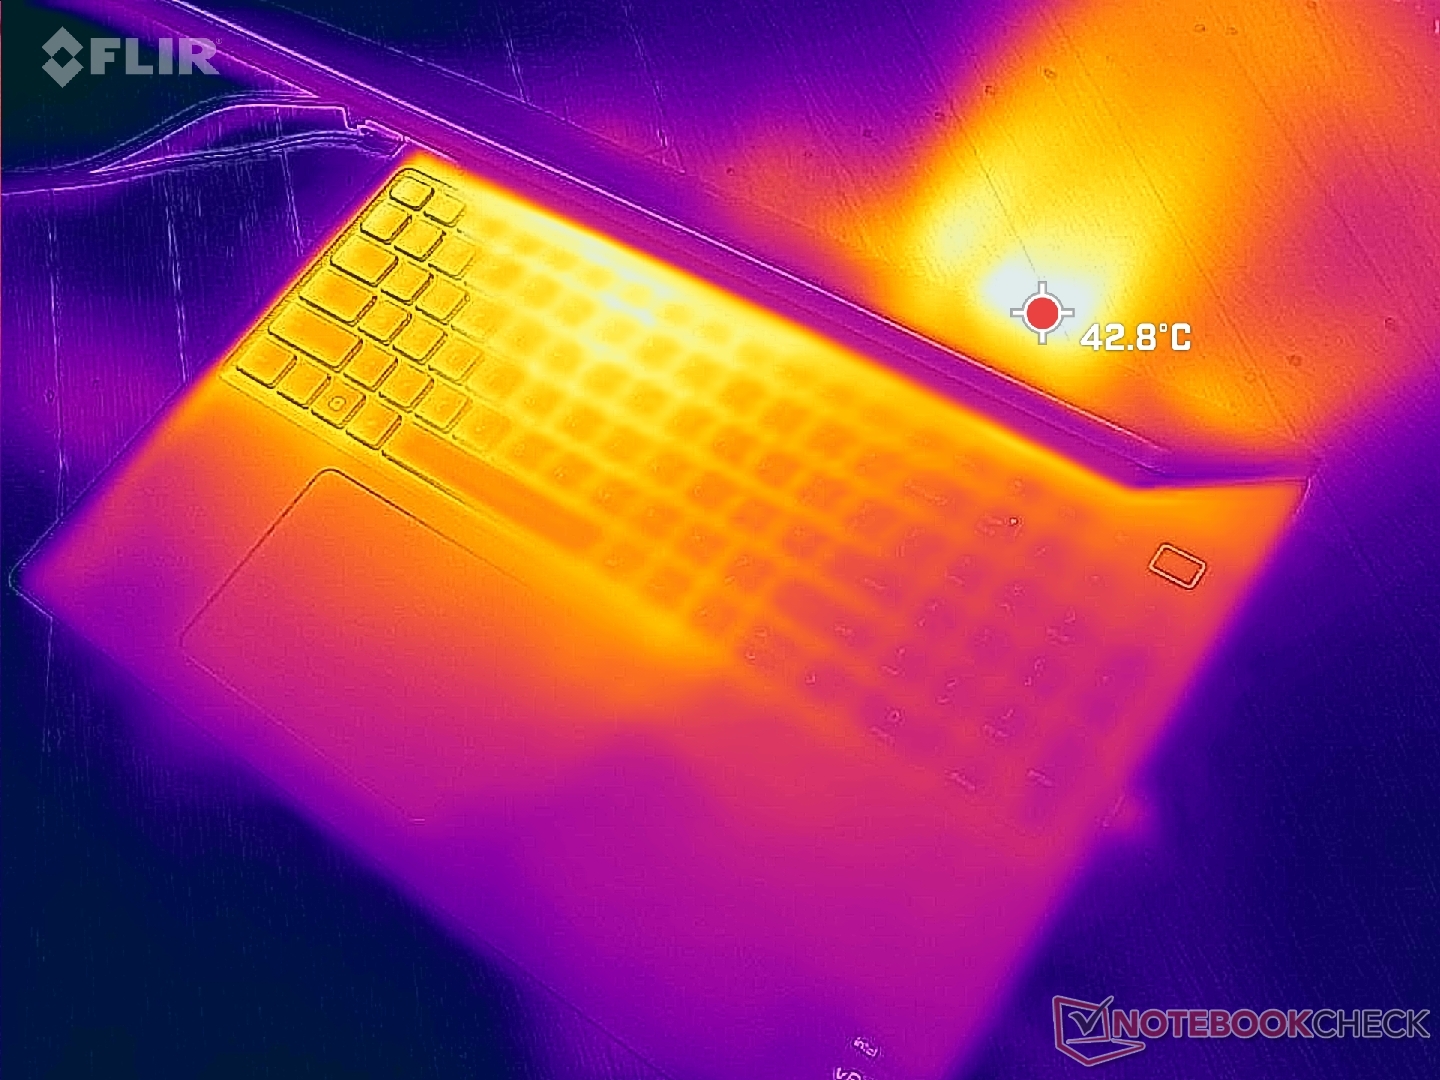
(-) Den maximala temperaturen på ovansidan är 51 °C / 124 F, jämfört med genomsnittet av 38.2 °C / 101 F , allt från 22.2 till 69.8 °C för klassen Workstation.
(-) Botten värms upp till maximalt 45.8 °C / 114 F, jämfört med genomsnittet av 41.1 °C / 106 F
(+) Vid tomgångsbruk är medeltemperaturen för ovansidan 29.8 °C / 86 F, jämfört med enhetsgenomsnittet på 32 °C / ### class_avg_f### F.
(±) När du spelar The Witcher 3 är medeltemperaturen för ovansidan 37.1 °C / 99 F, jämfört med enhetsgenomsnittet på 32 °C / ## #class_avg_f### F.
(+) Handledsstöden och pekplattan når maximal hudtemperatur (34.2 °C / 93.6 F) och är därför inte varma.
(-) Medeltemperaturen för handledsstödsområdet på liknande enheter var 27.8 °C / 82 F (-6.4 °C / -11.6 F).
| Dell Precision 7670 Intel Core i7-12850HX, NVIDIA RTX A2000 Laptop GPU | Lenovo ThinkPad P1 G4-20Y4Z9DVUS Intel Core i7-11800H, NVIDIA T1200 Laptop GPU | Asus ProArt StudioBook 16 W7600H5A-2BL2 Intel Xeon W-11955M, NVIDIA RTX A5000 Laptop GPU | Dell Precision 5000 5560 Intel Core i7-11850H, NVIDIA RTX A2000 Laptop GPU | Dell Precision 7550 Intel Xeon W-10885M, NVIDIA Quadro RTX 5000 Max-Q | HP ZBook Fury 15 G8 Intel Core i9-11950H, NVIDIA RTX A5000 Laptop GPU | |
|---|---|---|---|---|---|---|
| Heat | 5% | -3% | -1% | 2% | 4% | |
| Maximum Upper Side * (°C) | 51 | 49.9 2% | 45.7 10% | 48.2 5% | 49 4% | 45.6 11% |
| Maximum Bottom * (°C) | 45.8 | 56.7 -24% | 48.3 -5% | 42.6 7% | 51 -11% | 57.6 -26% |
| Idle Upper Side * (°C) | 31.8 | 25.5 20% | 35.3 -11% | 34.8 -9% | 28.2 11% | 26 18% |
| Idle Bottom * (°C) | 32.6 | 26.2 20% | 34.4 -6% | 35.2 -8% | 32 2% | 28.8 12% |
* ... mindre är bättre
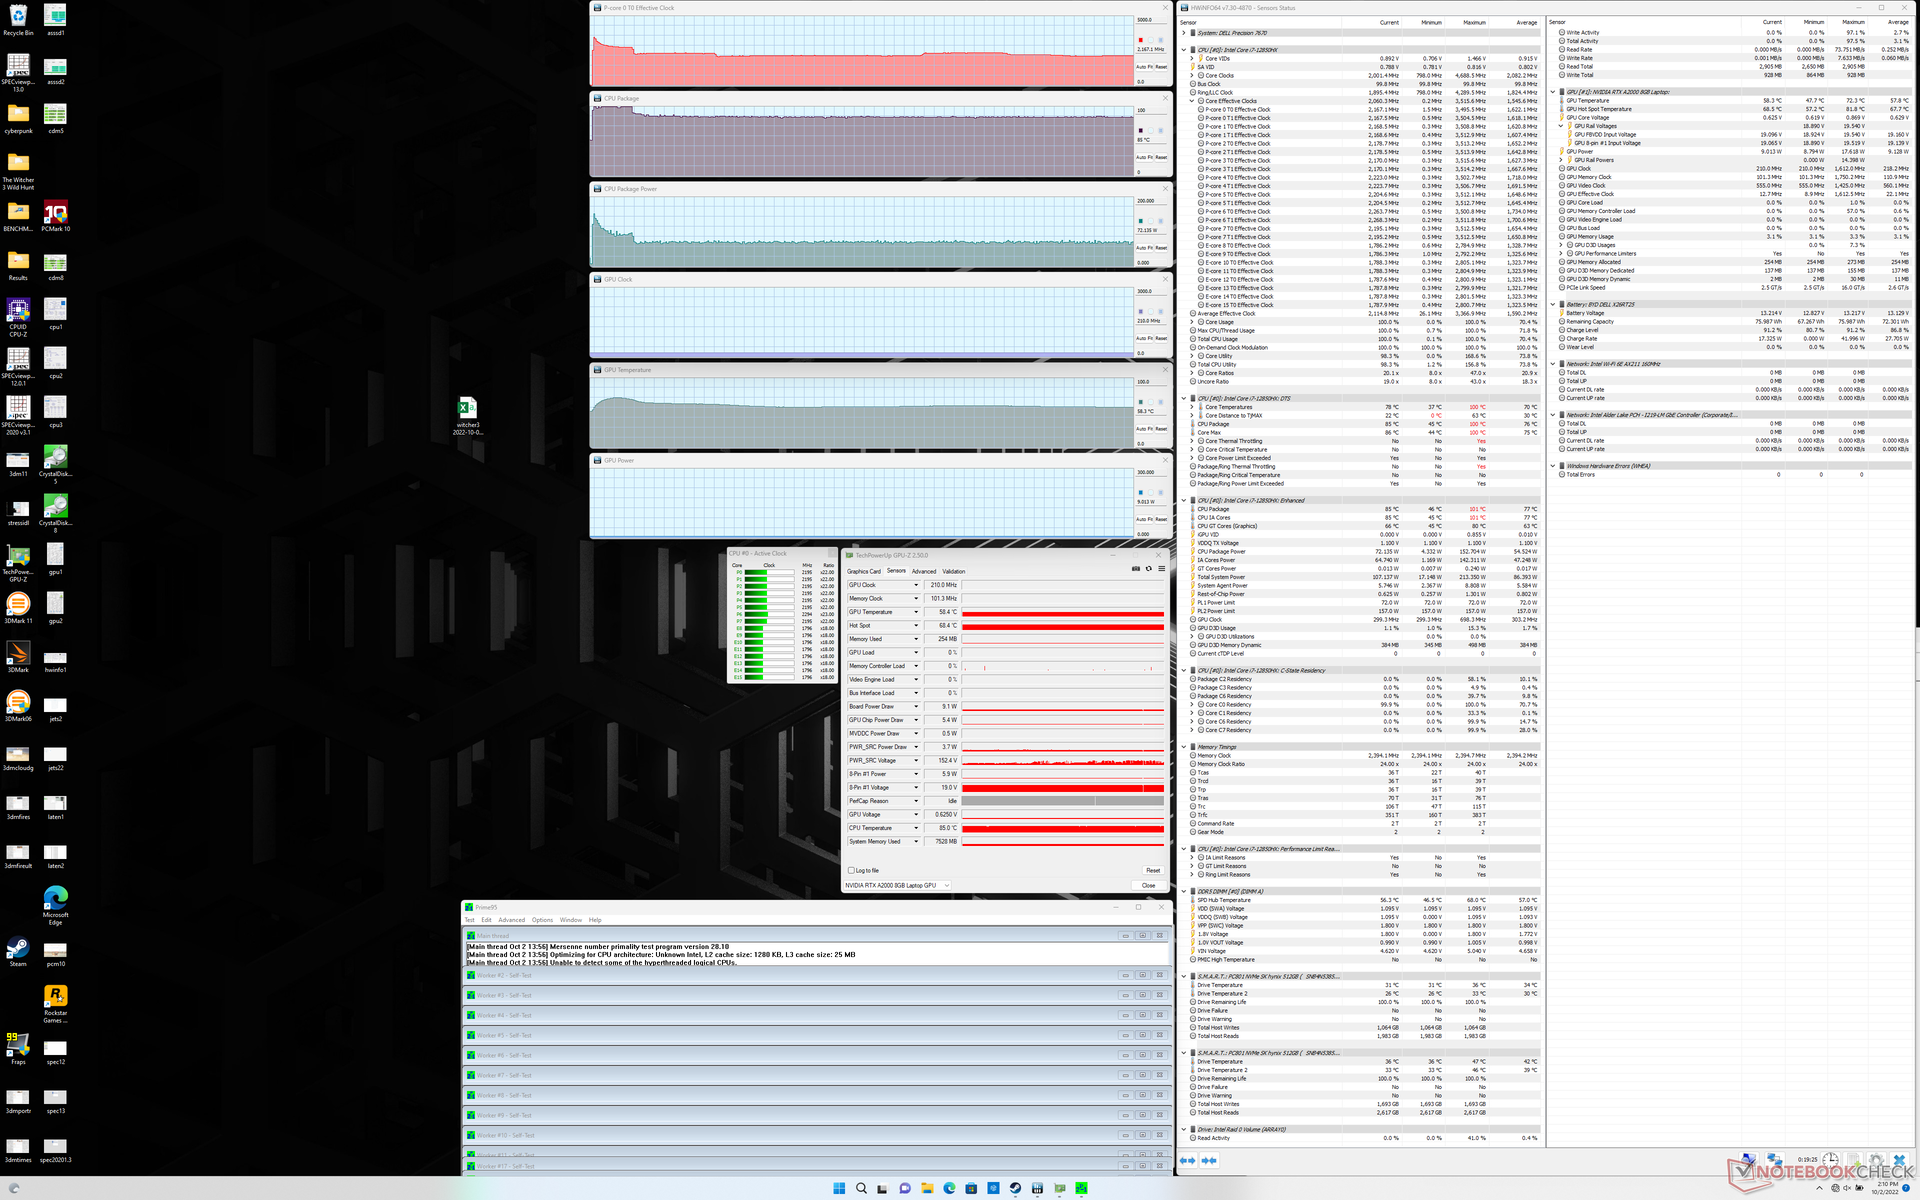
Stresstest
När vi körde Prime95 för att stressa processorn, steg klockfrekvensen och strömförbrukningen på kortet till 3,5 GHz respektive 153 W, men det varade bara i högst några sekunder. Kärnans temperatur skulle vara så hög som 100 C under denna korta period. Klockfrekvenserna och strömförbrukningen skulle sedan sjunka stadigt innan de stabiliserades på 2,2 till 2,4 GHz respektive 73 W för att bibehålla en mer tolerabel kärntemperatur på 85 C. Turbo Boost-prestanda är därför inte så bra som vi hade hoppats med tanke på storleken på den här arbetsstationen.
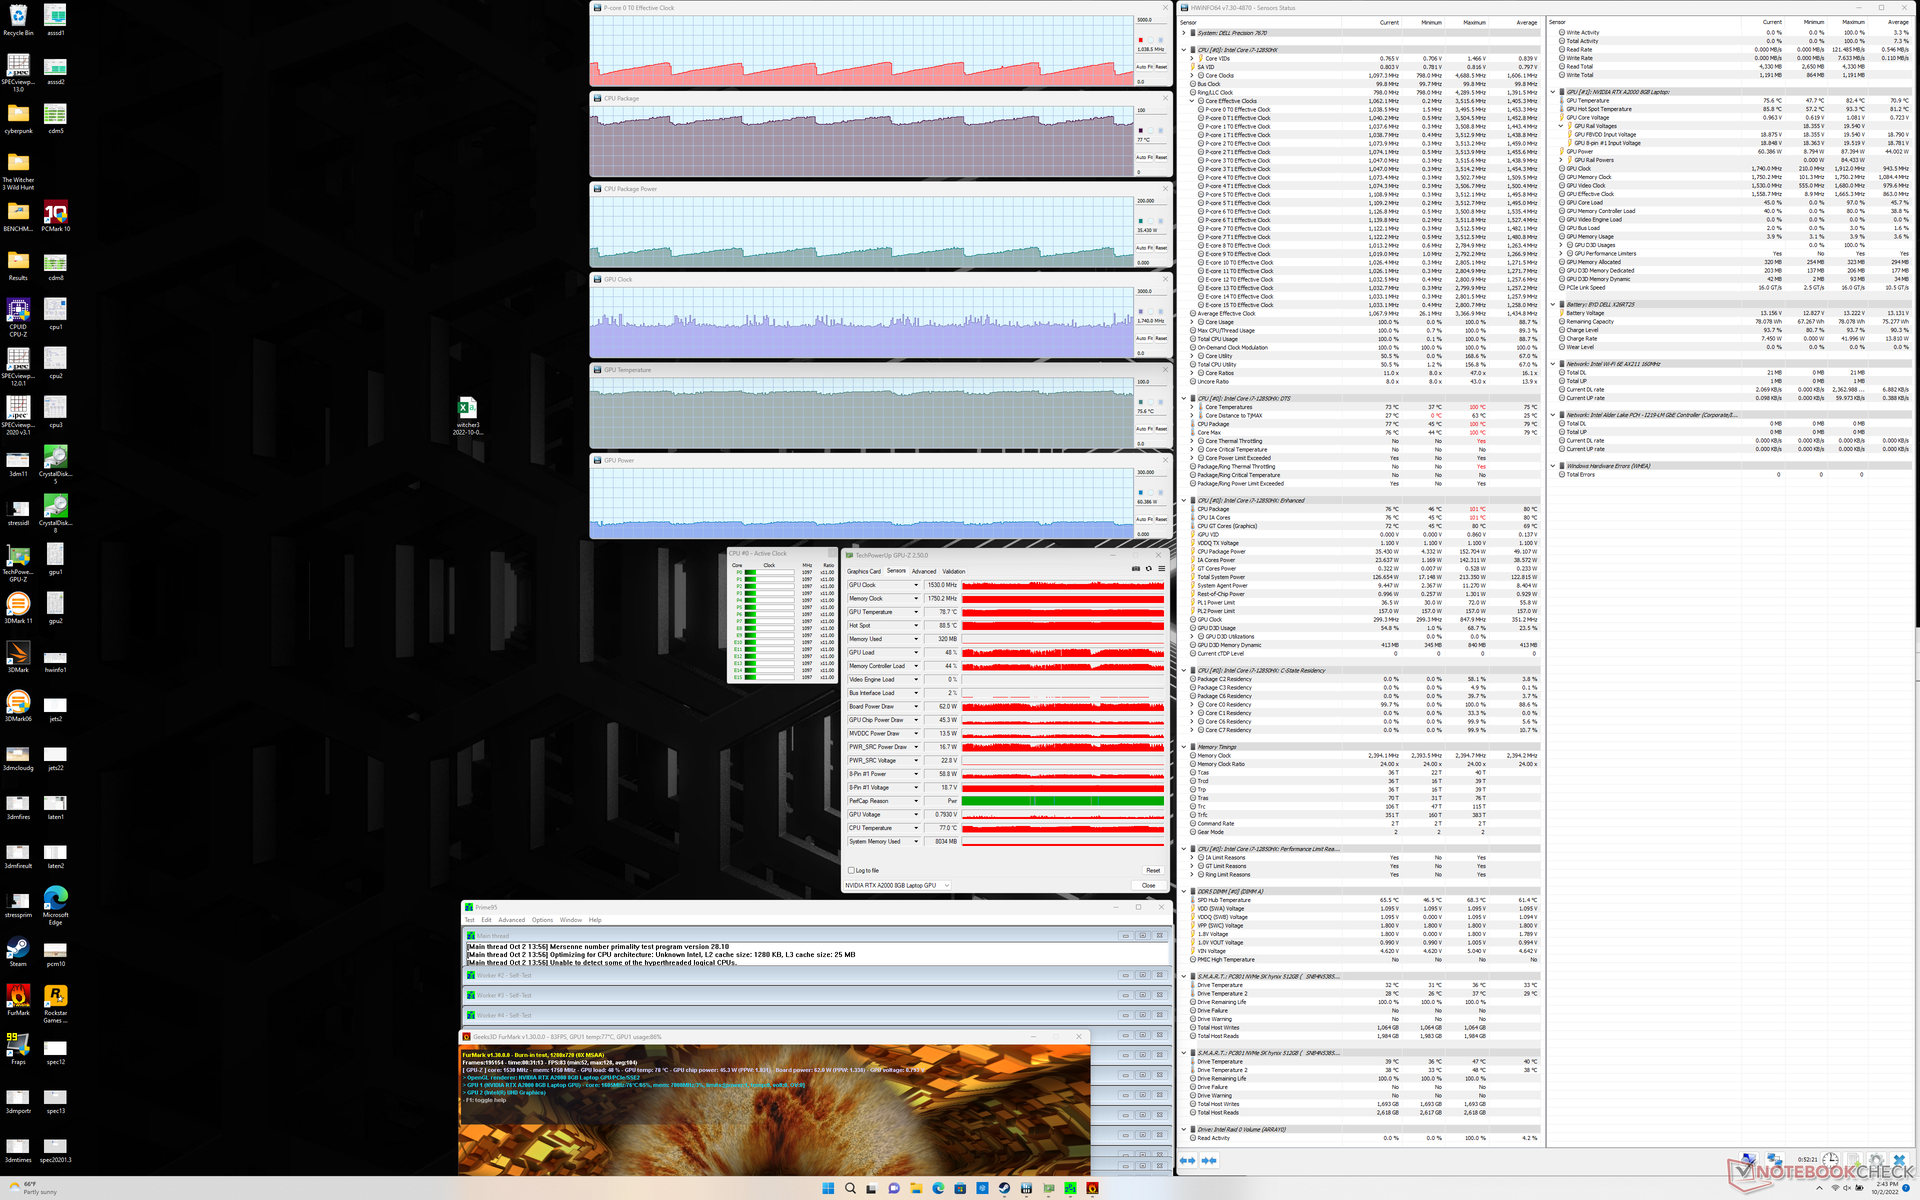
När vi kör Witcher 3 för att representera en stadig tung belastning skulle GPU-klockfrekvens, temperatur och strömförbrukning stabiliseras vid 1777 MHz, 80 C respektive 80 W, jämfört med 1462 MHz, 75 C respektive 45 W på den mindre Precision 5560 med samma RTX A2000 GPU.
Att köra på batteri begränsar prestandan. Ett Fire Strike -test på batterier skulle ge fysik- och grafikpoäng på 9820 respektive 6911 poäng, jämfört med 23868 respektive 14295 poäng vid nätström.
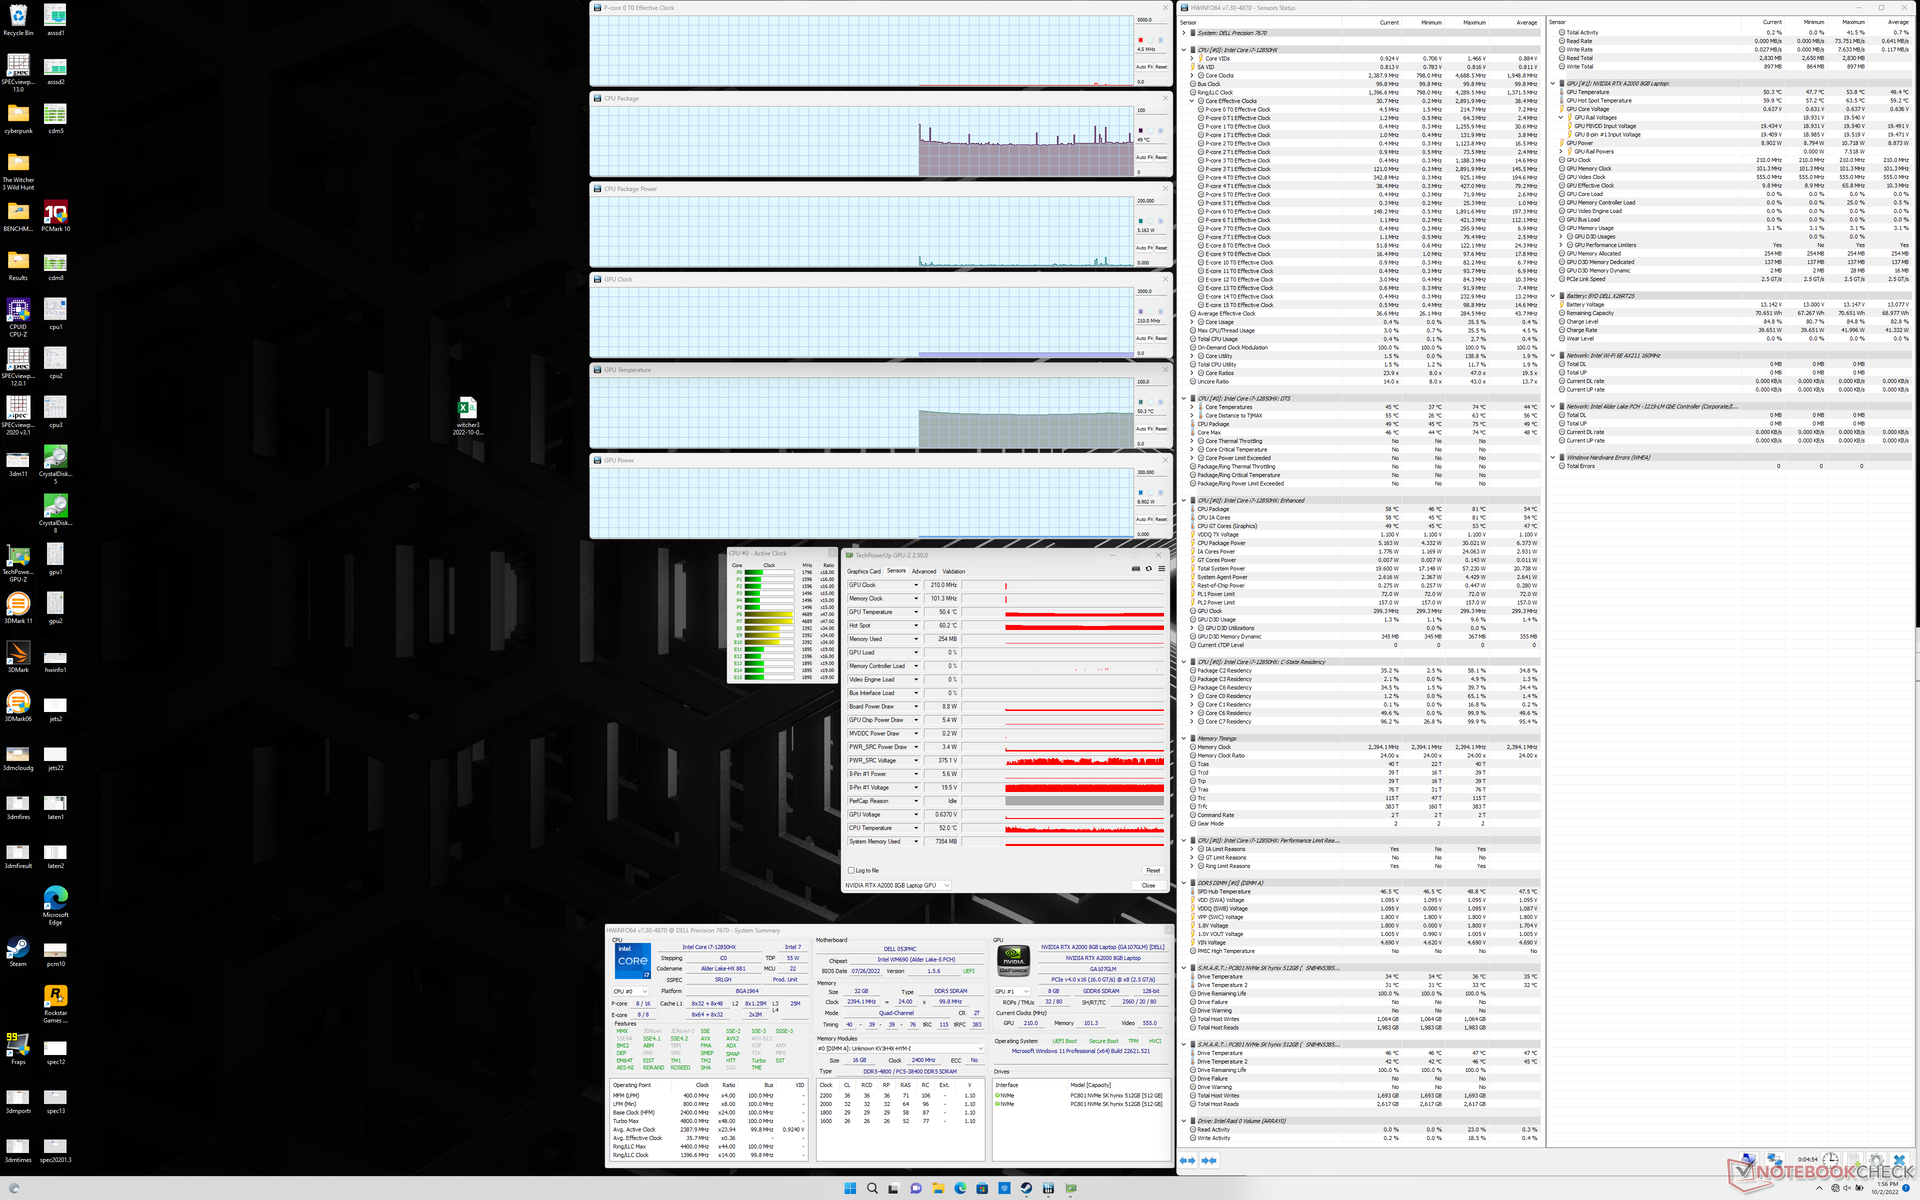

| CPU-klocka (GHz) | GPU-klocka (MHz) | Genomsnittlig CPU-temperatur (°C) | Genomsnittlig GPU-temperatur (°C) | |
| Systemets tomgång | -- | -- | 49 | 50 |
| Prime95 Stress | 2.2 | -- | 85 | 58 |
| Prime95 + FurMark Stress | 0,8 - 1,3 | ~1450 | 76 - 86 | 62 - 72 |
| Witcher 3 Stress | 0,6 | 1777 | 70 | 80 |
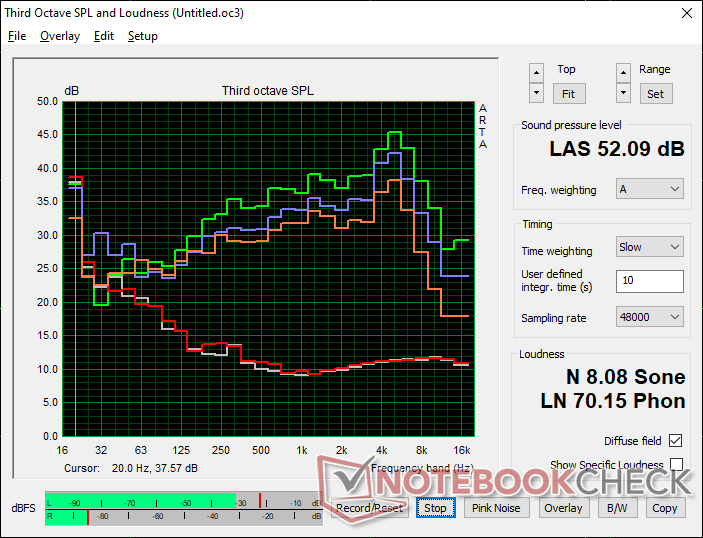
Högtalare
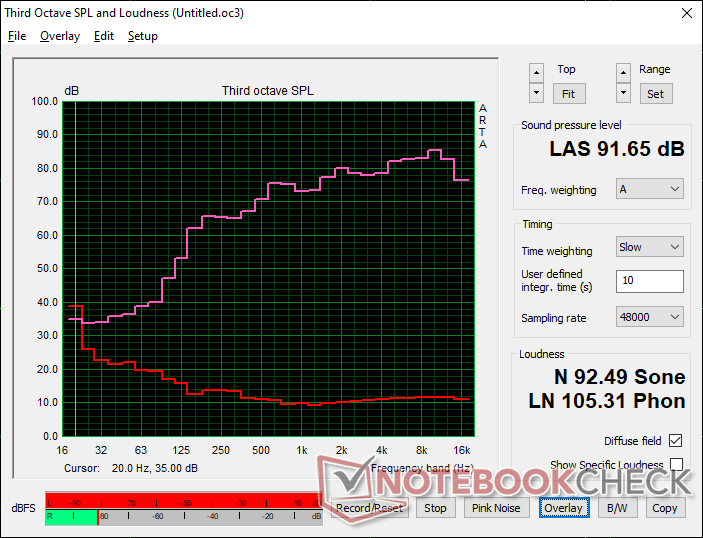
Dell Precision 7670 ljudanalys
(+) | högtalare kan spela relativt högt (91.7 dB)
Bas 100 - 315 Hz
(-) | nästan ingen bas - i genomsnitt 16.8% lägre än medianen
(+) | basen är linjär (6.7% delta till föregående frekvens)
Mellan 400 - 2000 Hz
(+) | balanserad mellan - endast 3.5% från medianen
(+) | mids är linjära (3.9% delta till föregående frekvens)
Högsta 2 - 16 kHz
(+) | balanserade toppar - endast 4.6% från medianen
(+) | toppar är linjära (2% delta till föregående frekvens)
Totalt 100 - 16 000 Hz
(+) | det totala ljudet är linjärt (12.2% skillnad mot median)
Jämfört med samma klass
» 18% av alla testade enheter i den här klassen var bättre, 3% liknande, 79% sämre
» Den bästa hade ett delta på 7%, genomsnittet var 17%, sämst var 35%
Jämfört med alla testade enheter
» 10% av alla testade enheter var bättre, 2% liknande, 88% sämre
» Den bästa hade ett delta på 4%, genomsnittet var 23%, sämst var 134%
Apple MacBook Pro 16 2021 M1 Pro ljudanalys
(+) | högtalare kan spela relativt högt (84.7 dB)
Bas 100 - 315 Hz
(+) | bra bas - bara 3.8% från medianen
(+) | basen är linjär (5.2% delta till föregående frekvens)
Mellan 400 - 2000 Hz
(+) | balanserad mellan - endast 1.3% från medianen
(+) | mids är linjära (2.1% delta till föregående frekvens)
Högsta 2 - 16 kHz
(+) | balanserade toppar - endast 1.9% från medianen
(+) | toppar är linjära (2.7% delta till föregående frekvens)
Totalt 100 - 16 000 Hz
(+) | det totala ljudet är linjärt (4.6% skillnad mot median)
Jämfört med samma klass
» 0% av alla testade enheter i den här klassen var bättre, 0% liknande, 100% sämre
» Den bästa hade ett delta på 5%, genomsnittet var 17%, sämst var 45%
Jämfört med alla testade enheter
» 0% av alla testade enheter var bättre, 0% liknande, 100% sämre
» Den bästa hade ett delta på 4%, genomsnittet var 23%, sämst var 134%
Energiförvaltning - mycket krävande
Effektförbrukning
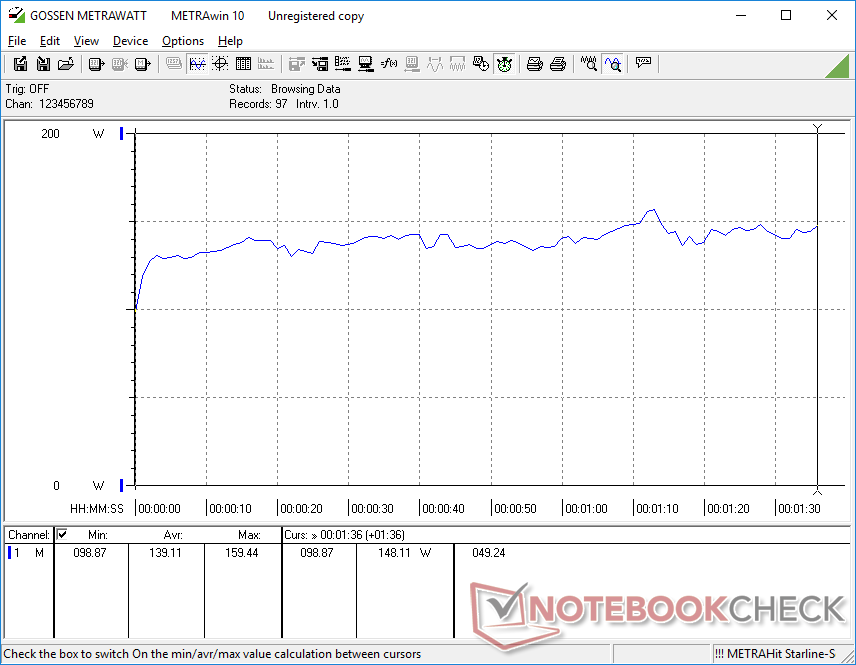
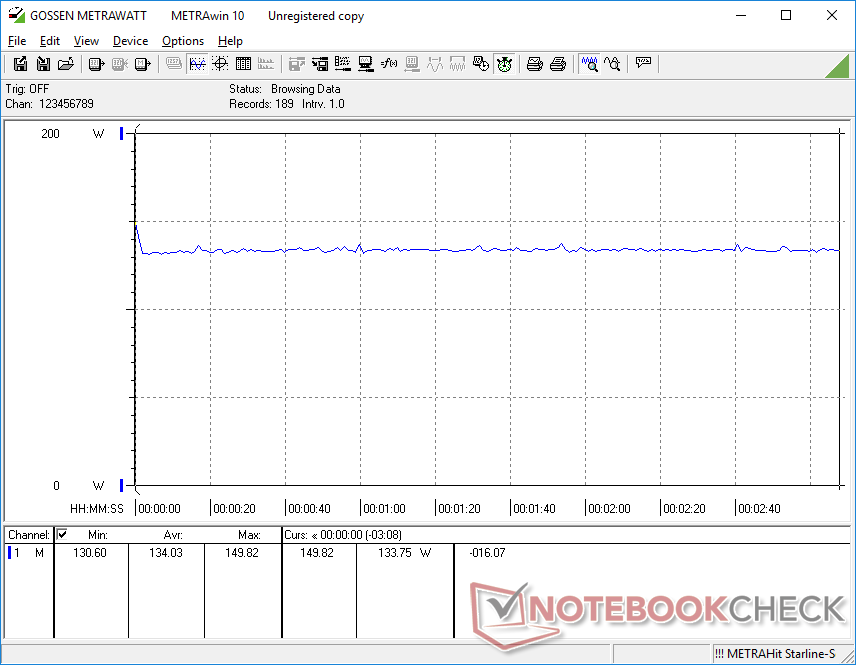
Systemet är ganska krävande under de flesta förhållanden. Strömförbrukningen varierar mellan 7 W och 25 W vid tomgång på skrivbordet medan högre belastningar som 3DMark 06 eller Witcher 3 drar omkring 140 W vardera. Asus ProArt StudioBook 16 eller Precision 5560 skulle bara dra 132 W eller 96 W under liknande förhållanden i jämförelse
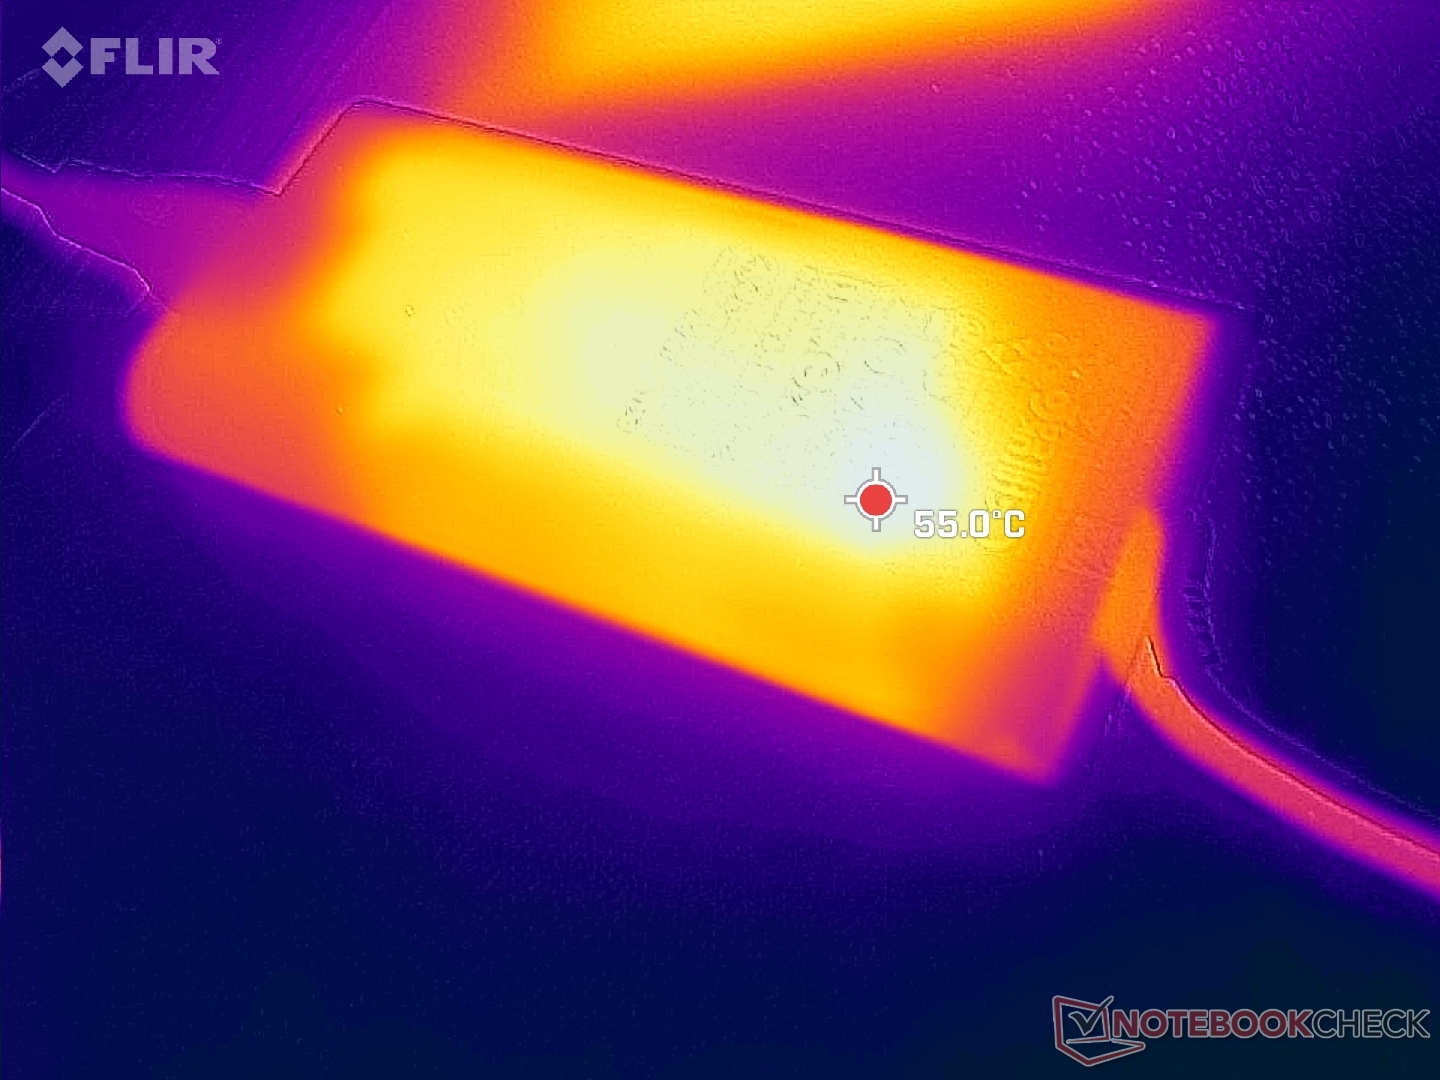
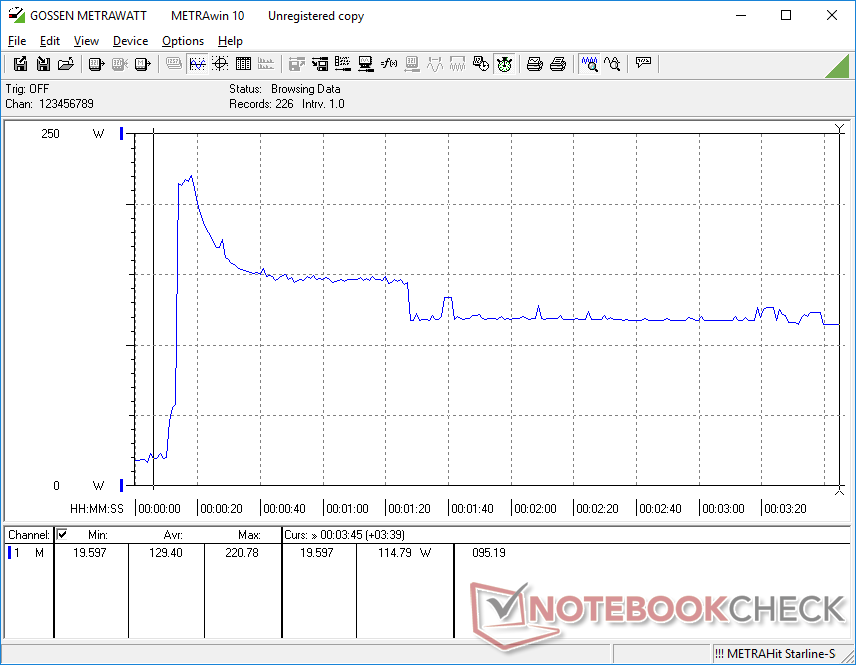
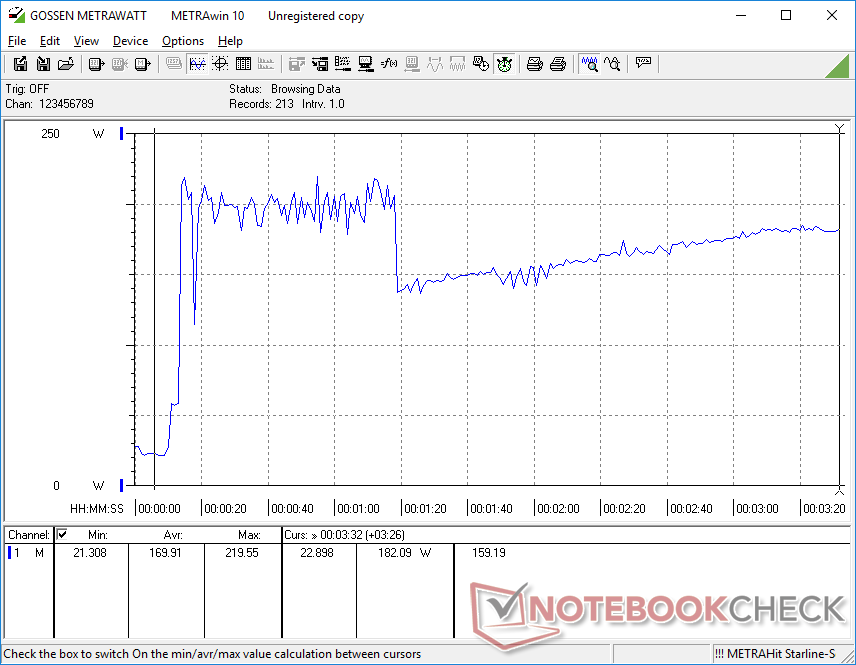
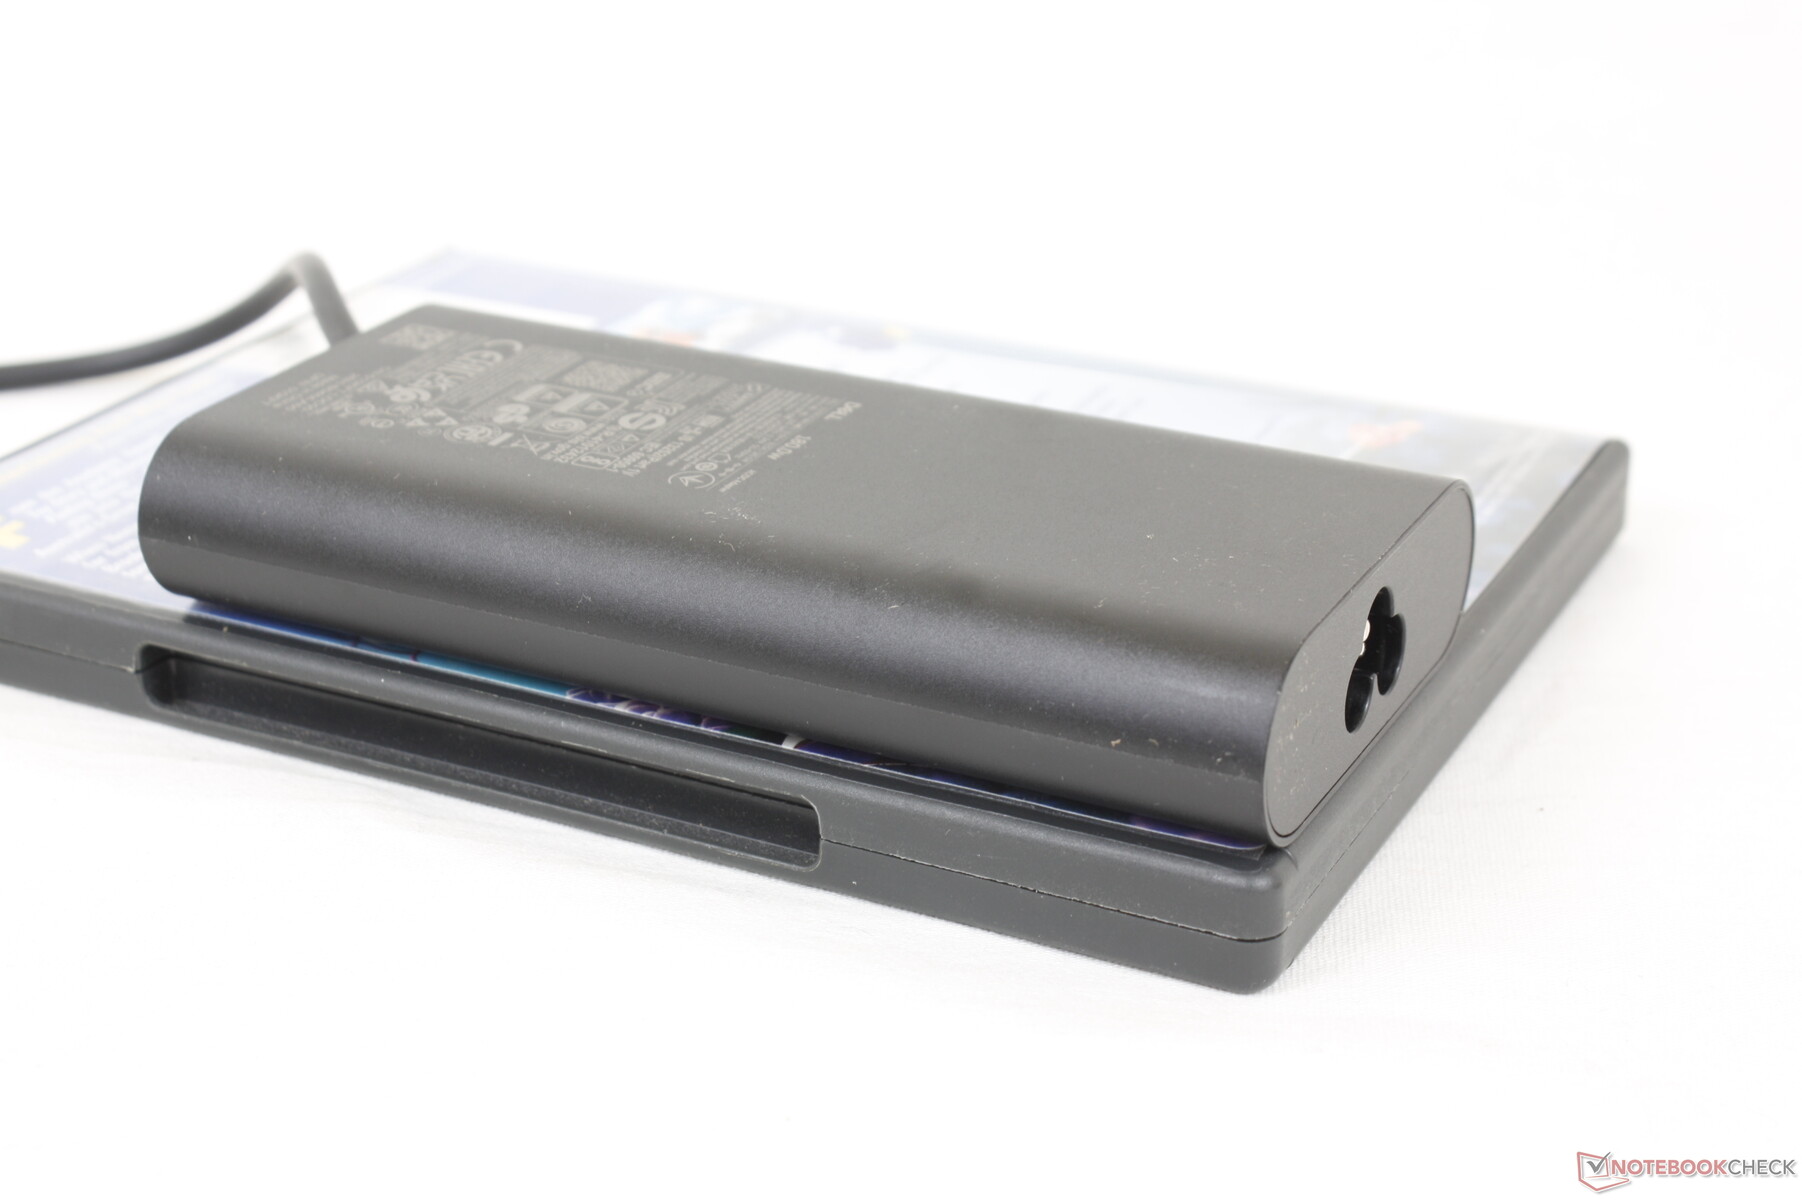
Strömförbrukningen kan vara så hög som 221 W när CPU och GPU är maximalt utnyttjade trots att den medelstora nätadaptern (~13,7 x 6,6 x 2,3 cm) är dimensionerad för endast 180 W. Denna extremt höga hastighet skulle hålla i högst en minut innan den sjunker till 114 W om CPU:n belastas eller 180 W om både CPU:n och GPU:n belastas samtidigt. Den bärbara datorns laddningshastighet kan därför sakta avstanna om den utsätts för sådana extrema förhållanden
Dell erbjuder en mer kapabel 240 W AC-adapter om man konfigurerar Precision 7670 med snabbare GPU-alternativ. Baserat på våra resultat med 180 W AC-adaptern kanske dock 240 W-alternativet borde vara standard för alla Nvidia RTX-konfigurationer.
| Av/Standby | |
| Låg belastning | |
| Hög belastning |
|
Förklaring:
min: | |
| Dell Precision 7670 i7-12850HX, RTX A2000 Laptop GPU, SK Hynix HFS001TEJ9X115N, OLED, 3840x2400, 16" | Lenovo ThinkPad P1 G4-20Y4Z9DVUS i7-11800H, T1200 Laptop GPU, Samsung PM9A1 MZVL2512HCJQ, IPS, 2560x1600, 16" | Asus ProArt StudioBook 16 W7600H5A-2BL2 W-11955M, RTX A5000 Laptop GPU, 2x Micron 2300 2TB MTFDHBA2T0TDV (RAID 0), OLED, 3840x2400, 16" | Dell Precision 5000 5560 i7-11850H, RTX A2000 Laptop GPU, Samsung PM9A1 MZVL22T0HBLB, IPS, 3840x2400, 15.6" | Dell Precision 7550 W-10885M, Quadro RTX 5000 Max-Q, SK Hynix PC601A NVMe 1TB, IPS, 3840x2160, 15.6" | HP ZBook Fury 15 G8 i9-11950H, RTX A5000 Laptop GPU, Samsung PM981a MZVLB1T0HBLR, IPS, 3840x2160, 15.6" | |
|---|---|---|---|---|---|---|
| Power Consumption | 9% | -14% | 16% | -12% | -13% | |
| Idle Minimum * (Watt) | 7.5 | 9.9 -32% | 12.4 -65% | 6.2 17% | 8.2 -9% | 8.3 -11% |
| Idle Average * (Watt) | 9.5 | 13.9 -46% | 16.5 -74% | 13.9 -46% | 16.8 -77% | 19.9 -109% |
| Idle Maximum * (Watt) | 28.4 | 14.6 49% | 25 12% | 23.8 16% | 24.4 14% | 21.8 23% |
| Load Average * (Watt) | 139.1 | 95 32% | 132 5% | 95.7 31% | 131 6% | 110.9 20% |
| Witcher 3 ultra * (Watt) | 134 | 98.9 26% | 132 1% | 87 35% | 156.6 -17% | 165 -23% |
| Load Maximum * (Watt) | 220.8 | 170.8 23% | 134 39% | 132.6 40% | 201.8 9% | 171.8 22% |
* ... mindre är bättre
Power Consumption Witcher 3 / Stresstest
Power Consumption external Monitor
Batteritid
WLAN-driftstiden är knappt 6 timmar, vilket är kortare än för Precision 5560 eller Precision 7550. Detta beror till stor del på OLED-panelen som förbrukar mer ström än IPS vid visning av vita färger. Eftersom de flesta webbplatser har övervägande vita färger är den generellt kortare batteritiden inte oväntad
Laddning med den medföljande nätadaptern tar cirka 2 timmar. Systemet kan inte laddas via USB-C eftersom det inte har stöd för PD-in.
| Dell Precision 7670 i7-12850HX, RTX A2000 Laptop GPU, 83 Wh | Lenovo ThinkPad P1 G4-20Y4Z9DVUS i7-11800H, T1200 Laptop GPU, 90 Wh | Asus ProArt StudioBook 16 W7600H5A-2BL2 W-11955M, RTX A5000 Laptop GPU, 90 Wh | Dell Precision 5000 5560 i7-11850H, RTX A2000 Laptop GPU, 86 Wh | Dell Precision 7550 W-10885M, Quadro RTX 5000 Max-Q, 95 Wh | HP ZBook Fury 15 G8 i9-11950H, RTX A5000 Laptop GPU, 94 Wh | |
|---|---|---|---|---|---|---|
| Batteridrifttid | 49% | -15% | 32% | 23% | 5% | |
| Reader / Idle (h) | 7.9 | 12 52% | 11.1 41% | |||
| WiFi v1.3 (h) | 5.9 | 8.8 49% | 5 -15% | 6.3 7% | 8.9 51% | 6.2 5% |
| Load (h) | 1.3 | 1.8 38% | 1 -23% | |||
| H.264 (h) | 1.8 | |||||
| Witcher 3 ultra (h) | 1.6 |
För
Emot
Omdöme - Kraftfull utan att vara för stor
Precision 7670 konkurrerar direkt med HP ZBook Fury 16 G9. Eftersom vi ännu inte har granskat HP-modellen kan vi bara jämföra vår Precision med 16-tumsLenovo ThinkPad P1 G4 ellerAsus ProArt StudioBook Pro 16 W7600. Dell-modellen kan erbjuda betydligt snabbare CPU-prestanda än båda tillsammans med många fler extrafunktioner, inklusive enklare service, WAN-anslutning och fler lagringsalternativ.
Precision 7670 är som bäst när den konfigureras med CPU- och GPU-alternativ av högre kvalitet. Vid enklare alternativ kan du istället hitta tunnare och lättare modeller som kan erbjuda ungefär samma prestanda.
Vikten är en viktig nackdel med Precision 7670 eftersom systemet är nästan lika tungt som den större 17,3-tums Precision 7550. Dessutom är det en liten besvikelse att Core i7-12850HX inte kan upprätthålla Turbo Boost-klockfrekvensen under längre perioder trots den tunga vikten. Den är fortfarande snabb, men den överliggande kylningslösningen här begränsar dess potential. Avsaknaden av Xeon CPU-alternativ gör att Precision 7670 känns mer som en bärbar dator av Studio-typ än en fullfjädrad arbetsstation som den marknadsförs för att vara.
Precision 7670 är fortfarande bra för kraftanvändare som kan dra nytta av att ha alla dessa kraftfulla 12:e generationens Intel-kärnor och en högklassig RTX A5500 GPU. För lägre konfigurationer kan dock smalare och lättare 16-tumsmodeller som de tidigare nämnda Lenovo eller Asus fortfarande vara anständiga alternativ.
Pris och tillgänglighet
Precision 7670 är för närvarande tillgänglig på Newegg med endast en konfiguration. Vi rekommenderar att du beställer direkt från Dell för ett större urval av konfigurationer och garantialternativ.
Dell Precision 7670
- 10/06/2022 v7 (old)
Allen Ngo
Price comparison

