Recension av Dell Surface Pro 8: XPS 13 9315 2-i-1
Dell presenterade tre olika XPS 13-modeller på CES 2022: XPS 13 XPS 13 9320 Plus med klämskåp, XPS 13 9315 med klämskåpoch XPS 13 9315 2-in-1. Efter att ha granskat de två clamshell-modellerna är vi nu redo att ta oss an 2-i-1-modellen som råkar vara den första avtagbara XPS-modellen på nästan ett decennium.
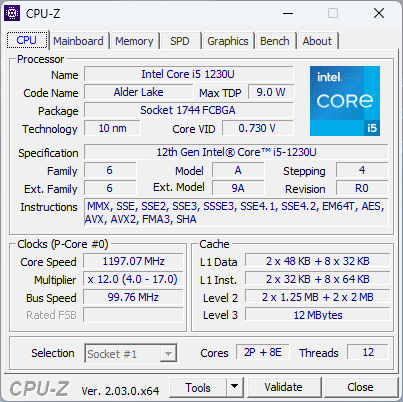
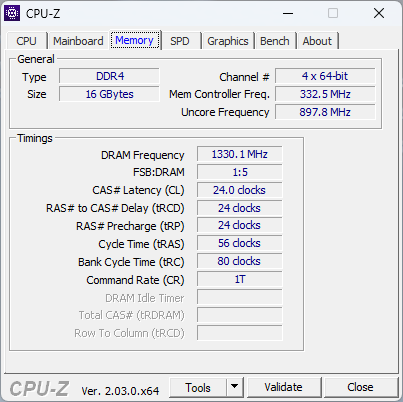
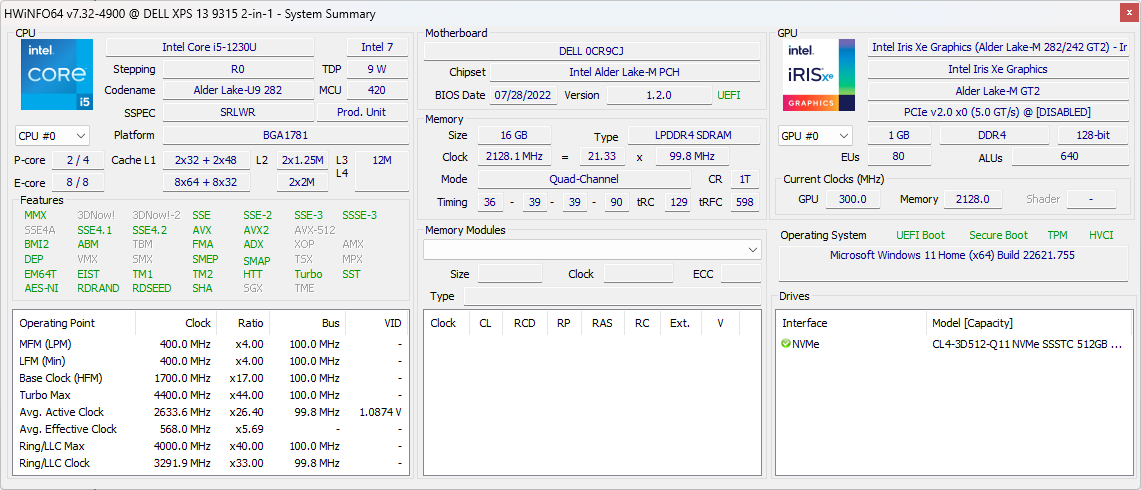
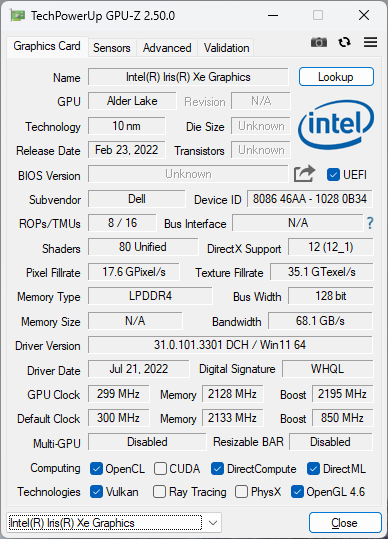
Vår konfiguration i recensionen är utrustad med den 12:e generationen Alder Lake Core i5-1230U CPU, 16 GB LPDDR4x RAM och 512 GB NVMe SSD för cirka 1 400 USD. Andra SKU:er med Core i7-1250U CPU, 5G eSIM och olika RAM/SSD-kapaciteter finns också tillgängliga, men alla alternativ kommer annars med samma 3:2 2880 x 1920 IPS-pekskärm.
Bland de direkta konkurrenterna i detta område finns andra Windows-tabletter eller lösbara enheter, framför allt Microsoft Surface Pro 8 och den dyrare HP Elite x2 serien i mindre utsträckning.
Fler recensioner av Dell:
Potentiella konkurrenter i jämförelse
Gradering | Datum | Modell | Vikt | Höjd | Storlek | Upplösning | Pris |
|---|---|---|---|---|---|---|---|
| 90.1 % v7 (old) | 11/2022 | Dell XPS 13 9315 2-in-1 Core i5-1230U i5-1230U, Iris Xe G7 80EUs | 764 g | 7.4 mm | 13.00" | 2880x1920 | |
| 87.3 % v7 (old) | 09/2022 | Dell XPS 13 Plus 9320 i7-1280P OLED i7-1280P, Iris Xe G7 96EUs | 1.3 kg | 15.28 mm | 13.40" | 3456x2160 | |
| 89.1 % v7 (old) | 11/2021 | Microsoft Surface Pro 8, i7-1185G7 i7-1185G7, Iris Xe G7 96EUs | 891 g | 8.5 mm | 13.00" | 2880x1920 | |
| 90.3 % v7 (old) | 08/2022 | HP Spectre x360 13.5 14t-ef000 i7-1255U, Iris Xe G7 96EUs | 1.4 kg | 17 mm | 13.50" | 3000x2000 | |
| 86.1 % v7 (old) | Lenovo ThinkBook Plus Gen2 Core i5 i5-1130G7, Iris Xe G7 80EUs | 1.2 kg | 13.9 mm | 13.30" | 2560x1600 | ||
| 92.3 % v7 (old) | 07/2022 | Apple MacBook Air M2 Entry M2, M2 8-Core GPU | 1.2 kg | 11.3 mm | 13.60" | 2560x1664 |
Hölje - Lättare än en Surface Pro 8
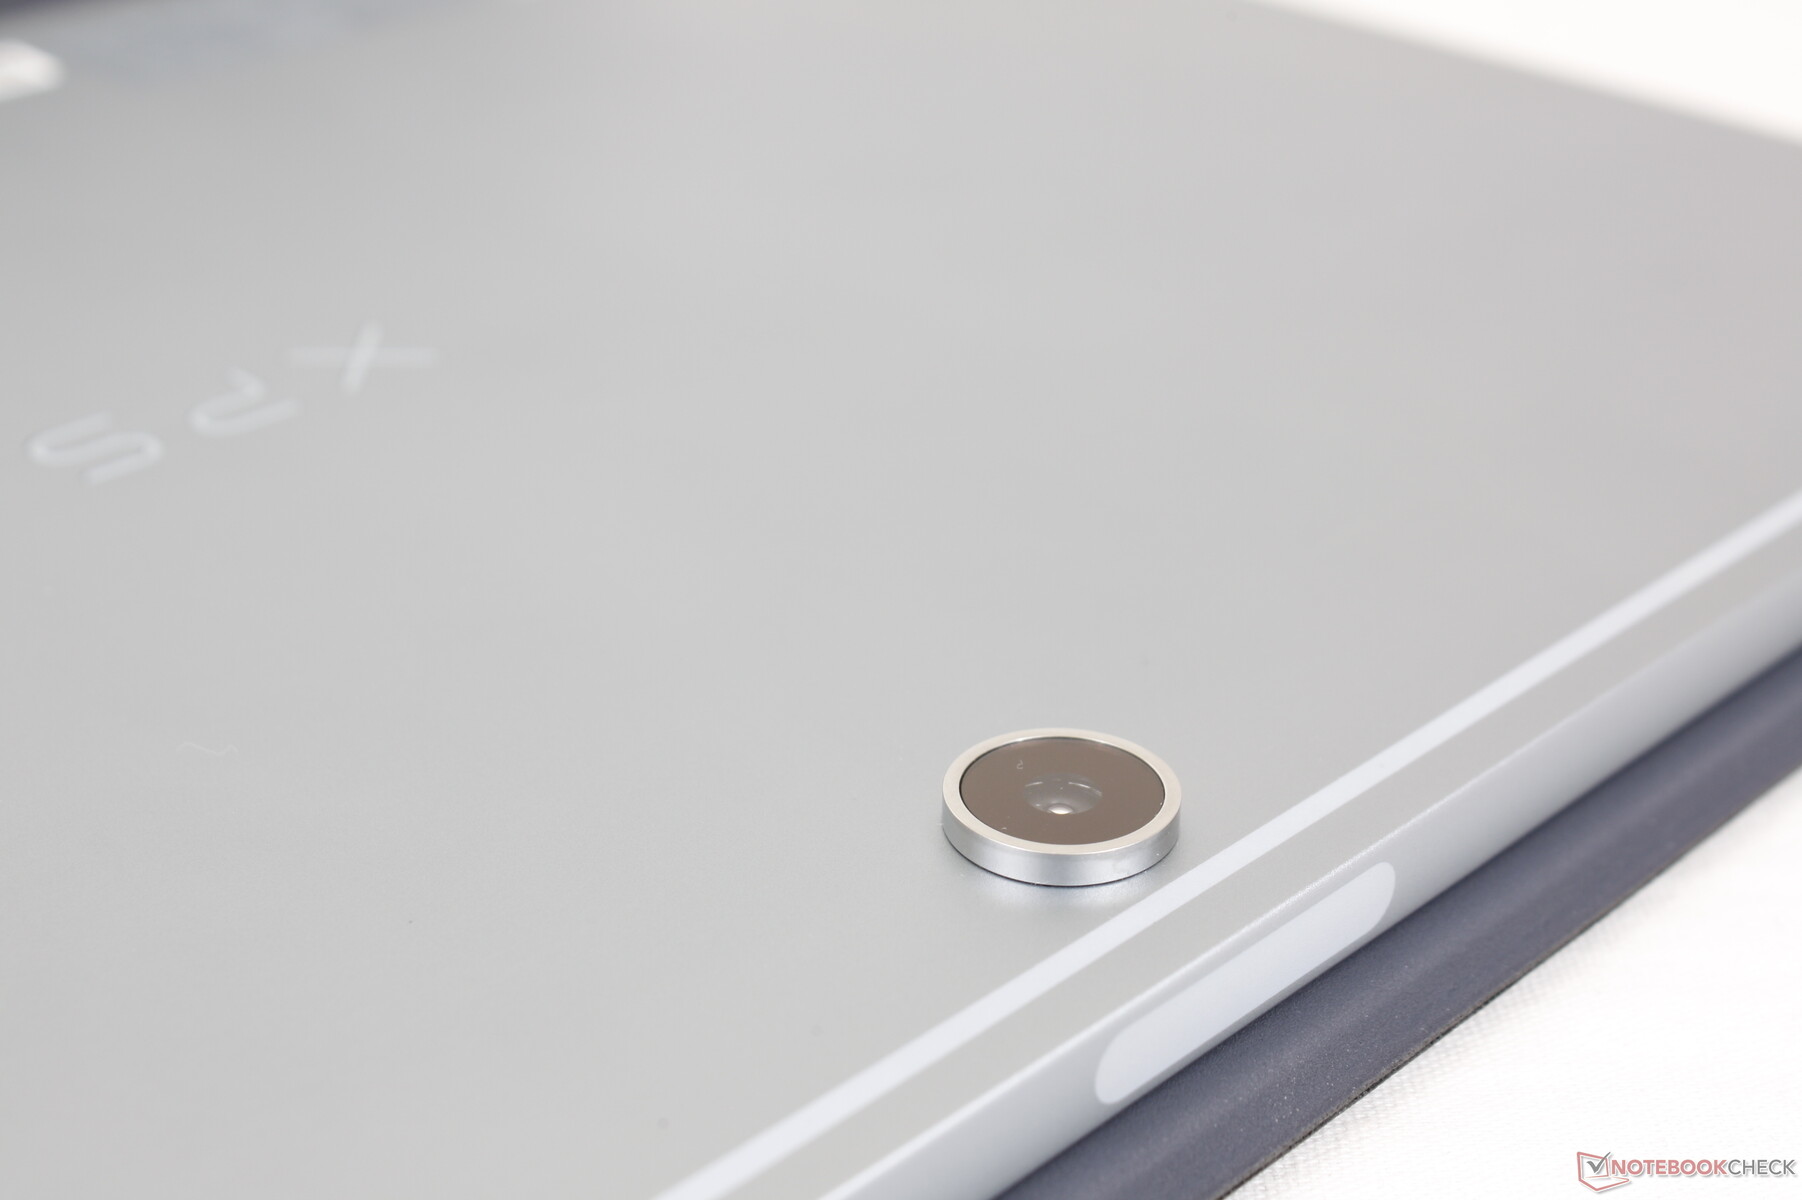
Skelettet är av aluminium på baksidan och kanterna medan framsidan är Gorilla Glass från kant till kant. Det är en robust, högkvalitativ matt yta som man kan förvänta sig med en färg och textur som liknar de yttre locken på XPS 13 9300 eller XPS 15-serien. Det finns en mycket liten skevhet när man försöker vrida enheten, men det är inte tillräckligt för att vara på något bekymmer.
Om du trycker på mitten av ryggen uppstår små fördjupningar och hörbara ljud. Detta beror sannolikt på den lilla luftspalten mellan det yttre skalet och de inre komponenterna, vilket återigen inte är något att oroa sig för.
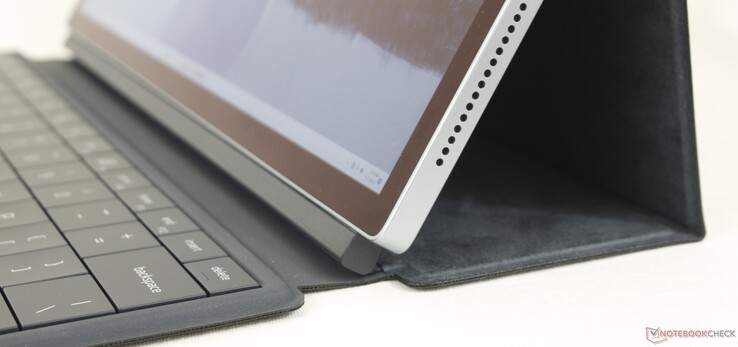
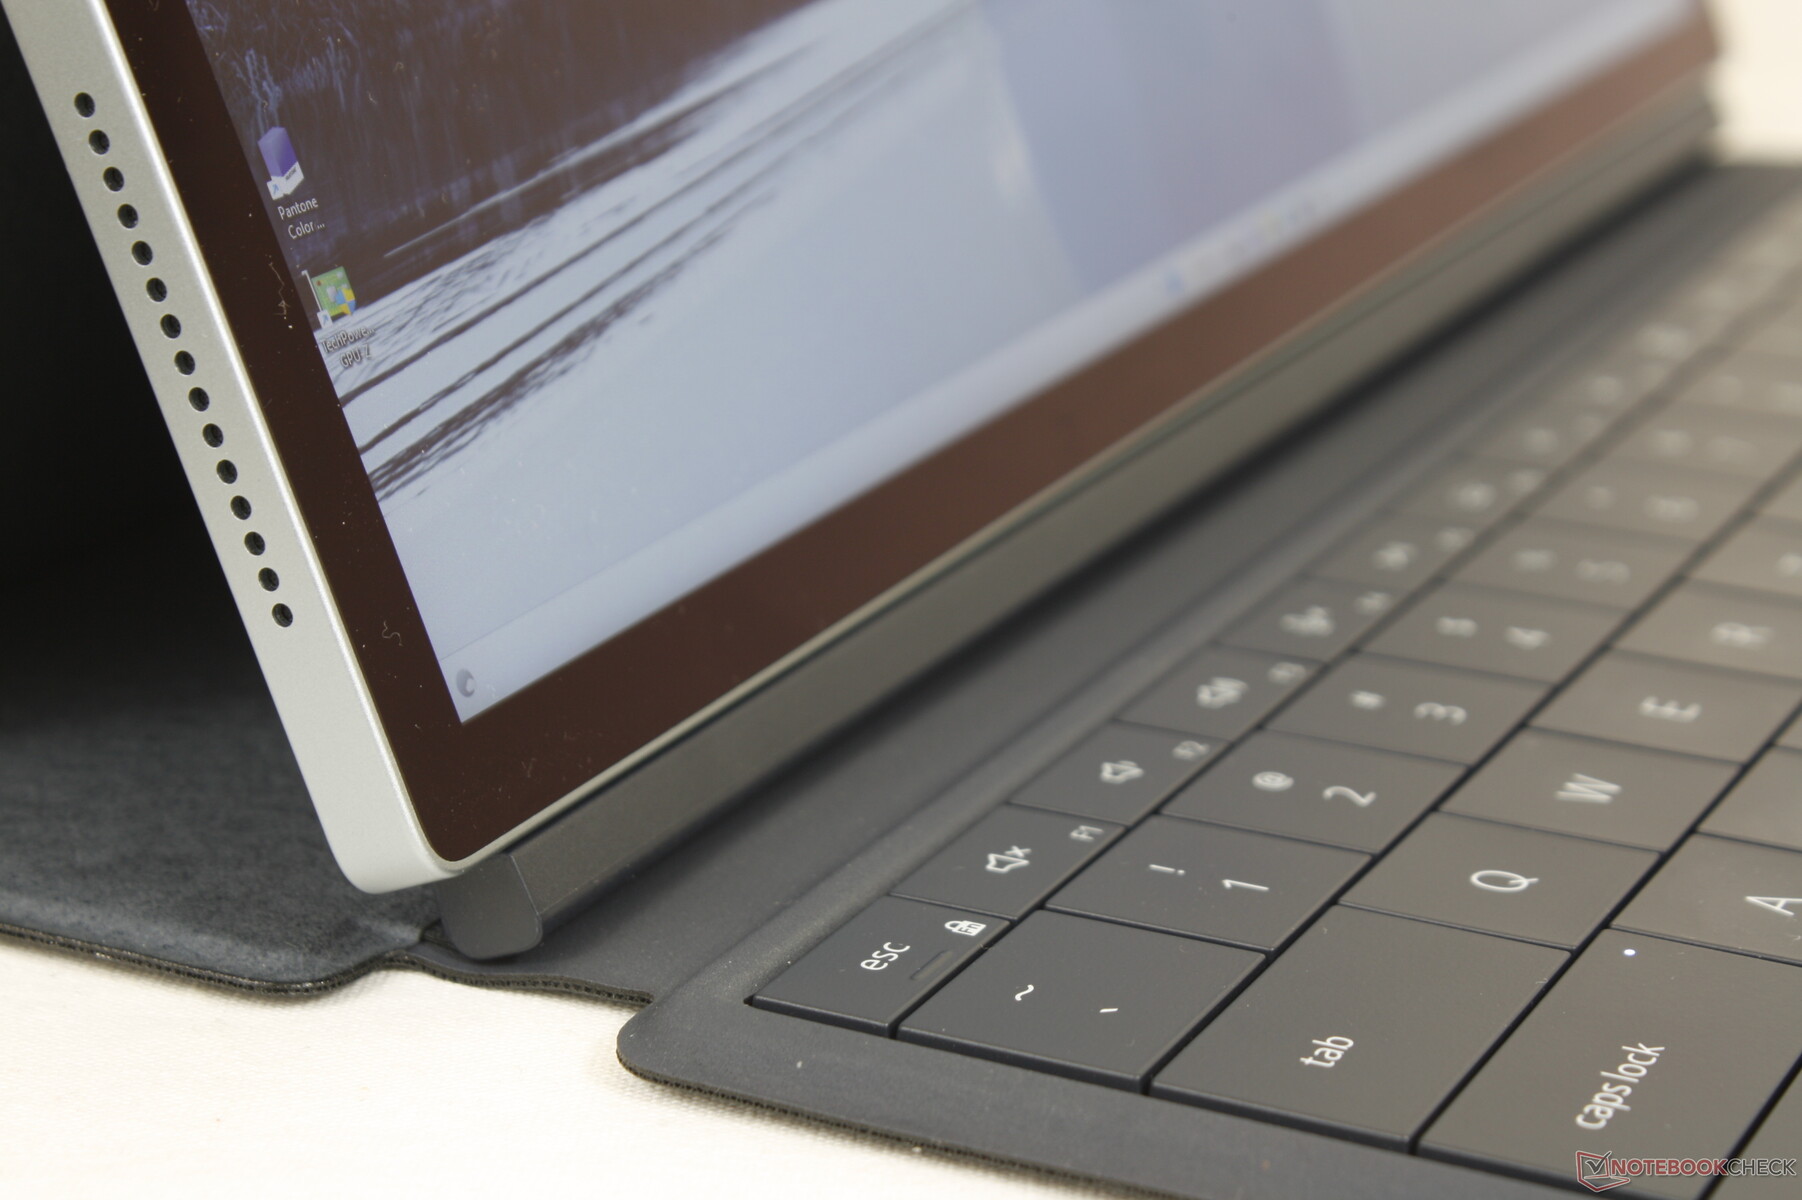
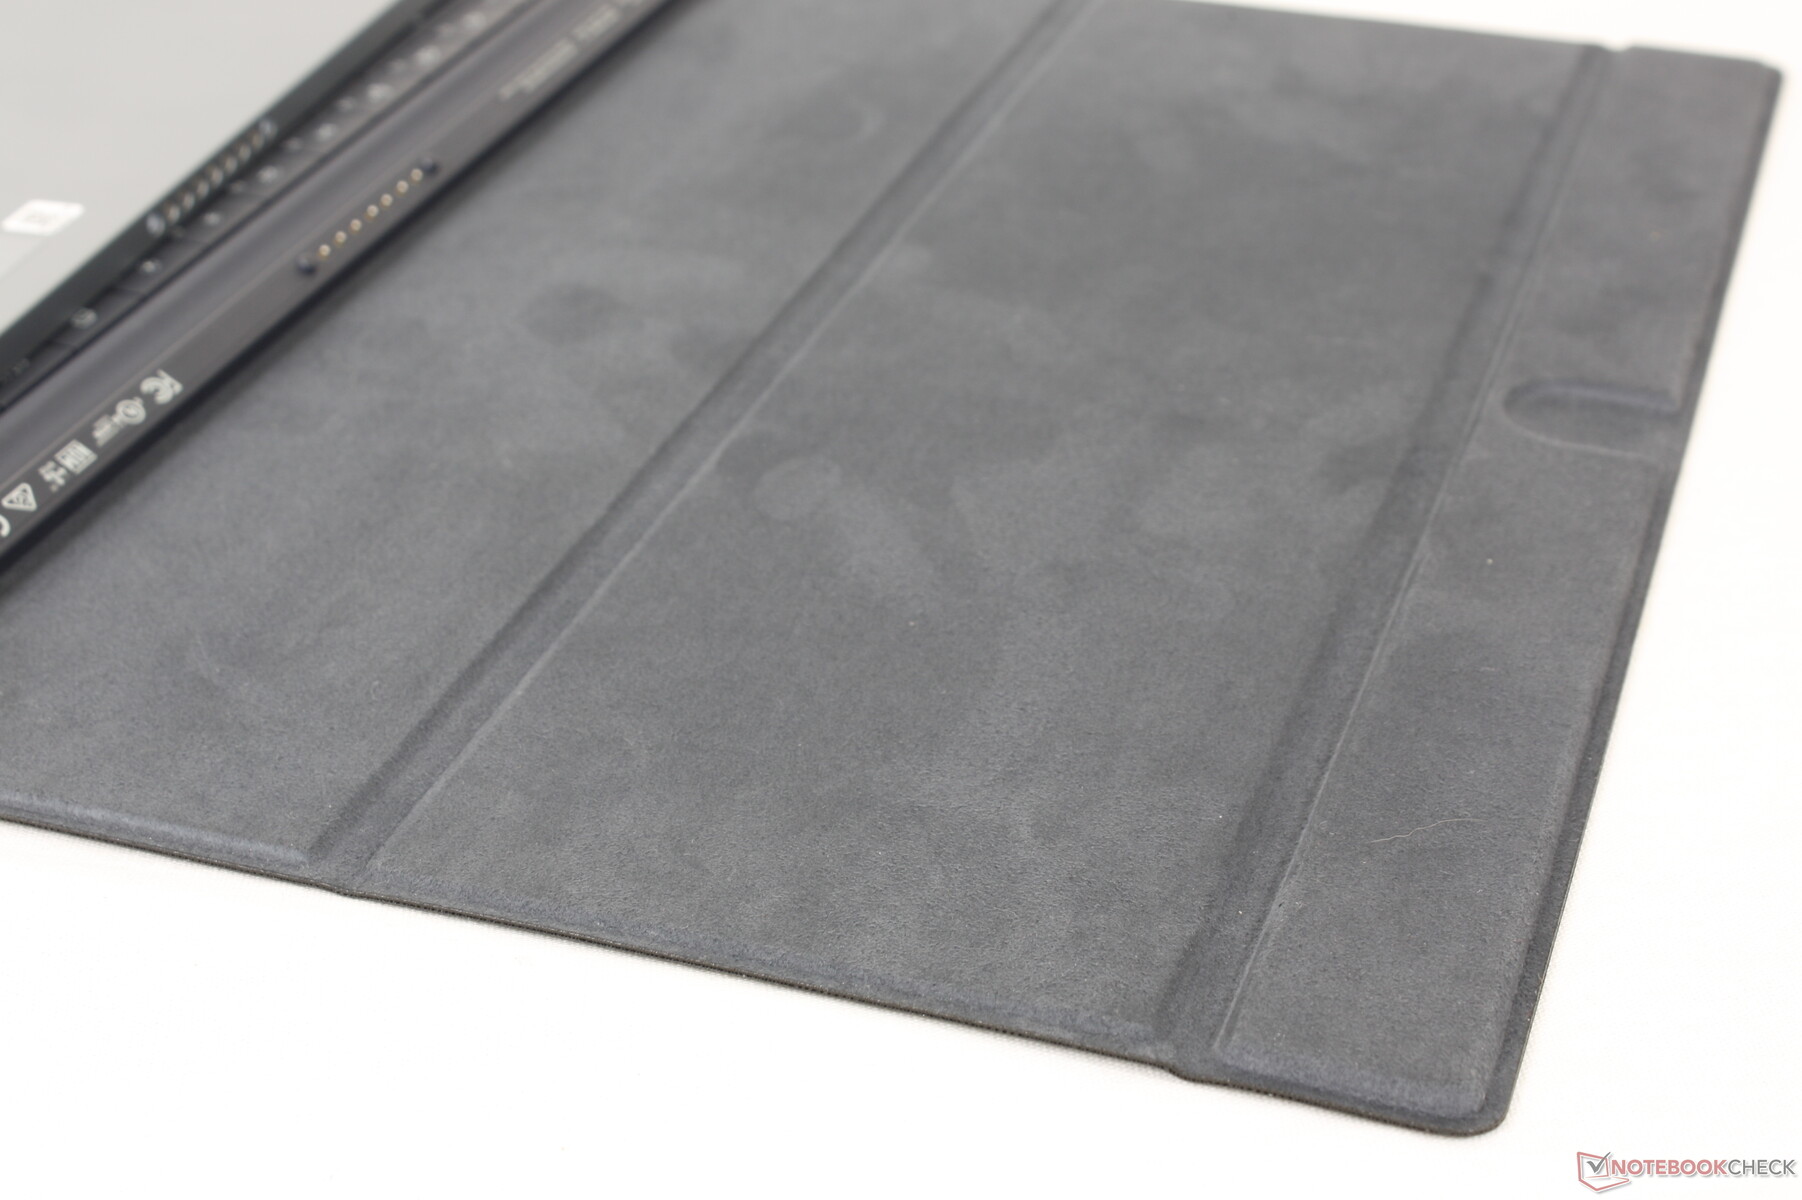
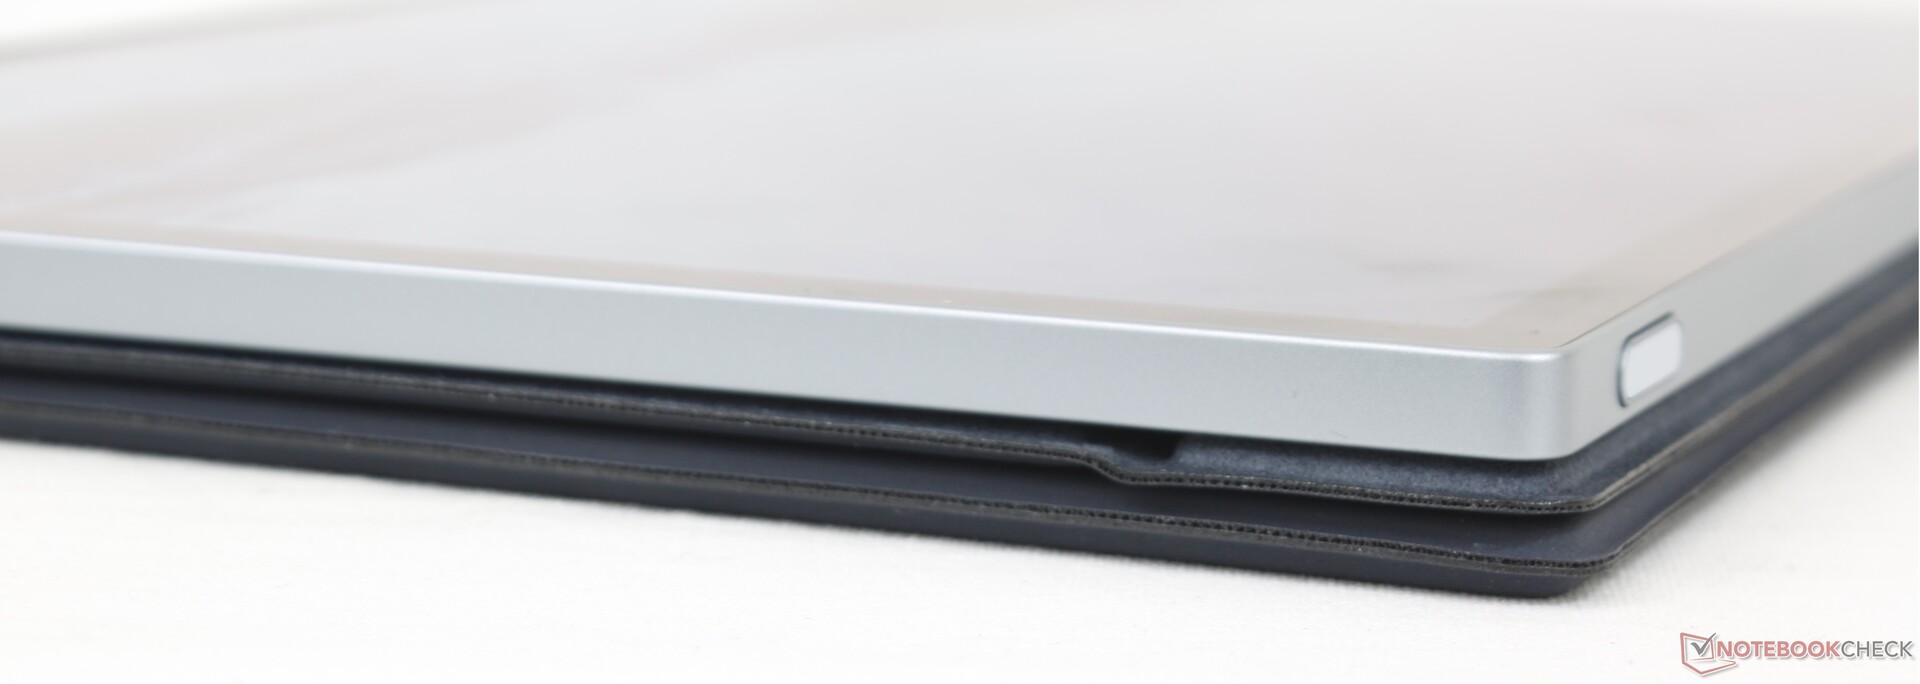
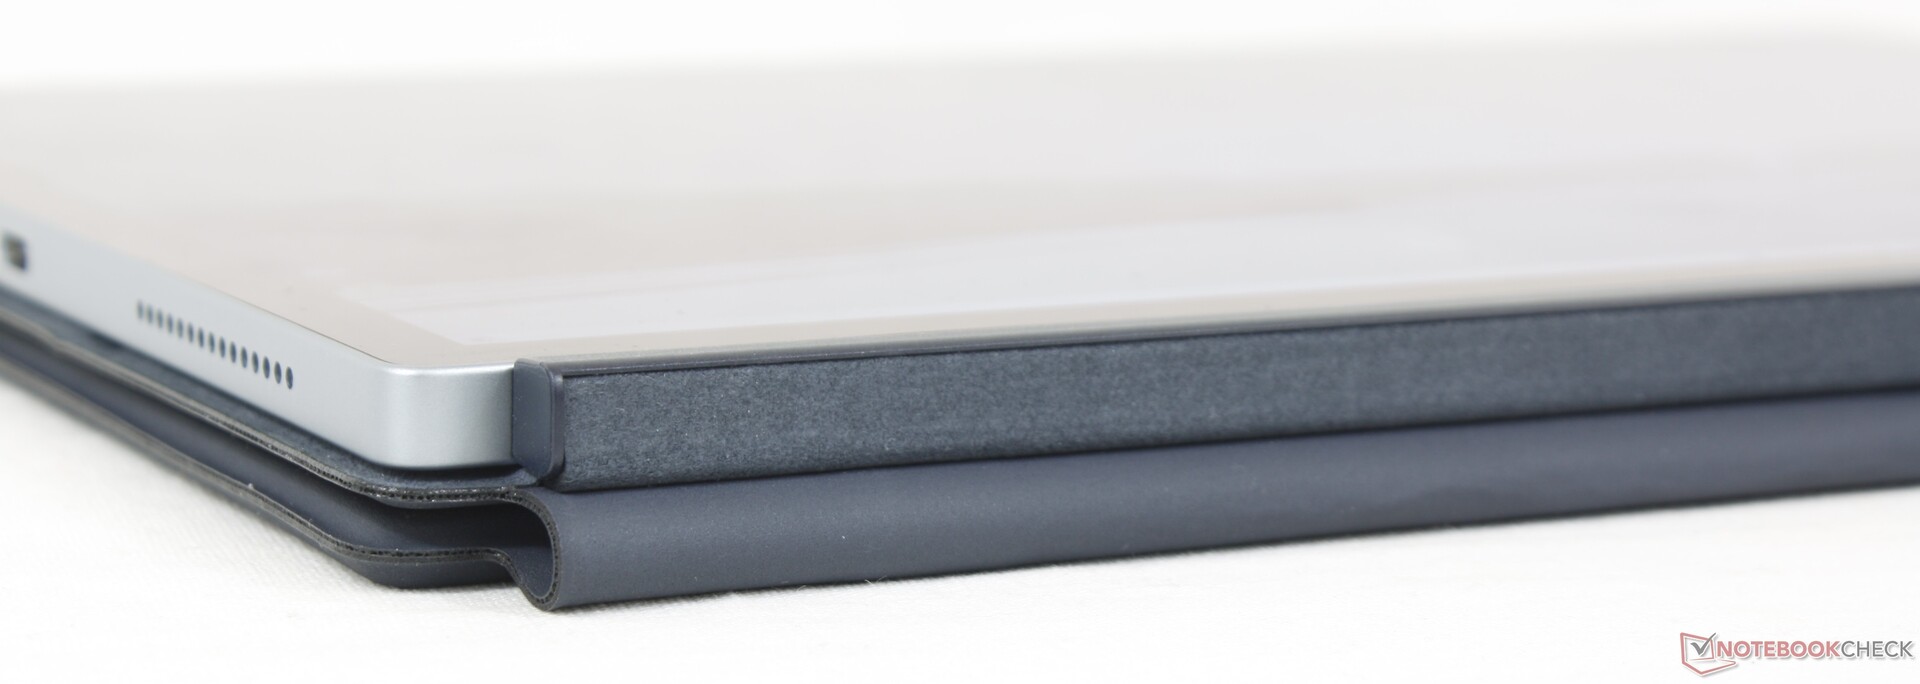
Den magnetiska tangentbordsdockan (eller folio) är ett mjukt material som inte är olikt Alcantara-ytorna på Surface Pro 8 tangentbordsdockan. Dell-lösningen skiljer sig dock avsevärt från Microsofts version eftersom den innehåller ett bakre skydd medan Surface Pro Type Cover endast består av ett tangentbord och en pekplatta. Denna baksida ger ytterligare skydd mot repor och repor till priset av ökad vikt.
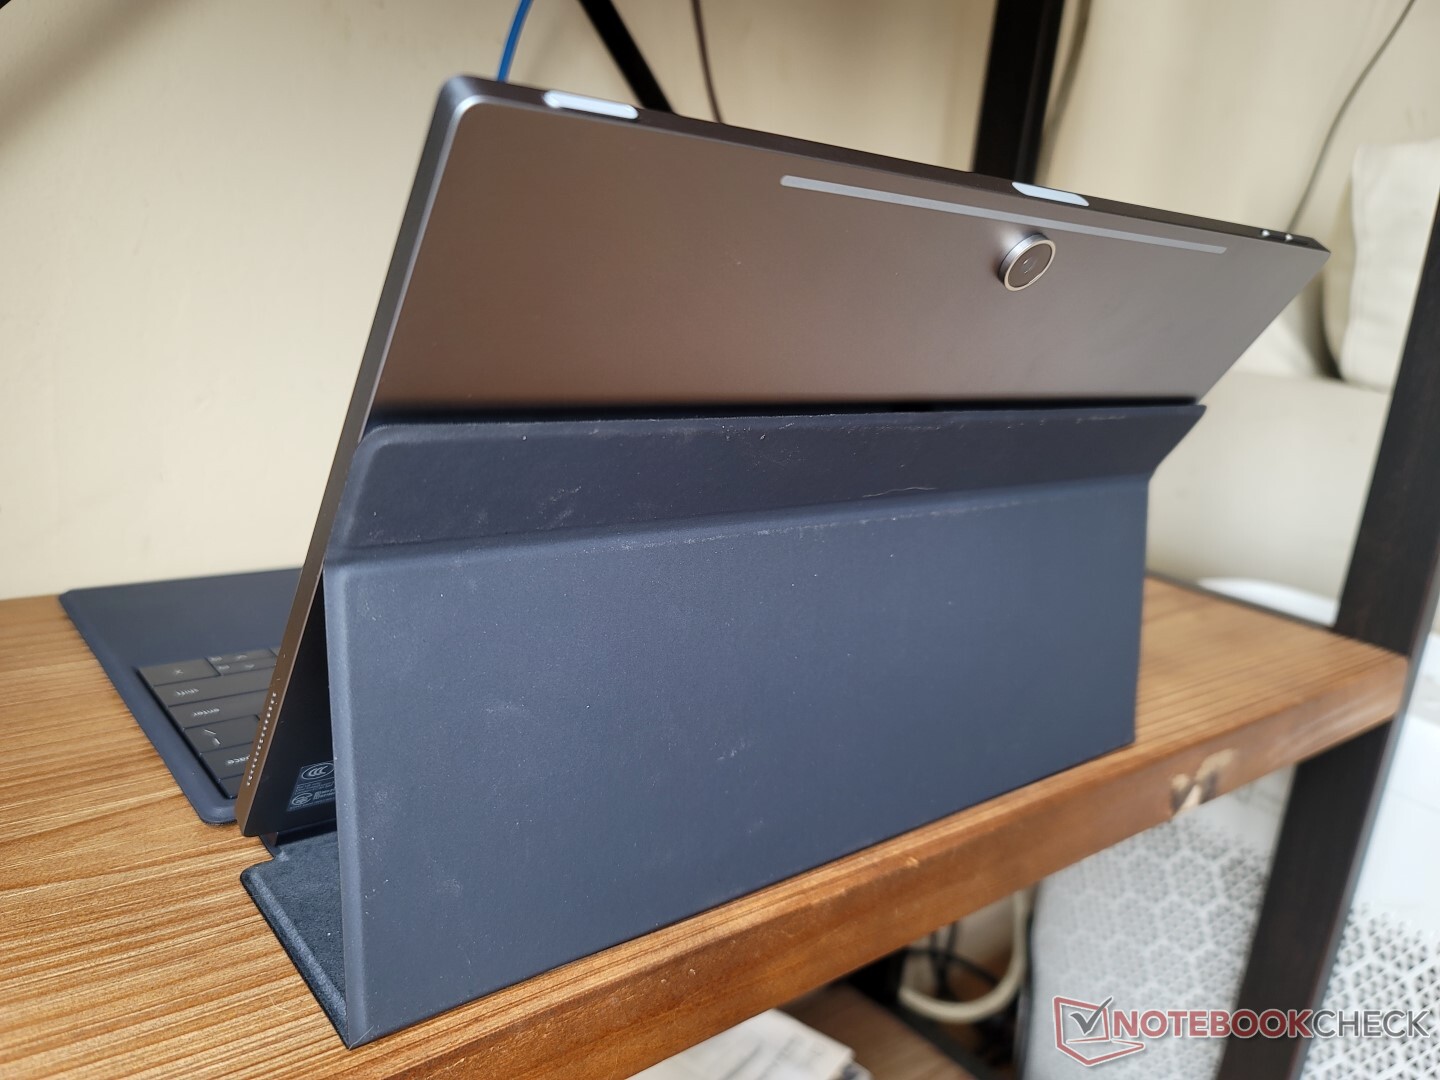
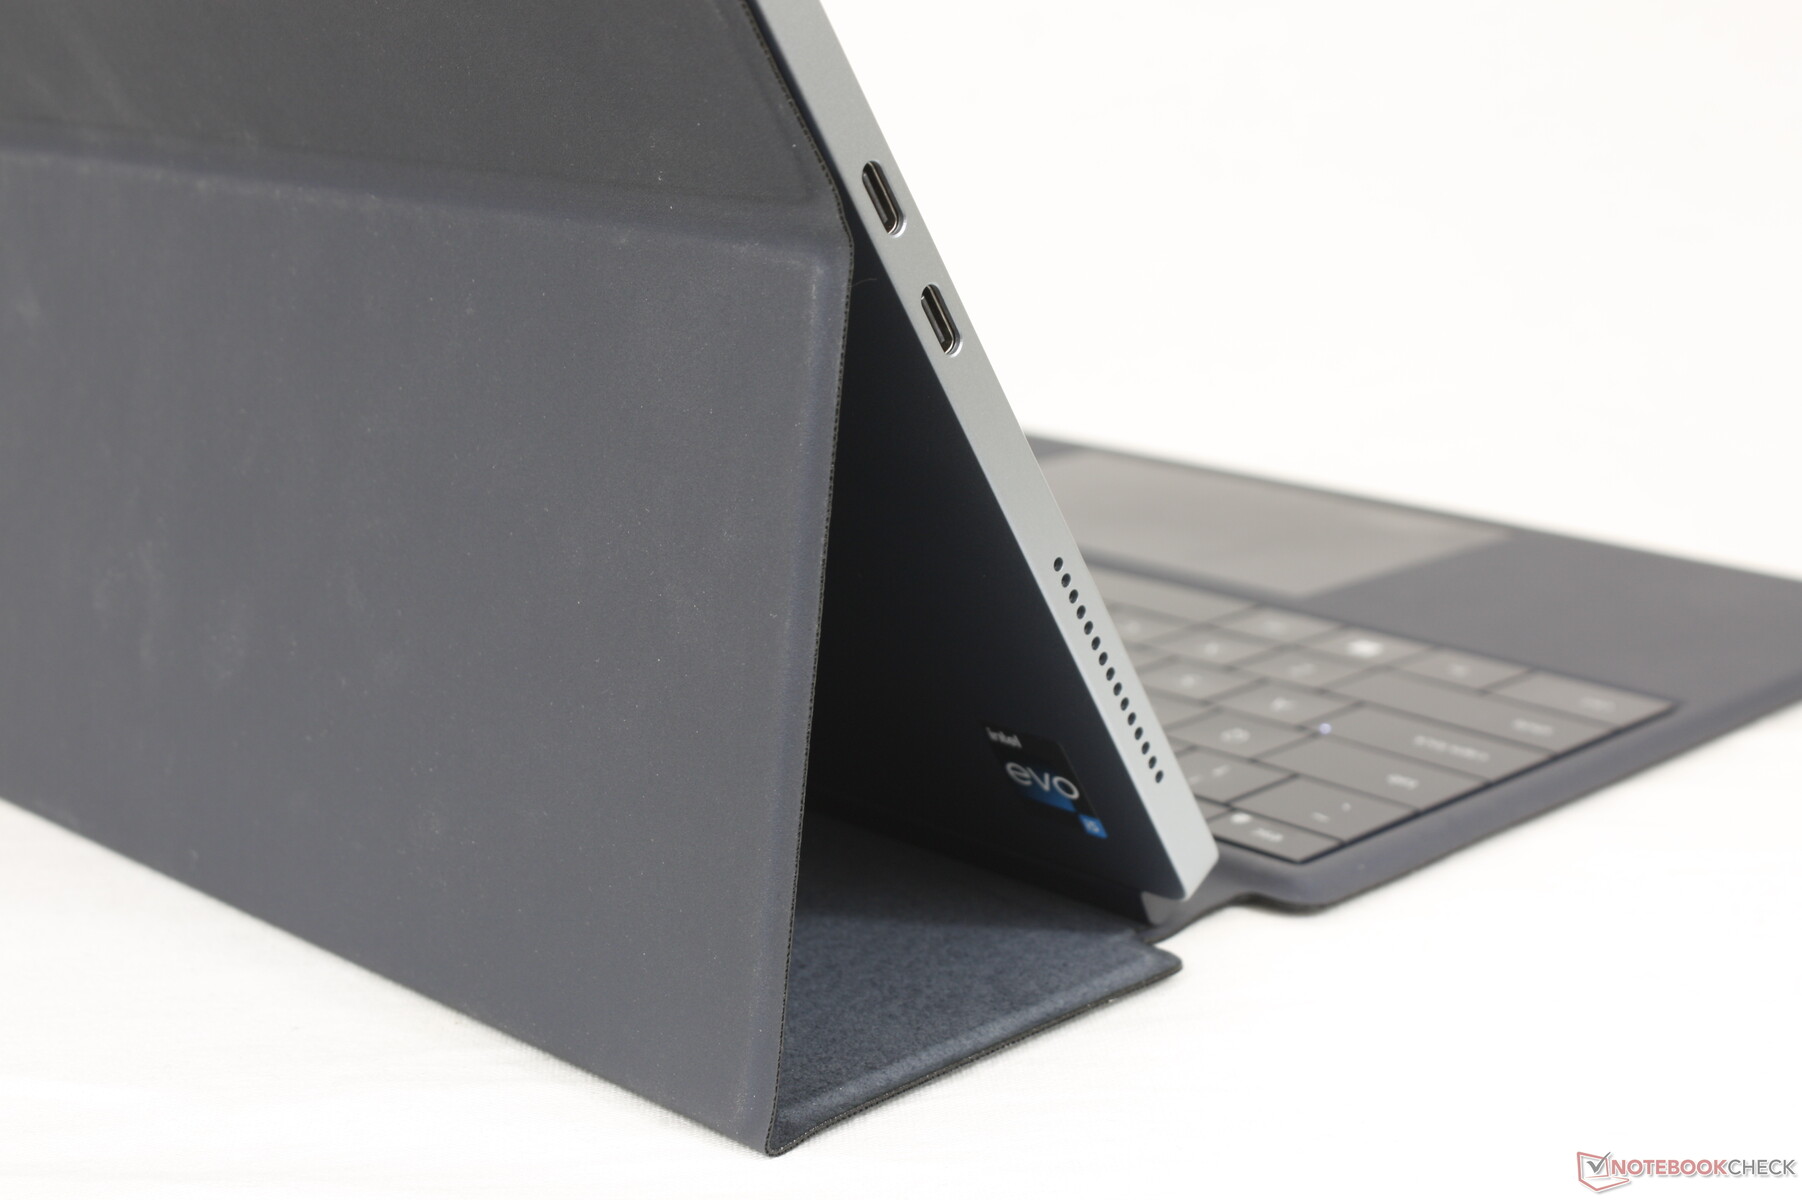
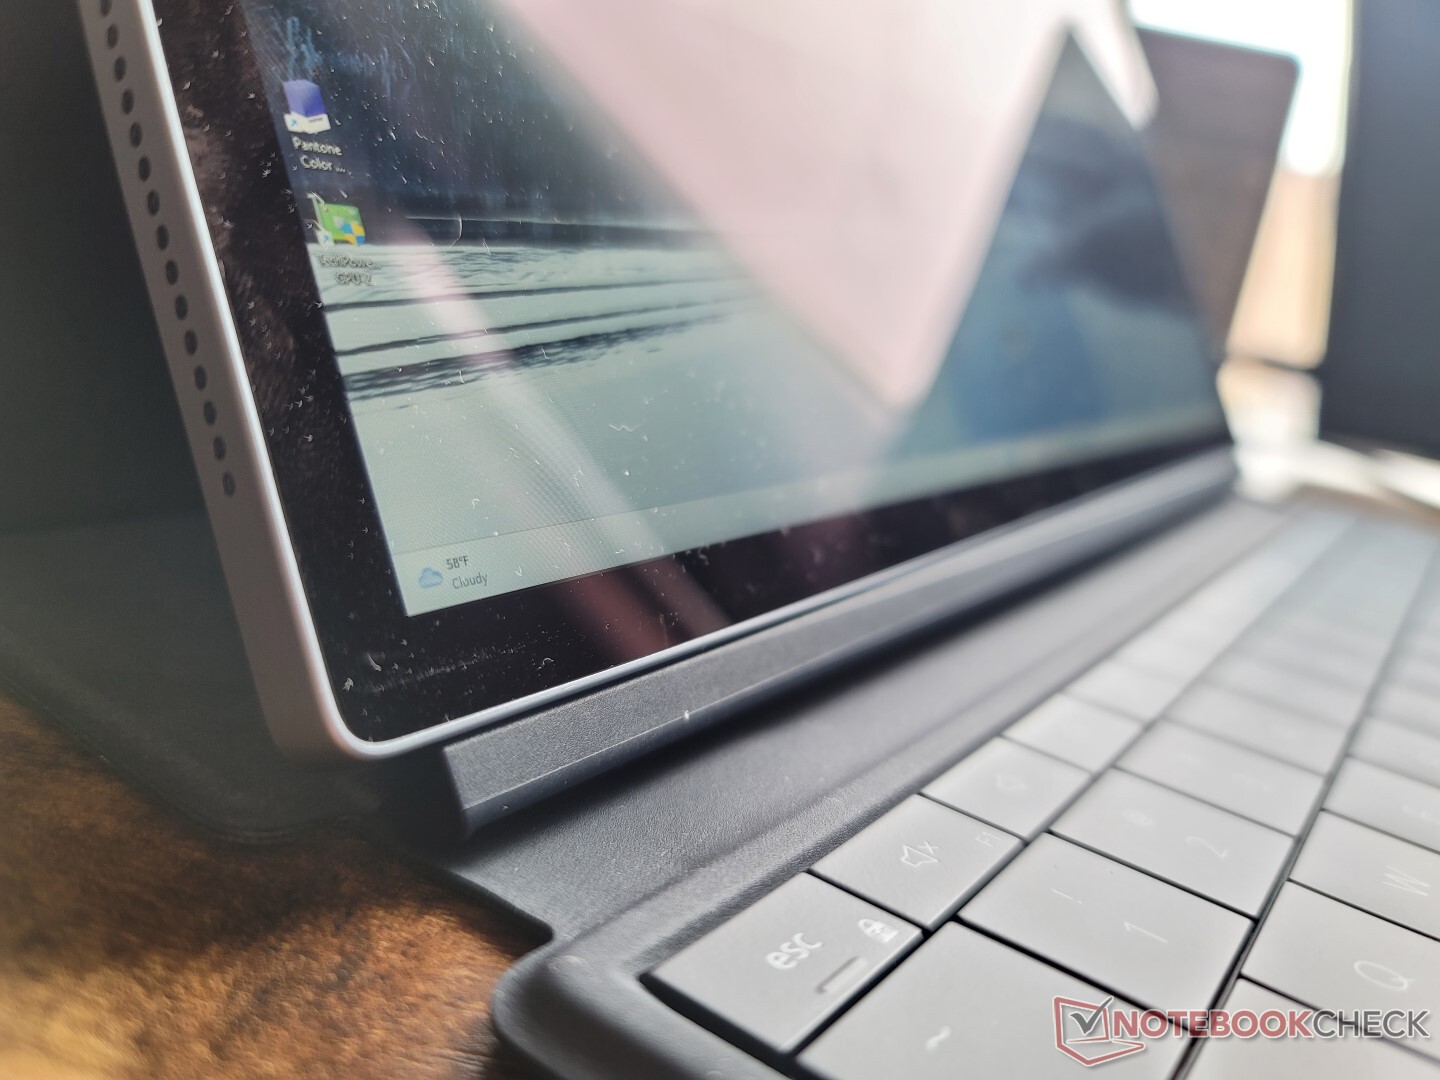
För att förankra Dell-surfplattan i bärbart läge kan baksidan av folion justeras till endast 100, 115 och 125 grader medan gångjärnet på Surface Pro 8 kan röra sig mer fritt. Med andra ord kräver XPS 13 9315 2-in-1 den valfria folio-dockan för att stötta sig själv medan Surface Pro 8 har ett bekvämare inbyggt stativ.
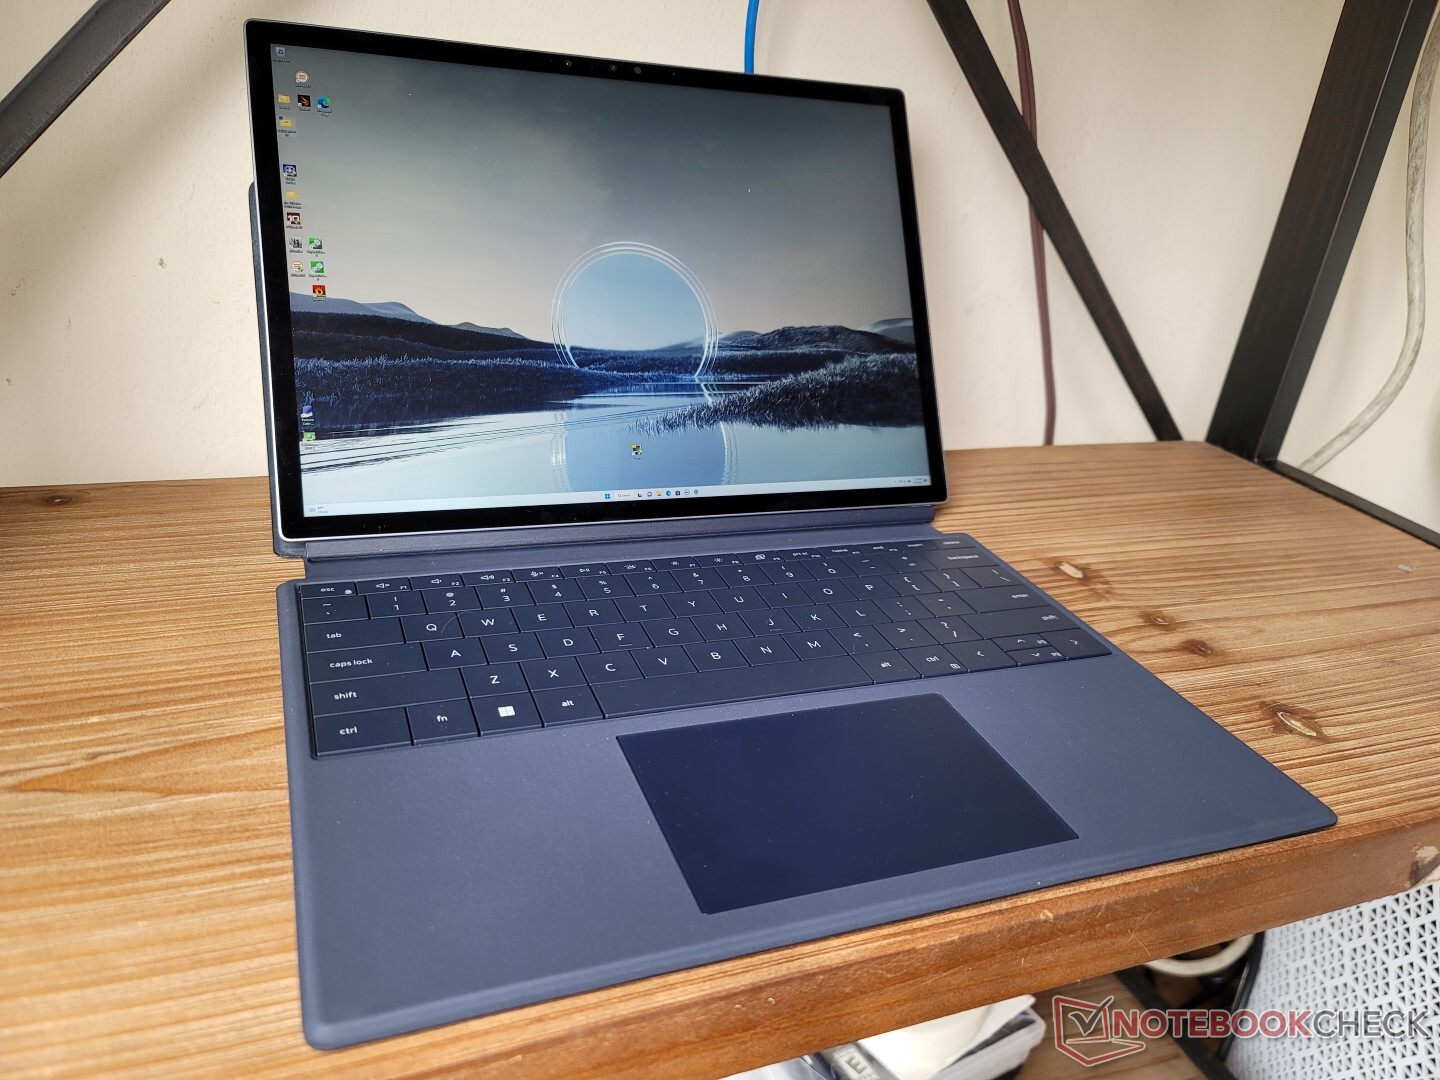
Surfplattan i sig själv är mycket lätt med bara 764 g jämfört med nästan 900 g för en Surface Pro 8. En stor del av viktbesparingen kan tillskrivas Dells fläktlösa konstruktion medan Microsofts modell har en fläkt för bättre kylning. Den kombinerade vikten mellan surfplattan och fodralet är 1305 g, vilket ligger nära många 13,5-tums clamshells som t.ex.HP Spectre x360 13,5.
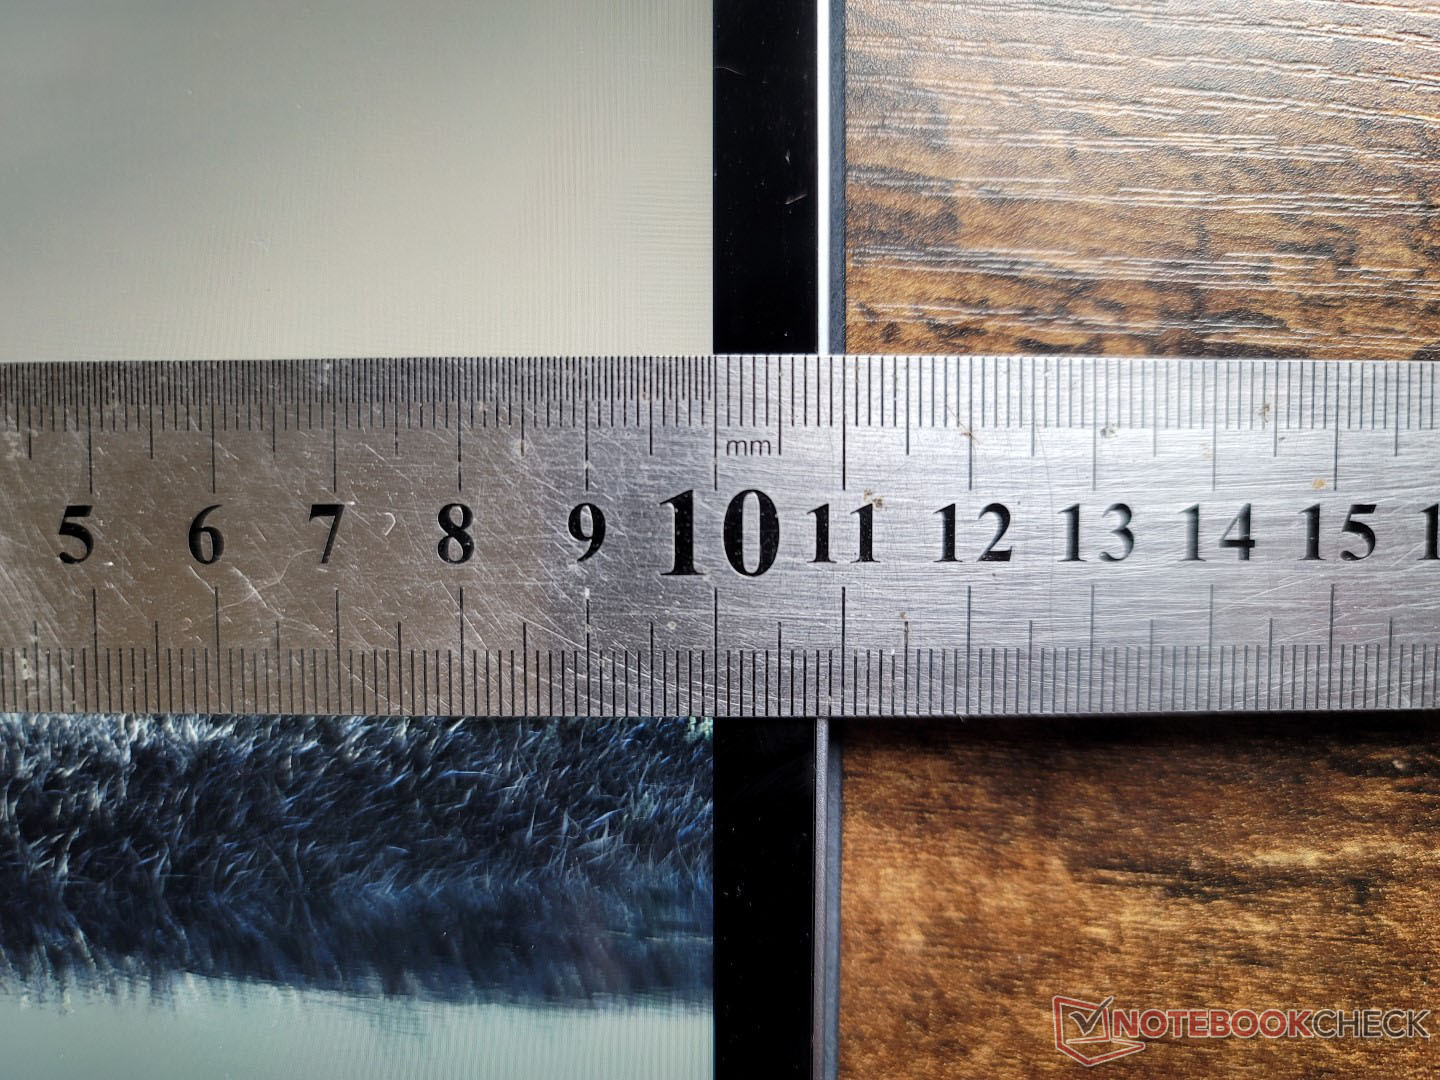
5G-konfigurationerna av XPS 13 9315 2-in-1 är något tjockare med 4/10 av en millimeter (7,8 mot 7,4 mm). Alla alternativ är fortfarande tunnare än Surface Pro 8 med bara en hårsmån samtidigt som de är nästan identiska i längd och bredd.
Anslutningsmöjligheter - Inget ljuduttag
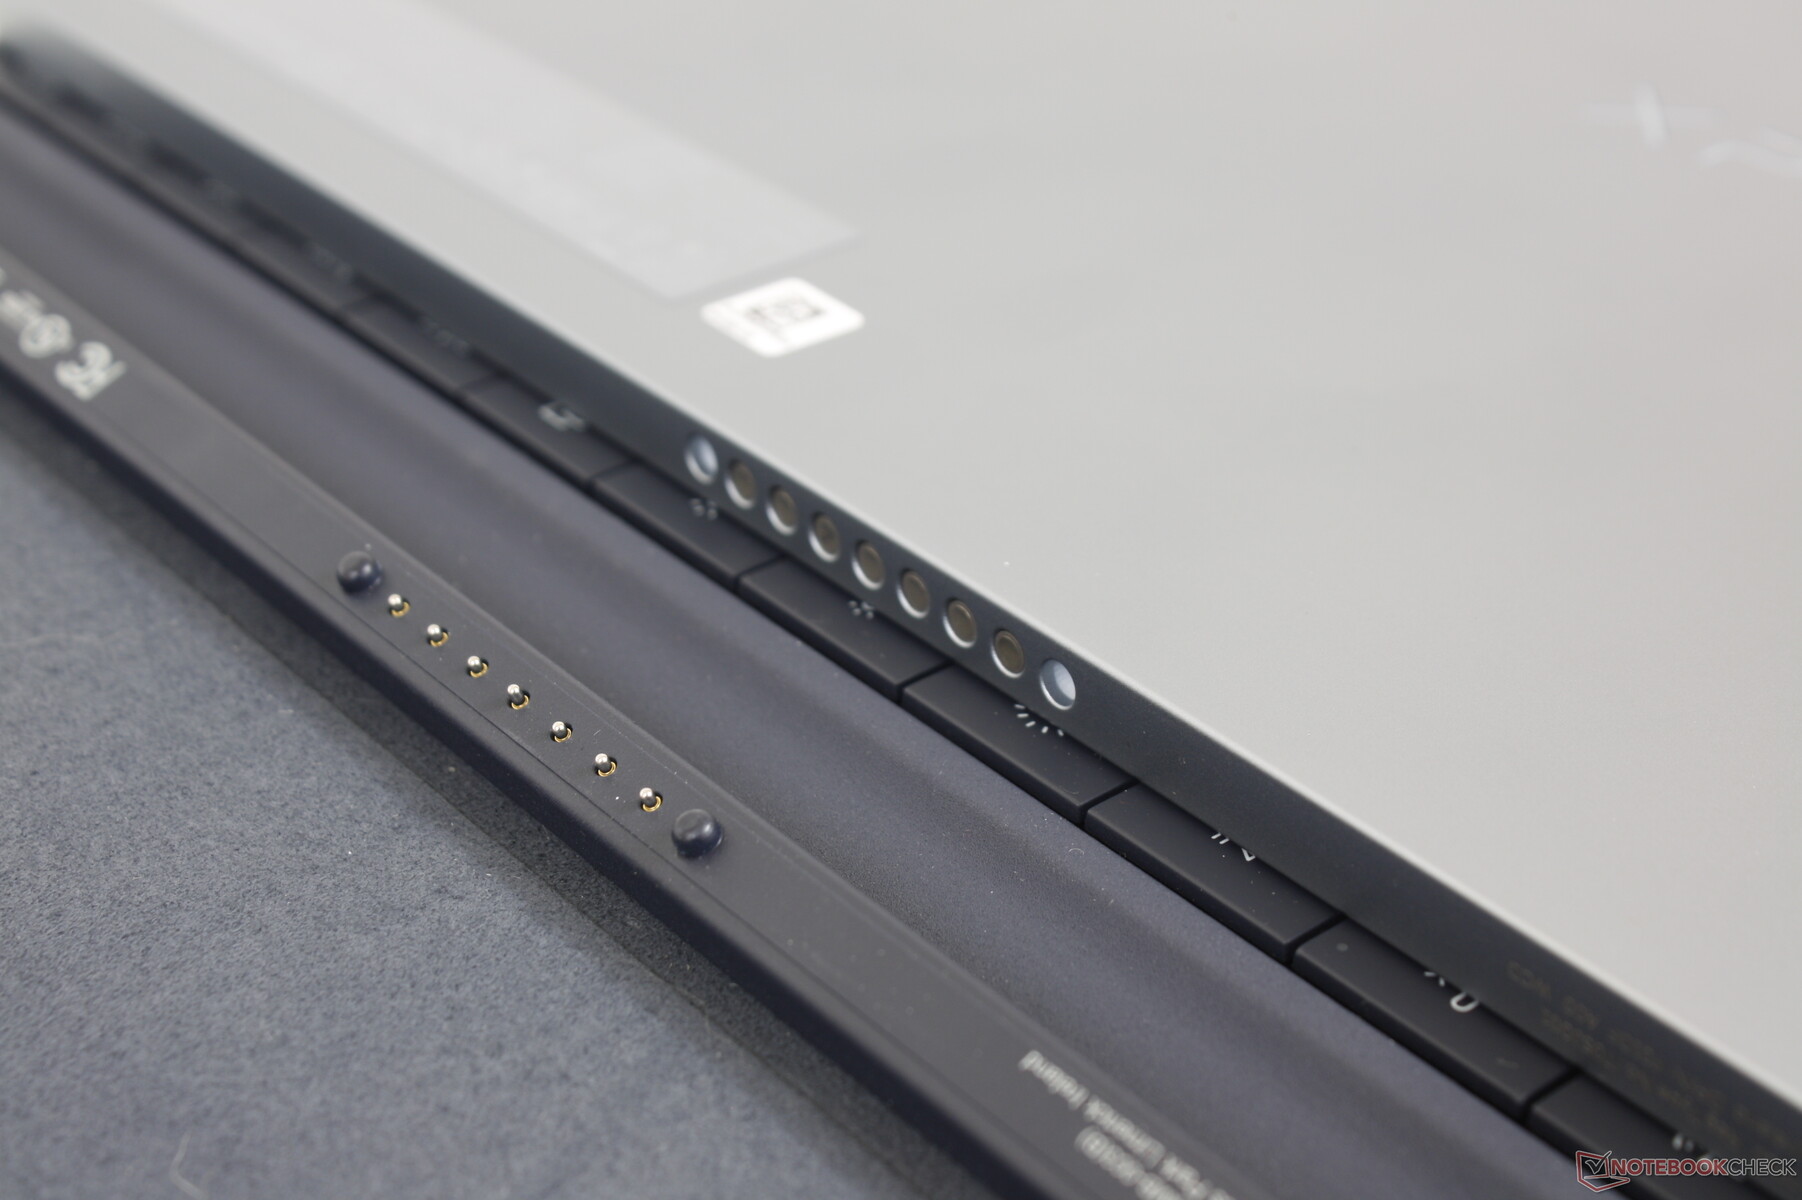
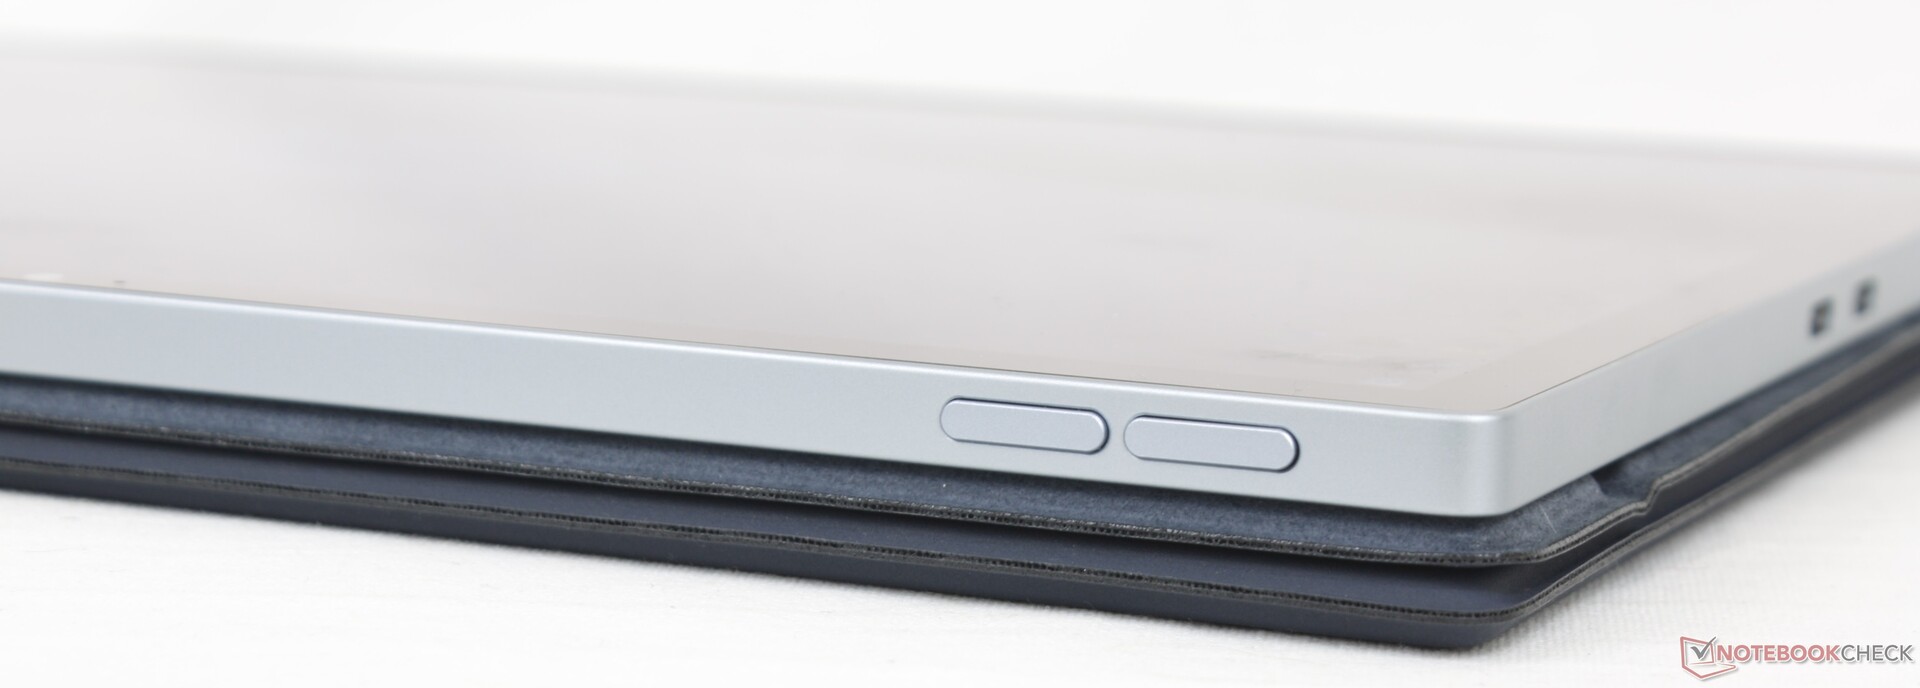
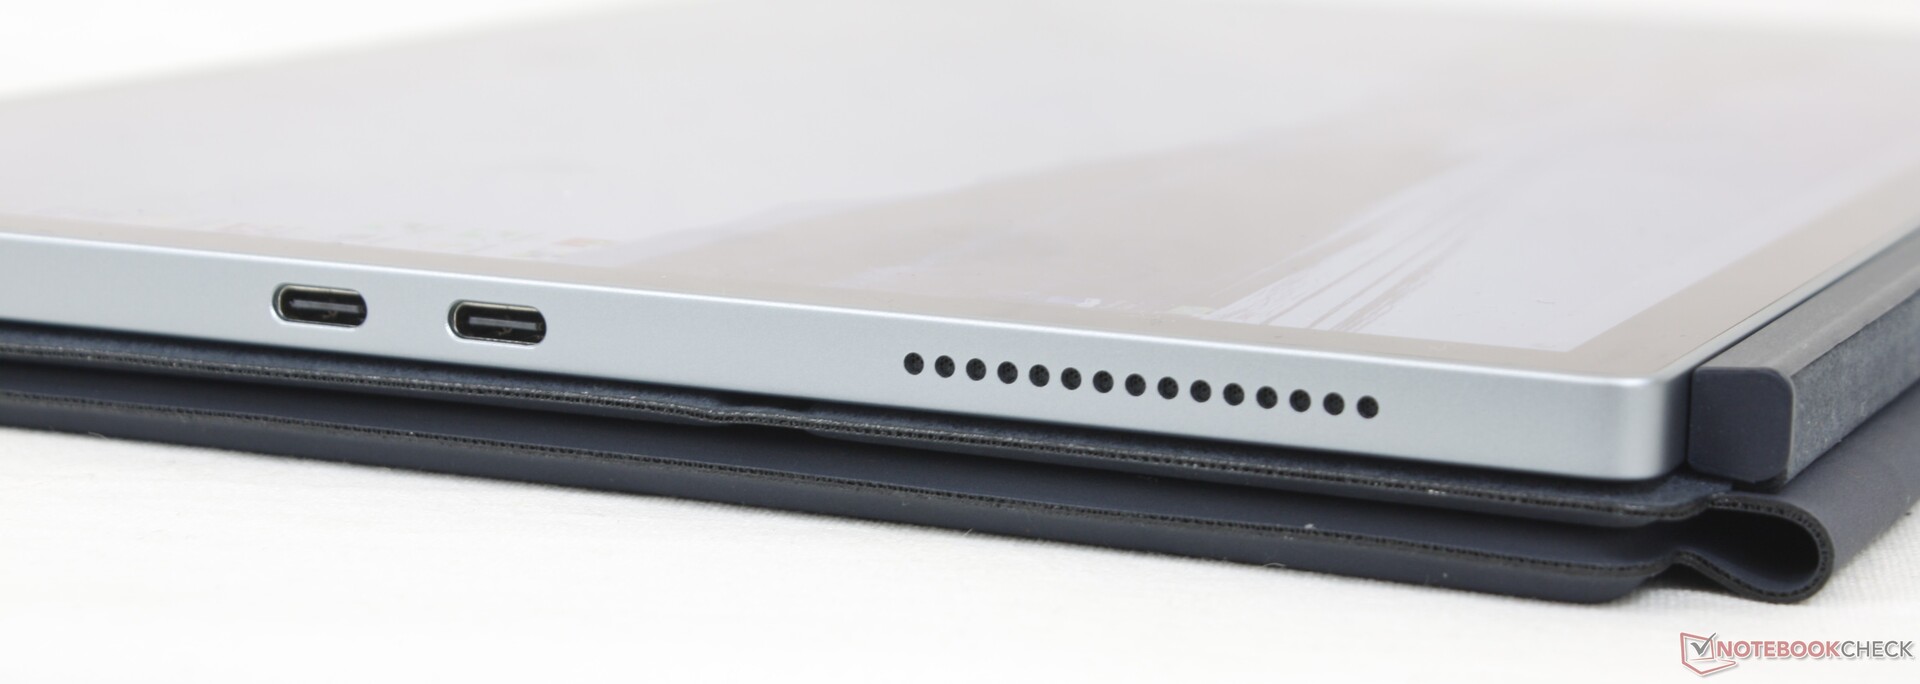
Det finns endast två USB-C-portar längs vänsterkanten, båda kompatibla med Thunderbolt 4-enheter. Användarna förväntas ha dockningsstationer och adaptrar redo för att bättre utnyttja de två portarna. Tänk på att det inte ens finns ett 3,5 mm-ljuduttag medan Surface Pro 8 har ett sådant.
Kommunikation
En Intel 1675 AX211 är standard för Wi-Fi 6E och Bluetooth 5.2-kompatibilitet. Överföringshastigheterna är snabba och stabila när de är kopplade till vårt 6 GHz-nätverk, men den genomsnittliga mottagningshastigheten är lite långsammare än väntat.
| Networking | |
| iperf3 transmit AX12 | |
| Microsoft Surface Pro 8, i7-1185G7 | |
| Lenovo ThinkBook Plus Gen2 Core i5 | |
| iperf3 receive AX12 | |
| Microsoft Surface Pro 8, i7-1185G7 | |
| Lenovo ThinkBook Plus Gen2 Core i5 | |
| iperf3 receive AXE11000 6GHz | |
| HP Spectre x360 13.5 14t-ef000 | |
| Dell XPS 13 9315 2-in-1 Core i5-1230U | |
| iperf3 receive AXE11000 | |
| Apple MacBook Air M2 Entry | |
| iperf3 transmit AXE11000 | |
| Apple MacBook Air M2 Entry | |
| iperf3 transmit AXE11000 6GHz | |
| HP Spectre x360 13.5 14t-ef000 | |
| Dell XPS 13 9315 2-in-1 Core i5-1230U | |
Webbkamera
Den bakre kameran är 11 MP, vilket kanske inte är en slump, är 1 MP mer än kameran på Surface Pro 8. Bildkvaliteten är betydligt skarpare än något som finns på en webbkamera på en bärbar dator, även om färgprecisionen fortfarande har en lång väg att gå.
IR finns med för stöd för Windows Hello. Det finns tyvärr ingen slutare för webbkameran av integritetsskäl.


Tillbehör och garanti
I butikslådan ingår två praktiska USB-C-adaptrar för konvertering till USB-A och 3,5 mm-ljud. I likhet med Microsoft och dess Surface Pro-tablettserie säljs dock den avtagbara tangentbordsbasen och den magnetiska aktiva stylus separat för ytterligare 100 USD vardera. Med andra ord måste du lägga till 200 dollar utöver det ursprungliga priset om du vill ha både tangentbordsbasen och pennan.
Den vanliga ettåriga begränsade tillverkargarantin gäller om den köps i USA.
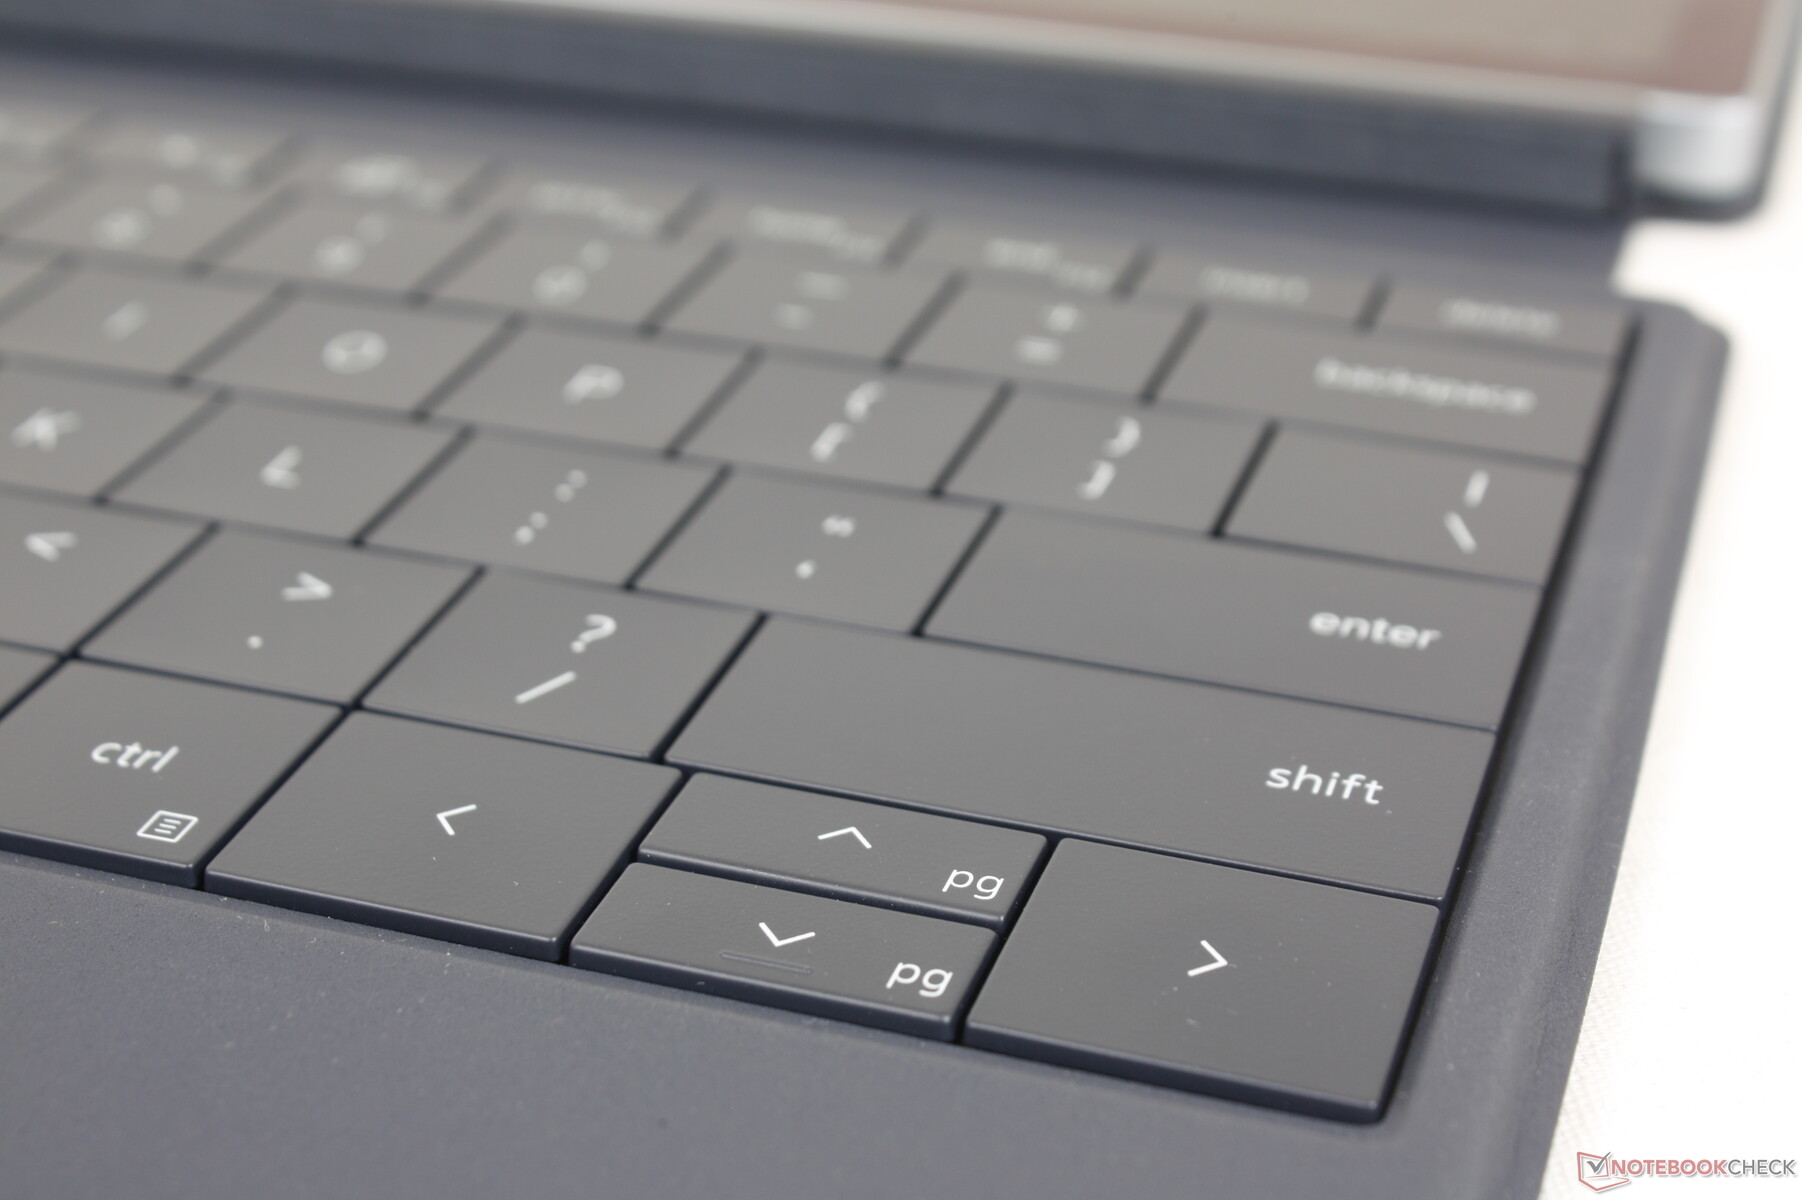
Inmatningsenheter - Ett av de mest bekväma löstagbara tangentborden
Tangentbord
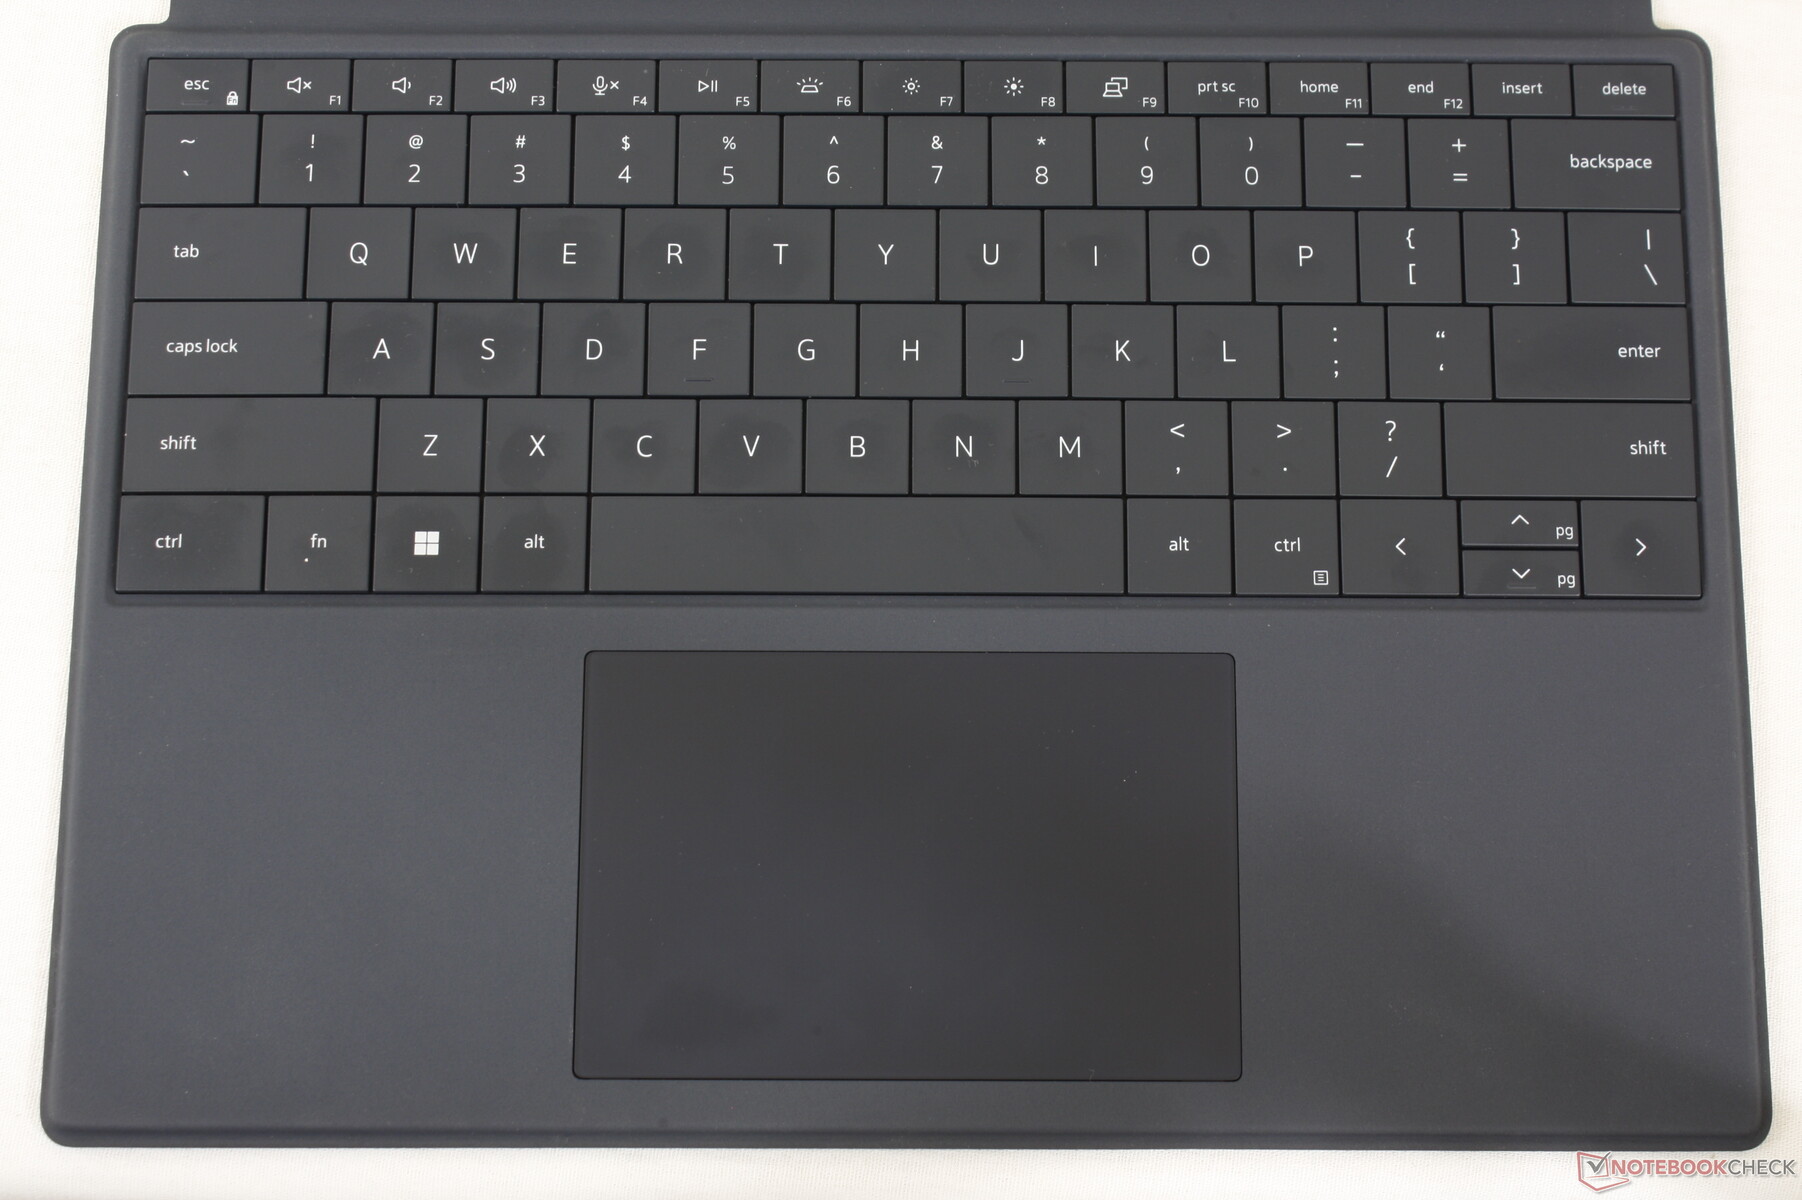
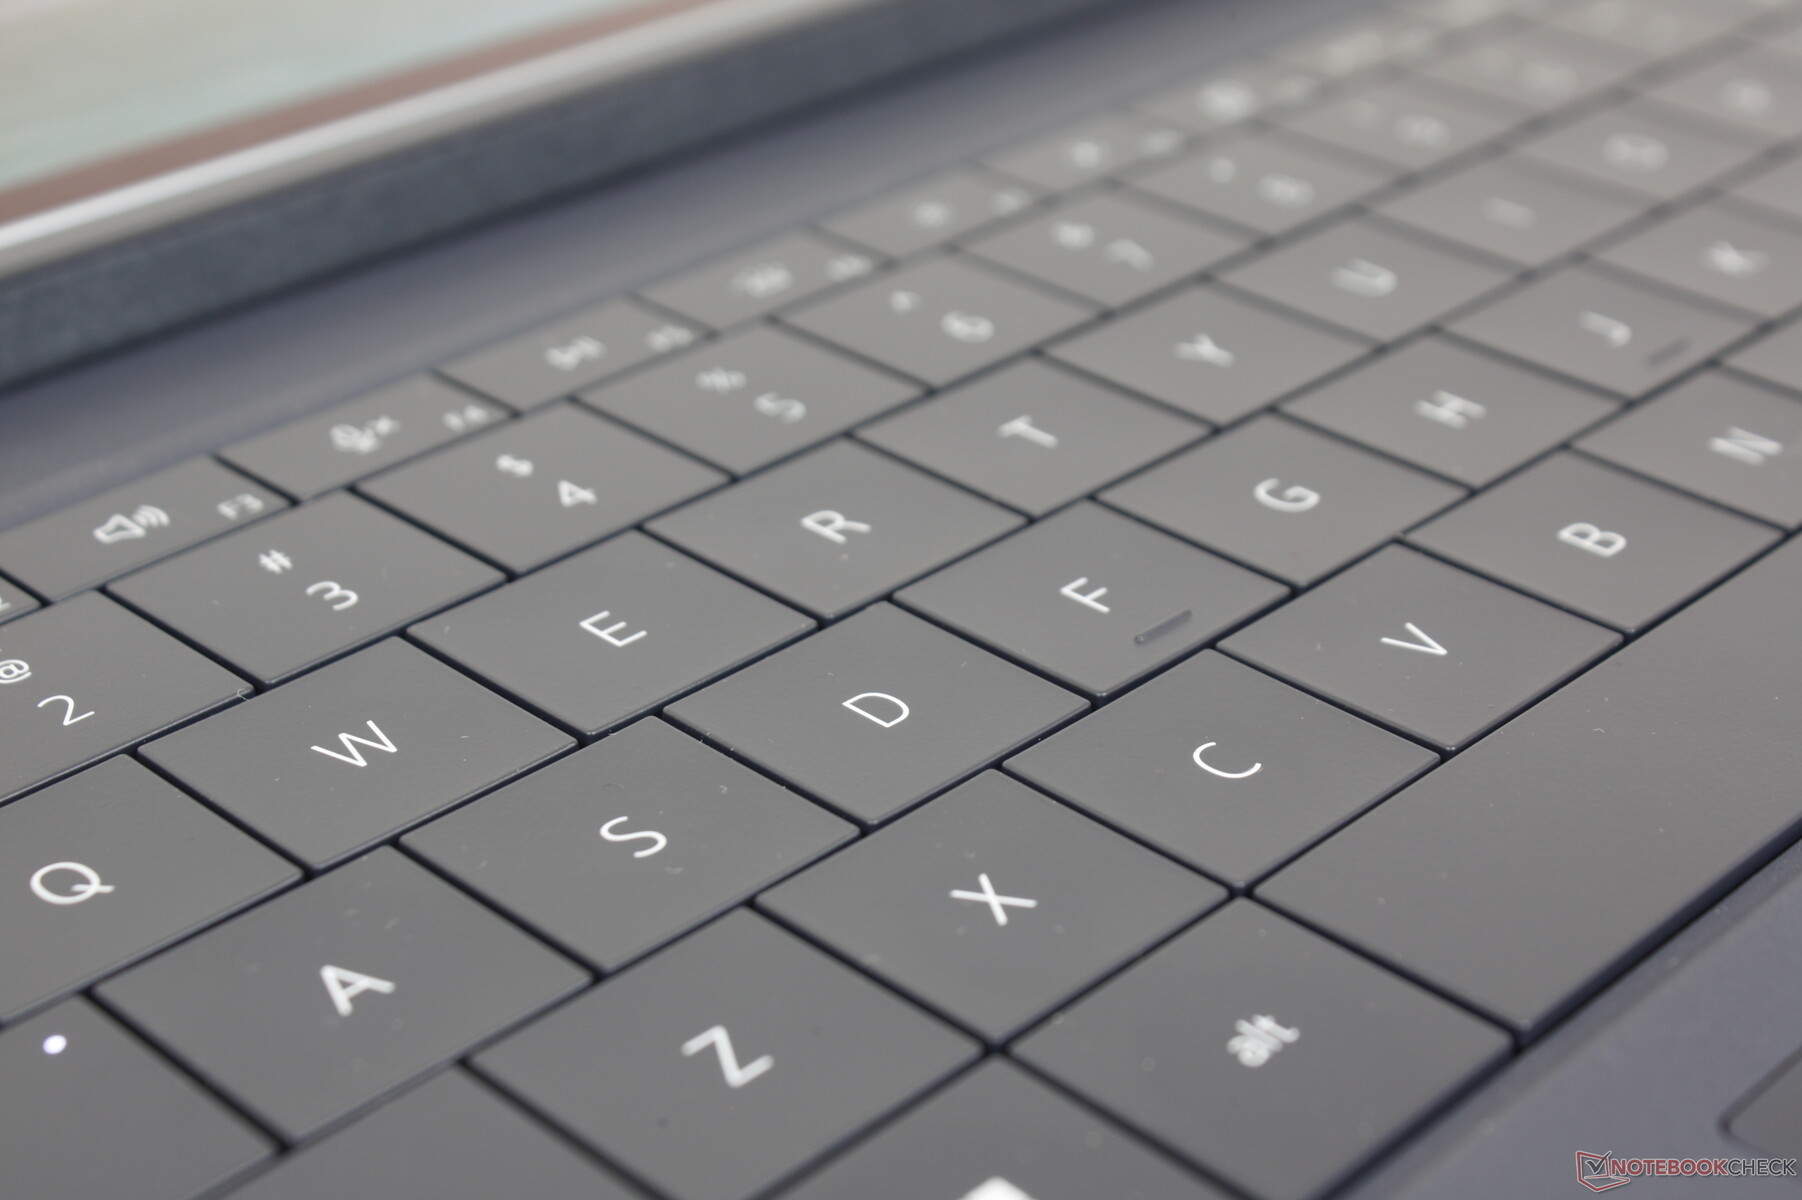
Tangentbordet är modellerat efter tangentbordet på XPS 13 Plus 9320 och därför känns de nästan likadana när det gäller rörlighet och återkoppling. En del kan tycka att tangenternas 1,0 mm rörelse är för grunt, men den övergripande känslan är ändå mycket bättre än väntat för en löstagbar bas eftersom många i kategorin är ökända för sin dåliga tangentåterkoppling, billiga känsla och svampiga tangenter. XPS 13 9315 2-i-1-tangentbordet kommer hittills närmast ett riktigt Ultrabook-tangentbord
Med det sagt är tangentbordslayouten inte ett till ett med XPS 13 Plus 9320. Det sistnämnda tangentbordet är något bredare samtidigt som det innehåller både strömknappen och den kapacitiva raden med funktionskommandon. Typsnittsstilen och den vita bakgrundsbelysningen är annars i stort sett identiska.
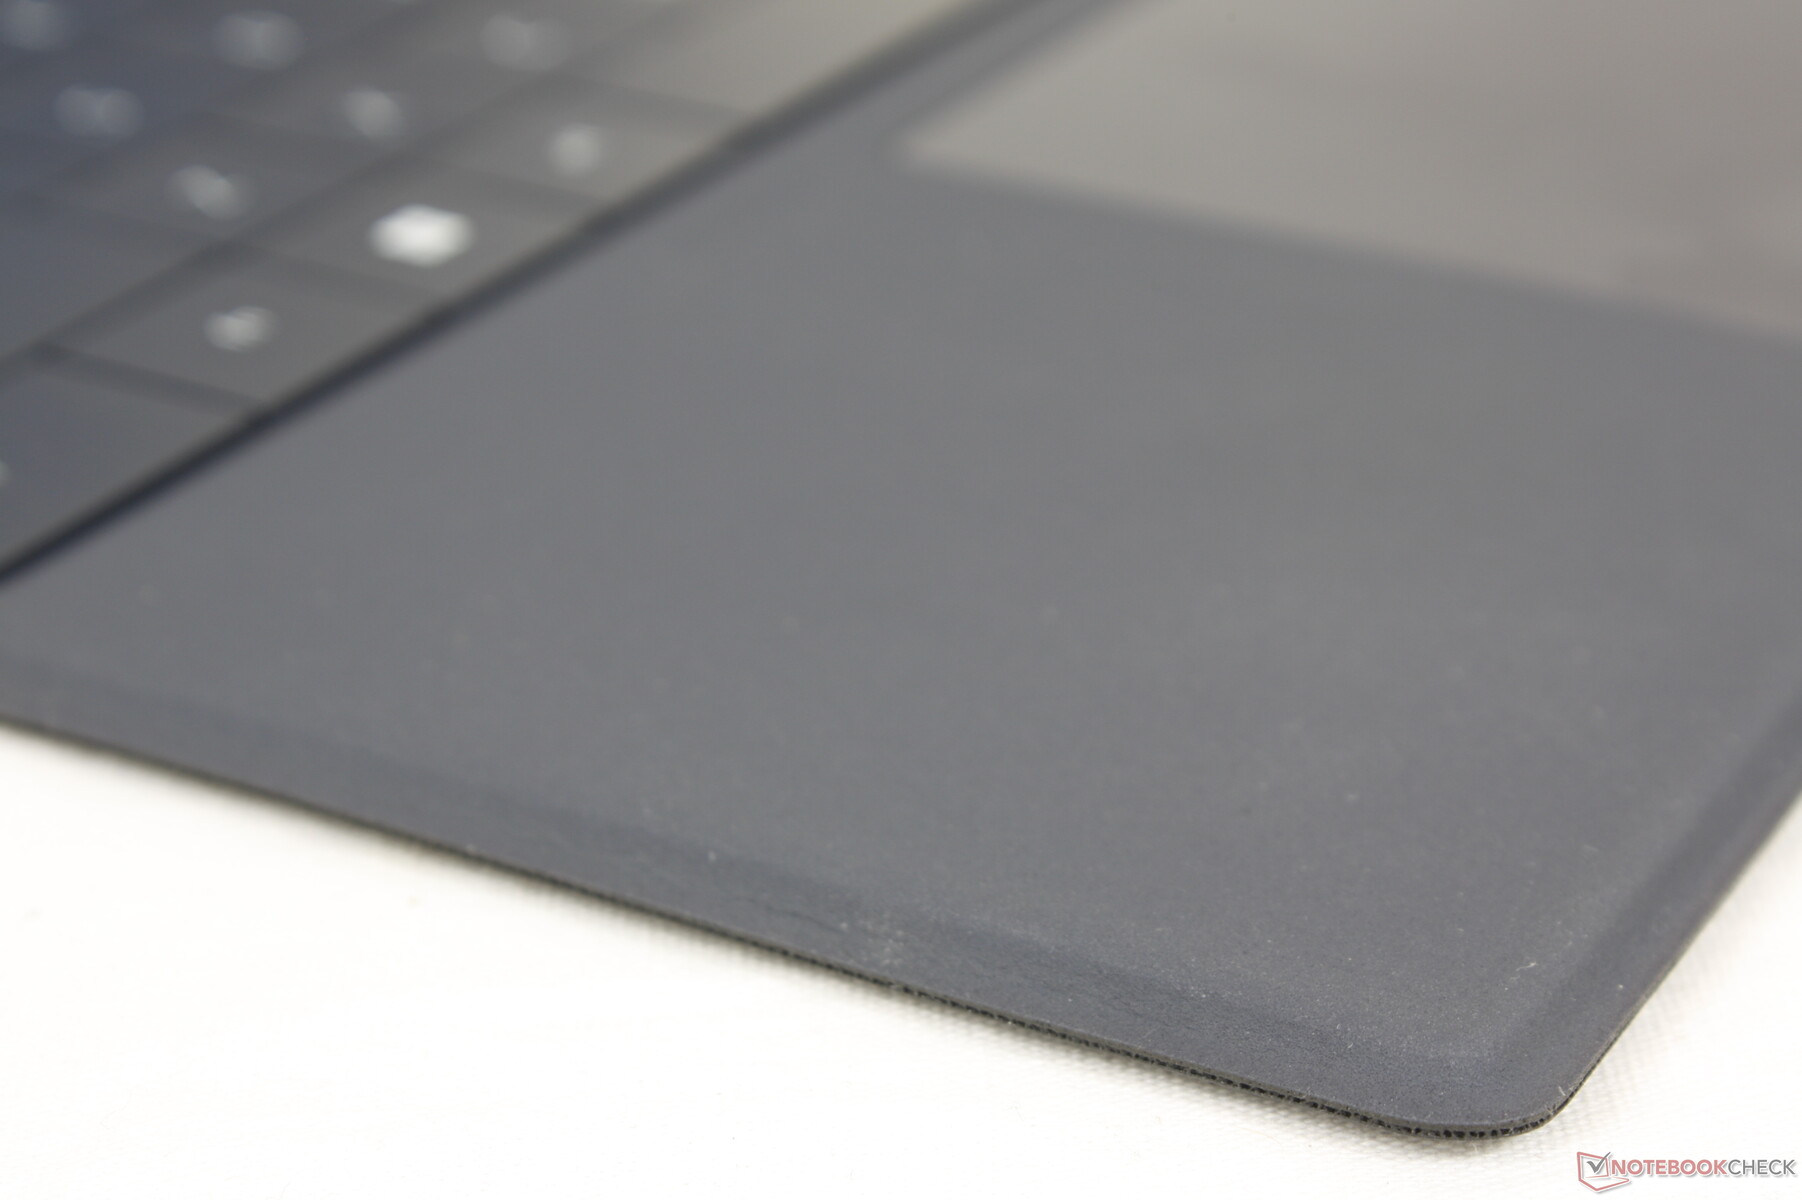
Pekplatta
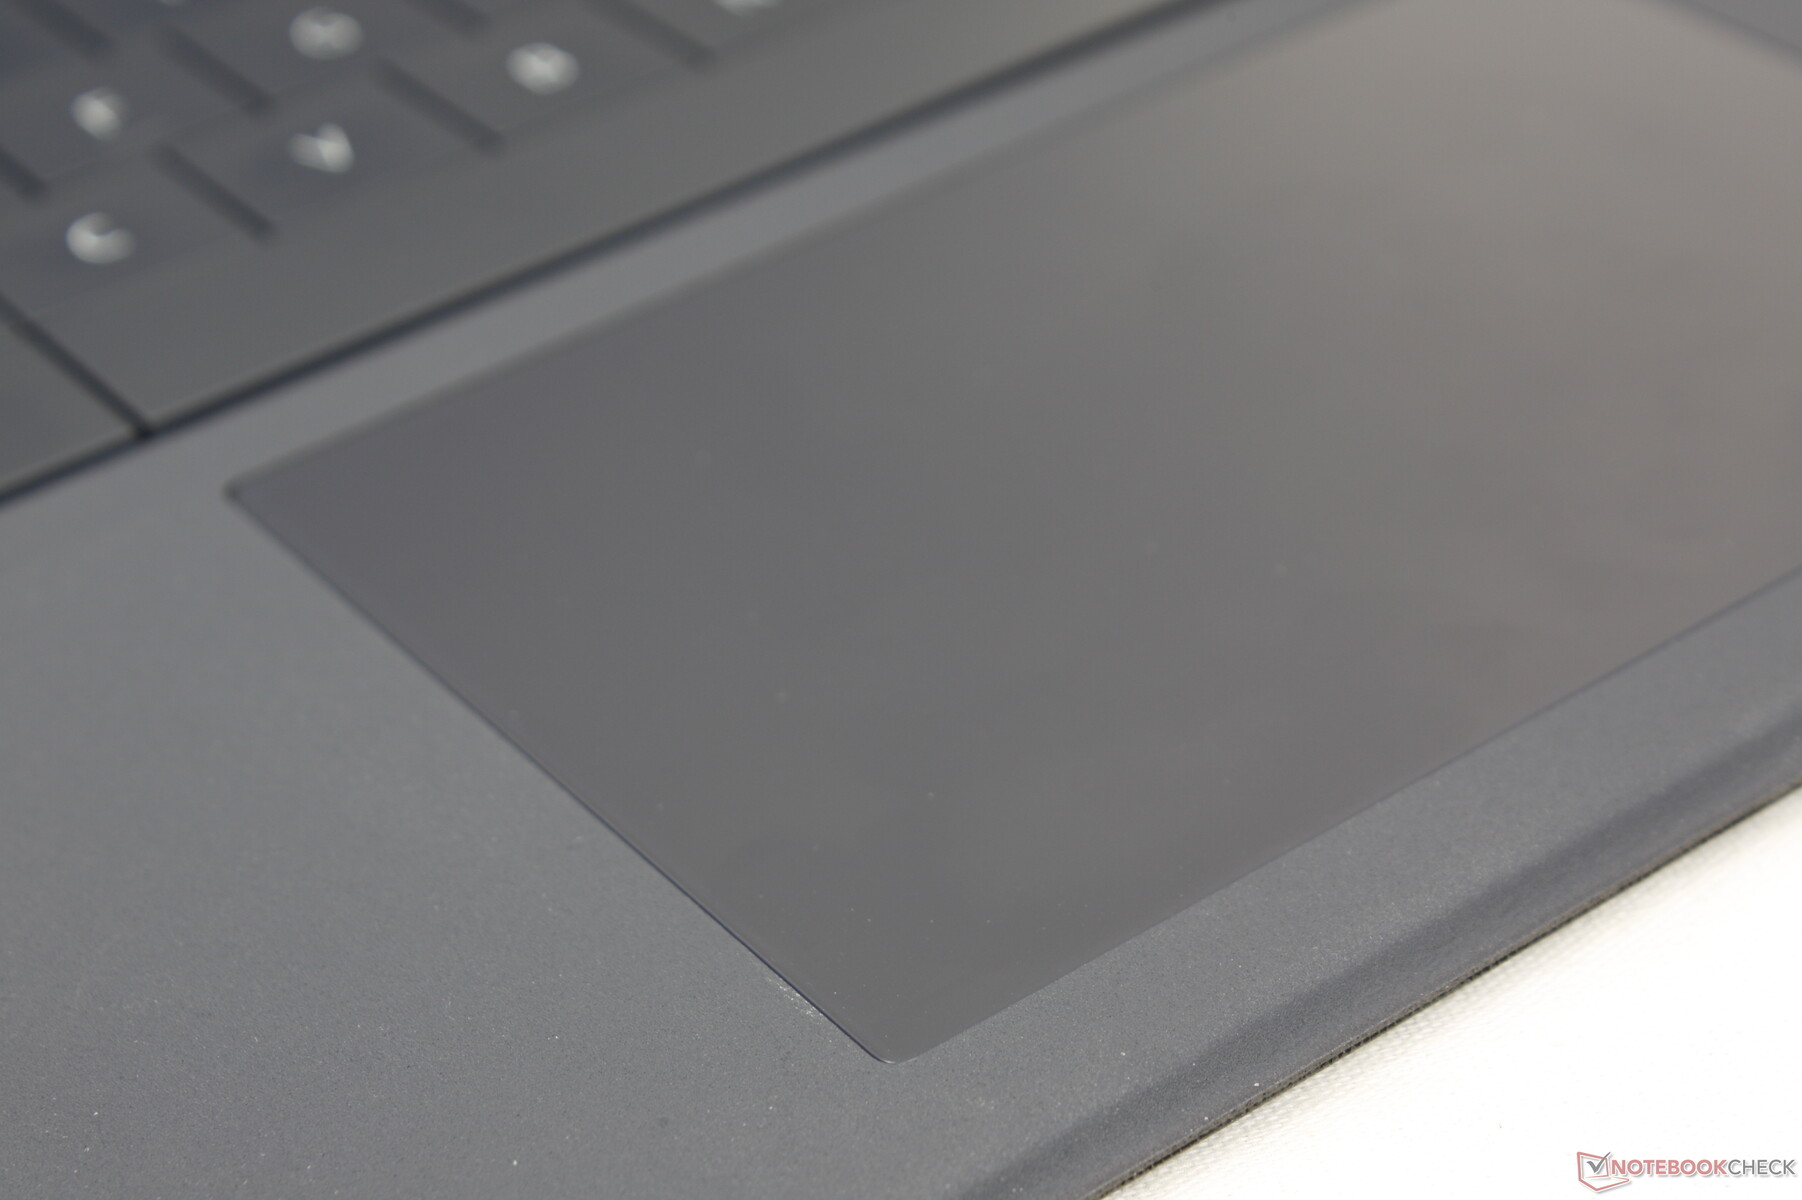
Klickplattan är större än den som finns på Surface Pro-serien (11,4 x 7,5 cm jämfört med 10,2 x 5,3 cm) för att göra det lättare att bläddra och utföra multitouch-inmatningar. Dess yta är helt slät och med mycket lite kladd även när den glider i duschhastigheter. Återkopplingen när man klickar är dock mycket ytligare än på de flesta bärbara datorer och därför är den inte lika tillfredsställande att använda som klickplattan på de mer traditionella XPS 13 9315 clamshell.
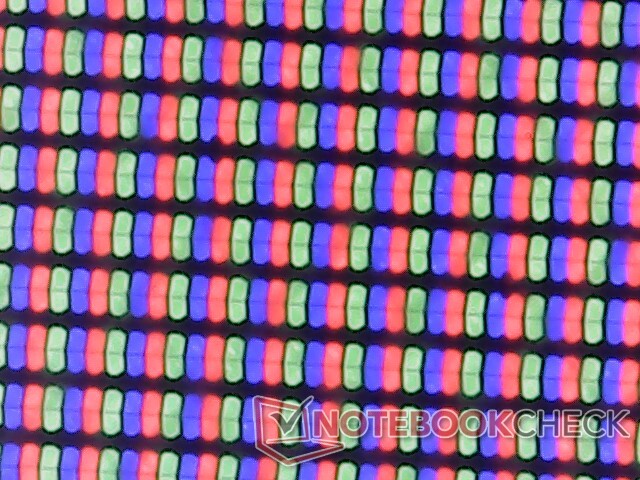
Skärm - endast 60 Hz
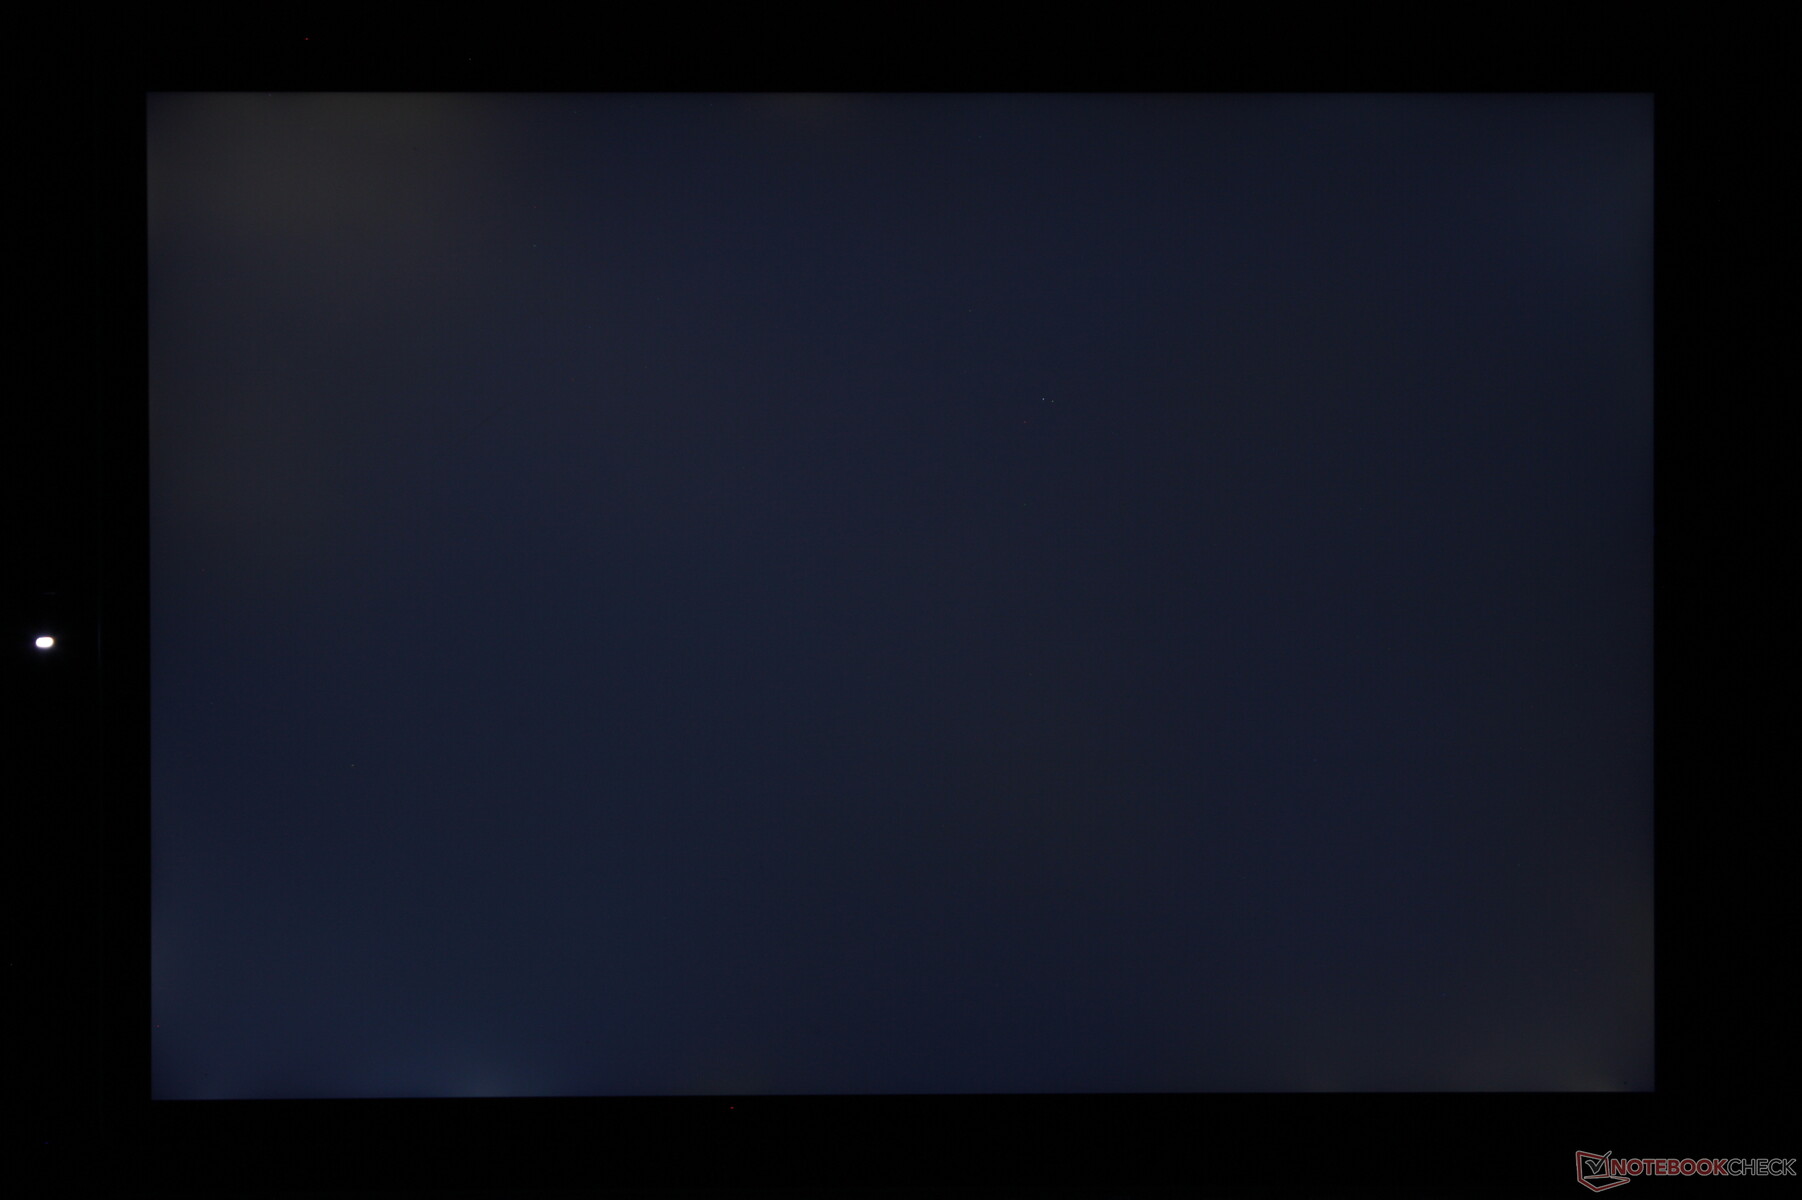
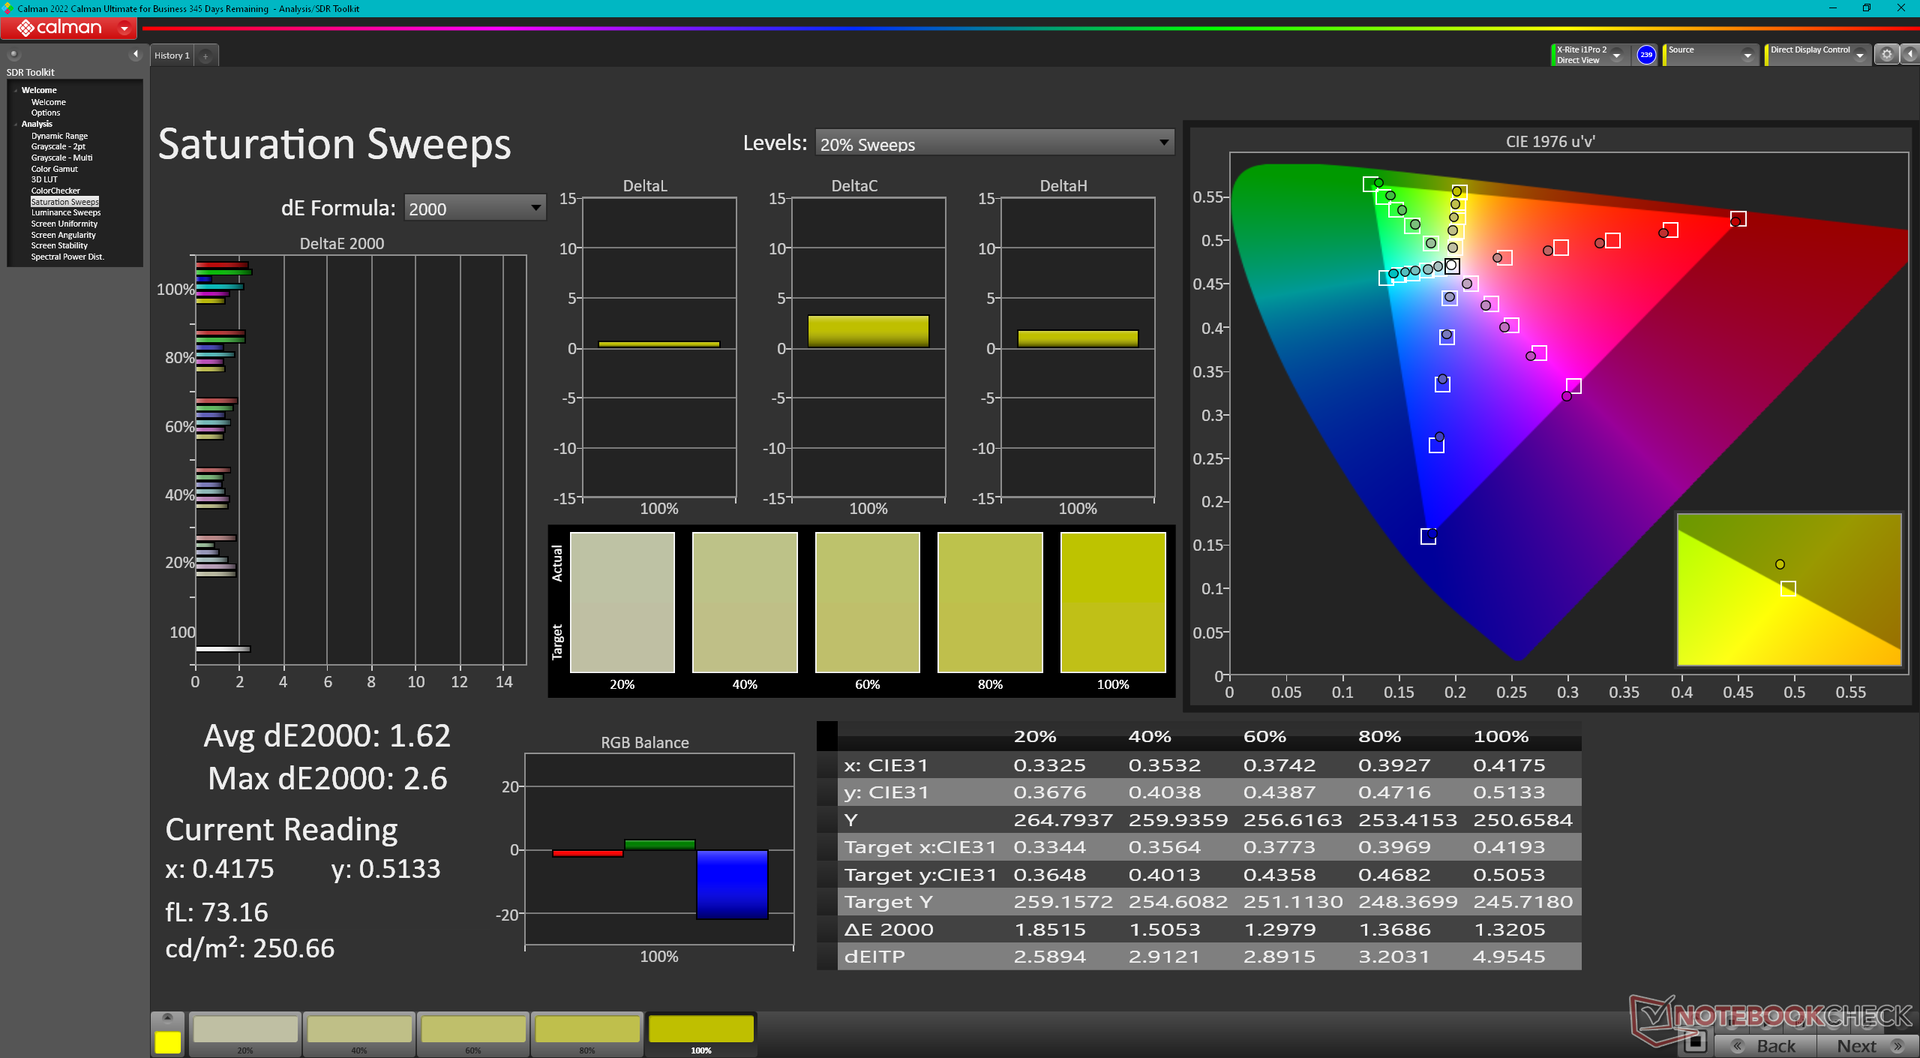
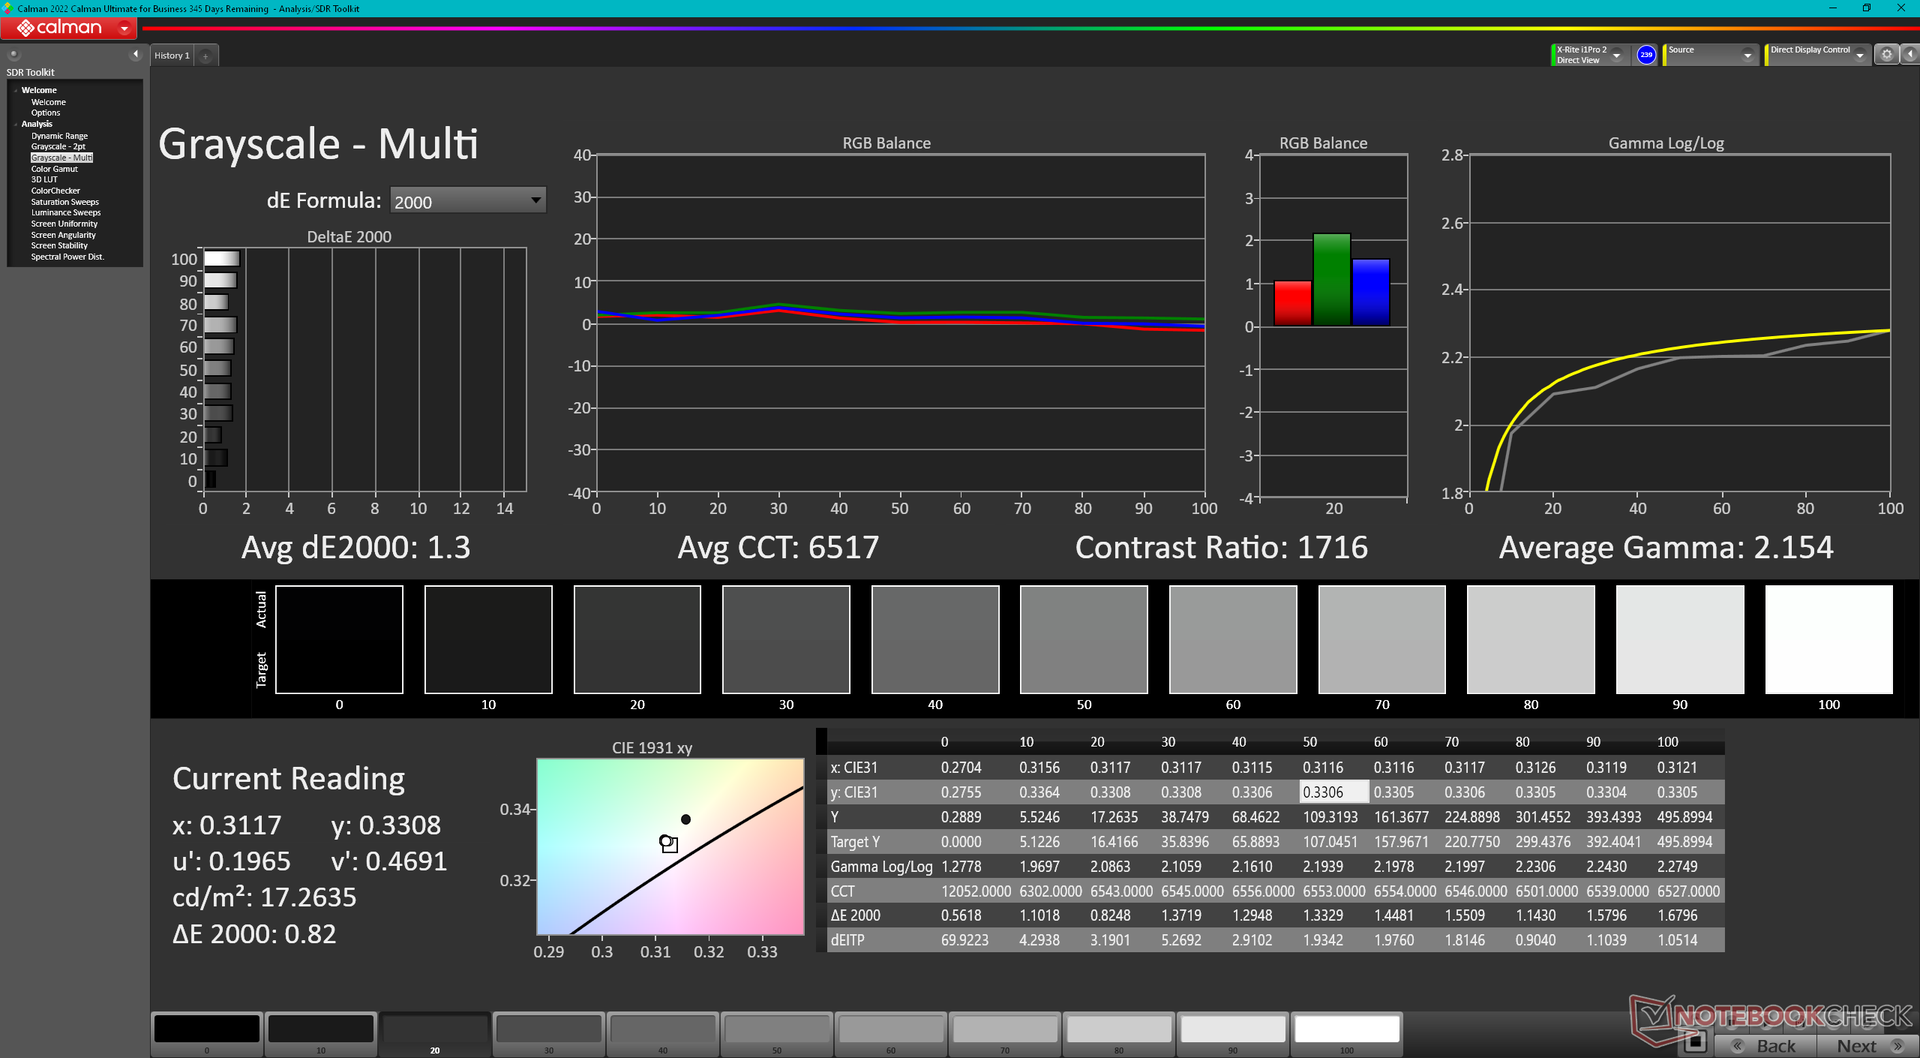
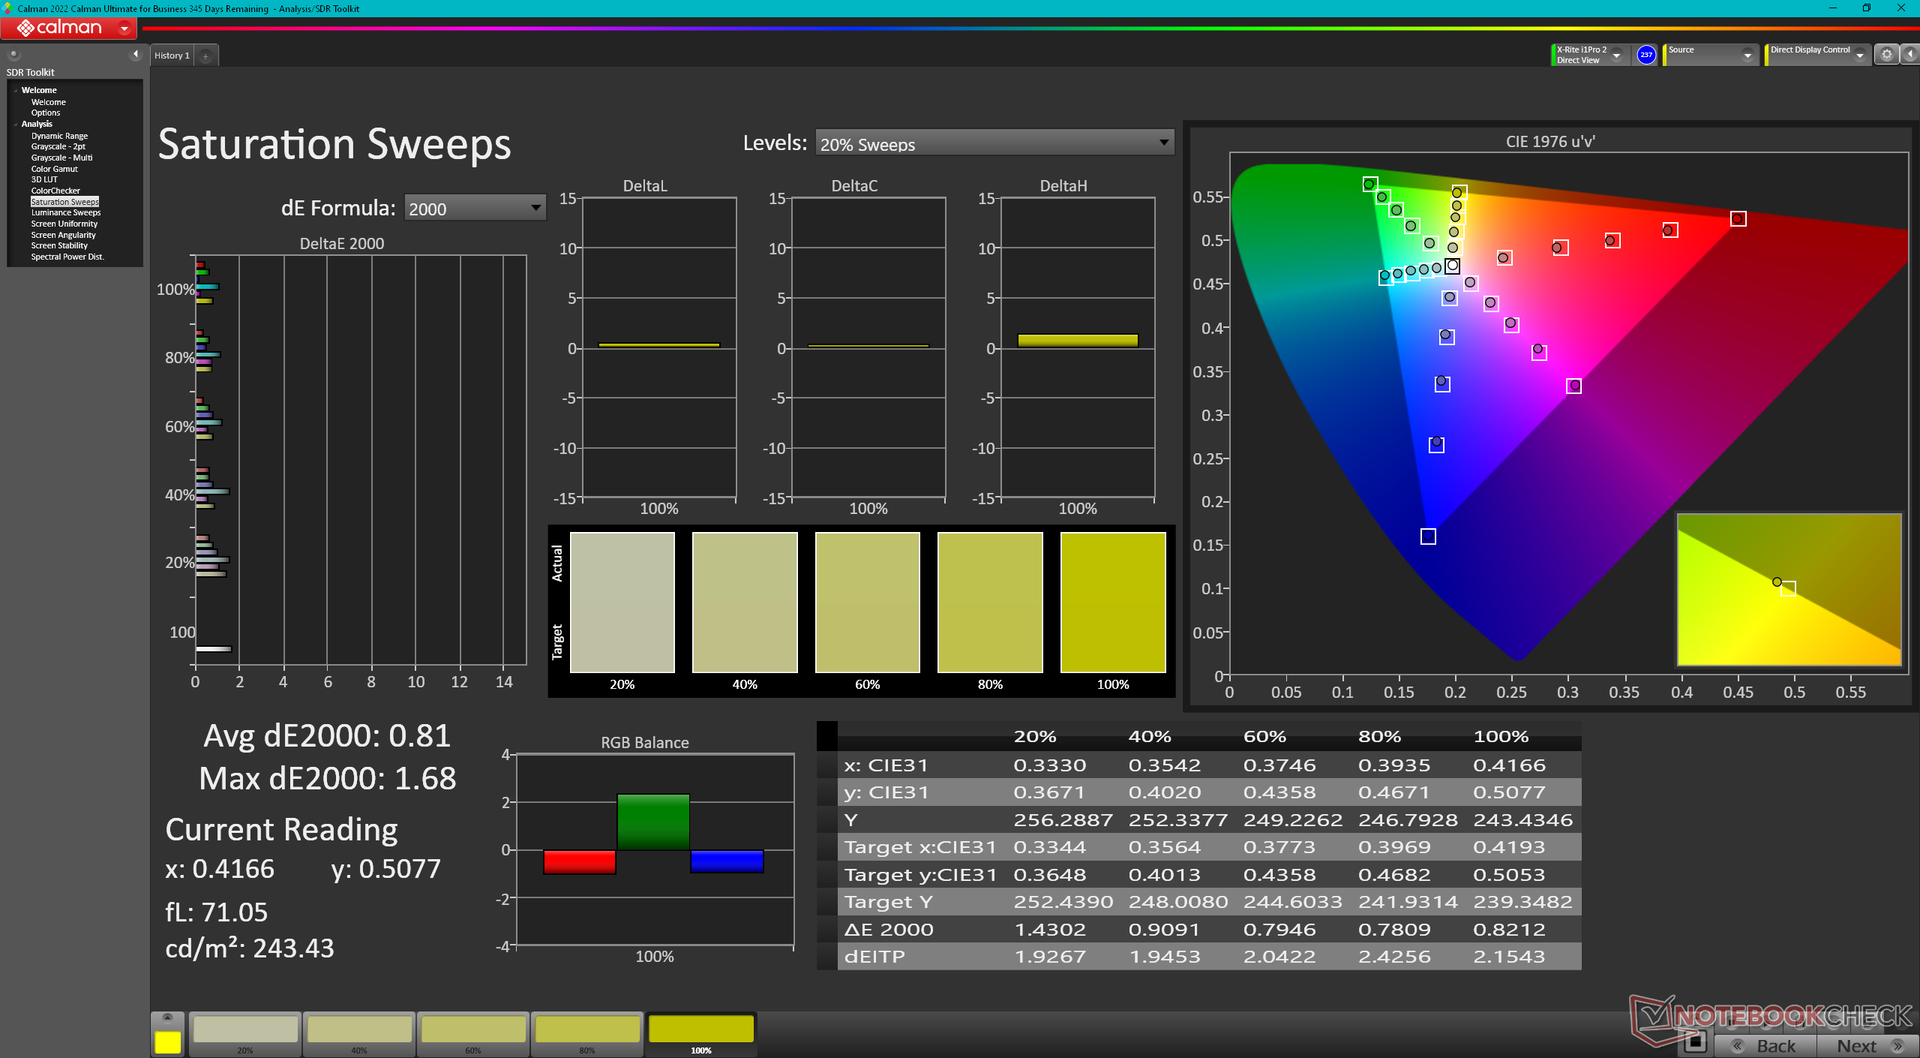
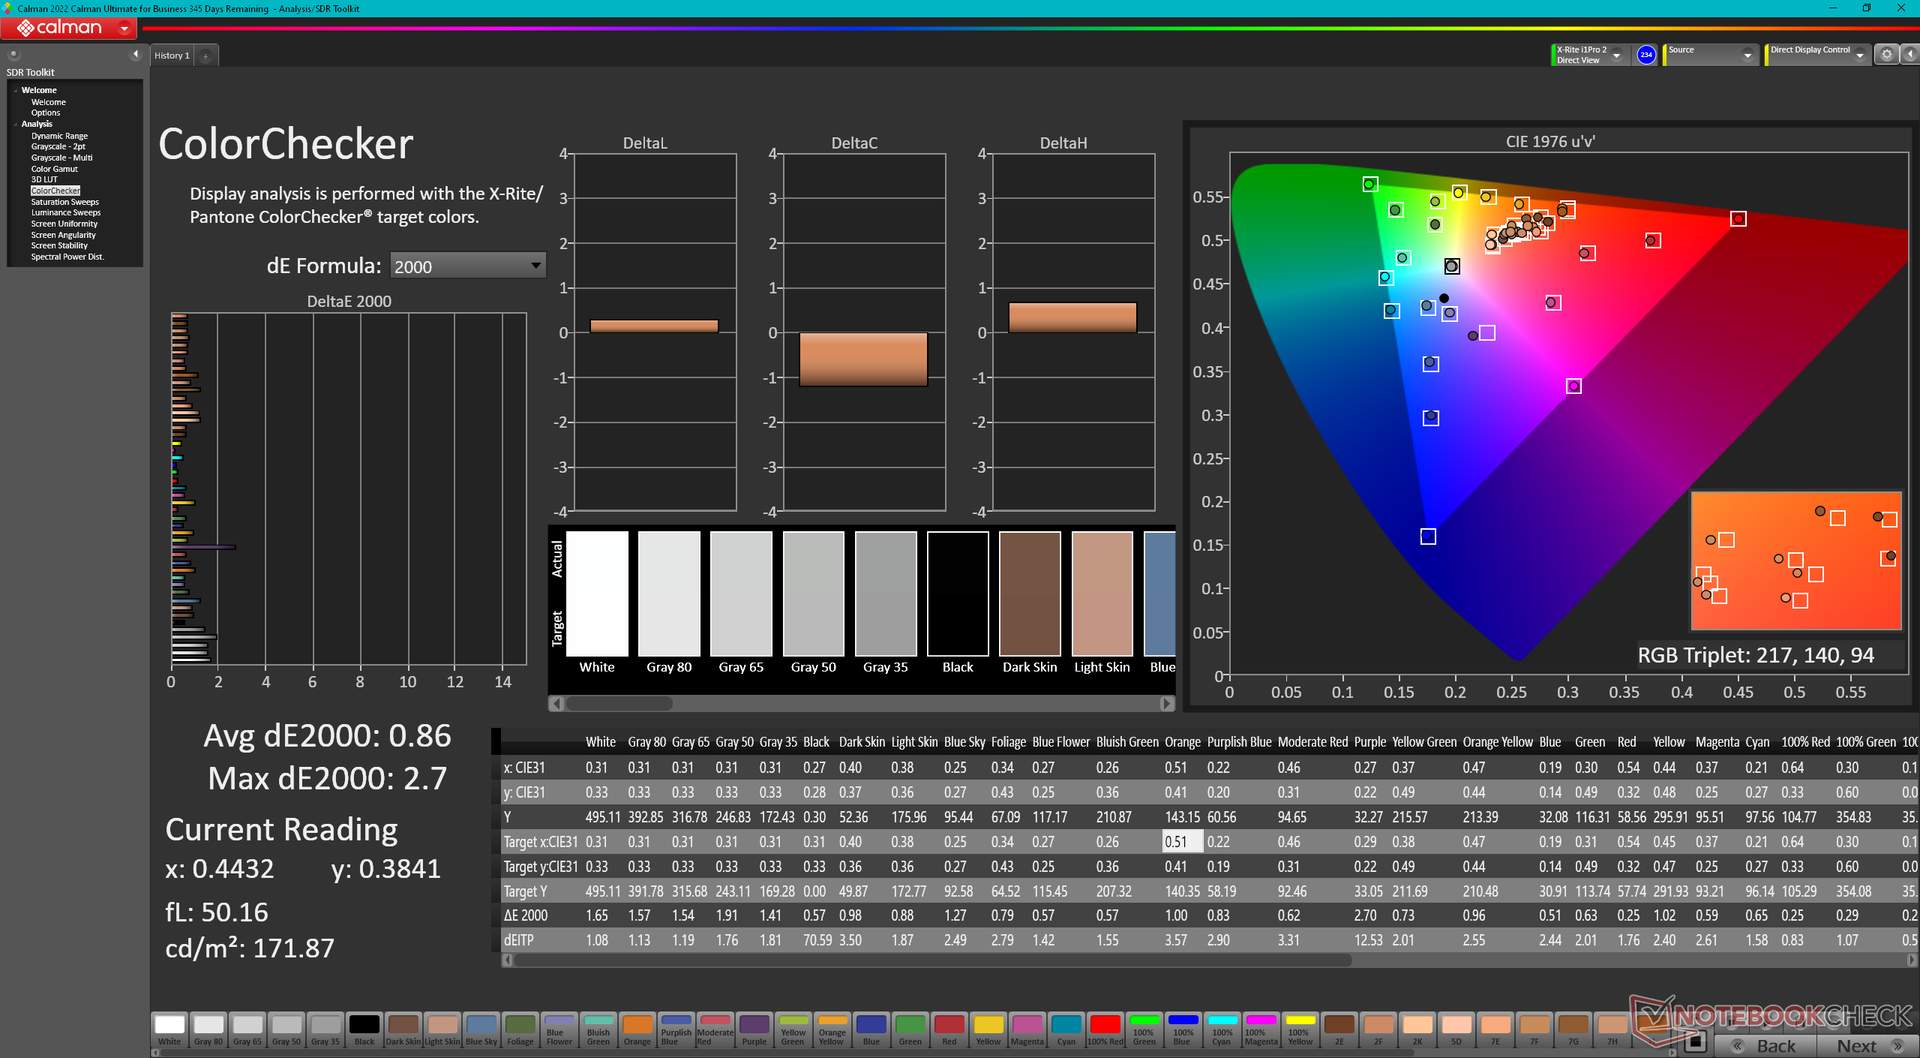
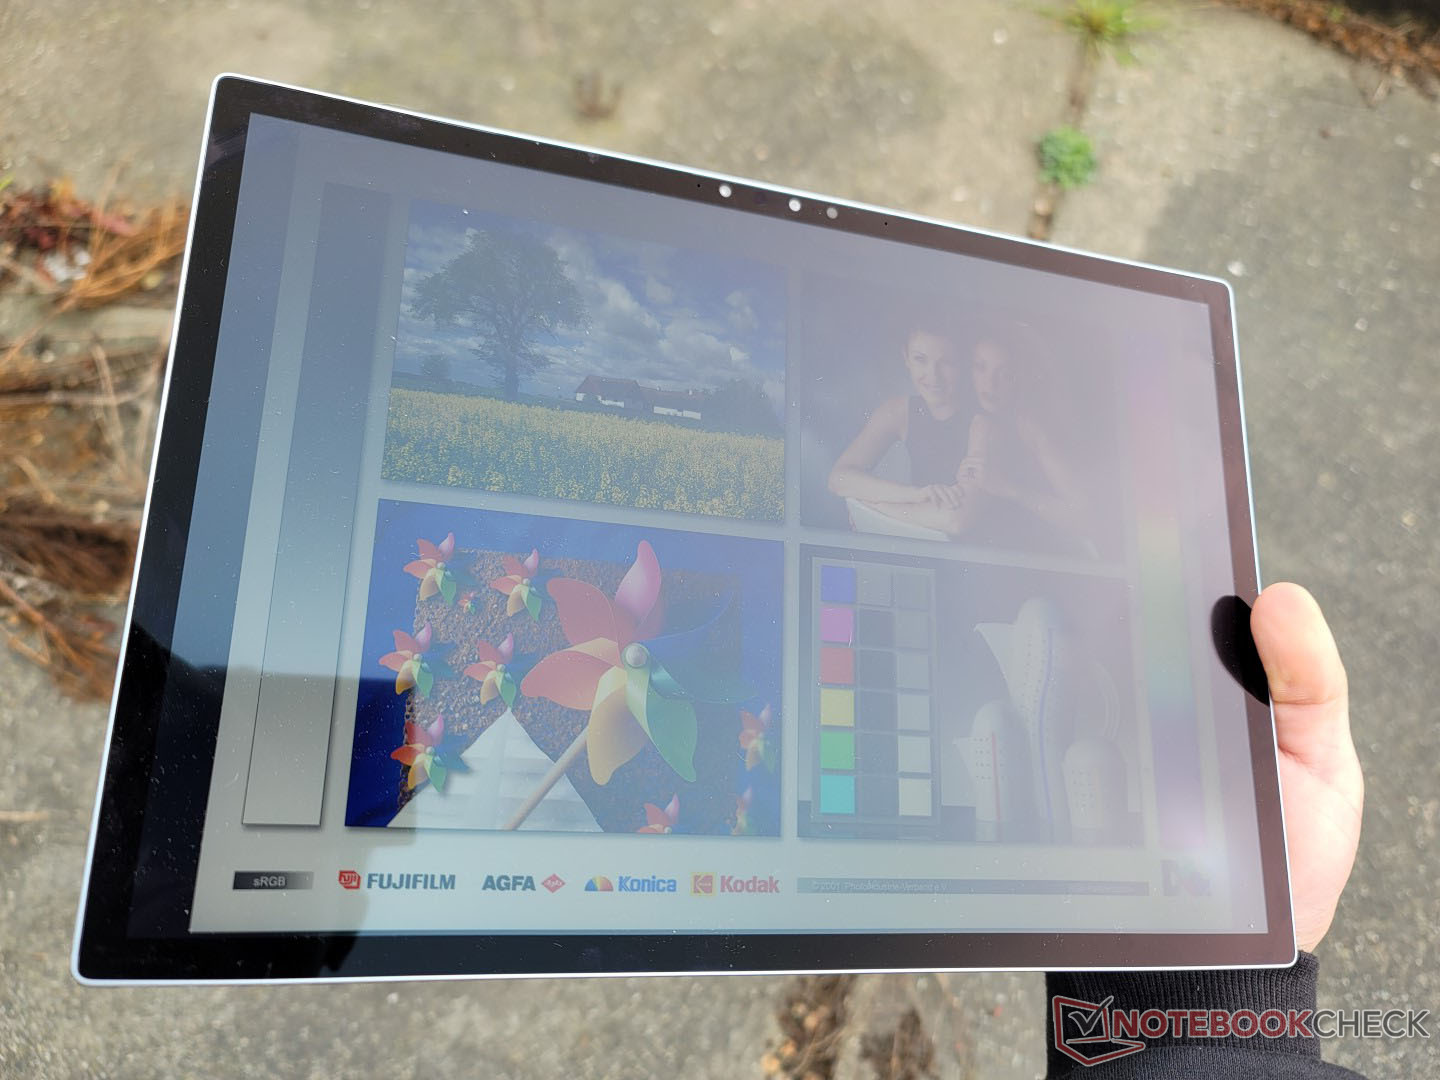
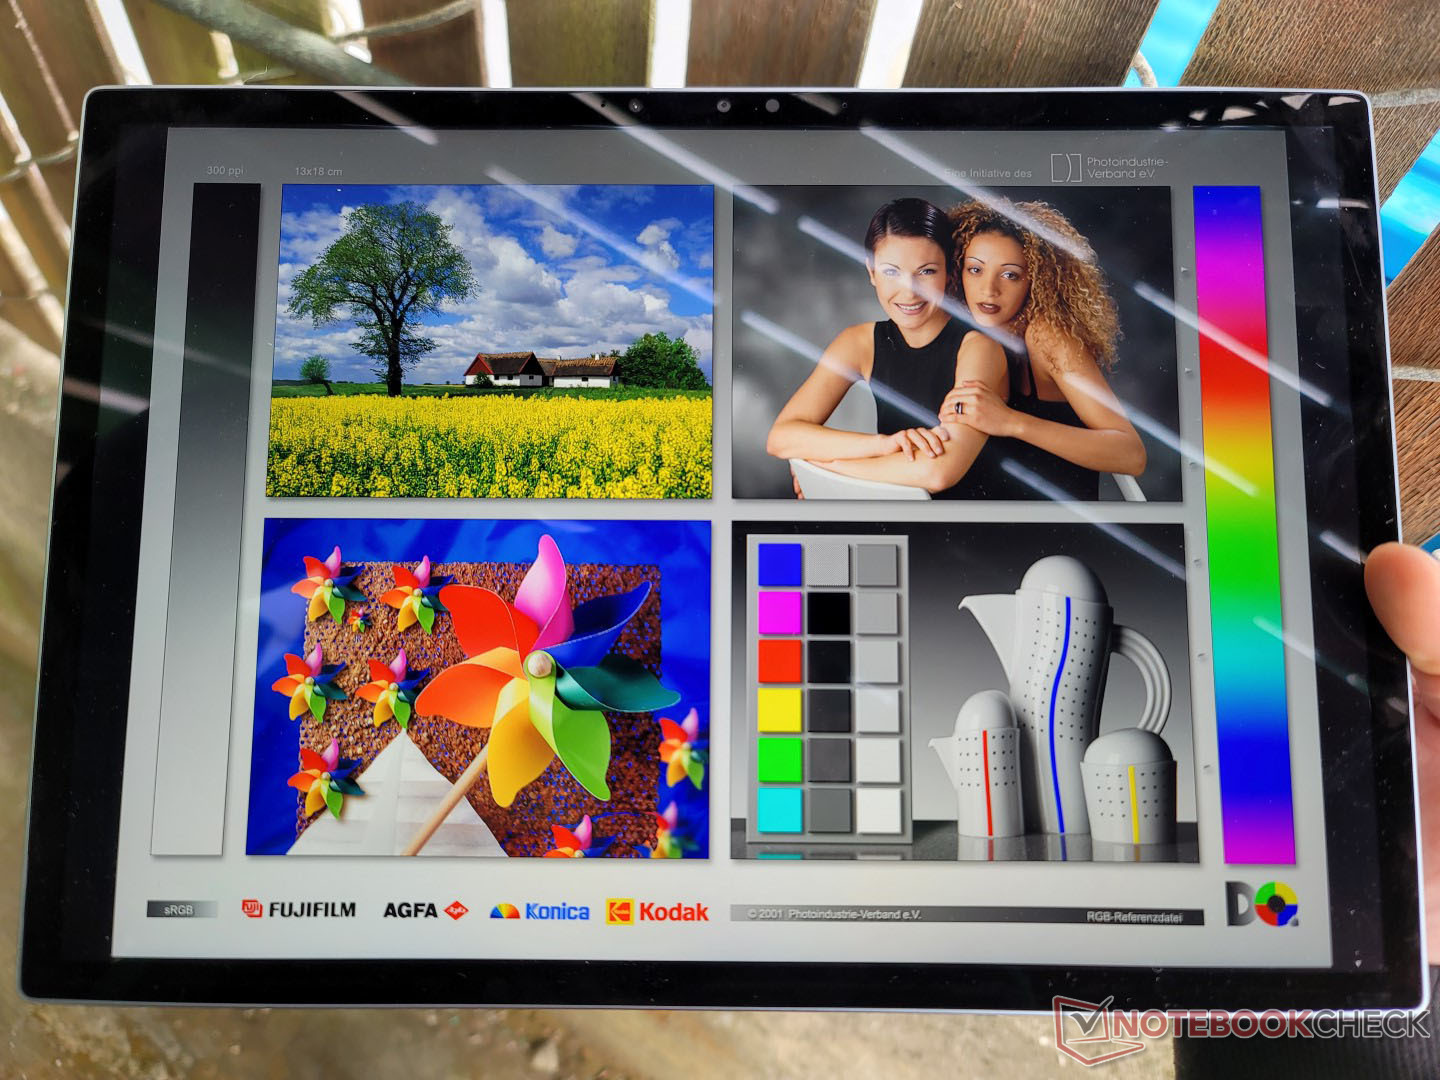
Dell annonserar en 500-nit-skärm med full sRGB-täckning, vilket vi kan bekräfta med våra egna oberoende mätningar. Kontrastförhållandet är också mycket bra för en IPS-panel på cirka 1500:1 och det finns ingen PWM på lägre ljusstyrkor till skillnad från Microsofts motsvarighet. Den visuella upplevelsen är lämplig för en Windows-surfplatta av hög kvalitet åtminstone vid första anblicken.
Det finns två anmärkningsvärda nackdelar som är värda att nämna. För det första är svarstiderna för svartvitt och grått relativt långsamma för märkbar ghosting när du flyttar markören eller bläddrar på webbsidor. För det andra kunde ljusstyrkan ha varit bättre eftersom skärmens övre vänstra del är cirka 50 nits ljusare än den nedre högra delen. Det är inget stort, men ett OLED-alternativ hade lätt kunnat åtgärda båda dessa nackdelar.
Vi skulle vilja se paneler med högre uppdateringsfrekvens och kanske fulla P3-färger på framtida SKU:er. Surface Pro 8 har till exempel alternativ med 120 Hz uppdateringsfrekvens för att öka användargränssnittets reaktionsförmåga. Under tiden måste användarna överväga bärbara datorer med klämskal som Dell XPS 13 Plus 9320 eller Asus VivoBook för att hitta OLED-funktioner för tillfället.
| |||||||||||||||||||||||||
Distribution av ljusstyrkan: 87 %
Mitt på batteriet: 507 cd/m²
Kontrast: 1491:1 (Svärta: 0.34 cd/m²)
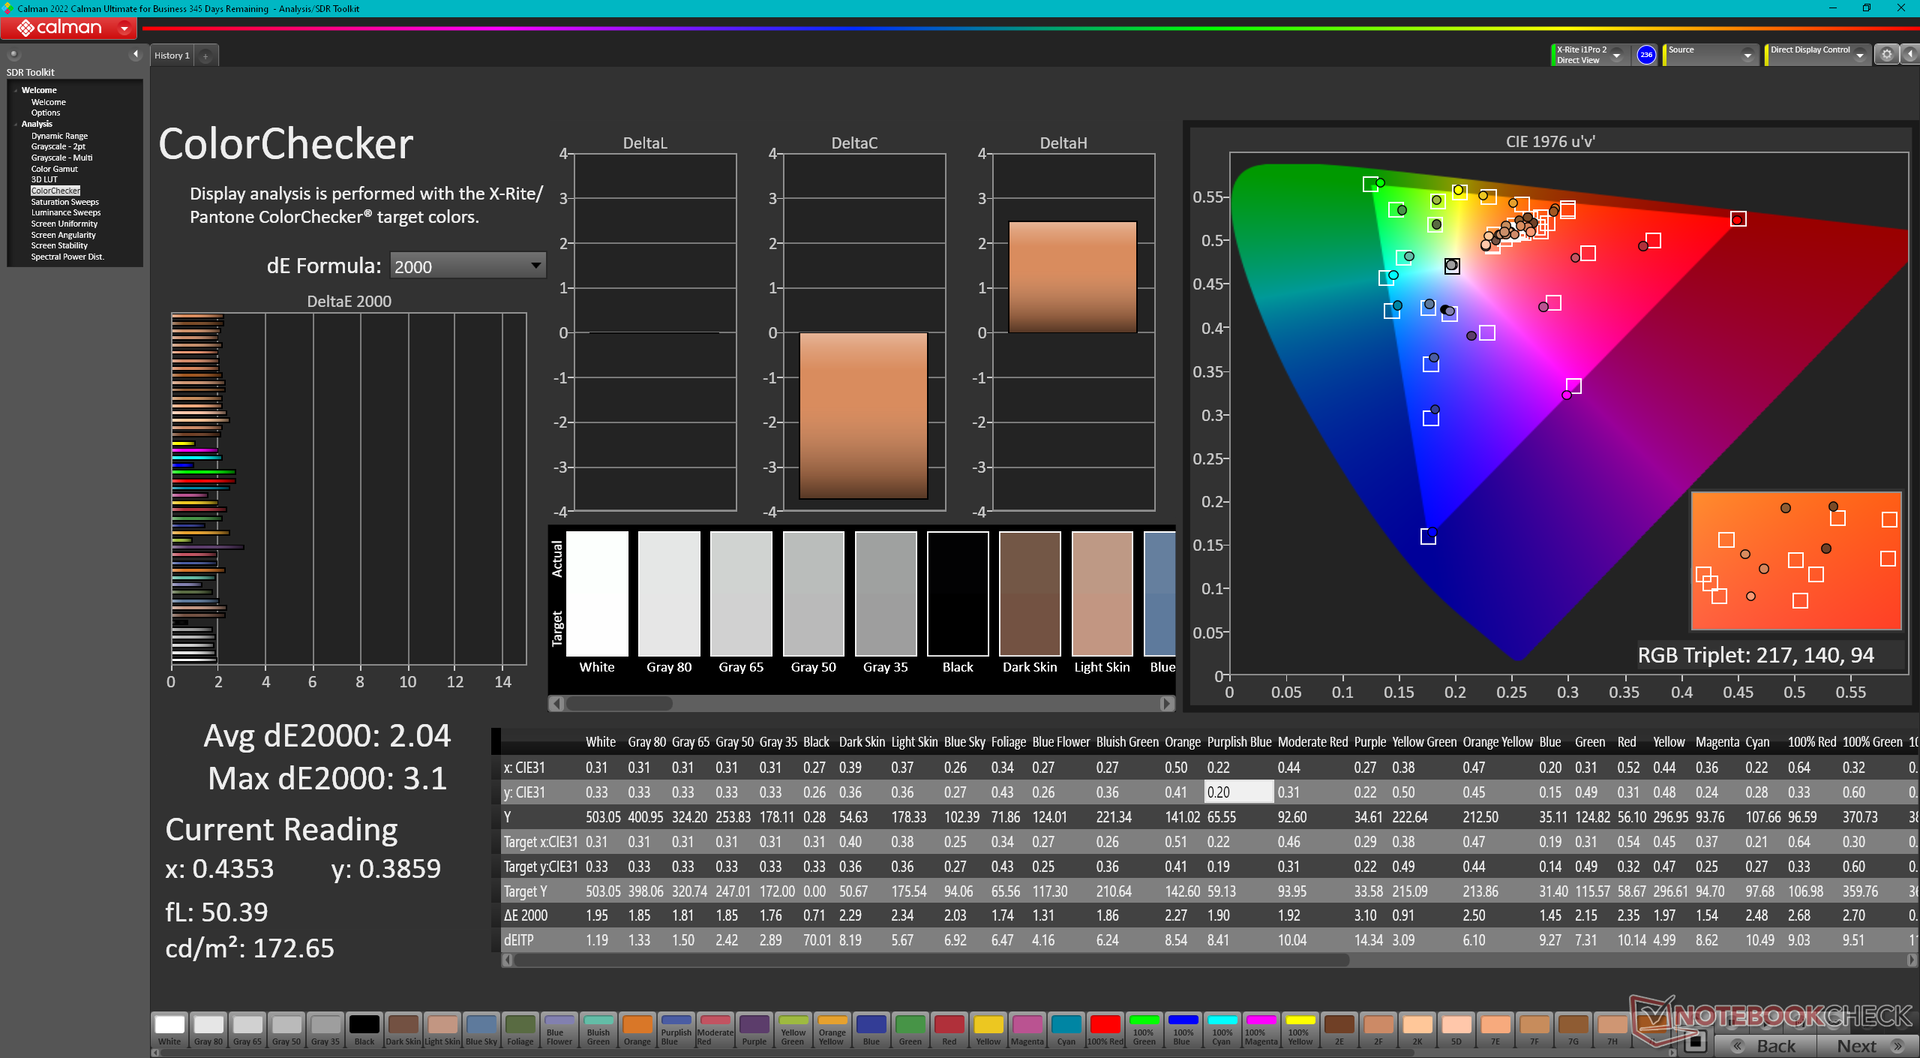
ΔE ColorChecker Calman: 2.04 | ∀{0.5-29.43 Ø4.71}
calibrated: 0.86
ΔE Greyscale Calman: 1.8 | ∀{0.09-98 Ø4.96}
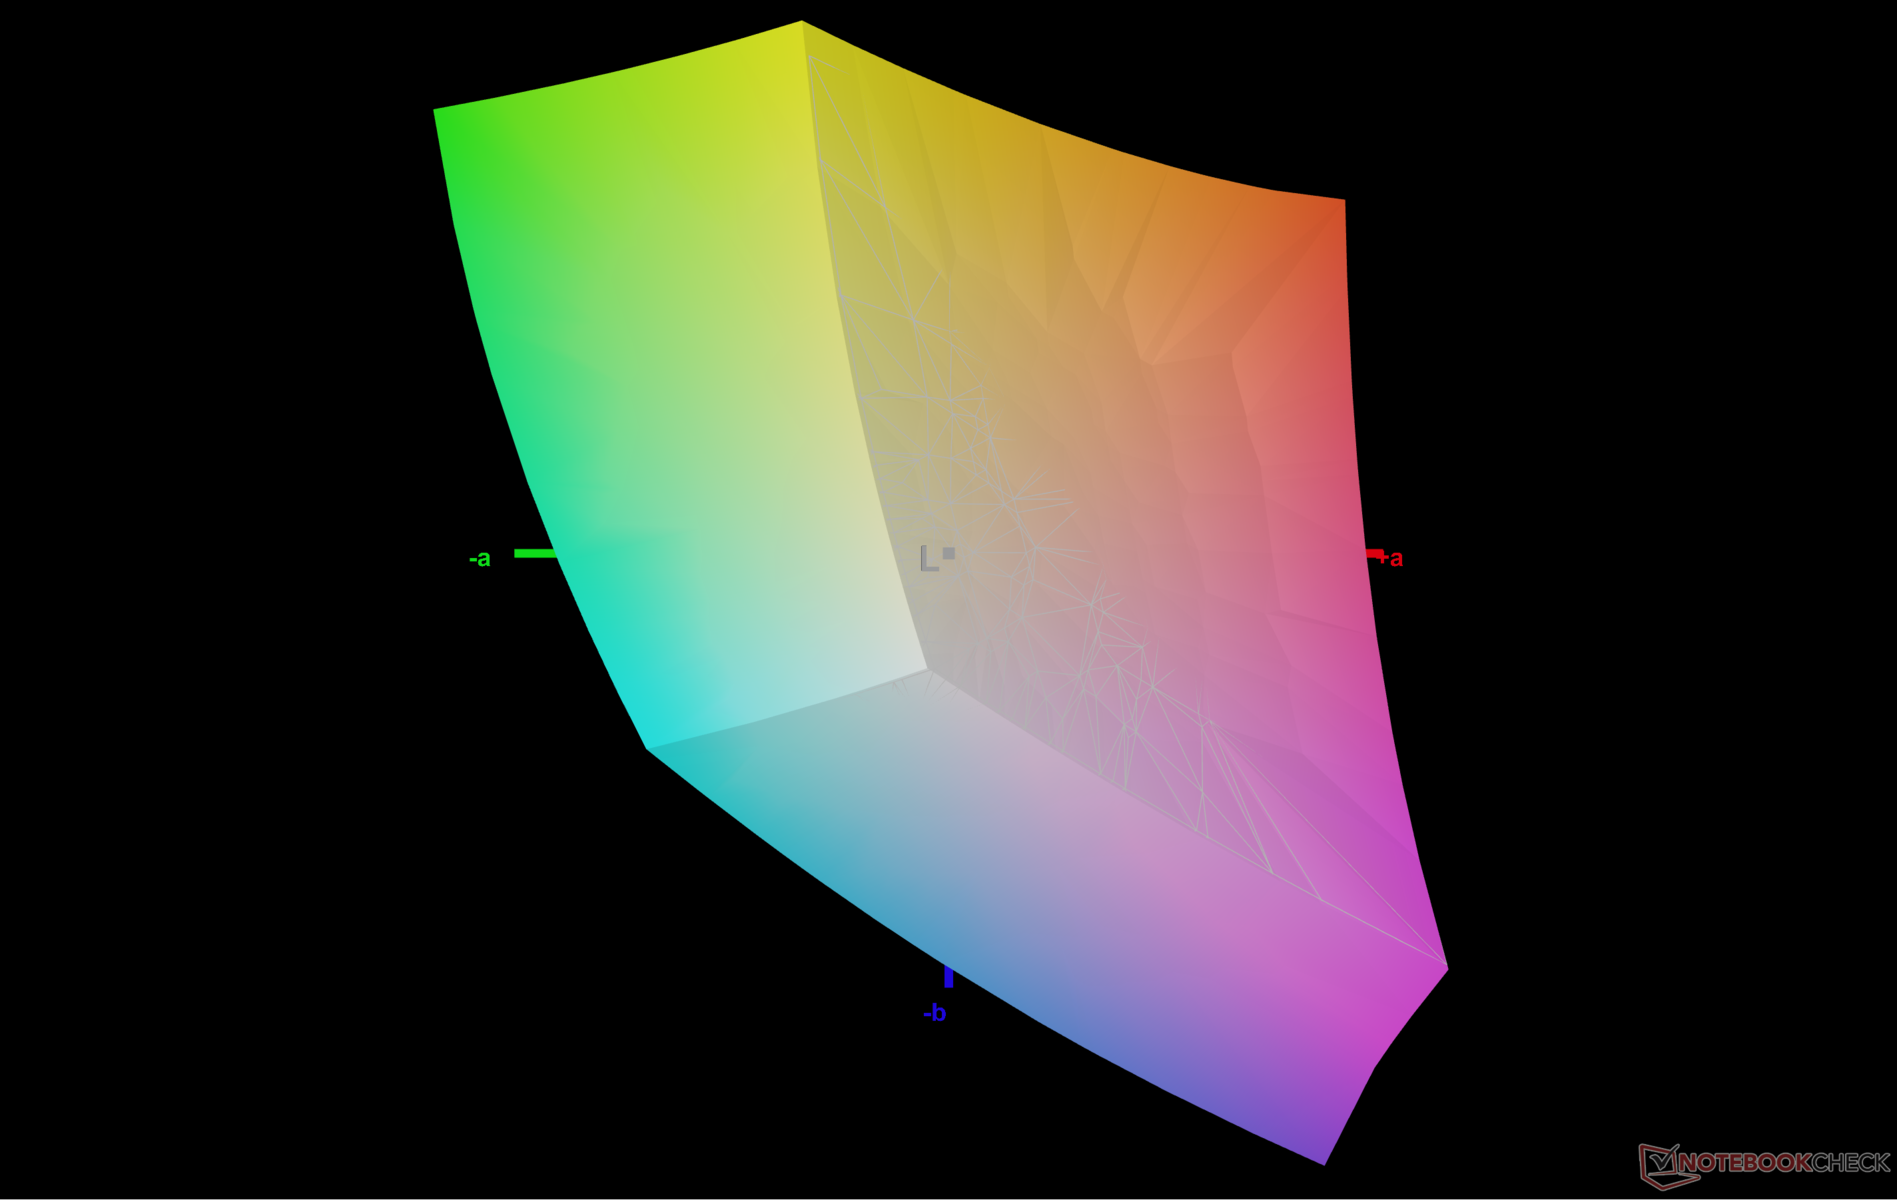
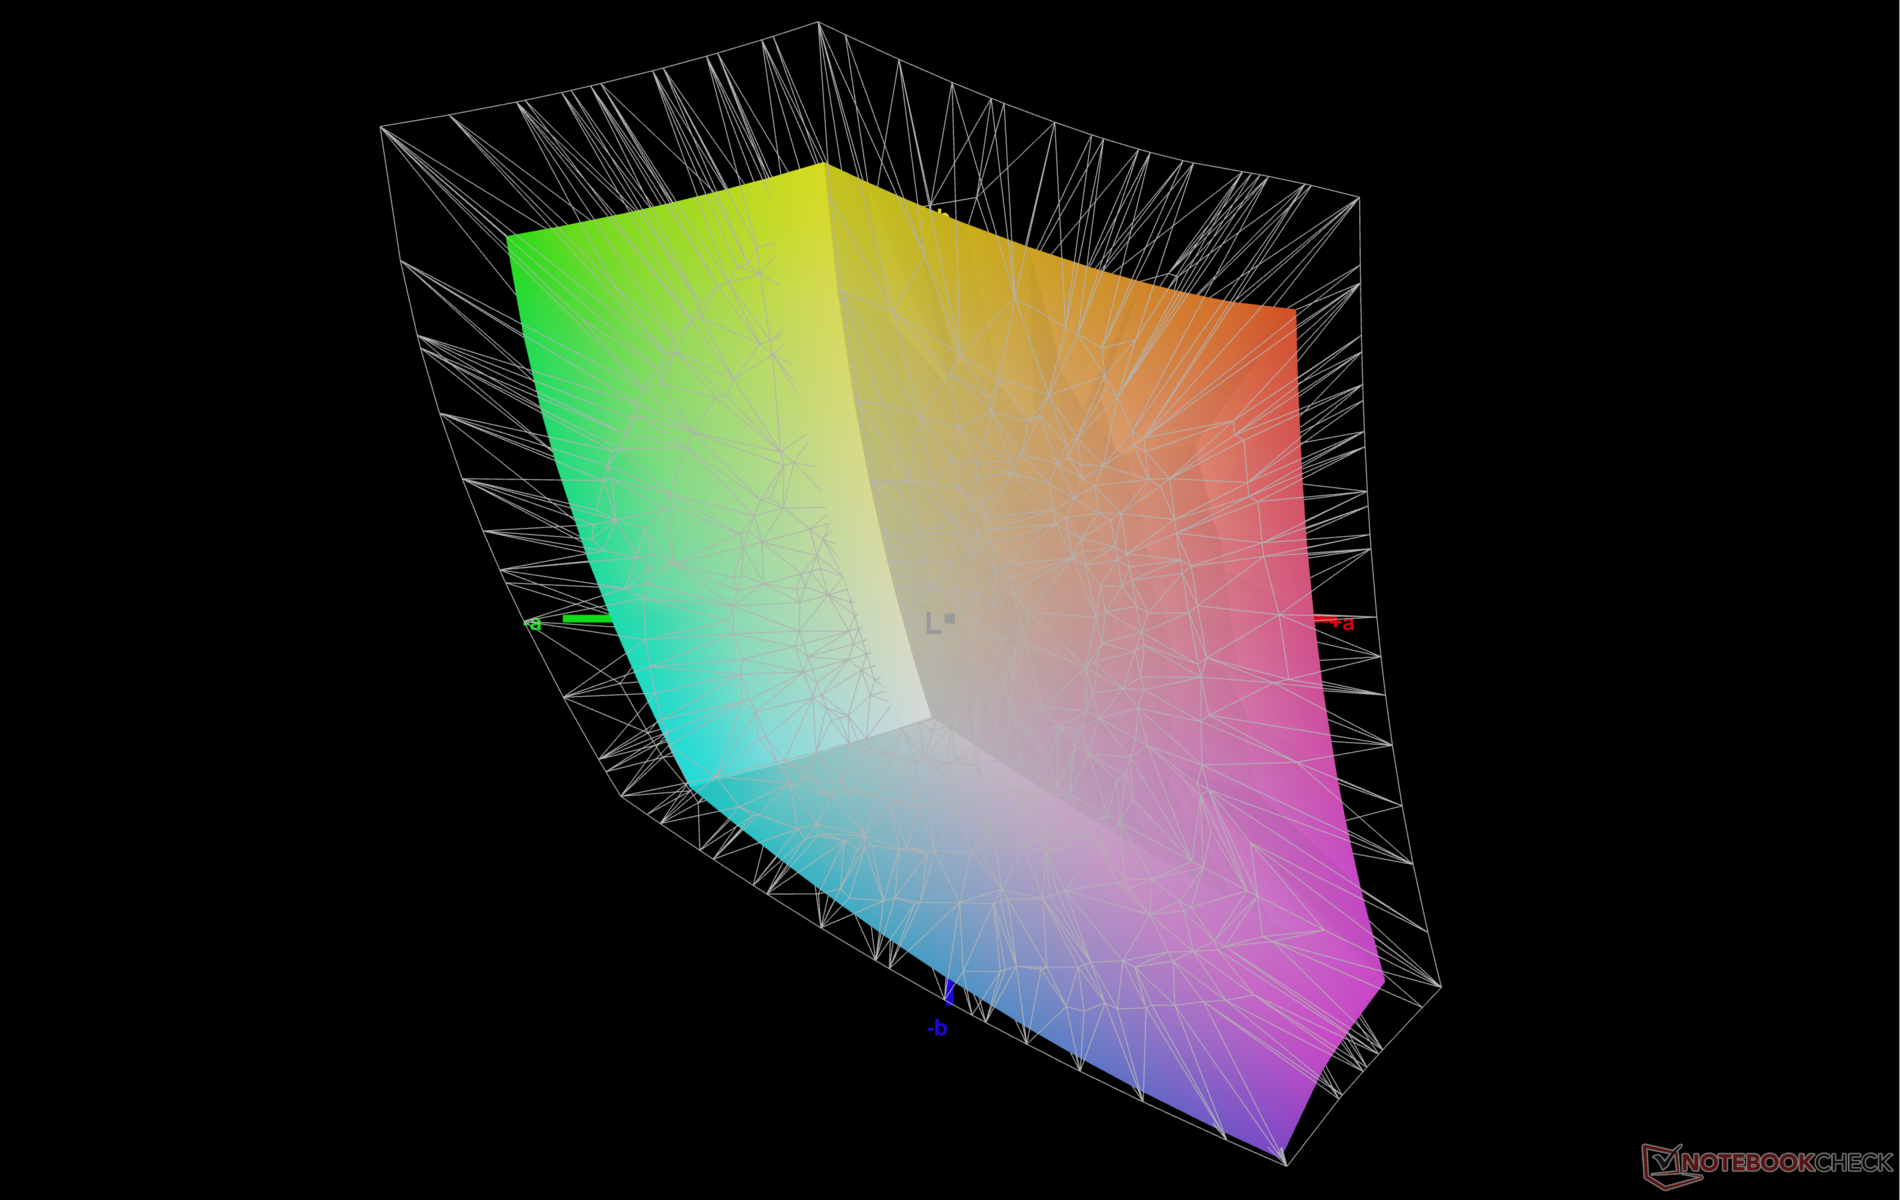
72.6% AdobeRGB 1998 (Argyll 3D)
99.8% sRGB (Argyll 3D)
70.7% Display P3 (Argyll 3D)
Gamma: 2.12
CCT: 6561 K
| Dell XPS 13 9315 2-in-1 Core i5-1230U BOE NE13A1M, IPS, 2880x1920, 13" | Dell XPS 13 Plus 9320 i7-1280P OLED Samsung 134XK04, OLED, 3456x2160, 13.4" | Microsoft Surface Pro 8, i7-1185G7 LP129WT212166, IPS, 2880x1920, 13" | HP Spectre x360 13.5 14t-ef000 SDC4160, OLED, 3000x2000, 13.5" | Lenovo ThinkBook Plus Gen2 Core i5 CSOT T3 MND307DA1-5 (LCD), IPS, E-Ink, 2560x1600, 13.3" | Apple MacBook Air M2 Entry IPS, 2560x1664, 13.6" | |
|---|---|---|---|---|---|---|
| Display | 26% | 6% | 22% | -1% | 20% | |
| Display P3 Coverage (%) | 70.7 | 99.5 41% | 78.2 11% | 99.9 41% | 70.1 -1% | 98.4 39% |
| sRGB Coverage (%) | 99.8 | 100 0% | 100 0% | 100 0% | 98 -2% | 99.9 0% |
| AdobeRGB 1998 Coverage (%) | 72.6 | 98.4 36% | 77.6 7% | 90.8 25% | 72.2 -1% | 87.6 21% |
| Response Times | 93% | 1% | 94% | -5% | 13% | |
| Response Time Grey 50% / Grey 80% * (ms) | 44 ? | 2.6 ? 94% | 46.4 ? -5% | 1.9 ? 96% | 42.8 ? 3% | 32.9 ? 25% |
| Response Time Black / White * (ms) | 24.8 ? | 2.1 ? 92% | 23.2 ? 6% | 2.16 ? 91% | 28 ? -13% | 24.9 ? -0% |
| PWM Frequency (Hz) | 59.5 | 29760 ? | 60.2 ? | |||
| Screen | -27% | -19% | -29% | -36% | 5% | |
| Brightness middle (cd/m²) | 507 | 371.8 -27% | 444 -12% | 351.7 -31% | 404 -20% | 526 4% |
| Brightness (cd/m²) | 486 | 374 -23% | 451 -7% | 351 -28% | 388 -20% | 486 0% |
| Brightness Distribution (%) | 87 | 98 13% | 91 5% | 87 0% | 94 8% | 87 0% |
| Black Level * (cd/m²) | 0.34 | 0.43 -26% | 0.24 29% | 0.38 -12% | ||
| Contrast (:1) | 1491 | 1033 -31% | 1683 13% | 1384 -7% | ||
| Colorchecker dE 2000 * | 2.04 | 2.37 -16% | 2 2% | 1.78 13% | 3.1 -52% | 1.3 36% |
| Colorchecker dE 2000 max. * | 3.1 | 6.1 -97% | 3.2 -3% | 6.14 -98% | 6.9 -123% | 2.7 13% |
| Colorchecker dE 2000 calibrated * | 0.86 | 1.7 -98% | 1.3 -51% | 0.7 19% | ||
| Greyscale dE 2000 * | 1.8 | 2 -11% | 1.8 -0% | 2.3 -28% | 3.7 -106% | 2 -11% |
| Gamma | 2.12 104% | 2.29 96% | 2.11 104% | 2.11 104% | 2.26 97% | 2.25 98% |
| CCT | 6561 99% | 6261 104% | 6417 101% | 6683 97% | 5936 110% | 6858 95% |
| Totalt genomsnitt (program/inställningar) | 31% /
9% | -4% /
-11% | 29% /
7% | -14% /
-24% | 13% /
9% |
* ... mindre är bättre
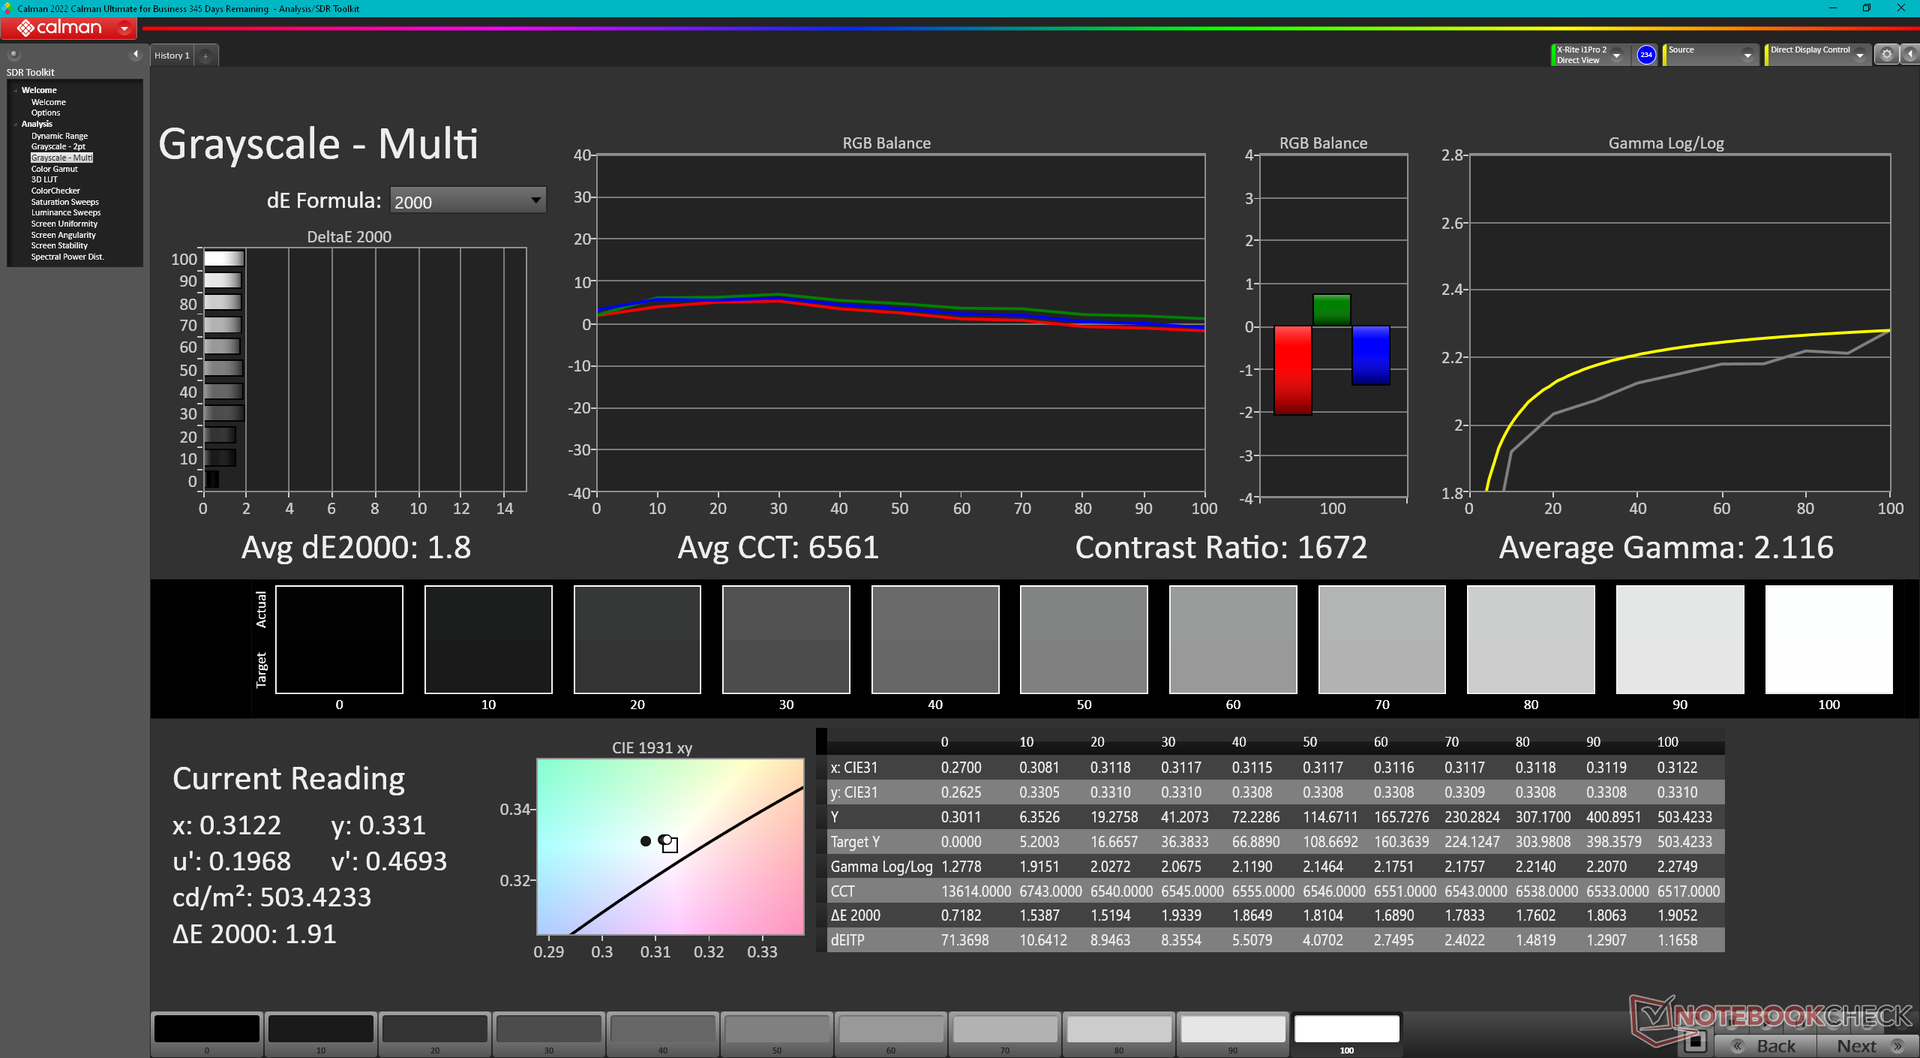
Skärmen är redan från början välkalibrerad med genomsnittliga DeltaE-värden för gråskala och färg på endast 1,8 respektive 2,04. Om vi själva kalibrerar skärmen ännu mer med en X-Rite-kolorimeter kan vi förbättra medelvärdena till endast 1,3 och 0,86, men kalibrering för slutanvändare kommer inte att vara nödvändig för de flesta.
Visa svarstider
| ↔ Svarstid svart till vitt | ||
|---|---|---|
| 24.8 ms ... stiga ↗ och falla ↘ kombinerat | ↗ 11.6 ms stiga | 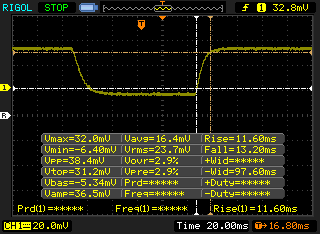 |
| ↘ 13.2 ms hösten | ||
| Skärmen visar bra svarsfrekvens i våra tester, men kan vara för långsam för konkurrenskraftiga spelare. I jämförelse sträcker sig alla testade enheter från 0.1 (minst) till 240 (maximalt) ms. » 58 % av alla enheter är bättre. Detta innebär att den uppmätta svarstiden är sämre än genomsnittet av alla testade enheter (19.8 ms). | ||
| ↔ Svarstid 50 % grått till 80 % grått | ||
| 44 ms ... stiga ↗ och falla ↘ kombinerat | ↗ 23.6 ms stiga | 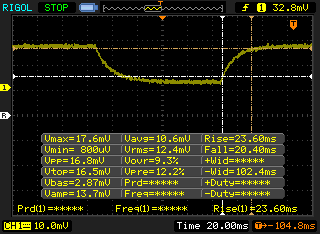 |
| ↘ 20.4 ms hösten | ||
| Skärmen visar långsamma svarsfrekvenser i våra tester och kommer att vara otillfredsställande för spelare. I jämförelse sträcker sig alla testade enheter från 0.165 (minst) till 636 (maximalt) ms. » 73 % av alla enheter är bättre. Detta innebär att den uppmätta svarstiden är sämre än genomsnittet av alla testade enheter (31 ms). | ||
Skärmflimmer / PWM (Puls-Width Modulation)
| Skärmflimmer / PWM upptäcktes inte | 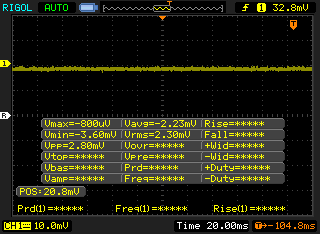 | ||
Som jämförelse: 52 % av alla testade enheter använder inte PWM för att dämpa skärmen. Om PWM upptäcktes mättes ett medelvärde av 7757 (minst: 5 - maximum: 343500) Hz. | |||
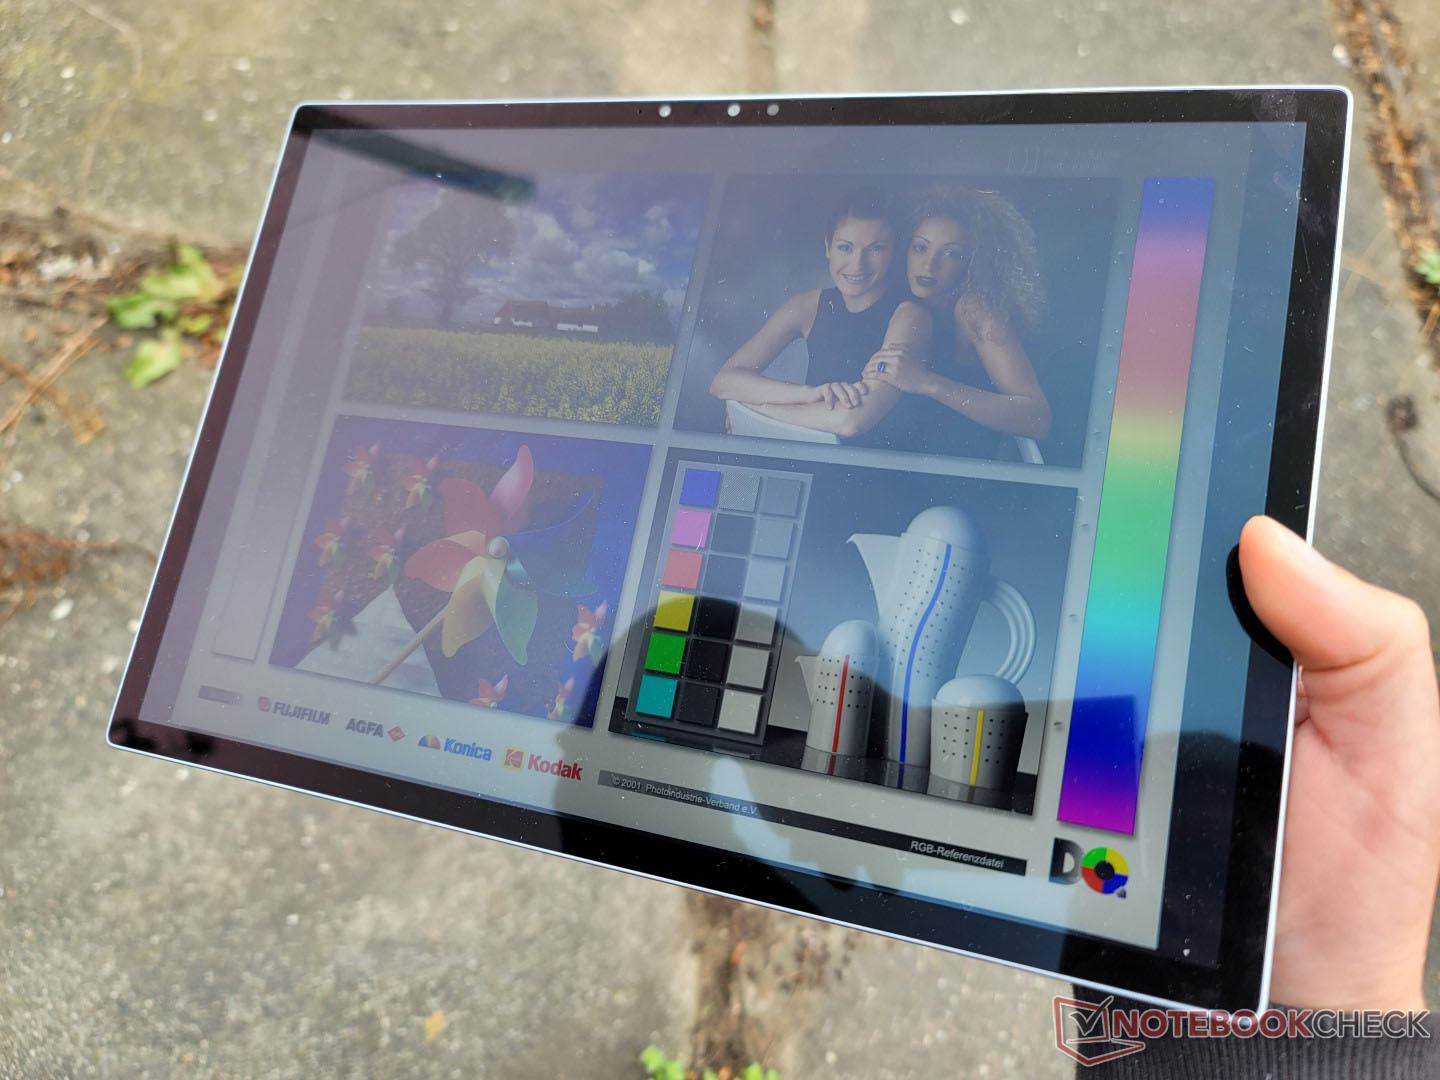
Bländning är ständigt närvarande och i princip oundviklig på den glansiga pekskärmen. Skärmen är lyckligtvis tillräckligt ljus för att hålla bländningen på ett minimum när du arbetar utomhus i skugga. Om det är under ljusare förhållanden försämras dock färgerna och visningsupplevelsen snabbt. Vissa HP Elite x2-modeller har displayalternativ med 1000 nit vilket skulle göra den 2x ljusare än Dell för att underlätta läsbarheten utomhus.
Prestanda - Bra CPU-prestanda, bra GPU-prestanda
Provningsförhållanden
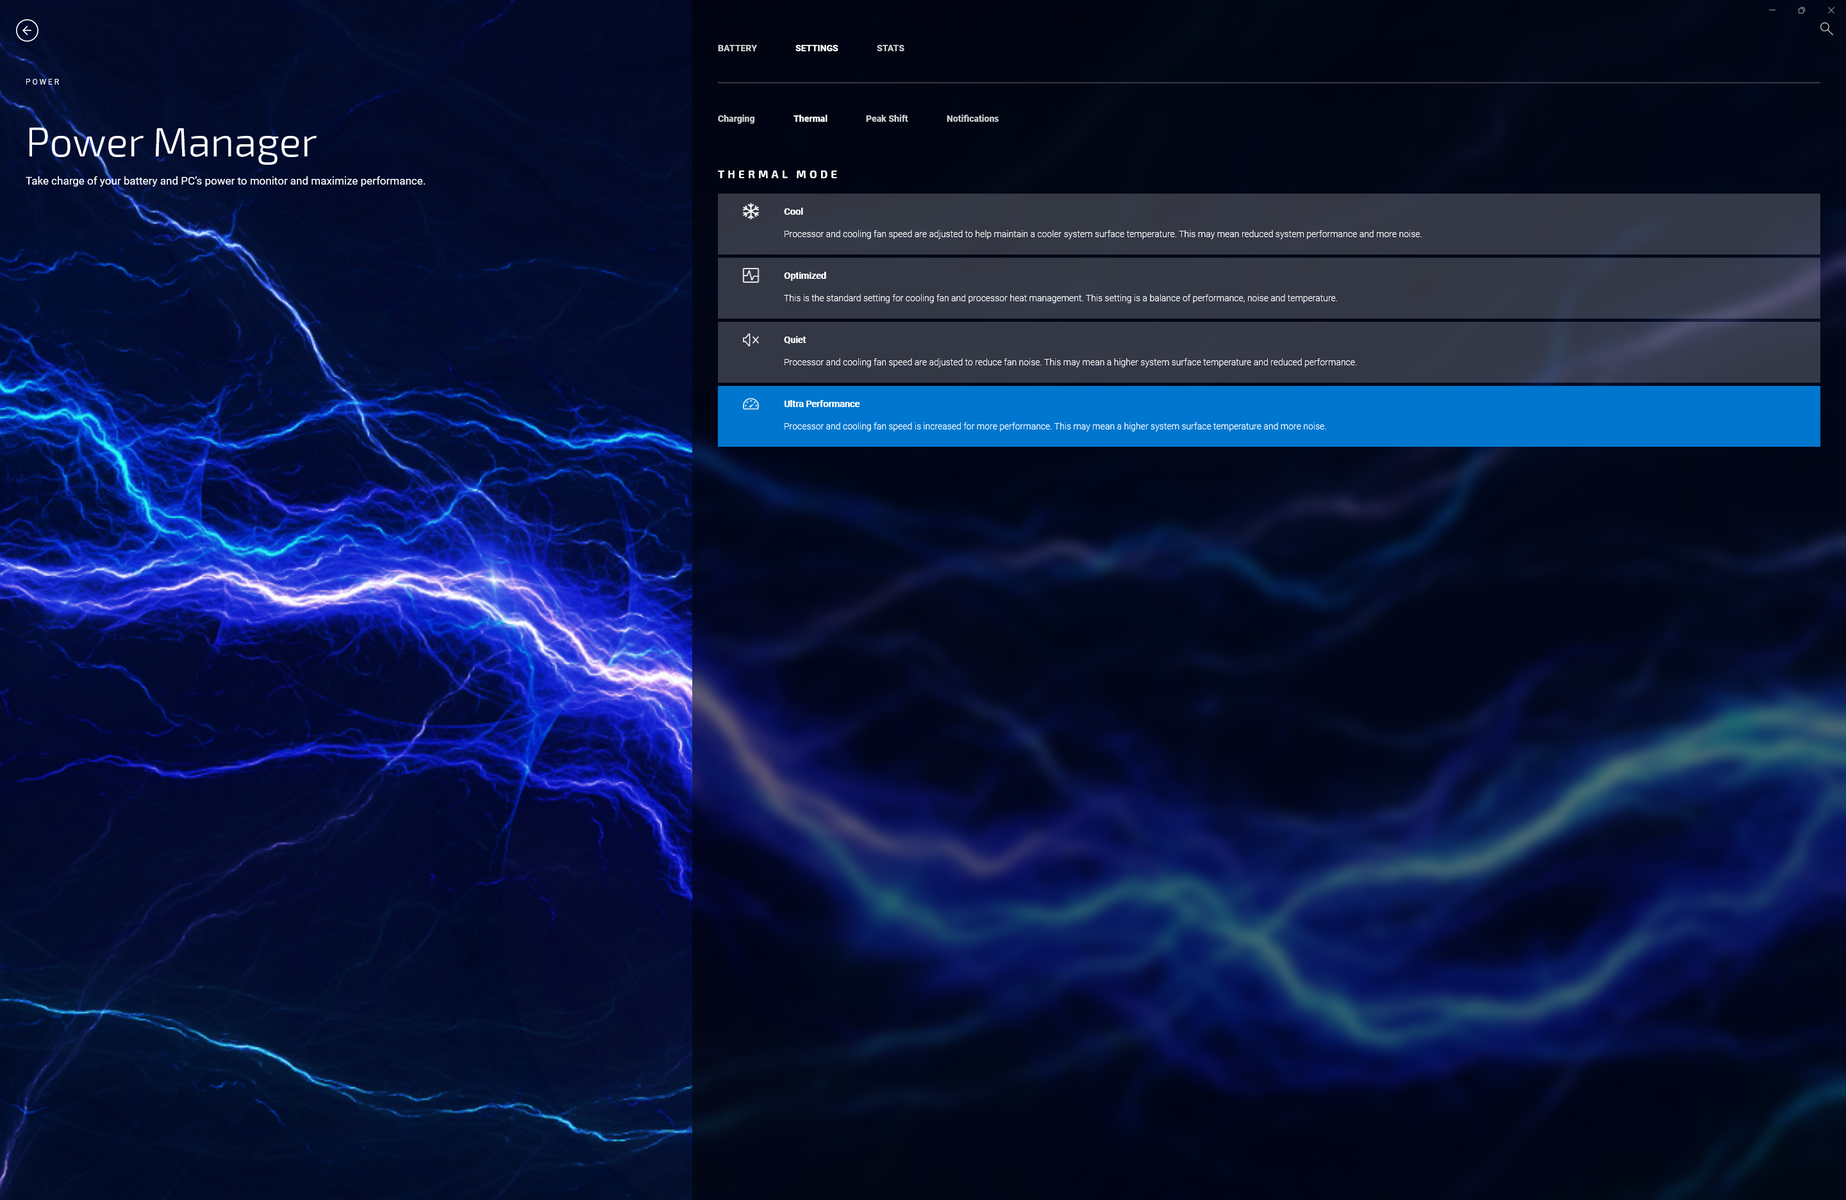
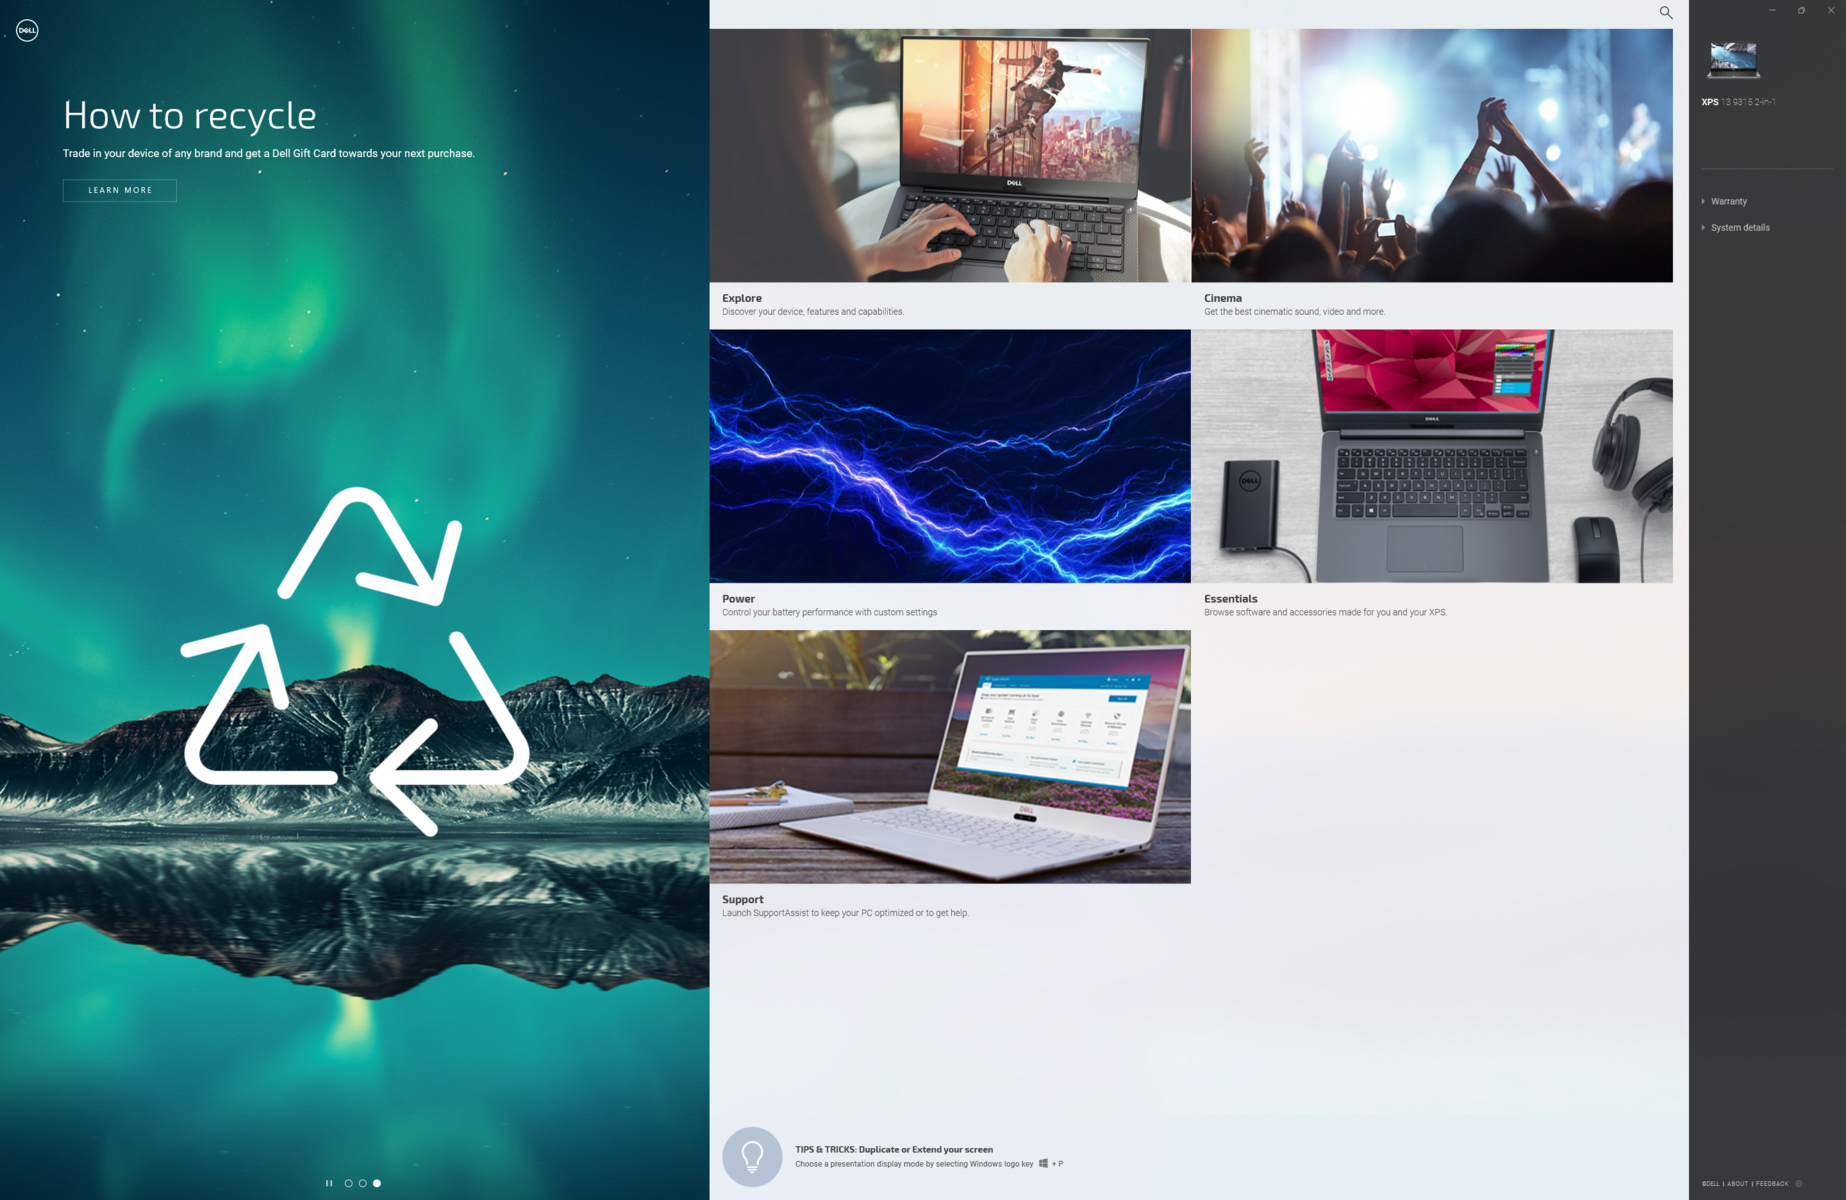
Vi ställde in vår enhet till läget "Ultra performance mode" och "Best performance" via Dell Power Manager respektive Windows innan vi körde några benchmarks nedan. Ägare bör bekanta sig med programvaran My Dell eftersom den är kontrollcentralen för att justera laddningsbeteende, systemprestanda, meddelanden och mycket mer, vilket framgår av skärmdumparna nedan.
Processor
XPS 13 9315 2-in-1 har samma Core i5-1230U CPU som finns i XPS 13 9315 clamshell. Man skulle kunna förvänta sig att clamshell-modellen skulle prestera lite snabbare än 2-i-1-modellen, men det är tvärtom. Våra resultat nedan visar att XPS 13 9315 2-in-1 konsekvent ligger före XPS 13 9315 clamshell med betydande marginaler på cirka 70 procent i arbetsbelastningar med flera trådar. Resultaten är tillräckligt breda för att dra ifrån till och med den Core i7-1185G7 i Surface Pro 8.
Uppgradering till Core i7-1250U SKU förväntas endast öka prestandan med cirka 5 procent baserat på vår erfarenhet av den senaste HP Envy x360 13. Om du vill ha mycket snabbare prestanda bör du överväga XPS 13 Plus 9320 och dess CPU-alternativ i P-serien istället.
Prestandahållbarheten är begränsad på XPS 13 9315 2-i-1 eftersom den har en fläktlös konstruktion. När du kör CineBench R15 xT i en slinga, till exempel, skulle den ursprungliga poängen på 1252 poäng stadigt sjunka till 750 poäng med tiden för att representera en prestandaförlust på 40 procent. Trots detta är prestandan fortfarande snabbare än samma CPU i XPS 13 9315 clamshell med cirka 50 procent, även efter att ha tagit hänsyn till strypning på båda maskinerna.
Cinebench R15 Multi Loop
Cinebench R23: Multi Core | Single Core
Cinebench R15: CPU Multi 64Bit | CPU Single 64Bit
Blender: v2.79 BMW27 CPU
7-Zip 18.03: 7z b 4 | 7z b 4 -mmt1
Geekbench 5.5: Multi-Core | Single-Core
HWBOT x265 Benchmark v2.2: 4k Preset
LibreOffice : 20 Documents To PDF
R Benchmark 2.5: Overall mean
| Cinebench R20 / CPU (Multi Core) | |
| Dell XPS 13 Plus 9320 i7-1280P OLED | |
| HP Spectre x360 13.5 14t-ef000 | |
| Dell XPS 13 9315 2-in-1 Core i5-1230U | |
| Apple MacBook Air M2 Entry | |
| Microsoft Surface Pro 8, i7-1185G7 | |
| Dell XPS 13 9315, i5-1230U | |
| Lenovo ThinkBook Plus Gen2 Core i5 | |
| Cinebench R20 / CPU (Single Core) | |
| HP Spectre x360 13.5 14t-ef000 | |
| Dell XPS 13 Plus 9320 i7-1280P OLED | |
| Dell XPS 13 9315 2-in-1 Core i5-1230U | |
| Microsoft Surface Pro 8, i7-1185G7 | |
| Lenovo ThinkBook Plus Gen2 Core i5 | |
| Dell XPS 13 9315, i5-1230U | |
| Apple MacBook Air M2 Entry | |
| Cinebench R23 / Multi Core | |
| Dell XPS 13 Plus 9320 i7-1280P OLED | |
| Apple MacBook Air M2 Entry | |
| HP Spectre x360 13.5 14t-ef000 | |
| Dell XPS 13 9315 2-in-1 Core i5-1230U | |
| Microsoft Surface Pro 8, i7-1185G7 | |
| Dell XPS 13 9315, i5-1230U | |
| Lenovo ThinkBook Plus Gen2 Core i5 | |
| Cinebench R23 / Single Core | |
| HP Spectre x360 13.5 14t-ef000 | |
| Dell XPS 13 Plus 9320 i7-1280P OLED | |
| Apple MacBook Air M2 Entry | |
| Microsoft Surface Pro 8, i7-1185G7 | |
| Dell XPS 13 9315 2-in-1 Core i5-1230U | |
| Dell XPS 13 9315, i5-1230U | |
| Lenovo ThinkBook Plus Gen2 Core i5 | |
| Cinebench R15 / CPU Multi 64Bit | |
| Dell XPS 13 Plus 9320 i7-1280P OLED | |
| HP Spectre x360 13.5 14t-ef000 | |
| Dell XPS 13 9315 2-in-1 Core i5-1230U | |
| Apple MacBook Air M2 Entry | |
| Microsoft Surface Pro 8, i7-1185G7 | |
| Lenovo ThinkBook Plus Gen2 Core i5 | |
| Lenovo ThinkBook Plus Gen2 Core i5 | |
| Dell XPS 13 9315, i5-1230U | |
| Cinebench R15 / CPU Single 64Bit | |
| HP Spectre x360 13.5 14t-ef000 | |
| Dell XPS 13 Plus 9320 i7-1280P OLED | |
| Microsoft Surface Pro 8, i7-1185G7 | |
| Apple MacBook Air M2 Entry | |
| Dell XPS 13 9315 2-in-1 Core i5-1230U | |
| Lenovo ThinkBook Plus Gen2 Core i5 | |
| Lenovo ThinkBook Plus Gen2 Core i5 | |
| Dell XPS 13 9315, i5-1230U | |
| Blender / v2.79 BMW27 CPU | |
| Lenovo ThinkBook Plus Gen2 Core i5 | |
| Apple MacBook Air M2 Entry | |
| Microsoft Surface Pro 8, i7-1185G7 | |
| Dell XPS 13 9315 2-in-1 Core i5-1230U | |
| HP Spectre x360 13.5 14t-ef000 | |
| Dell XPS 13 Plus 9320 i7-1280P OLED | |
| 7-Zip 18.03 / 7z b 4 | |
| Dell XPS 13 Plus 9320 i7-1280P OLED | |
| HP Spectre x360 13.5 14t-ef000 | |
| Dell XPS 13 9315 2-in-1 Core i5-1230U | |
| Microsoft Surface Pro 8, i7-1185G7 | |
| Dell XPS 13 9315, i5-1230U | |
| Lenovo ThinkBook Plus Gen2 Core i5 | |
| 7-Zip 18.03 / 7z b 4 -mmt1 | |
| HP Spectre x360 13.5 14t-ef000 | |
| Microsoft Surface Pro 8, i7-1185G7 | |
| Dell XPS 13 Plus 9320 i7-1280P OLED | |
| Dell XPS 13 9315 2-in-1 Core i5-1230U | |
| Lenovo ThinkBook Plus Gen2 Core i5 | |
| Dell XPS 13 9315, i5-1230U | |
| Geekbench 5.5 / Multi-Core | |
| Dell XPS 13 Plus 9320 i7-1280P OLED | |
| Apple MacBook Air M2 Entry | |
| HP Spectre x360 13.5 14t-ef000 | |
| Dell XPS 13 9315 2-in-1 Core i5-1230U | |
| Dell XPS 13 9315, i5-1230U | |
| Microsoft Surface Pro 8, i7-1185G7 | |
| Lenovo ThinkBook Plus Gen2 Core i5 | |
| Geekbench 5.5 / Single-Core | |
| Apple MacBook Air M2 Entry | |
| Dell XPS 13 Plus 9320 i7-1280P OLED | |
| HP Spectre x360 13.5 14t-ef000 | |
| Dell XPS 13 9315, i5-1230U | |
| Microsoft Surface Pro 8, i7-1185G7 | |
| Dell XPS 13 9315 2-in-1 Core i5-1230U | |
| Lenovo ThinkBook Plus Gen2 Core i5 | |
| HWBOT x265 Benchmark v2.2 / 4k Preset | |
| Dell XPS 13 Plus 9320 i7-1280P OLED | |
| HP Spectre x360 13.5 14t-ef000 | |
| Dell XPS 13 9315 2-in-1 Core i5-1230U | |
| Microsoft Surface Pro 8, i7-1185G7 | |
| LibreOffice / 20 Documents To PDF | |
| Lenovo ThinkBook Plus Gen2 Core i5 | |
| Dell XPS 13 9315 2-in-1 Core i5-1230U | |
| Microsoft Surface Pro 8, i7-1185G7 | |
| Dell XPS 13 Plus 9320 i7-1280P OLED | |
| HP Spectre x360 13.5 14t-ef000 | |
| R Benchmark 2.5 / Overall mean | |
| Lenovo ThinkBook Plus Gen2 Core i5 | |
| Microsoft Surface Pro 8, i7-1185G7 | |
| Dell XPS 13 9315 2-in-1 Core i5-1230U | |
| Dell XPS 13 Plus 9320 i7-1280P OLED | |
| HP Spectre x360 13.5 14t-ef000 | |
* ... mindre är bättre
AIDA64: FP32 Ray-Trace | FPU Julia | CPU SHA3 | CPU Queen | FPU SinJulia | FPU Mandel | CPU AES | CPU ZLib | FP64 Ray-Trace | CPU PhotoWorxx
| Performance rating | |
| Dell XPS 13 Plus 9320 i7-1280P OLED | |
| HP Spectre x360 13.5 14t-ef000 | |
| Microsoft Surface Pro 8, i7-1185G7 | |
| Dell XPS 13 9315 2-in-1 Core i5-1230U | |
| Lenovo ThinkBook Plus Gen2 Core i5 | |
| Genomsnitt Intel Core i5-1230U | |
| AIDA64 / FP32 Ray-Trace | |
| Dell XPS 13 Plus 9320 i7-1280P OLED | |
| HP Spectre x360 13.5 14t-ef000 | |
| Microsoft Surface Pro 8, i7-1185G7 | |
| Dell XPS 13 9315 2-in-1 Core i5-1230U | |
| Lenovo ThinkBook Plus Gen2 Core i5 | |
| Genomsnitt Intel Core i5-1230U (2344 - 6360, n=3) | |
| AIDA64 / FPU Julia | |
| Dell XPS 13 Plus 9320 i7-1280P OLED | |
| HP Spectre x360 13.5 14t-ef000 | |
| Dell XPS 13 9315 2-in-1 Core i5-1230U | |
| Microsoft Surface Pro 8, i7-1185G7 | |
| Lenovo ThinkBook Plus Gen2 Core i5 | |
| Genomsnitt Intel Core i5-1230U (11867 - 31714, n=3) | |
| AIDA64 / CPU SHA3 | |
| Dell XPS 13 Plus 9320 i7-1280P OLED | |
| HP Spectre x360 13.5 14t-ef000 | |
| Microsoft Surface Pro 8, i7-1185G7 | |
| Dell XPS 13 9315 2-in-1 Core i5-1230U | |
| Lenovo ThinkBook Plus Gen2 Core i5 | |
| Genomsnitt Intel Core i5-1230U (772 - 1711, n=3) | |
| AIDA64 / CPU Queen | |
| Dell XPS 13 Plus 9320 i7-1280P OLED | |
| HP Spectre x360 13.5 14t-ef000 | |
| Dell XPS 13 9315 2-in-1 Core i5-1230U | |
| Microsoft Surface Pro 8, i7-1185G7 | |
| Genomsnitt Intel Core i5-1230U (30824 - 52533, n=3) | |
| Lenovo ThinkBook Plus Gen2 Core i5 | |
| AIDA64 / FPU SinJulia | |
| Dell XPS 13 Plus 9320 i7-1280P OLED | |
| Microsoft Surface Pro 8, i7-1185G7 | |
| HP Spectre x360 13.5 14t-ef000 | |
| Dell XPS 13 9315 2-in-1 Core i5-1230U | |
| Lenovo ThinkBook Plus Gen2 Core i5 | |
| Genomsnitt Intel Core i5-1230U (2269 - 3947, n=3) | |
| AIDA64 / FPU Mandel | |
| Dell XPS 13 Plus 9320 i7-1280P OLED | |
| HP Spectre x360 13.5 14t-ef000 | |
| Microsoft Surface Pro 8, i7-1185G7 | |
| Dell XPS 13 9315 2-in-1 Core i5-1230U | |
| Lenovo ThinkBook Plus Gen2 Core i5 | |
| Genomsnitt Intel Core i5-1230U (6379 - 15896, n=3) | |
| AIDA64 / CPU AES | |
| HP Spectre x360 13.5 14t-ef000 | |
| Lenovo ThinkBook Plus Gen2 Core i5 | |
| Dell XPS 13 Plus 9320 i7-1280P OLED | |
| Microsoft Surface Pro 8, i7-1185G7 | |
| Dell XPS 13 9315 2-in-1 Core i5-1230U | |
| Genomsnitt Intel Core i5-1230U (18011 - 31941, n=3) | |
| AIDA64 / CPU ZLib | |
| Dell XPS 13 Plus 9320 i7-1280P OLED | |
| HP Spectre x360 13.5 14t-ef000 | |
| Dell XPS 13 9315 2-in-1 Core i5-1230U | |
| Genomsnitt Intel Core i5-1230U (229 - 495, n=3) | |
| Lenovo ThinkBook Plus Gen2 Core i5 | |
| Microsoft Surface Pro 8, i7-1185G7 | |
| AIDA64 / FP64 Ray-Trace | |
| Dell XPS 13 Plus 9320 i7-1280P OLED | |
| HP Spectre x360 13.5 14t-ef000 | |
| Microsoft Surface Pro 8, i7-1185G7 | |
| Dell XPS 13 9315 2-in-1 Core i5-1230U | |
| Lenovo ThinkBook Plus Gen2 Core i5 | |
| Genomsnitt Intel Core i5-1230U (1328 - 3305, n=3) | |
| AIDA64 / CPU PhotoWorxx | |
| Dell XPS 13 Plus 9320 i7-1280P OLED | |
| HP Spectre x360 13.5 14t-ef000 | |
| Lenovo ThinkBook Plus Gen2 Core i5 | |
| Microsoft Surface Pro 8, i7-1185G7 | |
| Dell XPS 13 9315 2-in-1 Core i5-1230U | |
| Genomsnitt Intel Core i5-1230U (17516 - 37042, n=3) | |
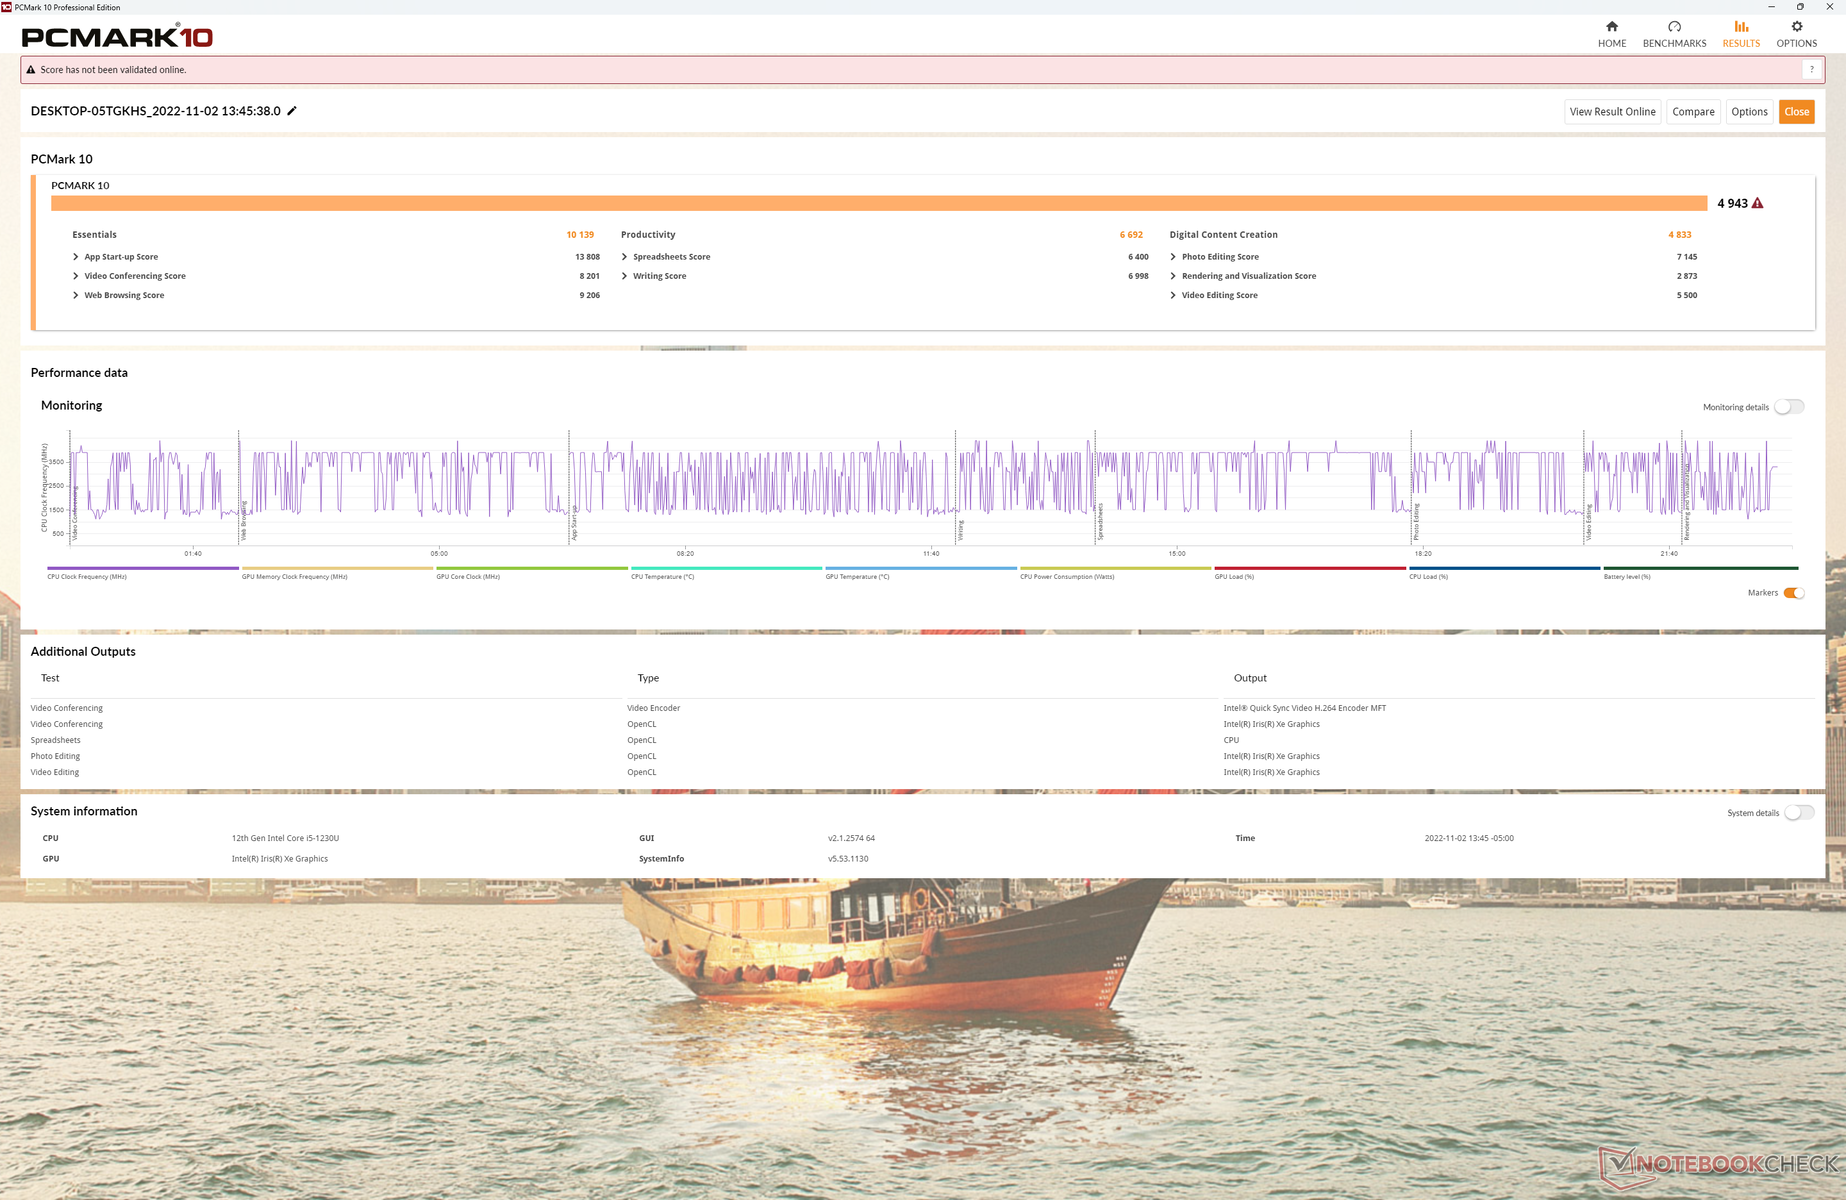
Systemets prestanda
PCMark 10-resultaten är jämförbara med Surface Pro 8 utom i undertestet Digital Content Creation där grafikprestanda är viktigast. Detta stämmer överens med våra GPU-testresultat nedan där XPS 13 9315 2-in-1 skulle uppvisa långsammare grafikprestanda än genomsnittet för kategorin.
CrossMark: Overall | Productivity | Creativity | Responsiveness
| PCMark 10 / Score | |
| Dell XPS 13 Plus 9320 i7-1280P OLED | |
| HP Spectre x360 13.5 14t-ef000 | |
| Microsoft Surface Pro 8, i7-1185G7 | |
| Dell XPS 13 9315 2-in-1 Core i5-1230U | |
| Genomsnitt Intel Core i5-1230U, Intel Iris Xe Graphics G7 80EUs (4001 - 4943, n=3) | |
| Lenovo ThinkBook Plus Gen2 Core i5 | |
| PCMark 10 / Essentials | |
| HP Spectre x360 13.5 14t-ef000 | |
| Dell XPS 13 Plus 9320 i7-1280P OLED | |
| Lenovo ThinkBook Plus Gen2 Core i5 | |
| Dell XPS 13 9315 2-in-1 Core i5-1230U | |
| Microsoft Surface Pro 8, i7-1185G7 | |
| Genomsnitt Intel Core i5-1230U, Intel Iris Xe Graphics G7 80EUs (8348 - 10139, n=3) | |
| PCMark 10 / Productivity | |
| HP Spectre x360 13.5 14t-ef000 | |
| Dell XPS 13 Plus 9320 i7-1280P OLED | |
| Dell XPS 13 9315 2-in-1 Core i5-1230U | |
| Microsoft Surface Pro 8, i7-1185G7 | |
| Genomsnitt Intel Core i5-1230U, Intel Iris Xe Graphics G7 80EUs (5735 - 6692, n=3) | |
| Lenovo ThinkBook Plus Gen2 Core i5 | |
| PCMark 10 / Digital Content Creation | |
| Dell XPS 13 Plus 9320 i7-1280P OLED | |
| Microsoft Surface Pro 8, i7-1185G7 | |
| HP Spectre x360 13.5 14t-ef000 | |
| Dell XPS 13 9315 2-in-1 Core i5-1230U | |
| Genomsnitt Intel Core i5-1230U, Intel Iris Xe Graphics G7 80EUs (3632 - 4833, n=3) | |
| Lenovo ThinkBook Plus Gen2 Core i5 | |
| CrossMark / Overall | |
| Dell XPS 13 Plus 9320 i7-1280P OLED | |
| HP Spectre x360 13.5 14t-ef000 | |
| Apple MacBook Air M2 Entry | |
| Microsoft Surface Pro 8, i7-1185G7 | |
| Dell XPS 13 9315 2-in-1 Core i5-1230U | |
| Genomsnitt Intel Core i5-1230U, Intel Iris Xe Graphics G7 80EUs (1117 - 1383, n=3) | |
| CrossMark / Productivity | |
| Dell XPS 13 Plus 9320 i7-1280P OLED | |
| HP Spectre x360 13.5 14t-ef000 | |
| Microsoft Surface Pro 8, i7-1185G7 | |
| Apple MacBook Air M2 Entry | |
| Dell XPS 13 9315 2-in-1 Core i5-1230U | |
| Genomsnitt Intel Core i5-1230U, Intel Iris Xe Graphics G7 80EUs (1187 - 1356, n=3) | |
| CrossMark / Creativity | |
| Dell XPS 13 Plus 9320 i7-1280P OLED | |
| Apple MacBook Air M2 Entry | |
| HP Spectre x360 13.5 14t-ef000 | |
| Microsoft Surface Pro 8, i7-1185G7 | |
| Dell XPS 13 9315 2-in-1 Core i5-1230U | |
| Genomsnitt Intel Core i5-1230U, Intel Iris Xe Graphics G7 80EUs (1095 - 1469, n=3) | |
| CrossMark / Responsiveness | |
| Dell XPS 13 Plus 9320 i7-1280P OLED | |
| HP Spectre x360 13.5 14t-ef000 | |
| Dell XPS 13 9315 2-in-1 Core i5-1230U | |
| Genomsnitt Intel Core i5-1230U, Intel Iris Xe Graphics G7 80EUs (990 - 1224, n=3) | |
| Microsoft Surface Pro 8, i7-1185G7 | |
| Apple MacBook Air M2 Entry | |
| PCMark 10 Score | 4943 poäng | |
Hjälp | ||
| AIDA64 / Memory Copy | |
| Dell XPS 13 Plus 9320 i7-1280P OLED | |
| HP Spectre x360 13.5 14t-ef000 | |
| Dell XPS 13 9315 2-in-1 Core i5-1230U | |
| Microsoft Surface Pro 8, i7-1185G7 | |
| Lenovo ThinkBook Plus Gen2 Core i5 | |
| Genomsnitt Intel Core i5-1230U (32539 - 60944, n=3) | |
| AIDA64 / Memory Read | |
| Dell XPS 13 Plus 9320 i7-1280P OLED | |
| Lenovo ThinkBook Plus Gen2 Core i5 | |
| HP Spectre x360 13.5 14t-ef000 | |
| Microsoft Surface Pro 8, i7-1185G7 | |
| Dell XPS 13 9315 2-in-1 Core i5-1230U | |
| Genomsnitt Intel Core i5-1230U (31342 - 60435, n=3) | |
| AIDA64 / Memory Write | |
| Dell XPS 13 9315 2-in-1 Core i5-1230U | |
| Lenovo ThinkBook Plus Gen2 Core i5 | |
| HP Spectre x360 13.5 14t-ef000 | |
| Dell XPS 13 Plus 9320 i7-1280P OLED | |
| Microsoft Surface Pro 8, i7-1185G7 | |
| Genomsnitt Intel Core i5-1230U (33224 - 65665, n=3) | |
| AIDA64 / Memory Latency | |
| Dell XPS 13 9315 2-in-1 Core i5-1230U | |
| Dell XPS 13 Plus 9320 i7-1280P OLED | |
| Microsoft Surface Pro 8, i7-1185G7 | |
| HP Spectre x360 13.5 14t-ef000 | |
| Lenovo ThinkBook Plus Gen2 Core i5 | |
| Genomsnitt Intel Core i5-1230U (104.3 - 105.3, n=3) | |
* ... mindre är bättre
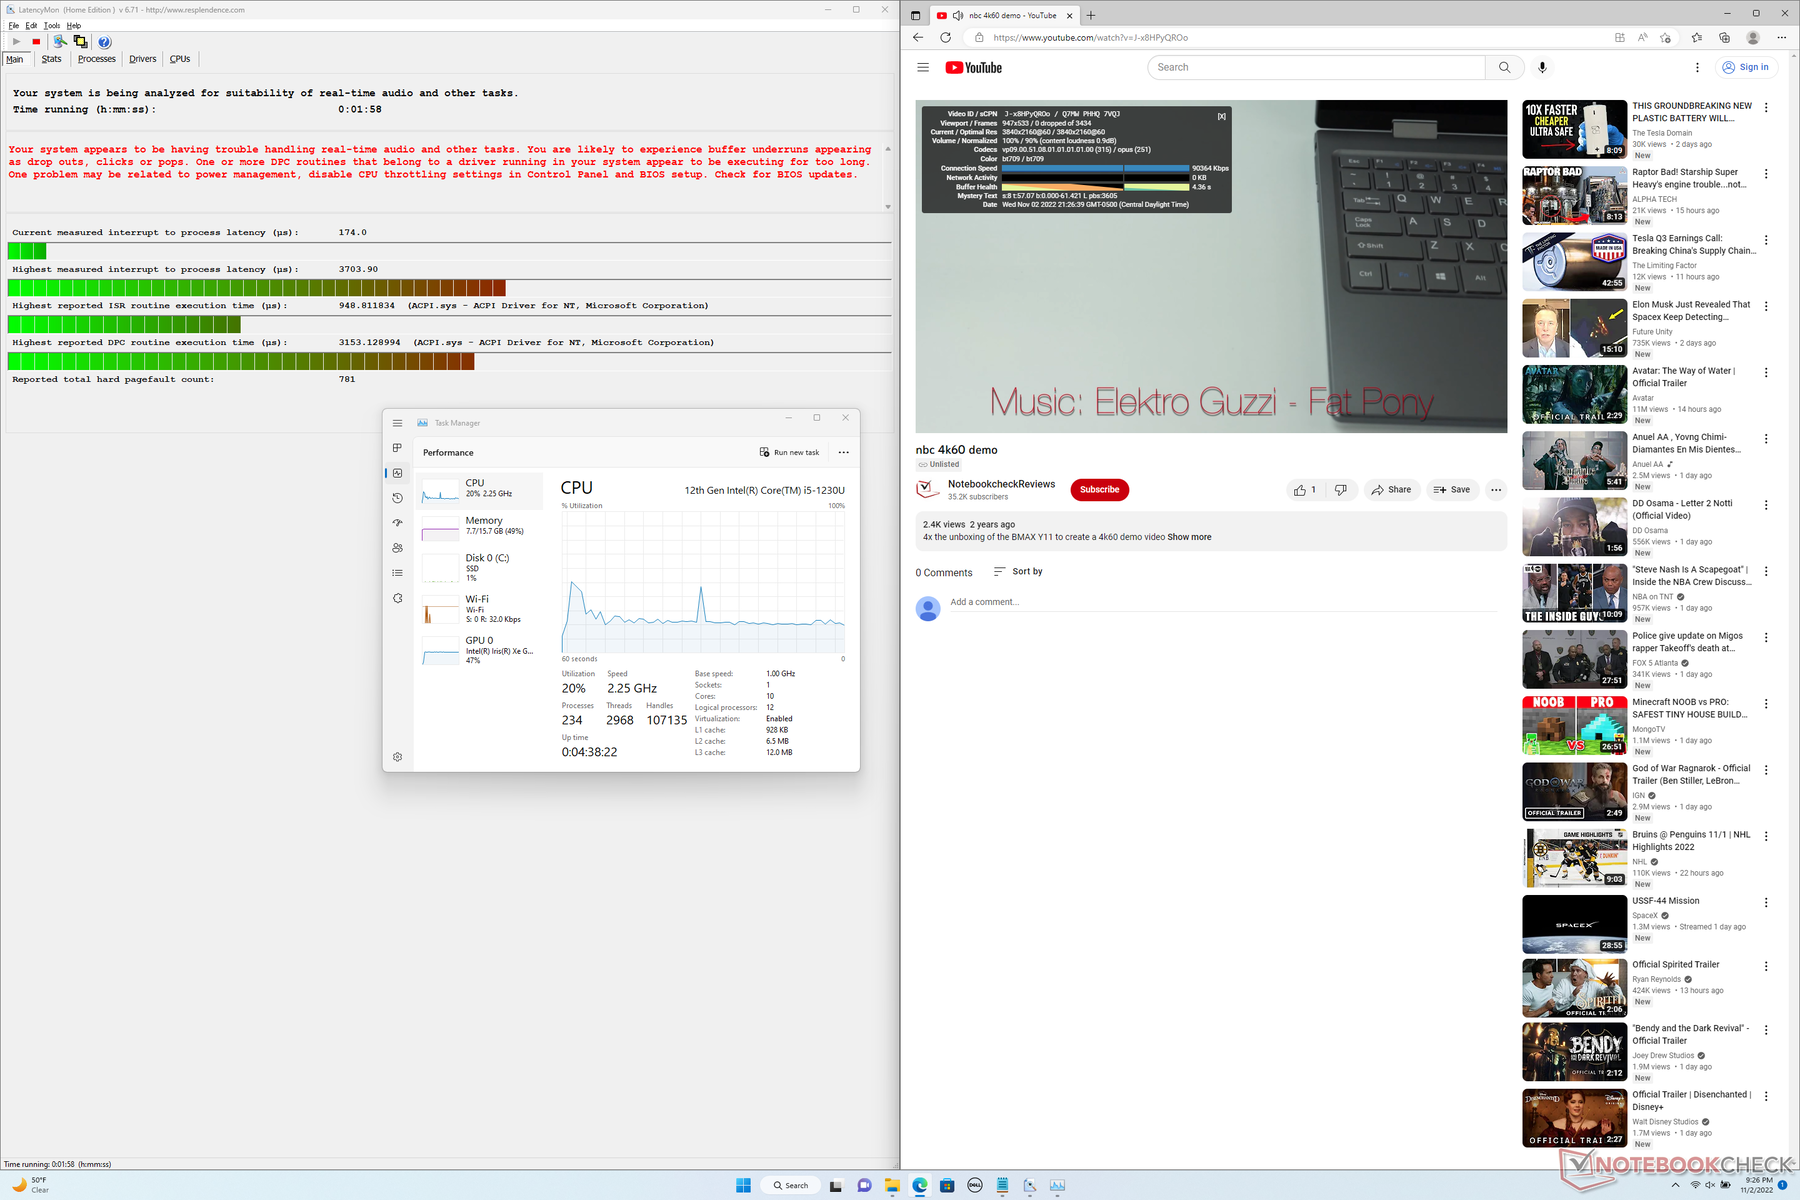
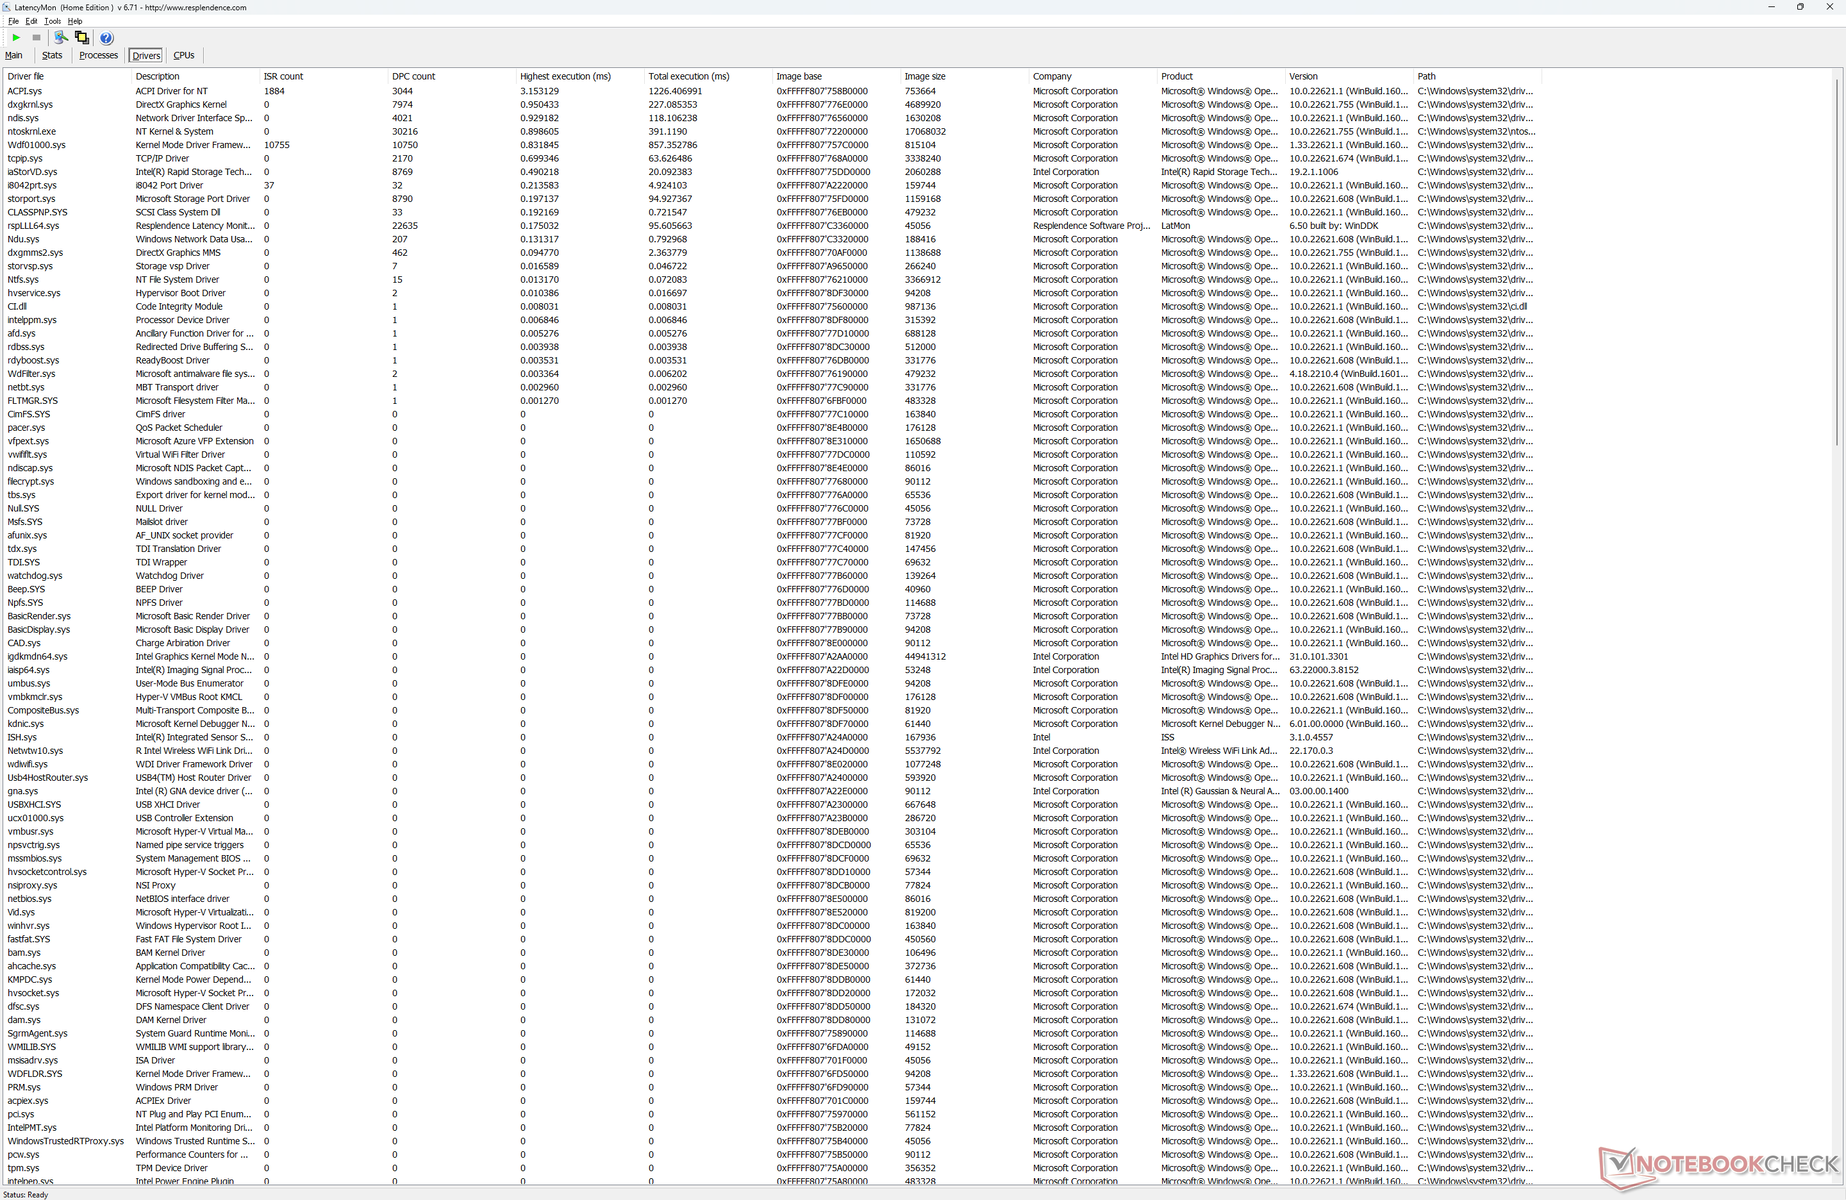
DPC-latenstid
LatencyMon avslöjar DPC-problem när du öppnar flera webbläsarflikar på vår hemsida. uppspelning av 4K-video vid 60 FPS är annars perfekt utan några tappade bilder.
| DPC Latencies / LatencyMon - interrupt to process latency (max), Web, Youtube, Prime95 | |
| Dell XPS 13 9315 2-in-1 Core i5-1230U | |
| Lenovo ThinkBook Plus Gen2 Core i5 | |
| HP Spectre x360 13.5 14t-ef000 | |
| Microsoft Surface Pro 8, i7-1185G7 | |
| Dell XPS 13 Plus 9320 i7-1280P OLED | |
* ... mindre är bättre
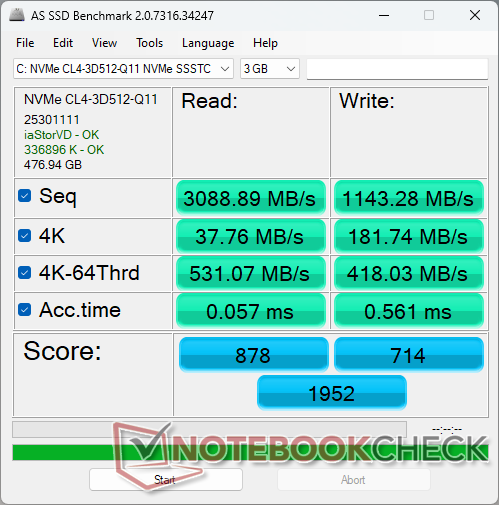
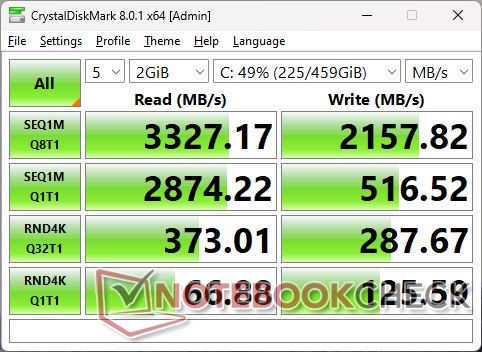
Lagringsenheter - PCIe4 med PCIe3-hastigheter
Dell erbjuder 256 GB, 512 GB och 1 TB PCIe4 x4-lagringsalternativ. Tyvärr ligger prestandan närmare de flesta PCIe3 x4-enheter än PCIe4 x4. Benchmarks som CrystalDiskMark och DiskSpd visar maximala läs- och skrivhastigheter på endast 3300 MB/s respektive 2200 MB/s, jämfört med 7000 MB/s eller snabbare på Samsung 980 Pro PCIe4 x4-serien. Trots detta är 3000 MB/s mer än tillräckligt med tanke på formfaktorn och Core U-seriens CPU.

| Drive Performance rating - Percent | |
| Lenovo ThinkBook Plus Gen2 Core i5 | |
| Dell XPS 13 Plus 9320 i7-1280P OLED | |
| HP Spectre x360 13.5 14t-ef000 | |
| Microsoft Surface Pro 8, i7-1185G7 | |
| Dell XPS 13 9315 2-in-1 Core i5-1230U | |
* ... mindre är bättre
Disk Throttling: DiskSpd Read Loop, Queue Depth 8
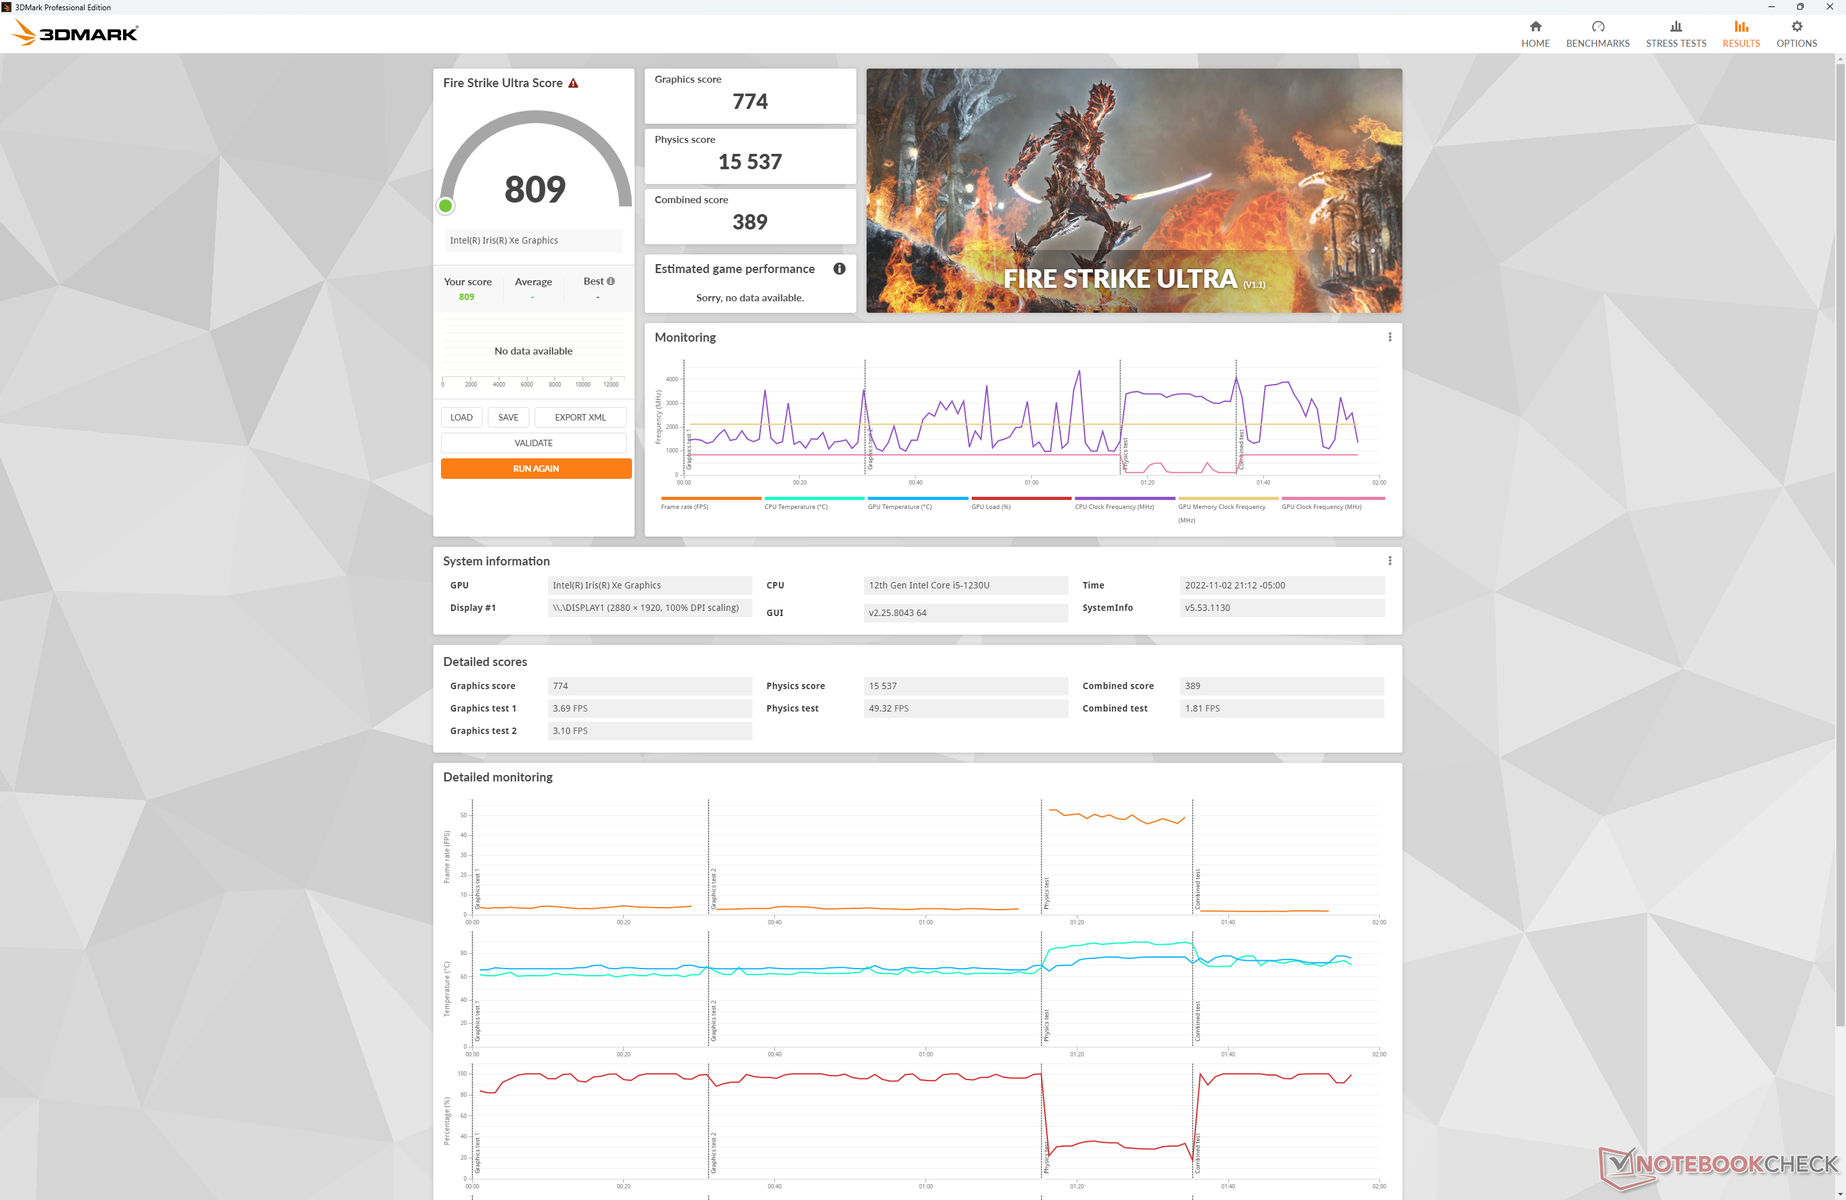
GPU-prestanda
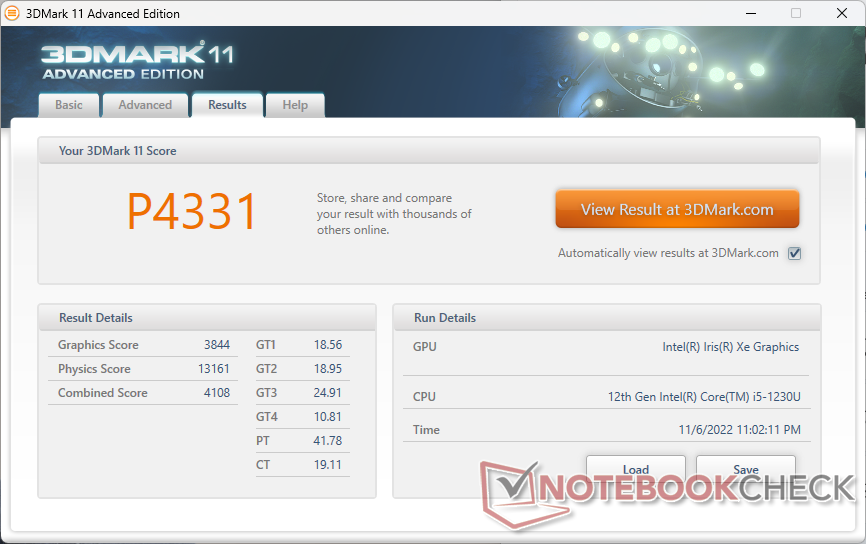
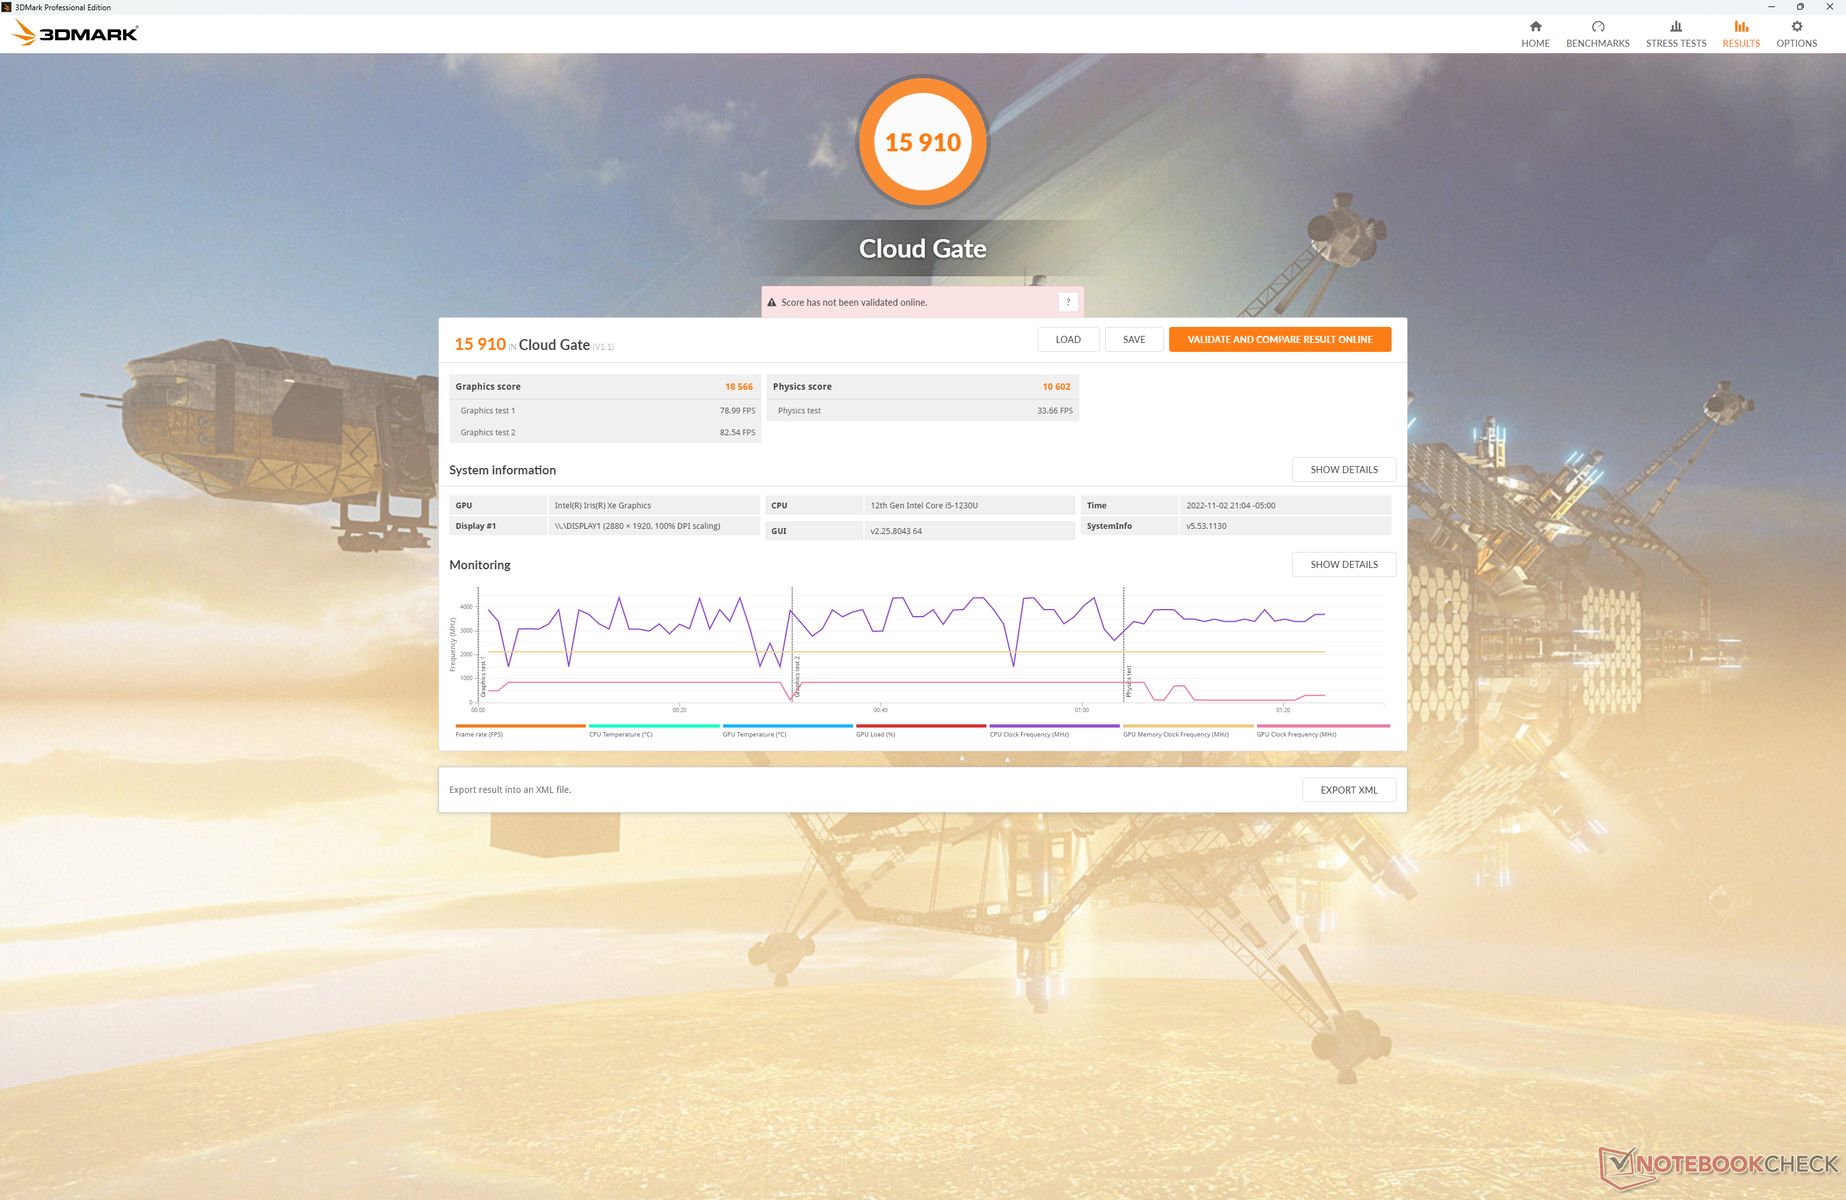
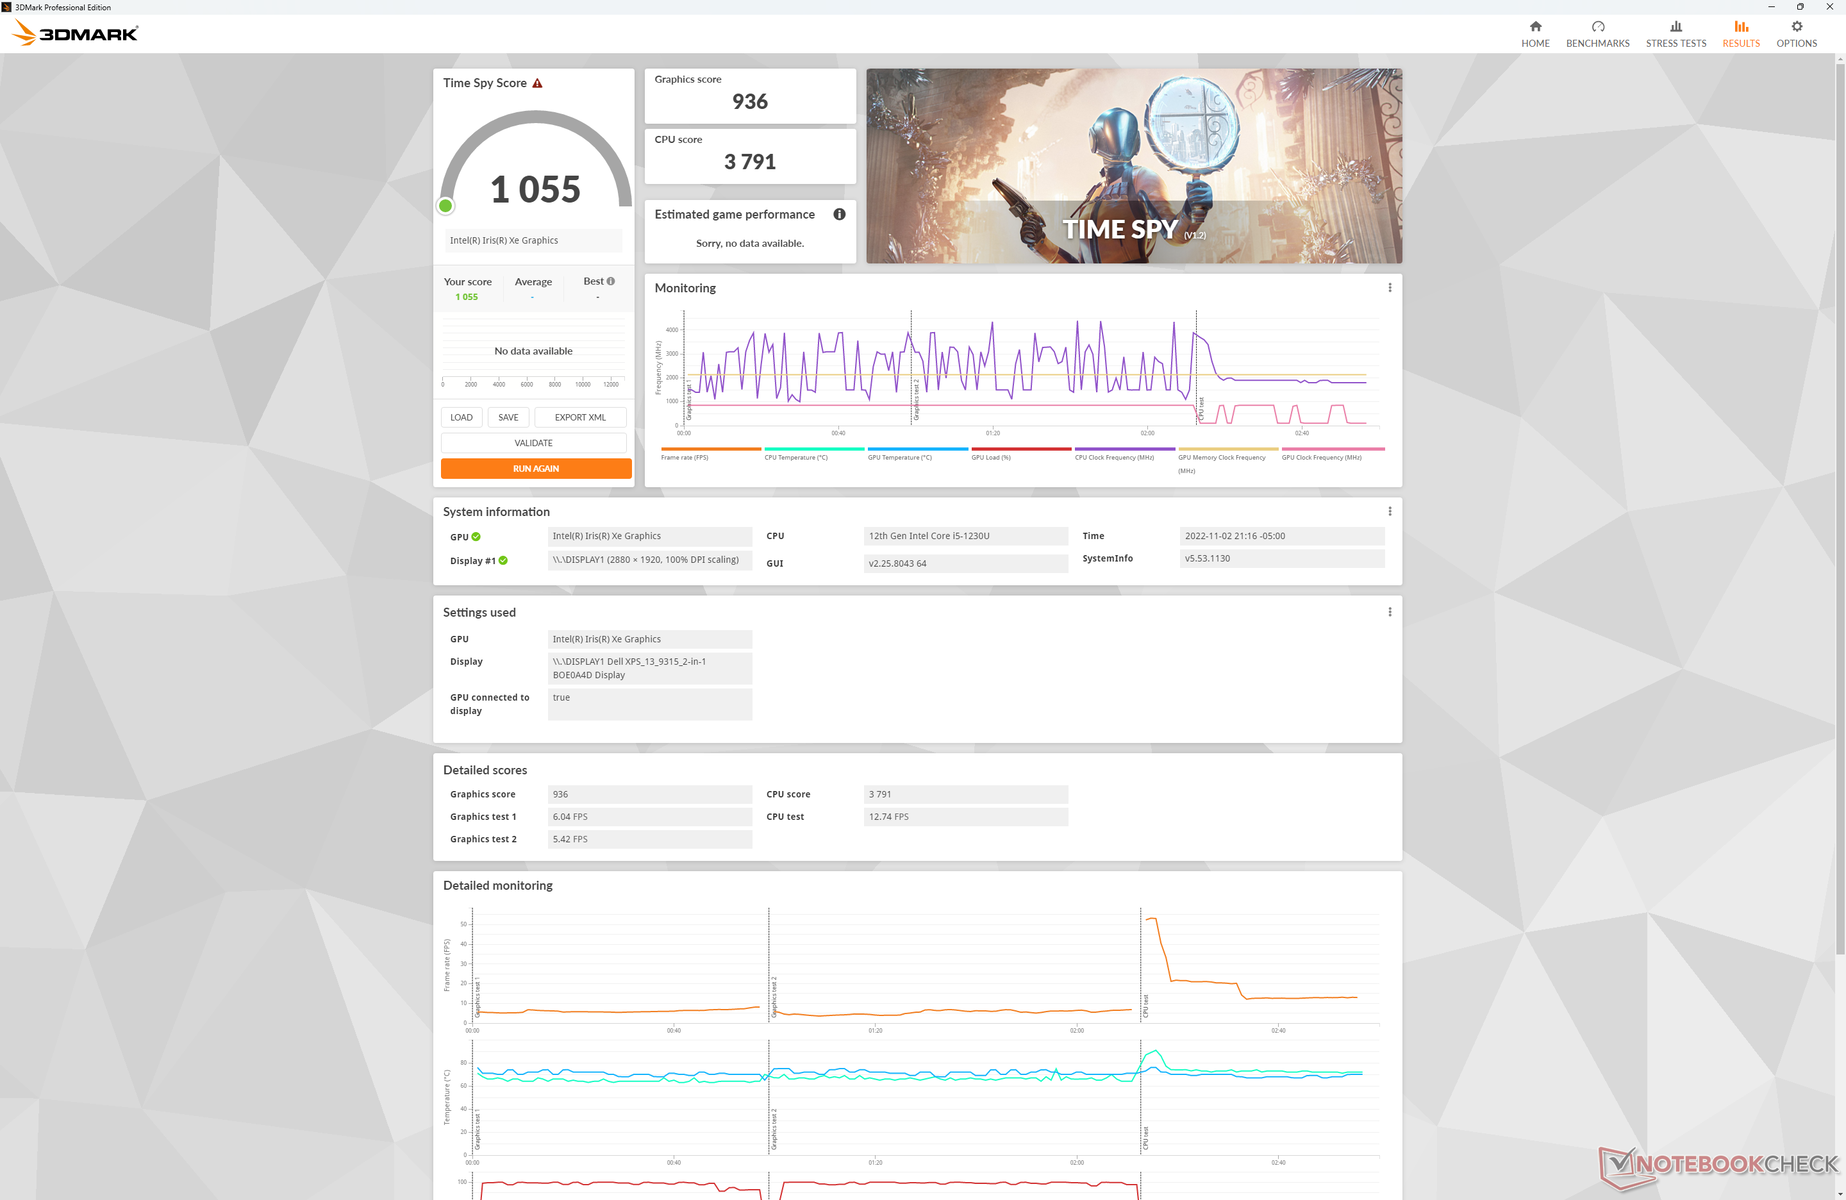
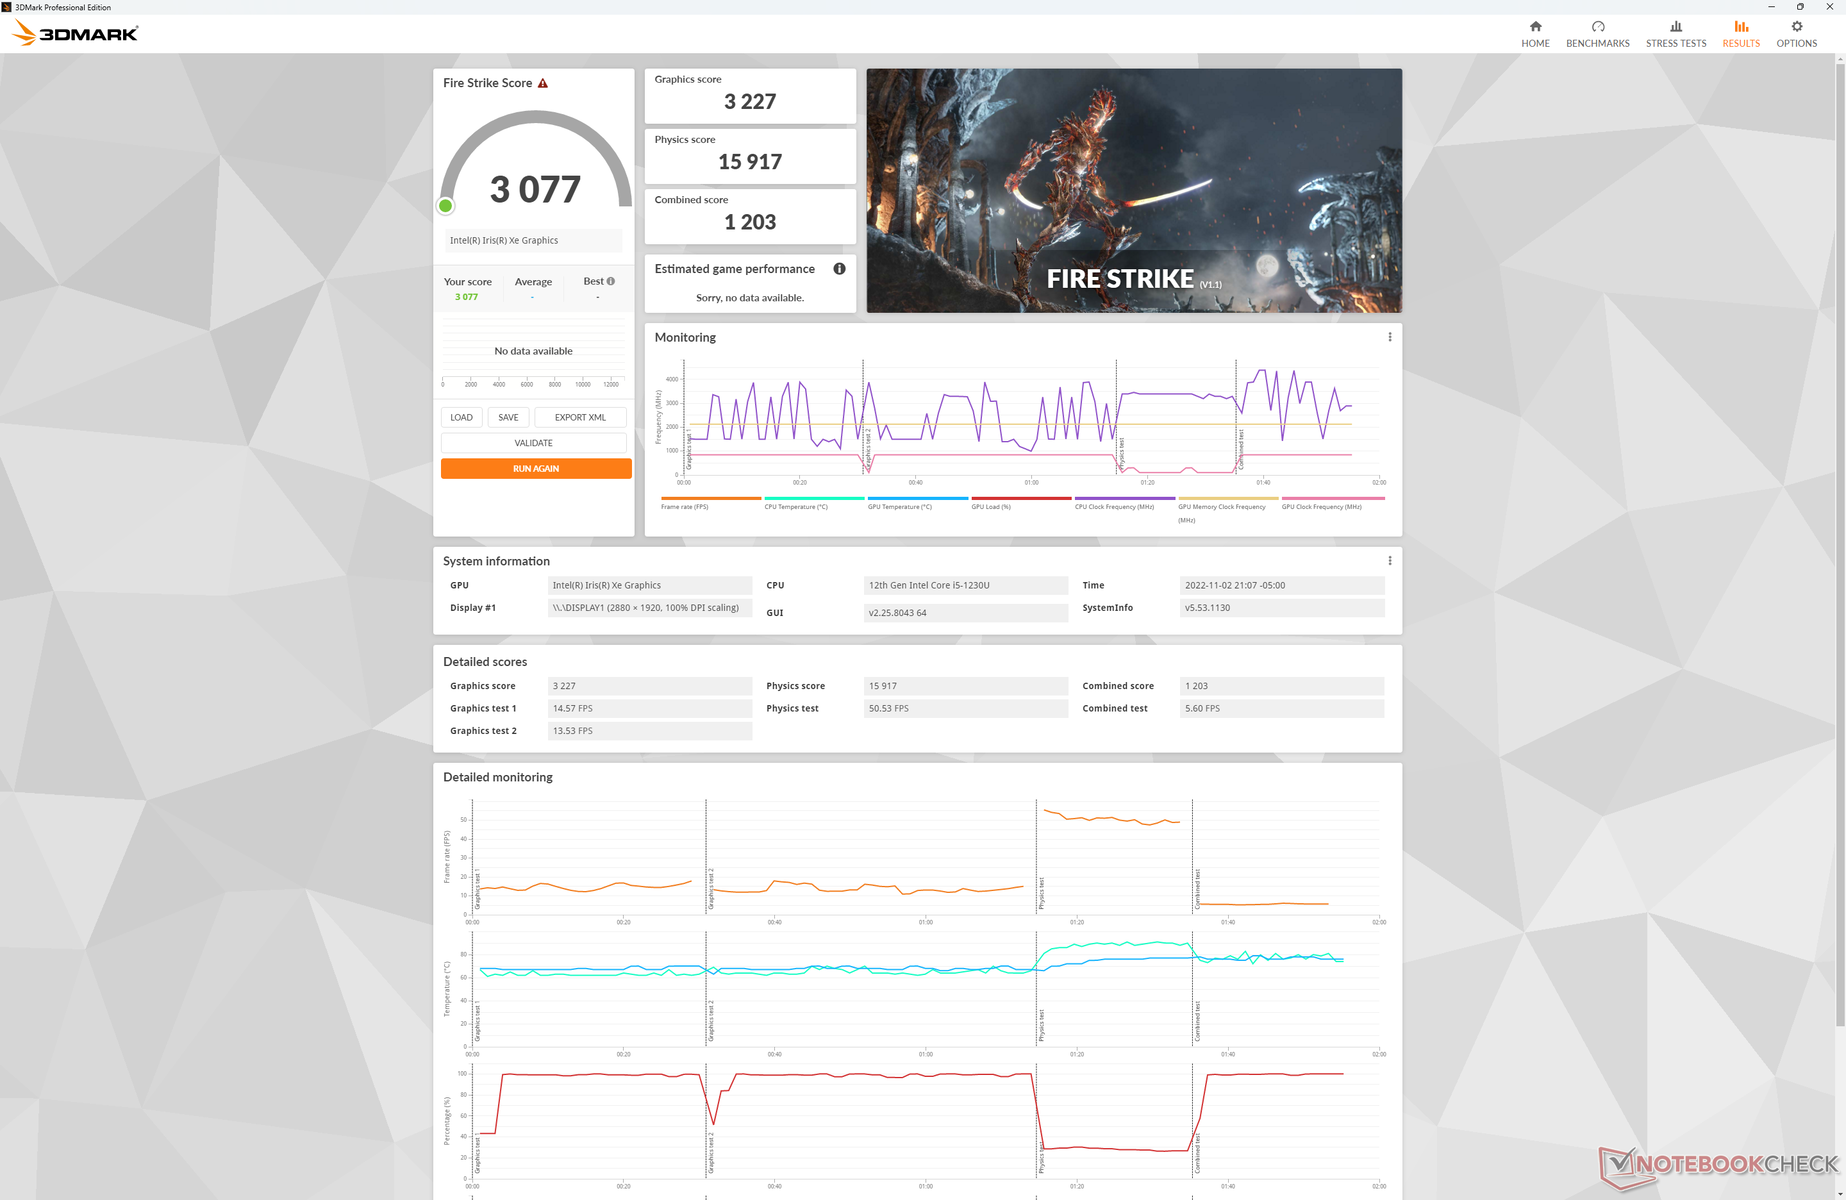
Processorprestanda är bättre än väntat, men grafikprestanda är inte lika bra. 3DMark-resultaten är cirka 10-20 procent långsammare än den genomsnittliga bärbara datorn i vår databas med samma integrerade grafik Iris Xe 80 EUsför att vara jämförbara med förra åretsThinkBook Plus Gen 2gaming är fortfarande möjligt om man bara använder de lägsta inställningarna.
Uppgradering till Core i7-1250U SKU med Iris Xe 96 EU förväntas öka grafikprestandan med cirka 36 procent baserat på vår erfarenhet med HP Envy x360 13. Det finns konfigurationer med endast 8 GB RAM i stället för 16 GB vilket vi inte rekommenderar, annars skulle grafikprestandan bli ännu sämre.
| 3DMark | |
| 1920x1080 Fire Strike Graphics | |
| Microsoft Surface Pro 8, i7-1185G7 | |
| Dell XPS 13 Plus 9320 i7-1280P OLED | |
| HP Spectre x360 13.5 14t-ef000 | |
| HP Envy x360 13-bf0013dx | |
| Genomsnitt Intel Iris Xe Graphics G7 80EUs (1560 - 5398, n=114) | |
| Lenovo ThinkBook Plus Gen2 Core i5 | |
| Dell XPS 13 9315 2-in-1 Core i5-1230U | |
| 2560x1440 Time Spy Graphics | |
| Dell XPS 13 Plus 9320 i7-1280P OLED | |
| Microsoft Surface Pro 8, i7-1185G7 | |
| HP Spectre x360 13.5 14t-ef000 | |
| HP Envy x360 13-bf0013dx | |
| Genomsnitt Intel Iris Xe Graphics G7 80EUs (561 - 1576, n=111) | |
| Lenovo ThinkBook Plus Gen2 Core i5 | |
| Dell XPS 13 9315 2-in-1 Core i5-1230U | |
| 2560x1440 Time Spy Score | |
| Dell XPS 13 Plus 9320 i7-1280P OLED | |
| Microsoft Surface Pro 8, i7-1185G7 | |
| HP Spectre x360 13.5 14t-ef000 | |
| HP Envy x360 13-bf0013dx | |
| Genomsnitt Intel Iris Xe Graphics G7 80EUs (630 - 1791, n=111) | |
| Lenovo ThinkBook Plus Gen2 Core i5 | |
| Dell XPS 13 9315 2-in-1 Core i5-1230U | |
| 3DMark 11 - 1280x720 Performance GPU | |
| Dell XPS 13 Plus 9320 i7-1280P OLED | |
| Microsoft Surface Pro 8, i7-1185G7 | |
| HP Spectre x360 13.5 14t-ef000 | |
| Genomsnitt Intel Iris Xe Graphics G7 80EUs (2246 - 6579, n=112) | |
| HP Envy x360 13-bf0013dx | |
| Lenovo ThinkBook Plus Gen2 Core i5 | |
| Dell XPS 13 9315 2-in-1 Core i5-1230U | |
| 3DMark 11 Performance | 4331 poäng | |
| 3DMark Cloud Gate Standard Score | 15910 poäng | |
| 3DMark Fire Strike Score | 3077 poäng | |
| 3DMark Time Spy Score | 1055 poäng | |
Hjälp | ||
* ... mindre är bättre
| Final Fantasy XV Benchmark - 1280x720 Lite Quality | |
| Microsoft Surface Pro 8, i7-1185G7 | |
| Dell XPS 13 Plus 9320 i7-1280P OLED | |
| HP Spectre x360 13.5 14t-ef000 | |
| Genomsnitt Intel Iris Xe Graphics G7 80EUs (8.32 - 45.6, n=107) | |
| Dell XPS 13 9315 2-in-1 Core i5-1230U | |
| X-Plane 11.11 | |
| 1280x720 low (fps_test=1) | |
| Dell XPS 13 Plus 9320 i7-1280P OLED | |
| HP Spectre x360 13.5 14t-ef000 | |
| Lenovo ThinkBook Plus Gen2 Core i5 | |
| Genomsnitt Intel Iris Xe Graphics G7 80EUs (9.12 - 74.4, n=111) | |
| Microsoft Surface Pro 8, i7-1185G7 | |
| Dell XPS 13 9315 2-in-1 Core i5-1230U | |
| 1920x1080 med (fps_test=2) | |
| HP Spectre x360 13.5 14t-ef000 | |
| Dell XPS 13 Plus 9320 i7-1280P OLED | |
| Microsoft Surface Pro 8, i7-1185G7 | |
| Genomsnitt Intel Iris Xe Graphics G7 80EUs (6.45 - 40.5, n=112) | |
| Dell XPS 13 9315 2-in-1 Core i5-1230U | |
| Lenovo ThinkBook Plus Gen2 Core i5 | |
| 1920x1080 high (fps_test=3) | |
| Dell XPS 13 Plus 9320 i7-1280P OLED | |
| HP Spectre x360 13.5 14t-ef000 | |
| Microsoft Surface Pro 8, i7-1185G7 | |
| Genomsnitt Intel Iris Xe Graphics G7 80EUs (5.55 - 36.3, n=110) | |
| Dell XPS 13 9315 2-in-1 Core i5-1230U | |
| Lenovo ThinkBook Plus Gen2 Core i5 | |
Bildfrekvensen är jämn när den går på tomgång på Witcher 3 för att visa att det inte finns några större avbrytande aktiviteter i bakgrunden. Vi upplevde ett enda tillfälle då prestandan sjönk till 36 FPS innan den steg tillbaka till det normala, men det var tack och lov bara ett undantag och ett mönster.
Witcher 3 FPS Chart
| låg | med. | hög | ultra | |
|---|---|---|---|---|
| GTA V (2015) | 60.9 | 38.4 | 11.7 | 6.06 |
| The Witcher 3 (2015) | 57.7 | 38.9 | 19.9 | 8.5 |
| Dota 2 Reborn (2015) | 101.2 | 75.8 | 37.6 | 34.2 |
| Final Fantasy XV Benchmark (2018) | 27 | |||
| X-Plane 11.11 (2018) | 31.2 | 25.1 | 22 |
Utsläpp - inga fläktar!
Systembrus
Medan Surface Pro 8 använder en intern fläkt för kylning, kyls XPS 13 9315 2-i-1 passivt i alla konfigurationer, inklusive Core i7-versionen. Det finns inget fläktljud eller spolningsljud alls för ett helt tyst system.
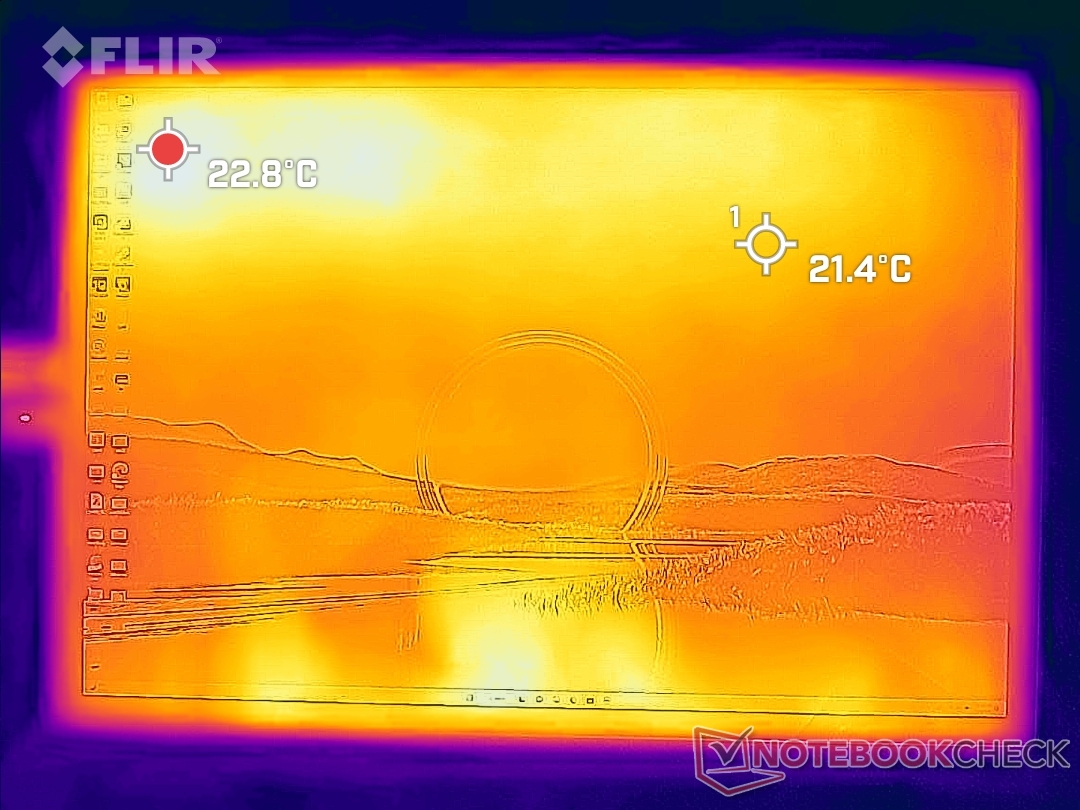
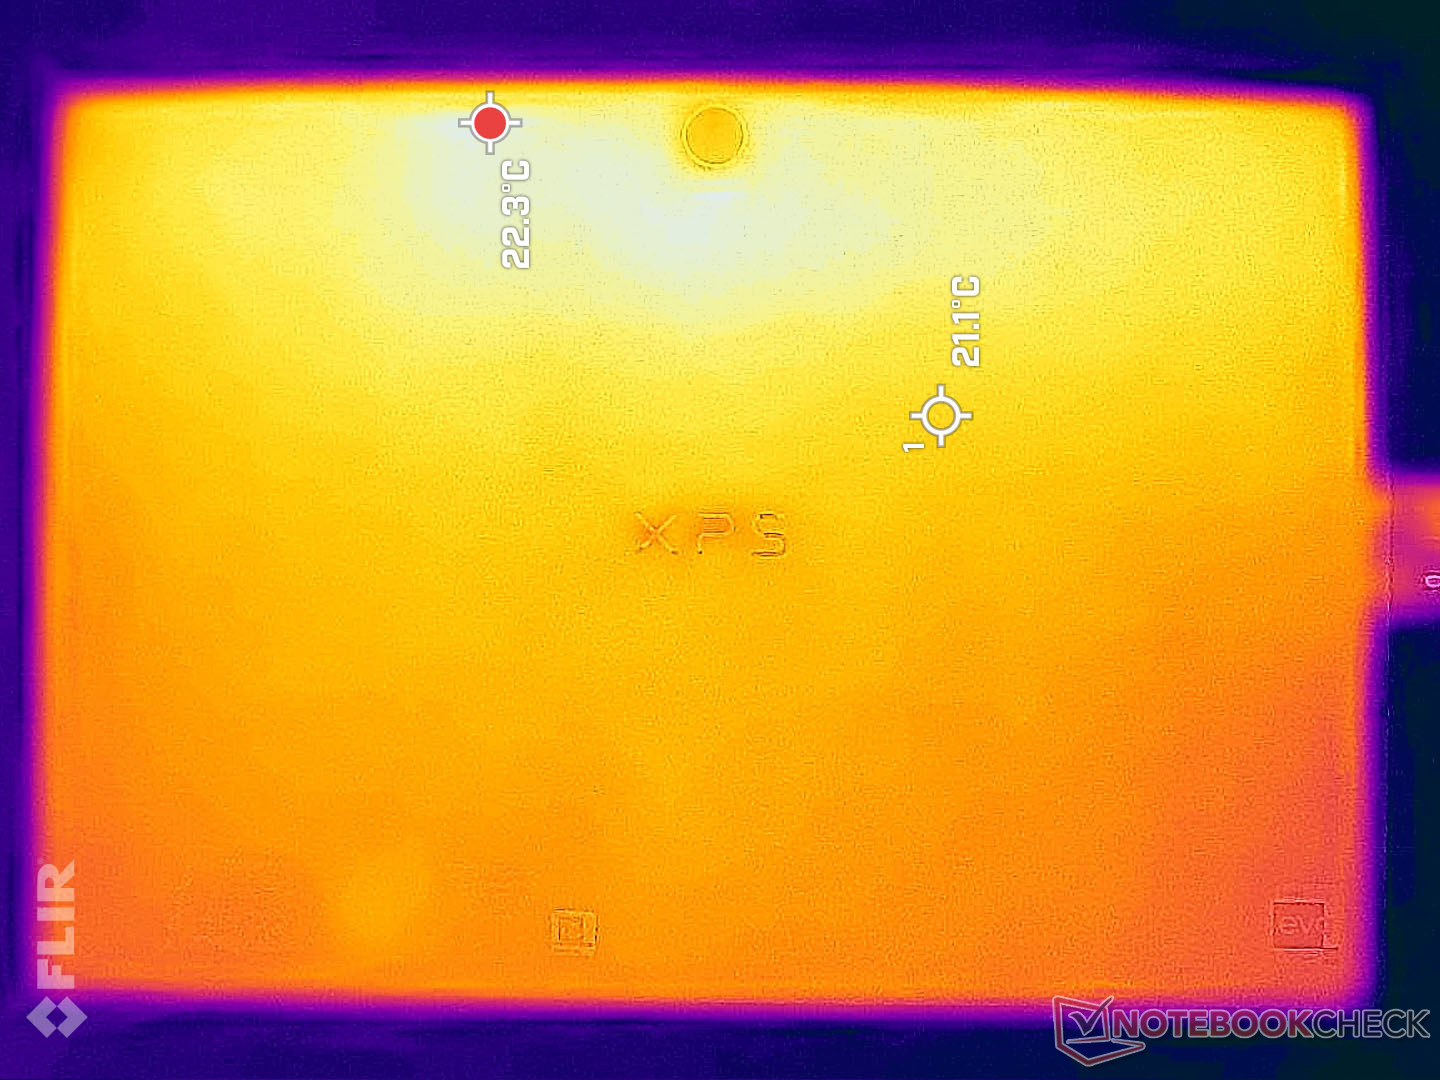
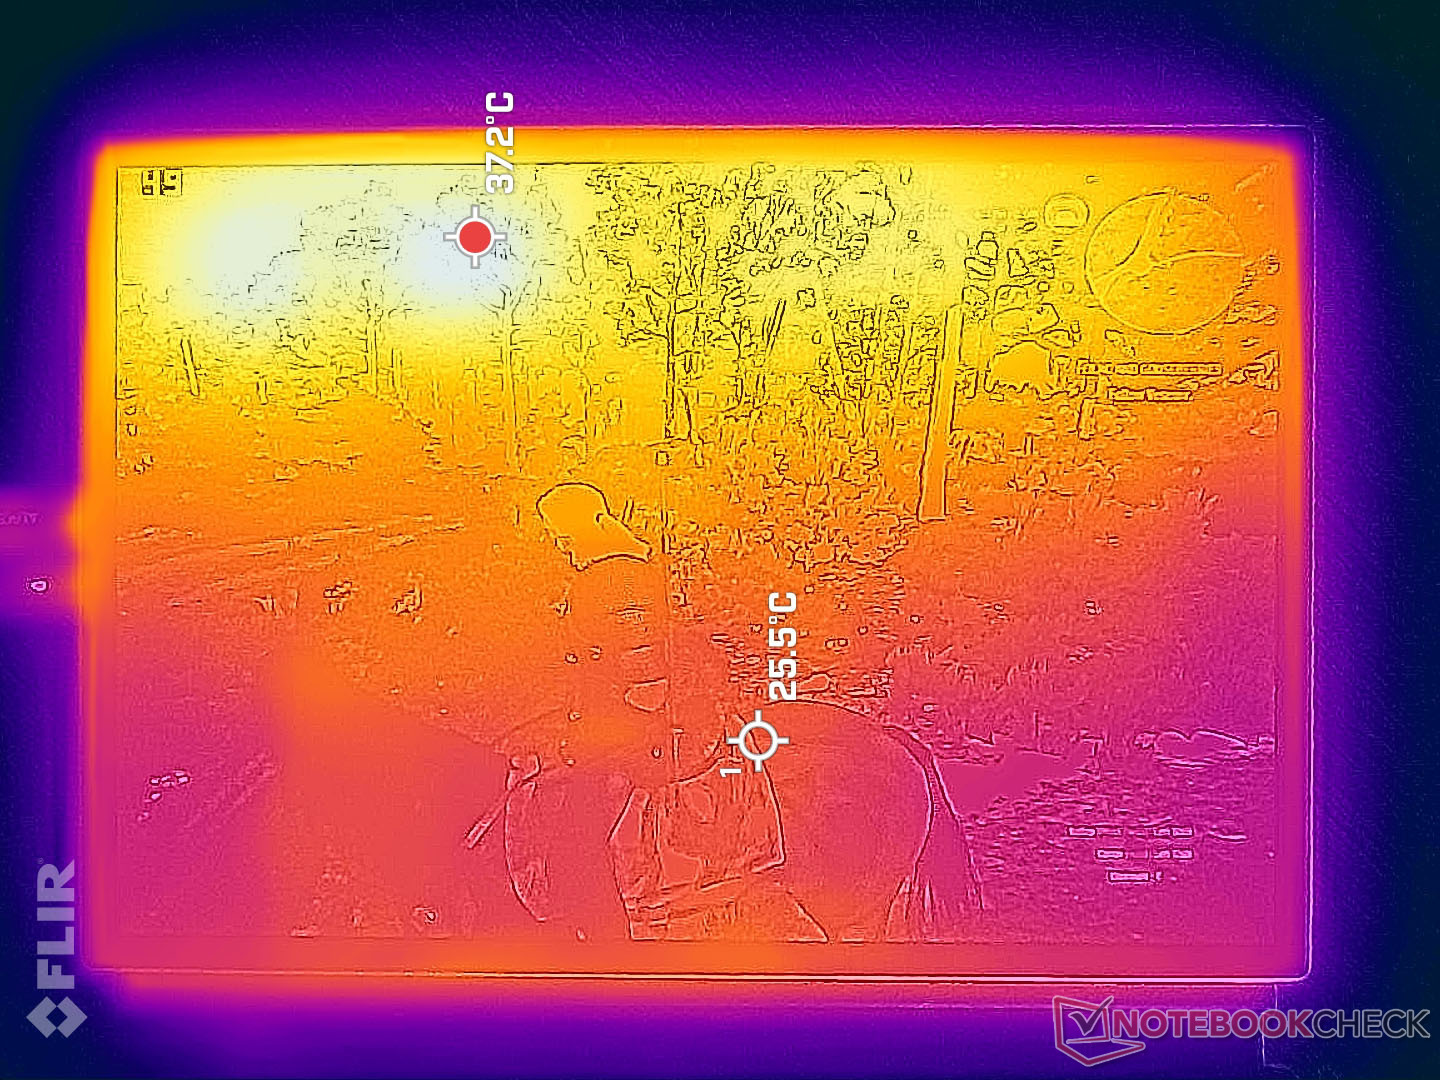
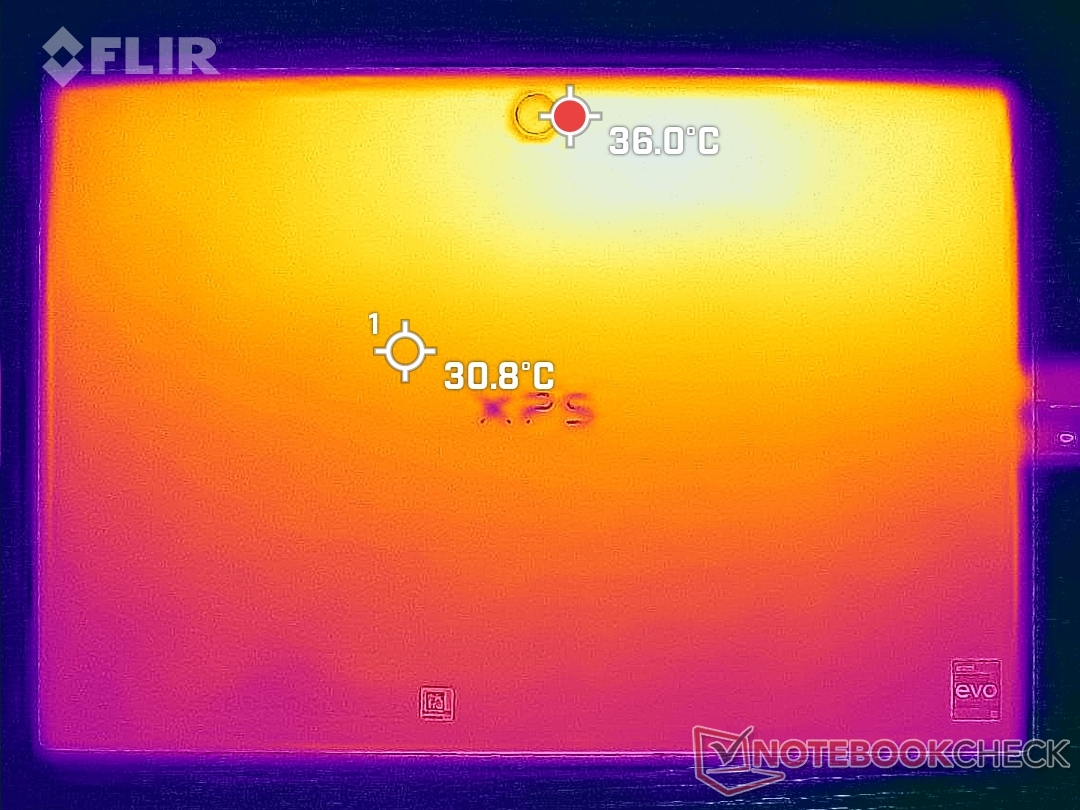
Temperatur
Yttemperaturerna är generellt sett varmare längs den övre halvan av enheten, medan den nedre halvan är märkbart kallare. Varma punkter på fram- och baksidan kan nå 42 C respektive 39 C, jämfört med endast 30 C på de svalare punkterna. Enheten blir aldrig obekväm att hålla i, oavsett inriktning eller placering. De övergripande temperaturerna är mycket svalare än vad vi registrerade på Surface Pro 8 där hela enhetens fram- och baksida kan nå 43 C till 48 C.
(±) Den maximala temperaturen på ovansidan är 41.8 °C / 107 F, jämfört med genomsnittet av 35.4 °C / 96 F , allt från 19.6 till 60 °C för klassen Convertible.
(+) Botten värms upp till maximalt 38.2 °C / 101 F, jämfört med genomsnittet av 36.9 °C / 98 F
(+) Vid tomgångsbruk är medeltemperaturen för ovansidan 25.5 °C / 78 F, jämfört med enhetsgenomsnittet på 30.3 °C / ### class_avg_f### F.
(+) Handledsstöden och pekplattan är kallare än hudtemperaturen med maximalt 29.8 °C / 85.6 F och är därför svala att ta på.
(±) Medeltemperaturen för handledsstödsområdet på liknande enheter var 28 °C / 82.4 F (-1.8 °C / -3.2 F).
| Dell XPS 13 9315 2-in-1 Core i5-1230U Intel Core i5-1230U, Intel Iris Xe Graphics G7 80EUs | Microsoft Surface Pro 8, i7-1185G7 Intel Core i7-1185G7, Intel Iris Xe Graphics G7 96EUs | HP Spectre x360 13.5 14t-ef000 Intel Core i7-1255U, Intel Iris Xe Graphics G7 96EUs | Lenovo ThinkBook Plus Gen2 Core i5 Intel Core i5-1130G7, Intel Iris Xe Graphics G7 80EUs | Apple MacBook Air M2 Entry Apple M2, Apple M2 8-Core GPU | |
|---|---|---|---|---|---|
| Heat | -2% | 14% | -11% | 1% | |
| Maximum Upper Side * (°C) | 41.8 | 45 -8% | 36.4 13% | 42 -0% | 44.5 -6% |
| Maximum Bottom * (°C) | 38.2 | 47.2 -24% | 37 3% | 44.5 -16% | 44.4 -16% |
| Idle Upper Side * (°C) | 27.4 | 24.1 12% | 20.8 24% | 29.8 -9% | 23.9 13% |
| Idle Bottom * (°C) | 27.2 | 23.4 14% | 22.6 17% | 31.9 -17% | 23.6 13% |
* ... mindre är bättre
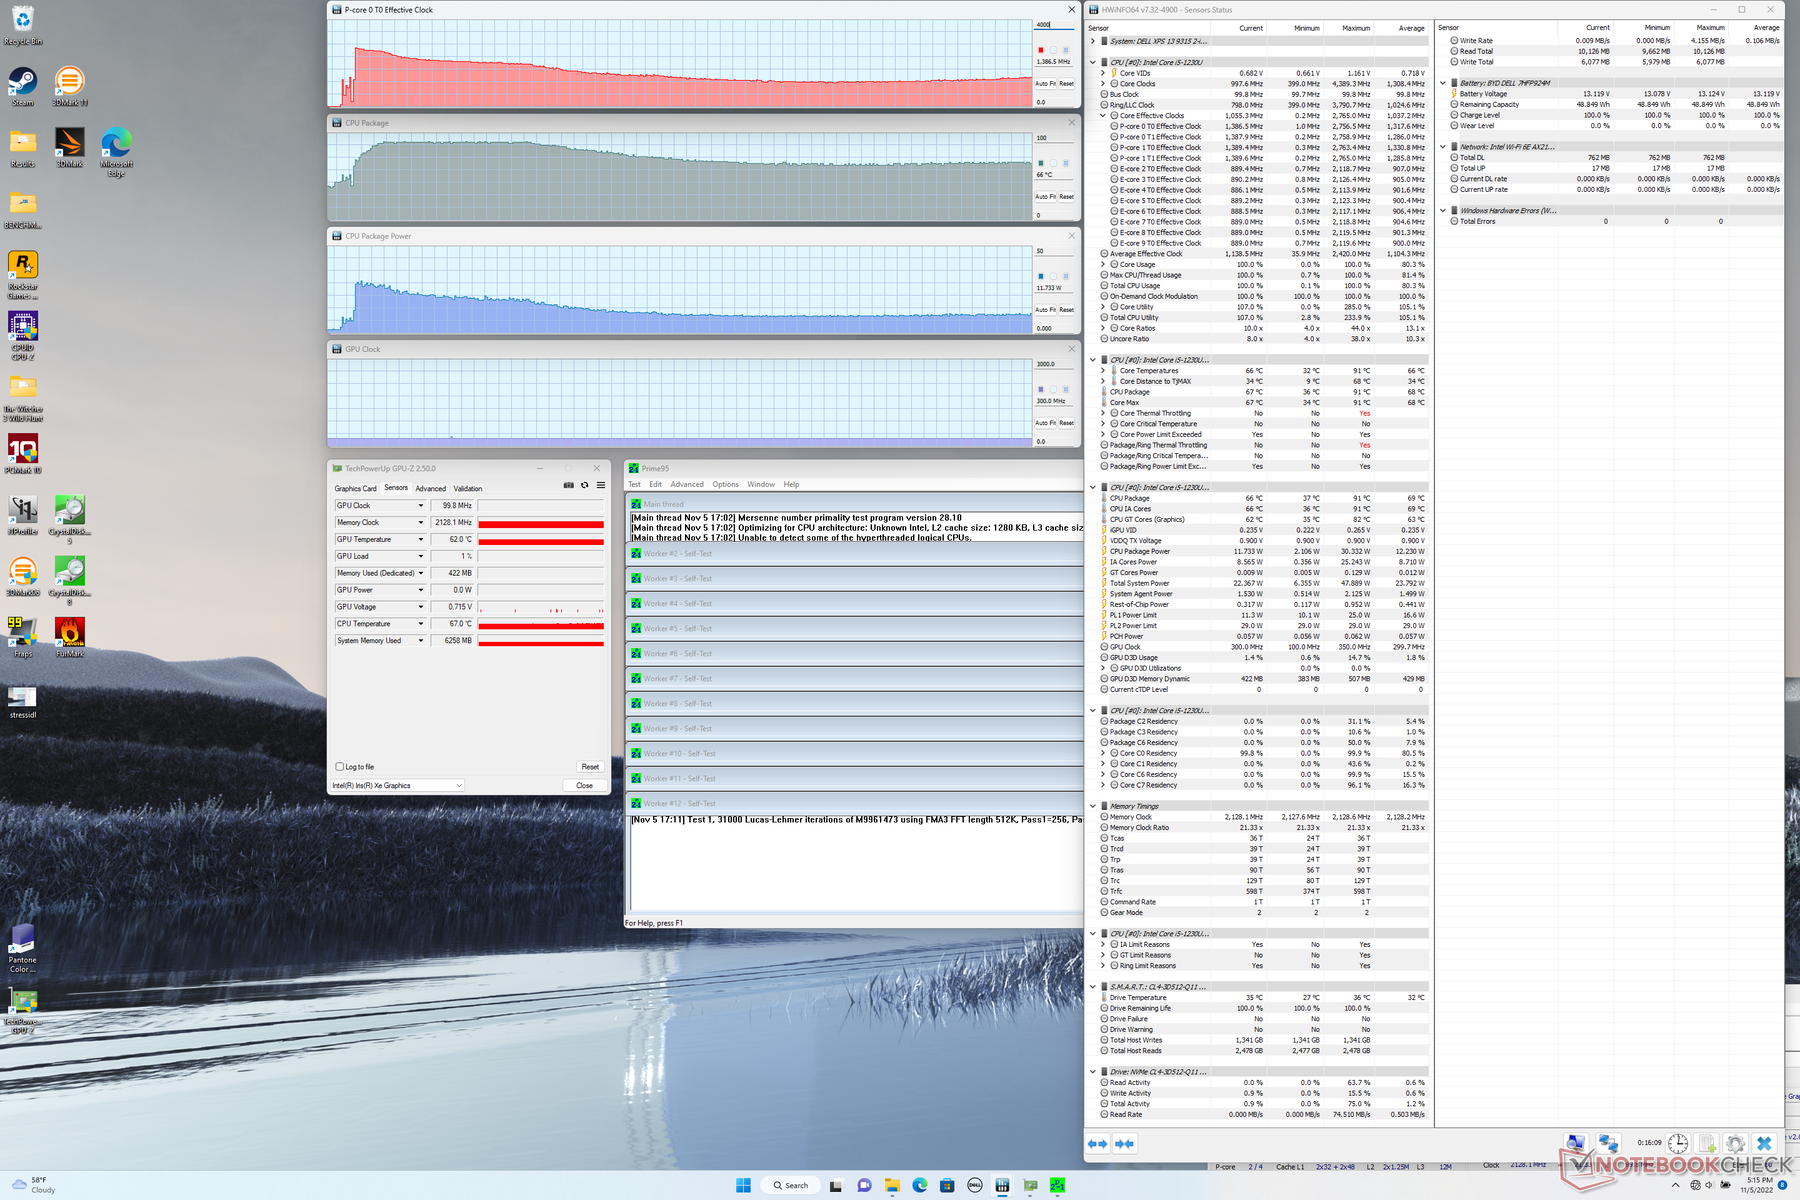
Stresstest
Under Prime95-stress ökar processorn till 2,7 GHz och 29 W i cirka 20 sekunder eller tills kärnans temperatur når 90 C. Därefter sjunker klockfrekvensen och strömförbrukningen stadigt för att slutligen stabiliseras på 1,4 GHz respektive 12 W, för att bibehålla en mycket svalare kärntemperatur på 66 C. De begränsade klockfrekvenserna är inte oväntade med tanke på den fläktlösa konstruktionen och formfaktorn för surfplattan. Om man upprepar det här testet på den fläktkylda Surface Pro 8 får man en högre CPU-strömförbrukning på 26 W, men med en liknande kärntemperatur på 65 C.
GPU-klockfrekvensen skulle stabiliseras vid 750 MHz när den körs på Witcher 3 jämfört med 1147 MHz på den mycket snabbare XPS 14 9320 Core i7 clamshell.
CPU-prestanda stryps inte på konstgjord väg om den körs på batteri. 3DMark 11-resultaten mellan batteri och nätström är nästan identiska.
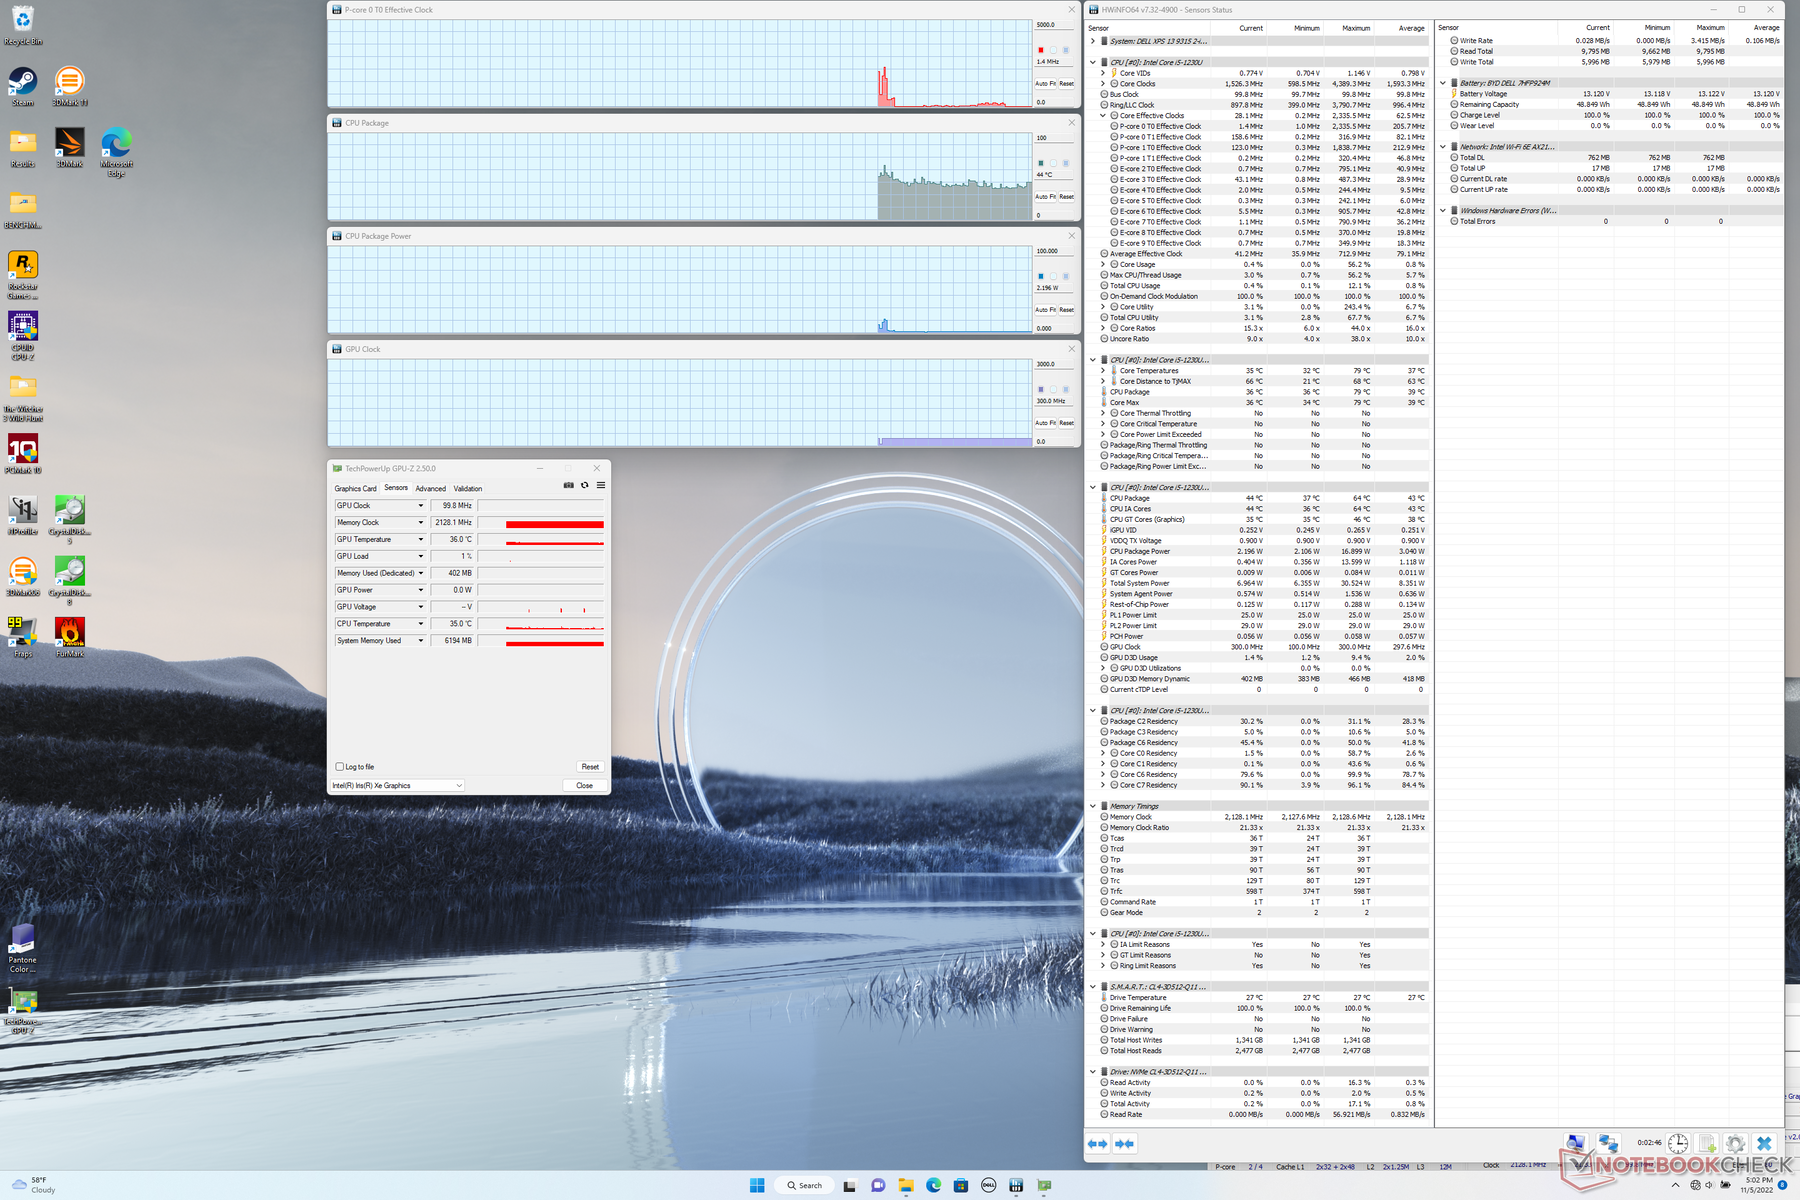
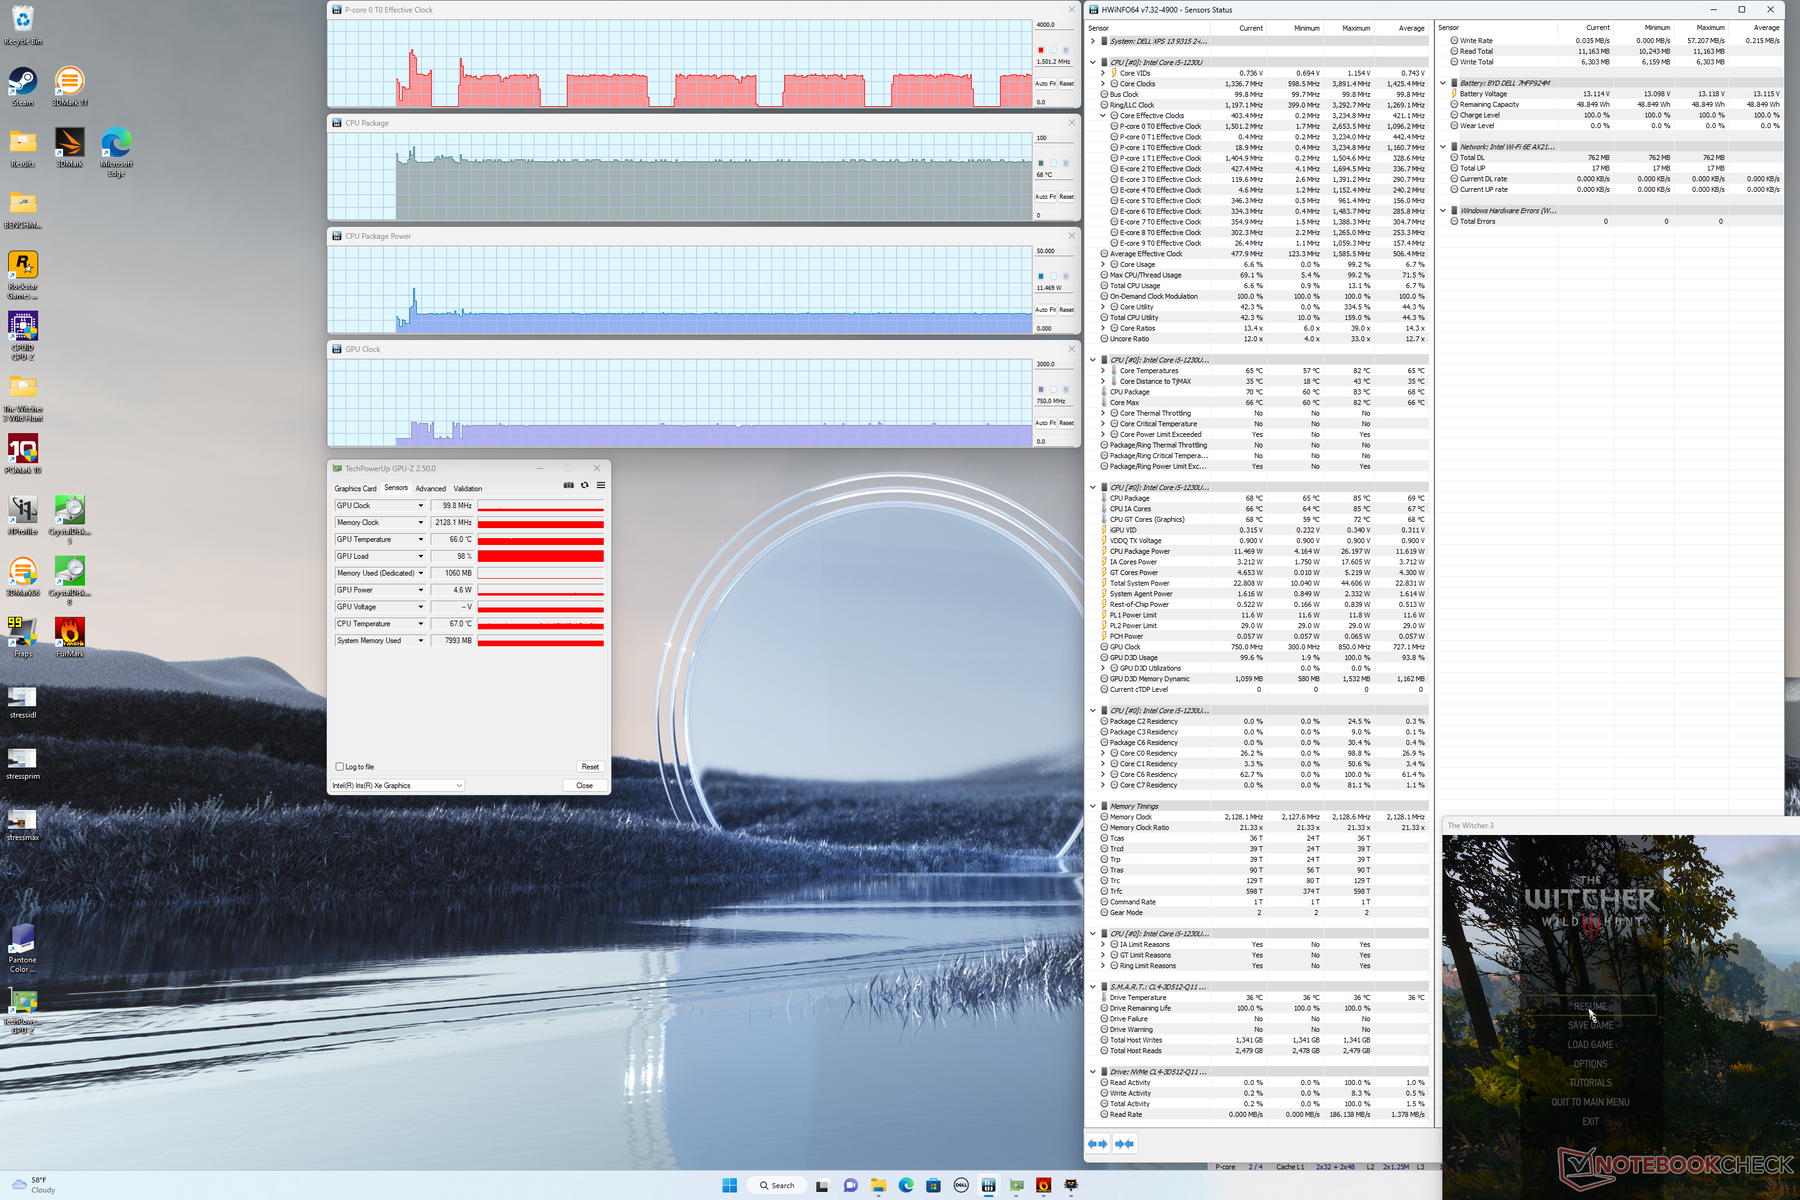
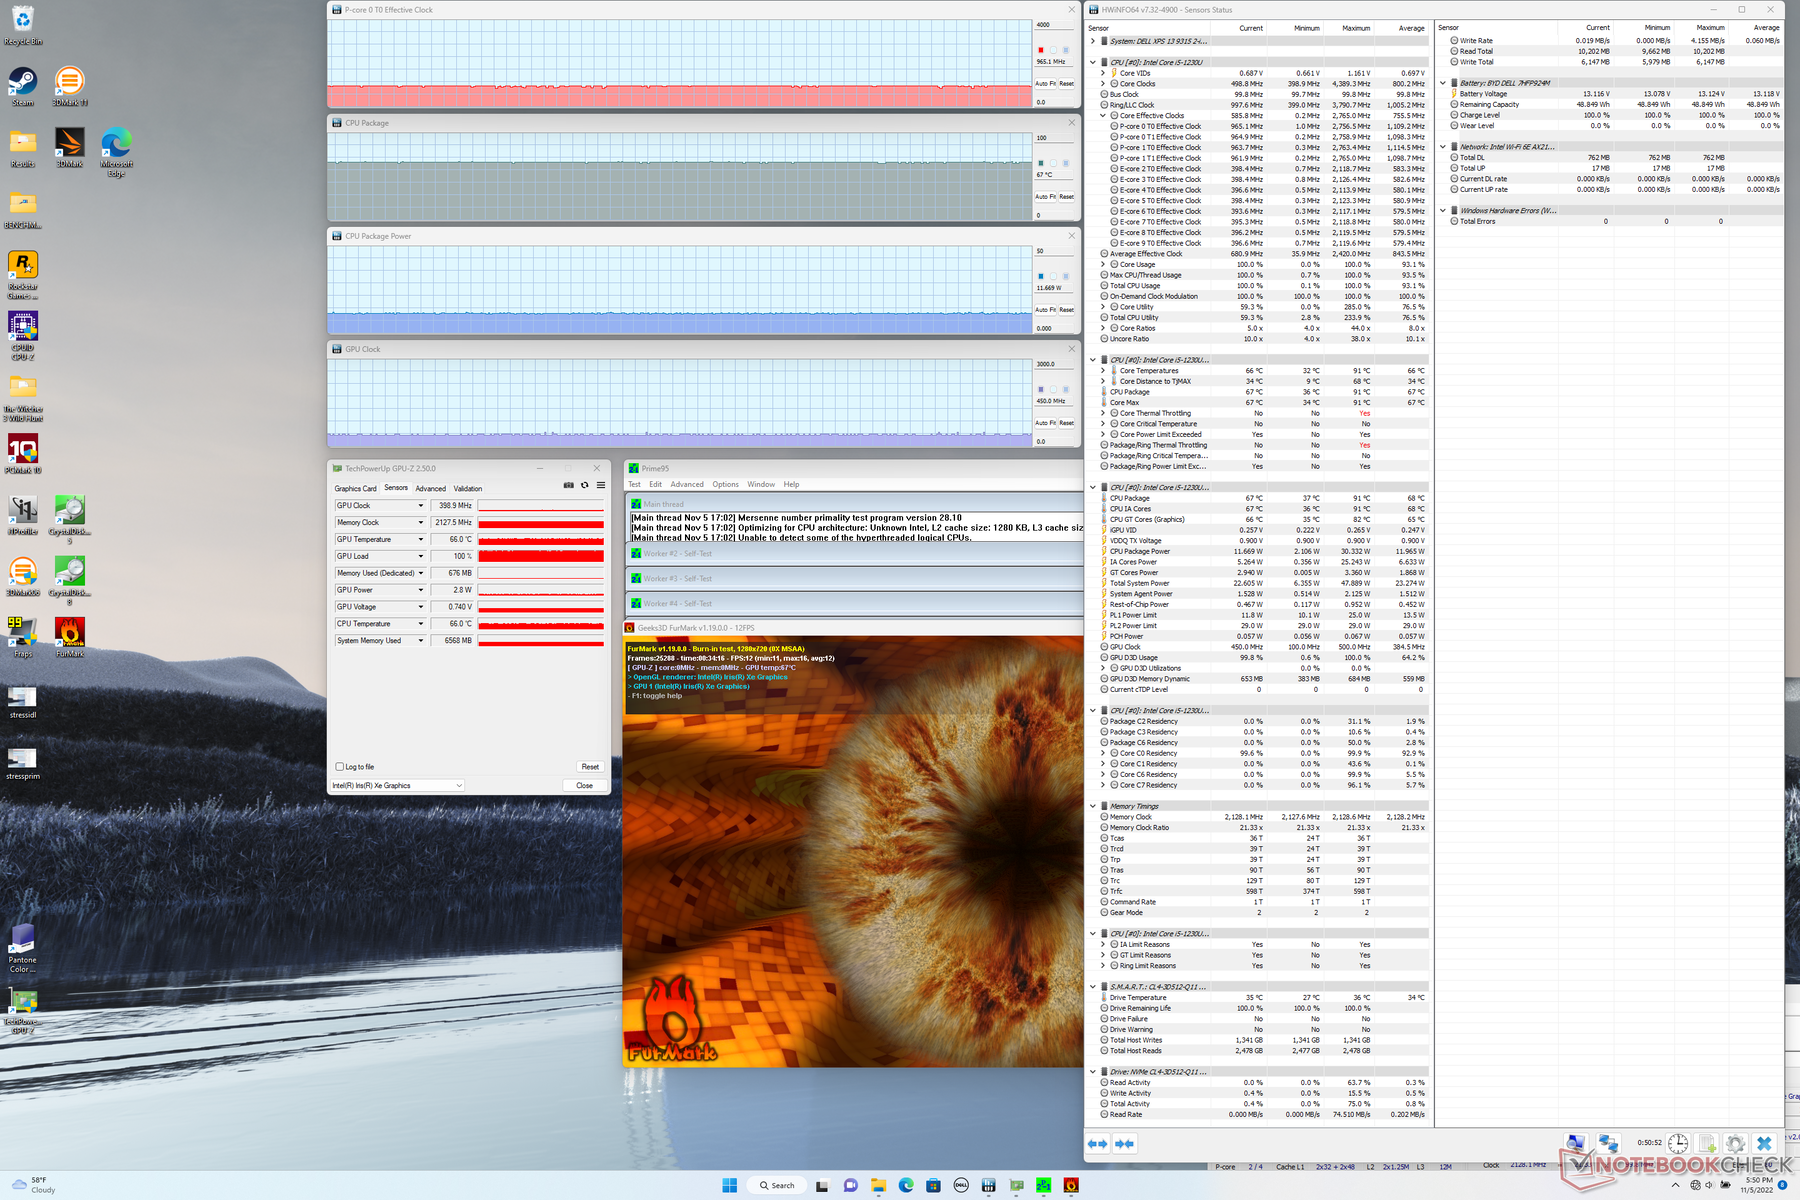
| CPU-klocka (GHz) | GPU-klocka (MHz) | Genomsnittlig CPU-temperatur (°C) | |
| Systemets tomgång | -- | -- | 44 |
| Prime95 Stress | 1.4 | -- | 66 |
| Prime95 + FurMark Stress | 1.0 | 450 | 67 |
| Witcher 3 Stress | ~1,5 | 750 | 68 |
Högtalare
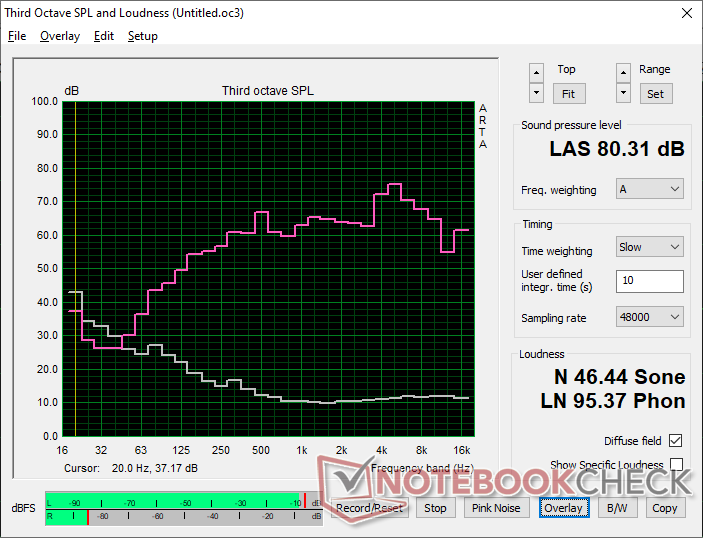
Dell XPS 13 9315 2-in-1 Core i5-1230U ljudanalys
(±) | högtalarljudstyrkan är genomsnittlig men bra (80.3 dB)
Bas 100 - 315 Hz
(±) | reducerad bas - i genomsnitt 8.9% lägre än medianen
(+) | basen är linjär (5.7% delta till föregående frekvens)
Mellan 400 - 2000 Hz
(+) | balanserad mellan - endast 2.2% från medianen
(+) | mids är linjära (5.2% delta till föregående frekvens)
Högsta 2 - 16 kHz
(±) | högre toppar - i genomsnitt 5.5% högre än medianen
(+) | toppar är linjära (6.8% delta till föregående frekvens)
Totalt 100 - 16 000 Hz
(+) | det totala ljudet är linjärt (11.9% skillnad mot median)
Jämfört med samma klass
» 11% av alla testade enheter i den här klassen var bättre, 3% liknande, 85% sämre
» Den bästa hade ett delta på 6%, genomsnittet var 20%, sämst var 57%
Jämfört med alla testade enheter
» 9% av alla testade enheter var bättre, 2% liknande, 89% sämre
» Den bästa hade ett delta på 4%, genomsnittet var 23%, sämst var 134%
Apple MacBook Pro 16 2021 M1 Pro ljudanalys
(+) | högtalare kan spela relativt högt (84.7 dB)
Bas 100 - 315 Hz
(+) | bra bas - bara 3.8% från medianen
(+) | basen är linjär (5.2% delta till föregående frekvens)
Mellan 400 - 2000 Hz
(+) | balanserad mellan - endast 1.3% från medianen
(+) | mids är linjära (2.1% delta till föregående frekvens)
Högsta 2 - 16 kHz
(+) | balanserade toppar - endast 1.9% från medianen
(+) | toppar är linjära (2.7% delta till föregående frekvens)
Totalt 100 - 16 000 Hz
(+) | det totala ljudet är linjärt (4.6% skillnad mot median)
Jämfört med samma klass
» 0% av alla testade enheter i den här klassen var bättre, 0% liknande, 100% sämre
» Den bästa hade ett delta på 5%, genomsnittet var 17%, sämst var 45%
Jämfört med alla testade enheter
» 0% av alla testade enheter var bättre, 0% liknande, 100% sämre
» Den bästa hade ett delta på 4%, genomsnittet var 23%, sämst var 134%
Energihantering - Mycket energisnålt
Effektförbrukning
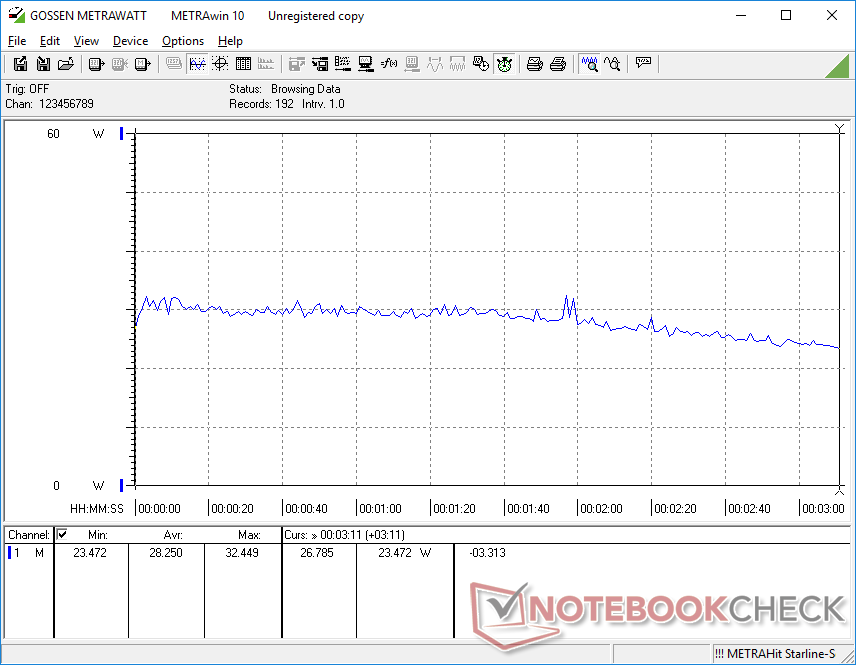
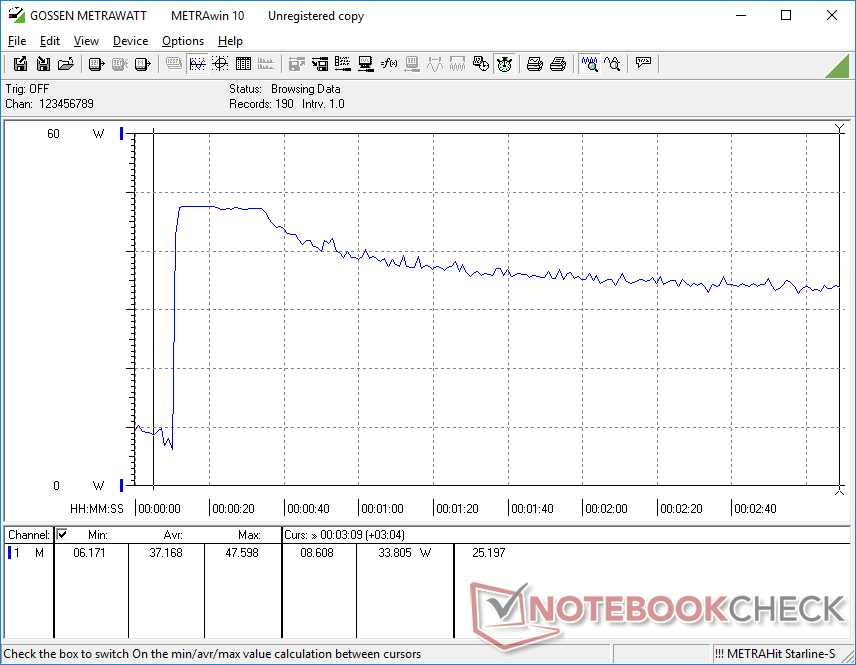
När den går på tomgång på skrivbordet med den lägsta ljusstyrkan förbrukar den bara 5 W, medan den högsta ljusstyrkan skulle förbruka cirka 3 W mer. Resultaten ligger mycket nära vad vi registrerade på ThinkBook Plus Gen 2 utrustad med samma Core i5-1230U-processor vid liknande belastning. Surface Pro 8 Core i7 drar över 50 procent mer ström vid hög belastning eftersom den har mycket snabbare grafikprestanda än vår Dell Core i5 SKU
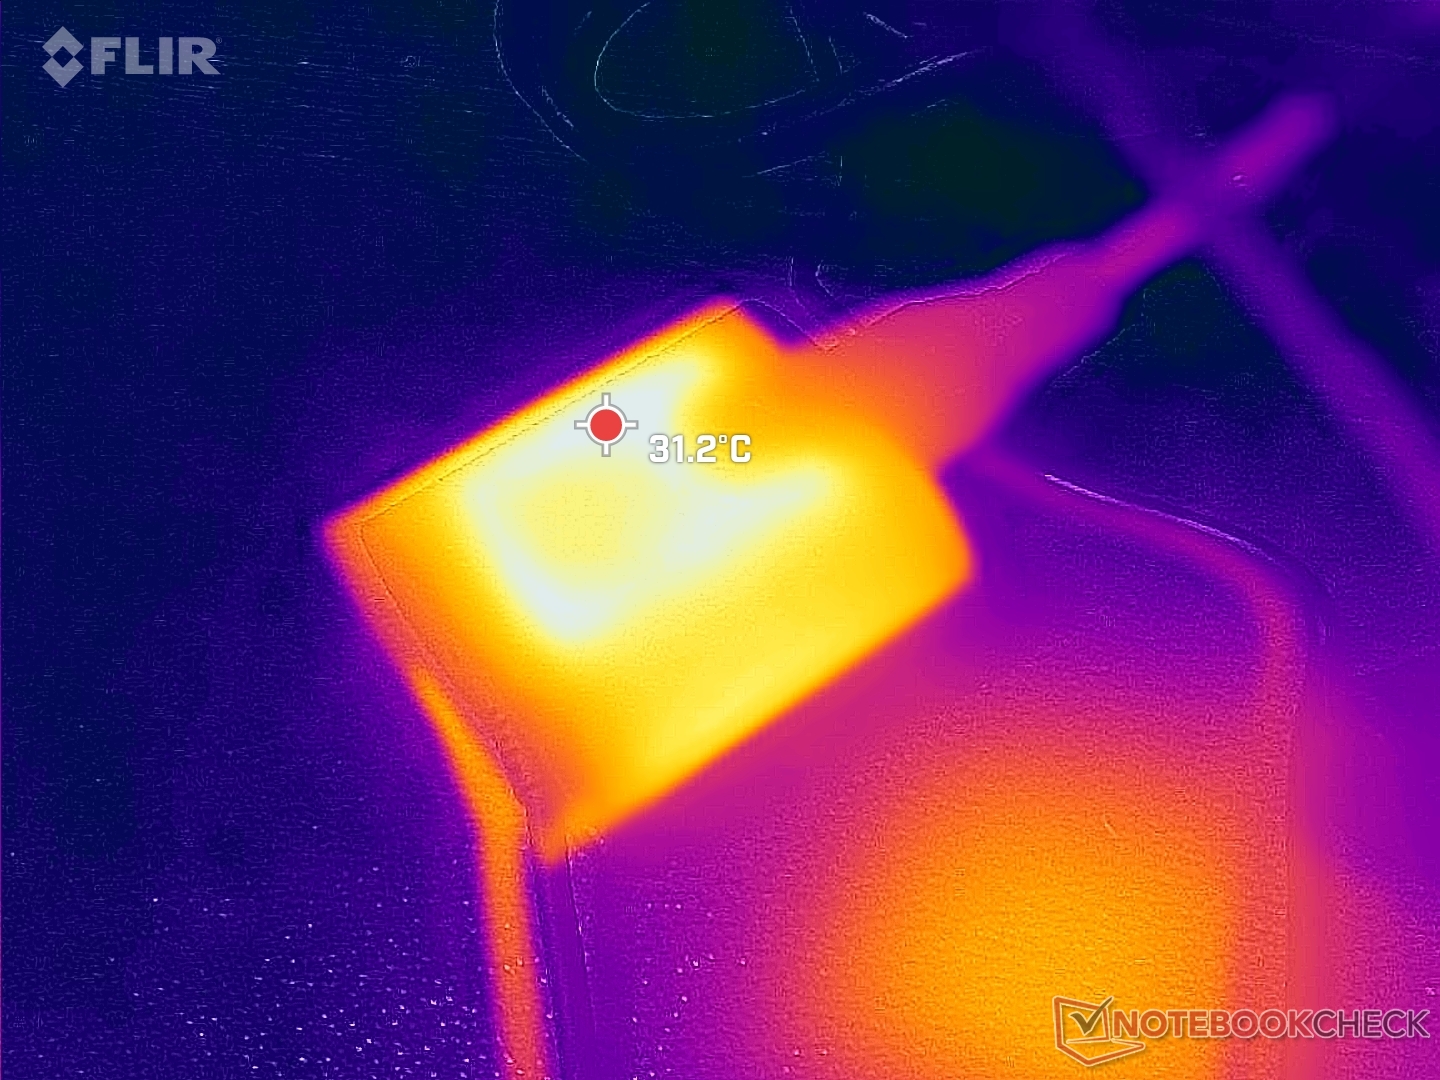
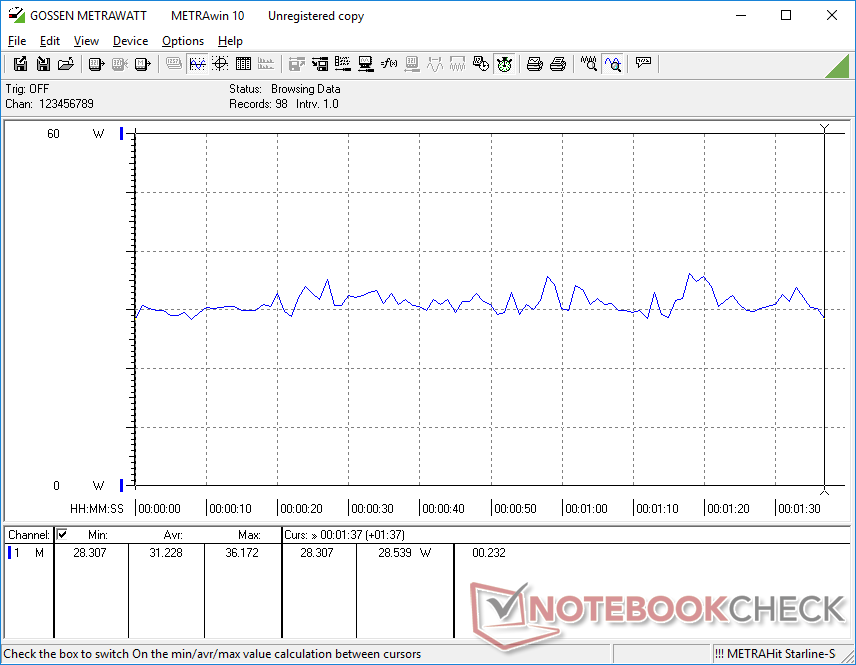
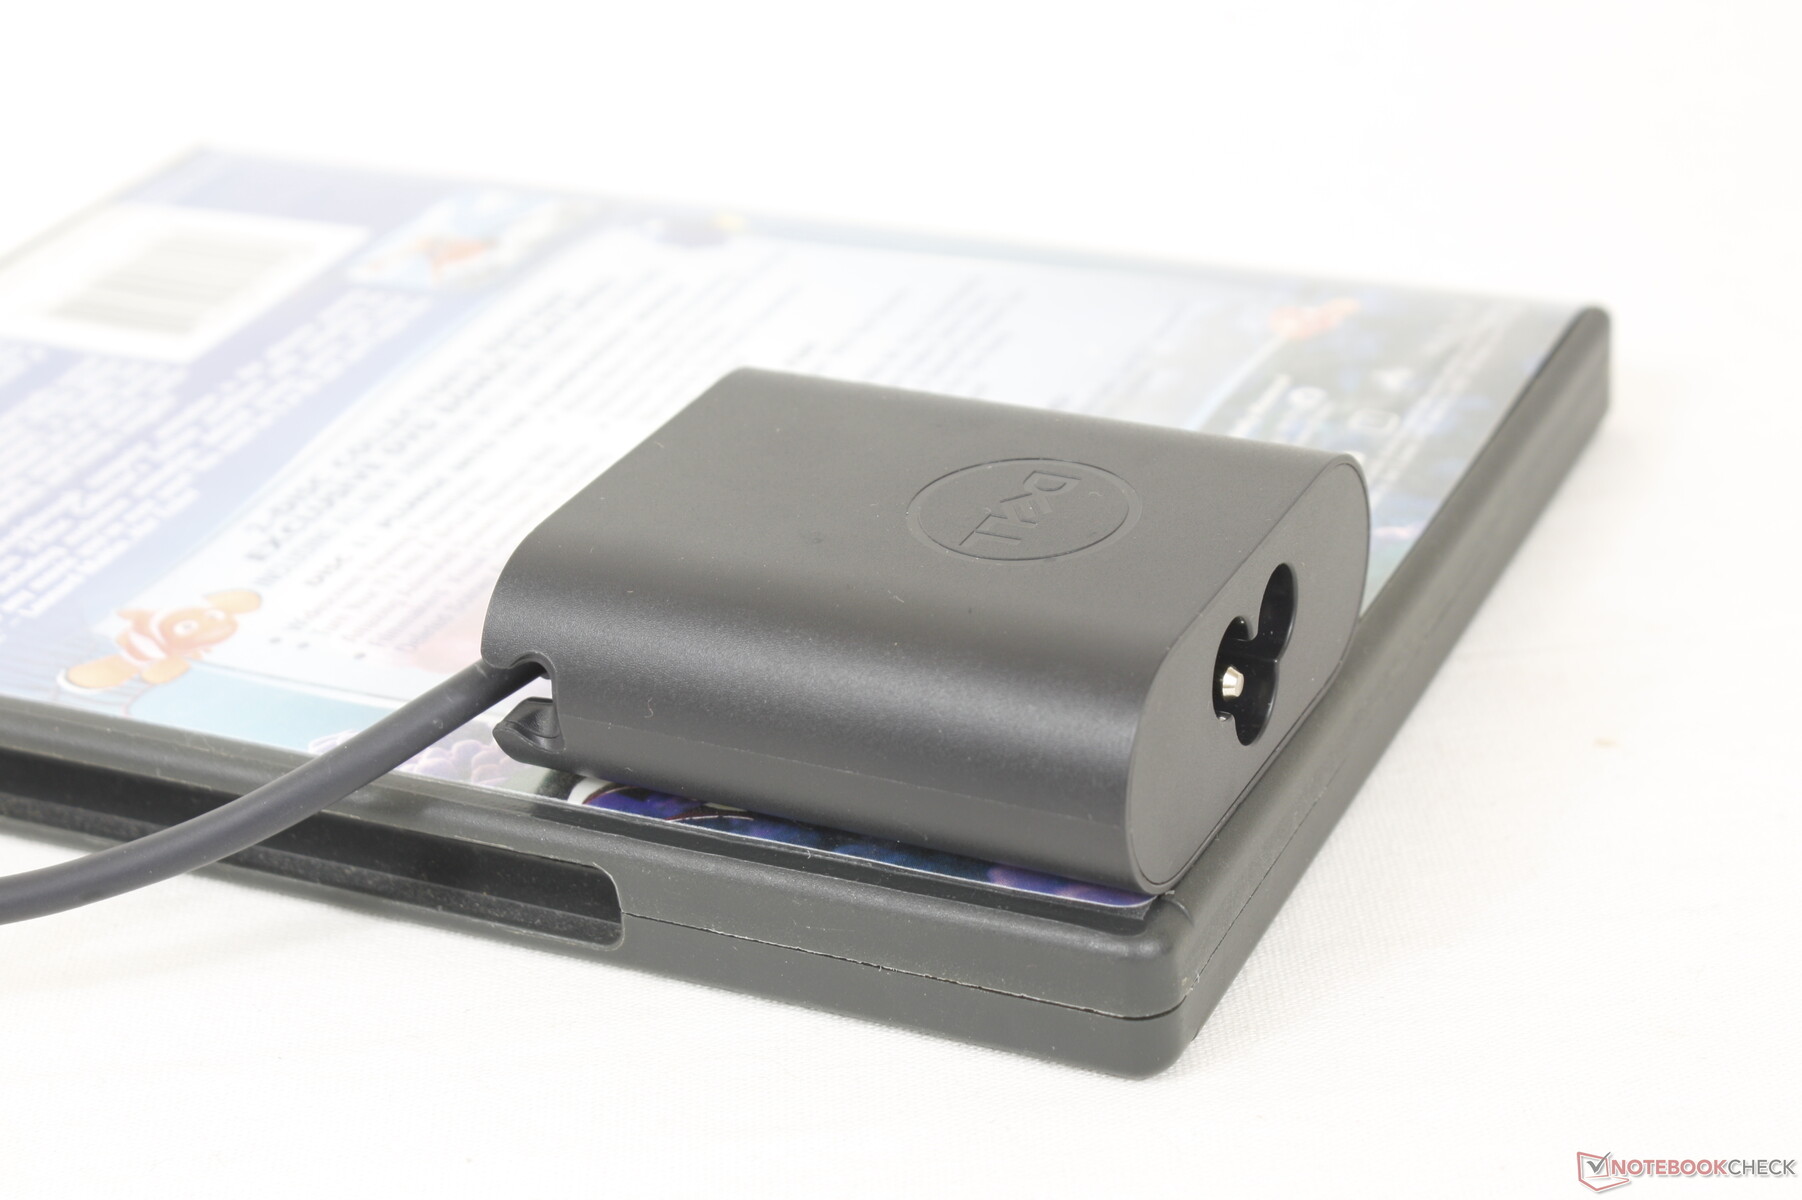
Vi kan registrera ett maximalt uttag på 48 W från den lilla (~6 x 5,5 x 2,2 cm) 45 W USB-C AC-adaptern. Den här hastigheten är endast tillfällig som framgår av våra grafer nedan eftersom CPU Turbo Boost är begränsad.

| Av/Standby | |
| Låg belastning | |
| Hög belastning |
|
Förklaring:
min: | |
| Dell XPS 13 9315 2-in-1 Core i5-1230U i5-1230U, Iris Xe G7 80EUs, , IPS, 2880x1920, 13" | Dell XPS 13 Plus 9320 i7-1280P OLED i7-1280P, Iris Xe G7 96EUs, WDC PC SN810 512GB, OLED, 3456x2160, 13.4" | Microsoft Surface Pro 8, i7-1185G7 i7-1185G7, Iris Xe G7 96EUs, Toshiba KBG40ZNS256G NVMe, IPS, 2880x1920, 13" | HP Spectre x360 13.5 14t-ef000 i7-1255U, Iris Xe G7 96EUs, Micron 3400 1TB MTFDKBA1T0TFH, OLED, 3000x2000, 13.5" | Lenovo ThinkBook Plus Gen2 Core i5 i5-1130G7, Iris Xe G7 80EUs, Samsung PM9A1 MZVL2512HCJQ, IPS, E-Ink, 2560x1600, 13.3" | Apple MacBook Air M2 Entry M2, M2 8-Core GPU, Apple SSD AP0256Z, IPS, 2560x1664, 13.6" | |
|---|---|---|---|---|---|---|
| Power Consumption | -46% | -23% | -19% | -5% | 13% | |
| Idle Minimum * (Watt) | 5.2 | 6.5 -25% | 3.9 25% | 4 23% | 5 4% | 1.87 64% |
| Idle Average * (Watt) | 7.9 | 7.8 1% | 8.5 -8% | 4.9 38% | 7.9 -0% | 9.2 -16% |
| Idle Maximum * (Watt) | 8 | 13 -63% | 9.8 -23% | 12.5 -56% | 8.3 -4% | 9.3 -16% |
| Load Average * (Watt) | 31.2 | 56.6 -81% | 48 -54% | 48.1 -54% | 30.9 1% | 28.5 9% |
| Witcher 3 ultra * (Watt) | 28.2 | 49.2 -74% | 41.5 -47% | 35.8 -27% | 25.2 11% | 27.4 3% |
| Load Maximum * (Watt) | 47.6 | 63 -32% | 63 -32% | 65.2 -37% | 66.8 -40% | 31 35% |
* ... mindre är bättre
Power Consumption Witcher 3 / Stresstest
Power Consumption external Monitor
Batteritid
Batteriet på 49,5 Wh är bara något mindre än batterierna på 51,5 Wh och 53 Wh i Surface Pro 8 respektive ThinkBook Plus Gen 2. Körtiderna är ändå utmärkta med nästan 9 timmars verklig WLAN-användning jämfört med ~8 timmar på de tidigare nämnda alternativen från Microsoft och Lenovo.
Laddning från tom till full kapacitet tar ungefär 2 till 2,5 timmar.
| Dell XPS 13 9315 2-in-1 Core i5-1230U i5-1230U, Iris Xe G7 80EUs, 49.5 Wh | Dell XPS 13 Plus 9320 i7-1280P OLED i7-1280P, Iris Xe G7 96EUs, 55 Wh | Microsoft Surface Pro 8, i7-1185G7 i7-1185G7, Iris Xe G7 96EUs, 51.5 Wh | HP Spectre x360 13.5 14t-ef000 i7-1255U, Iris Xe G7 96EUs, 66 Wh | Lenovo ThinkBook Plus Gen2 Core i5 i5-1130G7, Iris Xe G7 80EUs, 53 Wh | Apple MacBook Air M2 Entry M2, M2 8-Core GPU, 52.6 Wh | |
|---|---|---|---|---|---|---|
| Batteridrifttid | -36% | -28% | 16% | -16% | 45% | |
| Reader / Idle (h) | 13.6 | 20.4 50% | ||||
| WiFi v1.3 (h) | 9 | 5.8 -36% | 7.6 -16% | 8 -11% | 7.6 -16% | 15.2 69% |
| Load (h) | 2 | 1.2 -40% | 2.2 10% | 2.4 20% | ||
| H.264 (h) | 10.1 | 16.5 |
För
Emot
Slutsats - XPS eller Surface Pro?
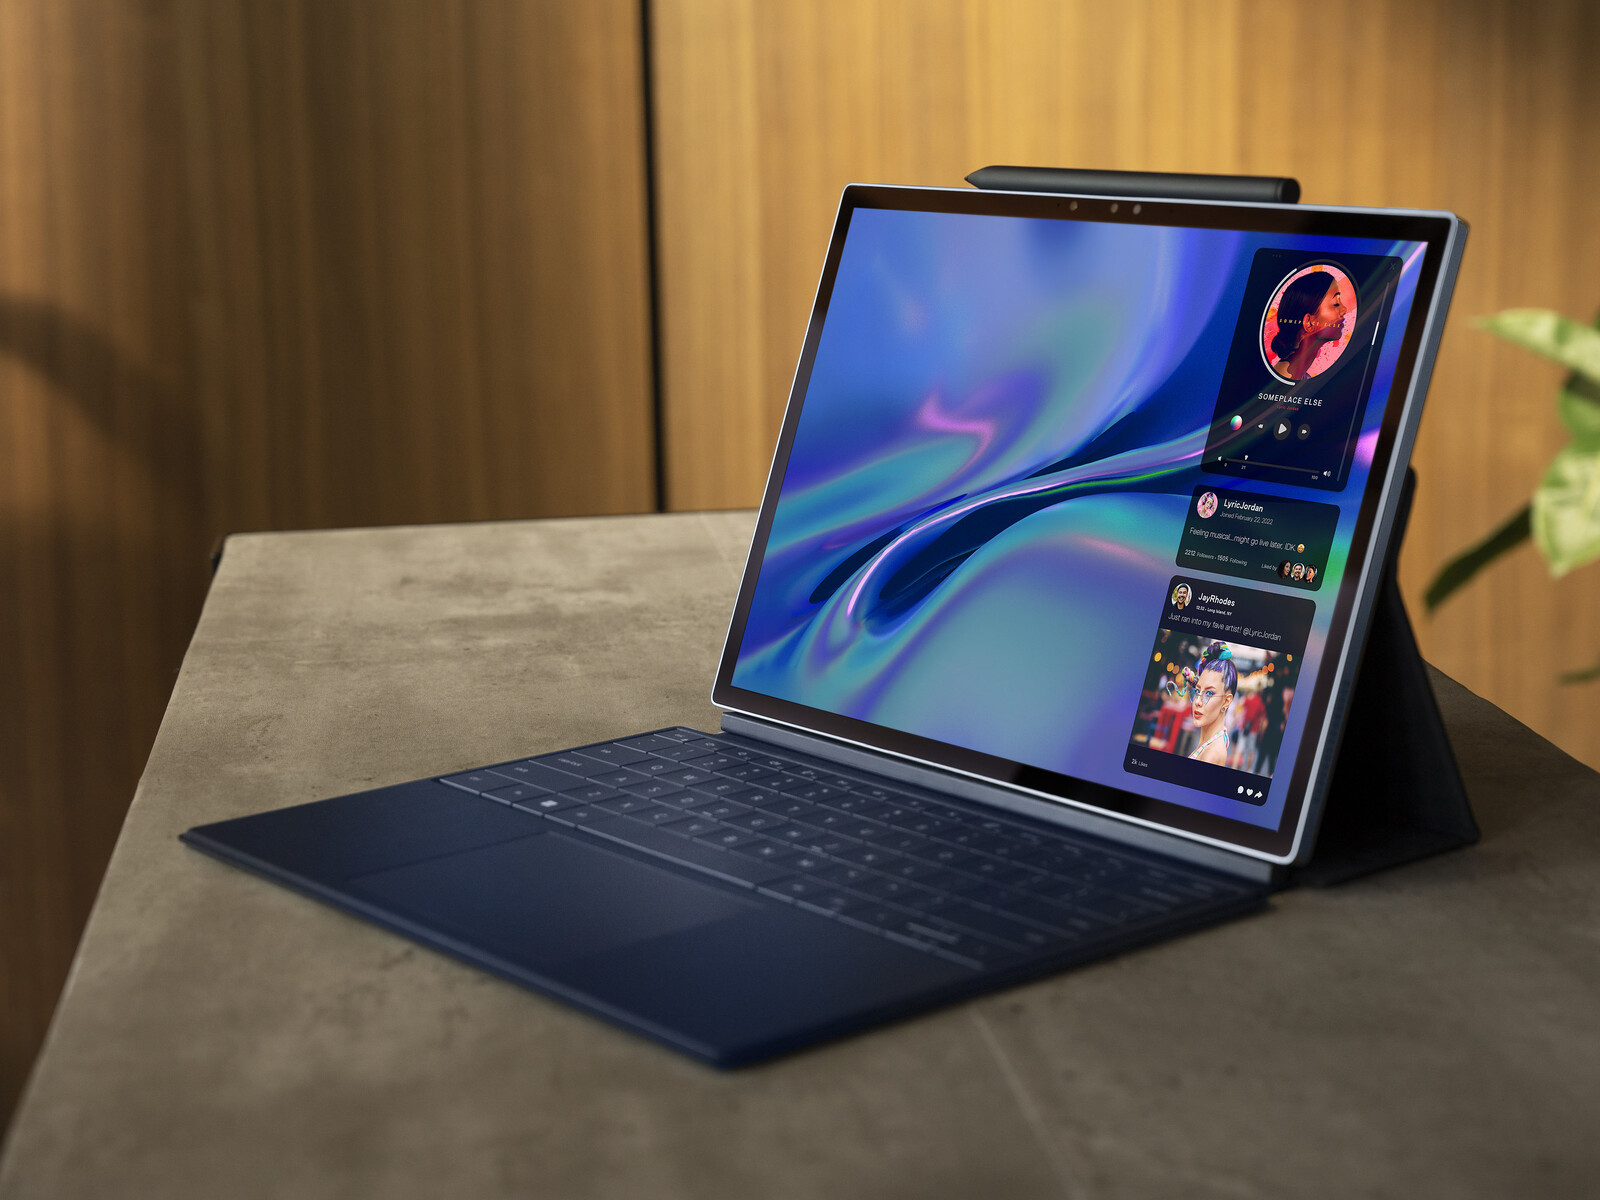
XPS 13 9315 2-i-1 är den bästa konkurrenten hittills till Microsoft Surface Pro serien. Vissa aspekter är bättre än Microsoftmodellen medan andra är sämre. Särskilt den avtagbara tangentbordsbasen erbjuder fastare tangentbordstangenter, en större klickplatta och bättre skydd mot repor. Själva surfplattan är också tunnare och lättare än Surface Pro 8 utan att behöva göra drastiska nedskärningar i processorprestanda. Faktum är att Core i5-1230U i Dell presterar på samma sätt som Core i7-1185G7 i Surface Pro 8, trots Dells fläktlösa konstruktion. Tillverkaren lovar också 5G eSIM SKUs inom en snar framtid medan inga sådana alternativ finns för Surface Pro i skrivande stund
Det finns fortfarande en handfull skäl att överväga Microsoftmodellen istället för Dell. För det första integrerar Surface Pro 8 ett 3,5 mm-ljuduttag, vilket vissa användare kanske uppskattar. Grafikprestandan är också betydligt snabbare då GPU:n i Dell tenderar att underprestera även mot andra bärbara datorer med liknande integrerad grafik. Avsaknaden av några 120 Hz-skärmalternativ är kanske det mest påtagliga eftersom det får Dell-tabletten att kännas klumpigare och mindre responsiv. Begränsningen på 60 Hz var inget stort problem tidigare, men det blir mer av ett handikapp nu när bärbara datorer, skärmar och smartphones med hög uppdateringsfrekvens är vanliga
En Surface Pro utan namnet Surface Pro. XPS 13 9315 2-i-1 överträffar Microsoft Surface Pro Type Cover när det gäller komfort, men 60 Hz-pekskärmen känns daterad bredvid Surface Pro 8 med 120 Hz.
Om du tänker skriva mycket och skicka e-post kan XPS 13 9315 2-in-1 vara det bättre alternativet på grund av dess överlägsna tangentbordsdockning. Om du tänker använda pekskärmen i surfplatteläge oftare är den högre uppdateringsfrekvensen och responsiviteten hos Surface Pro-skärmen svår att avstå från. Om Dell kan erbjuda ytterligare skärmalternativ i framtiden kan dess XPS 13 9315 2-i-1-serie bli en mycket enklare rekommendation för fler användningsscenarier.
Pris och tillgänglighet
XPS 13 9315 2-i-1 kommer att bli allmänt tillgänglig den 14 november. Återförsäljare som Amazon listar redan vissa SKU:er för förhandsbeställning. Det bästa stället att beställa just nu är via Dell där börjar på 1 000 USD utan tangentbordsdockning eller penna.
Dell XPS 13 9315 2-in-1 Core i5-1230U
- 11/08/2022 v7 (old)
Allen Ngo
Price comparison

