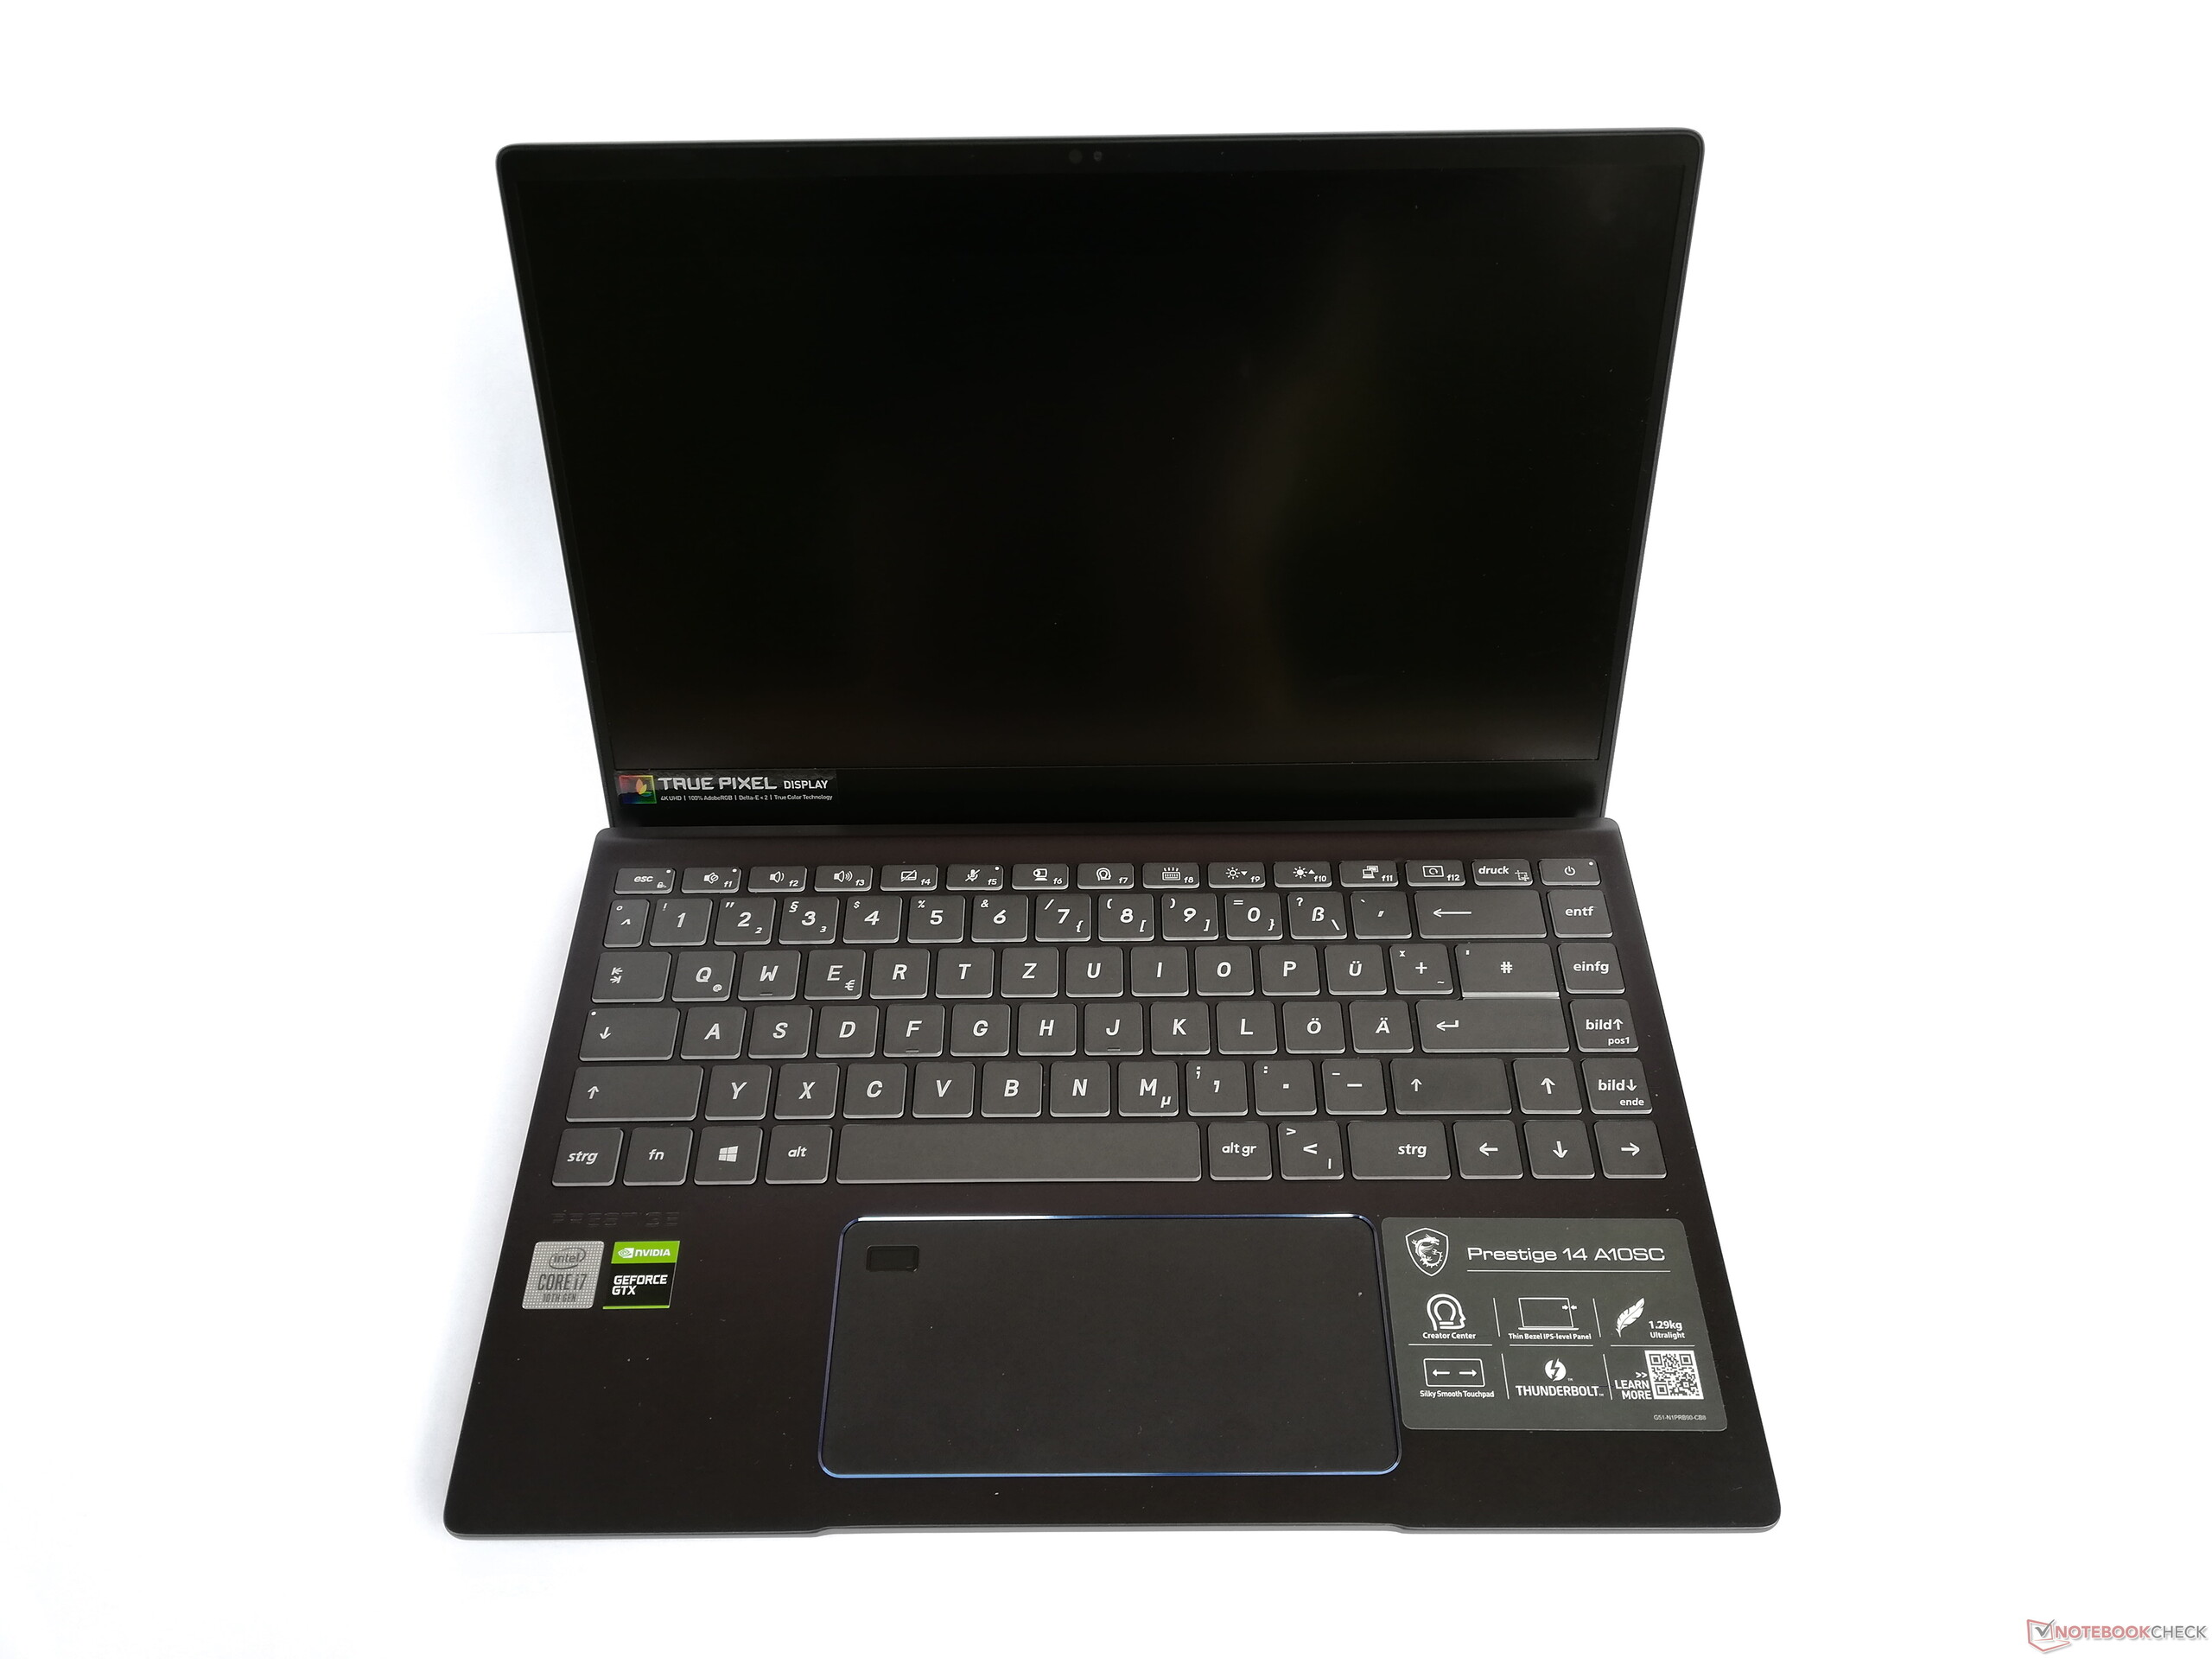
Test: MSI Prestige 14 A10SC-009 - Comet Lake för kreatörer (Sammanfattning)
Gradering | Datum | Modell | Vikt | Höjd | Storlek | Upplösning | Pris |
|---|---|---|---|---|---|---|---|
| 84.2 % v7 (old) | 02/2020 | MSI Prestige 14 A10SC-009 i7-10710U, GeForce GTX 1650 Max-Q | 1.3 kg | 16 mm | 14.00" | 3840x2160 | |
| 85.2 % v7 (old) | 11/2019 | MSI Prestige 15 A10SC i7-10710U, GeForce GTX 1650 Max-Q | 1.7 kg | 16 mm | 15.60" | 3840x2160 | |
| 83.7 % v7 (old) | 11/2019 | Razer Blade Stealth 13, Core i7-1065G7 i7-1065G7, GeForce GTX 1650 Max-Q | 1.5 kg | 15.3 mm | 13.30" | 3840x2160 | |
| 83.1 % v7 (old) | 10/2019 | Asus ZenBook 15 UX534FT-DB77 i7-8565U, GeForce GTX 1650 Max-Q | 1.7 kg | 18.9 mm | 15.60" | 1920x1080 | |
| 80.8 % v7 (old) | 10/2019 | HP ZBook 15u G6 6TP54EA i7-8565U, Radeon Pro WX 3200 | 1.6 kg | 19 mm | 15.60" | 3840x2160 |
| SD Card Reader | |
| average JPG Copy Test (av. of 3 runs) | |
| MSI Prestige 15 A10SC (Toshiba Exceria Pro M501 UHS-II) | |
| MSI Prestige 14 A10SC-009 (Toshiba Exceria Pro M501 microSDXC 64GB) | |
| Genomsnitt av klass Multimedia (23 - 531, n=36, senaste 2 åren) | |
| Asus ZenBook 15 UX534FT-DB77 (Toshiba Exceria Pro SDXC 64 GB UHS-II) | |
| maximum AS SSD Seq Read Test (1GB) | |
| Genomsnitt av klass Multimedia (37.3 - 1455, n=35, senaste 2 åren) | |
| MSI Prestige 15 A10SC (Toshiba Exceria Pro M501 UHS-II) | |
| MSI Prestige 14 A10SC-009 (Toshiba Exceria Pro M501 microSDXC 64GB) | |
| Asus ZenBook 15 UX534FT-DB77 (Toshiba Exceria Pro SDXC 64 GB UHS-II) | |
| |||||||||||||||||||||||||
Distribution av ljusstyrkan: 86 %
Mitt på batteriet: 567 cd/m²
Kontrast: 1274:1 (Svärta: 0.445 cd/m²)
ΔE ColorChecker Calman: 1.55 | ∀{0.5-29.43 Ø4.71}
calibrated: 1.24
ΔE Greyscale Calman: 1.48 | ∀{0.09-98 Ø4.96}
Gamma: 2.19
CCT: 6741 K
| MSI Prestige 14 A10SC-009 IPS, 3840x2160, 14" | MSI Prestige 15 A10SC Sharp LQ156D1JW42, IPS, 3840x2160, 15.6" | Razer Blade Stealth 13, Core i7-1065G7 AUO202B, IPS LED, 3840x2160, 13.3" | Asus ZenBook 15 UX534FT-DB77 BOE NV156FHM-N63, IPS, 1920x1080, 15.6" | HP ZBook 15u G6 6TP54EA AU Optronics AUO30EB, IPS, 3840x2160, 15.6" | |
|---|---|---|---|---|---|
| Display | |||||
| Display P3 Coverage (%) | 82 | 64.3 | 66.6 | 69.2 | |
| sRGB Coverage (%) | 98.3 | 95.8 | 87.7 | 97.1 | |
| AdobeRGB 1998 Coverage (%) | 96.2 | 65.7 | 64.1 | 69.7 | |
| Response Times | -12% | -11% | 17% | -4% | |
| Response Time Grey 50% / Grey 80% * (ms) | 55 ? | 60 ? -9% | 62 ? -13% | 41.2 ? 25% | 68.8 ? -25% |
| Response Time Black / White * (ms) | 36 ? | 41.2 ? -14% | 39 ? -8% | 33.2 ? 8% | 29.6 18% |
| PWM Frequency (Hz) | 26040 ? | ||||
| Screen | -42% | -55% | -100% | -49% | |
| Brightness middle (cd/m²) | 567 | 464.5 -18% | 353 -38% | 312.6 -45% | 451 -20% |
| Brightness (cd/m²) | 516 | 451 -13% | 335 -35% | 290 -44% | 434 -16% |
| Brightness Distribution (%) | 86 | 92 7% | 90 5% | 85 -1% | 89 3% |
| Black Level * (cd/m²) | 0.445 | 0.5 -12% | 0.25 44% | 0.31 30% | 0.25 44% |
| Contrast (:1) | 1274 | 929 -27% | 1412 11% | 1008 -21% | 1804 42% |
| Colorchecker dE 2000 * | 1.55 | 3.36 -117% | 4.4 -184% | 5.78 -273% | 4.4 -184% |
| Colorchecker dE 2000 max. * | 5.14 | 7.06 -37% | 7.21 -40% | 8.86 -72% | 6.7 -30% |
| Colorchecker dE 2000 calibrated * | 1.24 | 3.42 -176% | 1.1 11% | 3.78 -205% | 1.8 -45% |
| Greyscale dE 2000 * | 1.48 | 1.3 12% | 5.49 -271% | 5.4 -265% | 5 -238% |
| Gamma | 2.19 100% | 2.14 103% | 2.26 97% | 2.21 100% | 2.31 95% |
| CCT | 6741 96% | 6596 99% | 7689 85% | 7864 83% | 7717 84% |
| Color Space (Percent of AdobeRGB 1998) (%) | 84.8 | 61 | 57.1 | 63 | |
| Color Space (Percent of sRGB) (%) | 98.3 | 96 | 87.4 | 97 | |
| Totalt genomsnitt (program/inställningar) | -27% /
-37% | -33% /
-47% | -42% /
-78% | -27% /
-41% |
* ... mindre är bättre
Visa svarstider
| ↔ Svarstid svart till vitt | ||
|---|---|---|
| 36 ms ... stiga ↗ och falla ↘ kombinerat | ↗ 22 ms stiga | 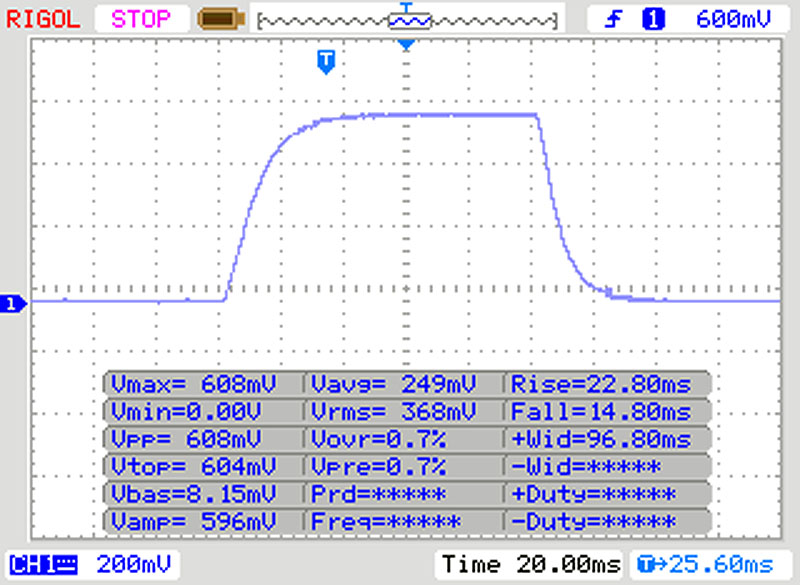 |
| ↘ 14 ms hösten | ||
| Skärmen visar långsamma svarsfrekvenser i våra tester och kommer att vara otillfredsställande för spelare. I jämförelse sträcker sig alla testade enheter från 0.1 (minst) till 240 (maximalt) ms. » 94 % av alla enheter är bättre. Detta innebär att den uppmätta svarstiden är sämre än genomsnittet av alla testade enheter (19.8 ms). | ||
| ↔ Svarstid 50 % grått till 80 % grått | ||
| 55 ms ... stiga ↗ och falla ↘ kombinerat | ↗ 27 ms stiga | 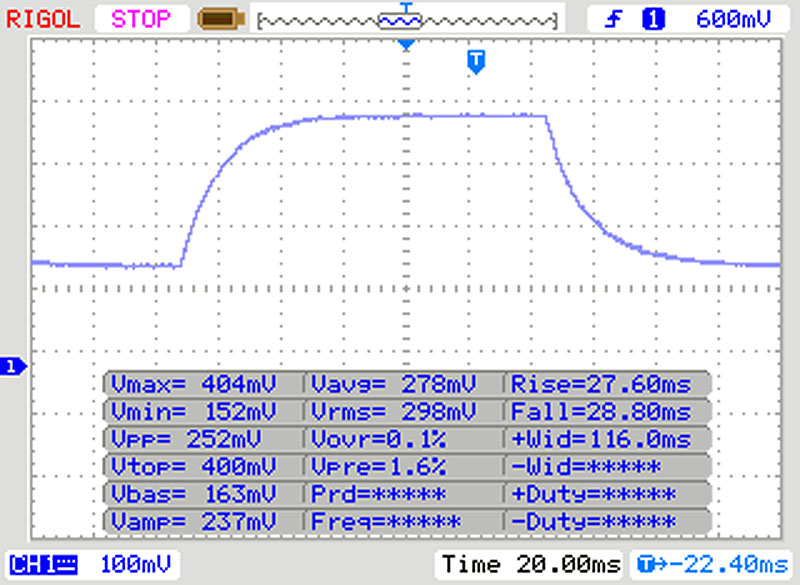 |
| ↘ 28 ms hösten | ||
| Skärmen visar långsamma svarsfrekvenser i våra tester och kommer att vara otillfredsställande för spelare. I jämförelse sträcker sig alla testade enheter från 0.165 (minst) till 636 (maximalt) ms. » 92 % av alla enheter är bättre. Detta innebär att den uppmätta svarstiden är sämre än genomsnittet av alla testade enheter (30.9 ms). | ||
Skärmflimmer / PWM (Puls-Width Modulation)
| Skärmflimmer / PWM upptäcktes inte | 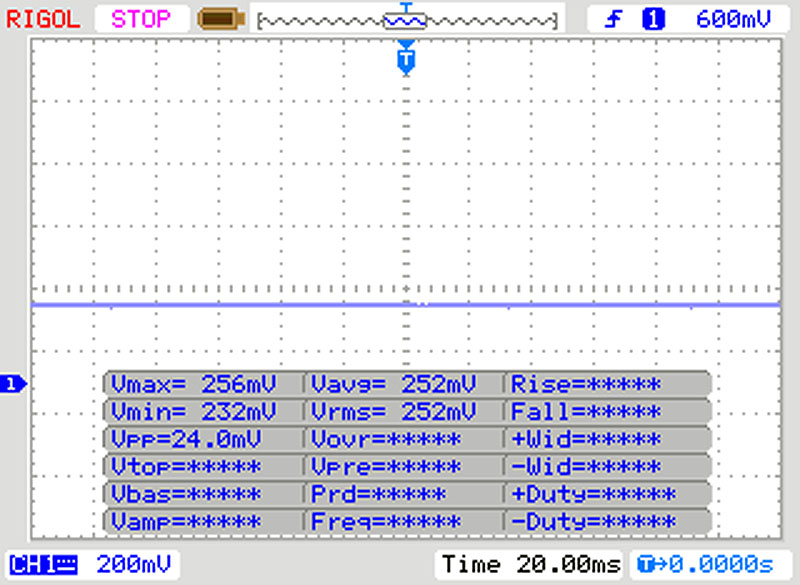 | ||
Som jämförelse: 52 % av alla testade enheter använder inte PWM för att dämpa skärmen. Om PWM upptäcktes mättes ett medelvärde av 7741 (minst: 5 - maximum: 343500) Hz. | |||
| PCMark 8 Home Score Accelerated v2 | 3511 poäng | |
| PCMark 8 Work Score Accelerated v2 | 4422 poäng | |
| PCMark 10 Score | 5150 poäng | |
Hjälp | ||
| MSI Prestige 14 A10SC-009 Samsung SSD PM981 MZVLB1T0HALR | MSI Prestige 15 A10SC Samsung SSD PM981 MZVLB1T0HALR | Razer Blade Stealth 13, Core i7-1065G7 Lite-On CA3-8D512 | Asus ZenBook 15 UX534FT-DB77 Samsung SSD PM981 MZVLB1T0HALR | HP ZBook 15u G6 6TP54EA Samsung SSD PM981 MZVLB512HAJQ | Genomsnitt Samsung SSD PM981 MZVLB1T0HALR | |
|---|---|---|---|---|---|---|
| CrystalDiskMark 5.2 / 6 | -14% | 10% | 6% | -6% | 2% | |
| Write 4K (MB/s) | 163.8 | 150.8 -8% | 153 -7% | 141.6 -14% | 156 -5% | 165.7 ? 1% |
| Read 4K (MB/s) | 48.6 | 47.3 -3% | 59.5 22% | 45.28 -7% | 45.73 -6% | 44.6 ? -8% |
| Write Seq (MB/s) | 2269 | 981 -57% | 1608 -29% | 1975 -13% | 1158 -49% | 1982 ? -13% |
| Read Seq (MB/s) | 1963 | 976 -50% | 2293 17% | 2272 16% | 1132 -42% | 1764 ? -10% |
| Write 4K Q32T1 (MB/s) | 289.8 | 442.7 53% | 497 71% | 458.6 58% | 369.2 27% | 395 ? 36% |
| Read 4K Q32T1 (MB/s) | 373.6 | 499.7 34% | 544 46% | 391.4 5% | 573 53% | 434 ? 16% |
| Write Seq Q32T1 (MB/s) | 2395 | 1706 -29% | 1640 -32% | 2393 0% | 1969 -18% | 2351 ? -2% |
| Read Seq Q32T1 (MB/s) | 3479 | 1758 -49% | 3158 -9% | 3464 0% | 3138 -10% | 3234 ? -7% |
| Write 4K Q8T8 (MB/s) | 960 | 1408 ? | ||||
| Read 4K Q8T8 (MB/s) | 844 | 1449 ? | ||||
| AS SSD | -15% | -26% | -13% | 2% | -4% | |
| Seq Read (MB/s) | 2300 | 1274 -45% | 2666 16% | 1887 -18% | 2083 -9% | 1993 ? -13% |
| Seq Write (MB/s) | 2051 | 1395 -32% | 1497 -27% | 1432 -30% | 1715 -16% | 2036 ? -1% |
| 4K Read (MB/s) | 46.23 | 50.3 9% | 53.7 16% | 52.3 13% | 55.3 20% | 46.4 ? 0% |
| 4K Write (MB/s) | 84.6 | 119.8 42% | 133.7 58% | 146 73% | 137.6 63% | 109.7 ? 30% |
| 4K-64 Read (MB/s) | 1552 | 1599 3% | 652 -58% | 969 -38% | 1211 -22% | 1502 ? -3% |
| 4K-64 Write (MB/s) | 1789 | 1455 -19% | 272 -85% | 1375 -23% | 1446 -19% | 1625 ? -9% |
| Access Time Read * (ms) | 0.049 | 0.044 10% | 0.075 -53% | 0.034 31% | 0.039 20% | 0.05158 ? -5% |
| Access Time Write * (ms) | 0.045 | 0.092 -104% | 0.032 29% | 0.075 -67% | 0.026 42% | 0.05581 ? -24% |
| Score Read (Points) | 1828 | 1777 -3% | 972 -47% | 1210 -34% | 1474 -19% | 1747 ? -4% |
| Score Write (Points) | 2079 | 1714 -18% | 555 -73% | 1664 -20% | 1755 -16% | 1942 ? -7% |
| Score Total (Points) | 4831 | 4411 -9% | 1982 -59% | 3483 -28% | 3976 -18% | 4588 ? -5% |
| Totalt genomsnitt (program/inställningar) | -15% /
-14% | -8% /
-11% | -4% /
-5% | -2% /
-1% | -1% /
-1% |
* ... mindre är bättre

| 3DMark 11 Performance | 10232 poäng | |
| 3DMark Cloud Gate Standard Score | 14259 poäng | |
| 3DMark Fire Strike Score | 6517 poäng | |
Hjälp | ||
| BioShock Infinite - 1920x1080 Ultra Preset, DX11 (DDOF) | |
| MSI Prestige 15 A10SC | |
| Genomsnitt NVIDIA GeForce GTX 1650 Max-Q (70.2 - 84.3, n=7) | |
| Asus ZenBook 15 UX534FT-DB77 | |
| Razer Blade Stealth 13, Core i7-1065G7 | |
| MSI Prestige 14 A10SC-009 | |
| HP ZBook 15u G6 6TP54EA | |
| Dota 2 Reborn | |
| 3840x2160 ultra (3/3) best looking | |
| Genomsnitt av klass Multimedia (106.4 - 139.3, n=3, senaste 2 åren) | |
| HP ZBook 15u G6 6TP54EA | |
| 1920x1080 ultra (3/3) best looking | |
| Genomsnitt av klass Multimedia (29 - 179.9, n=57, senaste 2 åren) | |
| Genomsnitt NVIDIA GeForce GTX 1650 Max-Q (64.4 - 105.6, n=5) | |
| MSI Prestige 14 A10SC-009 | |
| HP ZBook 15u G6 6TP54EA | |
| 1920x1080 high (2/3) | |
| Genomsnitt av klass Multimedia (31.1 - 196.9, n=57, senaste 2 åren) | |
| Genomsnitt NVIDIA GeForce GTX 1650 Max-Q (71.2 - 128, n=5) | |
| MSI Prestige 14 A10SC-009 | |
| HP ZBook 15u G6 6TP54EA | |
| låg | med. | hög | ultra | 4K | |
|---|---|---|---|---|---|
| BioShock Infinite (2013) | 70.2 | ||||
| Dota 2 Reborn (2015) | 86.2 | 76.5 | 71.2 | 64.4 | |
| Final Fantasy XV Benchmark (2018) | 51.7 | 36.7 | 23.1 | 8.7 | |
| Star Wars Jedi Fallen Order (2019) | 50.4 | 40.3 | 39.6 | 12.7 |
Ljudnivå
| Låg belastning |
| 30.3 / 30.3 / 30.3 dB(A) |
| Hög belastning |
| 40.2 / 43.5 dB(A) |
 | ||
30 dB tyst 40 dB(A) hörbar 50 dB(A) högt ljud |
||
min: | ||
(-) Den maximala temperaturen på ovansidan är 48 °C / 118 F, jämfört med genomsnittet av 36.8 °C / 98 F , allt från 21 till 71 °C för klassen Multimedia.
(-) Botten värms upp till maximalt 51 °C / 124 F, jämfört med genomsnittet av 39.1 °C / 102 F
(+) Vid tomgångsbruk är medeltemperaturen för ovansidan 26.9 °C / 80 F, jämfört med enhetsgenomsnittet på 31.3 °C / ### class_avg_f### F.
(+) Handledsstöden och pekplattan når maximal hudtemperatur (35.2 °C / 95.4 F) och är därför inte varma.
(-) Medeltemperaturen för handledsstödsområdet på liknande enheter var 28.7 °C / 83.7 F (-6.5 °C / -11.7 F).
Razer Blade Stealth 13, Core i7-1065G7 ljudanalys
(-) | inte särskilt höga högtalare (68.5 dB)
Bas 100 - 315 Hz
(±) | reducerad bas - i genomsnitt 14.1% lägre än medianen
(±) | linjäriteten för basen är genomsnittlig (13.6% delta till föregående frekvens)
Mellan 400 - 2000 Hz
(±) | högre mellan - i genomsnitt 6.2% högre än median
(±) | linjäriteten för mids är genomsnittlig (7.2% delta till föregående frekvens)
Högsta 2 - 16 kHz
(+) | balanserade toppar - endast 1.5% från medianen
(+) | toppar är linjära (5% delta till föregående frekvens)
Totalt 100 - 16 000 Hz
(±) | linjäriteten för det totala ljudet är genomsnittlig (18.2% skillnad mot median)
Jämfört med samma klass
» 53% av alla testade enheter i den här klassen var bättre, 7% liknande, 40% sämre
» Den bästa hade ett delta på 5%, genomsnittet var 18%, sämst var 53%
Jämfört med alla testade enheter
» 39% av alla testade enheter var bättre, 8% liknande, 53% sämre
» Den bästa hade ett delta på 4%, genomsnittet var 23%, sämst var 134%
| Av/Standby | |
| Låg belastning | |
| Hög belastning |
|
Förklaring:
min: | |
| MSI Prestige 14 A10SC-009 i7-10710U, GeForce GTX 1650 Max-Q, Samsung SSD PM981 MZVLB1T0HALR, IPS, 3840x2160, 14" | MSI Prestige 15 A10SC i7-10710U, GeForce GTX 1650 Max-Q, Samsung SSD PM981 MZVLB1T0HALR, IPS, 3840x2160, 15.6" | Razer Blade Stealth 13, Core i7-1065G7 i7-1065G7, GeForce GTX 1650 Max-Q, Lite-On CA3-8D512, IPS LED, 3840x2160, 13.3" | Asus ZenBook 15 UX534FT-DB77 i7-8565U, GeForce GTX 1650 Max-Q, Samsung SSD PM981 MZVLB1T0HALR, IPS, 1920x1080, 15.6" | HP ZBook 15u G6 6TP54EA i7-8565U, Radeon Pro WX 3200, Samsung SSD PM981 MZVLB512HAJQ, IPS, 3840x2160, 15.6" | Genomsnitt NVIDIA GeForce GTX 1650 Max-Q | Genomsnitt av klass Multimedia | |
|---|---|---|---|---|---|---|---|
| Power Consumption | -21% | -25% | -29% | 8% | -26% | -9% | |
| Idle Minimum * (Watt) | 5.2 | 6.1 -17% | 10.7 -106% | 5 4% | 5.5 -6% | 7.75 ? -49% | 5.62 ? -8% |
| Idle Average * (Watt) | 12.2 | 13.2 -8% | 13.6 -11% | 13.2 -8% | 9.8 20% | 11.8 ? 3% | 10.2 ? 16% |
| Idle Maximum * (Watt) | 14.3 | 19.2 -34% | 15.7 -10% | 24 -68% | 12 16% | 16.6 ? -16% | 12.5 ? 13% |
| Load Average * (Watt) | 67 | 75 -12% | 60 10% | 70 -4% | 59 12% | 75.2 ? -12% | 65 ? 3% |
| Load Maximum * (Watt) | 67 | 89.7 -34% | 71 -6% | 114 -70% | 70 -4% | 105.5 ? -57% | 111.9 ? -67% |
| Witcher 3 ultra * (Watt) | 74 | 64 | 63.3 | 51 |
* ... mindre är bättre
| MSI Prestige 14 A10SC-009 i7-10710U, GeForce GTX 1650 Max-Q, 52 Wh | MSI Prestige 15 A10SC i7-10710U, GeForce GTX 1650 Max-Q, 82 Wh | Razer Blade Stealth 13, Core i7-1065G7 i7-1065G7, GeForce GTX 1650 Max-Q, 53.1 Wh | Asus ZenBook 15 UX534FT-DB77 i7-8565U, GeForce GTX 1650 Max-Q, 71 Wh | HP ZBook 15u G6 6TP54EA i7-8565U, Radeon Pro WX 3200, 56 Wh | Genomsnitt av klass Multimedia | |
|---|---|---|---|---|---|---|
| Batteridrifttid | 41% | -11% | 66% | 17% | 79% | |
| Reader / Idle (h) | 9.9 | 19.1 93% | 8.3 -16% | 21.5 117% | 12.4 25% | 24.9 ? 152% |
| WiFi v1.3 (h) | 5.9 | 7.6 29% | 5.5 -7% | 8.4 42% | 6.9 17% | 12.3 ? 108% |
| Load (h) | 2.1 | 2.1 0% | 1.9 -10% | 2.9 38% | 2.3 10% | 1.645 ? -22% |
För
Emot
Omdöme - Bra prestanda med kompromisser
Läs den fullständiga versionen av den här recensionen på engelska här.
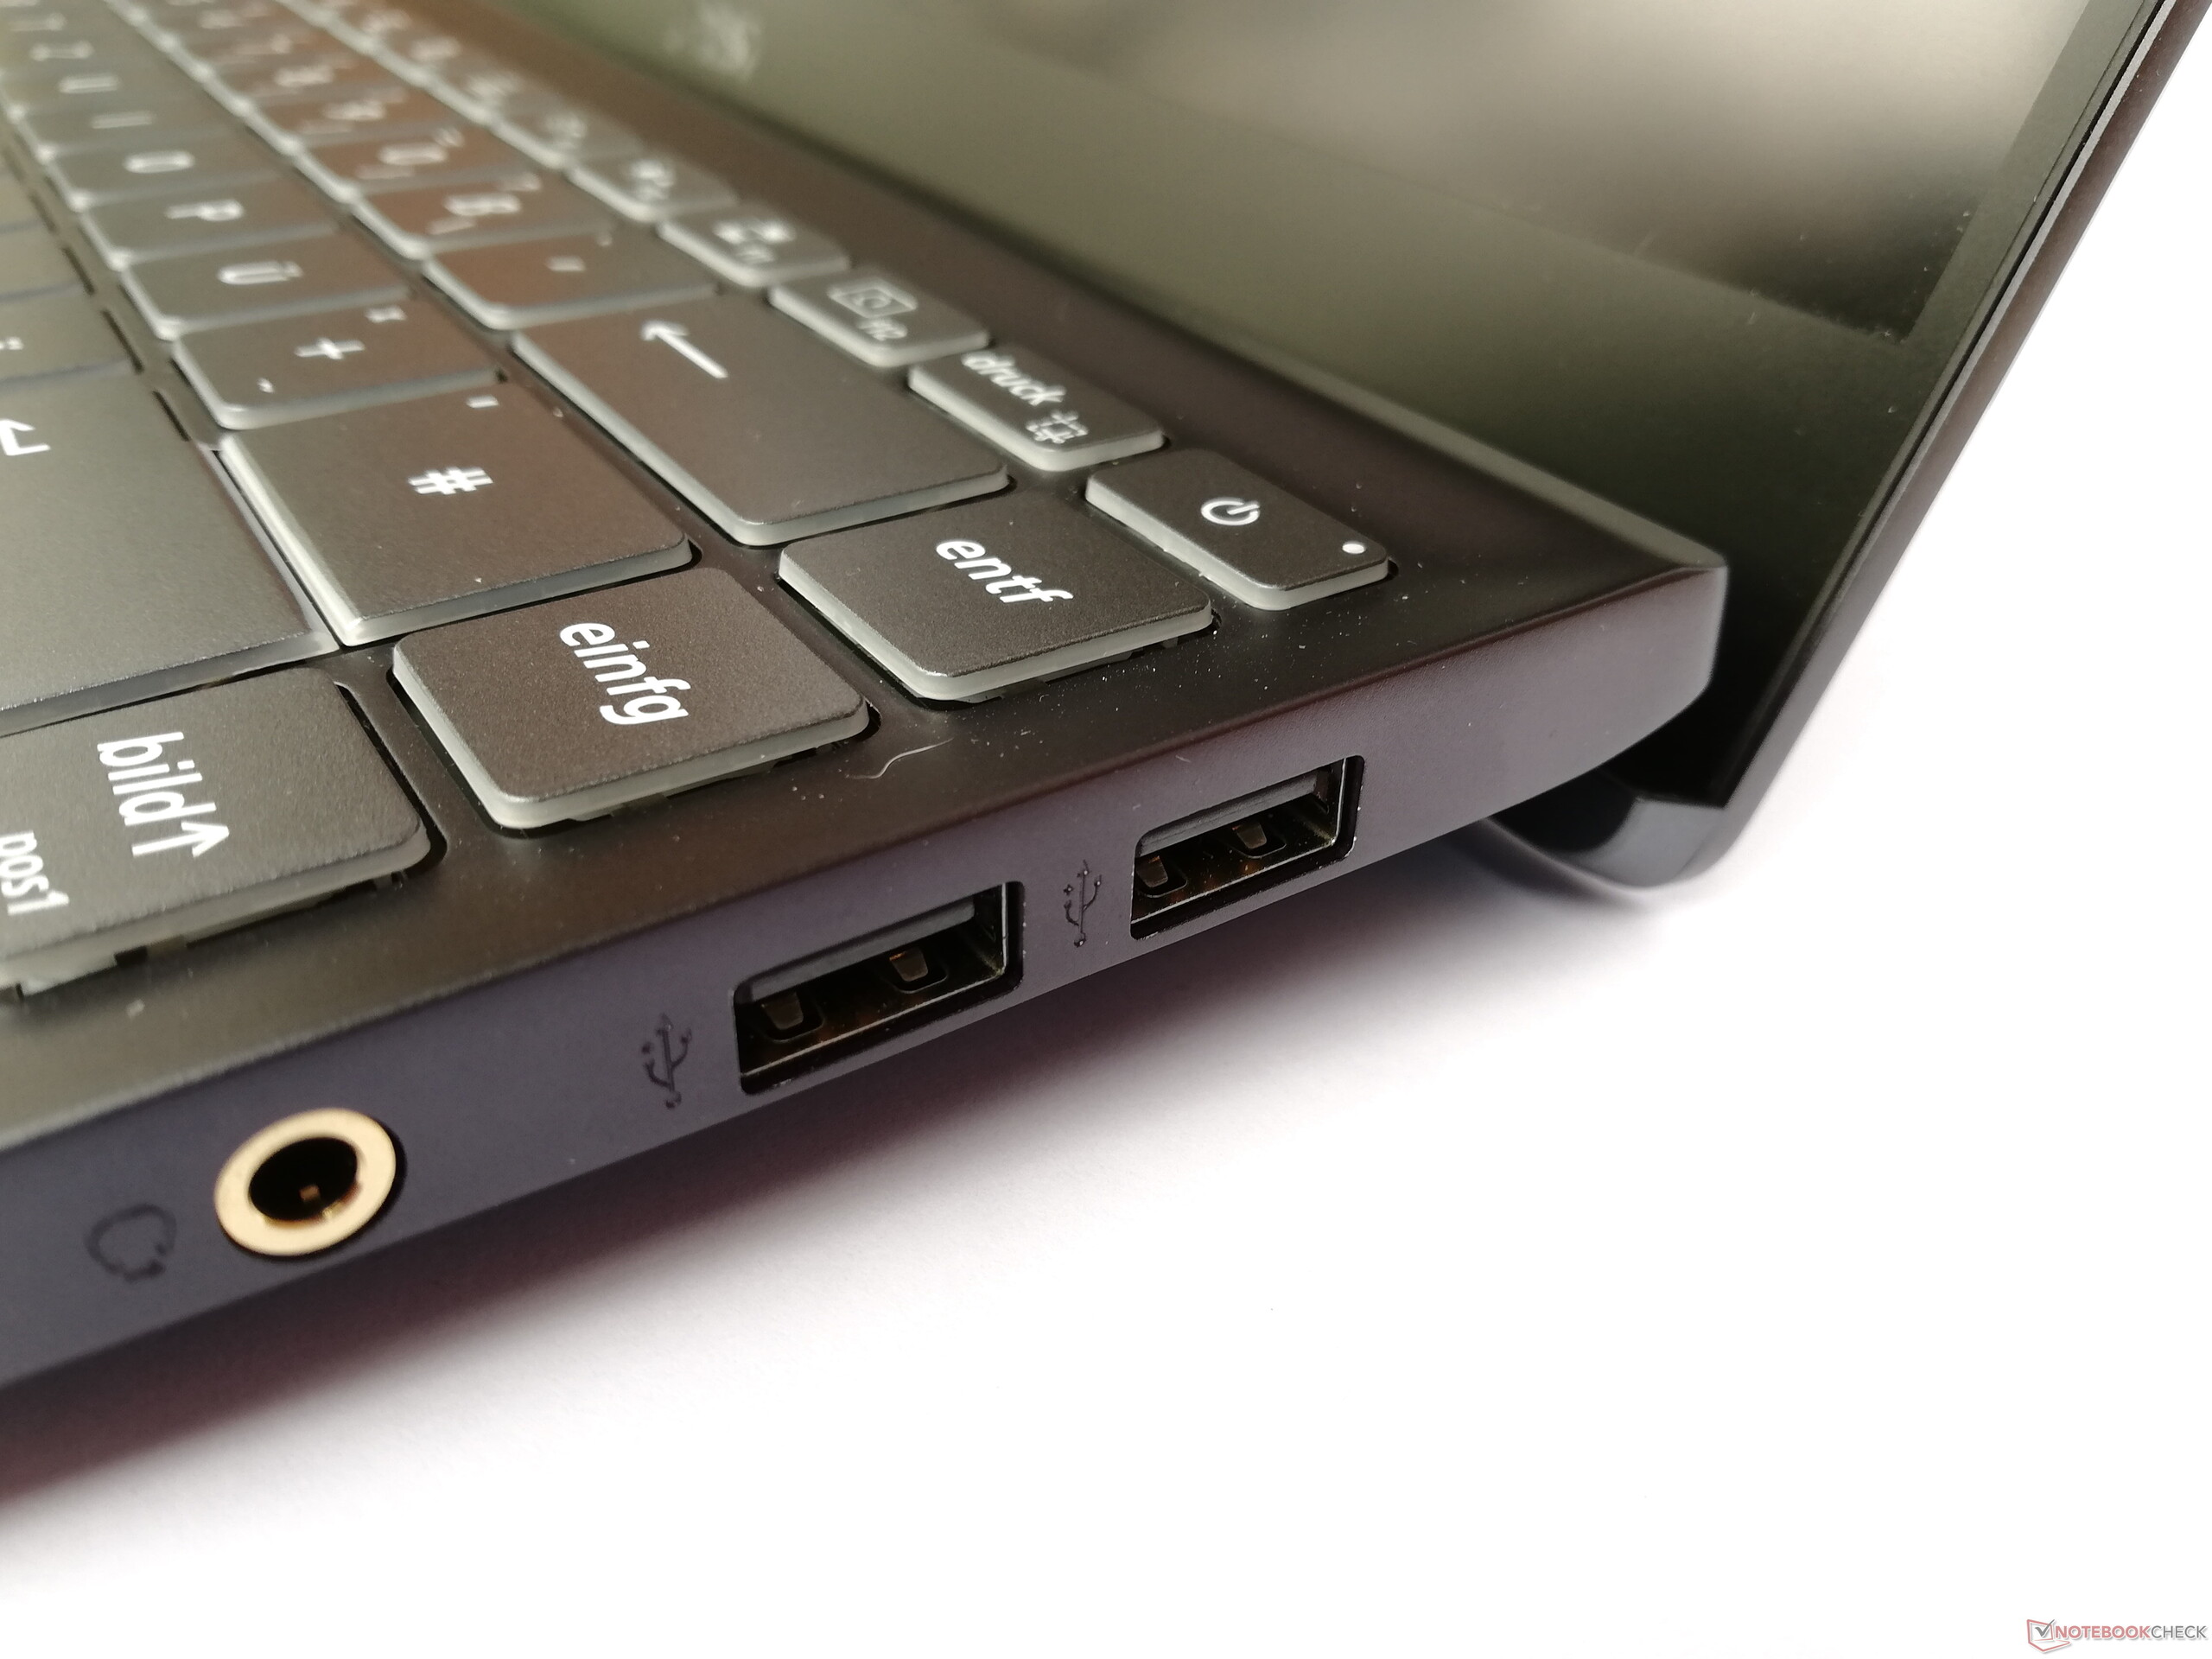
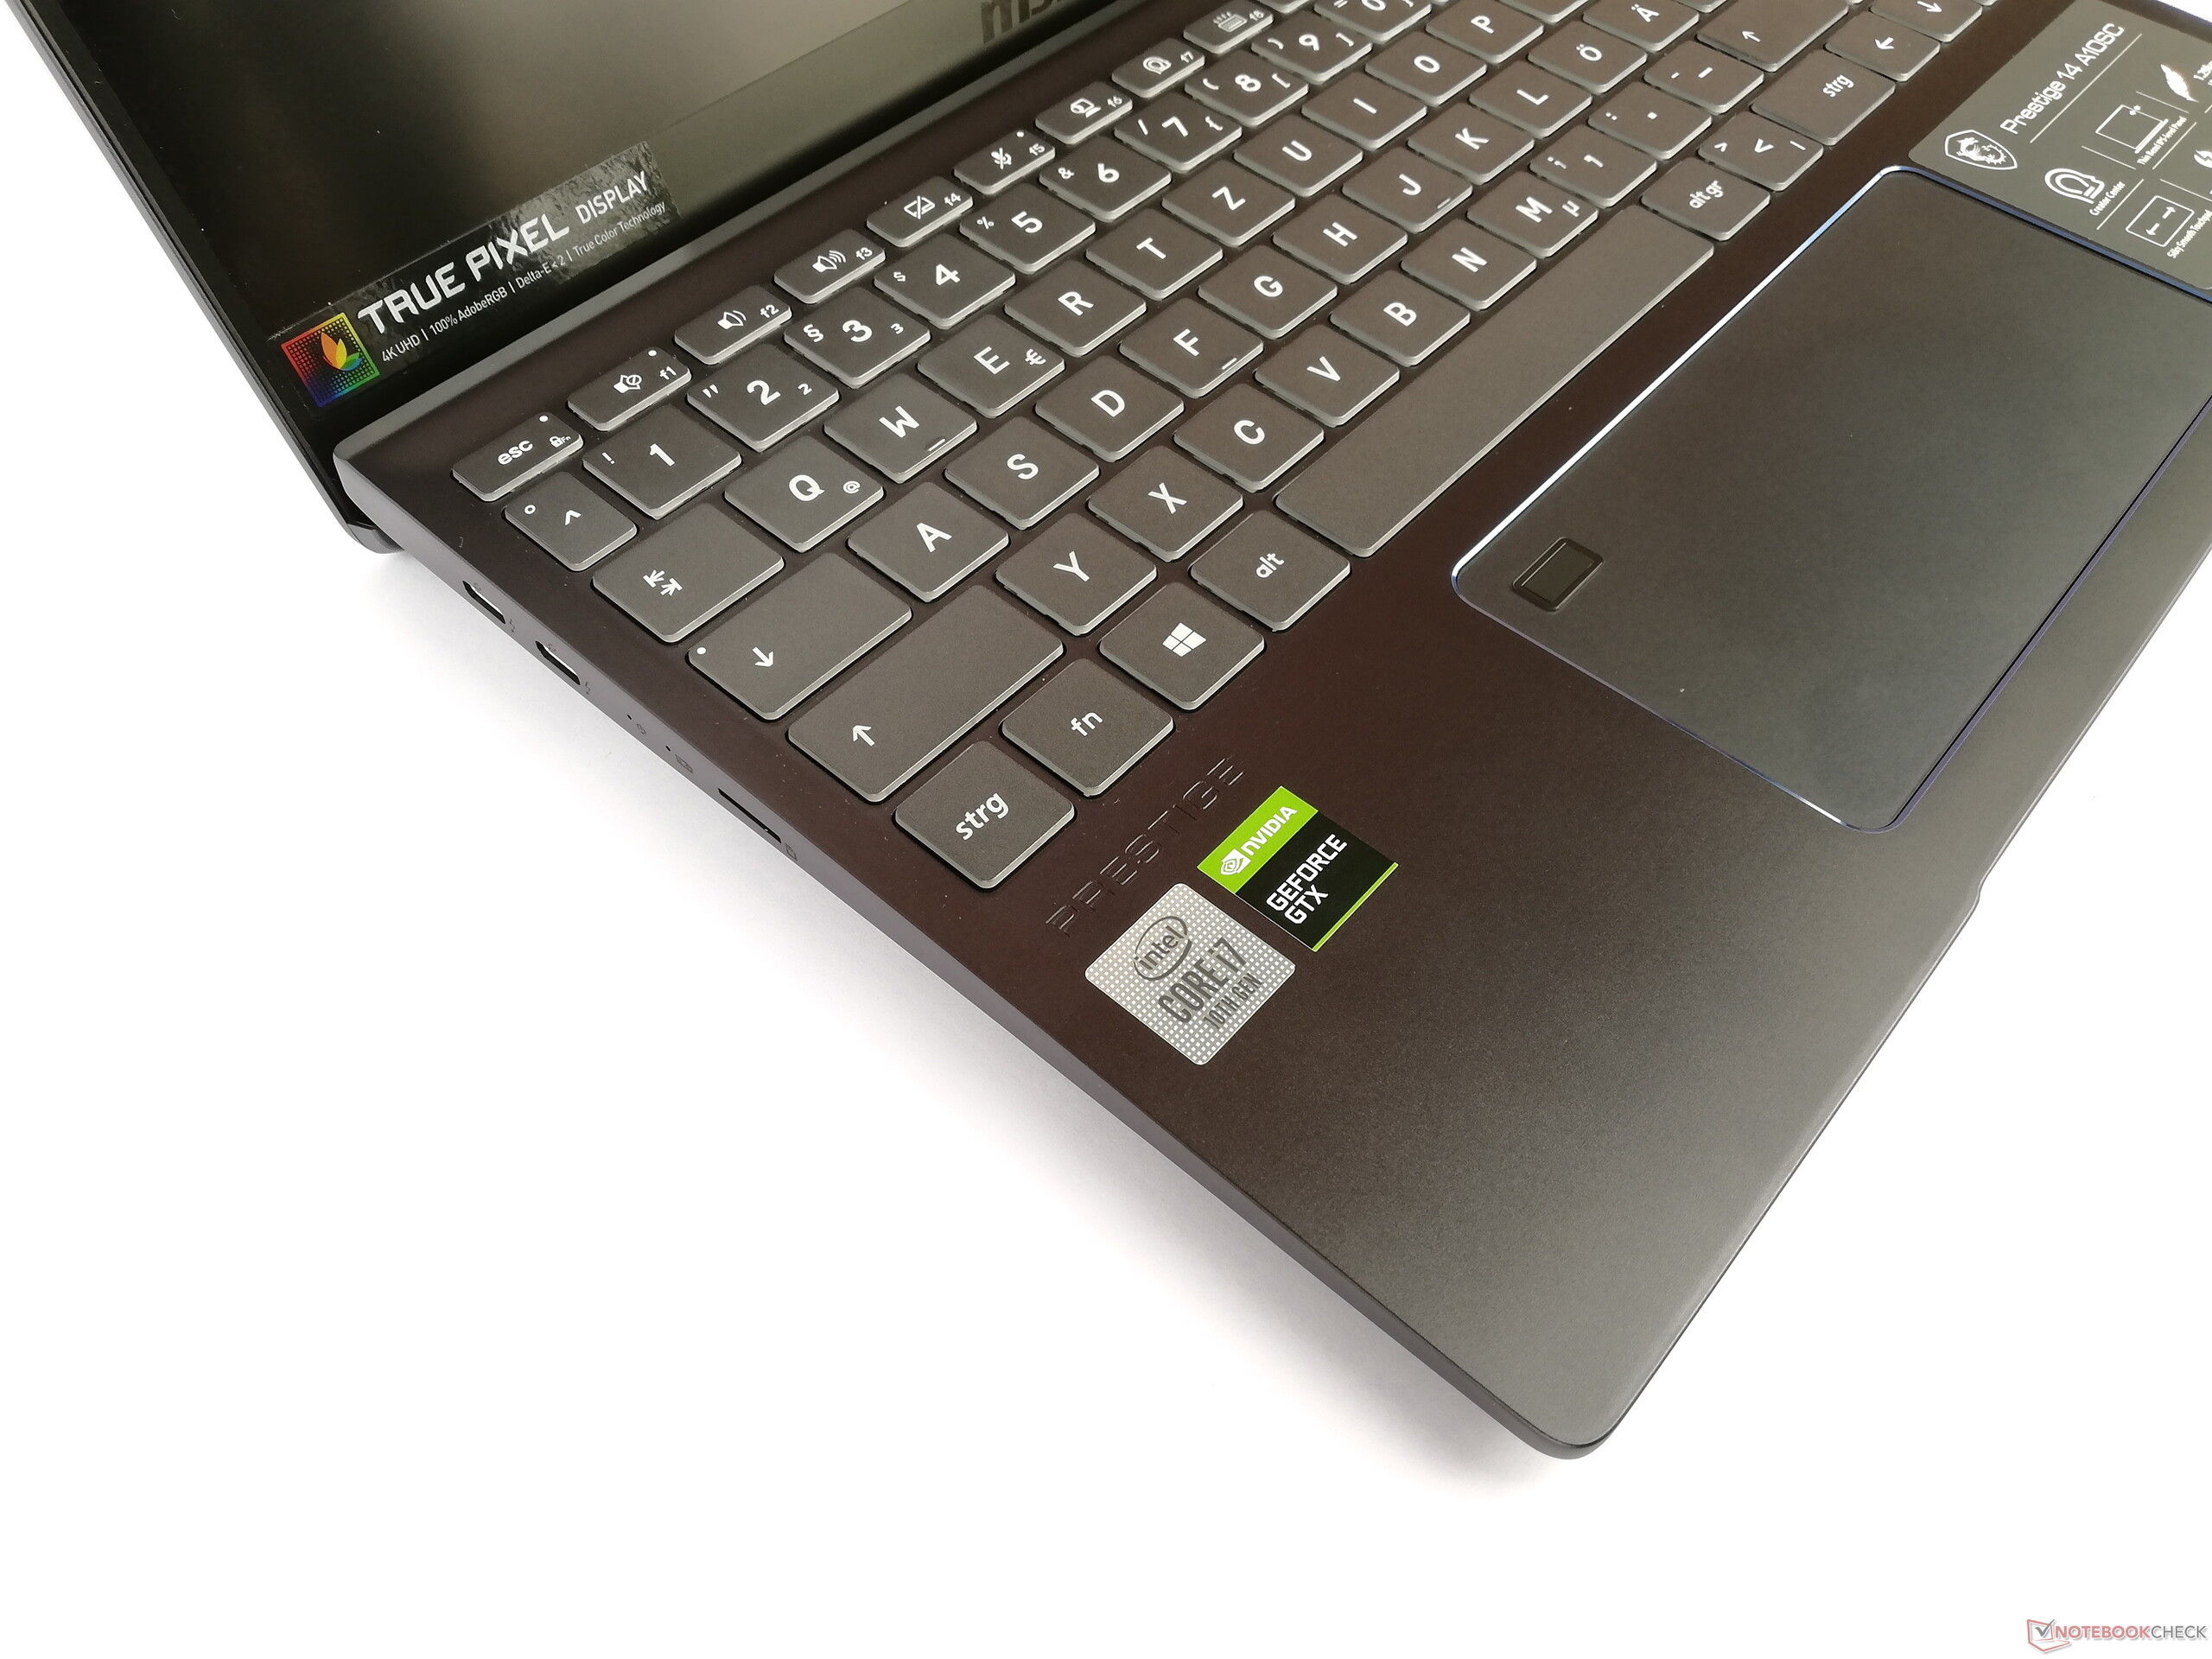
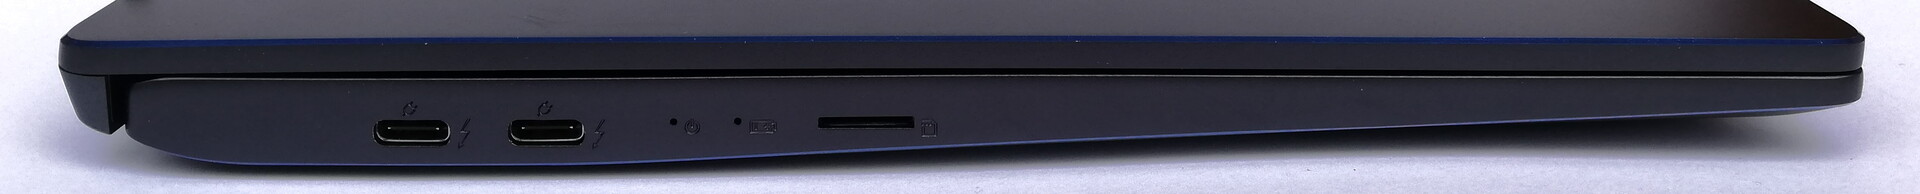
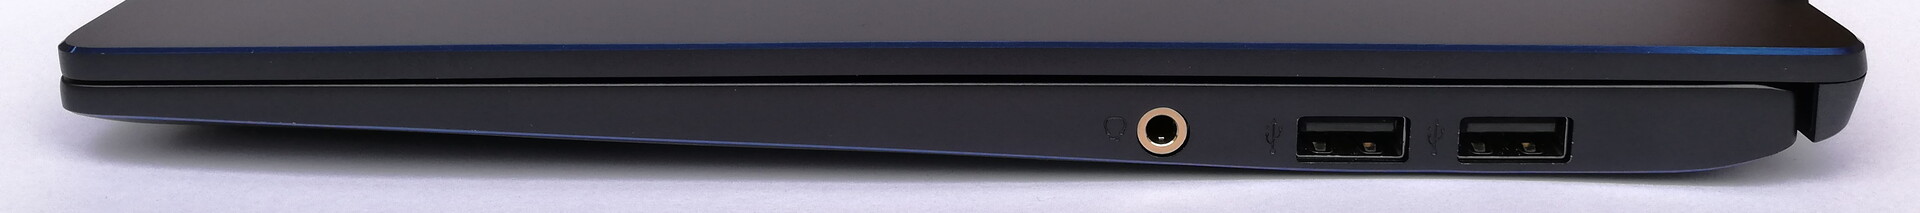
MSI Prestige visar sig vara en motsägelsefull laptop i vårt test. Den har bra prestanda, men prestandan faller ännu mer än i vårt hands on-test från September 2019. Skärmen är utmärkt kalibrerad redan vid leverans och har dessutom ett bra kontrastförhållande, men lite högre svärta och till viss del också bättre konkurrenter kastar skugga över även denna punkt. Två Thunderbolt 3-portar är riktigt välkommet, men faktum att en av dem tas upp av laddaren och att den återstående USB A-porten bara använder version 2.0 känns inte särskilt bra. Eftersom den inte har någon HDMI-port kan i extrema fall båda Thunderbolt-portarna vara upptagna, även om en motsvarande dockningsstation förstås löser detta.
MSI Prestige 14 har mycket kraft. Men man får stå ut med en del kompromisser.
Men detta är ändå småsaker. Prestige 14 kommer med bra prestanda för sin storlek och ger mycket hårdvara för pengarna. Att det knappt finns några möjligheter till service och kompromisser som exempelvis att 4K-skärmen ger kortare batteritid är saker man får fundera över innan man köper den. Man blir inte besviken om man köper den här datorn, men vi rekommenderar också att ta en titt på konkurrenterna.
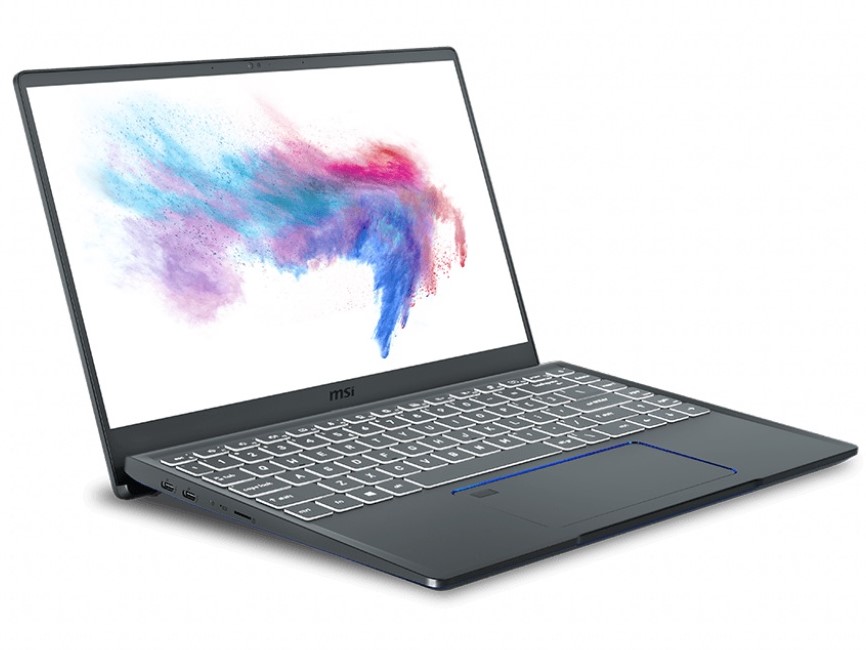
MSI Prestige 14 A10SC-009
- 02/17/2020 v7 (old)
Mike Wobker