Test: Lenovo IdeaPad S940 - Tunnare, Lättare, Elegantare (Sammanfattning)
| |||||||||||||||||||||||||
Distribution av ljusstyrkan: 83 %
Mitt på batteriet: 594.5 cd/m²
Kontrast: 1383:1 (Svärta: 0.43 cd/m²)
ΔE ColorChecker Calman: 4.87 | ∀{0.5-29.43 Ø4.71}
calibrated: 2.83
ΔE Greyscale Calman: 6.7 | ∀{0.09-98 Ø4.96}
100% sRGB (Argyll 1.6.3 3D)
72% AdobeRGB 1998 (Argyll 1.6.3 3D)
81.1% AdobeRGB 1998 (Argyll 3D)
99.7% sRGB (Argyll 3D)
87.5% Display P3 (Argyll 3D)
Gamma: 2.091
CCT: 6891 K
| Lenovo IdeaPad S940-14IWL B140ZAN01.3, IPS, 14", 3840x2160 | Dell XPS 13 9380 i7 4K ID: AUO 282B B133ZAN Dell: 90NTH, IPS, 13.3", 3840x2160 | Apple MacBook Pro 13 2018 Touchbar i5 APPA03E, IPS, 13.3", 2560x1600 | Asus ZenBook 13 UX333FA AU Optronics B133HAN05.C, IPS, 13.3", 1920x1080 | Lenovo ThinkPad X1 Carbon 2018-20KGS5DU00 LP140QH2-SPB1, IPS, 14", 2560x1440 | Lenovo Yoga C930-13IKB 81C4 AUO B139HAN03_0, IPS, 13.9", 1920x1080 | |
|---|---|---|---|---|---|---|
| Display | -17% | 7% | -13% | -9% | -18% | |
| Display P3 Coverage (%) | 87.5 | 64.8 -26% | 98.5 13% | 67.9 -22% | 72.7 -17% | 62.7 -28% |
| sRGB Coverage (%) | 99.7 | 93.6 -6% | 99.9 0% | 97.4 -2% | 97.9 -2% | 92.6 -7% |
| AdobeRGB 1998 Coverage (%) | 81.1 | 65.8 -19% | 87.3 8% | 69.2 -15% | 74.6 -8% | 64.7 -20% |
| Response Times | -16% | 10% | -7% | 27% | 30% | |
| Response Time Grey 50% / Grey 80% * (ms) | 57.2 ? | 64.8 ? -13% | 46 ? 20% | 54.4 ? 5% | 38 ? 34% | 34.4 ? 40% |
| Response Time Black / White * (ms) | 32 ? | 38 ? -19% | 32 ? -0% | 37.6 ? -18% | 26 ? 19% | 25.6 ? 20% |
| PWM Frequency (Hz) | 118000 ? | |||||
| Screen | 11% | 24% | -1% | -10% | -28% | |
| Brightness middle (cd/m²) | 594.5 | 428.3 -28% | 519 -13% | 276 -54% | 316 -47% | 312 -48% |
| Brightness (cd/m²) | 536 | 414 -23% | 504 -6% | 263 -51% | 311 -42% | 295 -45% |
| Brightness Distribution (%) | 83 | 88 6% | 95 14% | 89 7% | 84 1% | 87 5% |
| Black Level * (cd/m²) | 0.43 | 0.27 37% | 0.33 23% | 0.21 51% | 0.35 19% | 0.43 -0% |
| Contrast (:1) | 1383 | 1586 15% | 1573 14% | 1314 -5% | 903 -35% | 726 -48% |
| Colorchecker dE 2000 * | 4.87 | 2.69 45% | 1.4 71% | 4.85 -0% | 4.5 8% | 7.6 -56% |
| Colorchecker dE 2000 max. * | 7.9 | 6.19 22% | 2.8 65% | 8.24 -4% | 10.3 -30% | 15.06 -91% |
| Colorchecker dE 2000 calibrated * | 2.83 | 2.01 29% | 1.6 43% | 1.6 43% | 1.96 31% | |
| Greyscale dE 2000 * | 6.7 | 3.7 45% | 2.2 67% | 5.7 15% | 7.7 -15% | 8.8 -31% |
| Gamma | 2.091 105% | 2.1 105% | 2.22 99% | 2.08 106% | 2.2 100% | 2.01 109% |
| CCT | 6891 94% | 6706 97% | 6908 94% | 7424 88% | 6639 98% | 6874 95% |
| Color Space (Percent of AdobeRGB 1998) (%) | 72 | 60.4 -16% | 77.3 7% | 63 -12% | 68.6 -5% | 59.1 -18% |
| Color Space (Percent of sRGB) (%) | 100 | 93.5 -6% | 99.99 0% | 98 -2% | 97.9 -2% | 92.3 -8% |
| Totalt genomsnitt (program/inställningar) | -7% /
3% | 14% /
19% | -7% /
-4% | 3% /
-5% | -5% /
-19% |
* ... mindre är bättre
Visa svarstider
| ↔ Svarstid svart till vitt | ||
|---|---|---|
| 32 ms ... stiga ↗ och falla ↘ kombinerat | ↗ 17.2 ms stiga | 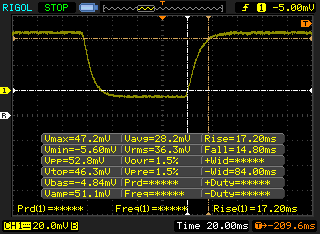 |
| ↘ 14.8 ms hösten | ||
| Skärmen visar långsamma svarsfrekvenser i våra tester och kommer att vara otillfredsställande för spelare. I jämförelse sträcker sig alla testade enheter från 0.1 (minst) till 240 (maximalt) ms. » 86 % av alla enheter är bättre. Detta innebär att den uppmätta svarstiden är sämre än genomsnittet av alla testade enheter (19.8 ms). | ||
| ↔ Svarstid 50 % grått till 80 % grått | ||
| 57.2 ms ... stiga ↗ och falla ↘ kombinerat | ↗ 30 ms stiga | 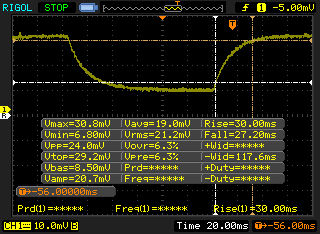 |
| ↘ 27.2 ms hösten | ||
| Skärmen visar långsamma svarsfrekvenser i våra tester och kommer att vara otillfredsställande för spelare. I jämförelse sträcker sig alla testade enheter från 0.165 (minst) till 636 (maximalt) ms. » 94 % av alla enheter är bättre. Detta innebär att den uppmätta svarstiden är sämre än genomsnittet av alla testade enheter (30.9 ms). | ||
Skärmflimmer / PWM (Puls-Width Modulation)
| Skärmflimmer / PWM upptäcktes inte | 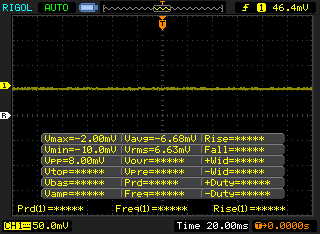 | ||
Som jämförelse: 52 % av alla testade enheter använder inte PWM för att dämpa skärmen. Om PWM upptäcktes mättes ett medelvärde av 7741 (minst: 5 - maximum: 343500) Hz. | |||
| Cinebench R10 | |
| Rendering Multiple CPUs 32Bit | |
| Genomsnitt av klass Subnotebook (14395 - 51868, n=14, senaste 2 åren) | |
| Genomsnitt Intel Core i7-8565U (13806 - 23118, n=16) | |
| Lenovo Yoga 530-14ARR-81H9000VGE | |
| Rendering Single 32Bit | |
| Genomsnitt av klass Subnotebook (2299 - 10697, n=14, senaste 2 åren) | |
| Genomsnitt Intel Core i7-8565U (2682 - 8906, n=16) | |
| Lenovo Yoga 530-14ARR-81H9000VGE | |
| PCMark 8 Home Score Accelerated v2 | 3147 poäng | |
| PCMark 8 Work Score Accelerated v2 | 4209 poäng | |
| PCMark 10 Score | 3870 poäng | |
Hjälp | ||
| Lenovo IdeaPad S940-14IWL Samsung SSD PM981 MZVLB512HAJQ | Dell XPS 13 9380 i7 4K Samsung SSD PM981 MZVLB512HAJQ | Apple MacBook Pro 13 2018 Touchbar i5 | Asus ZenBook 13 UX333FA WDC PC SN520 SDAPNUW-256G | Lenovo Yoga C930-13IKB 81C4 SK hynix PC401 HFS256GD9TNG | |
|---|---|---|---|---|---|
| AS SSD | 14% | -51% | -40% | -263% | |
| Seq Read (MB/s) | 2625 | 1981 -25% | 1442 -45% | 1186 -55% | 1228 -53% |
| Seq Write (MB/s) | 1360 | 1473 8% | 1694 25% | 809 -41% | 544 -60% |
| 4K Read (MB/s) | 47.71 | 53.3 12% | 9.7 -80% | 39.69 -17% | 39.16 -18% |
| 4K Write (MB/s) | 115.5 | 127.4 10% | 20 -83% | 114 -1% | 106.5 -8% |
| 4K-64 Read (MB/s) | 1492 | 1179 -21% | 957 -36% | 618 -59% | 466.4 -69% |
| 4K-64 Write (MB/s) | 1154 | 2105 82% | 162 -86% | 510 -56% | 305.1 -74% |
| Access Time Read * (ms) | 0.045 | 0.036 20% | 0.068 -51% | 0.46 -922% | |
| Access Time Write * (ms) | 0.032 | 0.029 9% | 0.032 -0% | 0.51 -1494% | |
| Score Read (Points) | 1802 | 1430 -21% | 776 -57% | 628 -65% | |
| Score Write (Points) | 1406 | 2379 69% | 705 -50% | 466 -67% | |
| Score Total (Points) | 4069 | 4526 11% | 1870 -54% | 1394 -66% | |
| Copy ISO MB/s (MB/s) | 1294 | 1090 | 628 | ||
| Copy Program MB/s (MB/s) | 503 | 714 | 540 | ||
| Copy Game MB/s (MB/s) | 1148 | 413 | 533 | ||
| CrystalDiskMark 5.2 / 6 | 29% | -38% | -25% | -22% | |
| Write 4K (MB/s) | 105.3 | 139.5 32% | 43.24 -59% | 113.7 8% | 108.7 3% |
| Read 4K (MB/s) | 40.9 | 61.3 50% | 14.07 -66% | 43.18 6% | 40.91 0% |
| Write Seq (MB/s) | 1914 | 1863 -3% | 887 -54% | 970 -49% | 798 -58% |
| Read Seq (MB/s) | 2224 | 2494 12% | 1515 -32% | 1085 -51% | 1610 -28% |
| Write 4K Q32T1 (MB/s) | 419.3 | 772 84% | 225.3 -46% | 396.8 -5% | 385.1 -8% |
| Read 4K Q32T1 (MB/s) | 288.1 | 454.8 58% | 346.5 20% | 317.8 10% | 305.8 6% |
| Write Seq Q32T1 (MB/s) | 1954 | 1869 -4% | 859 -56% | 518 -73% | 779 -60% |
| Read Seq Q32T1 (MB/s) | 3382 | 3480 3% | 2915 -14% | 1741 -49% | 2359 -30% |
| Totalt genomsnitt (program/inställningar) | 22% /
20% | -45% /
-44% | -33% /
-34% | -143% /
-162% |
* ... mindre är bättre

| 3DMark 11 Performance | 1987 poäng | |
| 3DMark Cloud Gate Standard Score | 8135 poäng | |
| 3DMark Fire Strike Score | 1130 poäng | |
Hjälp | ||
| låg | med. | hög | ultra | |
|---|---|---|---|---|
| BioShock Infinite (2013) | 70 | 35 | 27 | 8 |
| Metro: Last Light (2013) | 41 | |||
| Rise of the Tomb Raider (2016) | 16 | 11 | 6 |
Ljudnivå
| Låg belastning |
| 28.3 / 28.3 / 31.3 dB(A) |
| Hög belastning |
| 34.3 / 34.3 dB(A) |
 | ||
30 dB tyst 40 dB(A) hörbar 50 dB(A) högt ljud |
||
min: | ||
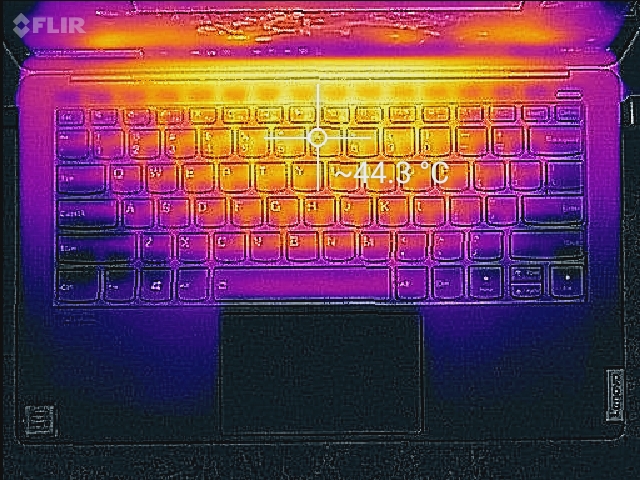
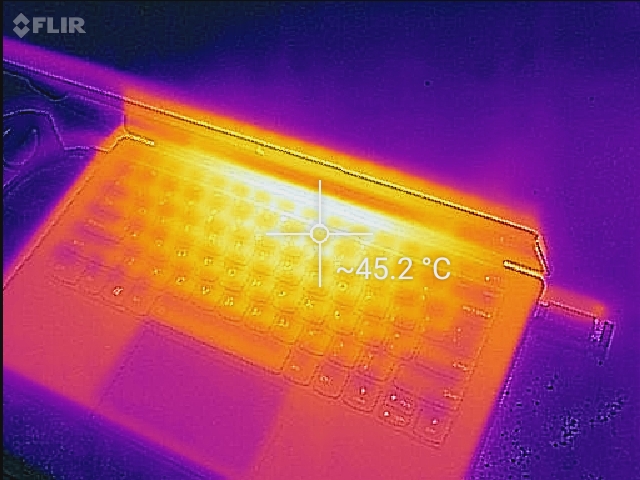
(±) Den maximala temperaturen på ovansidan är 43.8 °C / 111 F, jämfört med genomsnittet av 35.9 °C / 97 F , allt från 21.4 till 59 °C för klassen Subnotebook.
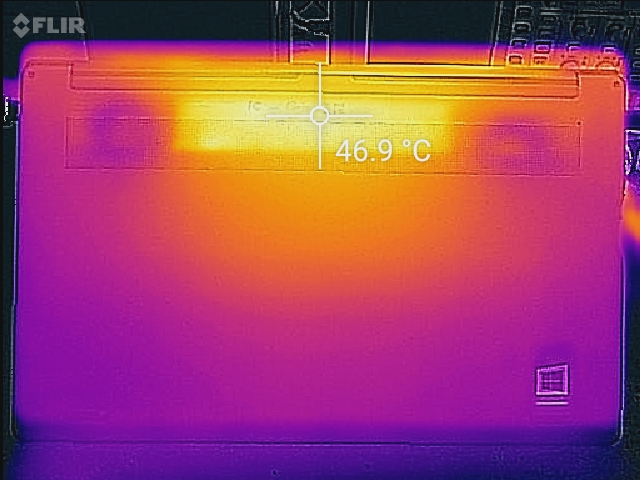
(-) Botten värms upp till maximalt 47 °C / 117 F, jämfört med genomsnittet av 39.2 °C / 103 F
(+) Vid tomgångsbruk är medeltemperaturen för ovansidan 30.9 °C / 88 F, jämfört med enhetsgenomsnittet på 30.8 °C / ### class_avg_f### F.
(+) Handledsstöden och pekplattan når maximal hudtemperatur (34 °C / 93.2 F) och är därför inte varma.
(-) Medeltemperaturen för handledsstödsområdet på liknande enheter var 28.2 °C / 82.8 F (-5.8 °C / -10.4 F).
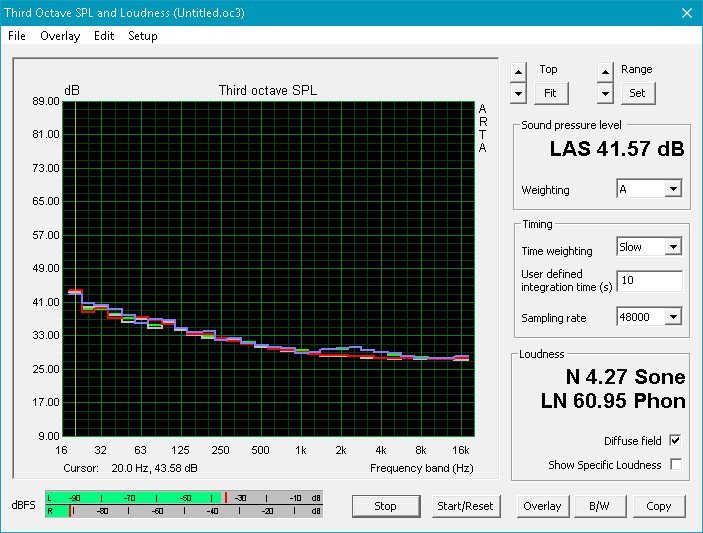
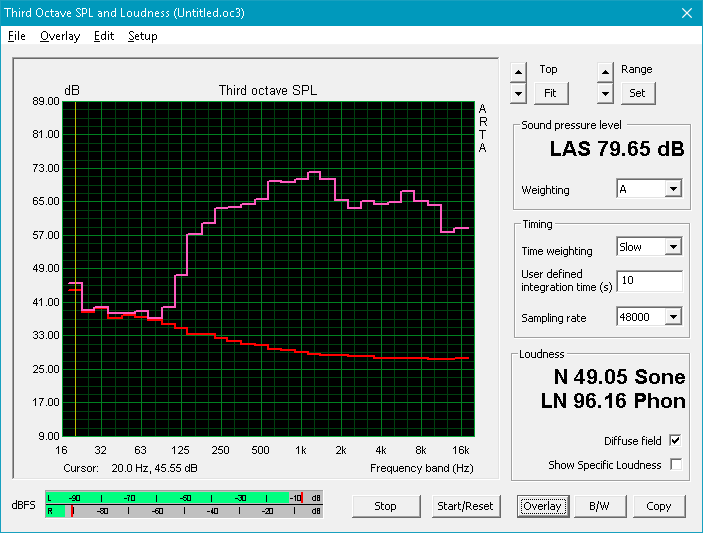
Lenovo IdeaPad S940-14IWL ljudanalys
(±) | högtalarljudstyrkan är genomsnittlig men bra (79.7 dB)
Bas 100 - 315 Hz
(±) | reducerad bas - i genomsnitt 9.2% lägre än medianen
(±) | linjäriteten för basen är genomsnittlig (12.3% delta till föregående frekvens)
Mellan 400 - 2000 Hz
(+) | balanserad mellan - endast 4% från medianen
(+) | mids är linjära (5.4% delta till föregående frekvens)
Högsta 2 - 16 kHz
(+) | balanserade toppar - endast 0.9% från medianen
(+) | toppar är linjära (4.2% delta till föregående frekvens)
Totalt 100 - 16 000 Hz
(±) | linjäriteten för det totala ljudet är genomsnittlig (15.2% skillnad mot median)
Jämfört med samma klass
» 35% av alla testade enheter i den här klassen var bättre, 5% liknande, 60% sämre
» Den bästa hade ett delta på 5%, genomsnittet var 18%, sämst var 53%
Jämfört med alla testade enheter
» 22% av alla testade enheter var bättre, 4% liknande, 74% sämre
» Den bästa hade ett delta på 4%, genomsnittet var 23%, sämst var 134%
Dell XPS 13 9380 i7 4K ljudanalys
(±) | högtalarljudstyrkan är genomsnittlig men bra (75.3 dB)
Bas 100 - 315 Hz
(-) | nästan ingen bas - i genomsnitt 18.5% lägre än medianen
(±) | linjäriteten för basen är genomsnittlig (8.1% delta till föregående frekvens)
Mellan 400 - 2000 Hz
(±) | högre mellan - i genomsnitt 7.7% högre än median
(±) | linjäriteten för mids är genomsnittlig (11.5% delta till föregående frekvens)
Högsta 2 - 16 kHz
(±) | högre toppar - i genomsnitt 6.2% högre än medianen
(±) | linjäriteten för toppar är genomsnittlig (10.5% delta till föregående frekvens)
Totalt 100 - 16 000 Hz
(±) | linjäriteten för det totala ljudet är genomsnittlig (28.5% skillnad mot median)
Jämfört med samma klass
» 90% av alla testade enheter i den här klassen var bättre, 2% liknande, 7% sämre
» Den bästa hade ett delta på 5%, genomsnittet var 18%, sämst var 53%
Jämfört med alla testade enheter
» 86% av alla testade enheter var bättre, 3% liknande, 11% sämre
» Den bästa hade ett delta på 4%, genomsnittet var 23%, sämst var 134%
| Av/Standby | |
| Låg belastning | |
| Hög belastning |
|
Förklaring:
min: | |
| Lenovo IdeaPad S940-14IWL i7-8565U, UHD Graphics 620, Samsung SSD PM981 MZVLB512HAJQ, IPS, 3840x2160, 14" | Dell XPS 13 9380 i7 4K i7-8565U, UHD Graphics 620, Samsung SSD PM981 MZVLB512HAJQ, IPS, 3840x2160, 13.3" | Apple MacBook Pro 13 2018 Touchbar i5 i5-8259U, Iris Plus Graphics 655, , IPS, 2560x1600, 13.3" | Asus ZenBook 13 UX333FA i5-8265U, UHD Graphics 620, WDC PC SN520 SDAPNUW-256G, IPS, 1920x1080, 13.3" | Lenovo Yoga C930-13IKB 81C4 i5-8550U, UHD Graphics 620, SK hynix PC401 HFS256GD9TNG, IPS, 1920x1080, 13.9" | Lenovo Yoga 530-14ARR-81H9000VGE R7 2700U, Vega 10, SK hynix BC501 HFM256GDHTNG, IPS, 1920x1080, 14" | |
|---|---|---|---|---|---|---|
| Power Consumption | 7% | 4% | 38% | 6% | 24% | |
| Idle Minimum * (Watt) | 5.2 | 5.2 -0% | 2.3 56% | 1.6 69% | 3.4 35% | 4.3 17% |
| Idle Average * (Watt) | 10.2 | 8.6 16% | 8.7 15% | 4.6 55% | 7.5 26% | 6.4 37% |
| Idle Maximum * (Watt) | 11.9 | 10.5 12% | 12.2 -3% | 7.3 39% | 11.8 1% | 7.8 34% |
| Load Average * (Watt) | 42.1 | 44.2 -5% | 53.3 -27% | 37.9 10% | 47.7 -13% | 34 19% |
| Load Maximum * (Watt) | 53.6 | 47.5 11% | 64 -19% | 44.8 16% | 63.2 -18% | 47.8 11% |
* ... mindre är bättre
| Lenovo IdeaPad S940-14IWL i7-8565U, UHD Graphics 620, 52 Wh | Dell XPS 13 9380 i7 4K i7-8565U, UHD Graphics 620, 52 Wh | Apple MacBook Pro 13 2018 Touchbar i5 i5-8259U, Iris Plus Graphics 655, 58 Wh | Asus ZenBook 13 UX333FA i5-8265U, UHD Graphics 620, 50 Wh | Lenovo ThinkPad X1 Carbon 2018-20KGS5DU00 i5-8550U, UHD Graphics 620, 57 Wh | Lenovo Yoga C930-13IKB 81C4 i5-8550U, UHD Graphics 620, 60 Wh | Lenovo Yoga 530-14ARR-81H9000VGE R7 2700U, Vega 10, 45 Wh | |
|---|---|---|---|---|---|---|---|
| Batteridrifttid | 54% | 94% | 119% | 80% | 122% | 28% | |
| Reader / Idle (h) | 8.4 | 27.8 231% | 11.7 39% | ||||
| WiFi v1.3 (h) | 5 | 7.7 54% | 9.7 94% | 9.9 98% | 9 80% | 11.1 122% | 6.7 34% |
| Load (h) | 1.7 | 2.2 29% | 1.9 12% | ||||
| Witcher 3 ultra (h) | 1.6 |
För
Emot
Läs den fullständiga versionen av den här recensionen på engelska här.
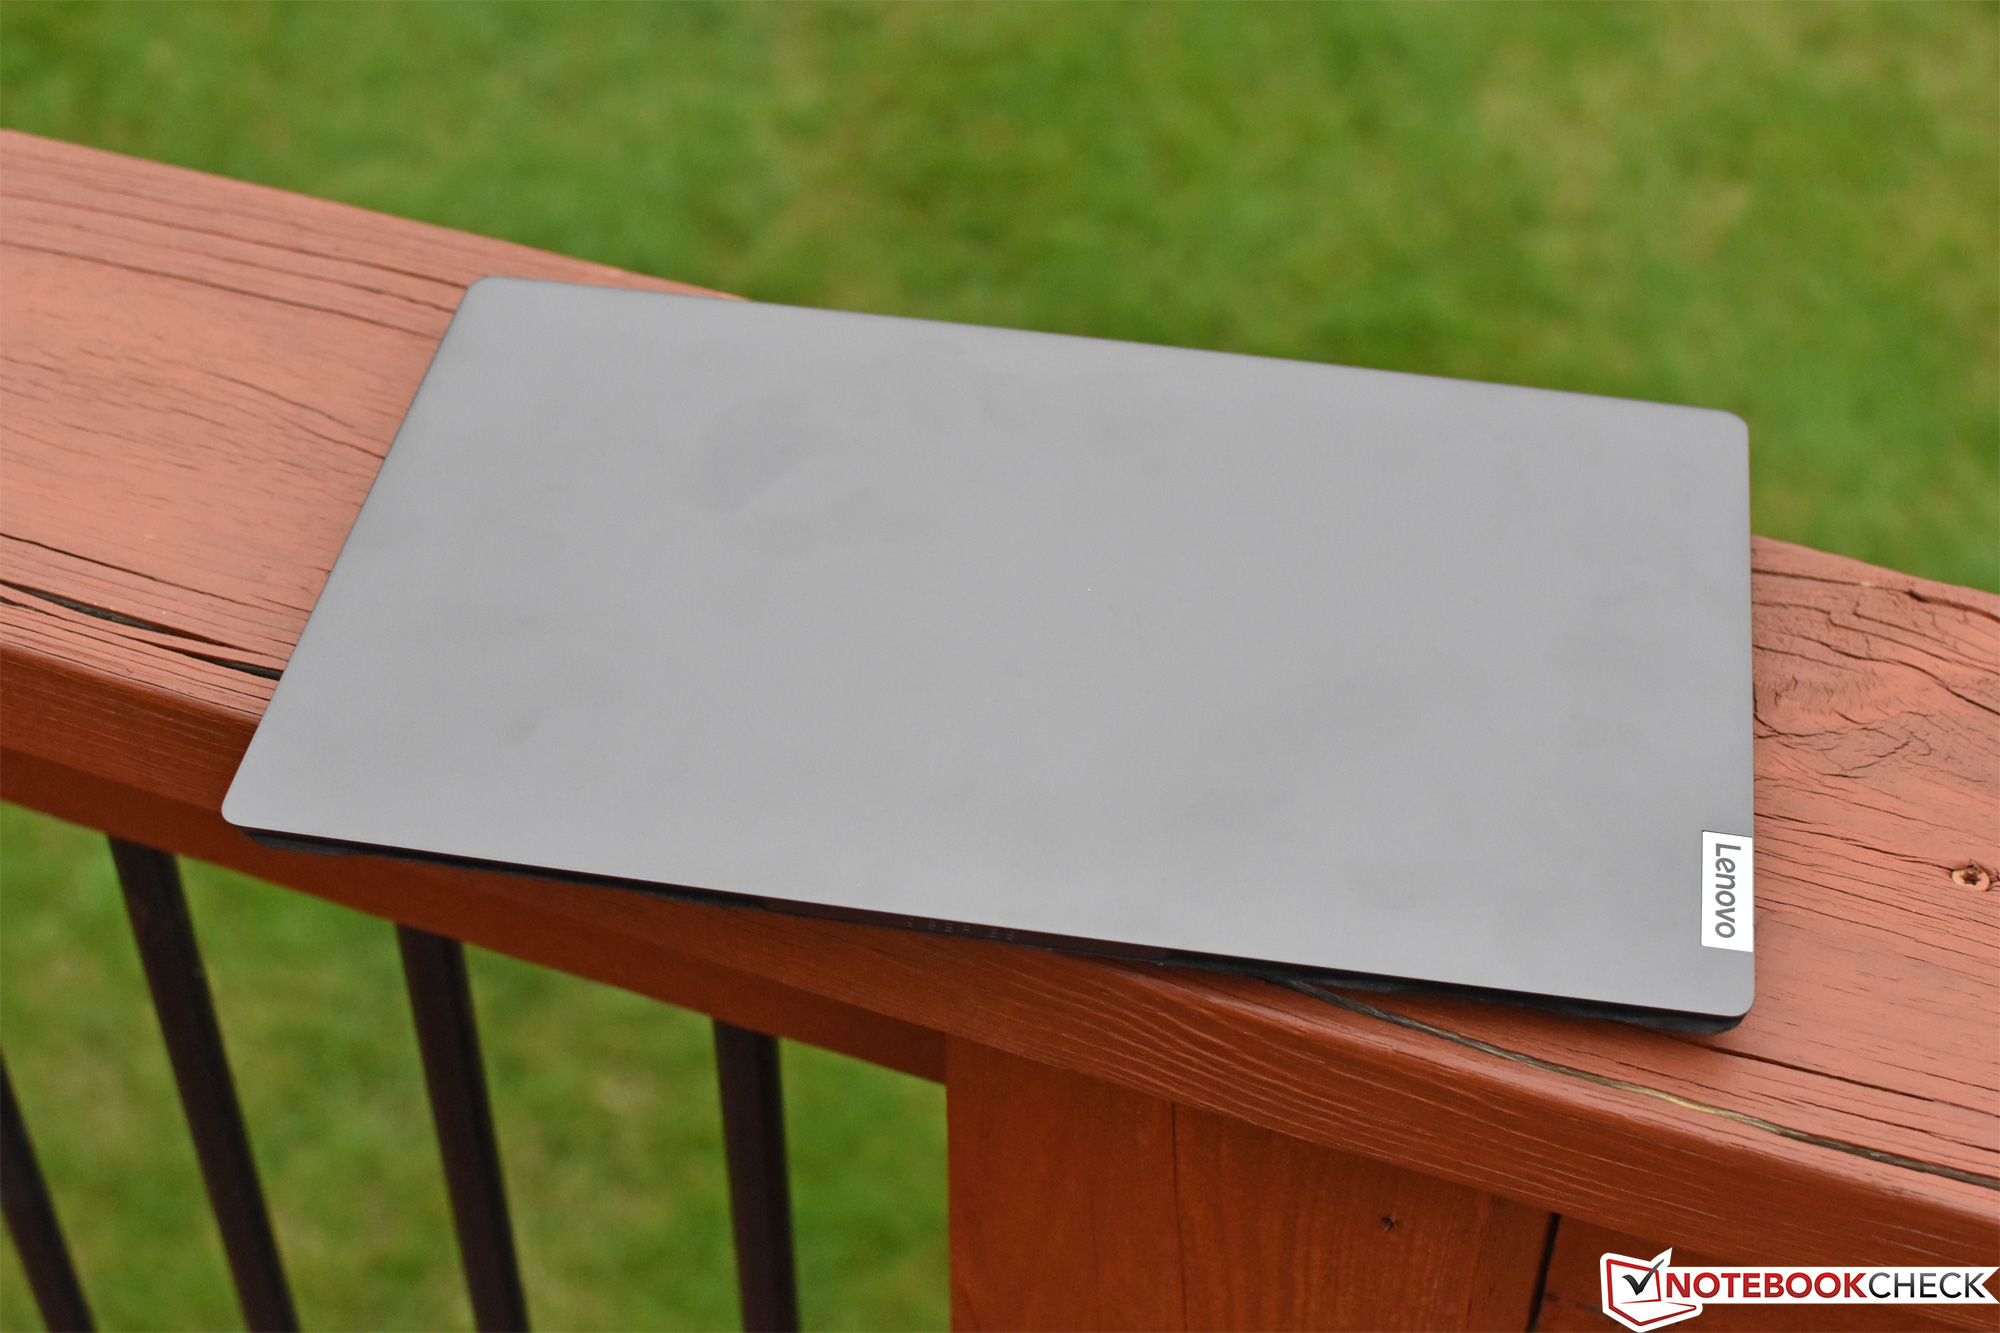
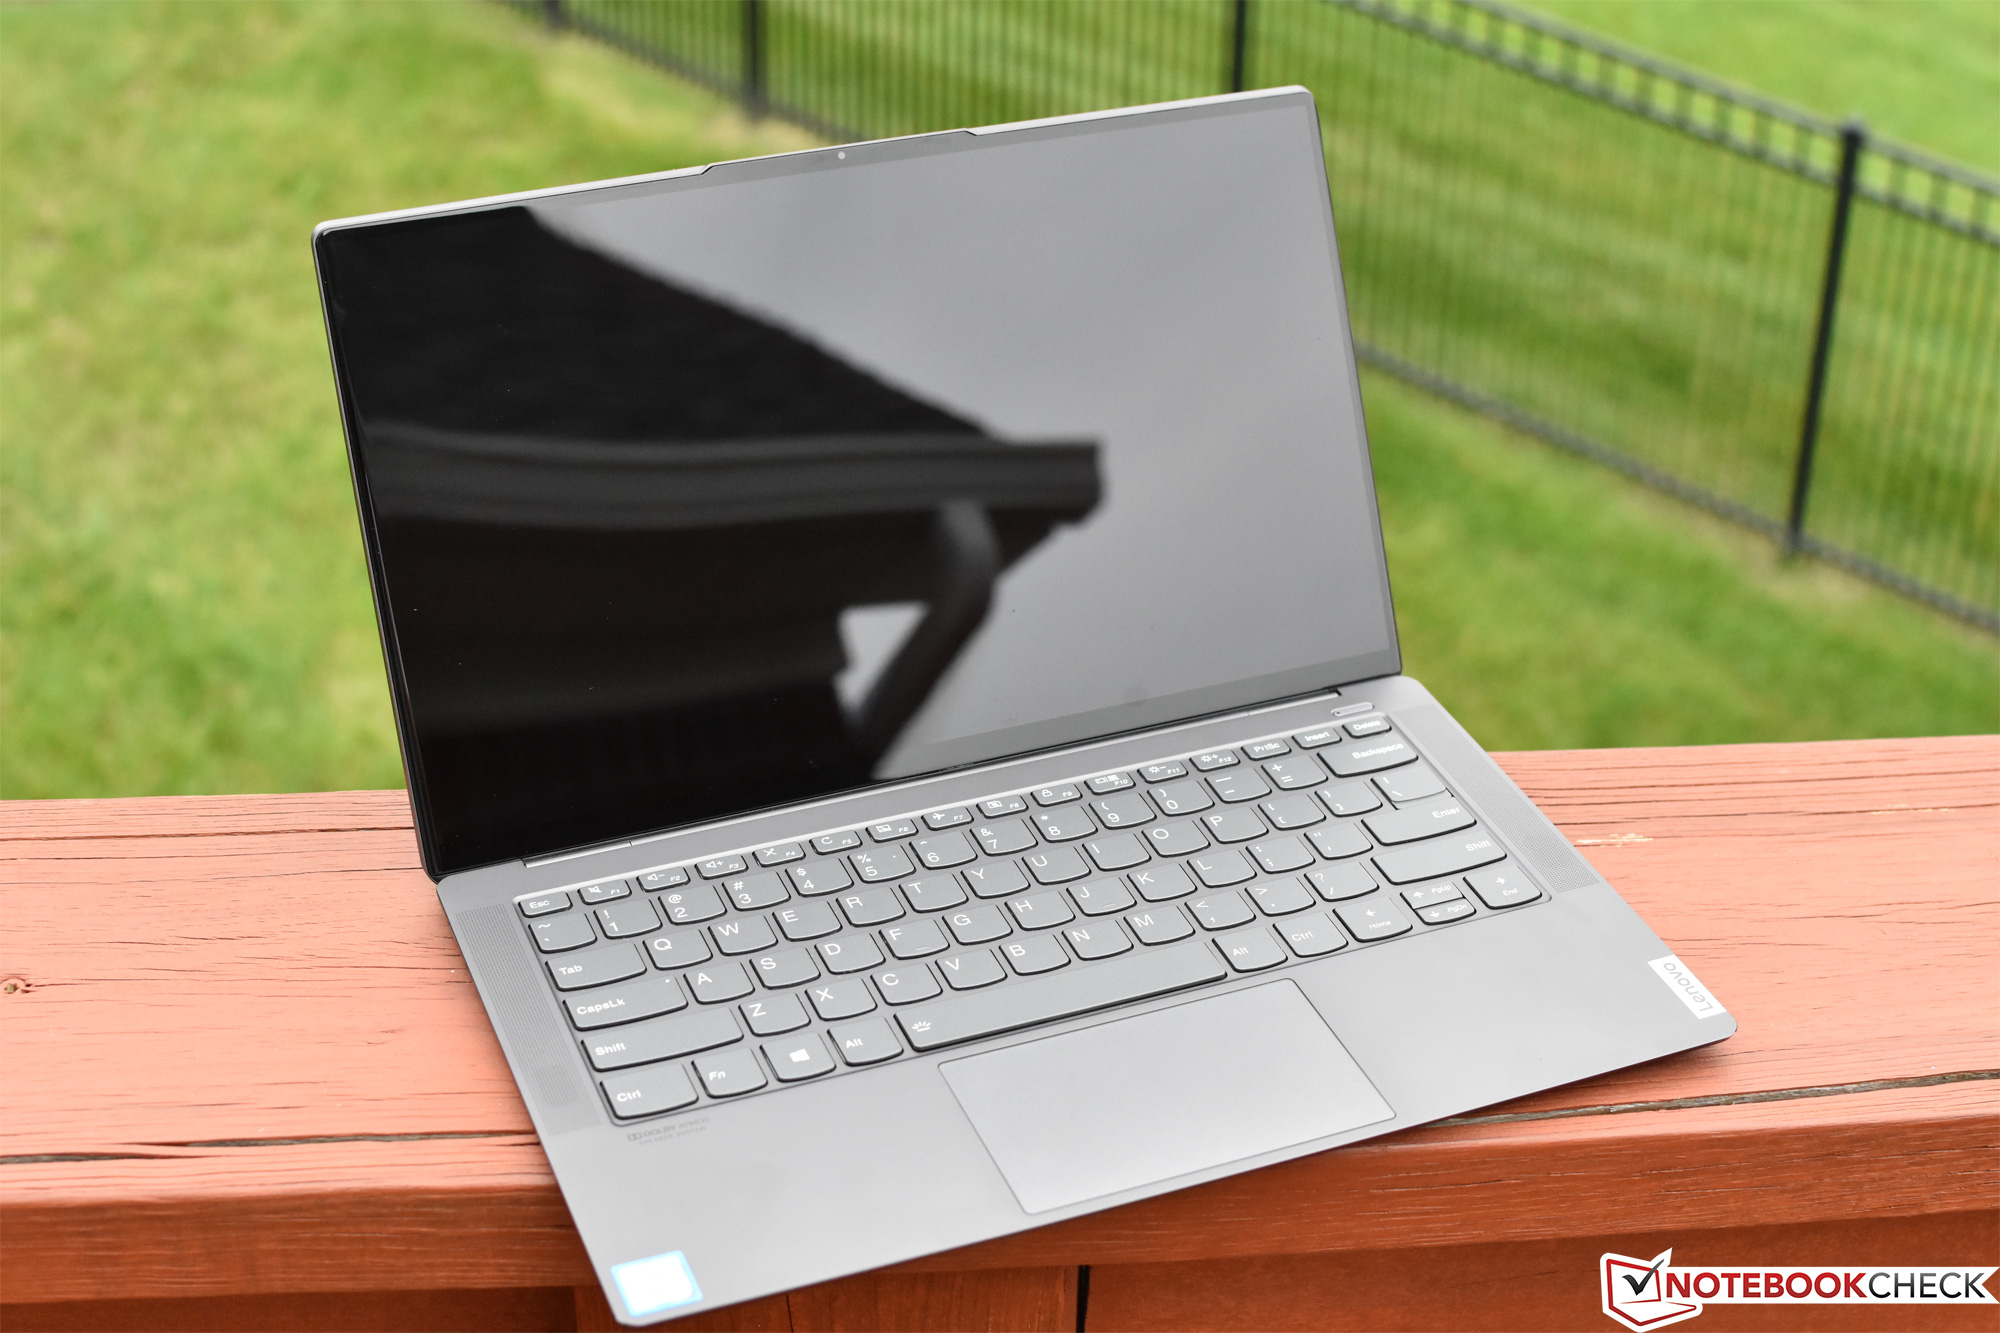
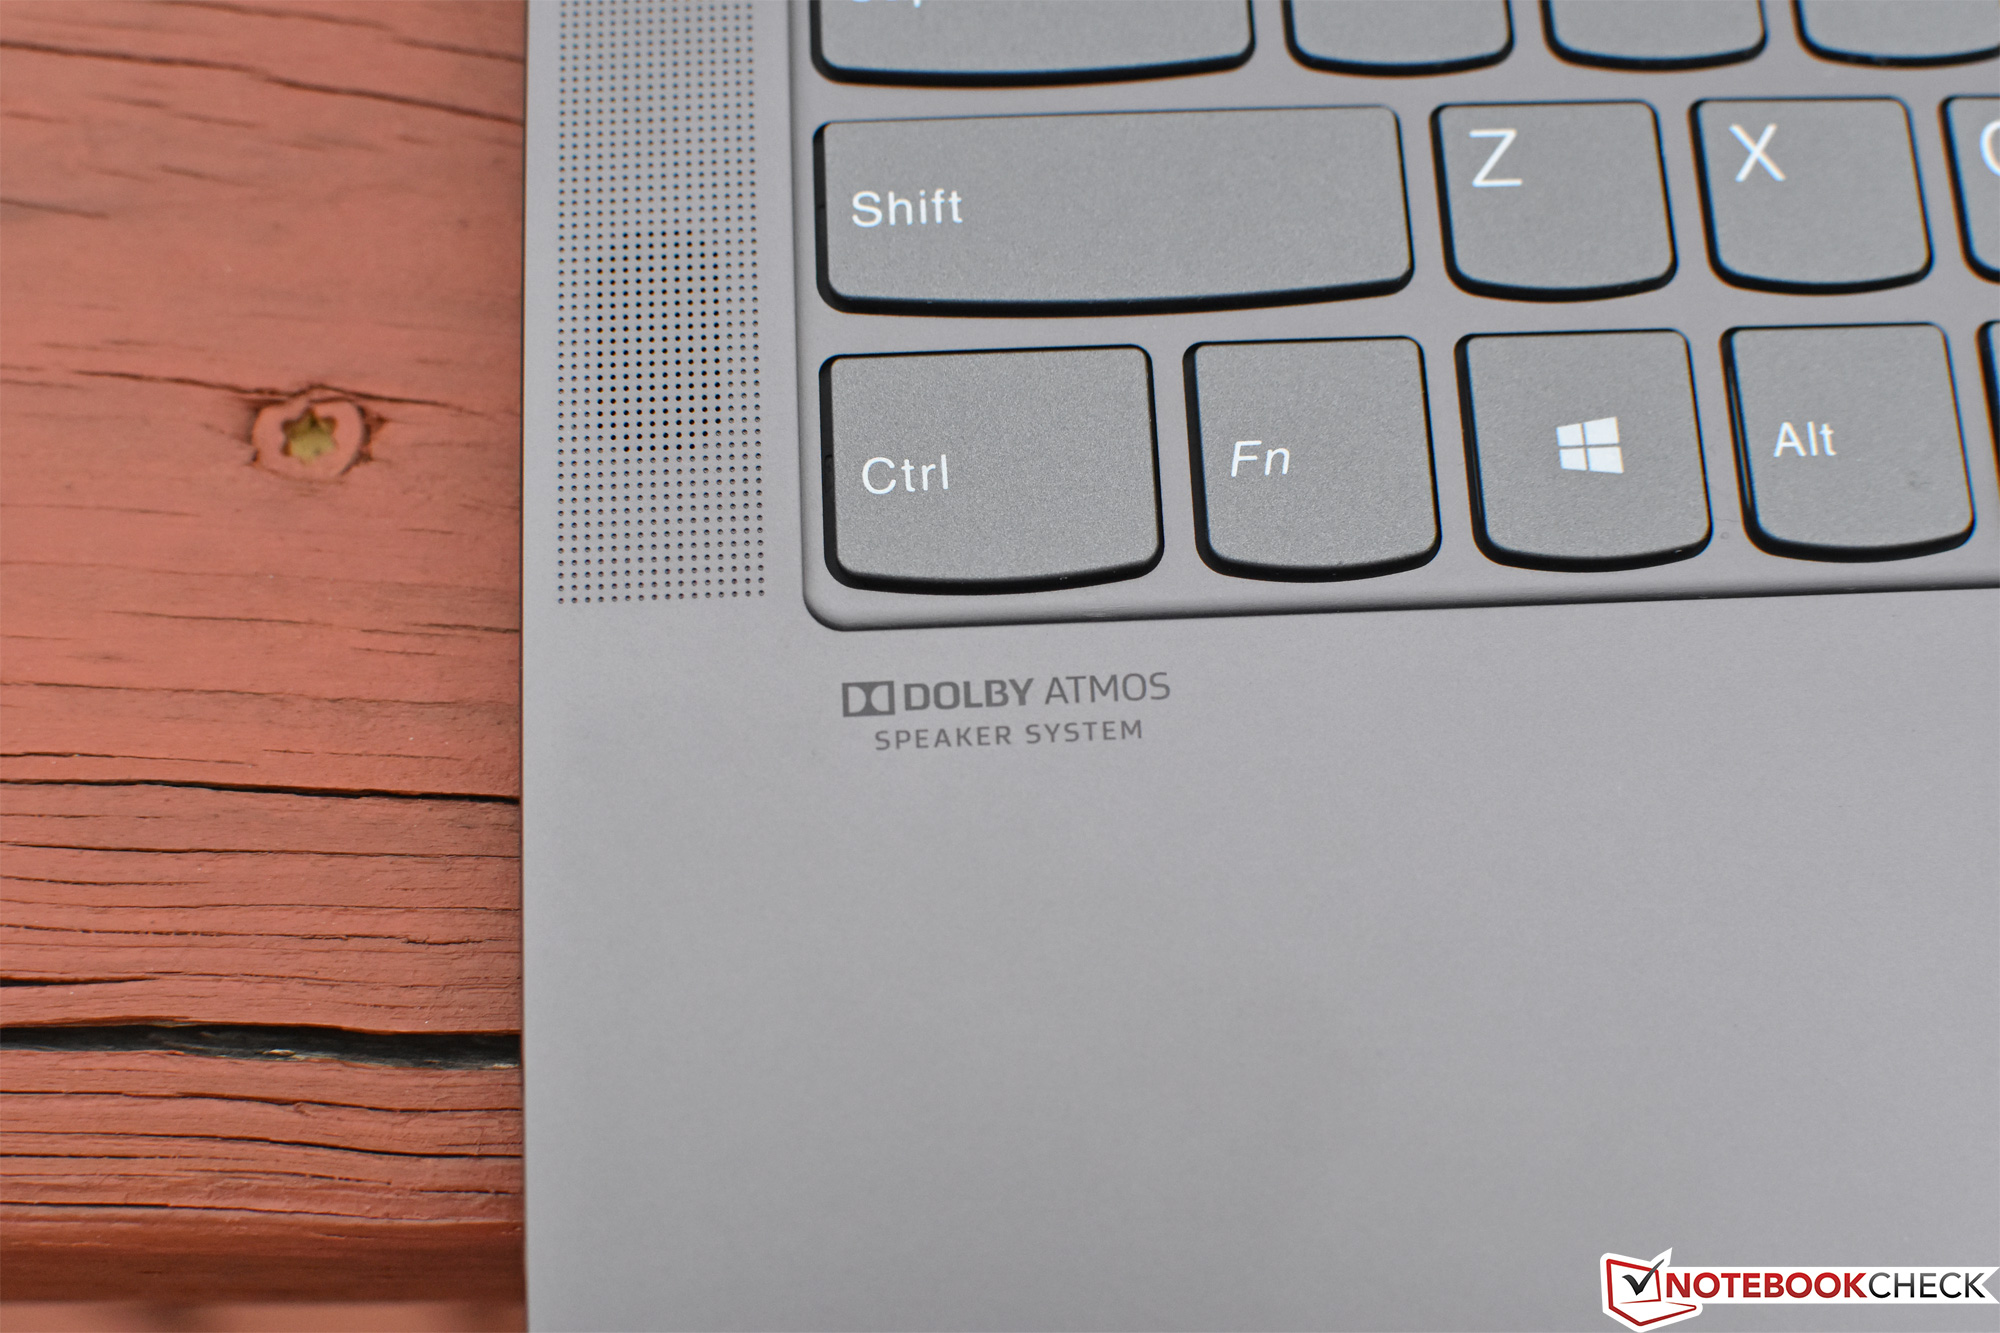
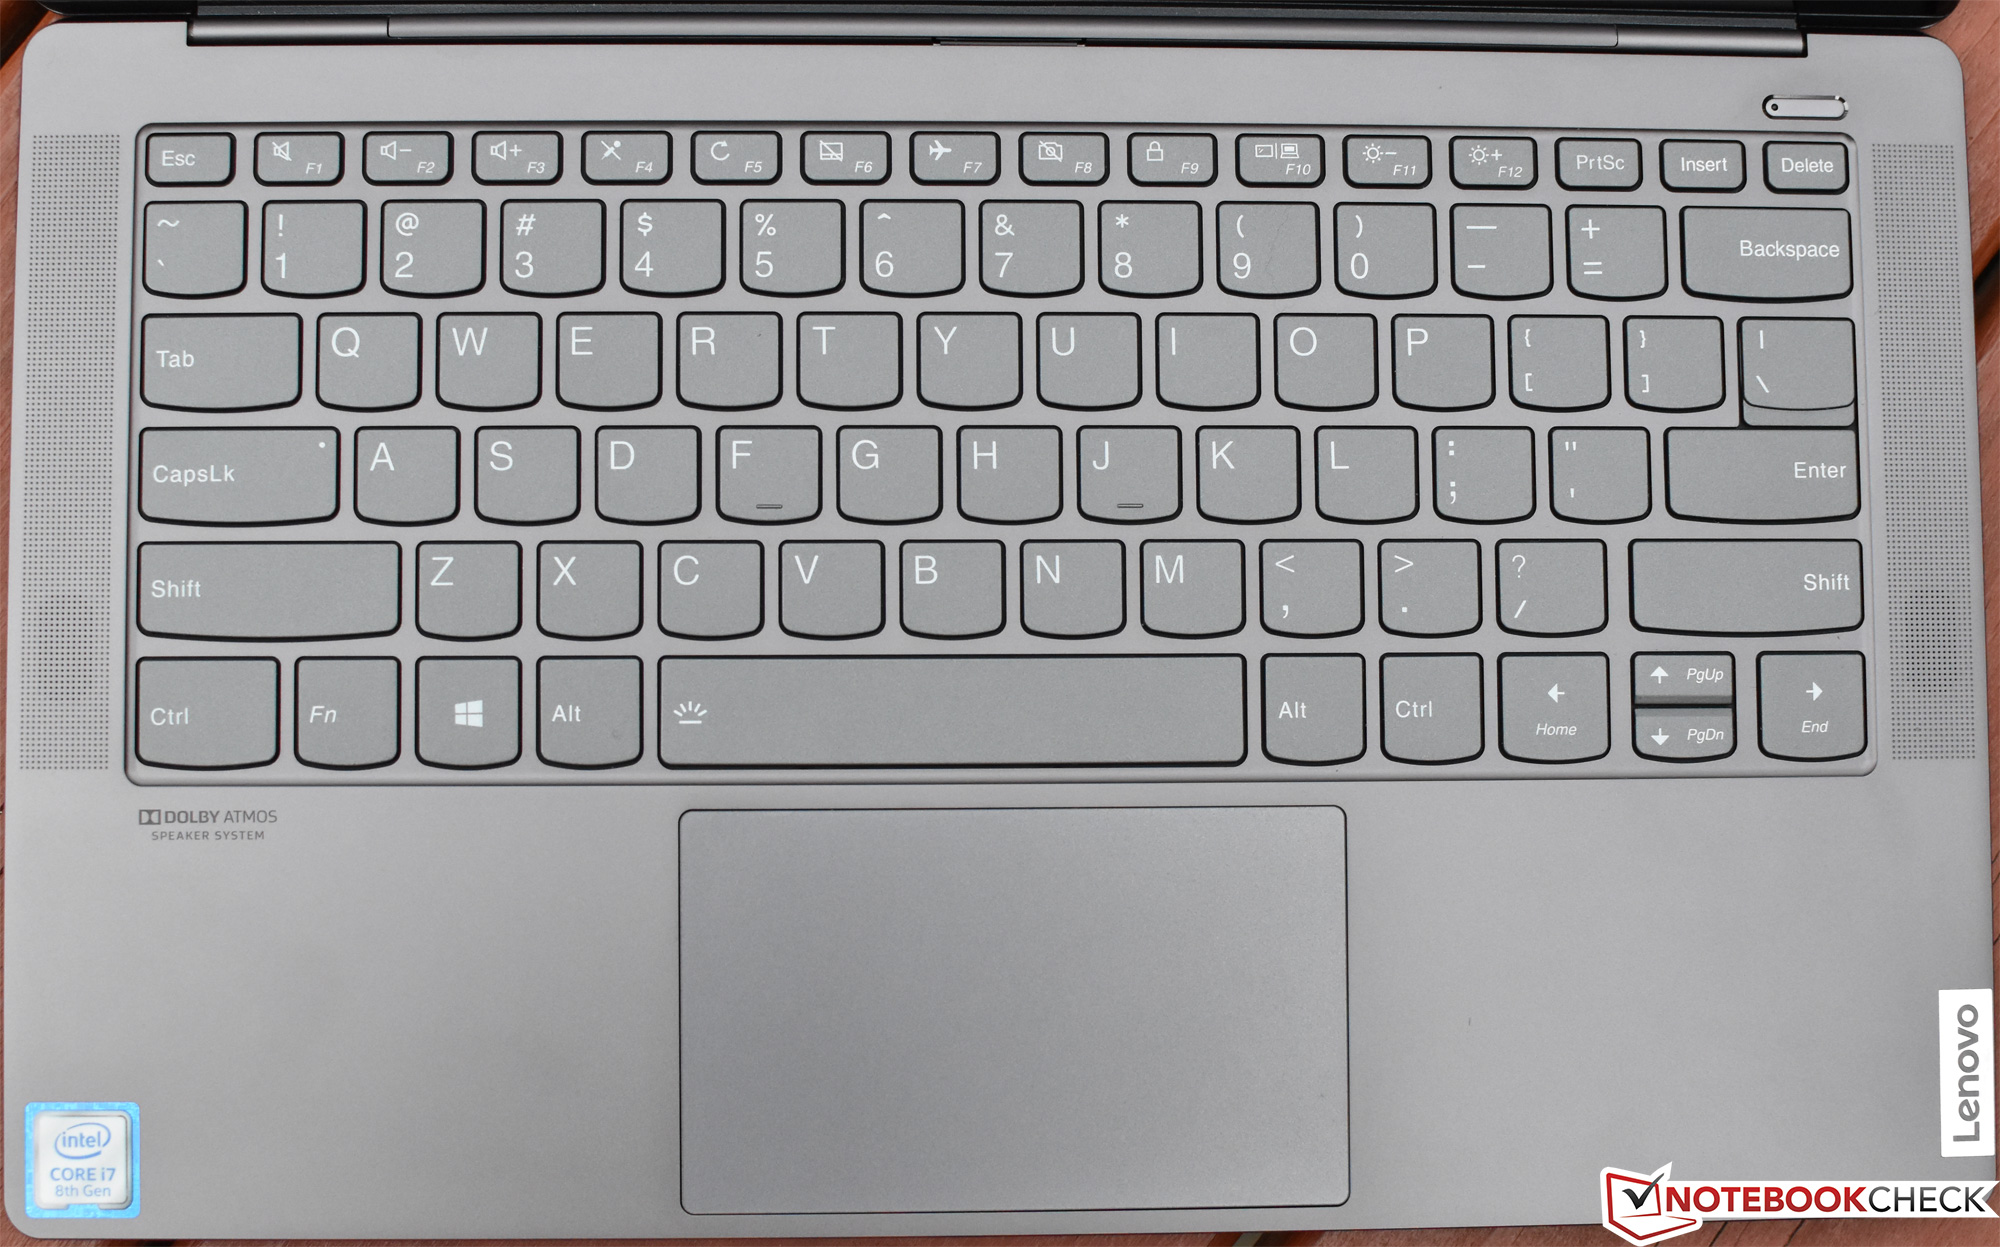
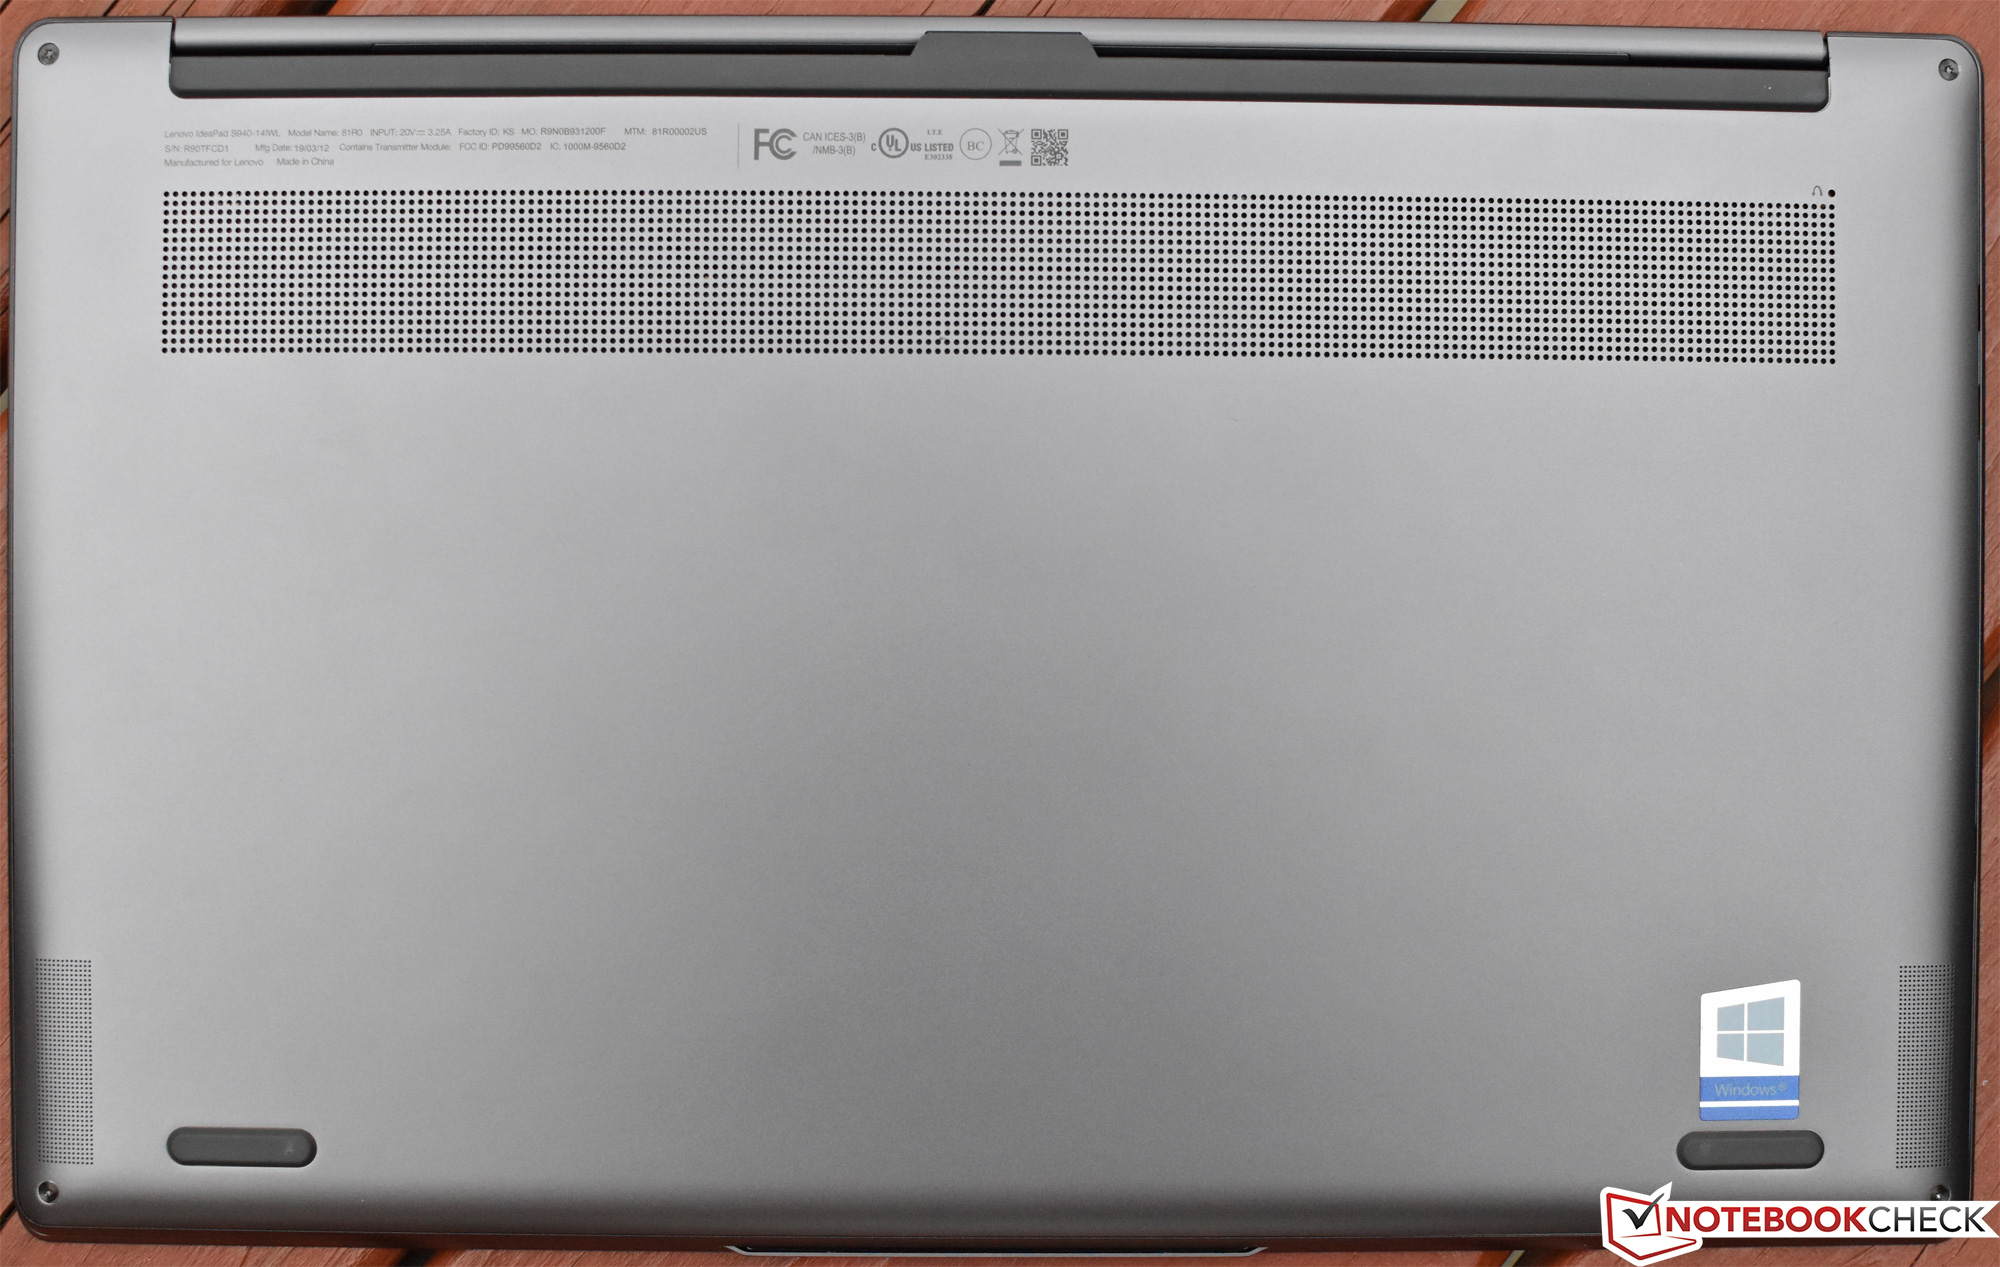
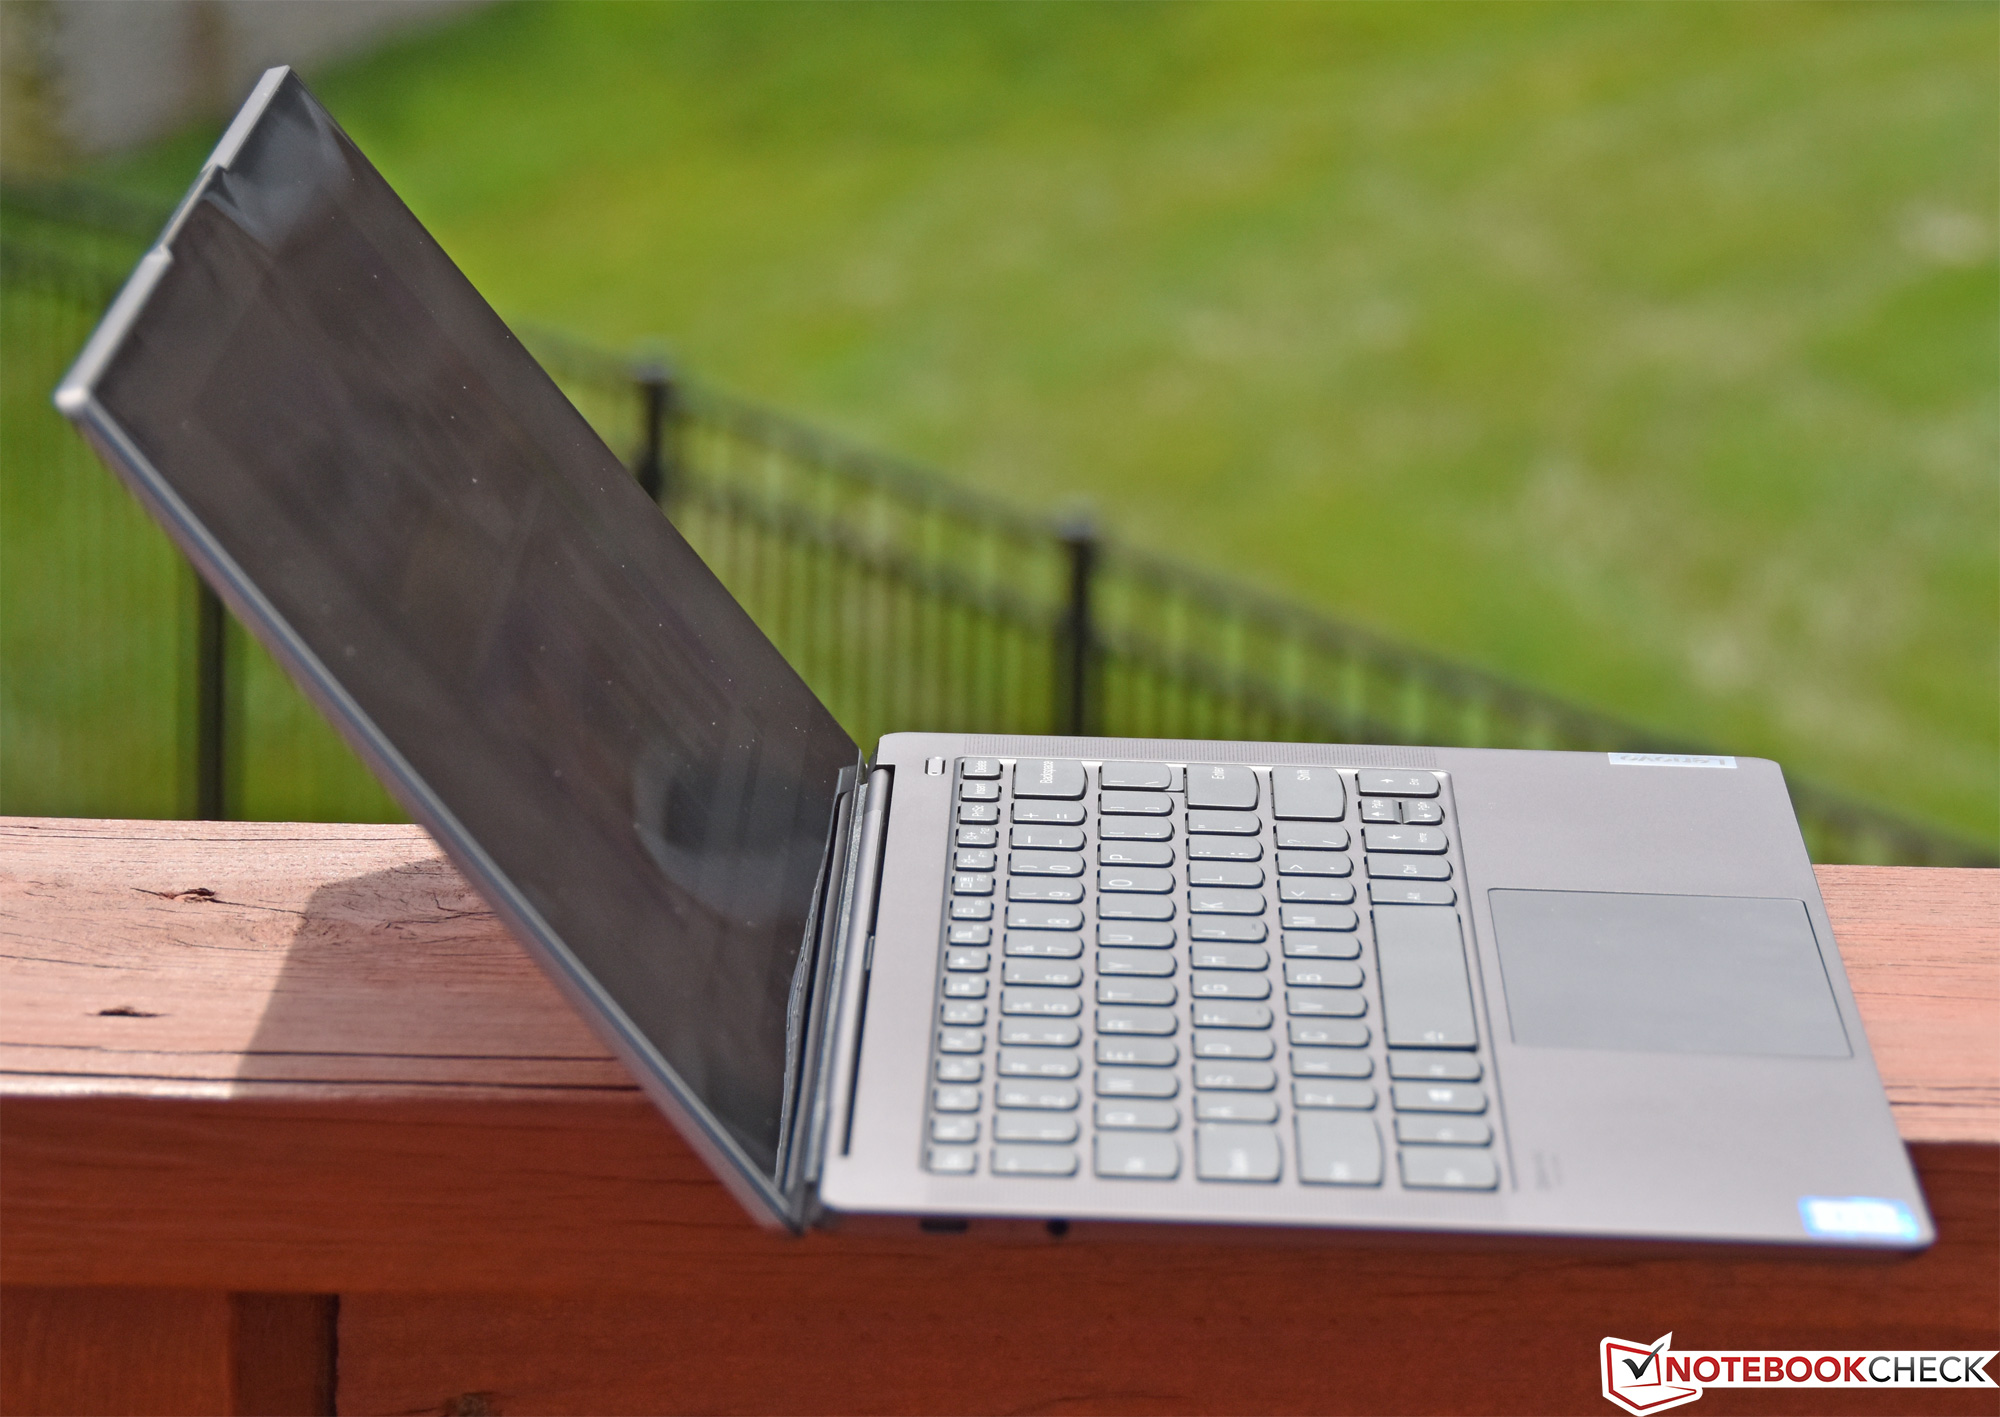
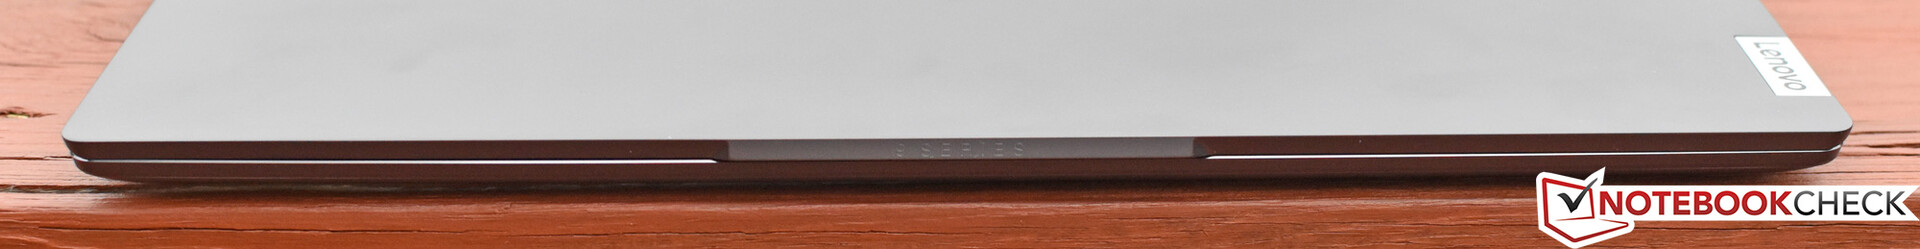
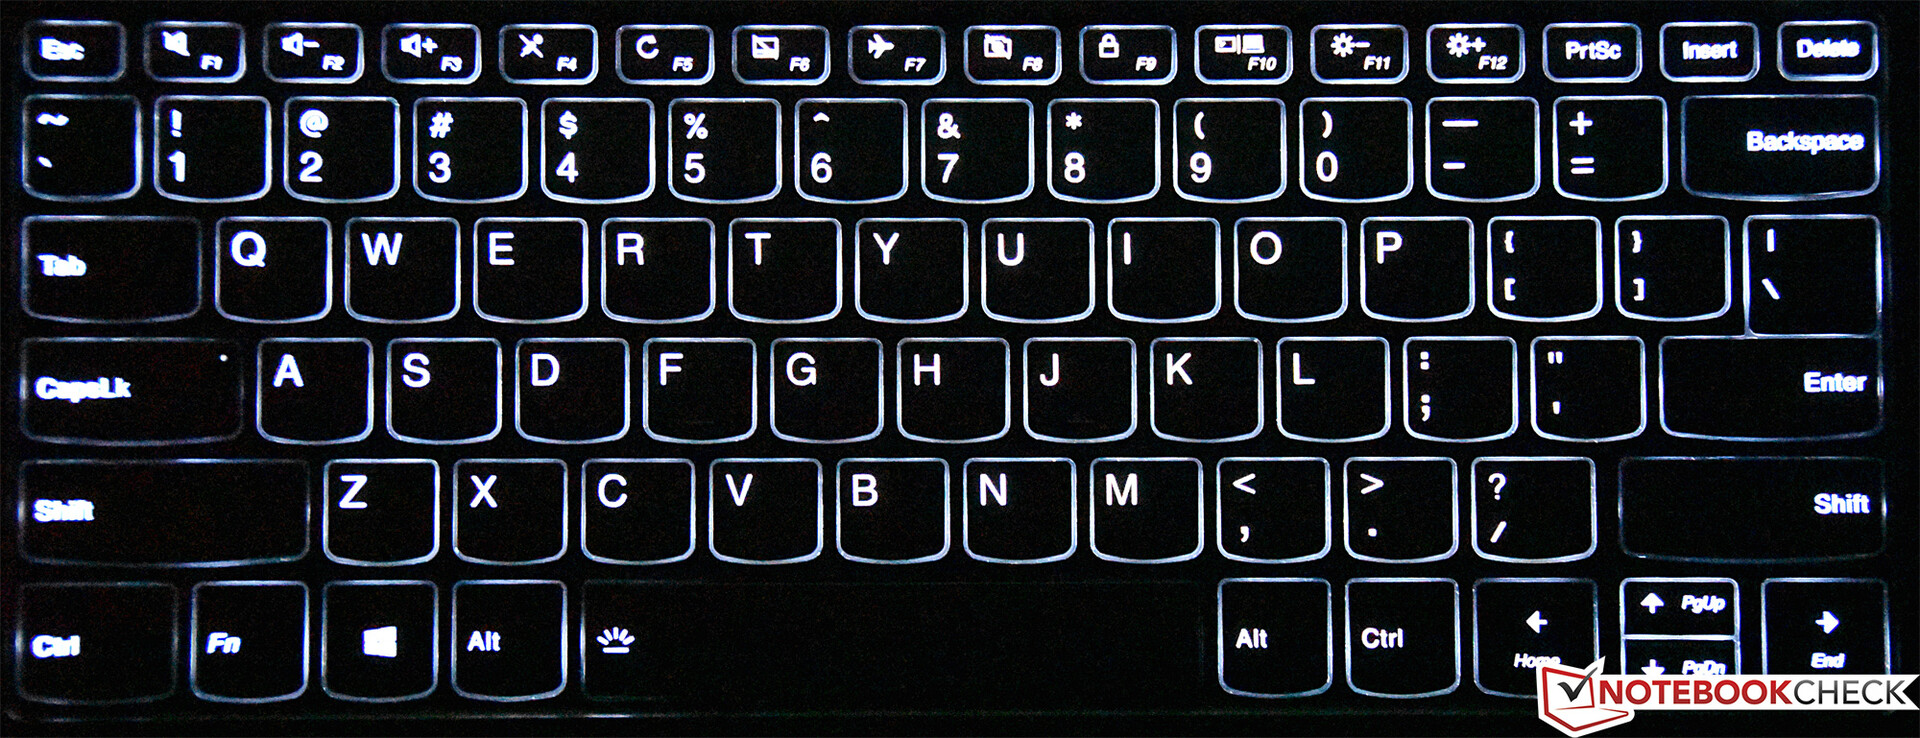
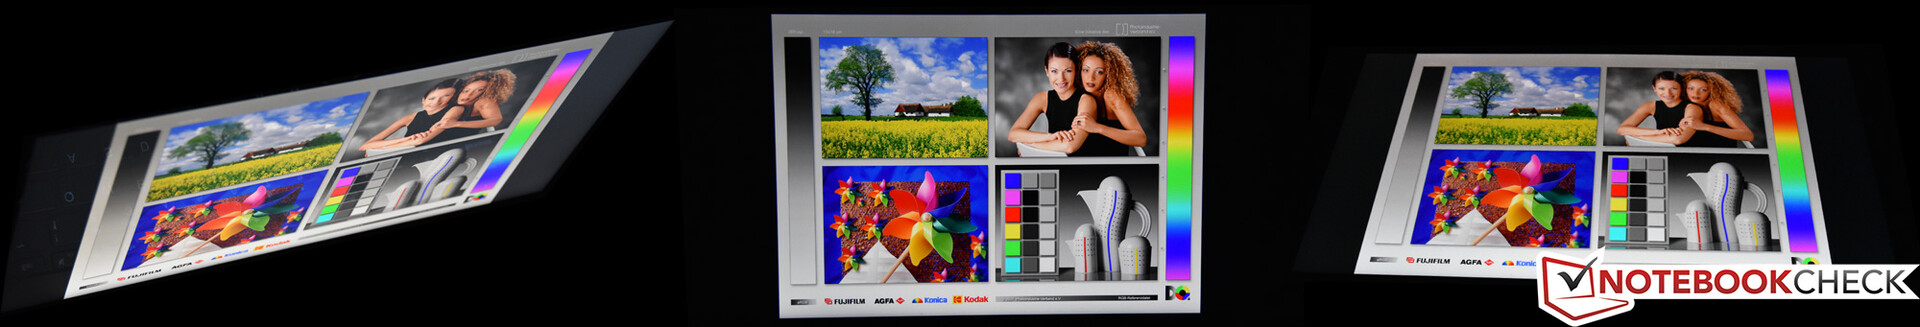
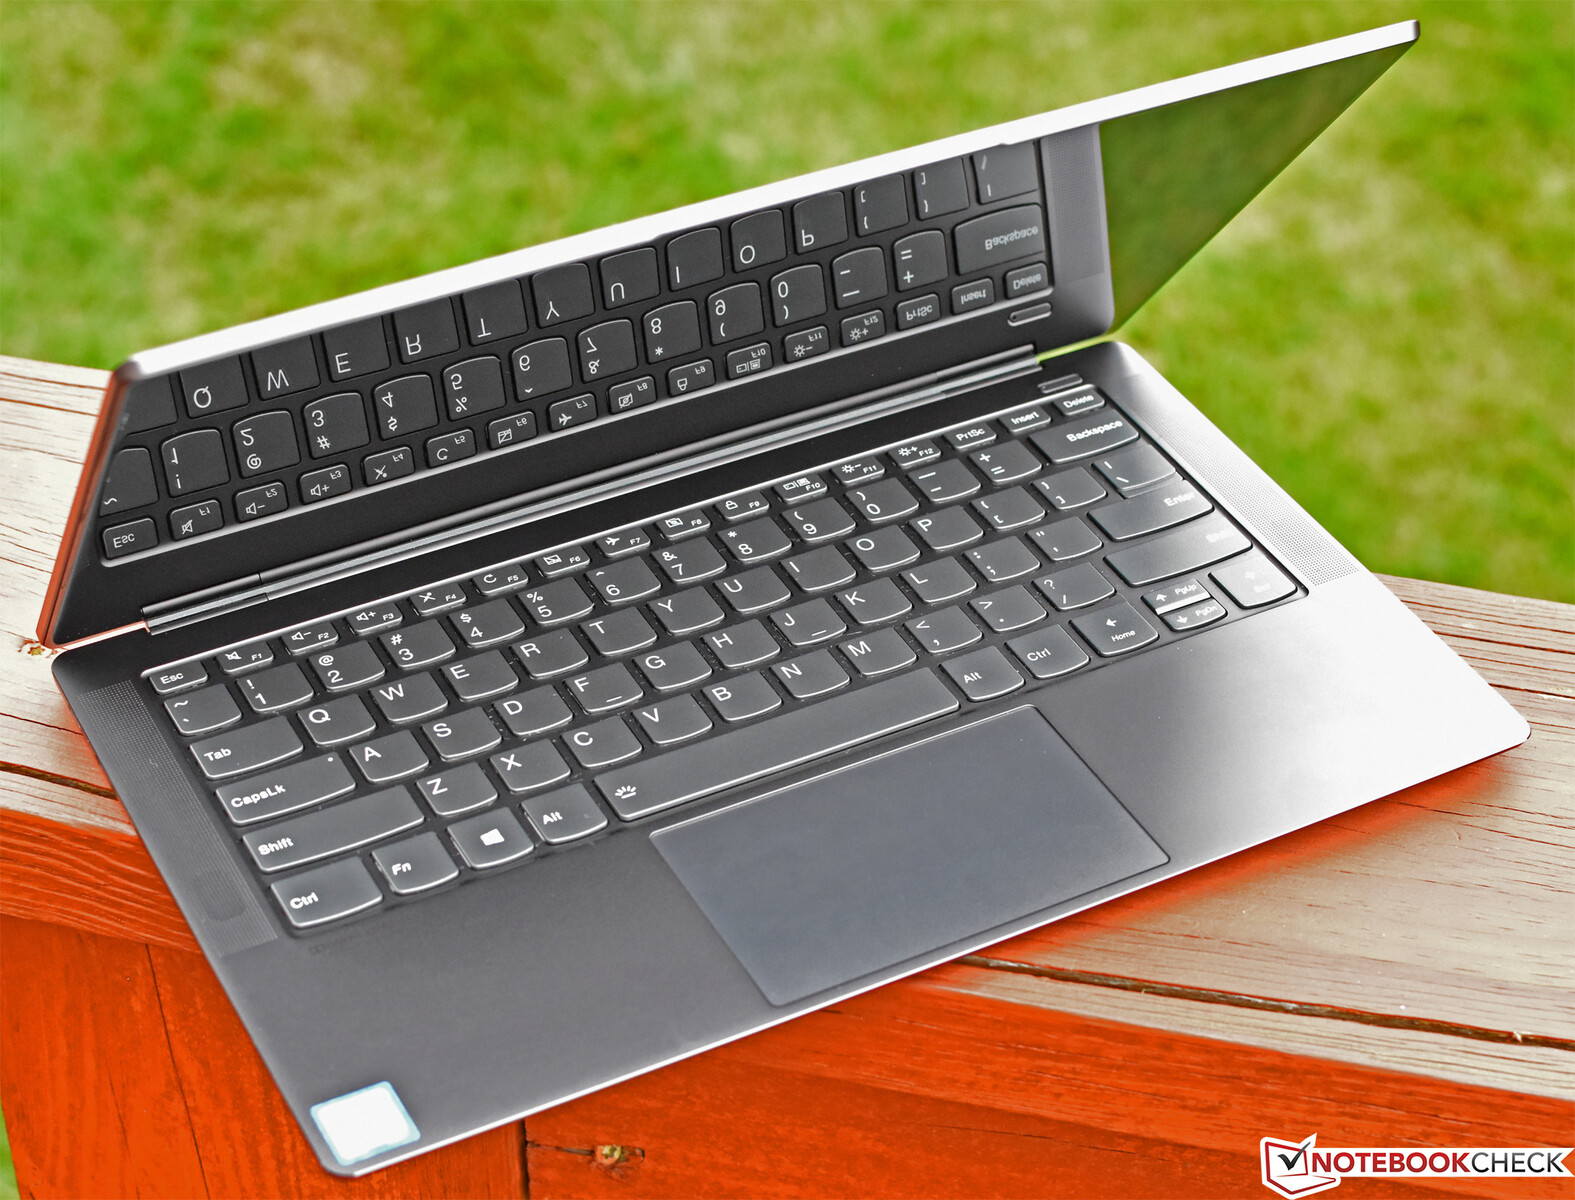
IdeaPad S940 är en otroligt läcker enhet. Det är en av de minsta och lättaste enheterna på 14 tum som vi recenserat hittills och den skulle passa bra både på köksbordet och i styrelserummet. Men trots att den är liten känns den relativt robust i sin konstruktion med ett fast skärmlock, perfekt justerade gångjärn och väldigt lite böjningsmån längs höljet. Den har också en av de mest imponerande — och otroligt ljusstarka — 4K-skärmarna med HDR-stöd som vi någonsin sett i en laptop. Som komplement till skärmen finns inte bara två utan fyra Dolby Atmos högtalare som är mycket kraftigare än de till en början verkar… och även om fysikens lagar förblir en ofrånkomlig begränsning så levererar de en ljudupplevelse som vida överträffar andra bärbara datorer i den här storleken. Den är dessutom nästan helt tyst under i princip alla förhållanden och hörs knappt ens vid belastning. Slutligen, trots den tunna storleken, är inmatningsenheterna ganska skapliga — med en riktigt bra clickpad i glas som ackompanjerar ett grunt med ändå funktionsdugligt tangentbord.
IdeaPad S940 är en vacker laptop som, i vår konfiguration (med en 4K-skärm och en Core i7 CPU), begår ett par allvarliga felsteg som gör den svår att rekommendera åt de flesta användare. Vi ser fram mot att någon gång framöver utvärdera en FHD-konfiguration med en Core i5 CPU, vilket vi hoppas kommer lösa en del av besvikelserna.
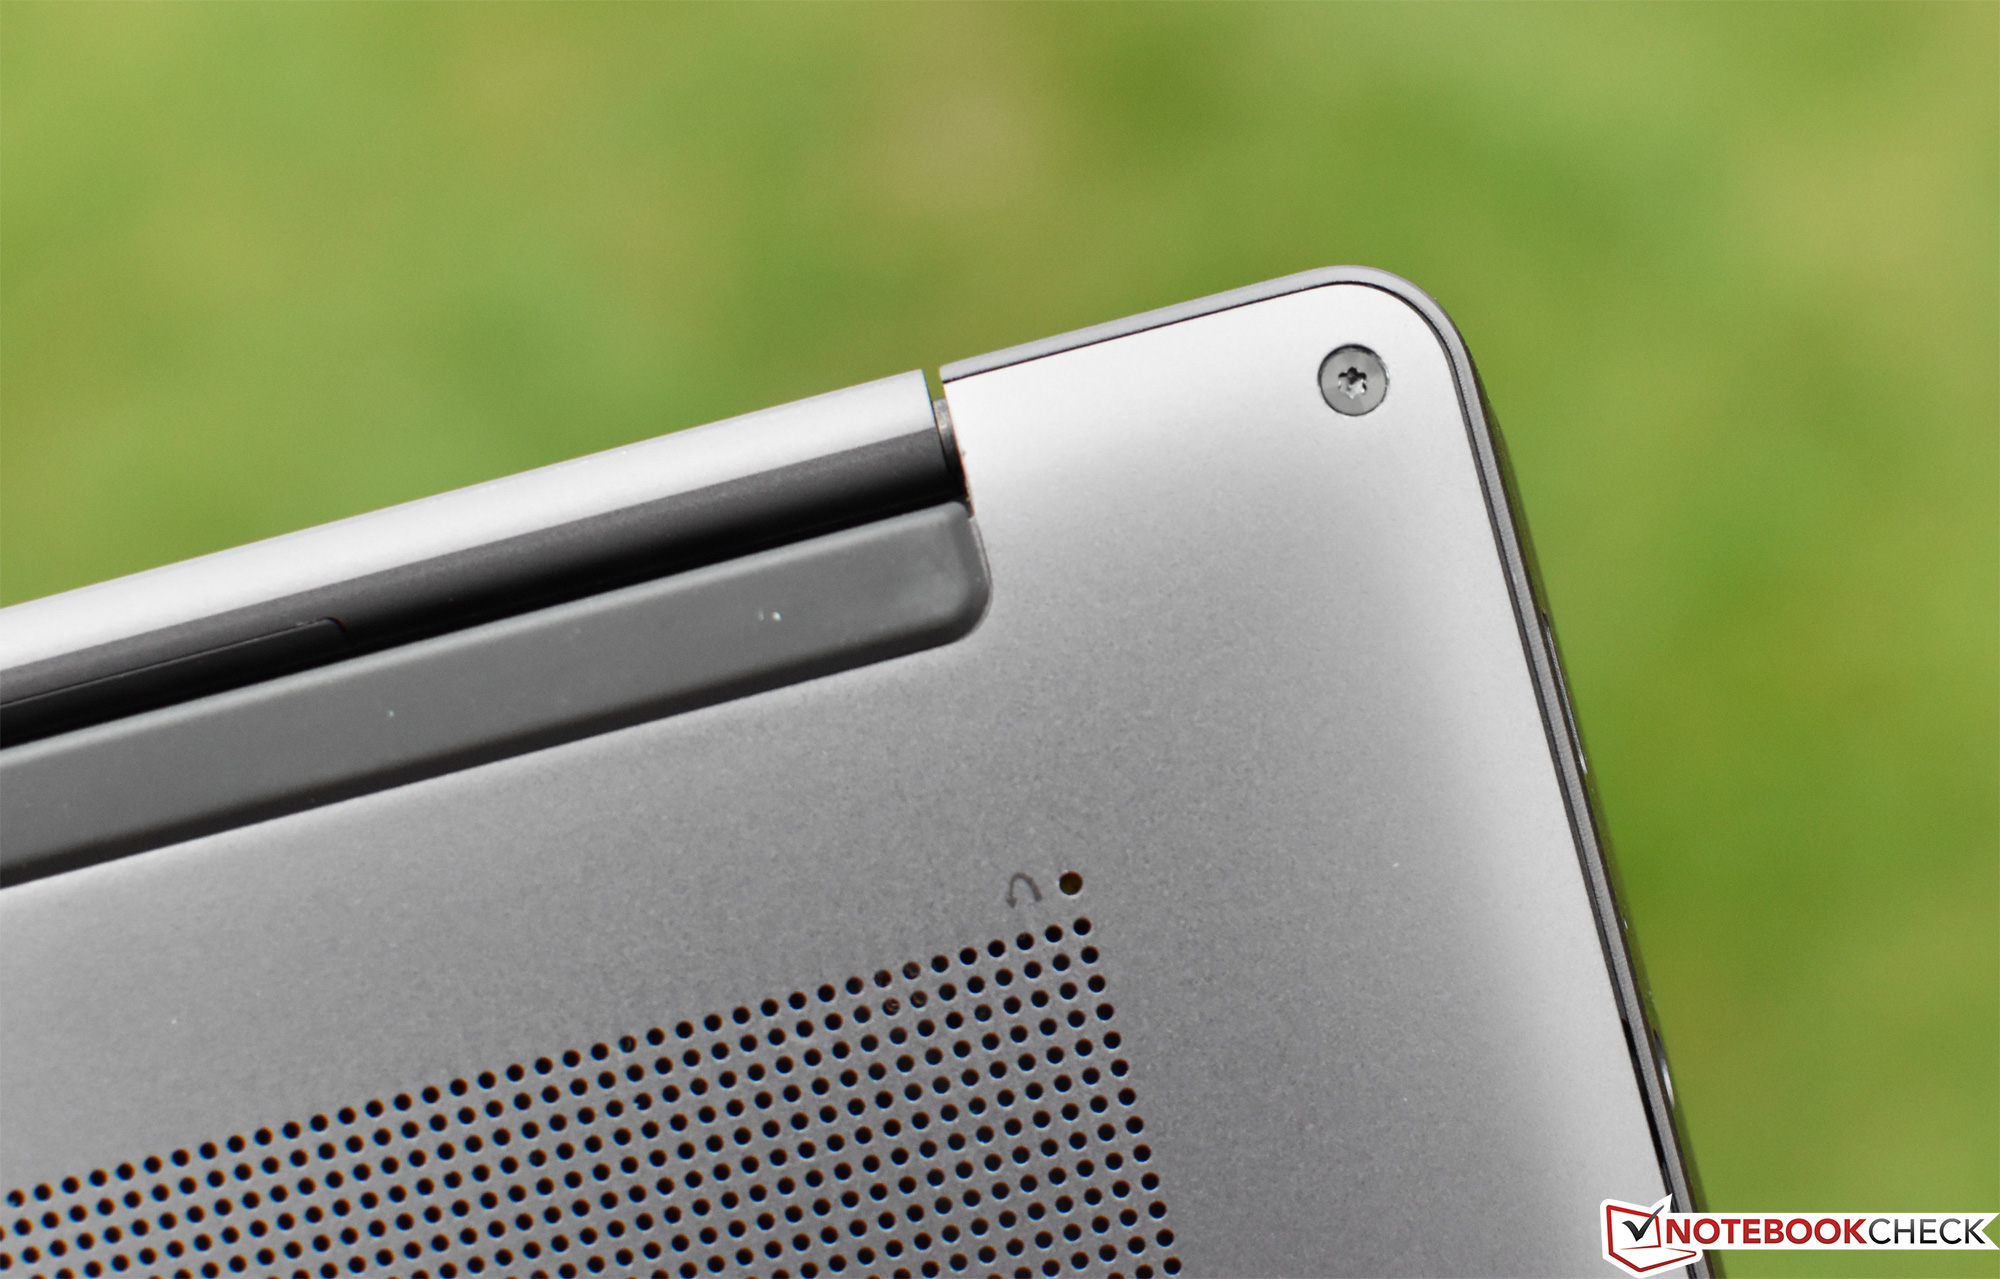
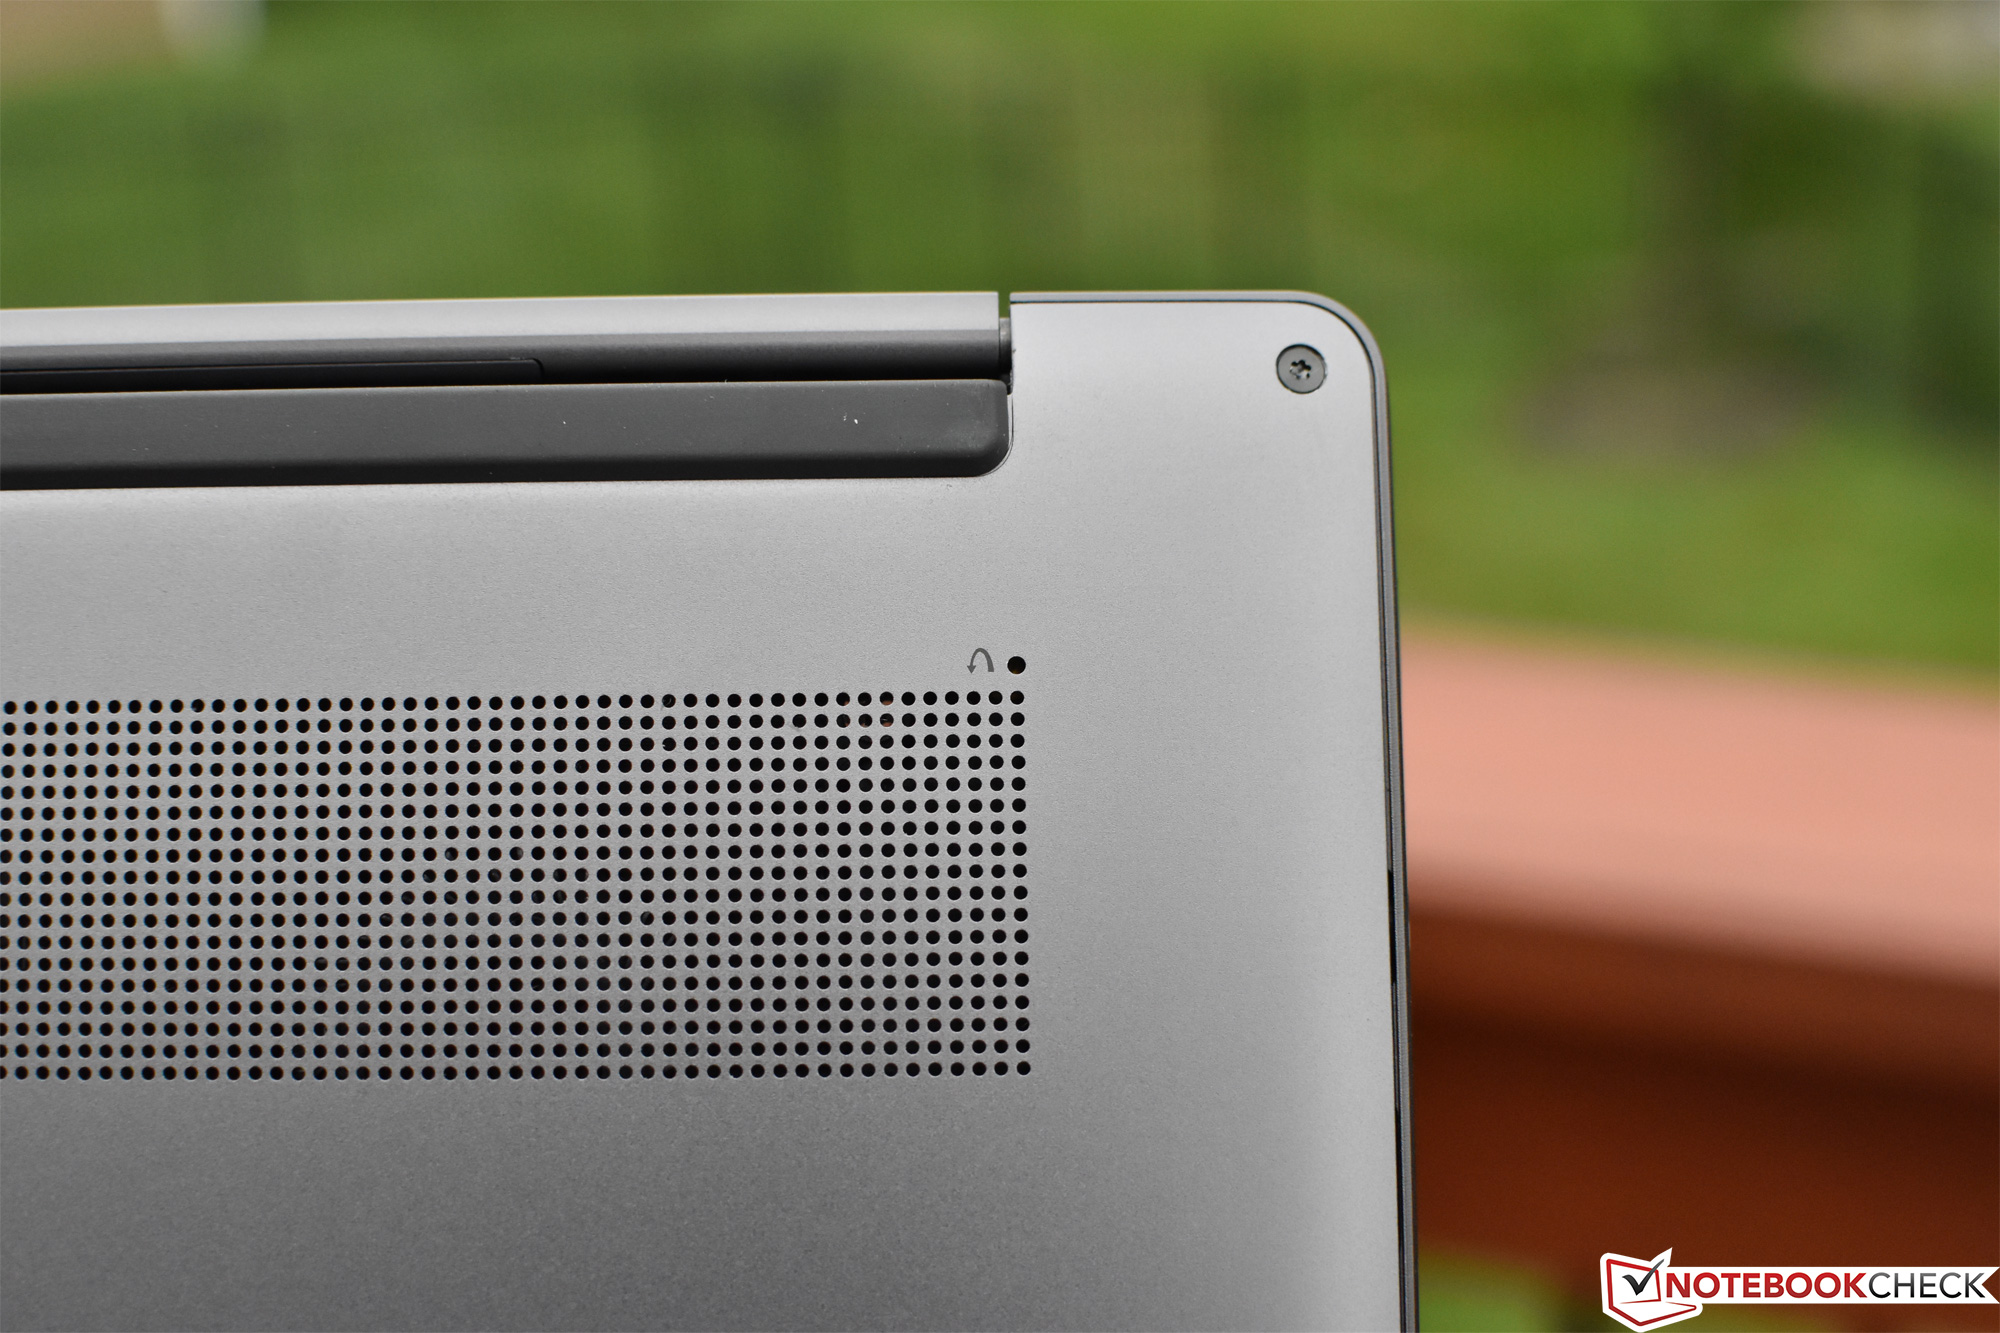
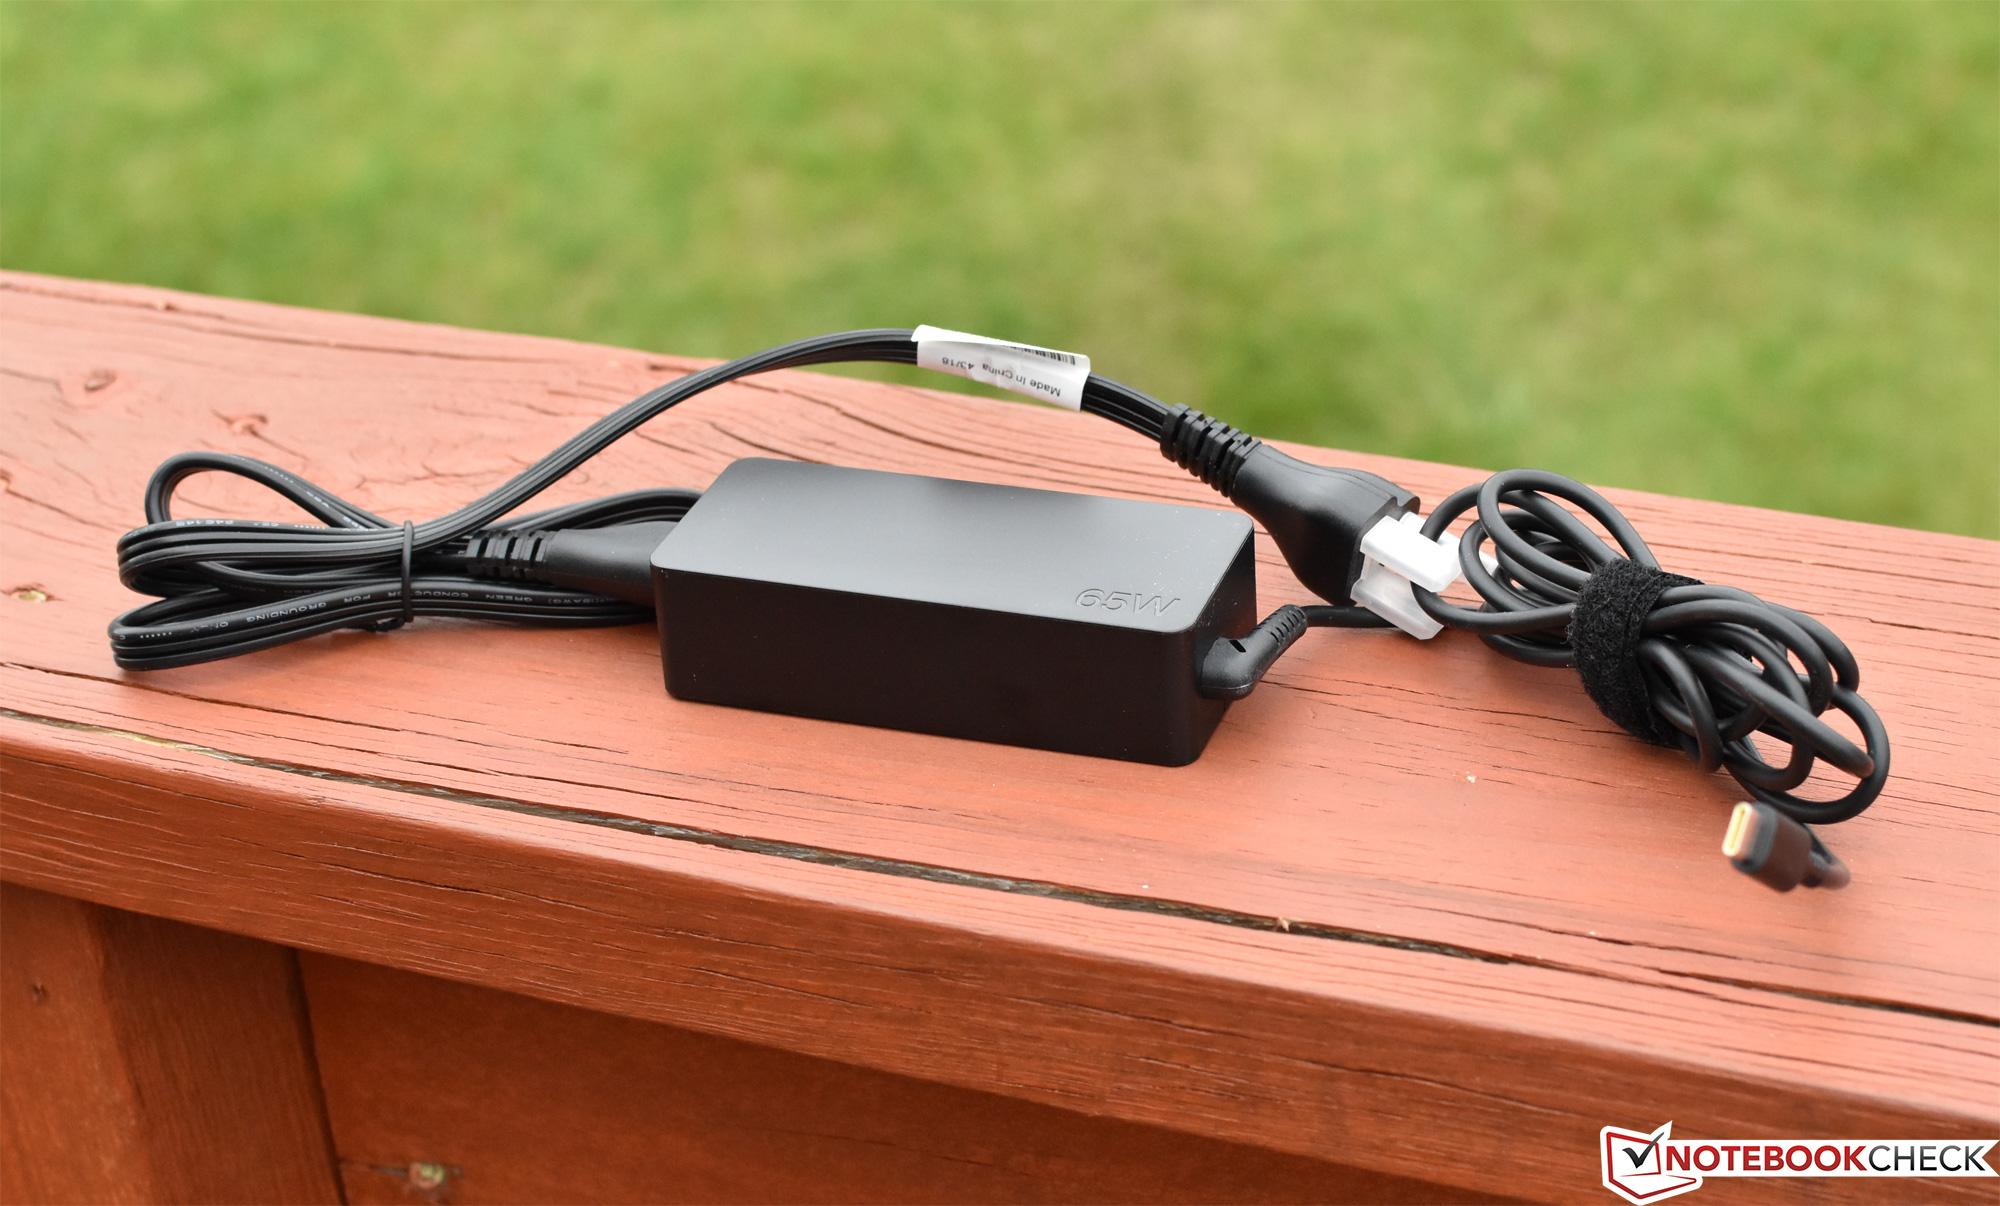
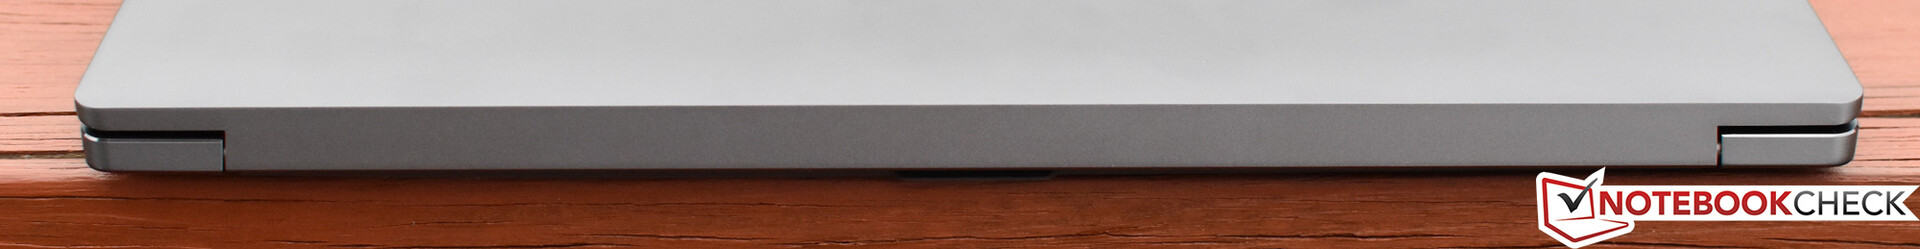
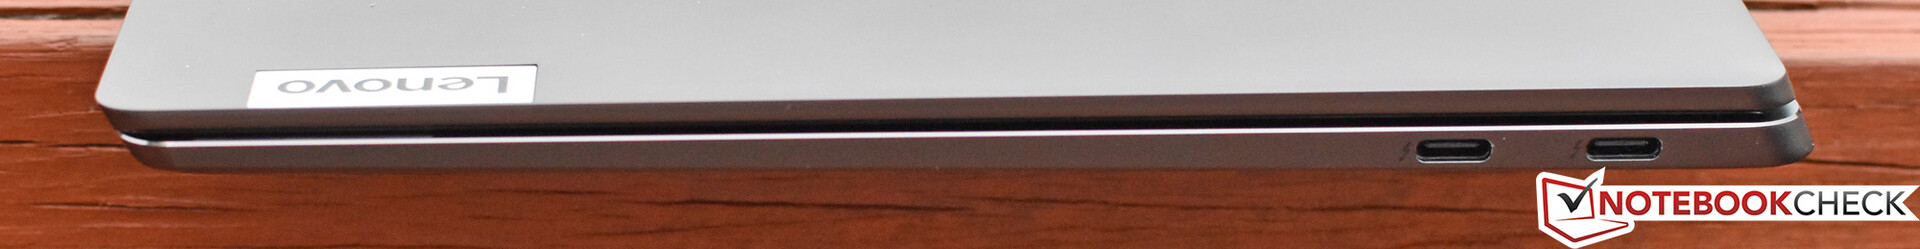
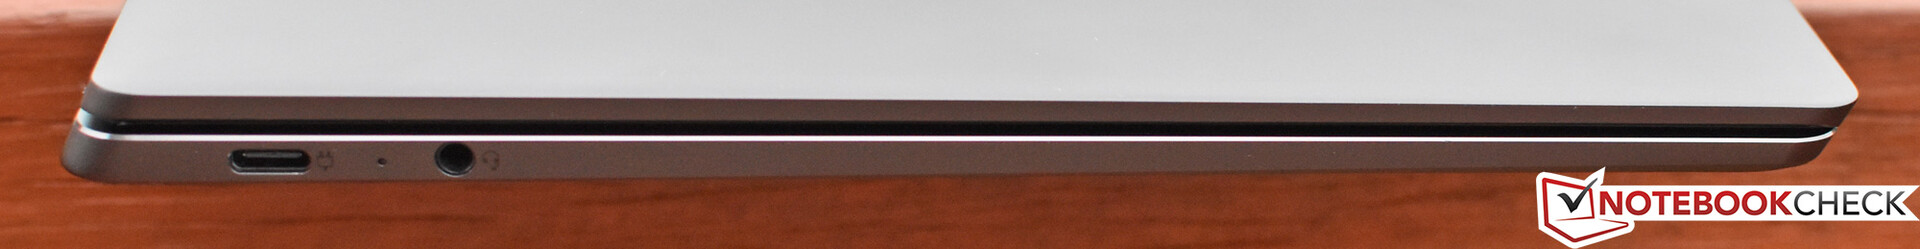
Om bara hela paketet var så fantastiskt. Tyvärr tar saker en vändning mot mindre imponerande. Portutbudet är en aning tunt, med två Thunderbolt 3.0-portar (ingen dedikerad laddningsport) bredvid en enda USB Typ C-port och en hörlursanslutning. Energiförbrukningen är på den höga sidan och batteritiden är riktigt kort — under 5 timmar i vårt nätsurfartest. Men de största problemet beror på maskinens ovilja — eller kanske snarare oförmåga — att hålla sig sval: ihållande belastning resulterar i temperaturer som snabbt klättrar upp till 90 grader, vilket de sedan stannar på. Resultatet är CPU-prestanda som ligger under genomsnittet för den Core i7 CPU vår recensionsenhet är utrustad med. Men datorn är precis lika ointresserad av att hålla sig sval vid tomgång och normal användning — en nonchalans som resulterar i yttemperaturer som är mycket högre än normalt och i många situationer gör den obekväm att ha i knät.
Tyvärr är de praktiska användningsmöjligheterna för S940 — trots den fantastiska UHD-skärmen vi nämnt tidigare — mycket färre än de hade kunnat vara. Det är dock troligt att alternativet med FHD-skärm åtminstone kommer förbättra batteritiden, även om vi inte kan säga säkert eftersom vi ännu inte hunnit testa en sådan konfiguration. Om processorprestanda inte är viktigt kanske det går att ha förbiseende med även den bristen — eller återigen, kanske presterar Core i5 processorn precis lika bra till ett mycket lägre pris. Detta kan eventuellt också hjälpa på temperaturfronten, vilket skulle förbättra hela situationen. Så som den är konfigurerad nu är det dock, trots den otroligt tjusiga fjäderlätta konstruktionen och den fantastiska skärmen, svårt att rekommendera S940 för 20.000 kronor istället för Lenovos egna flaggskepp X1 Carbon eller någon av dess andra nära konkurrenter (som alla presterar bättre i de flesta av dessa kategorier), såsom Dell XPS 13 eller MacBook Pro 13.
Lenovo IdeaPad S940-14IWL
- 06/27/2019 v6 (old)
Steve Schardein
Price comparison
