Microsoft Surface Pro 9 ARM recension - Den avancerade konvertibla ARM-versionen sviker
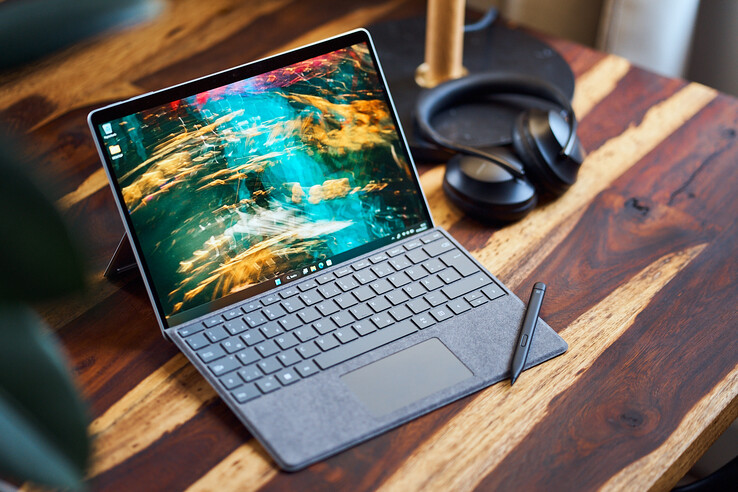
Microsoft har lagt den gamla Surface Pro Xmed ARM-processorer och erbjuder nu istället två versioner av den nya Surface Pro 9. Vi har redan testat Intel-modellennyligen, och nu tar vi en titt på modellen med ARM-processor från Qualcomm. Vid en första anblick är de mest uppenbara skillnaderna det integrerade 5G-modemet i ARM-versionen och avsaknaden av fläkt, vilket gör att Surface Pro 9 ARM alltid körs tyst.
När det gäller priset börjar ARM-modellen med 8 GB RAM och en liten 128 GB SSD på 1 549 euro (~1 648 dollar), vilket gör den dyrare än Core-i5-versionen med 8 GB RAM och 256 GB SSD för 1 299 euro (~1 382 dollar; endast konvertibel, inmatningsenheter kostar extra). ARM-versionen erbjuder naturligtvis 5G, men med 256 GB lagring blir den cirka 350 euro (~372 dollar) dyrare än den jämförbara i5-modellen. Med det dyrare priset antyder Microsoft en produkt som är minst lika bra, men är det verkligen så?
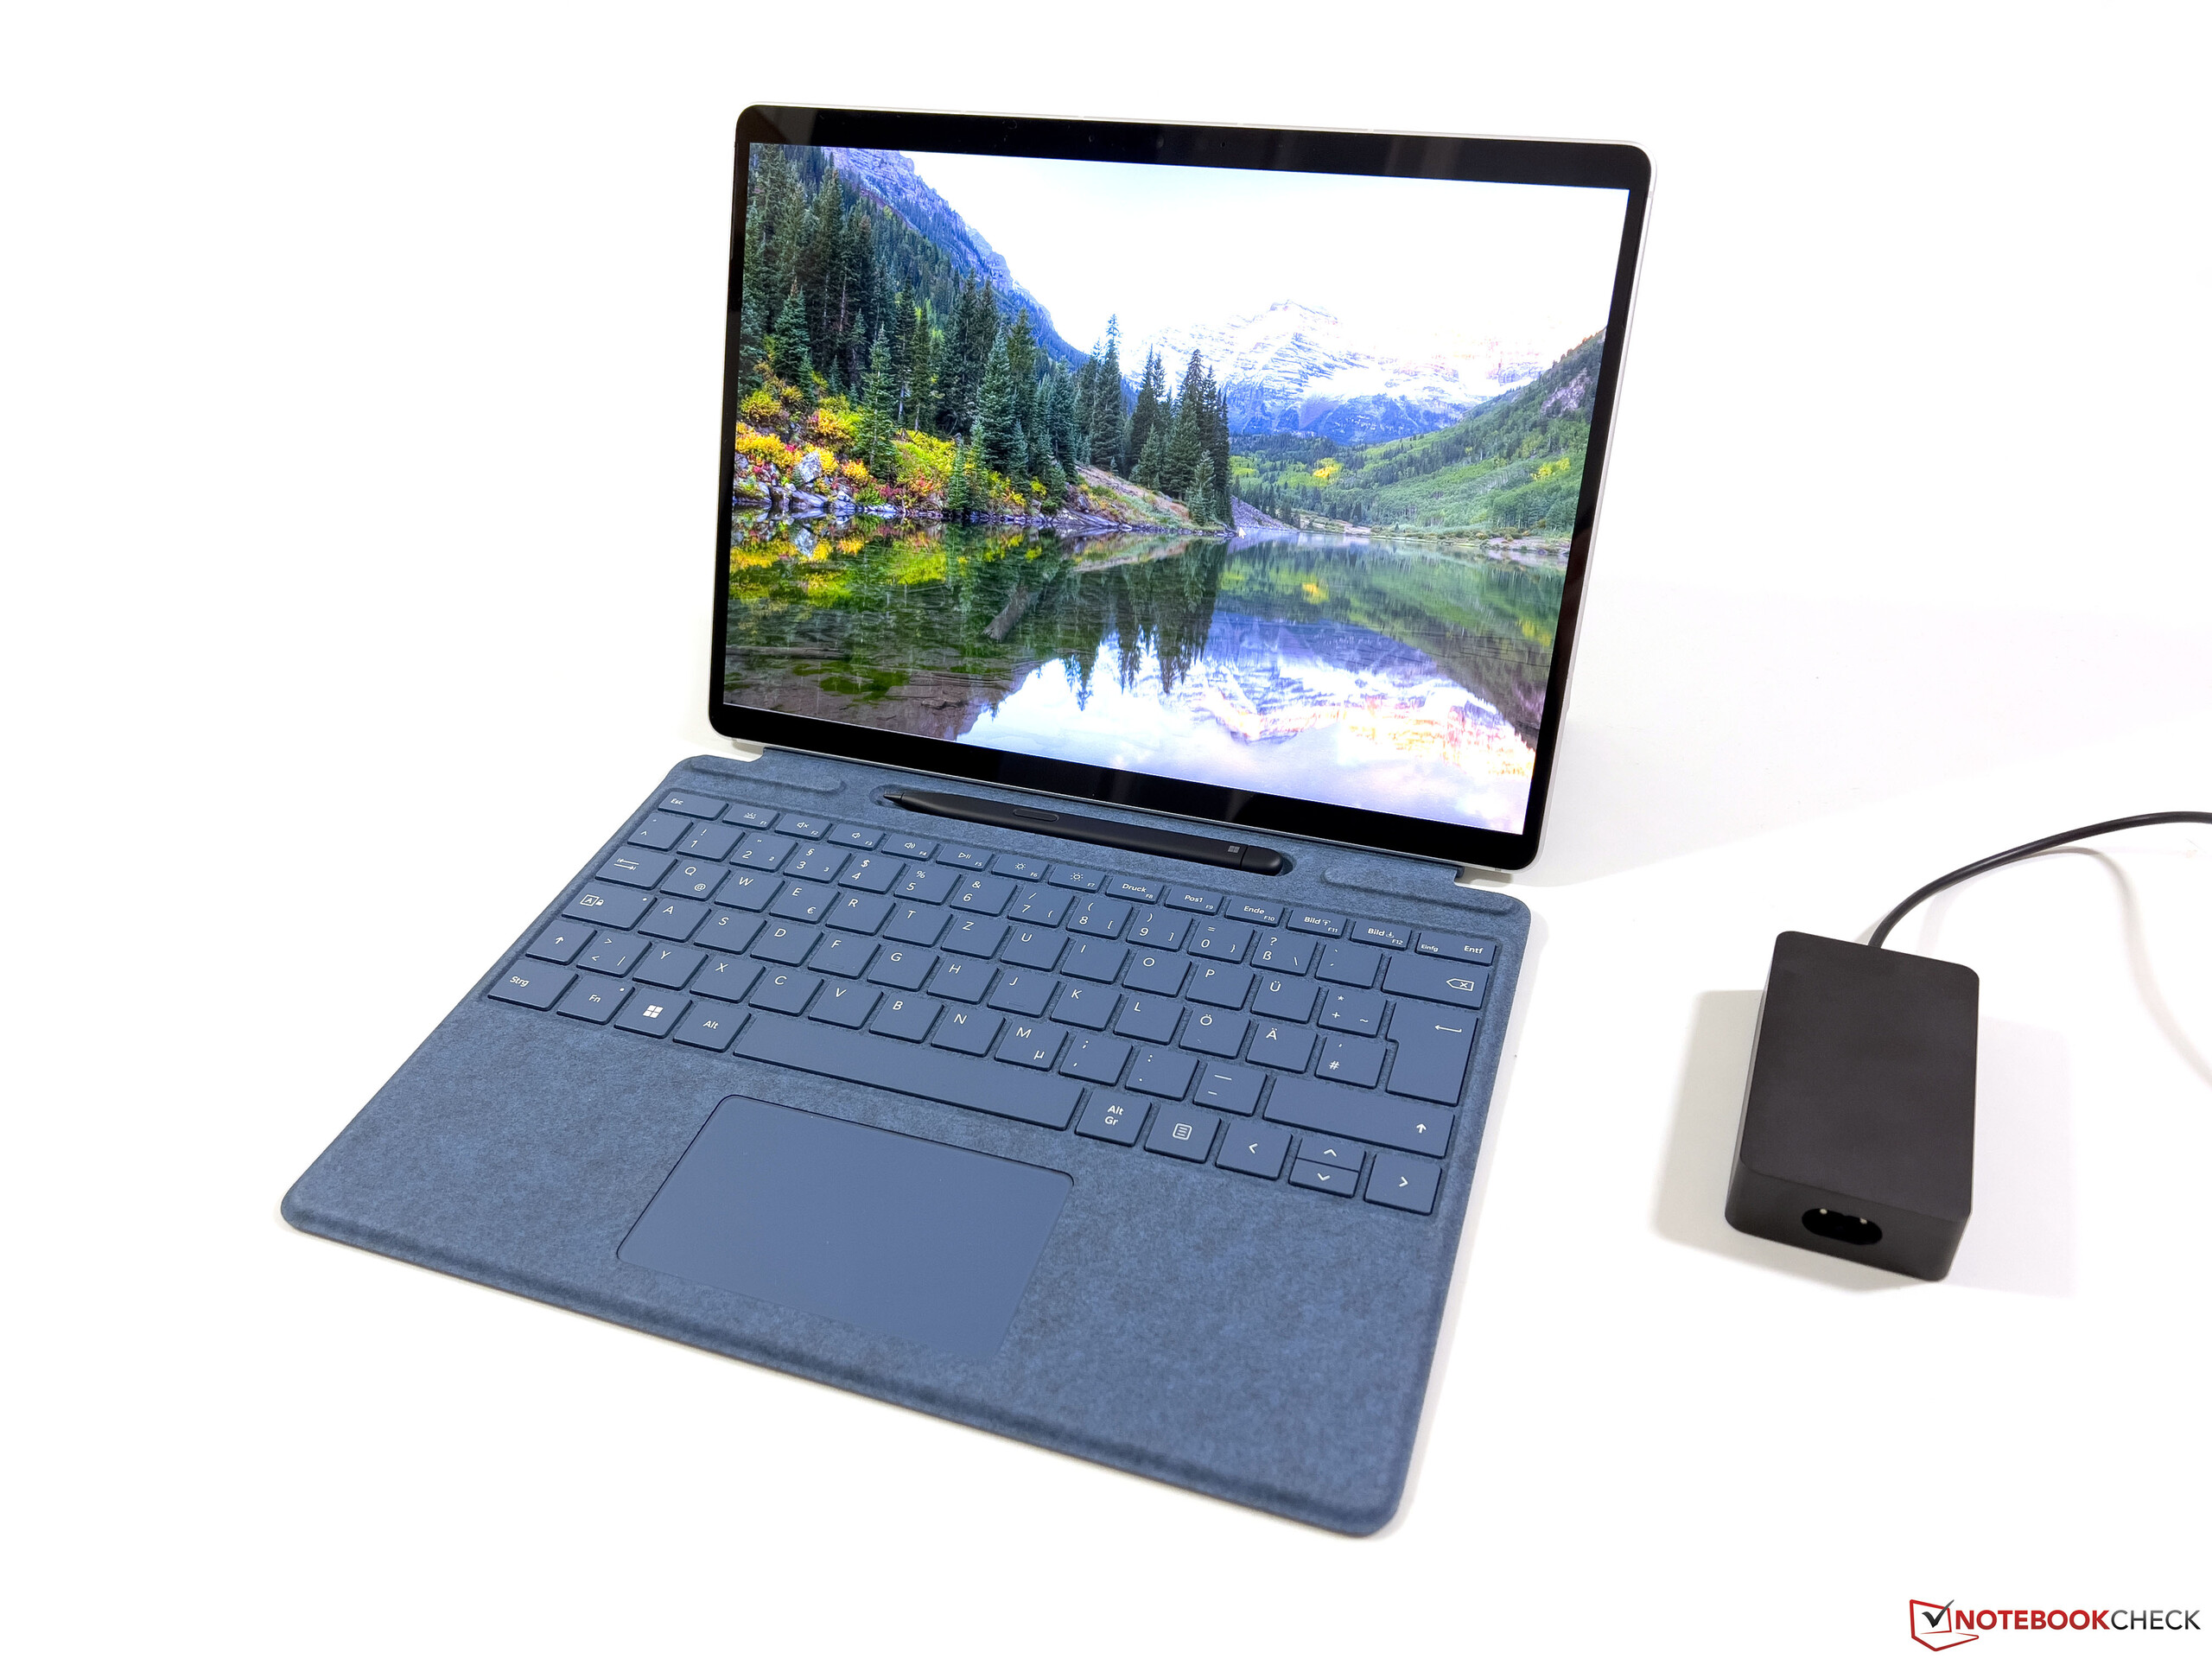
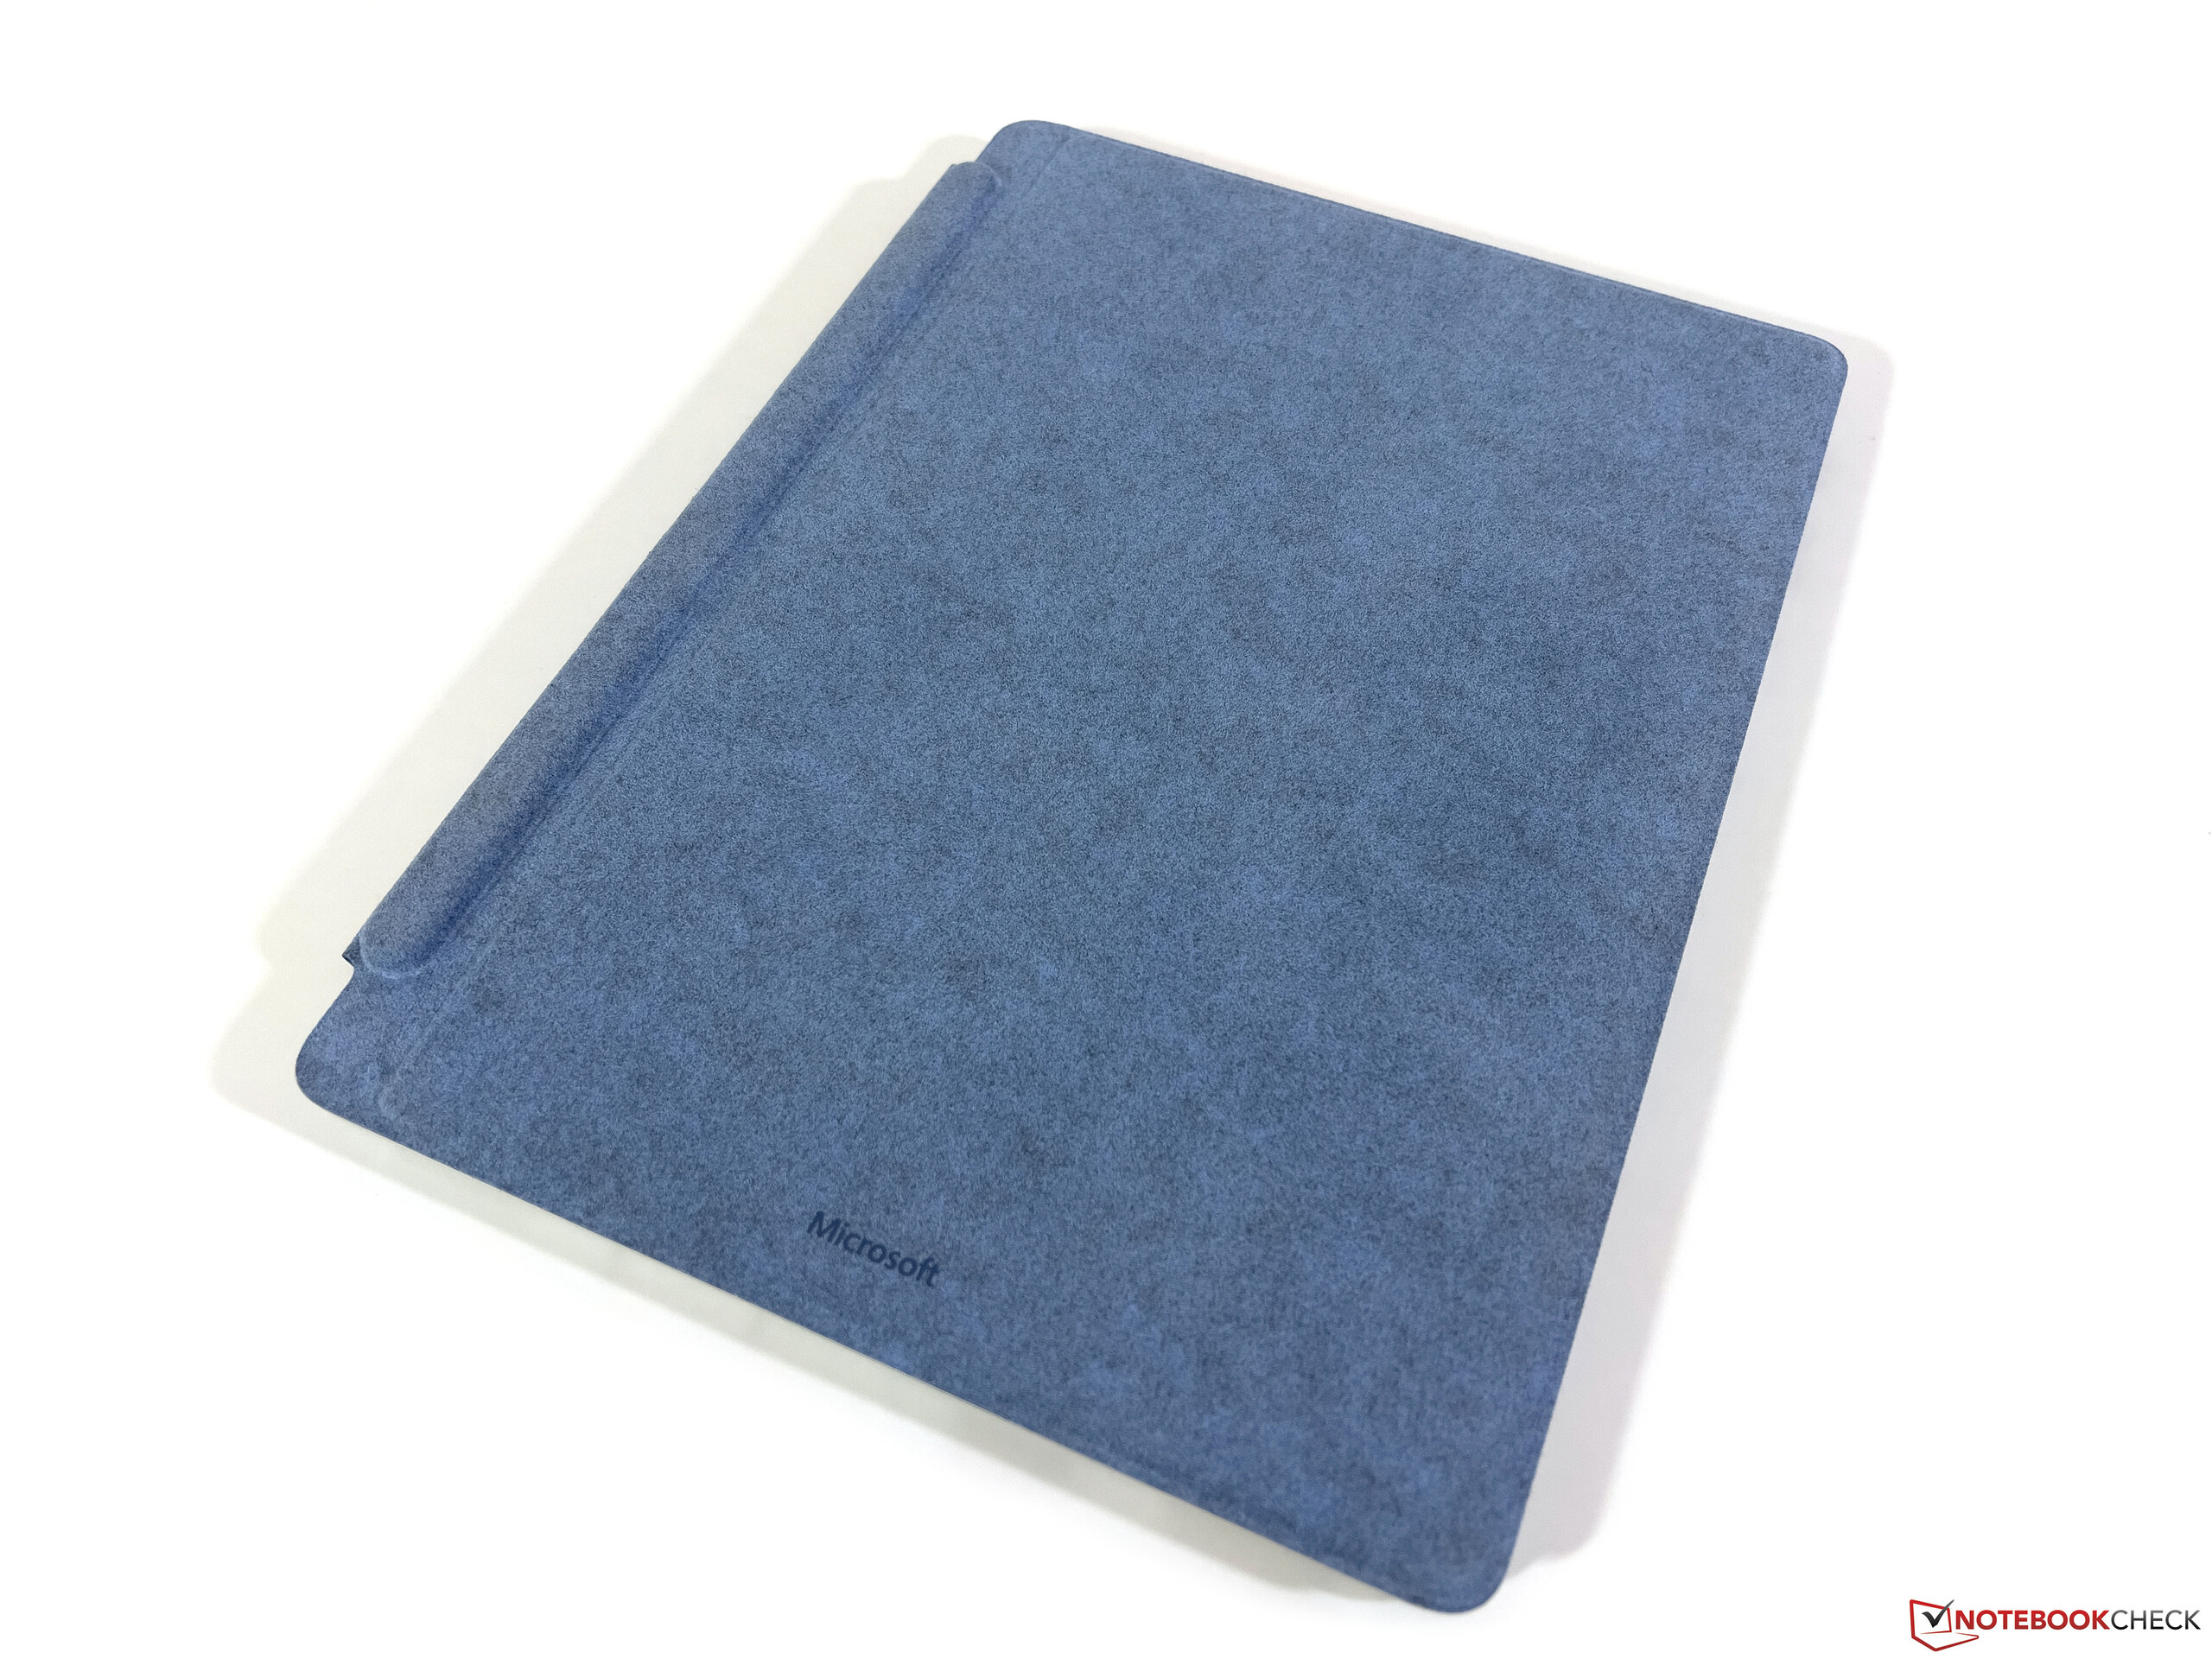
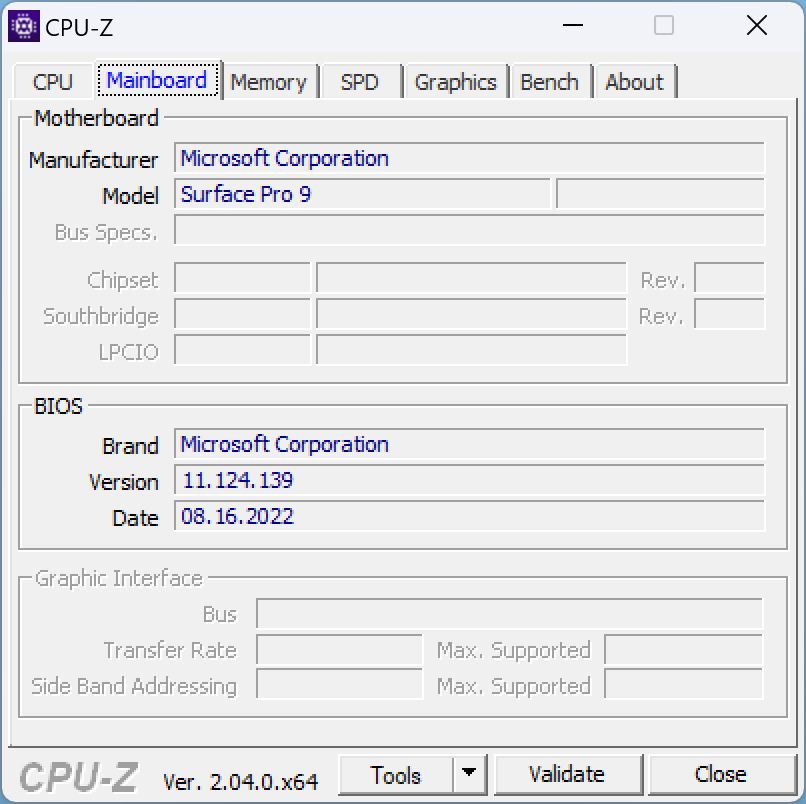
Vår testenhet är versionen med 256 SSD-lagring för 1 659 euro (~1 765 dollar) med ytterligare 280 euro (~298 dollar) för tangentbordet tillsammans med inmatningspennan, vilket resulterar i en totalsumma på ~1 940 euro (~2 063 dollar) för hela paketet. Eftersom många områden är identiska med den nyligen testade Intel-modellen kommer vi i den här recensionen endast att diskutera skillnaderna, med fokus främst på prestandan och kompatibiliteten hos ARM SoC:n. Du kan hitta detaljerad information om höljet, inmatningsenheterna, skärmen och högtalarna i vår recension av Surface Pro 9 med Core-i7-processor.
Potentiella konkurrenter i jämförelse
Gradering | Datum | Modell | Vikt | Höjd | Storlek | Upplösning | Pris |
|---|---|---|---|---|---|---|---|
| 86.9 % v7 (old) | 03/2023 | Microsoft Surface Pro 9, ARM SD 8cx Gen 3, Adreno 690 | 883 g | 9.3 mm | 13.00" | 2880x1920 | |
| 88.4 % v7 (old) | 01/2023 | Microsoft Surface Pro 9, i7-1255U i7-1255U, Iris Xe G7 96EUs | 877 g | 9.3 mm | 13.00" | 2880x1920 | |
| 84.4 % v7 (old) | 10/2019 | Microsoft Surface Pro X SQ1, Adreno 685 | 1 kg | 7.3 mm | 13.00" | 2880x1920 | |
| 86.7 % v7 (old) | 10/2022 | Lenovo ThinkPad X13s Gen 1 21BX000QGE SD 8cx Gen 3, Adreno 690 | 1.1 kg | 13.4 mm | 13.30" | 1920x1200 | |
| 84 % v7 (old) | 08/2021 | HP EliteBook Folio 13.5-3G2L2EA SD 8cx Gen 2 5G, Adreno 680 | 1.3 kg | 16 mm | 13.50" | 1920x1280 | |
| 91.8 % v7 (old) | 11/2022 | Apple iPad Pro 12.9 2022 M2, M2 10-Core GPU | 682 g | 6.4 mm | 12.90" | 2732x2048 |
Skillnader jämfört med Intel-versionen av Surface Pro 9
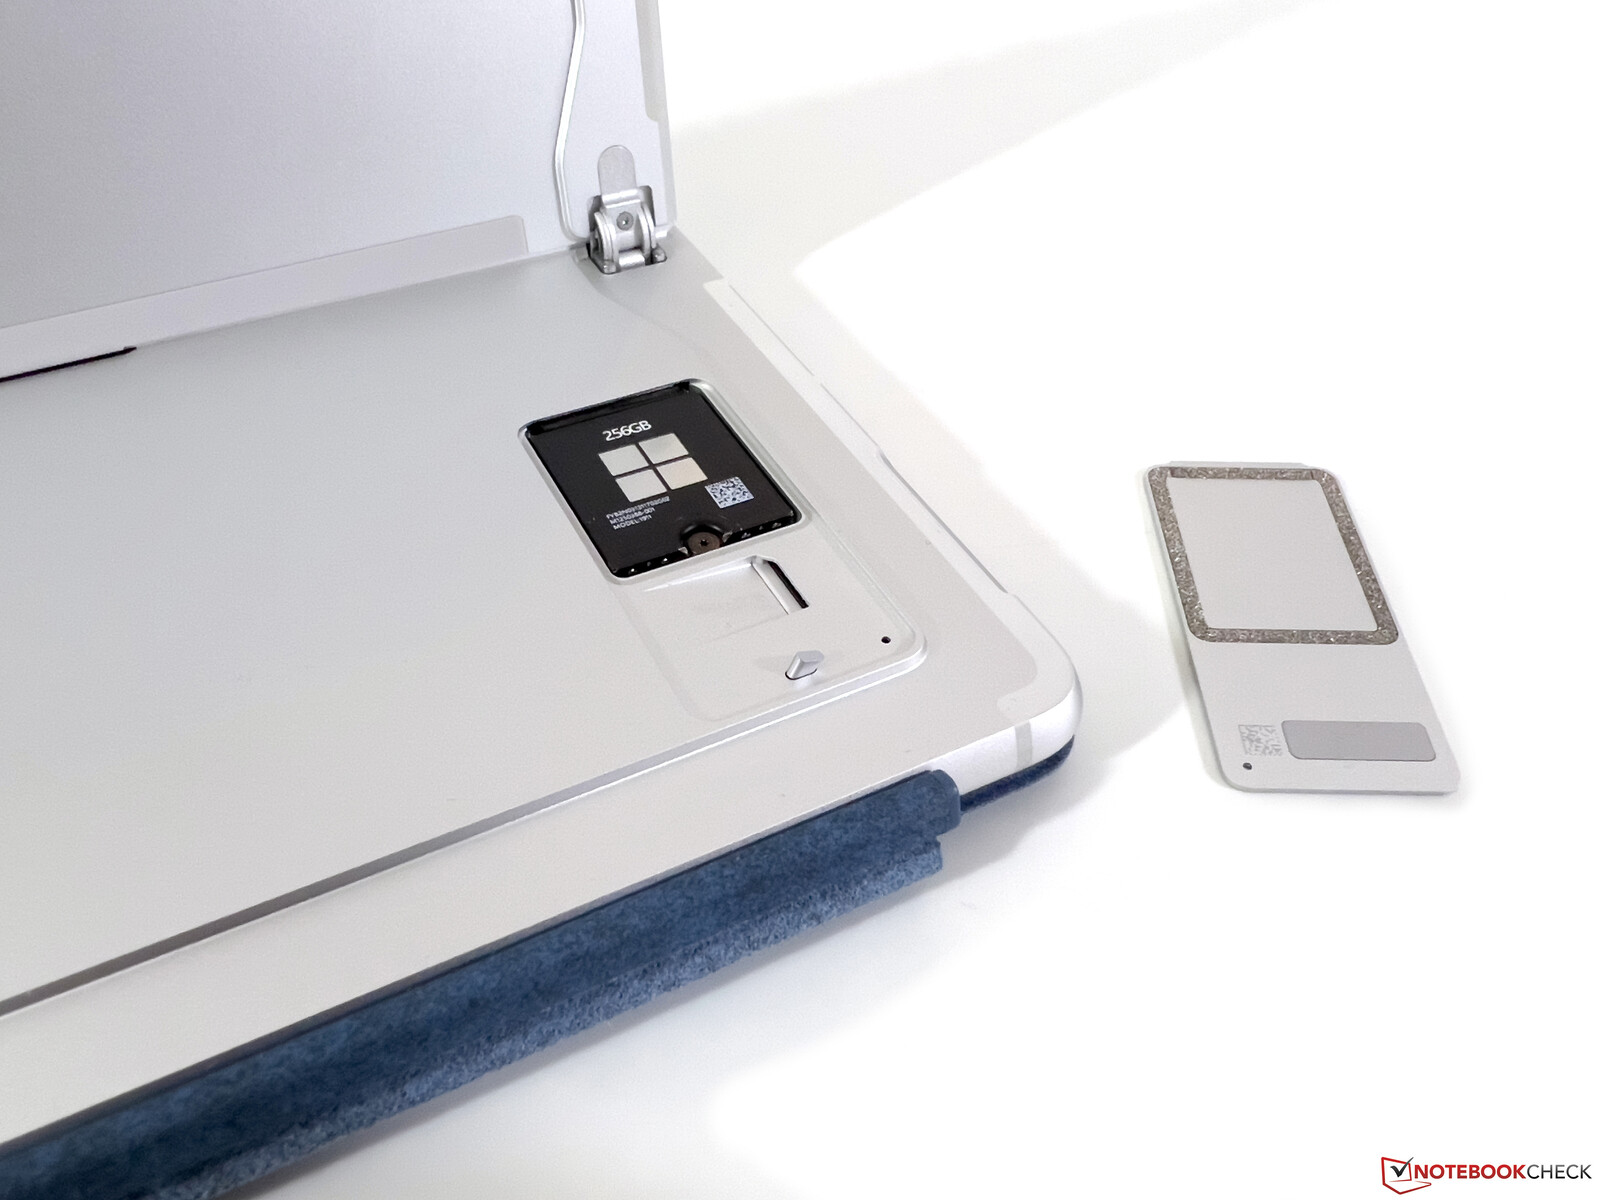
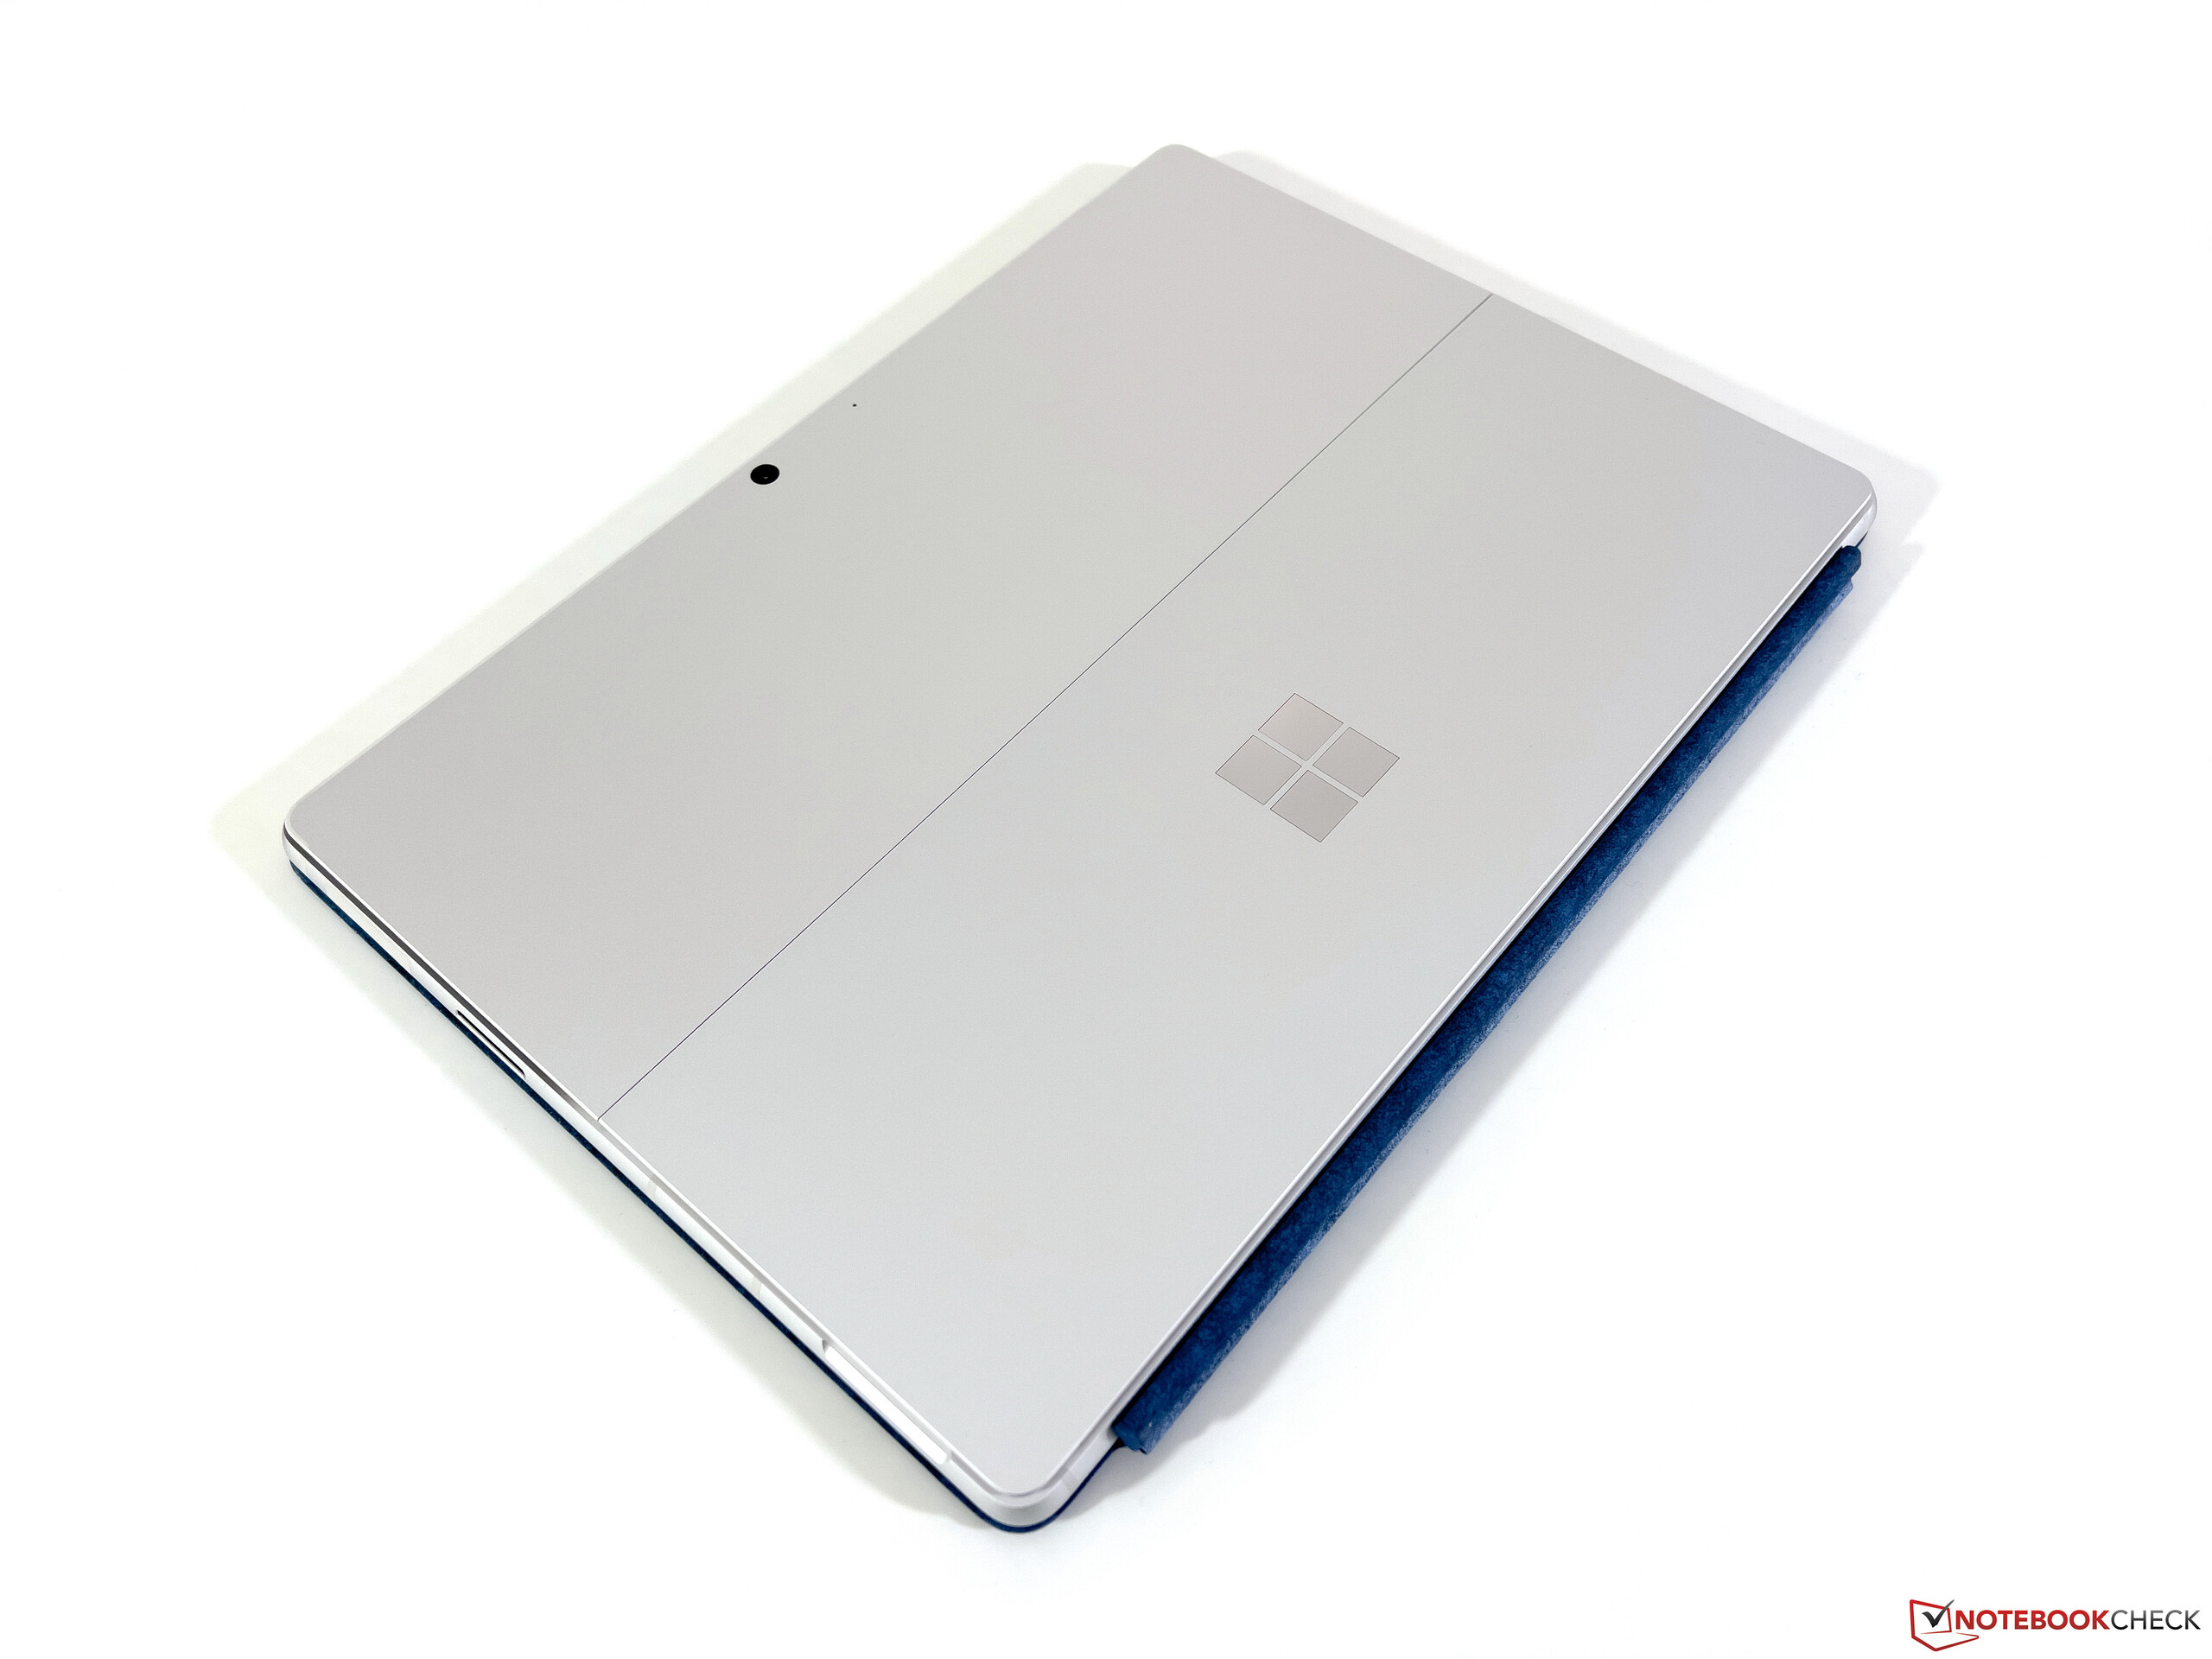
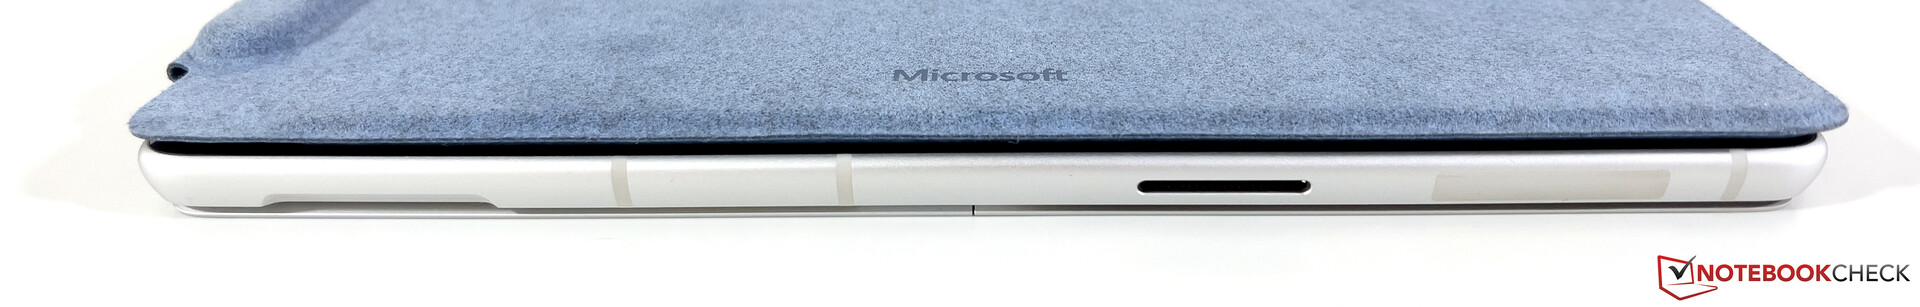
I princip ser de två versionerna av Surface Pro 9 praktiskt taget identiska ut när det gäller deras yttre. Eftersom den kyls passivt saknar ARM-modellen bara fläktöppningar. Den finns också bara i mörkgrå eller silverfärg. Storleken på höljet är identisk, så att samma tangentbord kan användas. ARM-modellen är endast 6 gram (~0,2 oz) tyngre. Dessutom är laddaren svagare med 39 watt men också något lättare (210 mot 260 gram, ~7,4 mot 9,2 oz). Underhållsklappen på baksidan, som är mycket lätt att öppna i Intel-modellen, kräver återigen ett SIM-verktyg i ARM-modellen.
Den inbyggda 5G-modulen är en annan viktig skillnad mellan de två modellerna, eftersom Microsoft till skillnad från tidigare generationer inte längre erbjuder en WWAN-modul för Intel-modellen. Surface Pro 9 med Qualcomm SoC kan stödja antingen en NanoSIM eller en eSIM. För att testa detta använde vi en NanoSIM från Telekom och kunde ansluta till 5G-nätet utan problem.
Liksom AX211-modulen i Intel-versionen har WLAN-modulen (Qualcomm WCN685x) stöd för den aktuella standarden Wi-Fi 6E, och vi kunde ansluta till 6 GHz-nätet i vår referensrouter från Asus utan problem. Överföringshastigheterna är stabila, men sändningsprestandan är något svagare överlag. Du bör dock inte stöta på några begränsningar här i den dagliga driften.
Slutligen erbjuder Qualcomms SoC även några studio-effekter för de inbyggda kamerorna. Du kan till exempel ändra bakgrunden, eller så kan kameran hålla personen fokuserad i mitten av bilden, vilket fungerar acceptabelt bra.
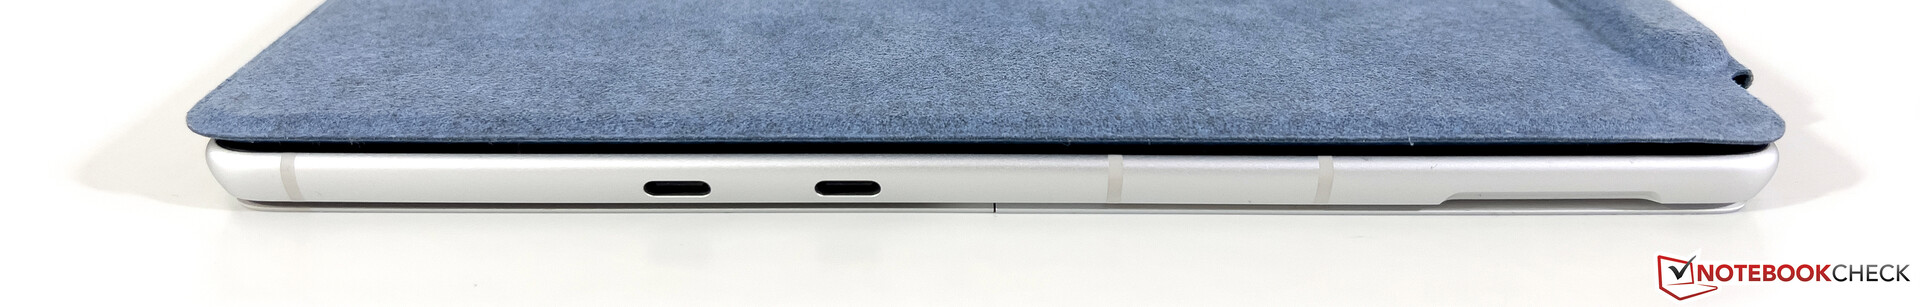
ARM-modellen erbjuder även Surface Connect-porten för Microsofts egna tillbehör, men Thunderbolt 4-stödet saknas här. De två USB-C-portarna stöder endast USB-3.2-standarden inklusive laddningsfunktion och bildutgång.
| Networking | |
| Microsoft Surface Pro 9, ARM | |
| iperf3 transmit AXE11000 6GHz | |
| iperf3 receive AXE11000 6GHz | |
| Microsoft Surface Pro 9, i7-1255U | |
| iperf3 transmit AXE11000 6GHz | |
| iperf3 receive AXE11000 6GHz | |
| Microsoft Surface Pro X | |
| iperf3 transmit AX12 | |
| iperf3 receive AX12 | |
| Lenovo ThinkPad X13s Gen 1 21BX000QGE | |
| iperf3 transmit AXE11000 | |
| iperf3 receive AXE11000 | |
| HP EliteBook Folio 13.5-3G2L2EA | |
| iperf3 transmit AX12 | |
| iperf3 receive AX12 | |
| Apple iPad Pro 12.9 2022 | |
| iperf3 transmit AXE11000 | |
| iperf3 receive AXE11000 | |
| iperf3 transmit AXE11000 6GHz | |
| iperf3 receive AXE11000 6GHz | |
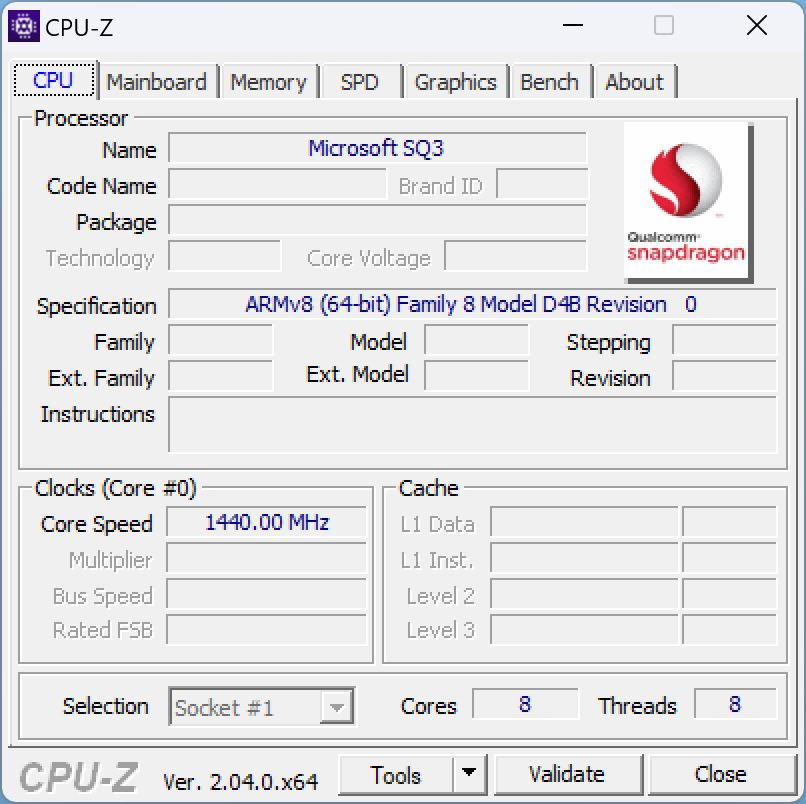
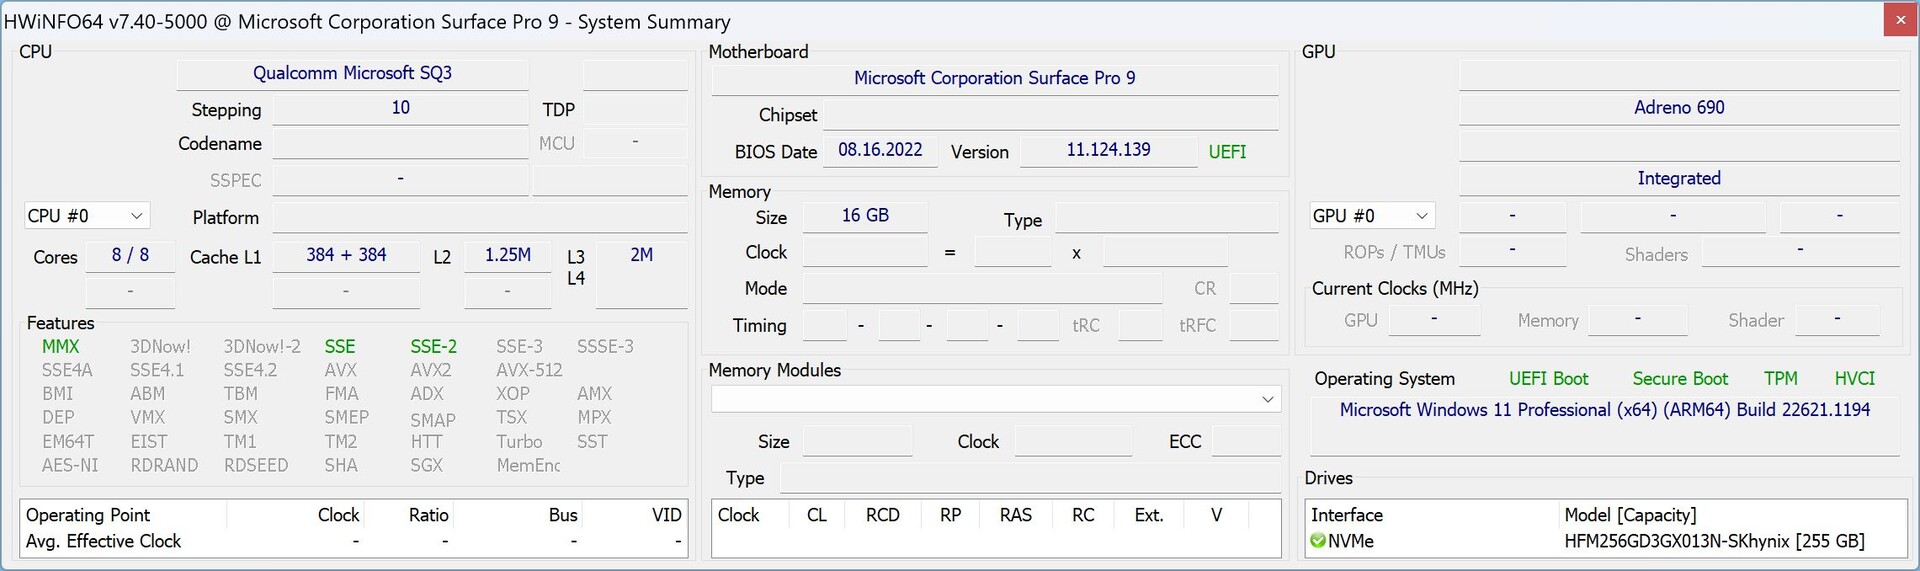
Prestanda - Microsoft SQ3 alias Snapdragon 8cx Gen 3
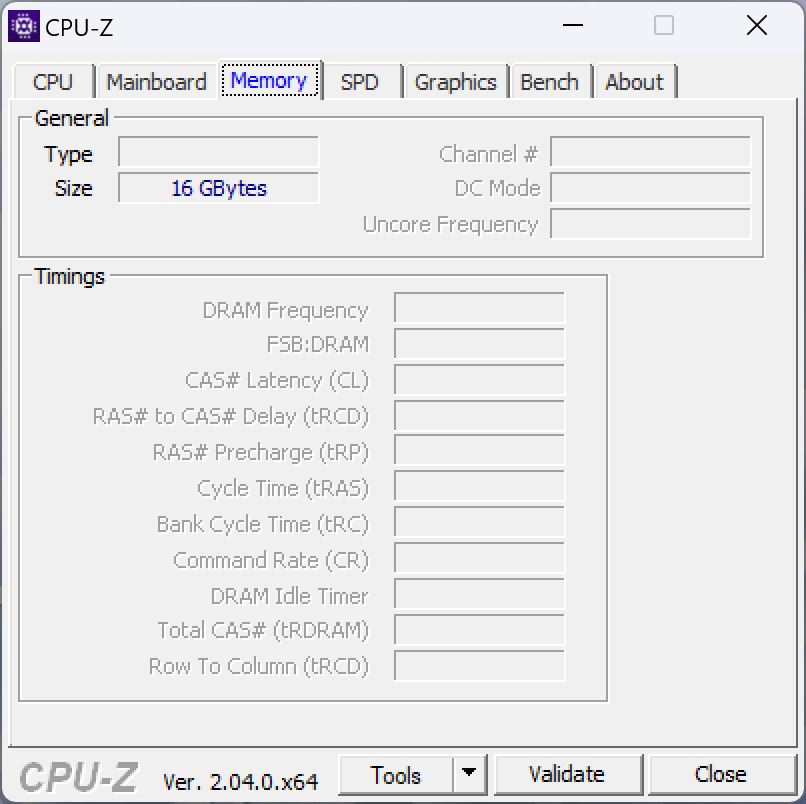
I den nya Surface Pro 9 ARM använder Microsoft SQ3 SoC, vilket är ett annat namn för en Qualcomm Snapdragon 8cx Gen 3som också används i Lenovo ThinkPad X13still exempel. Adreno 690 GPU:n fungerar som grafikkort och SoC:n kan stödjas av antingen 8 eller 16 GB RAM-minne. För SSD:n kan du välja mellan 128 GB upp till 512 GB, men det går även att byta ut den kompakta M.2-2230 SSD:n senare också.
Testförhållanden
Det finns inga särskilda strömlägen, och vi har inte heller kunnat mäta vare sig klockfrekvens eller TDP för processorn på ett tillförlitligt sätt. Enligt Qualcomm ligger förbrukningen på 7 watt. Under belastning ska det dock öka till nästan 30 watt, att döma av enhetens strömförbrukning.
Jämfört med vårt tidigare test av Surface Pro Xmed SQ1 SoChar Microsoft nu stöd för emulering av 64-bitarsprogram, vilket gör att vi också kan köra betydligt fler riktmärken. Men som tidigare har det fortfarande inte stöd för alla program.
Processor - Qualcomm 8cx Gen 3
TheQualcomm 8cx Gen 3är en ARM-processor med fyra prestanda- (upp till 3 GHz) och fyra effektivitetskärnor (upp till 2,4 GHz), vilket i stort sett motsvarar designkonceptet för Apple M2 och de nuvarande Intel-mobilprocessorerna.
Flerkärnig prestanda hos 8cx Gen 3 är i princip inte alls dålig, vilket motsvarar ungefär samma nivå som den gamla Surface Pro 7medCore i7-1065G7. Problemet är dock den svaga enkelkärniga prestandan, som också lätt märks i vardaglig drift. Surface Pro 9 har helt enkelt ingen chans mot moderna Intel-processorer eller till och med Apple s egna ARM-processorer som t.ex Apple M2här.
CPU-prestandan minskar inte i batteridrift. Du kan hitta ytterligare CPU-jämförelser i vår tekniska sektion.
Cinebench R15 Multi Constant Load Test
Cinebench R20: CPU (Multi Core) | CPU (Single Core)
Cinebench R15: CPU Multi 64Bit | CPU Single 64Bit
Blender: v2.79 BMW27 CPU
7-Zip 18.03: 7z b 4 | 7z b 4 -mmt1
Geekbench 5.5: Multi-Core | Single-Core
HWBOT x265 Benchmark v2.2: 4k Preset
LibreOffice : 20 Documents To PDF
R Benchmark 2.5: Overall mean
| Cinebench R23 / Multi Core | |
| Genomsnitt av klass Convertible (1317 - 30959, n=51, senaste 2 åren) | |
| Microsoft Surface Pro 9, i7-1255U | |
| Apple MacBook Air M2 Entry | |
| Microsoft Surface Pro 8, i7-1185G7 | |
| Microsoft Surface Pro 7 Plus | |
| Genomsnitt Qualcomm Snapdragon 8cx Gen 3 (3534 - 3709, n=3) | |
| Microsoft Surface Pro 9, ARM | |
| Lenovo ThinkPad X13s Gen 1 21BX000QGE | |
| Cinebench R23 / Single Core | |
| Genomsnitt av klass Convertible (740 - 2188, n=51, senaste 2 åren) | |
| Microsoft Surface Pro 9, i7-1255U | |
| Apple MacBook Air M2 Entry | |
| Microsoft Surface Pro 8, i7-1185G7 | |
| Microsoft Surface Pro 7 Plus | |
| Microsoft Surface Pro 9, ARM | |
| Lenovo ThinkPad X13s Gen 1 21BX000QGE | |
| Genomsnitt Qualcomm Snapdragon 8cx Gen 3 (559 - 608, n=3) | |
| Cinebench R20 / CPU (Multi Core) | |
| Genomsnitt av klass Convertible (595 - 12102, n=51, senaste 2 åren) | |
| Microsoft Surface Pro 9, i7-1255U | |
| Apple MacBook Air M2 Entry | |
| Microsoft Surface Pro 8, i7-1185G7 | |
| Microsoft Surface Pro 7 Plus | |
| Microsoft Surface Pro 9, ARM | |
| Genomsnitt Qualcomm Snapdragon 8cx Gen 3 (810 - 1258, n=3) | |
| Lenovo ThinkPad X13s Gen 1 21BX000QGE | |
| Cinebench R20 / CPU (Single Core) | |
| Genomsnitt av klass Convertible (273 - 834, n=51, senaste 2 åren) | |
| Microsoft Surface Pro 9, i7-1255U | |
| Microsoft Surface Pro 8, i7-1185G7 | |
| Microsoft Surface Pro 7 Plus | |
| Lenovo ThinkPad X13s Gen 1 21BX000QGE | |
| Apple MacBook Air M2 Entry | |
| Genomsnitt Qualcomm Snapdragon 8cx Gen 3 (199 - 222, n=3) | |
| Microsoft Surface Pro 9, ARM | |
| Cinebench R15 / CPU Multi 64Bit | |
| Genomsnitt av klass Convertible (478 - 4940, n=50, senaste 2 åren) | |
| Microsoft Surface Pro 9, i7-1255U | |
| Apple MacBook Air M2 Entry | |
| Microsoft Surface Pro 8, i7-1185G7 | |
| Microsoft Surface Pro 7 Plus | |
| Microsoft Surface Pro 9, ARM | |
| Genomsnitt Qualcomm Snapdragon 8cx Gen 3 (723 - 774, n=2) | |
| Cinebench R15 / CPU Single 64Bit | |
| Genomsnitt av klass Convertible (149.8 - 317, n=50, senaste 2 åren) | |
| Microsoft Surface Pro 8, i7-1185G7 | |
| Apple MacBook Air M2 Entry | |
| Microsoft Surface Pro 9, i7-1255U | |
| Microsoft Surface Pro 7 Plus | |
| Microsoft Surface Pro 9, ARM | |
| Genomsnitt Qualcomm Snapdragon 8cx Gen 3 (119 - 119.1, n=2) | |
| Blender / v2.79 BMW27 CPU | |
| Lenovo ThinkPad X13s Gen 1 21BX000QGE | |
| Genomsnitt Qualcomm Snapdragon 8cx Gen 3 (1059 - 1600, n=3) | |
| Microsoft Surface Pro 9, ARM | |
| Microsoft Surface Pro 7 Plus | |
| Apple MacBook Air M2 Entry | |
| Microsoft Surface Pro 8, i7-1185G7 | |
| Microsoft Surface Pro 9, i7-1255U | |
| Genomsnitt av klass Convertible (105 - 1051, n=50, senaste 2 åren) | |
| 7-Zip 18.03 / 7z b 4 | |
| Genomsnitt av klass Convertible (12977 - 121368, n=50, senaste 2 åren) | |
| Microsoft Surface Pro 9, i7-1255U | |
| Microsoft Surface Pro 8, i7-1185G7 | |
| Microsoft Surface Pro 9, ARM | |
| Microsoft Surface Pro 7 Plus | |
| Genomsnitt Qualcomm Snapdragon 8cx Gen 3 (16223 - 24505, n=3) | |
| Lenovo ThinkPad X13s Gen 1 21BX000QGE | |
| 7-Zip 18.03 / 7z b 4 -mmt1 | |
| Genomsnitt av klass Convertible (3672 - 6655, n=50, senaste 2 åren) | |
| Microsoft Surface Pro 8, i7-1185G7 | |
| Microsoft Surface Pro 9, i7-1255U | |
| Microsoft Surface Pro 7 Plus | |
| Microsoft Surface Pro 9, ARM | |
| Genomsnitt Qualcomm Snapdragon 8cx Gen 3 (3874 - 3946, n=3) | |
| Lenovo ThinkPad X13s Gen 1 21BX000QGE | |
| Geekbench 5.5 / Multi-Core | |
| Genomsnitt av klass Convertible (1608 - 22023, n=50, senaste 2 åren) | |
| Apple MacBook Air M2 Entry | |
| Microsoft Surface Pro 9, i7-1255U | |
| Apple iPad Pro 12.9 2022 | |
| Microsoft Surface Pro 9, ARM | |
| Genomsnitt Qualcomm Snapdragon 8cx Gen 3 (4457 - 7522, n=2) | |
| Microsoft Surface Pro 8, i7-1185G7 | |
| Microsoft Surface Pro 7 Plus | |
| Lenovo ThinkPad X13s Gen 1 21BX000QGE | |
| HP EliteBook Folio 13.5-3G2L2EA | |
| Microsoft Surface Pro X | |
| Geekbench 5.5 / Single-Core | |
| Apple MacBook Air M2 Entry | |
| Apple iPad Pro 12.9 2022 | |
| Genomsnitt av klass Convertible (806 - 2275, n=50, senaste 2 åren) | |
| Microsoft Surface Pro 9, i7-1255U | |
| Microsoft Surface Pro 9, ARM | |
| Genomsnitt Qualcomm Snapdragon 8cx Gen 3 (1486 - 1690, n=2) | |
| Microsoft Surface Pro 8, i7-1185G7 | |
| Lenovo ThinkPad X13s Gen 1 21BX000QGE | |
| Microsoft Surface Pro 7 Plus | |
| HP EliteBook Folio 13.5-3G2L2EA | |
| Microsoft Surface Pro X | |
| HWBOT x265 Benchmark v2.2 / 4k Preset | |
| Genomsnitt av klass Convertible (3.43 - 36.2, n=50, senaste 2 åren) | |
| Microsoft Surface Pro 9, i7-1255U | |
| Microsoft Surface Pro 8, i7-1185G7 | |
| Microsoft Surface Pro 7 Plus | |
| Microsoft Surface Pro 9, ARM | |
| Genomsnitt Qualcomm Snapdragon 8cx Gen 3 (1.5 - 2.68, n=3) | |
| Lenovo ThinkPad X13s Gen 1 21BX000QGE | |
| LibreOffice / 20 Documents To PDF | |
| Microsoft Surface Pro 9, ARM | |
| Genomsnitt Qualcomm Snapdragon 8cx Gen 3 (115.5 - 121.5, n=3) | |
| Lenovo ThinkPad X13s Gen 1 21BX000QGE | |
| Microsoft Surface Pro 7 Plus | |
| Genomsnitt av klass Convertible (42.5 - 84.3, n=50, senaste 2 åren) | |
| Microsoft Surface Pro 9, i7-1255U | |
| Microsoft Surface Pro 8, i7-1185G7 | |
| R Benchmark 2.5 / Overall mean | |
| Microsoft Surface Pro 9, ARM | |
| Genomsnitt Qualcomm Snapdragon 8cx Gen 3 (1.011 - 1.013, n=3) | |
| Lenovo ThinkPad X13s Gen 1 21BX000QGE | |
| Microsoft Surface Pro 7 Plus | |
| Microsoft Surface Pro 8, i7-1185G7 | |
| Microsoft Surface Pro 9, i7-1255U | |
| Genomsnitt av klass Convertible (0.3915 - 0.84, n=50, senaste 2 åren) | |
* ... mindre är bättre
AIDA64: FP32 Ray-Trace | FPU Julia | CPU SHA3 | CPU Queen | FPU SinJulia | FPU Mandel | CPU AES | CPU ZLib | FP64 Ray-Trace | CPU PhotoWorxx
| Performance rating | |
| Genomsnitt av klass Convertible | |
| Microsoft Surface Pro 9, i7-1255U | |
| Microsoft Surface Pro 8, i7-1185G7 | |
| Microsoft Surface Pro 7 Plus | |
| Microsoft Surface Pro 9, ARM | |
| Genomsnitt Qualcomm Snapdragon 8cx Gen 3 | |
| Lenovo ThinkPad X13s Gen 1 21BX000QGE | |
| AIDA64 / FP32 Ray-Trace | |
| Genomsnitt av klass Convertible (1480 - 64158, n=50, senaste 2 åren) | |
| Microsoft Surface Pro 9, i7-1255U | |
| Microsoft Surface Pro 8, i7-1185G7 | |
| Microsoft Surface Pro 7 Plus | |
| Microsoft Surface Pro 9, ARM | |
| Genomsnitt Qualcomm Snapdragon 8cx Gen 3 (343 - 2627, n=3) | |
| Lenovo ThinkPad X13s Gen 1 21BX000QGE | |
| AIDA64 / FPU Julia | |
| Genomsnitt av klass Convertible (11392 - 184800, n=50, senaste 2 åren) | |
| Microsoft Surface Pro 9, i7-1255U | |
| Microsoft Surface Pro 8, i7-1185G7 | |
| Microsoft Surface Pro 7 Plus | |
| Lenovo ThinkPad X13s Gen 1 21BX000QGE | |
| Genomsnitt Qualcomm Snapdragon 8cx Gen 3 (13729 - 14650, n=3) | |
| Microsoft Surface Pro 9, ARM | |
| AIDA64 / CPU SHA3 | |
| Genomsnitt av klass Convertible (797 - 8291, n=50, senaste 2 åren) | |
| Microsoft Surface Pro 9, i7-1255U | |
| Microsoft Surface Pro 8, i7-1185G7 | |
| Microsoft Surface Pro 7 Plus | |
| Microsoft Surface Pro 9, ARM | |
| Genomsnitt Qualcomm Snapdragon 8cx Gen 3 (453 - 1144, n=3) | |
| Lenovo ThinkPad X13s Gen 1 21BX000QGE | |
| AIDA64 / CPU Queen | |
| Microsoft Surface Pro 9, i7-1255U | |
| Genomsnitt av klass Convertible (14686 - 148874, n=41, senaste 2 åren) | |
| Microsoft Surface Pro 8, i7-1185G7 | |
| Microsoft Surface Pro 7 Plus | |
| Microsoft Surface Pro 9, ARM | |
| Genomsnitt Qualcomm Snapdragon 8cx Gen 3 (15447 - 27474, n=3) | |
| Lenovo ThinkPad X13s Gen 1 21BX000QGE | |
| AIDA64 / FPU SinJulia | |
| Genomsnitt av klass Convertible (1120 - 29155, n=50, senaste 2 åren) | |
| Microsoft Surface Pro 9, i7-1255U | |
| Microsoft Surface Pro 8, i7-1185G7 | |
| Microsoft Surface Pro 7 Plus | |
| Microsoft Surface Pro 9, ARM | |
| Lenovo ThinkPad X13s Gen 1 21BX000QGE | |
| Genomsnitt Qualcomm Snapdragon 8cx Gen 3 (1161 - 1257, n=3) | |
| AIDA64 / FPU Mandel | |
| Genomsnitt av klass Convertible (4929 - 97193, n=50, senaste 2 åren) | |
| Microsoft Surface Pro 9, i7-1255U | |
| Microsoft Surface Pro 8, i7-1185G7 | |
| Microsoft Surface Pro 7 Plus | |
| Lenovo ThinkPad X13s Gen 1 21BX000QGE | |
| Genomsnitt Qualcomm Snapdragon 8cx Gen 3 (7085 - 7704, n=3) | |
| Microsoft Surface Pro 9, ARM | |
| AIDA64 / CPU AES | |
| Genomsnitt av klass Convertible (5271 - 190280, n=50, senaste 2 åren) | |
| Microsoft Surface Pro 9, i7-1255U | |
| Microsoft Surface Pro 8, i7-1185G7 | |
| Microsoft Surface Pro 7 Plus | |
| Microsoft Surface Pro 9, ARM | |
| Genomsnitt Qualcomm Snapdragon 8cx Gen 3 (638 - 1279, n=3) | |
| Lenovo ThinkPad X13s Gen 1 21BX000QGE | |
| AIDA64 / CPU ZLib | |
| Genomsnitt av klass Convertible (218 - 2017, n=50, senaste 2 åren) | |
| Microsoft Surface Pro 9, i7-1255U | |
| Microsoft Surface Pro 9, ARM | |
| Genomsnitt Qualcomm Snapdragon 8cx Gen 3 (398 - 412, n=3) | |
| Lenovo ThinkPad X13s Gen 1 21BX000QGE | |
| Microsoft Surface Pro 8, i7-1185G7 | |
| Microsoft Surface Pro 7 Plus | |
| AIDA64 / FP64 Ray-Trace | |
| Genomsnitt av klass Convertible (1169 - 34297, n=50, senaste 2 åren) | |
| Microsoft Surface Pro 9, i7-1255U | |
| Microsoft Surface Pro 8, i7-1185G7 | |
| Microsoft Surface Pro 7 Plus | |
| Microsoft Surface Pro 9, ARM | |
| Genomsnitt Qualcomm Snapdragon 8cx Gen 3 (204 - 1379, n=3) | |
| Lenovo ThinkPad X13s Gen 1 21BX000QGE | |
| AIDA64 / CPU PhotoWorxx | |
| Genomsnitt av klass Convertible (14193 - 85327, n=50, senaste 2 åren) | |
| Microsoft Surface Pro 9, i7-1255U | |
| Microsoft Surface Pro 7 Plus | |
| Microsoft Surface Pro 8, i7-1185G7 | |
| Microsoft Surface Pro 9, ARM | |
| Genomsnitt Qualcomm Snapdragon 8cx Gen 3 (7622 - 14660, n=3) | |
| Lenovo ThinkPad X13s Gen 1 21BX000QGE | |
Dessutom vill vi också ta en kort titt på Qualcomm-processorns effektivitet. Även om 8cx Gen 3 kan placera sig knappt före konkurrenterna från Intel och AMD när det gäller effektiviteten för enstaka kärnor, hjälper det inte mycket, eftersom prestandan för enstaka kärnor är mycket låg överlag, vilket påverkar enhetens subjektiva prestanda.
Effektiviteten är riktigt dålig i flerkärnigtestet. Vi kan bekräfta detta, eftersom enheten trots sin mediokra prestanda drar 40 watt från uttaget vid full belastning, så cirka 30 watt går till processorn. Vi kan inte riktigt kalla detta för effektivt överhuvudtaget.
| Power Consumption | |
| Cinebench R23 Multi Power Efficiency - external Monitor | |
| Apple MacBook Air M2 Entry | |
| Apple MacBook Air M2 10C GPU | |
| Lenovo ThinkPad T14 G3-21CF004NGE | |
| Lenovo Yoga 9 14IRP G8 | |
| Microsoft Surface Pro 9, i7-1255U | |
| Lenovo ThinkPad X13s Gen 1 21BX000QGE | |
| Microsoft Surface Pro 9, ARM | |
| Cinebench R23 Single Power Efficiency - external Monitor | |
| Apple MacBook Air M2 Entry | |
| Apple MacBook Air M2 10C GPU | |
| Microsoft Surface Pro 9, ARM | |
| Microsoft Surface Pro 9, i7-1255U | |
| Lenovo ThinkPad T14 G3-21CF004NGE | |
| Lenovo Yoga 9 14IRP G8 | |
Systemets prestanda
Vi var begränsade när det gäller syntetiska tester, eftersom även CrossMark, som är plattformsoberoende, kraschade upprepade gånger. Istället visar vi webbläsarbänkmärkena, men även här är prestandan överlag mycket svag, vilket också återspeglar det subjektiva prestandaintrycket. Även om driften i princip är smidig, även med enkla uppgifter som att öppna inställningarna, kan det förekomma en del betydande stotter och enheten överbelastas snabbt av komplexa applikationer. De som är bekanta med MacBook Air med M1/M2 SoC, till exempel, som förväntar sig en liknande prestanda här kommer definitivt att bli besvikna.
| WebXPRT 4 / Overall | |
| Microsoft Surface Pro 9, i7-1255U | |
| Apple iPad Pro 12.9 2022 | |
| Lenovo ThinkPad X13s Gen 1 21BX000QGE | |
| Microsoft Surface Pro 9, ARM | |
| WebXPRT 3 / Overall | |
| Apple iPad Pro 12.9 2022 | |
| Microsoft Surface Pro 9, i7-1255U | |
| HP EliteBook Folio 13.5-3G2L2EA | |
| Microsoft Surface Pro X | |
| Microsoft Surface Pro 9, ARM | |
| Speedometer 2.0 / Result 2.0 | |
| Apple iPad Pro 12.9 2022 | |
| Microsoft Surface Pro 9, i7-1255U | |
| Microsoft Surface Pro 9, ARM | |
| HP EliteBook Folio 13.5-3G2L2EA | |
| Microsoft Surface Pro X | |
| AIDA64 / Memory Copy | |
| Genomsnitt av klass Convertible (23880 - 161475, n=50, senaste 2 åren) | |
| Microsoft Surface Pro 9, i7-1255U | |
| Genomsnitt Qualcomm Snapdragon 8cx Gen 3 (40599 - 42710, n=3) | |
| Lenovo ThinkPad X13s Gen 1 21BX000QGE | |
| Microsoft Surface Pro 9, ARM | |
| AIDA64 / Memory Read | |
| Genomsnitt av klass Convertible (19931 - 131960, n=50, senaste 2 åren) | |
| Microsoft Surface Pro 9, i7-1255U | |
| Lenovo ThinkPad X13s Gen 1 21BX000QGE | |
| Genomsnitt Qualcomm Snapdragon 8cx Gen 3 (33013 - 33757, n=3) | |
| Microsoft Surface Pro 9, ARM | |
| AIDA64 / Memory Write | |
| Genomsnitt av klass Convertible (17473 - 216896, n=50, senaste 2 åren) | |
| Microsoft Surface Pro 9, i7-1255U | |
| Microsoft Surface Pro 9, ARM | |
| Genomsnitt Qualcomm Snapdragon 8cx Gen 3 (49100 - 49815, n=3) | |
| Lenovo ThinkPad X13s Gen 1 21BX000QGE | |
| AIDA64 / Memory Latency | |
| Genomsnitt av klass Convertible (6.9 - 536, n=49, senaste 2 åren) | |
| Microsoft Surface Pro 9, i7-1255U | |
| Lenovo ThinkPad X13s Gen 1 21BX000QGE | |
| Genomsnitt Qualcomm Snapdragon 8cx Gen 3 (10.2 - 18.8, n=3) | |
| Microsoft Surface Pro 9, ARM | |
* ... mindre är bättre
Lagringslösning
Den kompakta M.2-2230 SSD-enheten kommer från SK Hynix och har en lagringskapacitet på 256 GB, varav 180 GB fortfarande är tillgängliga efter att ha kört enheten för första gången. Överföringshastigheterna för PCIe 3.0 SSd är okej och tillräckliga i daglig drift, särskilt med tanke på den låga CPU-prestandan. Dessutom förblir överföringshastigheterna konstanta även efter längre belastningar. Du kan hitta ytterligare benchmarks för SSD-produkter här.

* ... mindre är bättre
Disk Throttling: DiskSpd Read Loop, Queue Depth 8
Grafikkort
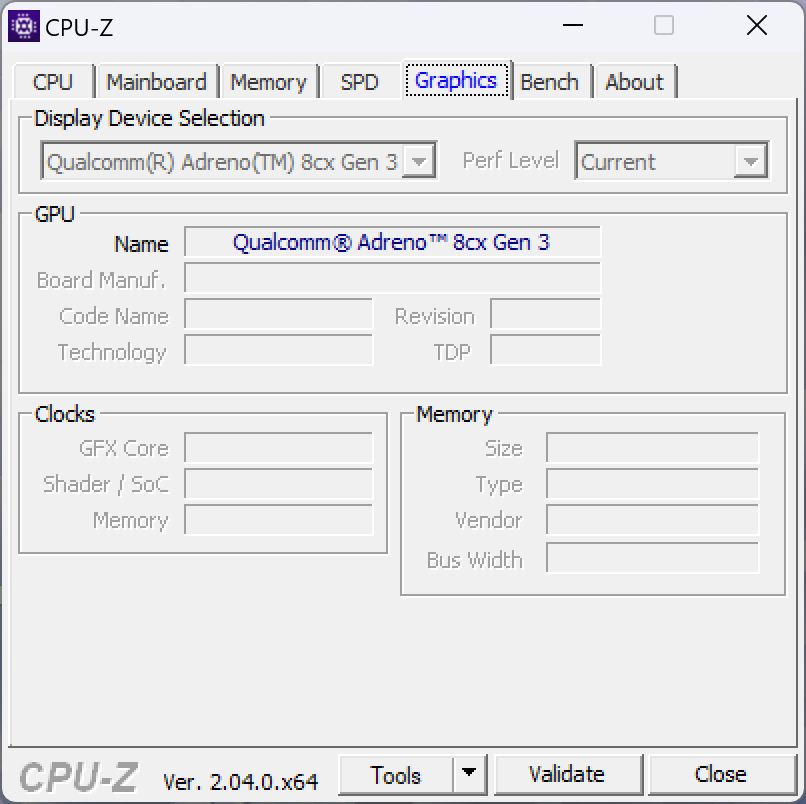
Grafikberäkningarna hanteras av den integrerade Adreno-690 GPUi processorn, som kan återge högupplösta videor i vardaglig drift utan problem. Om vi tittar på den rena prestandan ser vi en fördel på cirka 25 % jämfört med den gamla Adreno 680, men den dammiga åldradeIris Xe Graphics G7i Intel CPU:erna är fortfarande betydligt kraftfullare. The M2 GPUi den nuvarande iPad Pro 12.9 spelar i en helt annan liga ändå.
Surface Pro 9 ARM lämpar sig knappast för spel, eftersom många vanliga spel knappt går att köra eller inte startar alls. Istället bör du begränsa dig till mycket enkla spel från Windows Store (till exempel kortspel, schack eller Mahjong). Men Adreno 690:s grafikprestanda förblir i alla fall stabil i batteridrift såväl som under längre belastning. Du kan hitta ytterligare GPU-jämförelser här.
| 3DMark 11 Performance | 3077 poäng | |
| 3DMark Cloud Gate Standard Score | 8602 poäng | |
| 3DMark Fire Strike Score | 2911 poäng | |
Hjälp | ||
| låg | med. | hög | ultra | |
|---|---|---|---|---|
| The Witcher 3 (2015) | 35 | |||
| Dota 2 Reborn (2015) | 57.1 | 54.5 | 47 | 40.7 |
| X-Plane 11.11 (2018) | 20.7 | 18 | 16.3 |
Utsläpp och energihantering
Bullernivåer
Precis som för de andra ARM-enheterna i jämförelsegruppen är den passiva kylningen naturligtvis en fördel, eftersom den konvertibla enheten alltid är helt tyst. Vi upptäckte inte heller några andra elektroniska ljud.
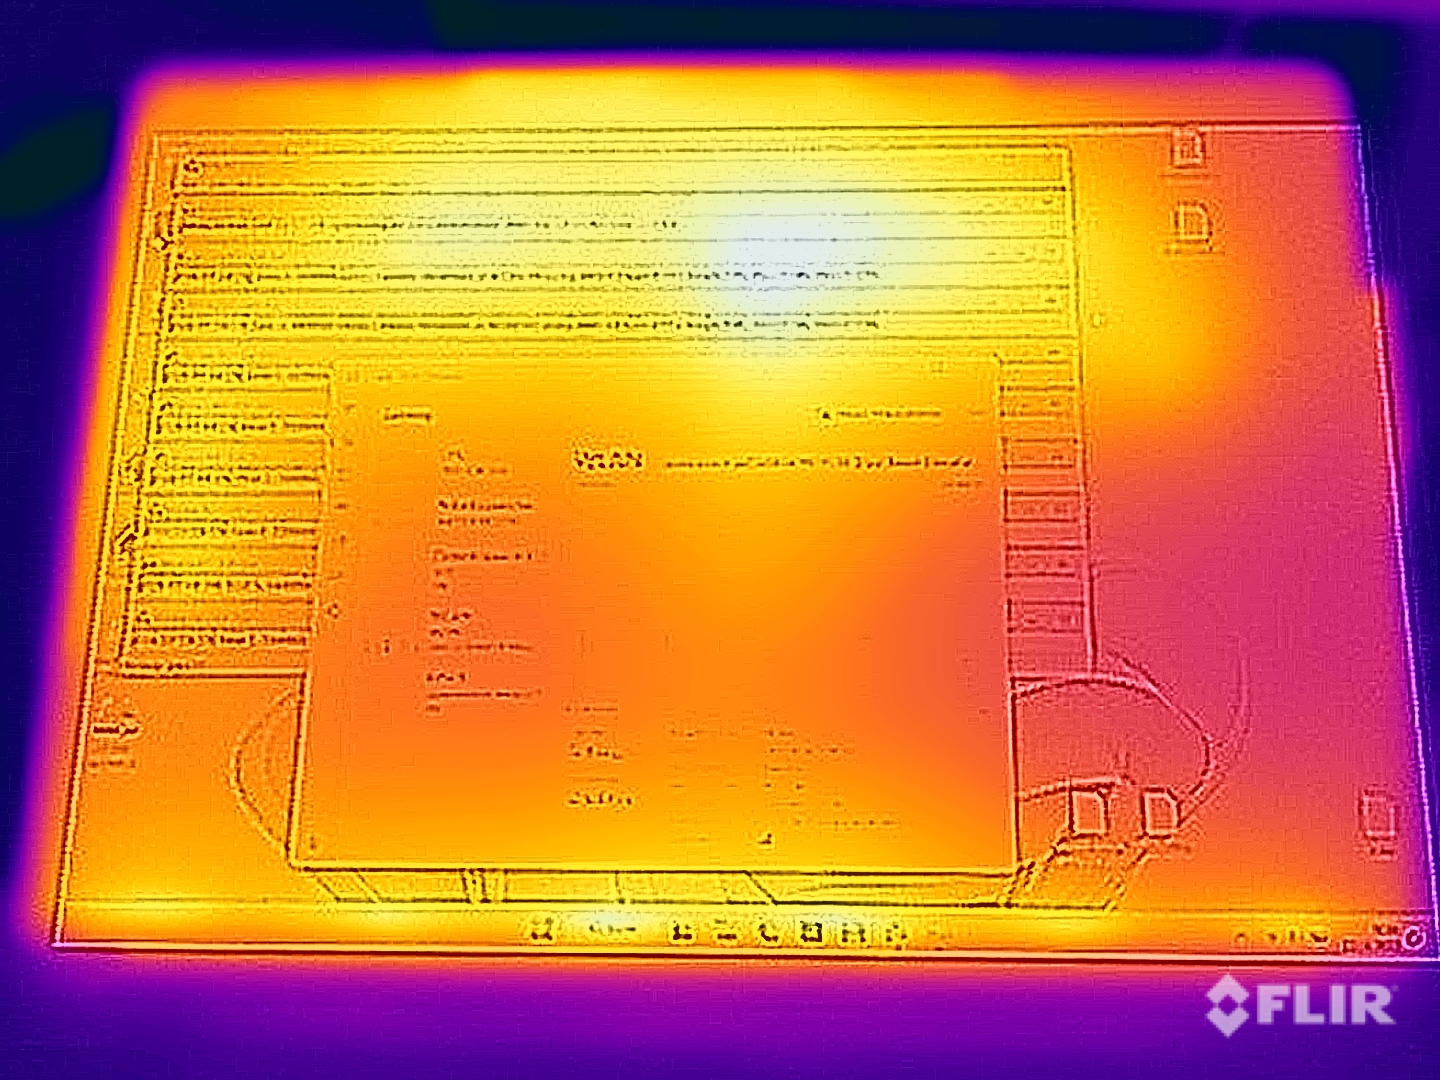
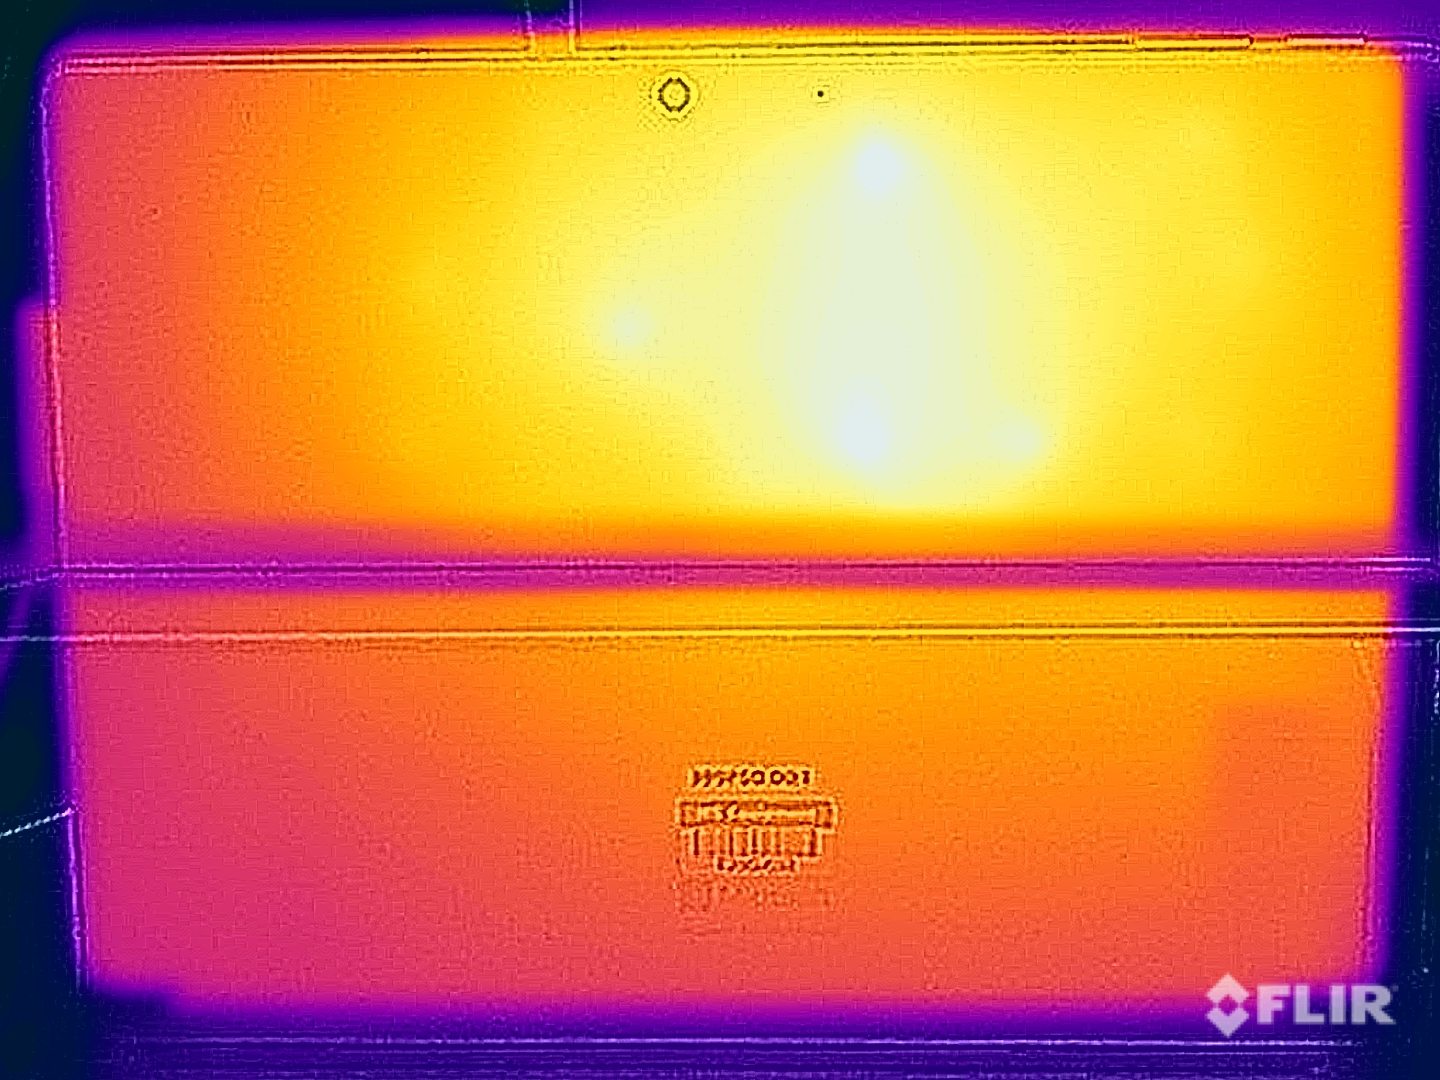
Temperaturer
I vardaglig drift värms cabriolet praktiskt taget inte upp alls. Endast om du verkligen ökar kraven på processorn blir värmen märkbar, på grund av att metallhöljet ibland till och med känns obehagligt varmt när du håller konvertibeln i händerna. Vi mäter till exempel yttemperaturer på upp till 44 °C (111 °F) på baksidan. Vi måste bara fråga oss varför ARM-processorn körs med så hög effekt här.
(±) Den maximala temperaturen på ovansidan är 40.8 °C / 105 F, jämfört med genomsnittet av 35.4 °C / 96 F , allt från 19.6 till 60 °C för klassen Convertible.
(±) Botten värms upp till maximalt 43.4 °C / 110 F, jämfört med genomsnittet av 36.9 °C / 98 F
(+) Vid tomgångsbruk är medeltemperaturen för ovansidan 23 °C / 73 F, jämfört med enhetsgenomsnittet på 30.3 °C / ### class_avg_f### F.
(±) Handledsstöden och pekplattan kan bli väldigt varma vid beröring med maximalt 36.4 °C / 97.5 F.
(-) Medeltemperaturen för handledsstödsområdet på liknande enheter var 28 °C / 82.4 F (-8.4 °C / -15.1 F).
| Microsoft Surface Pro 9, ARM Qualcomm Snapdragon 8cx Gen 3, Qualcomm Adreno 690 | Microsoft Surface Pro 9, i7-1255U Intel Core i7-1255U, Intel Iris Xe Graphics G7 96EUs | Microsoft Surface Pro X Microsoft SQ1, Qualcomm Adreno 685 | Lenovo ThinkPad X13s Gen 1 21BX000QGE Qualcomm Snapdragon 8cx Gen 3, Qualcomm Adreno 690 | HP EliteBook Folio 13.5-3G2L2EA Qualcomm Snapdragon 8cx Gen 2 5G, Qualcomm Adreno 680 | Apple iPad Pro 12.9 2022 Apple M2, Apple M2 10-Core GPU | |
|---|---|---|---|---|---|---|
| Heat | -9% | -9% | -32% | 3% | -11% | |
| Maximum Upper Side * (°C) | 40.8 | 44.6 -9% | 41.8 -2% | 59 -45% | 34.3 16% | 36.9 10% |
| Maximum Bottom * (°C) | 43.4 | 45.9 -6% | 45.7 -5% | 64.4 -48% | 35.4 18% | 37.6 13% |
| Idle Upper Side * (°C) | 23.2 | 24.8 -7% | 26.3 -13% | 26.5 -14% | 25.7 -11% | 31.9 -38% |
| Idle Bottom * (°C) | 22.6 | 25.3 -12% | 25.8 -14% | 26.8 -19% | 25.1 -11% | 29.4 -30% |
* ... mindre är bättre
Effektförbrukning
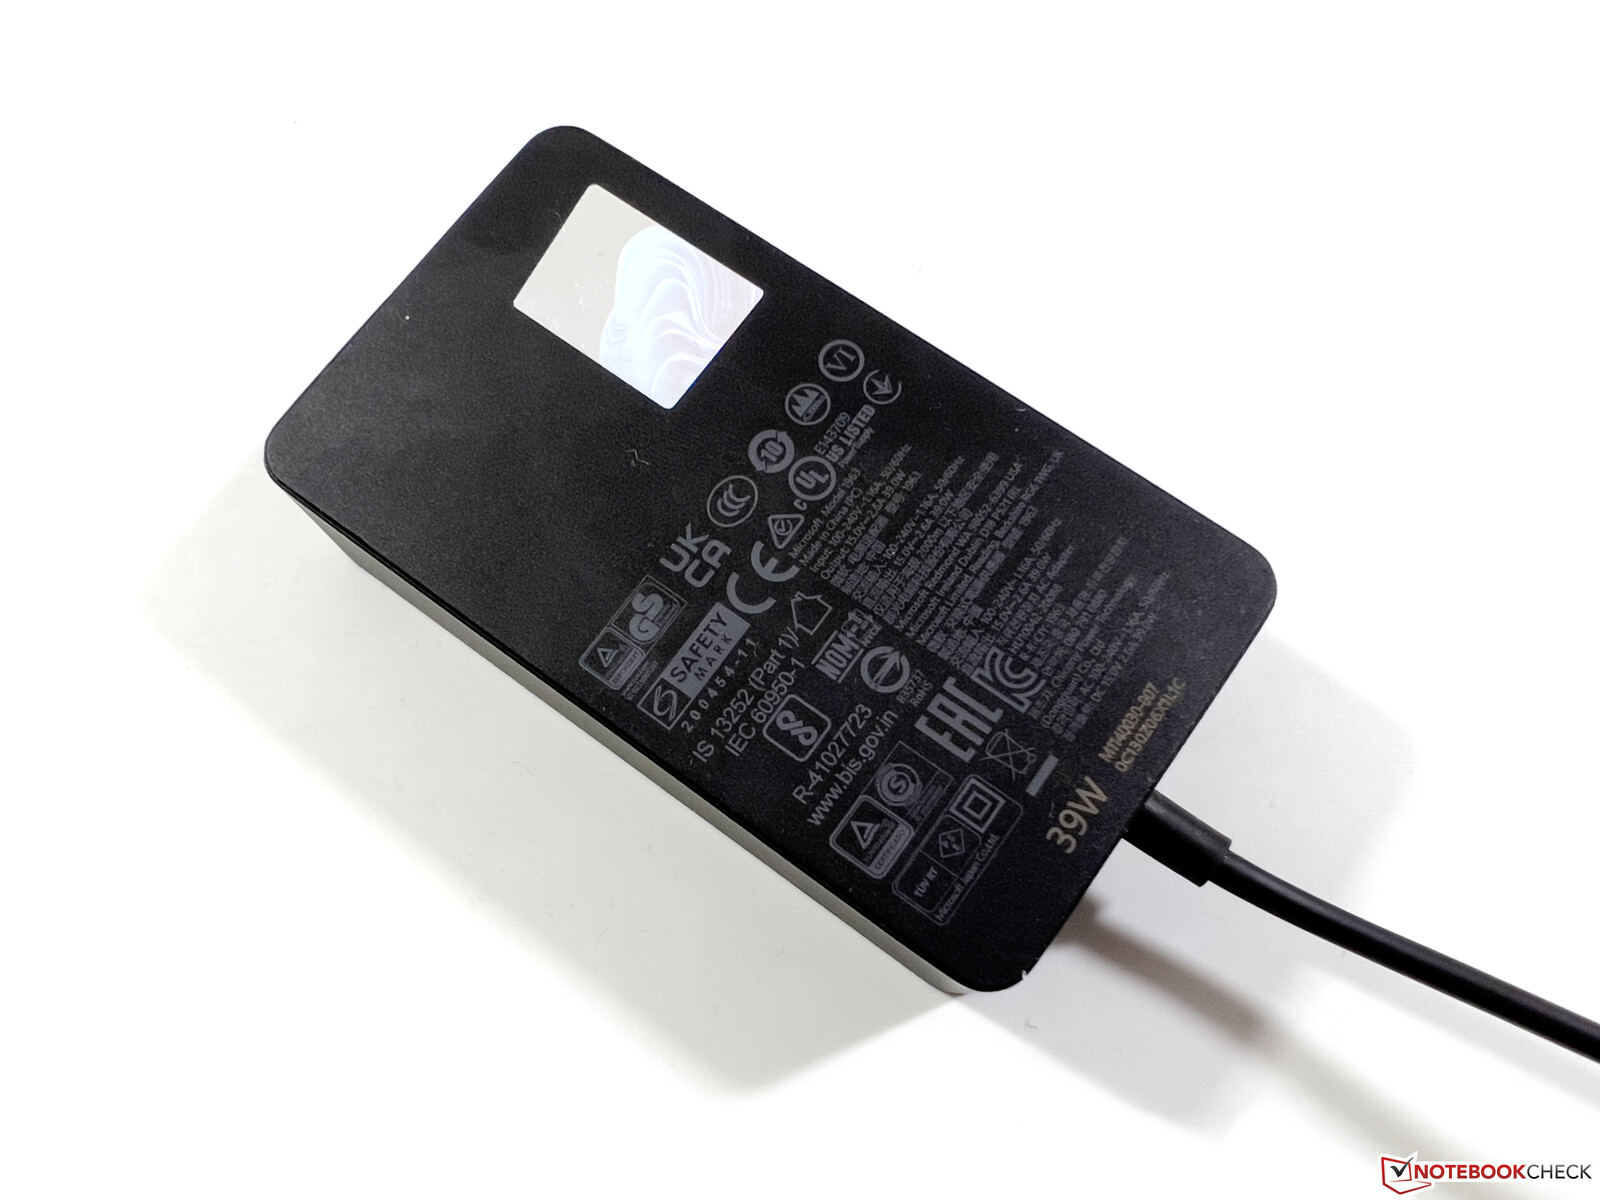
Mätningarna vid tomgång är totalt sett något höga för en ARM-enhet, men det kan bero på en bugg. Även om vi kunde växla skärmens 120 Hz-läge till 60 Hz hade detta ingen effekt (skärmen blev inte heller kortvarigt svart, vilket brukar vara fallet när man växlar). Under belastning drar enheten maximalt 40 watt från uttaget, så den utnyttjar den medföljande 39-watts laddaren fullt ut. Vi hade föredragit om den hade inkluderat den 60-wattsladdare som ingår i Intel-versionen, som också erbjuder en extra USB-A-anslutning för laddning.
| Av/Standby | |
| Låg belastning | |
| Hög belastning |
|
Förklaring:
min: | |
| Microsoft Surface Pro 9, ARM Adreno 690, SD 8cx Gen 3 | Microsoft Surface Pro 9, i7-1255U Iris Xe G7 96EUs, i7-1255U, Samsung MZ9L4512HBLU-00BMV | Microsoft Surface Pro X Adreno 685, SQ1, 256 GB NVMe | Lenovo ThinkPad X13s Gen 1 21BX000QGE Adreno 690, SD 8cx Gen 3, Lenovo UMIS AM630 RPJTJ512MGE1QDQ | HP EliteBook Folio 13.5-3G2L2EA Adreno 680, SD 8cx Gen 2 5G, Toshiba XG6 KXG60ZNV512G | Apple iPad Pro 12.9 2022 M2 10-Core GPU, M2, 128 GB NVMe | |
|---|---|---|---|---|---|---|
| Power Consumption | -67% | -0% | 11% | 36% | 1% | |
| Idle Minimum * (Watt) | 2.8 | 5.1 -82% | 3.2 -14% | 2.6 7% | 2.3 18% | 2.54 9% |
| Idle Average * (Watt) | 6.8 | 9.8 -44% | 8.5 -25% | 4.9 28% | 3.7 46% | 11.24 -65% |
| Idle Maximum * (Watt) | 8.1 | 11.3 -40% | 9.6 -19% | 5.2 36% | 5.6 31% | 11.48 -42% |
| Load Average * (Watt) | 23.8 | 47.5 -100% | 19.8 17% | 21.5 10% | 13 45% | 12.97 46% |
| Load Maximum * (Watt) | 40.2 | 68.5 -70% | 24.7 39% | 49.8 -24% | 25 38% | 16.6 59% |
| Witcher 3 ultra * (Watt) | 36 |
* ... mindre är bättre
Power Consumption The Witcher 3 / Stress Test
Power Consumption with External Monitor
Batteritid
Batteritiden lider också av 120-Hz-buggen och är totalt sett lite kort. Även om Intel-modellen av Surface Pro 9överträffas, är nackdelen bakom den ThinkPad X13smed samma Snapdragon SoC är fortfarande betydande. Vi mäter 10 timmar i WLAN-testet vid 150 cd/m² ljusstyrka, och endast cirka 6 timmar vid full skärmhällighet. Under belastning håller den i 140 minuter. I 60-hz-läget borde en längre batteritid vara möjlig.
För
Emot
Slutsats - ARM-modellen av Surface Pro 9 får ingen rekommendation

ARM-modellen av Microsoft Surface Pro 9 har två klara fördelar jämfört med den Intel-versionen. Den första fördelen är den passiva kylningen, vilket garanterar att den konvertibla datorn alltid fungerar tyst. Å andra sidan måste vi också säga att prestandan totalt sett ligger på en låg nivå. Den andra fördelen är det integrerade 5G-modemet, men vi tycker också att det är ytterst olyckligt att Microsoft tvingar kunderna att skaffa ARM-versionen här, genom att inte också erbjuda en Intel-modell med LTE/5G som tidigare har varit fallet.
Vi tycker att det är ett misstag att nu erbjuda ARM-modellen under etiketten Surface Pro 9. Med detta antyder Microsoft en produkt på liknande nivå, men detta är helt enkelt inte fallet i daglig drift (trots det högre priset jämfört med Core-i5-modellen).
Sammantaget finns det säkert ett bra skäl för Surface Pro med ARM-processor att existera, och tack vare den förbättrade 64-bitarsemuleringen kan nu betydligt fler appar köras. Den är dock fortfarande inte ett fullvärdigt alternativ till modellerna med x86-processor. I vardaglig drift är enheten helt enkelt inte lika snabb, och det fortsätter att förekomma en del mindre stamningar eller fördröjningar, även under enkla uppgifter. De som förväntar sig prestandan hos en Apple MacBook med ARM SoCkommer definitivt att bli besvikna här. I det här sammanhanget tycker vi också att Microsofts beslut att erbjuda ARM-versionen nu helt enkelt som Surface Pro 9 är problematiskt. Dessutom är kunderna tvungna att skaffa ARM-modellen om de vill ha ett integrerat LTE/5G-modem.
Trots den förbättrade kompatibiliteten med 64-bitarsprogram är Surface Pro 9 med ARM-processor fortfarande inte en fullfjädrad Windows-enhet, eftersom alla program inte är kompatibla. Den uppfyller inte de krav som användarna kopplar samman med Surface "Pro"-märkningen.
ARM-modellen erbjuder också ett stabilt hölje, en bra skärm och bra högtalare. Om man bara tittar på det i sig är det en bra enhet, men med tanke på det höga priset har vi svårt att rekommendera ARM-modellen jämfört med Intel-versionen av Surface Pro 9. Naturligtvis är SP9 med Qualcomms SoC också lämplig för enkla uppgifter, men det gäller även för Apple iPad Pro 12.9, som har fördelar på nästan alla områden med sin M2 SoC.
Pris och tillgänglighet
Surface Pro 9 ARM är tillgänglig från Microsoft Store från 1 169,99 USD, inklusive tangentbord och inmatningspenna. Amazon listar modeller som börjar från 1 299,99 dollar.
Microsoft Surface Pro 9, ARM
- 03/04/2023 v7 (old)
Andreas Osthoff
Genomskinlighet
Valet av enheter som ska granskas görs av vår redaktion. Testprovet gavs till författaren som ett lån av tillverkaren eller återförsäljaren för denna recension. Långivaren hade inget inflytande på denna recension och inte heller fick tillverkaren en kopia av denna recension innan publiceringen. Det fanns ingen skyldighet att publicera denna recension. Som ett oberoende medieföretag är Notebookcheck inte föremål för auktoritet från tillverkare, återförsäljare eller förlag.
This is how Notebookcheck is testingEvery year, Notebookcheck independently reviews hundreds of laptops and smartphones using standardized procedures to ensure that all results are comparable. We have continuously developed our test methods for around 20 years and set industry standards in the process. In our test labs, high-quality measuring equipment is utilized by experienced technicians and editors. These tests involve a multi-stage validation process. Our complex rating system is based on hundreds of well-founded measurements and benchmarks, which maintains objectivity.
Price comparison

