Test: Asus ROG Zephyrus G15 - Fångar blicken (Sammanfattning)
Testgrupp
Gradering | Datum | Modell | Vikt | Höjd | Storlek | Upplösning | Pris |
|---|---|---|---|---|---|---|---|
| 83.8 % v7 (old) | 02/2021 | Asus ROG Zephyrus G15 GA503Q R9 5900HS, GeForce RTX 3080 Laptop GPU | 2 kg | 20 mm | 15.60" | 2560x1440 | |
| 84 % v7 (old) | 05/2020 | MSI GS66 10SGS i7-10750H, GeForce RTX 2080 Super Max-Q | 2.2 kg | 20 mm | 15.60" | 1920x1080 | |
| 85.9 % v7 (old) | 08/2020 | Razer Blade 15 RTX 2080 Super Max-Q i7-10875H, GeForce RTX 2080 Super Max-Q | 2.2 kg | 17.8 mm | 15.60" | 1920x1080 | |
v (old) | 04/2020 | Acer Predator Triton 500 PT515-52-70N3 i7-10750H, GeForce RTX 2080 Super Max-Q | 2.1 kg | 18 mm | 15.60" | 1920x1080 | |
| 86.3 % v7 (old) | 12/2020 | Lenovo Legion 7 15IMH05-81YT001VGE i9-10980HK, GeForce RTX 2080 Super Max-Q | 2.4 kg | 19.9 mm | 15.60" | 1920x1080 |
| |||||||||||||||||||||||||
Distribution av ljusstyrkan: 89 %
Mitt på batteriet: 327 cd/m²
Kontrast: 991:1 (Svärta: 0.33 cd/m²)
ΔE ColorChecker Calman: 4.49 | ∀{0.5-29.43 Ø4.72}
calibrated: 2.27
ΔE Greyscale Calman: 4.2 | ∀{0.09-98 Ø4.97}
99% sRGB (Argyll 1.6.3 3D)
86% AdobeRGB 1998 (Argyll 1.6.3 3D)
86.2% AdobeRGB 1998 (Argyll 3D)
99.9% sRGB (Argyll 3D)
97.3% Display P3 (Argyll 3D)
Gamma: 2.173
CCT: 7014 K
| Asus ROG Zephyrus G15 GA503Q CMN N156KME-GNA (CMN152A), IPS-Level, 2560x1440, 15.6" | MSI GS66 10SGS AU Optronics B156HAN12.0, IPS, 1920x1080, 15.6" | Razer Blade 15 RTX 2080 Super Max-Q AU Optronics B156HAN12.0, IPS, 1920x1080, 15.6" | Acer Predator Triton 500 PT515-52-70N3 AUO B156HAN12.0 (AUO7A8C), IPS, 1920x1080, 15.6" | Lenovo Legion 7 15IMH05-81YT001VGE AUO048E, IPS, 1920x1080, 15.6" | |
|---|---|---|---|---|---|
| Display | -16% | -15% | -15% | -15% | |
| Display P3 Coverage (%) | 97.3 | 69.9 -28% | 70.2 -28% | 70.3 -28% | 70.3 -28% |
| sRGB Coverage (%) | 99.9 | 99.1 -1% | 99 -1% | 99.5 0% | 99.4 -1% |
| AdobeRGB 1998 Coverage (%) | 86.2 | 71.1 -18% | 71.4 -17% | 72.2 -16% | 71.3 -17% |
| Response Times | -8% | 26% | -29% | 19% | |
| Response Time Grey 50% / Grey 80% * (ms) | 8.8 ? | 11.2 ? -27% | 6 ? 32% | 14.4 ? -64% | 8 ? 9% |
| Response Time Black / White * (ms) | 11.2 ? | 10 ? 11% | 9 ? 20% | 10.4 ? 7% | 8 ? 29% |
| PWM Frequency (Hz) | |||||
| Screen | 24% | 18% | 6% | 30% | |
| Brightness middle (cd/m²) | 327 | 339.4 4% | 347 6% | 320 -2% | 470 44% |
| Brightness (cd/m²) | 309 | 331 7% | 328 6% | 318 3% | 468 51% |
| Brightness Distribution (%) | 89 | 92 3% | 89 0% | 88 -1% | 85 -4% |
| Black Level * (cd/m²) | 0.33 | 0.24 27% | 0.285 14% | 0.24 27% | 0.21 36% |
| Contrast (:1) | 991 | 1414 43% | 1218 23% | 1333 35% | 2238 126% |
| Colorchecker dE 2000 * | 4.49 | 1.58 65% | 2.35 48% | 4.03 10% | 3.28 27% |
| Colorchecker dE 2000 max. * | 8.42 | 3.8 55% | 4.15 51% | 8.43 -0% | 7.31 13% |
| Colorchecker dE 2000 calibrated * | 2.27 | 1.47 35% | 1.16 49% | 0.98 57% | 0.8 65% |
| Greyscale dE 2000 * | 4.2 | 2.3 45% | 3.04 28% | 5.94 -41% | 4.49 -7% |
| Gamma | 2.173 101% | 2.24 98% | 2.35 94% | 2.42 91% | 2.4 92% |
| CCT | 7014 93% | 6952 93% | 6658 98% | 6751 96% | 7438 87% |
| Color Space (Percent of AdobeRGB 1998) (%) | 86 | 64.8 -25% | 65 -24% | 66 -23% | 65 -24% |
| Color Space (Percent of sRGB) (%) | 99 | 99.4 0% | 99 0% | 99 0% | 99 0% |
| Totalt genomsnitt (program/inställningar) | 0% /
12% | 10% /
13% | -13% /
-2% | 11% /
20% |
* ... mindre är bättre
Visa svarstider
| ↔ Svarstid svart till vitt | ||
|---|---|---|
| 11.2 ms ... stiga ↗ och falla ↘ kombinerat | ↗ 6.8 ms stiga | 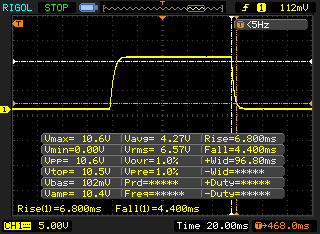 |
| ↘ 4.4 ms hösten | ||
| Skärmen visar bra svarsfrekvens i våra tester, men kan vara för långsam för konkurrenskraftiga spelare. I jämförelse sträcker sig alla testade enheter från 0.1 (minst) till 240 (maximalt) ms. » 30 % av alla enheter är bättre. Det betyder att den uppmätta svarstiden är bättre än genomsnittet av alla testade enheter (19.8 ms). | ||
| ↔ Svarstid 50 % grått till 80 % grått | ||
| 8.8 ms ... stiga ↗ och falla ↘ kombinerat | ↗ 4.4 ms stiga | 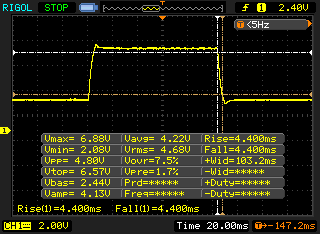 |
| ↘ 4.4 ms hösten | ||
| Skärmen visar snabba svarsfrekvenser i våra tester och bör passa för spel. I jämförelse sträcker sig alla testade enheter från 0.165 (minst) till 636 (maximalt) ms. » 22 % av alla enheter är bättre. Det betyder att den uppmätta svarstiden är bättre än genomsnittet av alla testade enheter (31 ms). | ||
Skärmflimmer / PWM (Puls-Width Modulation)
| Skärmflimmer / PWM upptäcktes inte |  | ||
Som jämförelse: 52 % av alla testade enheter använder inte PWM för att dämpa skärmen. Om PWM upptäcktes mättes ett medelvärde av 7778 (minst: 5 - maximum: 343500) Hz. | |||

* ... mindre är bättre
| PCMark 10 Score | 6896 poäng | |
Hjälp | ||
| DPC Latencies / LatencyMon - interrupt to process latency (max), Web, Youtube, Prime95 | |
| Acer Predator Triton 500 PT515-52-70N3 | |
| Lenovo Legion 7 15IMH05-81YT001VGE | |
| MSI GS66 10SGS | |
| Razer Blade 15 RTX 2080 Super Max-Q | |
| Asus ROG Zephyrus G15 GA503Q | |
* ... mindre är bättre
| Asus ROG Zephyrus G15 GA503Q SK Hynix HFM001TD3JX013N | MSI GS66 10SGS Samsung SSD PM981 MZVLB512HAJQ | Razer Blade 15 RTX 2080 Super Max-Q Samsung PM981a MZVLB1T0HBLR | Acer Predator Triton 500 PT515-52-70N3 Samsung SSD PM981a MZVLB512HBJQ | Lenovo Legion 7 15IMH05-81YT001VGE 2x Samsung PM981a MZVLB1T0HBLR (RAID 0) | |
|---|---|---|---|---|---|
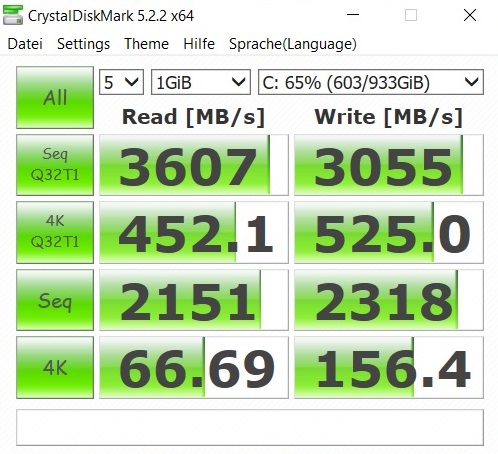
| CrystalDiskMark 5.2 / 6 | -16% | -6% | -5% | -6% | |
| Write 4K (MB/s) | 156.4 | 132.5 -15% | 135.7 -13% | 131.7 -16% | 110.4 -29% |
| Read 4K (MB/s) | 66.7 | 45.03 -32% | 46.98 -30% | 47.34 -29% | 55.1 -17% |
| Write Seq (MB/s) | 2318 | 1987 -14% | 2180 -6% | 2884 24% | |
| Read Seq (MB/s) | 2151 | 1434 -33% | 1949 -9% | 2303 7% | |
| Write 4K Q32T1 (MB/s) | 525 | 467.5 -11% | 510 -3% | 423.9 -19% | 466.6 -11% |
| Read 4K Q32T1 (MB/s) | 452.1 | 536 19% | 569 26% | 487.7 8% | 517 14% |
| Write Seq Q32T1 (MB/s) | 3055 | 2003 -34% | 2984 -2% | 2822 -8% | 3424 12% |
| Read Seq Q32T1 (MB/s) | 3607 | 3306 -8% | 3238 -10% | 3478 -4% | 3519 -2% |
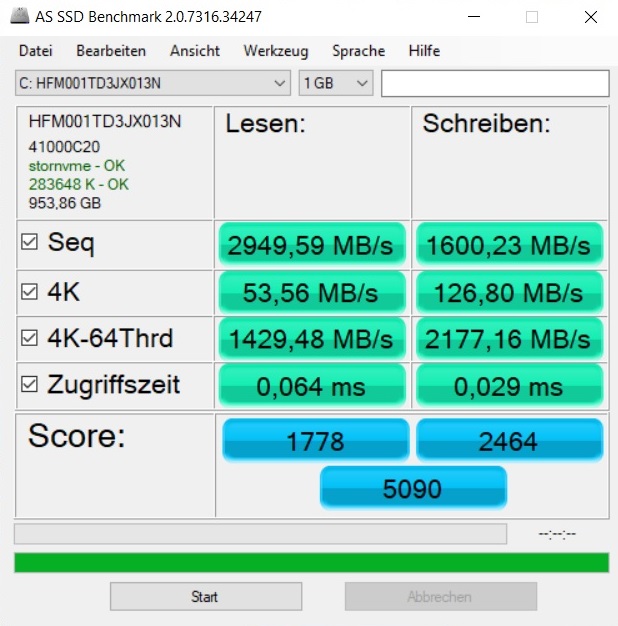
| AS SSD | -31% | -6% | -5% | -4% | |
| Seq Read (MB/s) | 2950 | 1086 -63% | 1950 -34% | 2767 -6% | 3088 5% |
| Seq Write (MB/s) | 1600 | 1901 19% | 2322 45% | 2613 63% | 2561 60% |
| 4K Read (MB/s) | 53.6 | 51 -5% | 45.48 -15% | 47.55 -11% | 43.01 -20% |
| 4K Write (MB/s) | 126.8 | 117.3 -7% | 95.4 -25% | 98.9 -22% | 102 -20% |
| 4K-64 Read (MB/s) | 1429 | 1503 5% | 1484 4% | 1205 -16% | 1549 8% |
| 4K-64 Write (MB/s) | 2177 | 1721 -21% | 1887 -13% | 2007 -8% | 1378 -37% |
| Access Time Read * (ms) | 0.064 | 0.059 8% | 0.051 20% | 0.065 -2% | 0.051 20% |
| Access Time Write * (ms) | 0.029 | 0.1 -245% | 0.038 -31% | 0.038 -31% | 0.037 -28% |
| Score Read (Points) | 1778 | 1662 -7% | 1725 -3% | 1529 -14% | 1901 7% |
| Score Write (Points) | 2464 | 2029 -18% | 2215 -10% | 2367 -4% | 1737 -30% |
| Score Total (Points) | 5090 | 4588 -10% | 4843 -5% | 4677 -8% | 4583 -10% |
| Totalt genomsnitt (program/inställningar) | -24% /
-25% | -6% /
-6% | -5% /
-5% | -5% /
-5% |
* ... mindre är bättre

DiskSpd Read Loop, Queue Depth 8
| 3DMark Cloud Gate Standard Score | 42022 poäng | |
| 3DMark Fire Strike Score | 20784 poäng | |
| 3DMark Time Spy Score | 9391 poäng | |
Hjälp | ||
| The Witcher 3 | |
| 1920x1080 Ultra Graphics & Postprocessing (HBAO+) | |
| Genomsnitt av klass Gaming (95 - 240, n=8, senaste 2 åren) | |
| Asus ROG Zephyrus G15 GA503Q | |
| Lenovo Legion 7 15IMH05-81YT001VGE | |
| Razer Blade 15 RTX 2080 Super Max-Q | |
| Acer Predator Triton 500 PT515-52-70N3 | |
| MSI GS66 10SGS | |
| 3840x2160 High Graphics & Postprocessing (Nvidia HairWorks Off) | |
| Genomsnitt av klass Gaming (114 - 169.8, n=3, senaste 2 åren) | |
| Asus ROG Zephyrus G15 GA503Q | |
| Acer Predator Triton 500 PT515-52-70N3 | |
| låg | med. | hög | ultra | QHD | 4K | |
|---|---|---|---|---|---|---|
| GTA V (2015) | 177 | 152 | 90 | |||
| The Witcher 3 (2015) | 155 | 90.2 | 62.2 | |||
| Dota 2 Reborn (2015) | 148 | 140 | 126 | 119 | ||
| X-Plane 11.11 (2018) | 103 | 88 | 72.4 | |||
| Shadow of the Tomb Raider (2018) | 111 | 106 | 79 | 43 | ||
| Battlefield V (2018) | 131 | 125 | 98.3 | 59.2 | ||
| Apex Legends (2019) | 144 | 144 | 120 | 69.2 | ||
| Far Cry New Dawn (2019) | 101 | 90 | 78 | 50 | ||
| Metro Exodus (2019) | 85 | 68.7 | 53.8 | 35.4 | ||
| The Division 2 (2019) | 105 | 82 | 56 | 31 | ||
| Anno 1800 (2019) | 77.6 | 44.3 | 37.9 | 25.2 | ||
| Rage 2 (2019) | 116 | 115 | 75.5 | 37.8 | ||
| Control (2019) | 82.3 | 55.7 | 29 | |||
| Borderlands 3 (2019) | 94.5 | 76.5 | 55.7 | 32.3 | ||
| GRID 2019 (2019) | 113 | 84.8 | 69.8 | 48.7 | ||
| Need for Speed Heat (2019) | 94.3 | 89.4 | 67.9 | 40.7 | ||
| Star Wars Jedi Fallen Order (2019) | 97.8 | 91.5 | 79 | 42.1 | ||
| Red Dead Redemption 2 (2019) | 85.1 | 57.5 | 46.9 | 31.2 | ||
| Hunt Showdown (2020) | 111 | 71.4 | 36.8 | |||
| Doom Eternal (2020) | 165 | 163 | 123 | 68 | ||
| Gears Tactics (2020) | 136 | 107 | 72.4 | 39.4 | ||
| F1 2020 (2020) | 162 | 131 | 103 | 60 | ||
| Death Stranding (2020) | 83.6 | 82.3 | 73.7 | 52.1 | ||
| Horizon Zero Dawn (2020) | 93 | 84 | 67 | 41 | ||
| Crysis Remastered (2020) | 79.2 | 56.9 | 45.2 | 29.4 | ||
| Serious Sam 4 (2020) | 93.3 | 80.2 | 67.2 | |||
| Mafia Definitive Edition (2020) | 98.7 | 70.7 | 37.2 | |||
| Star Wars Squadrons (2020) | 198 | 189 | 134 | 79.4 | ||
| FIFA 21 (2020) | 198 | 190 | 156 | 104 | ||
| Watch Dogs Legion (2020) | 82 | 65 | 52 | 31 | ||
| Dirt 5 (2020) | 85.6 | 56.4 | 42.7 | 39.6 | ||
| Assassin´s Creed Valhalla (2020) | 74 | 64 | 52 | 33 | ||
| Call of Duty Black Ops Cold War (2020) | 89.4 | 81.7 | 62.8 | 36.9 | ||
| Yakuza Like a Dragon (2020) | 112 | 101 | 67.1 | 35.8 | ||
| Immortals Fenyx Rising (2020) | 88 | 82 | 64 | 44 | ||
| Cyberpunk 2077 1.0 (2020) | 70 | 60.2 | 39.8 | 19.7 |
Ljudnivå
| Låg belastning |
| 26 / 27 / 31 dB(A) |
| Hög belastning |
| 49 / 51 dB(A) |
 | ||
30 dB tyst 40 dB(A) hörbar 50 dB(A) högt ljud |
||
min: | ||
| Asus ROG Zephyrus G15 GA503Q R9 5900HS, GeForce RTX 3080 Laptop GPU | MSI GS66 10SGS i7-10750H, GeForce RTX 2080 Super Max-Q | Razer Blade 15 RTX 2080 Super Max-Q i7-10875H, GeForce RTX 2080 Super Max-Q | Acer Predator Triton 500 PT515-52-70N3 i7-10750H, GeForce RTX 2080 Super Max-Q | Lenovo Legion 7 15IMH05-81YT001VGE i9-10980HK, GeForce RTX 2080 Super Max-Q | |
|---|---|---|---|---|---|
| Noise | -5% | -4% | -10% | 5% | |
| av / miljö * (dB) | 25 | 28.5 -14% | 30.1 -20% | 30 -20% | 24.4 2% |
| Idle Minimum * (dB) | 26 | 30 -15% | 30.1 -16% | 30 -15% | 24.4 6% |
| Idle Average * (dB) | 27 | 30 -11% | 30.1 -11% | 33 -22% | 24.4 10% |
| Idle Maximum * (dB) | 31 | 30.9 -0% | 30.1 3% | 36 -16% | 24.4 21% |
| Load Average * (dB) | 49 | 39.5 19% | 46.8 4% | 50 -2% | 49.3 -1% |
| Witcher 3 ultra * (dB) | 49 | 48 2% | 48.4 1% | 48 2% | 54 -10% |
| Load Maximum * (dB) | 51 | 59.4 -16% | 46 10% | 50 2% | 46.6 9% |
* ... mindre är bättre
(-) Den maximala temperaturen på ovansidan är 51 °C / 124 F, jämfört med genomsnittet av 40.4 °C / 105 F , allt från 21.2 till 68.8 °C för klassen Gaming.
(-) Botten värms upp till maximalt 56 °C / 133 F, jämfört med genomsnittet av 43.2 °C / 110 F
(+) Vid tomgångsbruk är medeltemperaturen för ovansidan 28.2 °C / 83 F, jämfört med enhetsgenomsnittet på 33.9 °C / ### class_avg_f### F.
(±) När du spelar The Witcher 3 är medeltemperaturen för ovansidan 37.8 °C / 100 F, jämfört med enhetsgenomsnittet på 33.9 °C / ## #class_avg_f### F.
(±) Handledsstöden och pekplattan kan bli väldigt varma vid beröring med maximalt 39 °C / 102.2 F.
(-) Medeltemperaturen för handledsstödsområdet på liknande enheter var 28.8 °C / 83.8 F (-10.2 °C / -18.4 F).
| Asus ROG Zephyrus G15 GA503Q R9 5900HS, GeForce RTX 3080 Laptop GPU | MSI GS66 10SGS i7-10750H, GeForce RTX 2080 Super Max-Q | Razer Blade 15 RTX 2080 Super Max-Q i7-10875H, GeForce RTX 2080 Super Max-Q | Acer Predator Triton 500 PT515-52-70N3 i7-10750H, GeForce RTX 2080 Super Max-Q | Lenovo Legion 7 15IMH05-81YT001VGE i9-10980HK, GeForce RTX 2080 Super Max-Q | |
|---|---|---|---|---|---|
| Heat | 5% | 3% | 9% | 21% | |
| Maximum Upper Side * (°C) | 51 | 47.8 6% | 52 -2% | 44 14% | 35.2 31% |
| Maximum Bottom * (°C) | 56 | 54.4 3% | 53 5% | 50 11% | 32.5 42% |
| Idle Upper Side * (°C) | 29 | 27.4 6% | 29.3 -1% | 29 -0% | 29.4 -1% |
| Idle Bottom * (°C) | 34 | 32 6% | 30.2 11% | 31 9% | 29.6 13% |
* ... mindre är bättre
Asus ROG Zephyrus G15 GA503Q ljudanalys
(±) | högtalarljudstyrkan är genomsnittlig men bra (78 dB)
Bas 100 - 315 Hz
(+) | bra bas - bara 4% från medianen
(+) | basen är linjär (6.5% delta till föregående frekvens)
Mellan 400 - 2000 Hz
(+) | balanserad mellan - endast 4.5% från medianen
(+) | mids är linjära (2.1% delta till föregående frekvens)
Högsta 2 - 16 kHz
(+) | balanserade toppar - endast 3.5% från medianen
(+) | toppar är linjära (5.7% delta till föregående frekvens)
Totalt 100 - 16 000 Hz
(+) | det totala ljudet är linjärt (11.2% skillnad mot median)
Jämfört med samma klass
» 8% av alla testade enheter i den här klassen var bättre, 4% liknande, 88% sämre
» Den bästa hade ett delta på 6%, genomsnittet var 18%, sämst var 132%
Jämfört med alla testade enheter
» 7% av alla testade enheter var bättre, 2% liknande, 91% sämre
» Den bästa hade ett delta på 4%, genomsnittet var 24%, sämst var 134%
Apple MacBook 12 (Early 2016) 1.1 GHz ljudanalys
(+) | högtalare kan spela relativt högt (83.6 dB)
Bas 100 - 315 Hz
(±) | reducerad bas - i genomsnitt 11.3% lägre än medianen
(±) | linjäriteten för basen är genomsnittlig (14.2% delta till föregående frekvens)
Mellan 400 - 2000 Hz
(+) | balanserad mellan - endast 2.4% från medianen
(+) | mids är linjära (5.5% delta till föregående frekvens)
Högsta 2 - 16 kHz
(+) | balanserade toppar - endast 2% från medianen
(+) | toppar är linjära (4.5% delta till föregående frekvens)
Totalt 100 - 16 000 Hz
(+) | det totala ljudet är linjärt (10.2% skillnad mot median)
Jämfört med samma klass
» 7% av alla testade enheter i den här klassen var bättre, 2% liknande, 91% sämre
» Den bästa hade ett delta på 5%, genomsnittet var 18%, sämst var 53%
Jämfört med alla testade enheter
» 5% av alla testade enheter var bättre, 1% liknande, 94% sämre
» Den bästa hade ett delta på 4%, genomsnittet var 24%, sämst var 134%
| Av/Standby | |
| Låg belastning | |
| Hög belastning |
|
Förklaring:
min: | |
| Asus ROG Zephyrus G15 GA503Q R9 5900HS, GeForce RTX 3080 Laptop GPU | MSI GS66 10SGS i7-10750H, GeForce RTX 2080 Super Max-Q | Razer Blade 15 RTX 2080 Super Max-Q i7-10875H, GeForce RTX 2080 Super Max-Q | Acer Predator Triton 500 PT515-52-70N3 i7-10750H, GeForce RTX 2080 Super Max-Q | Lenovo Legion 7 15IMH05-81YT001VGE i9-10980HK, GeForce RTX 2080 Super Max-Q | |
|---|---|---|---|---|---|
| Power Consumption | -32% | -7% | -17% | -8% | |
| Idle Minimum * (Watt) | 10 | 14.9 -49% | 10.6 -6% | 11 -10% | 9 10% |
| Idle Average * (Watt) | 12 | 17.5 -46% | 13.1 -9% | 15 -25% | 12.6 -5% |
| Idle Maximum * (Watt) | 17 | 29.5 -74% | 15.8 7% | 25 -47% | 17 -0% |
| Load Average * (Watt) | 108 | 94.8 12% | 131 -21% | 95 12% | 115 -6% |
| Witcher 3 ultra * (Watt) | 123 | 146.1 -19% | 146 -19% | 140 -14% | 159 -29% |
| Load Maximum * (Watt) | 182 | 210.9 -16% | 169 7% | 211 -16% | 216 -19% |
* ... mindre är bättre
| Asus ROG Zephyrus G15 GA503Q R9 5900HS, GeForce RTX 3080 Laptop GPU, 90 Wh | MSI GS66 10SGS i7-10750H, GeForce RTX 2080 Super Max-Q, 99.99 Wh | Razer Blade 15 RTX 2080 Super Max-Q i7-10875H, GeForce RTX 2080 Super Max-Q, 80 Wh | Acer Predator Triton 500 PT515-52-70N3 i7-10750H, GeForce RTX 2080 Super Max-Q, 84 Wh | Lenovo Legion 7 15IMH05-81YT001VGE i9-10980HK, GeForce RTX 2080 Super Max-Q, 80 Wh | |
|---|---|---|---|---|---|
| Batteridrifttid | -12% | -12% | -26% | -36% | |
| Reader / Idle (h) | 12.1 | 10.2 -16% | 8.7 -28% | 8.3 -31% | |
| WiFi v1.3 (h) | 9.4 | 6.9 -27% | 6.1 -35% | 6.3 -33% | 3.4 -64% |
| Load (h) | 1.5 | 1.6 7% | 1.9 27% | 1.3 -13% | 1.4 -7% |
| H.264 (h) | 7.3 | 1.5 |
För
Emot
Läs den fullständiga versionen av den här recensionen på engelska här.
Så länge du är medveten om att laptop-versionen av GeForce RTX 3080 inte kan utnyttja sin potential fullt ut på grund av Asus låga TDP-inställningar och att kortet därmed kan vara långsammare än ett snabbt RTX 3070 laptop-kort så ser ROG Zephyrus G15 GA503Q bra ut.
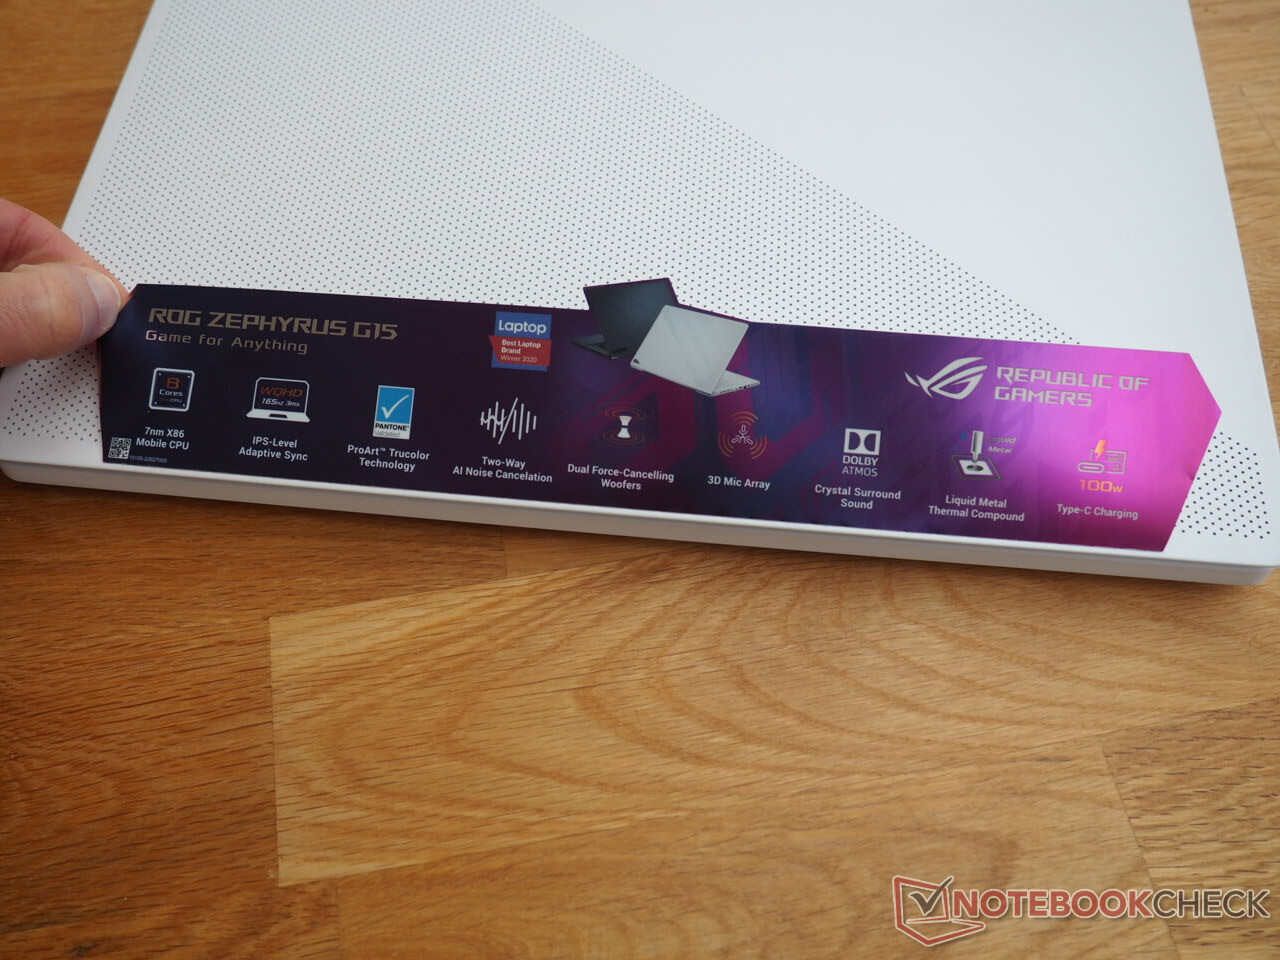
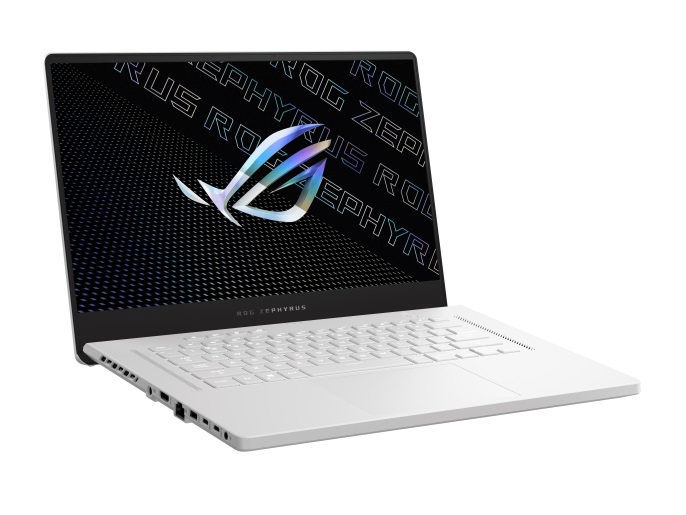
En av de största höjdpunkterna visade sig vara WQHD-skärmen som lockar köpare med 165 Hz, relativt snabba responstider, FreeSync samt ett brett färgomfång.
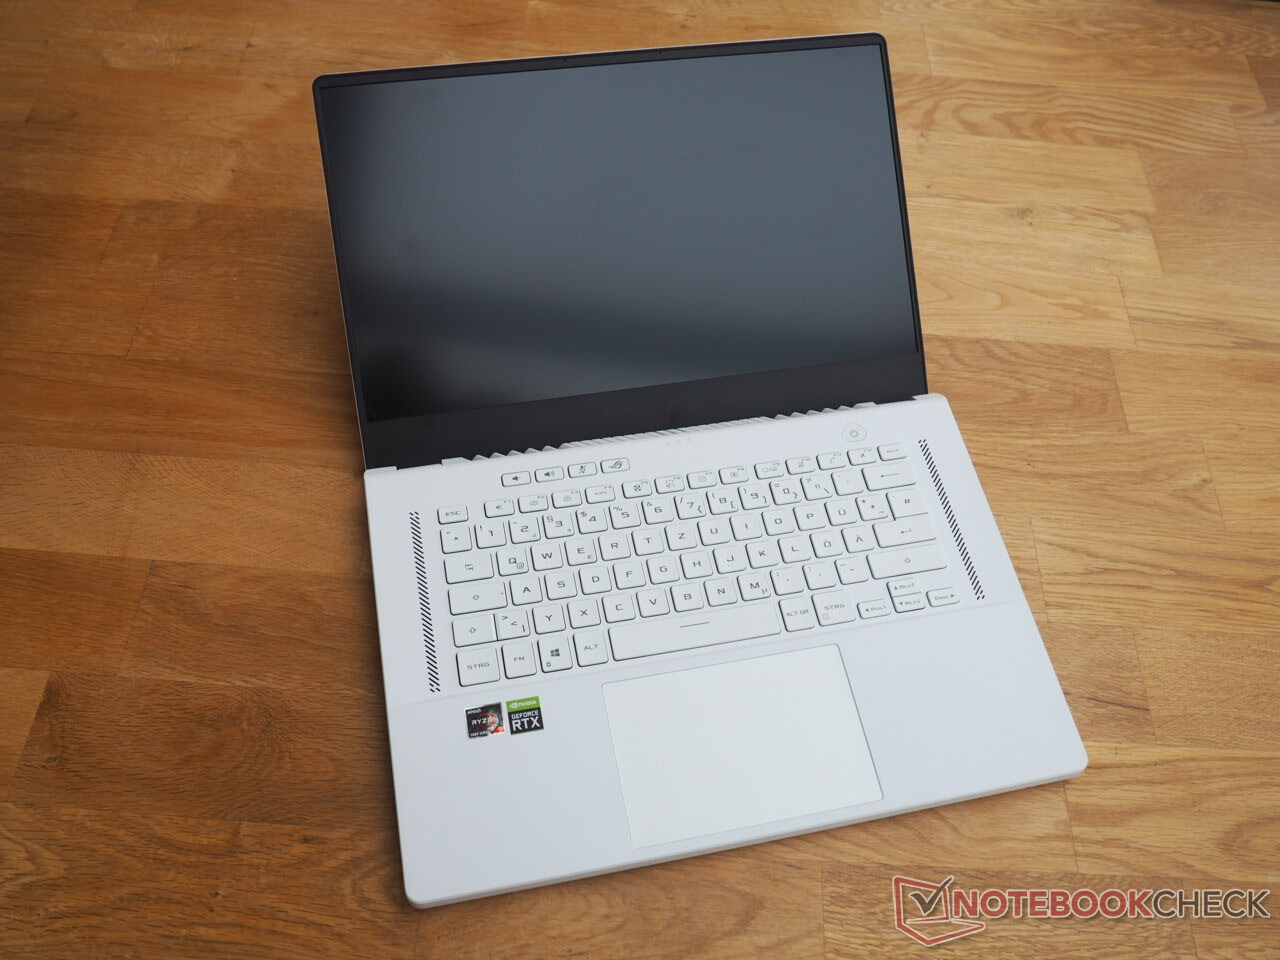
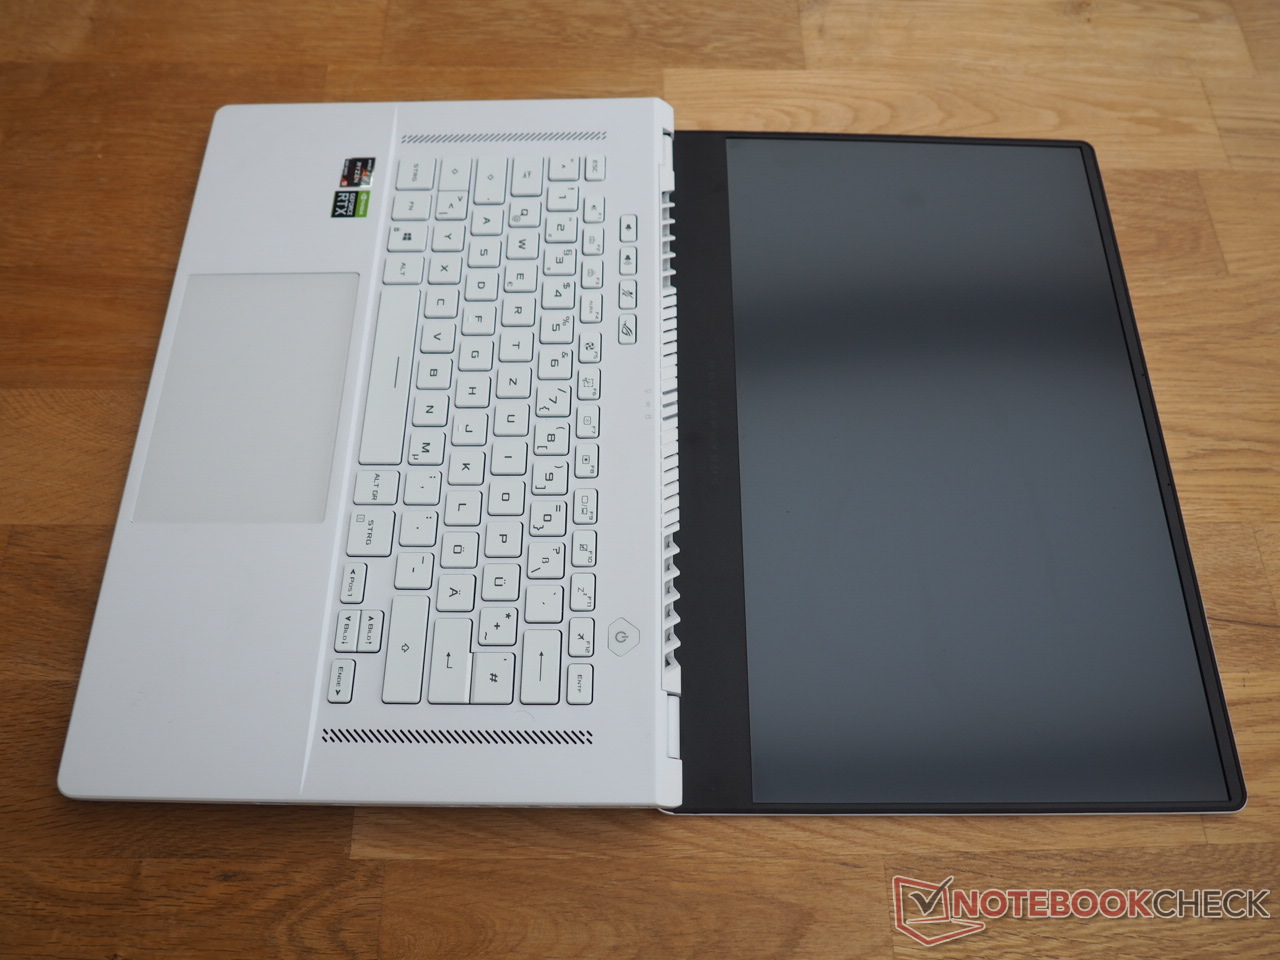
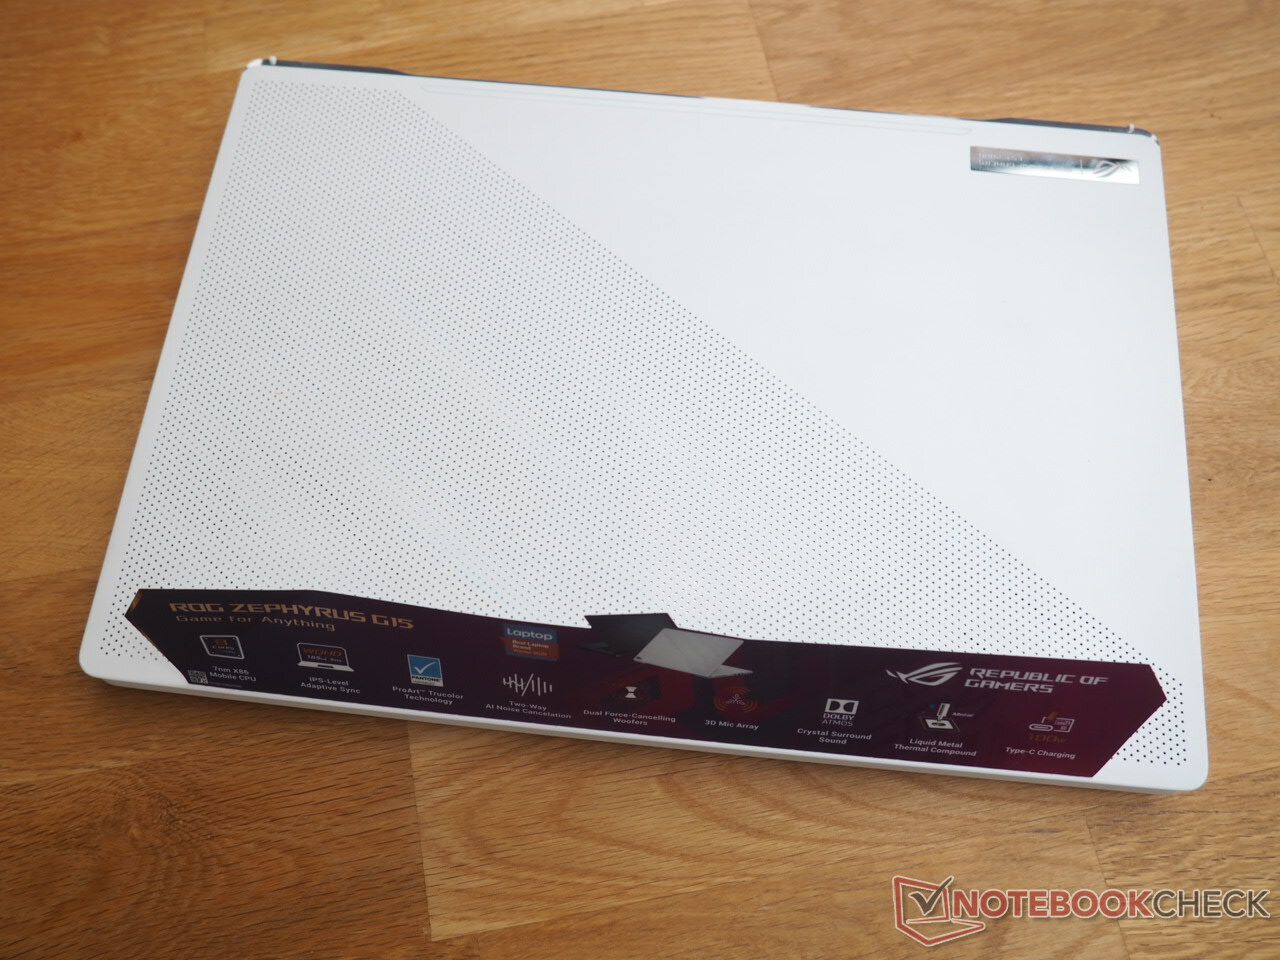
Andra säljargument är att den har förvånansvärt rikt ljud, lång batteritid och en tjusig design. Den vita utgåvan har ett utseende som på ett trevligt sätt skiljer sig från konkurrenterna.
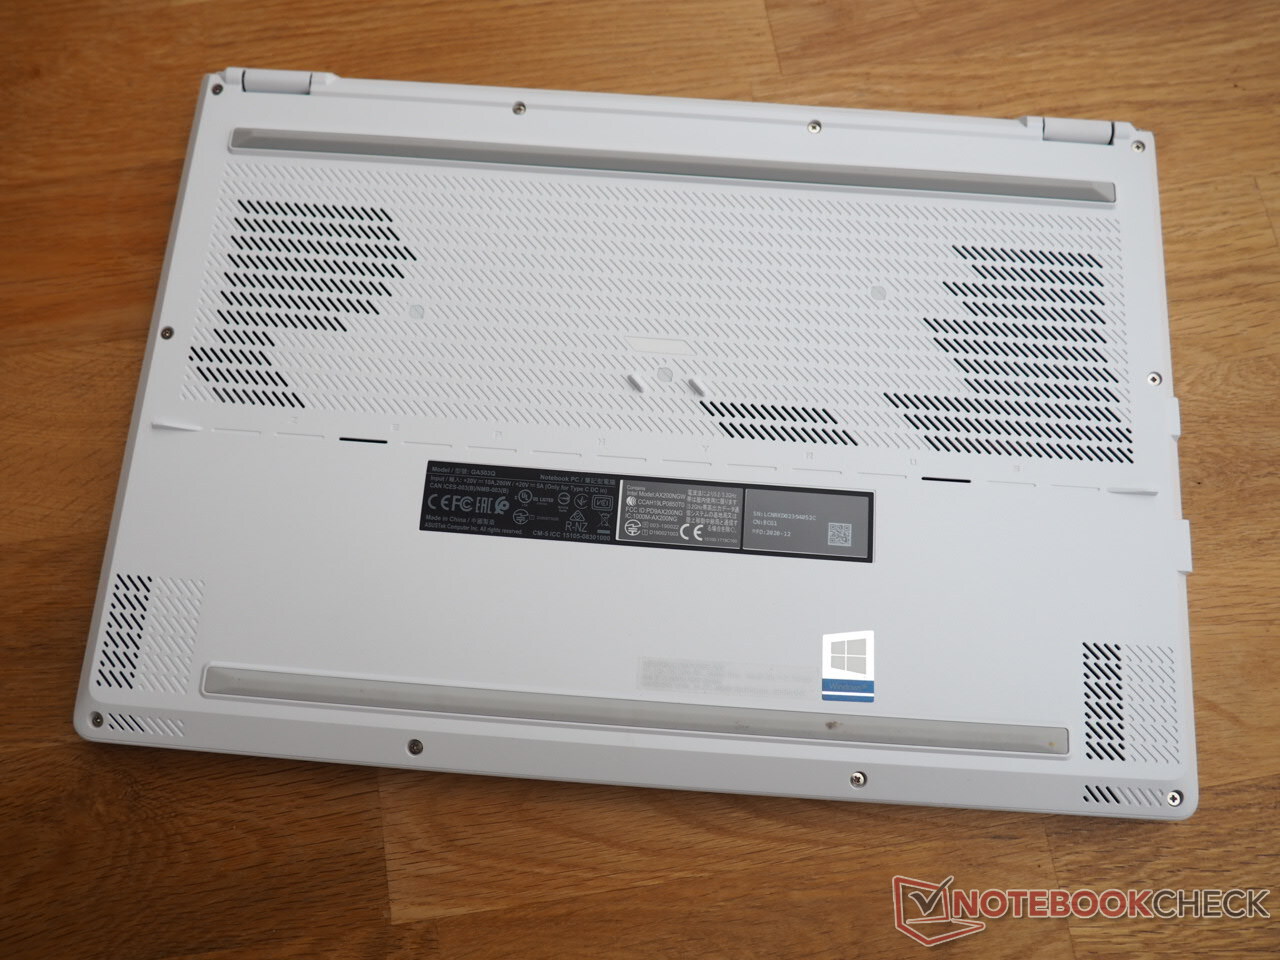
Vi gillade däremot inte tangentbordet samt att den lät så mycket i 3D-läge. Faktum att Asus har utelämnat webbkameran och löder fast delar av datorns RAM på moderkortet är också irriterande.
Asus ROG Zephyrus G15 GA503Q
- 01/31/2021 v7 (old)
Florian Glaser
Price comparison