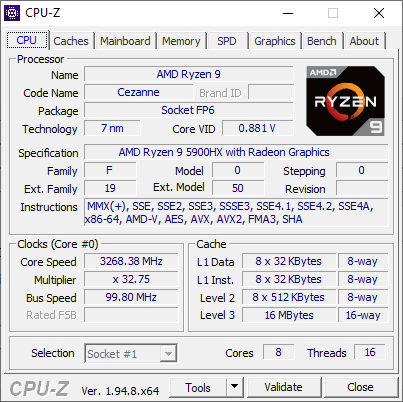
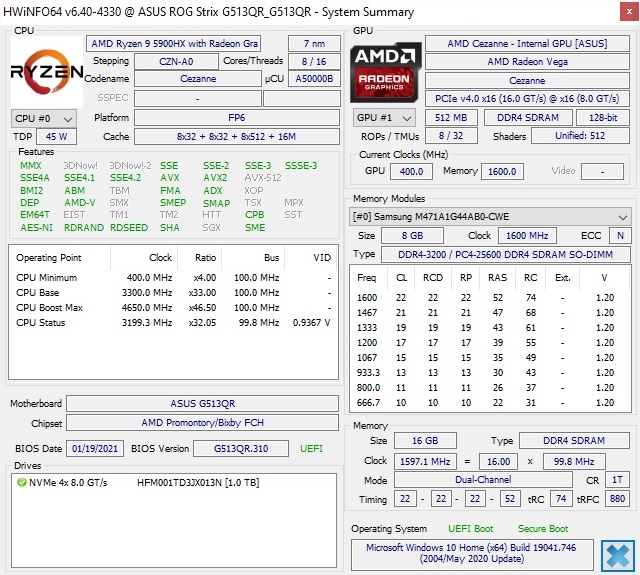
Test: Asus ROG Strix G15 G513QR - AMD och Nvidia i kombination (Sammanfattning)
Testgrupp
Gradering | Datum | Modell | Vikt | Höjd | Storlek | Upplösning | Pris |
|---|---|---|---|---|---|---|---|
| 85 % v7 (old) | 02/2021 | Asus ROG Strix G15 G513QR R9 5900HX, GeForce RTX 3070 Laptop GPU | 2.3 kg | 27.2 mm | 15.60" | 1920x1080 | |
| 84 % v7 (old) | 09/2021 | MSI GS66 Stealth 10UG i7-10870H, GeForce RTX 3070 Laptop GPU | 2.1 kg | 19.8 mm | 15.60" | 1920x1080 | |
| 82.4 % v7 (old) | 02/2021 | Asus TUF Dash F15 FX516PR i7-11370H, GeForce RTX 3070 Laptop GPU | 2 kg | 20 mm | 15.60" | 1920x1080 | |
| 83.8 % v7 (old) | 02/2021 | Asus ROG Zephyrus G15 GA503Q R9 5900HS, GeForce RTX 3080 Laptop GPU | 2 kg | 20 mm | 15.60" | 2560x1440 | |
| 86.9 % v7 (old) | Razer Blade 15 RTX 2070 Super Max-Q i7-10875H, GeForce RTX 2070 Super Max-Q | 2.1 kg | 17.8 mm | 15.60" | 1920x1080 | ||
| 83.4 % v7 (old) | 02/2021 | Asus ROG Strix G15 G512LW i7-10750H, GeForce RTX 2070 Mobile | 2.3 kg | 25.8 mm | 15.60" | 1920x1080 |
| Networking | |
| iperf3 transmit AX12 | |
| Razer Blade 15 RTX 2070 Super Max-Q | |
| Asus ROG Strix G15 G513QR | |
| Genomsnitt Intel Wi-Fi 6 AX200 (447 - 1645, n=127) | |
| MSI GS66 Stealth 10UG | |
| Asus ROG Strix G15 G512LW | |
| iperf3 receive AX12 | |
| Razer Blade 15 RTX 2070 Super Max-Q | |
| Asus ROG Strix G15 G513QR | |
| MSI GS66 Stealth 10UG | |
| Genomsnitt Intel Wi-Fi 6 AX200 (523 - 1684, n=128) | |
| Asus ROG Strix G15 G512LW | |
| |||||||||||||||||||||||||
Distribution av ljusstyrkan: 86 %
Mitt på batteriet: 308 cd/m²
Kontrast: 1339:1 (Svärta: 0.23 cd/m²)
ΔE ColorChecker Calman: 3.28 | ∀{0.5-29.43 Ø4.72}
calibrated: 0.83
ΔE Greyscale Calman: 5 | ∀{0.09-98 Ø4.97}
90% sRGB (Argyll 1.6.3 3D)
68% AdobeRGB 1998 (Argyll 1.6.3 3D)
68.2% AdobeRGB 1998 (Argyll 3D)
94.3% sRGB (Argyll 3D)
67.7% Display P3 (Argyll 3D)
Gamma: 2.057
CCT: 7393 K
| Asus ROG Strix G15 G513QR LQ156M1JW25, IPS, 1920x1080, 15.6" | MSI GS66 Stealth 10UG AU Optronics B156HAN12.0, IPS, 1920x1080, 15.6" | Asus TUF Dash F15 FX516PR LQ156M1JW26 (SHP1532), IPS, 1920x1080, 15.6" | Asus ROG Zephyrus G15 GA503Q CMN N156KME-GNA (CMN152A), IPS-Level, 2560x1440, 15.6" | Razer Blade 15 RTX 2070 Super Max-Q AU Optronics B156HAN12.0, IPS, 1920x1080, 15.6" | Asus ROG Strix G15 G512LW Sharp LQ156M1JW09, IPS, 1920x1080, 15.6" | |
|---|---|---|---|---|---|---|
| Display | 2% | 1% | 25% | 4% | 1% | |
| Display P3 Coverage (%) | 67.7 | 67.7 0% | 66.9 -1% | 97.3 44% | 69.4 3% | 67.8 0% |
| sRGB Coverage (%) | 94.3 | 98.4 4% | 98.1 4% | 99.9 6% | 98.8 5% | 98.3 4% |
| AdobeRGB 1998 Coverage (%) | 68.2 | 69.1 1% | 67.9 0% | 86.2 26% | 70.5 3% | 68.5 0% |
| Response Times | -51% | -28% | -15% | 37% | -54% | |
| Response Time Grey 50% / Grey 80% * (ms) | 8.2 ? | 14.4 ? -76% | 12 ? -46% | 8.8 ? -7% | 3.2 ? 61% | 16 ? -95% |
| Response Time Black / White * (ms) | 9.2 ? | 11.6 ? -26% | 10 ? -9% | 11.2 ? -22% | 8 ? 13% | 10.4 ? -13% |
| PWM Frequency (Hz) | 23580 ? | 23580 ? | ||||
| Screen | -5% | 5% | -19% | -9% | -11% | |
| Brightness middle (cd/m²) | 308 | 259.5 -16% | 286 -7% | 327 6% | 345.4 12% | 300.9 -2% |
| Brightness (cd/m²) | 288 | 264 -8% | 275 -5% | 309 7% | 342 19% | 289 0% |
| Brightness Distribution (%) | 86 | 90 5% | 91 6% | 89 3% | 90 5% | 92 7% |
| Black Level * (cd/m²) | 0.23 | 0.25 -9% | 0.25 -9% | 0.33 -43% | 0.34 -48% | 0.31 -35% |
| Contrast (:1) | 1339 | 1038 -22% | 1144 -15% | 991 -26% | 1016 -24% | 971 -27% |
| Colorchecker dE 2000 * | 3.28 | 2.52 23% | 2.43 26% | 4.49 -37% | 3.18 3% | 3.54 -8% |
| Colorchecker dE 2000 max. * | 8.51 | 5.55 35% | 6.33 26% | 8.42 1% | 6.57 23% | 9.82 -15% |
| Colorchecker dE 2000 calibrated * | 0.83 | 1.93 -133% | 0.83 -0% | 2.27 -173% | 1.77 -113% | 1 -20% |
| Greyscale dE 2000 * | 5 | 1.7 66% | 3.5 30% | 4.2 16% | 3.8 24% | 5.9 -18% |
| Gamma | 2.057 107% | 2.04 108% | 2.32 95% | 2.173 101% | 2.15 102% | 2.37 93% |
| CCT | 7393 88% | 6414 101% | 7145 91% | 7014 93% | 7109 91% | 7456 87% |
| Color Space (Percent of AdobeRGB 1998) (%) | 68 | 63.3 -7% | 68 0% | 86 26% | 64.3 -5% | 63.3 -7% |
| Color Space (Percent of sRGB) (%) | 90 | 98.8 10% | 91 1% | 99 10% | 99 10% | 98.3 9% |
| Totalt genomsnitt (program/inställningar) | -18% /
-10% | -7% /
0% | -3% /
-10% | 11% /
-1% | -21% /
-14% |
* ... mindre är bättre
Visa svarstider
| ↔ Svarstid svart till vitt | ||
|---|---|---|
| 9.2 ms ... stiga ↗ och falla ↘ kombinerat | ↗ 4.4 ms stiga | 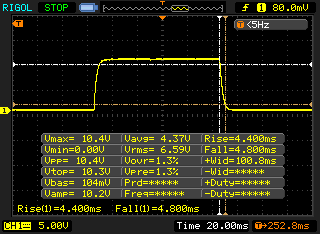 |
| ↘ 4.8 ms hösten | ||
| Skärmen visar snabba svarsfrekvenser i våra tester och bör passa för spel. I jämförelse sträcker sig alla testade enheter från 0.1 (minst) till 240 (maximalt) ms. » 26 % av alla enheter är bättre. Det betyder att den uppmätta svarstiden är bättre än genomsnittet av alla testade enheter (19.8 ms). | ||
| ↔ Svarstid 50 % grått till 80 % grått | ||
| 8.2 ms ... stiga ↗ och falla ↘ kombinerat | ↗ 2.6 ms stiga | 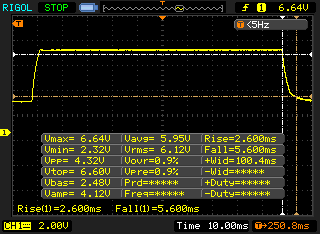 |
| ↘ 5.6 ms hösten | ||
| Skärmen visar snabba svarsfrekvenser i våra tester och bör passa för spel. I jämförelse sträcker sig alla testade enheter från 0.165 (minst) till 636 (maximalt) ms. » 22 % av alla enheter är bättre. Det betyder att den uppmätta svarstiden är bättre än genomsnittet av alla testade enheter (31 ms). | ||
Skärmflimmer / PWM (Puls-Width Modulation)
| Skärmflimmer / PWM upptäcktes inte | 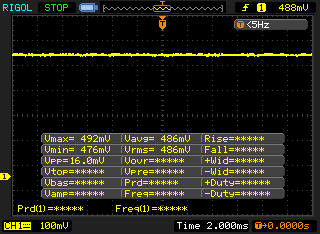 | ||
Som jämförelse: 52 % av alla testade enheter använder inte PWM för att dämpa skärmen. Om PWM upptäcktes mättes ett medelvärde av 7769 (minst: 5 - maximum: 343500) Hz. | |||
| Cinebench R15 | |
| CPU Single 64Bit | |
| Genomsnitt av klass Gaming (188.8 - 343, n=109, senaste 2 åren) | |
| Asus ROG Strix G15 G513QR | |
| Genomsnitt AMD Ryzen 9 5900HX (197 - 243, n=25) | |
| Asus TUF Dash F15 FX516PR | |
| Asus ROG Zephyrus G15 GA503Q | |
| Asus ROG Strix G15 G512LW | |
| Razer Blade 15 RTX 2070 Super Max-Q | |
| MSI GS66 Stealth 10UG | |
| CPU Multi 64Bit | |
| Genomsnitt av klass Gaming (1578 - 6271, n=108, senaste 2 åren) | |
| Asus ROG Strix G15 G513QR | |
| Genomsnitt AMD Ryzen 9 5900HX (1076 - 2267, n=29) | |
| Asus ROG Zephyrus G15 GA503Q | |
| MSI GS66 Stealth 10UG | |
| Razer Blade 15 RTX 2070 Super Max-Q | |
| Asus ROG Strix G15 G512LW | |
| Asus TUF Dash F15 FX516PR | |
| Blender - v2.79 BMW27 CPU | |
| Asus TUF Dash F15 FX516PR | |
| Razer Blade 15 RTX 2070 Super Max-Q | |
| Asus ROG Strix G15 G512LW | |
| MSI GS66 Stealth 10UG | |
| Genomsnitt AMD Ryzen 9 5900HX (219 - 442, n=29) | |
| Asus ROG Zephyrus G15 GA503Q | |
| Asus ROG Strix G15 G513QR | |
| Genomsnitt av klass Gaming (80 - 330, n=107, senaste 2 åren) | |
| Cinebench R20 | |
| CPU (Single Core) | |
| Genomsnitt av klass Gaming (442 - 895, n=109, senaste 2 åren) | |
| Asus ROG Strix G15 G513QR | |
| Genomsnitt AMD Ryzen 9 5900HX (471 - 584, n=29) | |
| Asus ROG Zephyrus G15 GA503Q | |
| Asus TUF Dash F15 FX516PR | |
| Razer Blade 15 RTX 2070 Super Max-Q | |
| Asus ROG Strix G15 G512LW | |
| MSI GS66 Stealth 10UG | |
| CPU (Multi Core) | |
| Genomsnitt av klass Gaming (4029 - 16108, n=109, senaste 2 åren) | |
| Asus ROG Strix G15 G513QR | |
| Genomsnitt AMD Ryzen 9 5900HX (2242 - 5476, n=30) | |
| Asus ROG Zephyrus G15 GA503Q | |
| MSI GS66 Stealth 10UG | |
| Asus ROG Strix G15 G512LW | |
| Razer Blade 15 RTX 2070 Super Max-Q | |
| Asus TUF Dash F15 FX516PR | |
| Geekbench 5.5 | |
| Single-Core | |
| Genomsnitt av klass Gaming (986 - 2474, n=108, senaste 2 åren) | |
| Genomsnitt AMD Ryzen 9 5900HX (1271 - 1574, n=27) | |
| Asus ROG Strix G15 G513QR | |
| Asus ROG Zephyrus G15 GA503Q | |
| Asus TUF Dash F15 FX516PR | |
| Asus ROG Strix G15 G512LW | |
| Razer Blade 15 RTX 2070 Super Max-Q | |
| MSI GS66 Stealth 10UG | |
| Multi-Core | |
| Genomsnitt av klass Gaming (6460 - 27010, n=108, senaste 2 åren) | |
| Genomsnitt AMD Ryzen 9 5900HX (5057 - 9294, n=27) | |
| Asus ROG Zephyrus G15 GA503Q | |
| MSI GS66 Stealth 10UG | |
| Asus ROG Strix G15 G513QR | |
| Razer Blade 15 RTX 2070 Super Max-Q | |
| Asus ROG Strix G15 G512LW | |
| Asus TUF Dash F15 FX516PR | |
| HWBOT x265 Benchmark v2.2 - 4k Preset | |
| Genomsnitt av klass Gaming (11.5 - 44.3, n=108, senaste 2 åren) | |
| Genomsnitt AMD Ryzen 9 5900HX (8.26 - 17.1, n=29) | |
| Asus ROG Strix G15 G513QR | |
| Asus ROG Zephyrus G15 GA503Q | |
| MSI GS66 Stealth 10UG | |
| Asus ROG Strix G15 G512LW | |
| Razer Blade 15 RTX 2070 Super Max-Q | |
| Asus TUF Dash F15 FX516PR | |
| LibreOffice - 20 Documents To PDF | |
| Asus TUF Dash F15 FX516PR | |
| Asus ROG Zephyrus G15 GA503Q | |
| Genomsnitt AMD Ryzen 9 5900HX (44.1 - 87.4, n=29) | |
| Asus ROG Strix G15 G513QR | |
| Genomsnitt av klass Gaming (19 - 88.8, n=108, senaste 2 åren) | |
| MSI GS66 Stealth 10UG | |
| Asus ROG Strix G15 G512LW | |
| Razer Blade 15 RTX 2070 Super Max-Q | |
| R Benchmark 2.5 - Overall mean | |
| Asus ROG Strix G15 G512LW | |
| MSI GS66 Stealth 10UG | |
| Razer Blade 15 RTX 2070 Super Max-Q | |
| Asus TUF Dash F15 FX516PR | |
| Asus ROG Zephyrus G15 GA503Q | |
| Asus ROG Strix G15 G513QR | |
| Genomsnitt AMD Ryzen 9 5900HX (0.48 - 0.599, n=29) | |
| Genomsnitt av klass Gaming (0.3439 - 0.759, n=109, senaste 2 åren) | |
* ... mindre är bättre
| PCMark 10 - Score | |
| Genomsnitt av klass Gaming (5828 - 11574, n=95, senaste 2 åren) | |
| Asus ROG Strix G15 G513QR | |
| Asus ROG Zephyrus G15 GA503Q | |
| Razer Blade 15 RTX 2070 Super Max-Q | |
| MSI GS66 Stealth 10UG | |
| Asus TUF Dash F15 FX516PR | |
| Asus ROG Strix G15 G512LW | |
| PCMark 8 | |
| Home Score Accelerated v2 | |
| Asus ROG Strix G15 G513QR | |
| Razer Blade 15 RTX 2070 Super Max-Q | |
| Genomsnitt av klass Gaming (n=1senaste 2 åren) | |
| MSI GS66 Stealth 10UG | |
| Asus ROG Strix G15 G512LW | |
| Work Score Accelerated v2 | |
| Razer Blade 15 RTX 2070 Super Max-Q | |
| Asus ROG Strix G15 G513QR | |
| MSI GS66 Stealth 10UG | |
| Asus ROG Strix G15 G512LW | |
| Genomsnitt av klass Gaming (n=1senaste 2 åren) | |
| PCMark 8 Home Score Accelerated v2 | 6277 poäng | |
| PCMark 8 Creative Score Accelerated v2 | 10483 poäng | |
| PCMark 8 Work Score Accelerated v2 | 6808 poäng | |
| PCMark 10 Score | 6922 poäng | |
Hjälp | ||
| DPC Latencies / LatencyMon - interrupt to process latency (max), Web, Youtube, Prime95 | |
| Asus ROG Strix G15 G512LW | |
| Razer Blade 15 RTX 2070 Super Max-Q | |
| Asus TUF Dash F15 FX516PR | |
| MSI GS66 Stealth 10UG | |
| Asus ROG Strix G15 G513QR | |
| Asus ROG Zephyrus G15 GA503Q | |
* ... mindre är bättre
| Asus ROG Strix G15 G513QR SK Hynix HFM001TD3JX013N | MSI GS66 Stealth 10UG WDC PC SN730 SDBPNTY-1T00 | Asus TUF Dash F15 FX516PR SK Hynix HFM001TD3JX013N | Asus ROG Zephyrus G15 GA503Q SK Hynix HFM001TD3JX013N | Razer Blade 15 RTX 2070 Super Max-Q Samsung SSD PM981a MZVLB512HBJQ | Asus ROG Strix G15 G512LW Toshiba XG5-P KXG50PNV2T04 | |
|---|---|---|---|---|---|---|
| AS SSD | -3% | -29% | 1% | -17% | -42% | |
| Seq Read (MB/s) | 2881 | 2198 -24% | 2671 -7% | 2950 2% | 1957 -32% | 1933 -33% |
| Seq Write (MB/s) | 1570 | 2596 65% | 1501 -4% | 1600 2% | 2092 33% | 787 -50% |
| 4K Read (MB/s) | 52.4 | 43.81 -16% | 39.65 -24% | 53.6 2% | 50.2 -4% | 26.4 -50% |
| 4K Write (MB/s) | 124 | 115.5 -7% | 69 -44% | 126.8 2% | 96.5 -22% | 109.8 -11% |
| 4K-64 Read (MB/s) | 1334 | 1692 27% | 1209 -9% | 1429 7% | 1594 19% | 848 -36% |
| 4K-64 Write (MB/s) | 2189 | 2162 -1% | 1650 -25% | 2177 -1% | 2005 -8% | 923 -58% |
| Access Time Read * (ms) | 0.055 | 0.056 -2% | 0.093 -69% | 0.064 -16% | 0.057 -4% | 0.044 20% |
| Access Time Write * (ms) | 0.03 | 0.098 -227% | 0.055 -83% | 0.029 3% | 0.112 -273% | 0.158 -427% |
| Score Read (Points) | 1675 | 1956 17% | 1516 -9% | 1778 6% | 1840 10% | 1067 -36% |
| Score Write (Points) | 2470 | 2537 3% | 1869 -24% | 2464 0% | 2310 -6% | 1112 -55% |
| Score Total (Points) | 4943 | 5513 12% | 4105 -17% | 5090 3% | 5103 3% | 2669 -46% |
| Copy ISO MB/s (MB/s) | 1277 | 2236 75% | 1793 40% | 3210 151% | ||
| Copy Program MB/s (MB/s) | 575 | 690 20% | 573 0% | 728 27% | ||
| Copy Game MB/s (MB/s) | 1272 | 1546 22% | 1418 11% | 1499 18% |
* ... mindre är bättre

DiskSpd Read Loop, Queue Depth 8
| 3DMark 11 - 1280x720 Performance GPU | |
| Genomsnitt av klass Gaming (21841 - 80022, n=106, senaste 2 åren) | |
| Asus ROG Strix G15 G513QR | |
| Genomsnitt NVIDIA GeForce RTX 3070 Laptop GPU (12535 - 38275, n=54) | |
| MSI GS66 Stealth 10UG | |
| Razer Blade 15 RTX 2070 Super Max-Q | |
| Asus ROG Strix G15 G512LW | |
| 3DMark | |
| 1280x720 Cloud Gate Standard Graphics | |
| Genomsnitt av klass Gaming (86886 - 223650, n=62, senaste 2 åren) | |
| MSI GS66 Stealth 10UG | |
| Razer Blade 15 RTX 2070 Super Max-Q | |
| Asus ROG Strix G15 G512LW | |
| Genomsnitt NVIDIA GeForce RTX 3070 Laptop GPU (45531 - 179716, n=33) | |
| Asus TUF Dash F15 FX516PR | |
| Asus ROG Strix G15 G513QR | |
| Asus ROG Zephyrus G15 GA503Q | |
| 1920x1080 Fire Strike Graphics | |
| Genomsnitt av klass Gaming (12242 - 62849, n=118, senaste 2 åren) | |
| Asus ROG Strix G15 G513QR | |
| Genomsnitt NVIDIA GeForce RTX 3070 Laptop GPU (7178 - 29128, n=52) | |
| MSI GS66 Stealth 10UG | |
| Asus ROG Zephyrus G15 GA503Q | |
| Asus ROG Strix G15 G512LW | |
| Razer Blade 15 RTX 2070 Super Max-Q | |
| Asus TUF Dash F15 FX516PR | |
| 2560x1440 Time Spy Graphics | |
| Genomsnitt av klass Gaming (5012 - 26212, n=117, senaste 2 åren) | |
| Asus ROG Strix G15 G513QR | |
| Asus ROG Zephyrus G15 GA503Q | |
| Genomsnitt NVIDIA GeForce RTX 3070 Laptop GPU (2644 - 11019, n=53) | |
| MSI GS66 Stealth 10UG | |
| Razer Blade 15 RTX 2070 Super Max-Q | |
| Asus TUF Dash F15 FX516PR | |
| Asus ROG Strix G15 G512LW | |
| 3DMark 11 Performance | 25508 poäng | |
| 3DMark Cloud Gate Standard Score | 47194 poäng | |
| 3DMark Fire Strike Score | 22758 poäng | |
| 3DMark Time Spy Score | 9933 poäng | |
Hjälp | ||
| låg | med. | hög | ultra | |
|---|---|---|---|---|
| GTA V (2015) | 171 | 158 | 130 | 78.6 |
| The Witcher 3 (2015) | 267 | 179.9 | 157 | 92.9 |
| Dota 2 Reborn (2015) | 136 | 129 | 112 | 107 |
| Final Fantasy XV Benchmark (2018) | 145 | 115 | 88.9 | |
| X-Plane 11.11 (2018) | 97.5 | 84 | 70.1 | |
| Far Cry 5 (2018) | 124 | 101 | 98 | 92 |
| Strange Brigade (2018) | 295 | 182 | 166 | 158 |
Ljudnivå
| Låg belastning |
| 25 / 31 / 33 dB(A) |
| Hög belastning |
| 45 / 50 dB(A) |
 | ||
30 dB tyst 40 dB(A) hörbar 50 dB(A) högt ljud |
||
min: | ||
(-) Den maximala temperaturen på ovansidan är 49 °C / 120 F, jämfört med genomsnittet av 40.4 °C / 105 F , allt från 21.2 till 68.8 °C för klassen Gaming.
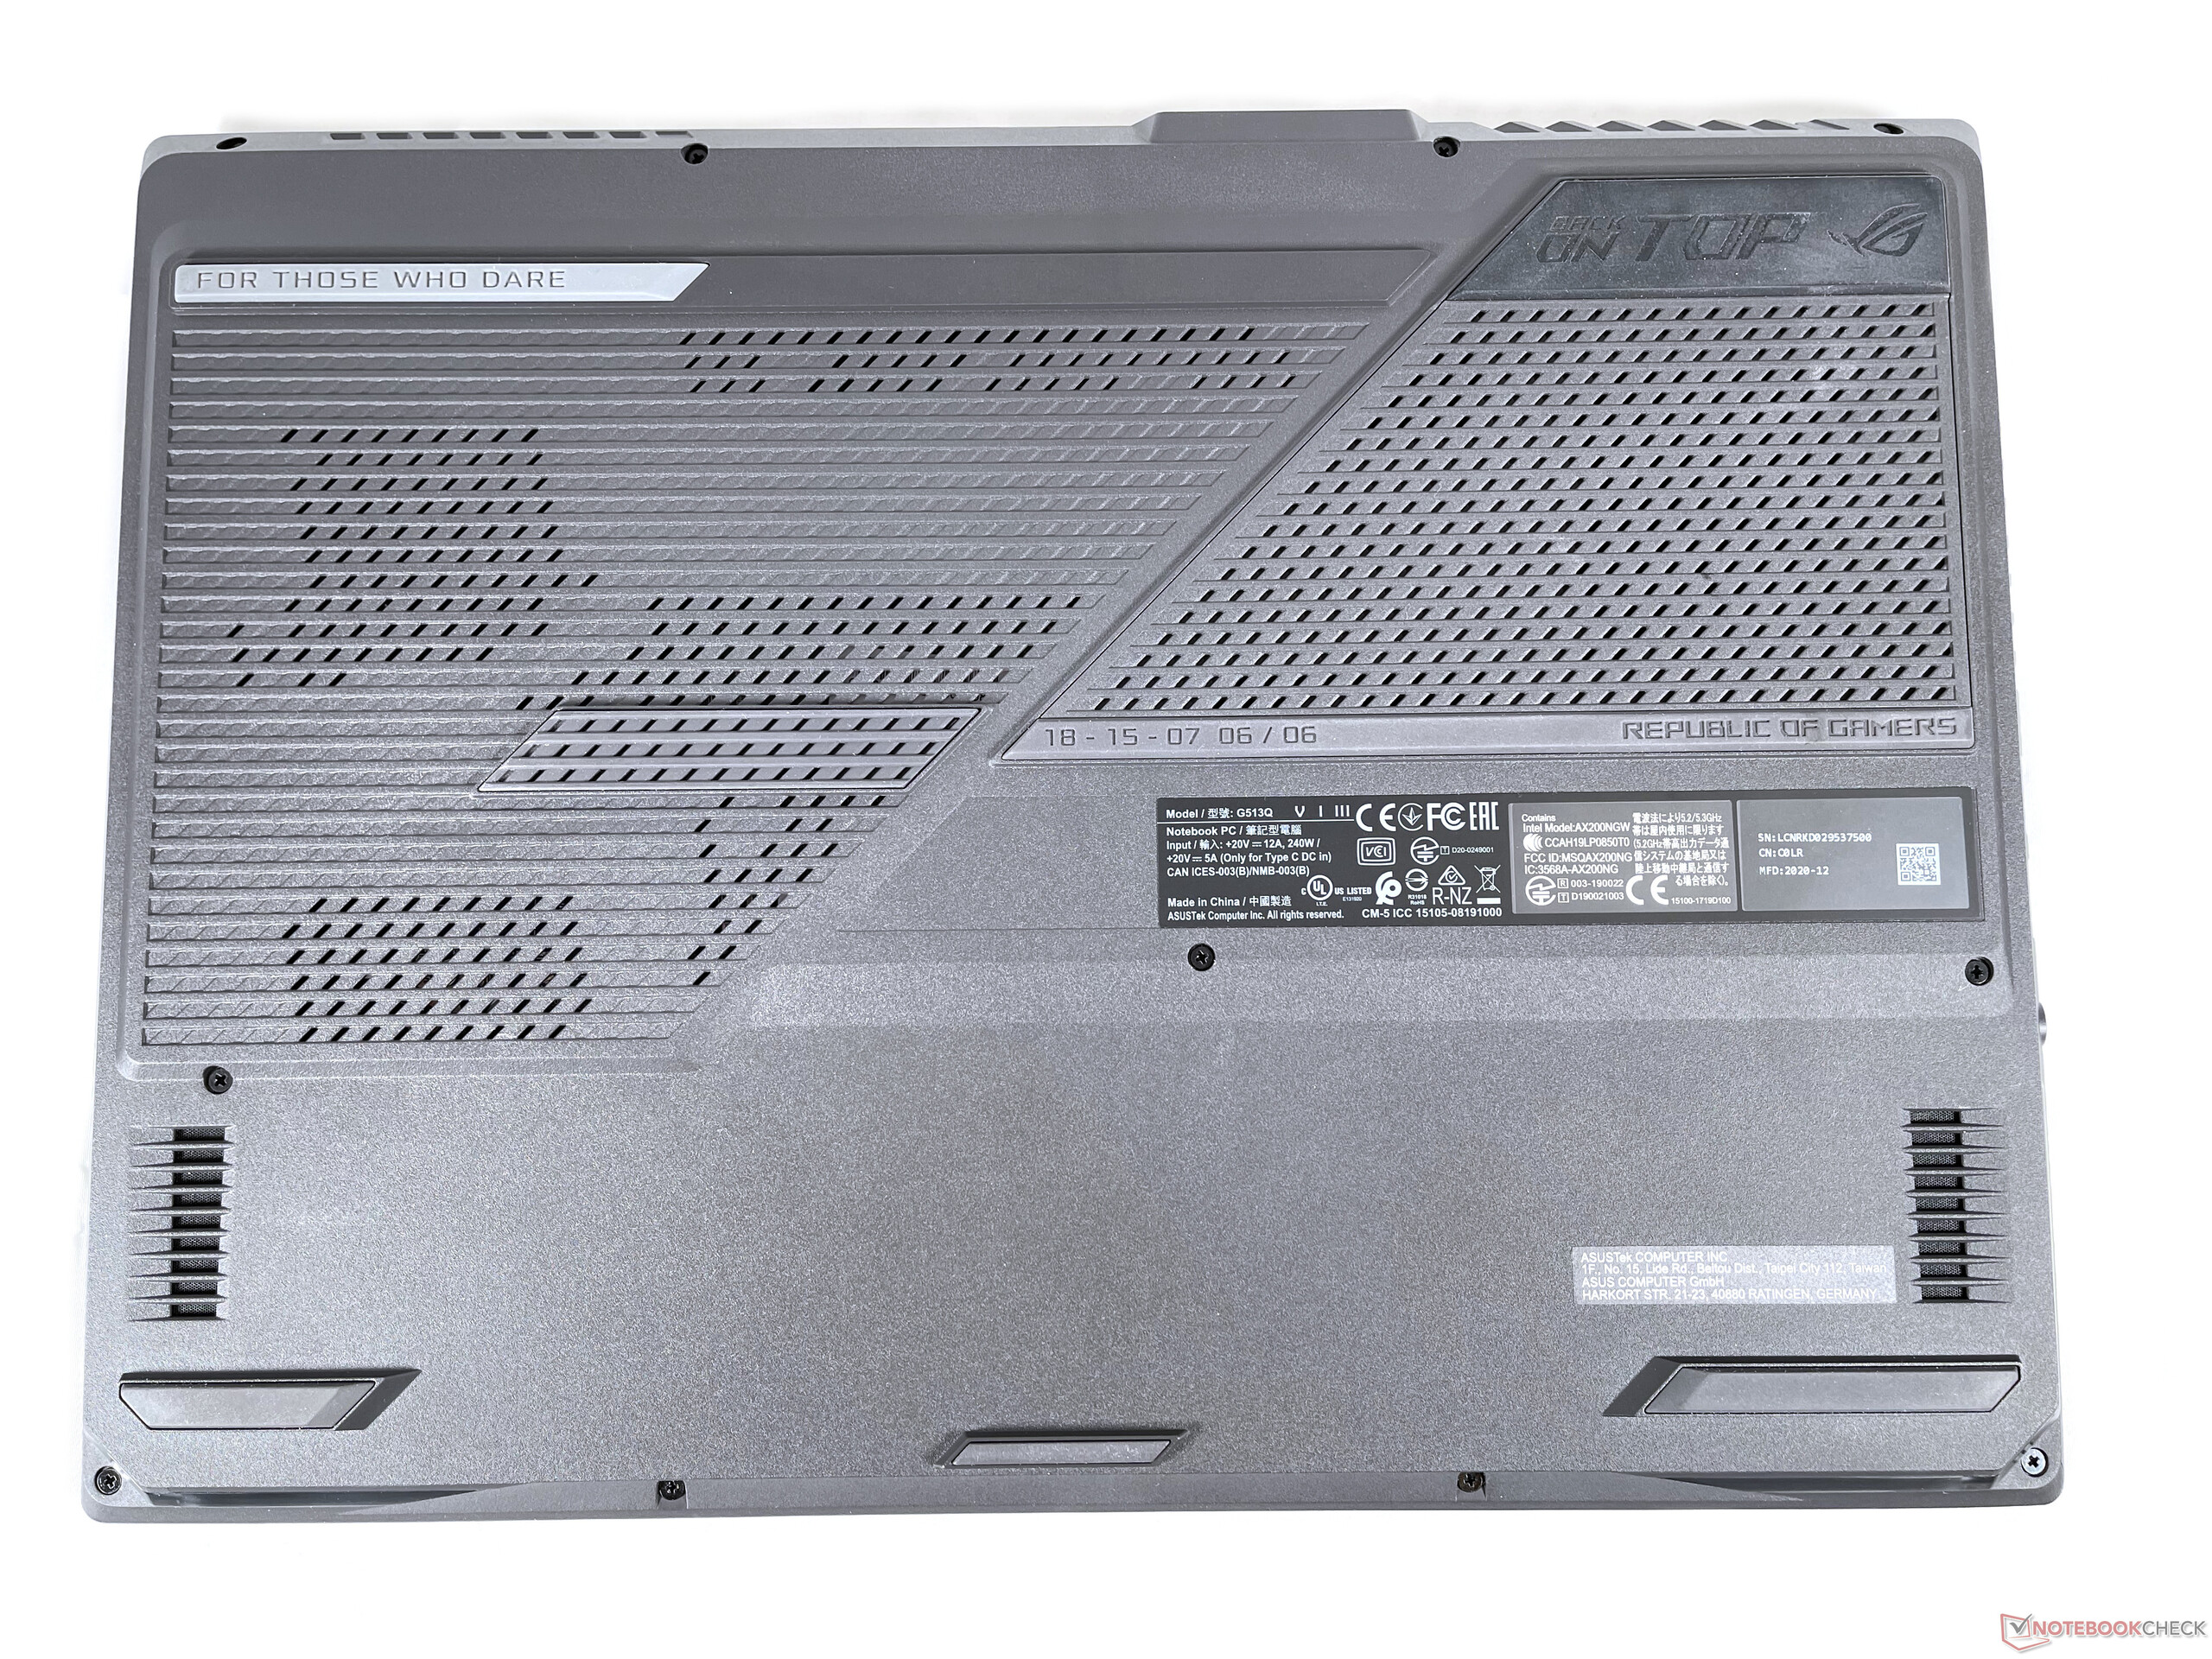
(-) Botten värms upp till maximalt 48 °C / 118 F, jämfört med genomsnittet av 43.2 °C / 110 F
(+) Vid tomgångsbruk är medeltemperaturen för ovansidan 28.1 °C / 83 F, jämfört med enhetsgenomsnittet på 33.9 °C / ### class_avg_f### F.
(±) När du spelar The Witcher 3 är medeltemperaturen för ovansidan 36.8 °C / 98 F, jämfört med enhetsgenomsnittet på 33.9 °C / ## #class_avg_f### F.
(+) Handledsstöden och pekplattan är kallare än hudtemperaturen med maximalt 30 °C / 86 F och är därför svala att ta på.
(±) Medeltemperaturen för handledsstödsområdet på liknande enheter var 28.8 °C / 83.8 F (-1.2 °C / -2.2 F).
Asus ROG Strix G15 G513QR ljudanalys
(±) | högtalarljudstyrkan är genomsnittlig men bra (78 dB)
Bas 100 - 315 Hz
(±) | reducerad bas - i genomsnitt 5% lägre än medianen
(±) | linjäriteten för basen är genomsnittlig (7.3% delta till föregående frekvens)
Mellan 400 - 2000 Hz
(+) | balanserad mellan - endast 3% från medianen
(+) | mids är linjära (3.4% delta till föregående frekvens)
Högsta 2 - 16 kHz
(+) | balanserade toppar - endast 1.7% från medianen
(+) | toppar är linjära (6.3% delta till föregående frekvens)
Totalt 100 - 16 000 Hz
(+) | det totala ljudet är linjärt (8.3% skillnad mot median)
Jämfört med samma klass
» 1% av alla testade enheter i den här klassen var bättre, 1% liknande, 97% sämre
» Den bästa hade ett delta på 6%, genomsnittet var 18%, sämst var 132%
Jämfört med alla testade enheter
» 2% av alla testade enheter var bättre, 1% liknande, 97% sämre
» Den bästa hade ett delta på 4%, genomsnittet var 24%, sämst var 134%
MSI GS66 Stealth 10UG ljudanalys
(±) | högtalarljudstyrkan är genomsnittlig men bra (81 dB)
Bas 100 - 315 Hz
(-) | nästan ingen bas - i genomsnitt 18.9% lägre än medianen
(±) | linjäriteten för basen är genomsnittlig (13.6% delta till föregående frekvens)
Mellan 400 - 2000 Hz
(±) | högre mellan - i genomsnitt 6.1% högre än median
(+) | mids är linjära (5.7% delta till föregående frekvens)
Högsta 2 - 16 kHz
(+) | balanserade toppar - endast 2.4% från medianen
(±) | linjäriteten för toppar är genomsnittlig (8% delta till föregående frekvens)
Totalt 100 - 16 000 Hz
(±) | linjäriteten för det totala ljudet är genomsnittlig (20.3% skillnad mot median)
Jämfört med samma klass
» 72% av alla testade enheter i den här klassen var bättre, 6% liknande, 23% sämre
» Den bästa hade ett delta på 6%, genomsnittet var 18%, sämst var 132%
Jämfört med alla testade enheter
» 53% av alla testade enheter var bättre, 8% liknande, 39% sämre
» Den bästa hade ett delta på 4%, genomsnittet var 24%, sämst var 134%
| Av/Standby | |
| Låg belastning | |
| Hög belastning |
|
Förklaring:
min: | |
| Asus ROG Strix G15 G513QR R9 5900HX, GeForce RTX 3070 Laptop GPU | MSI GS66 Stealth 10UG i7-10870H, GeForce RTX 3070 Laptop GPU | Asus TUF Dash F15 FX516PR i7-11370H, GeForce RTX 3070 Laptop GPU | Asus ROG Zephyrus G15 GA503Q R9 5900HS, GeForce RTX 3080 Laptop GPU | Razer Blade 15 RTX 2070 Super Max-Q i7-10875H, GeForce RTX 2070 Super Max-Q | Asus ROG Strix G15 G512LW i7-10750H, GeForce RTX 2070 Mobile | Genomsnitt av klass Gaming | |
|---|---|---|---|---|---|---|---|
| Power Consumption | -41% | -2% | -11% | -64% | -78% | -61% | |
| Idle Minimum * (Watt) | 4 | 12.9 -223% | 9 -125% | 10 -150% | 14.3 -258% | 16.2 -305% | 13.2 ? -230% |
| Idle Average * (Watt) | 9 | 15.4 -71% | 11 -22% | 12 -33% | 22.3 -148% | 24.1 -168% | 18.9 ? -110% |
| Idle Maximum * (Watt) | 36 | 27.1 25% | 16 56% | 17 53% | 36.9 -2% | 30.8 14% | 24.5 ? 32% |
| Load Average * (Watt) | 130 | 98.2 24% | 107 18% | 108 17% | 118.4 9% | 127.6 2% | 108.8 ? 16% |
| Witcher 3 ultra * (Watt) | 174 | 164.9 5% | 121 30% | 123 29% | 153.7 12% | 187.5 -8% | |
| Load Maximum * (Watt) | 227 | 232.9 -3% | 162 29% | 182 20% | 220.8 3% | 239 -5% | 254 ? -12% |
* ... mindre är bättre
| Asus ROG Strix G15 G513QR R9 5900HX, GeForce RTX 3070 Laptop GPU, 90 Wh | MSI GS66 Stealth 10UG i7-10870H, GeForce RTX 3070 Laptop GPU, 99.9 Wh | Asus TUF Dash F15 FX516PR i7-11370H, GeForce RTX 3070 Laptop GPU, 76 Wh | Asus ROG Zephyrus G15 GA503Q R9 5900HS, GeForce RTX 3080 Laptop GPU, 90 Wh | Razer Blade 15 RTX 2070 Super Max-Q i7-10875H, GeForce RTX 2070 Super Max-Q, 80 Wh | Asus ROG Strix G15 G512LW i7-10750H, GeForce RTX 2070 Mobile, 66 Wh | Genomsnitt av klass Gaming | |
|---|---|---|---|---|---|---|---|
| Batteridrifttid | 13% | 23% | 8% | -15% | -14% | -20% | |
| H.264 (h) | 13.5 | 8.28 ? -39% | |||||
| WiFi v1.3 (h) | 7.4 | 7.1 -4% | 9.1 23% | 9.4 27% | 6.3 -15% | 6.4 -14% | 6.96 ? -6% |
| Load (h) | 1.7 | 2.2 29% | 1.5 -12% | 1.47 ? -14% | |||
| Reader / Idle (h) | 10.8 | 16 | 12.1 | 8.71 ? |
För
Emot
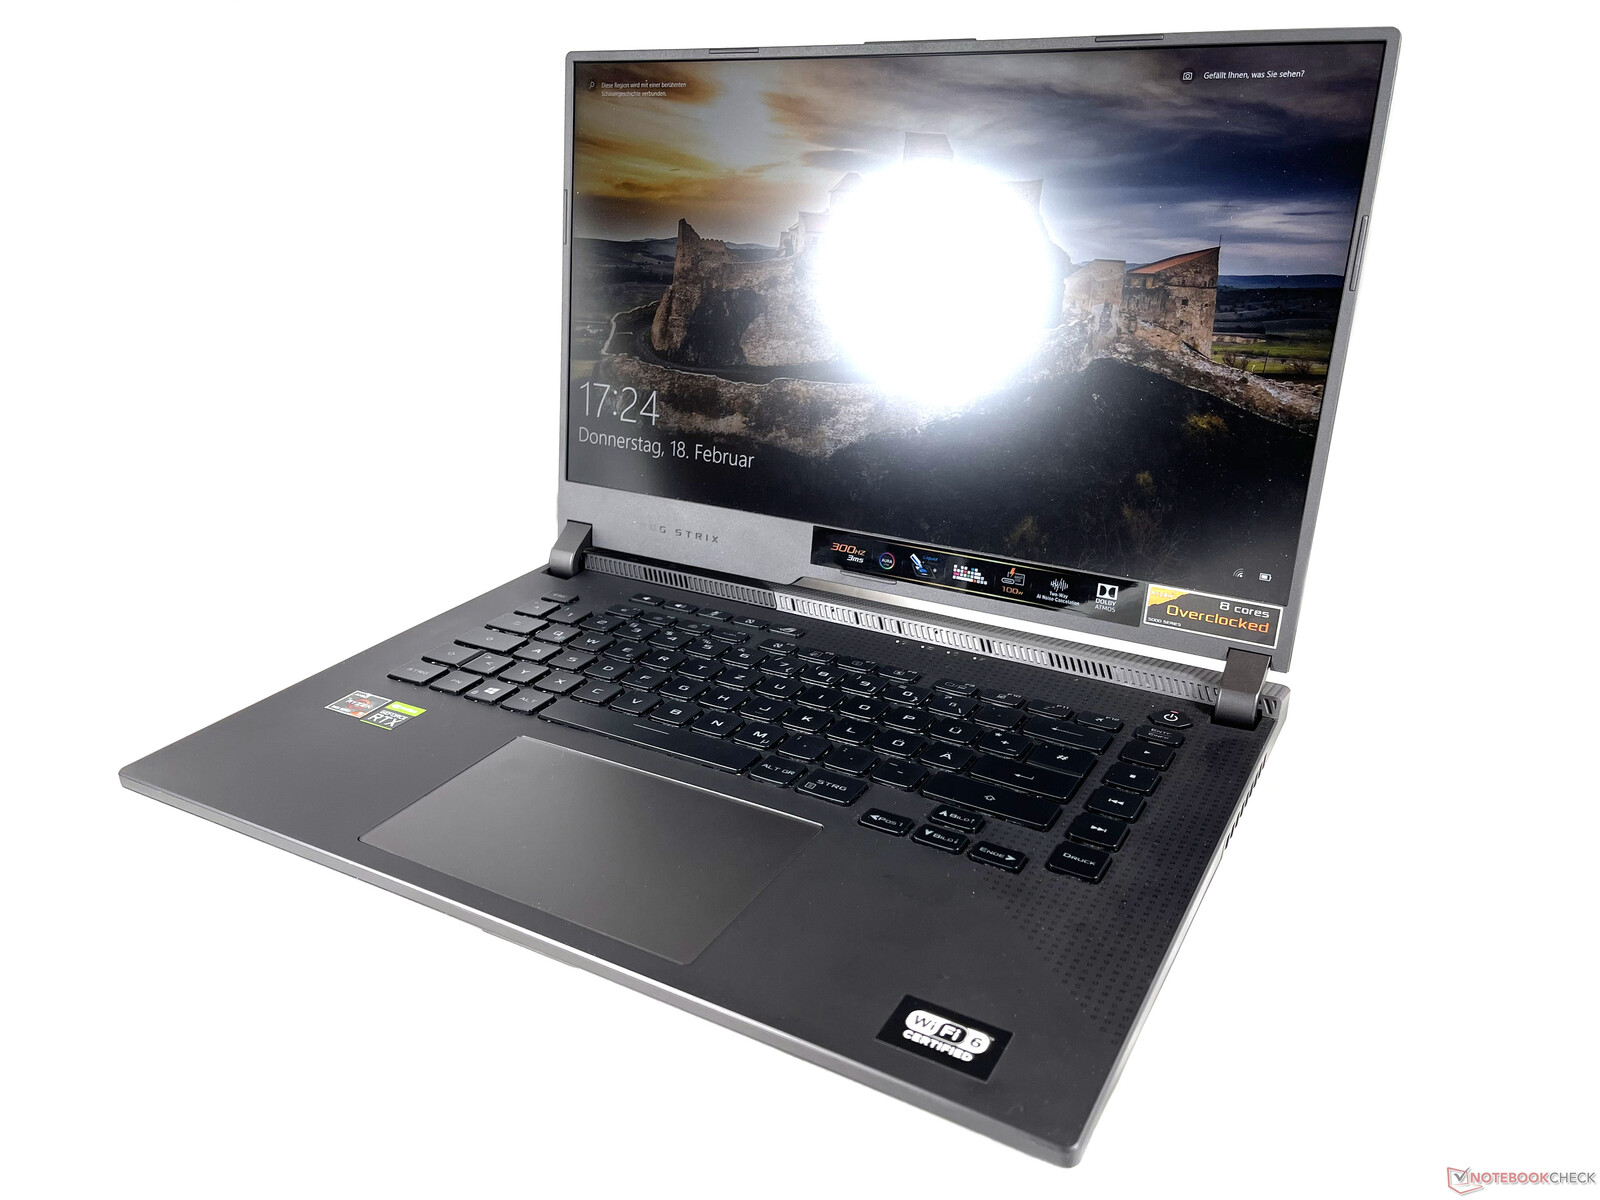
Omdöme - Framgångsrik 15-tumslaptop med hög prestanda
Läs den fullständiga versionen av den här recensionen här.
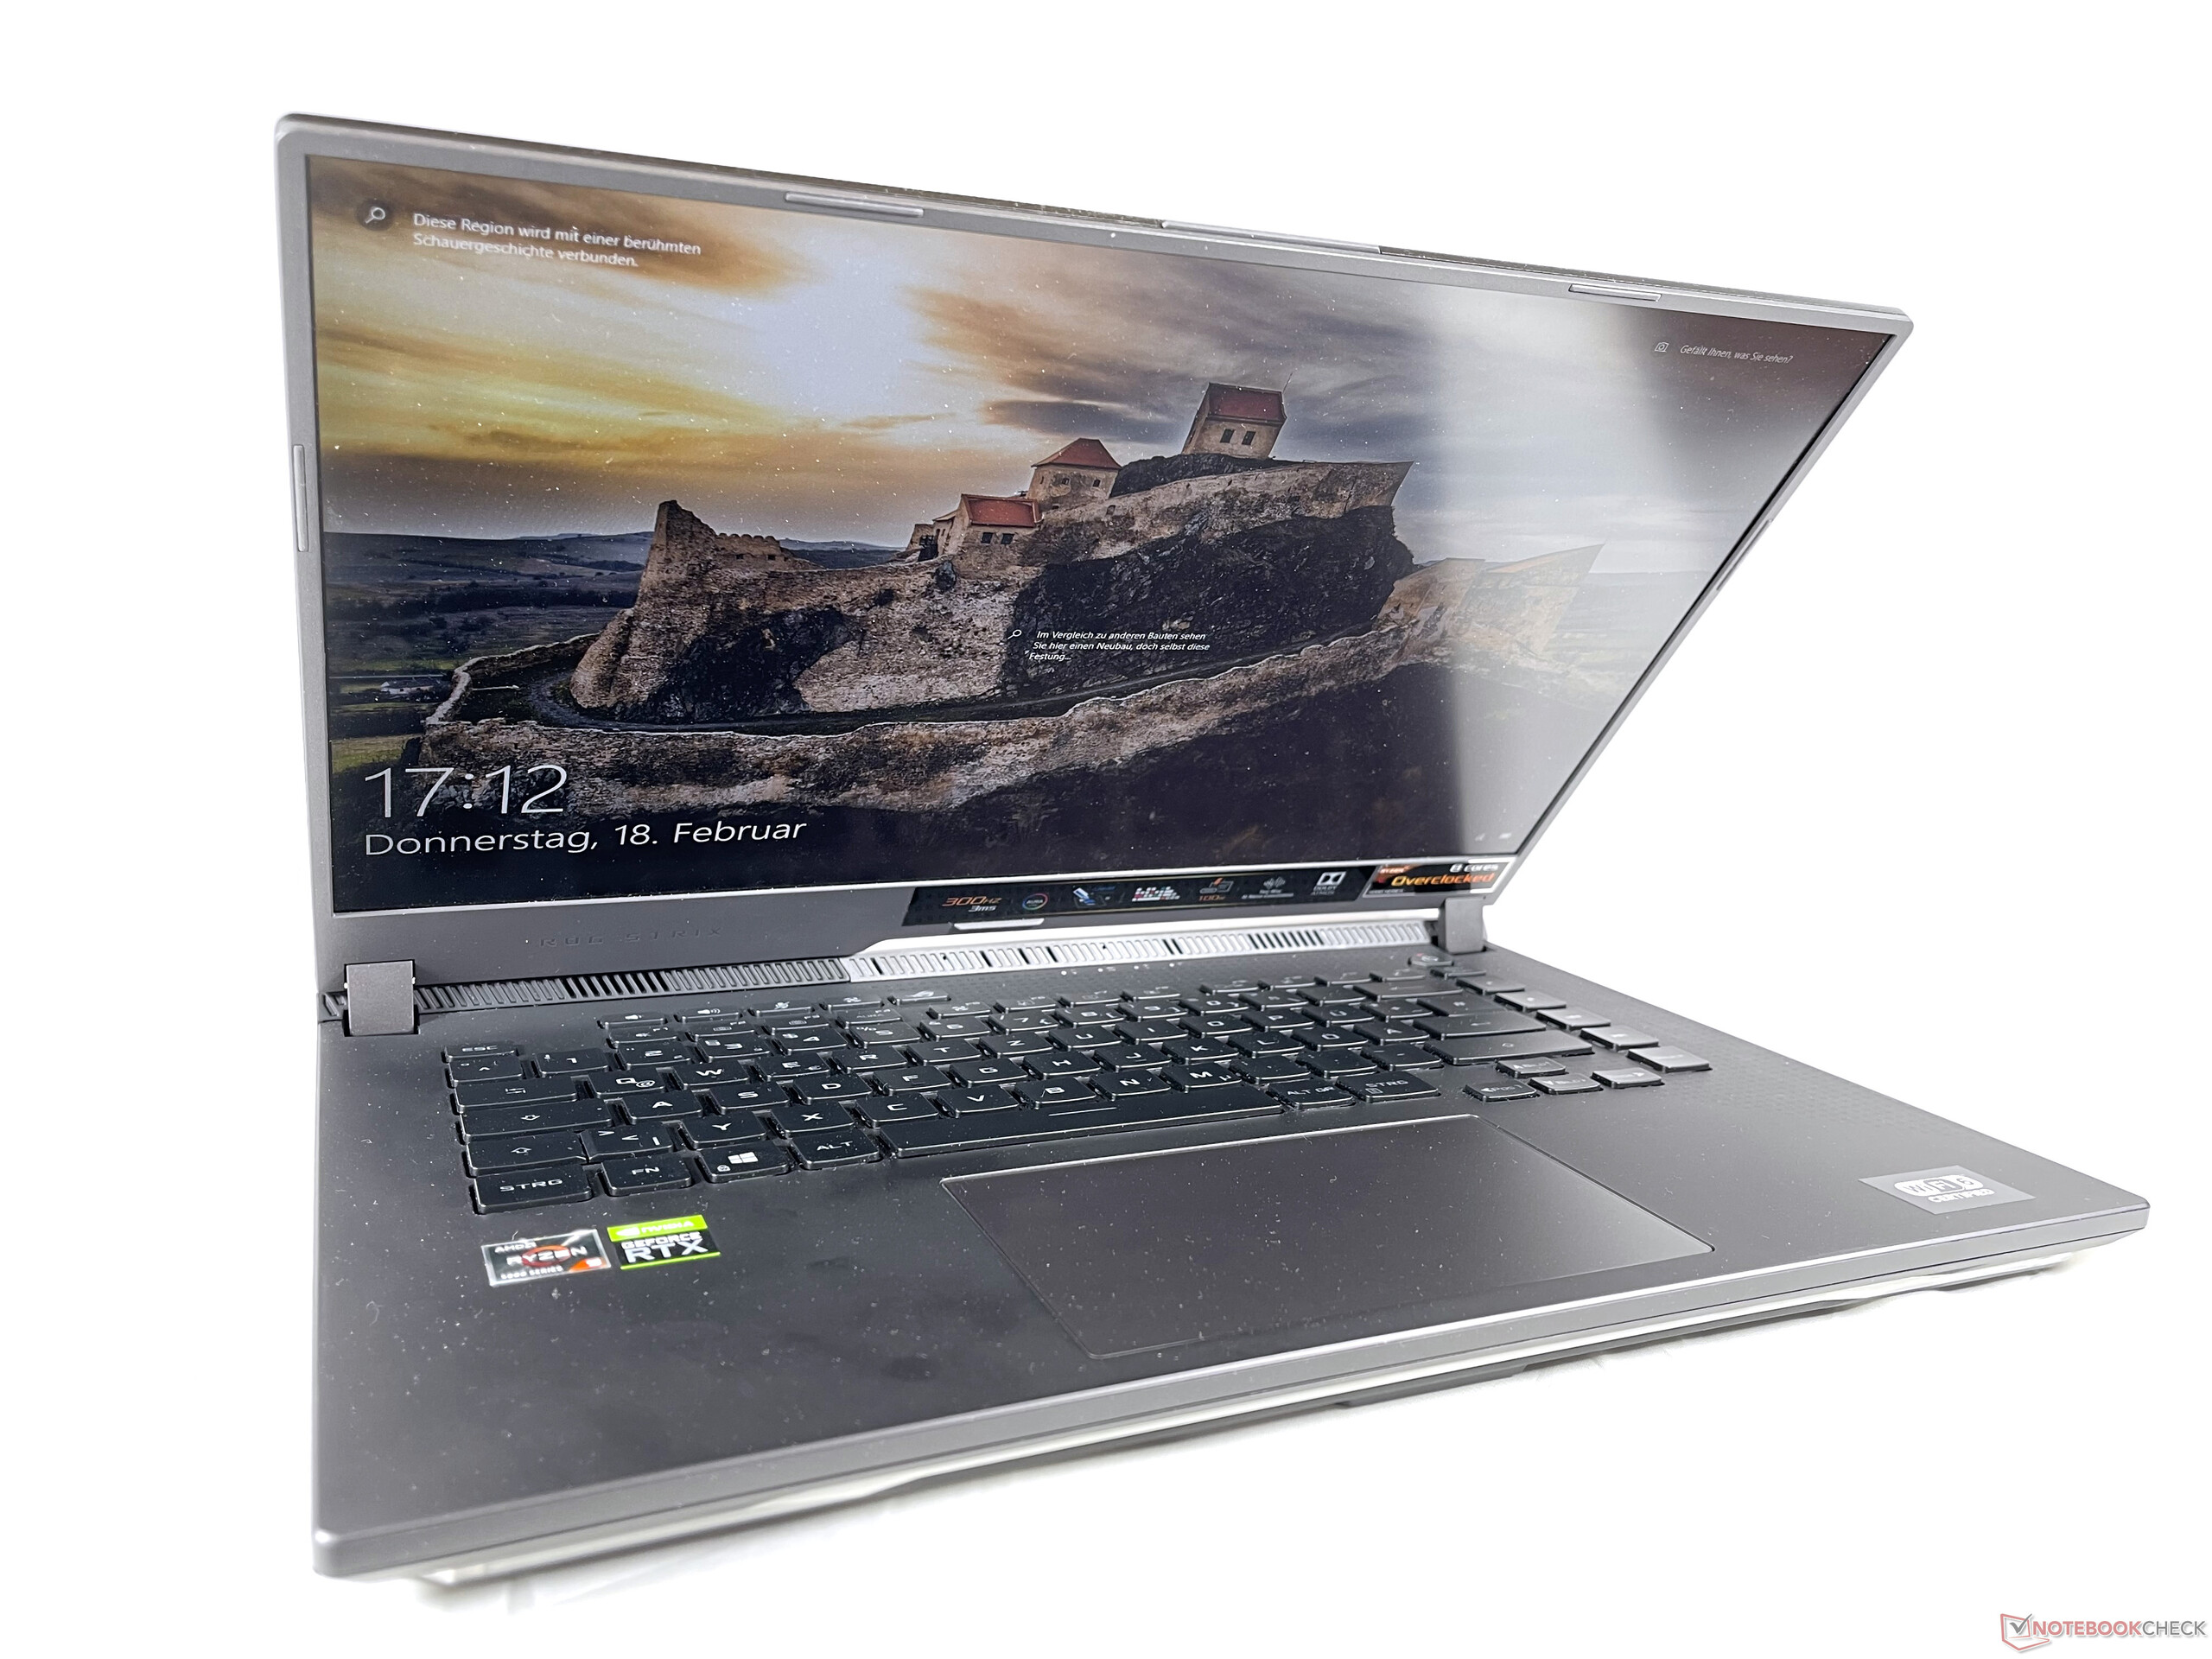
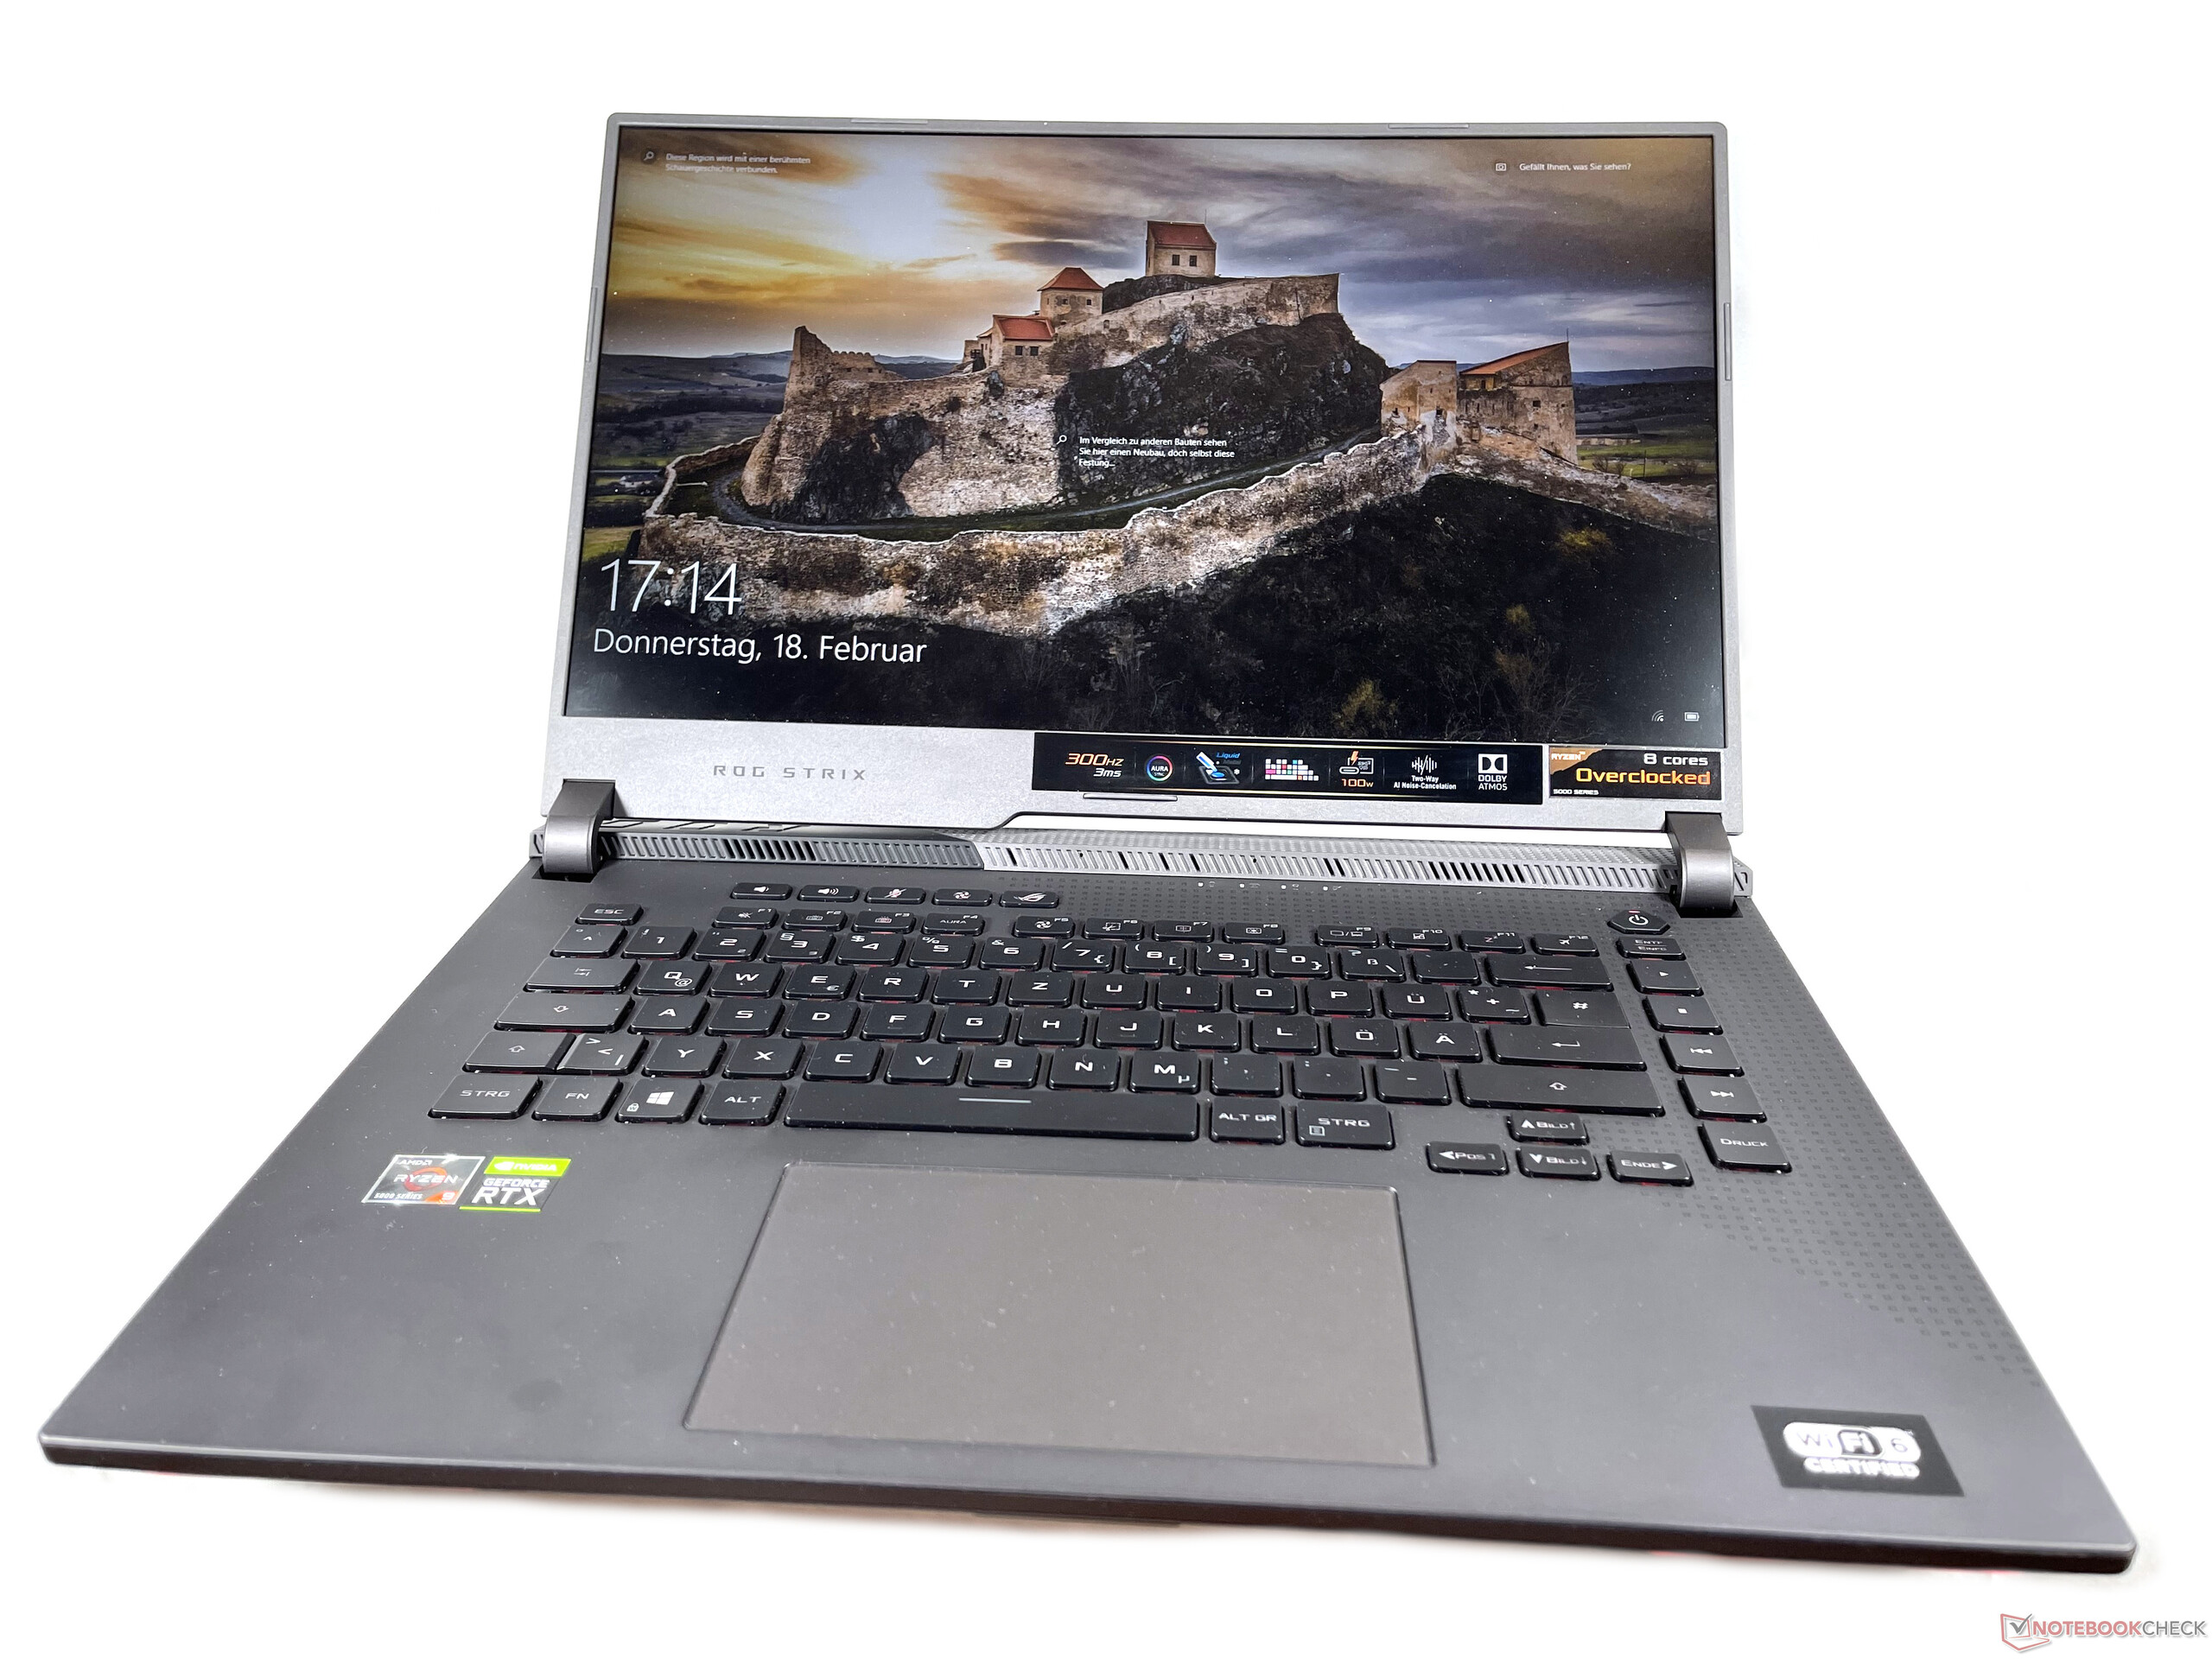
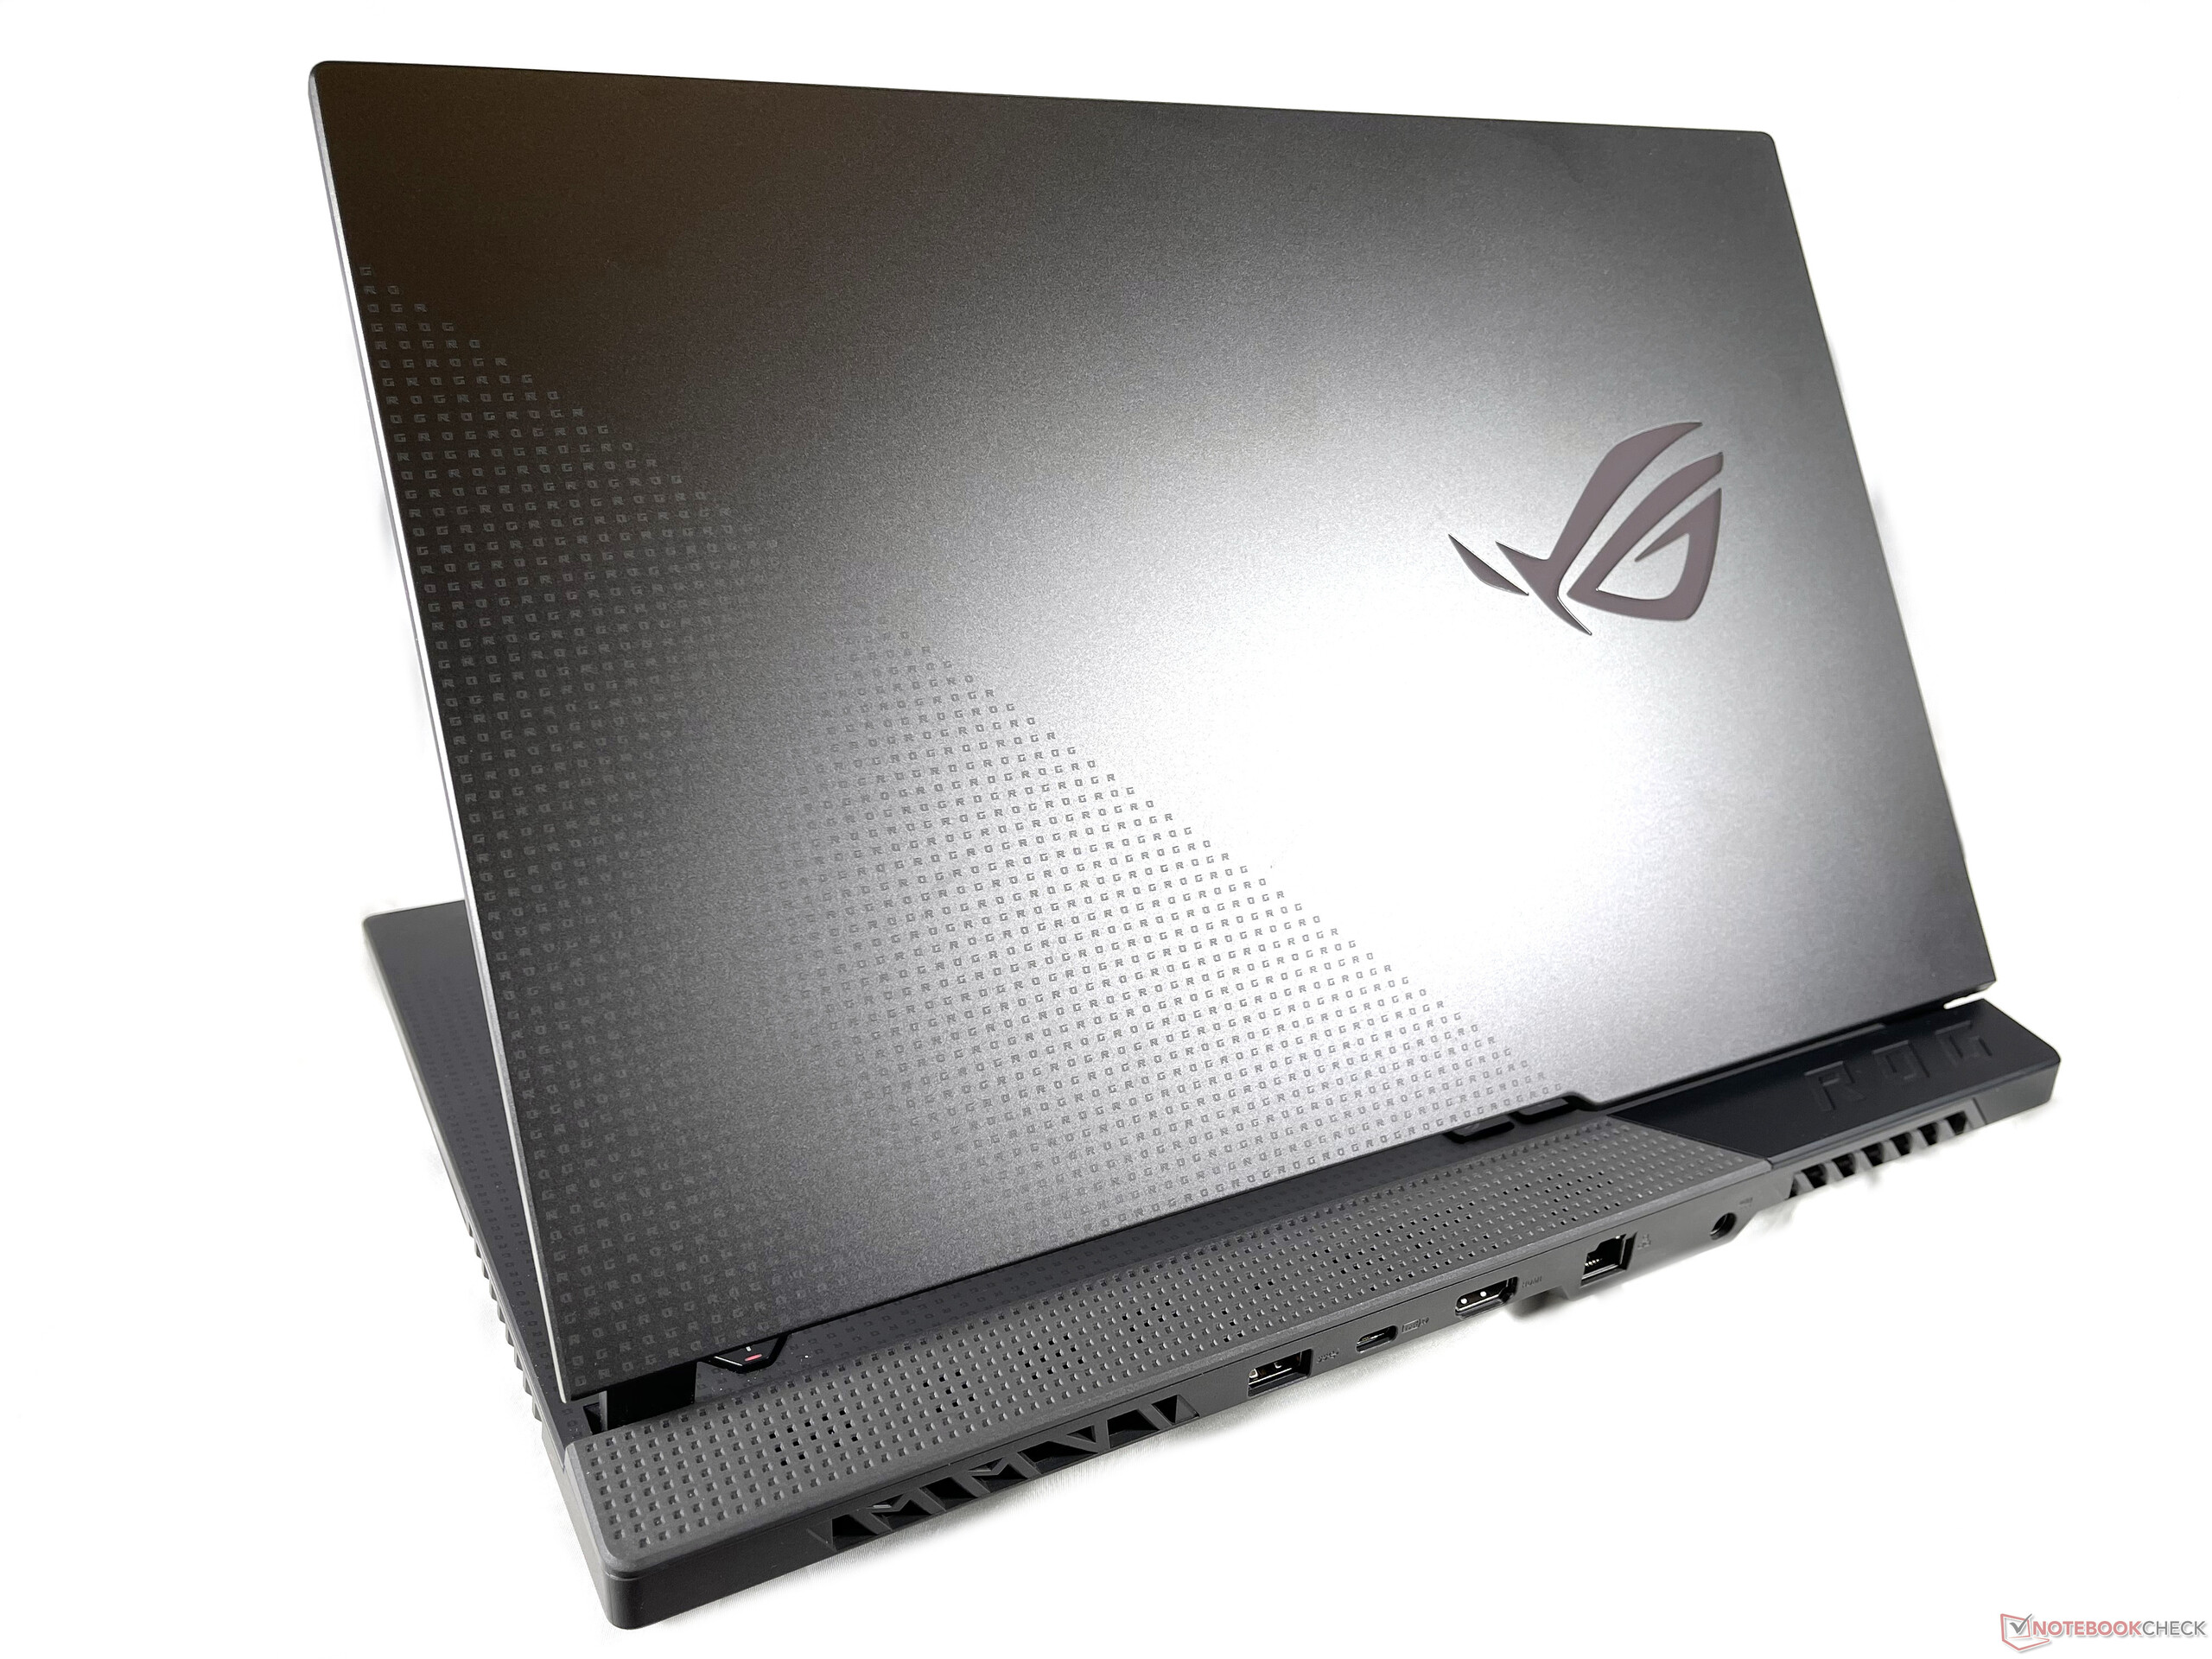
Asus ROG Strix imponerar med en genomarbetad design och snabb hårdvara. Den sistnämnda kan verkligen släppa lös sin fulla potential i det stora 15-tumshöljet och ger en skaplig prestandaökning jämfört med den förra generationen. I synnerhet ger den imponerande 300 Hz-skärmen samt ett RTX 3070 med generöst TDP-värde valuta för pengarna. Asus har heller inte bortsett från mindre detaljer, som tangentbordet och servicemöjligheterna.
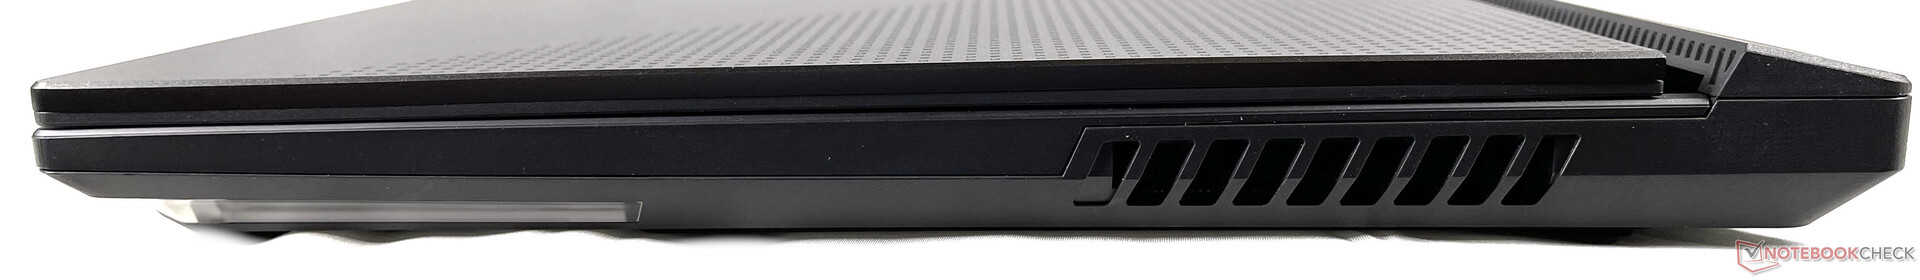
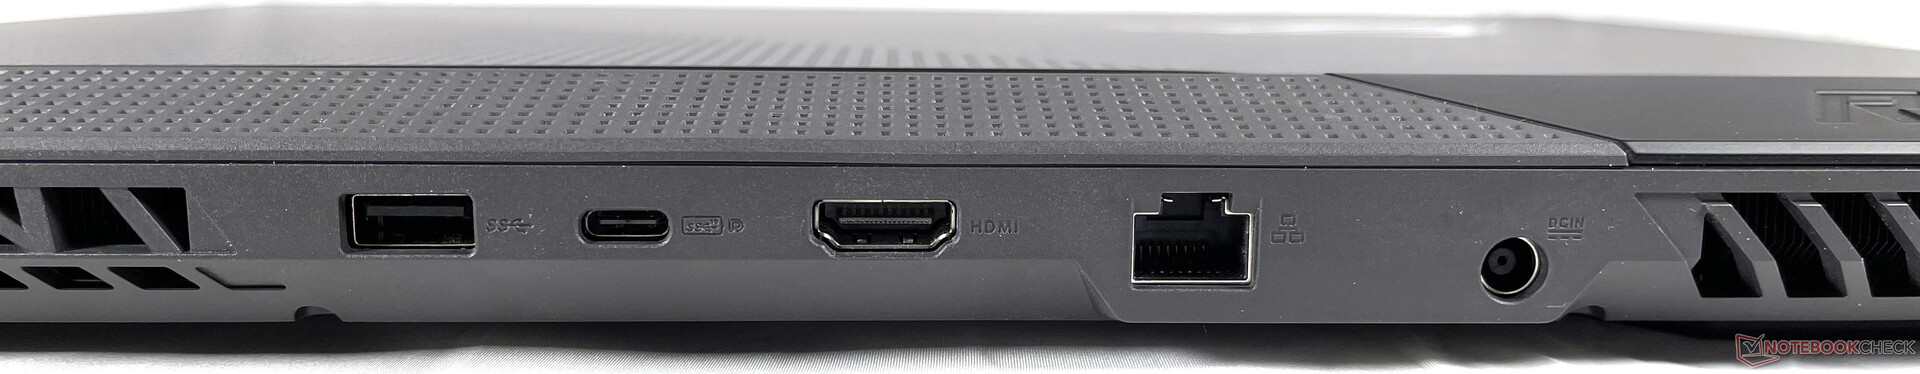
ROG Strix G15 har massor av ren prestanda och ett utmärkt hantverk i 15-tumsformat, men anslutningsmöjligheterna lämnar en del att önska.
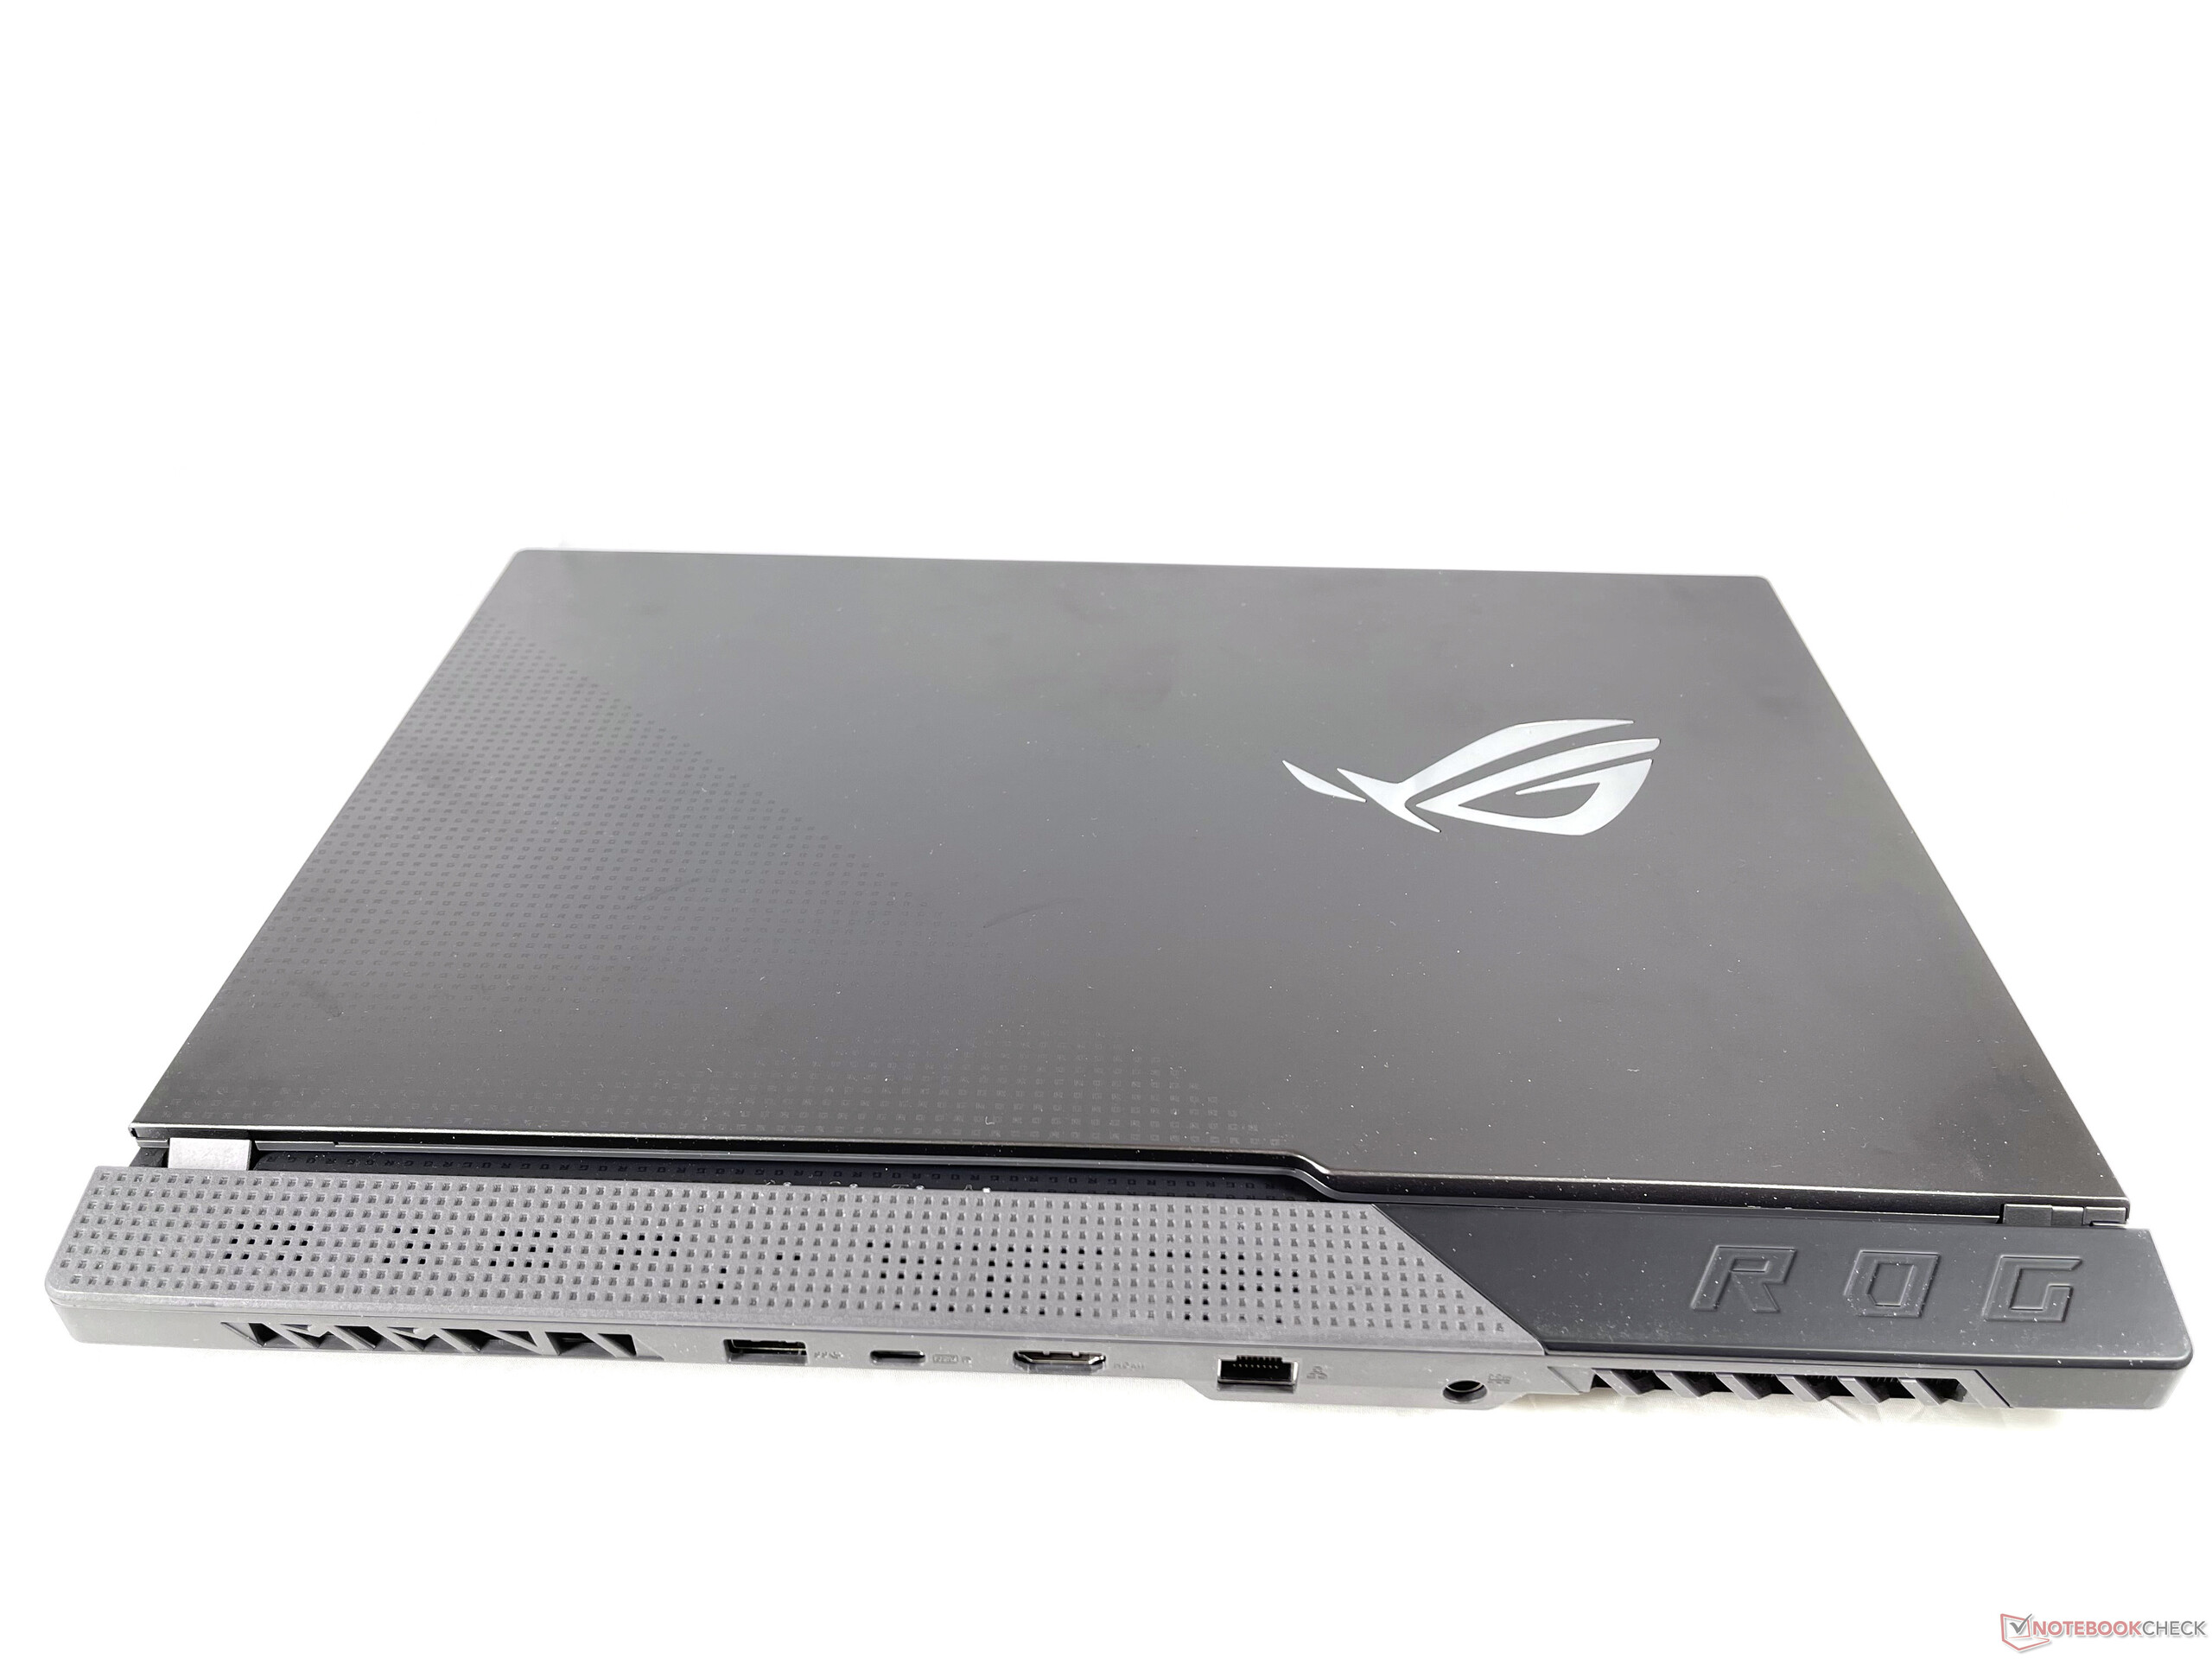
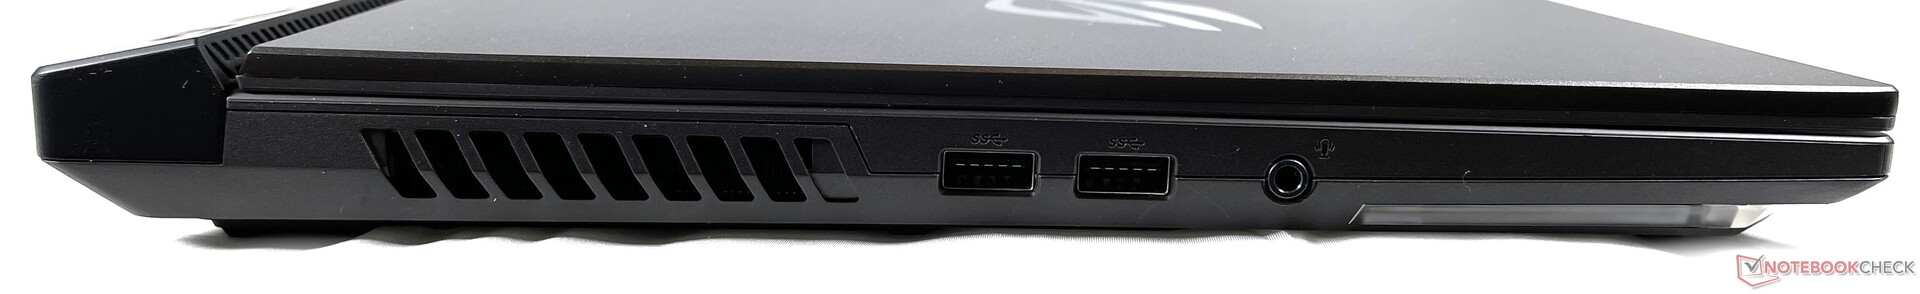
Mest kritik får vi ge anslutningsmöjligheterna: Med bara en USB-C port som har stöd för DisplayPort och Power Delivery och varken webbkamera eller SD-kortläsare känns det ganska minimalistiskt - särskilt eftersom det inte går att ansluta någon dockningsstation då datorn saknar Thunderbolt-port.
Klarar man sig utan dessa funktioner eller helt enkelt inte behöver dem får man massor av prestanda till ett rimligt pris med senaste Asus ROG Strix G15.
Asus ROG Strix G15 G513QR
- 02/22/2021 v7 (old)
Marius Schell
Price comparison
