Test: Aorus 15P WB - Kompakt kraftpaket med riktigt bra batteritid (Sammanfattning)
Gradering | Datum | Modell | Vikt | Höjd | Storlek | Upplösning | Pris |
|---|---|---|---|---|---|---|---|
| 84.5 % v7 (old) | 01/2021 | Aorus 15P WB i7-10750H, GeForce RTX 2070 Max-Q | 2.1 kg | 23 mm | 15.60" | 1920x1080 | |
| 82.1 % v7 (old) | Acer Predator Triton 300 PT315-52-79LP i7-10750H, GeForce RTX 2060 Mobile | 2.1 kg | 19.9 mm | 15.60" | 1920x1080 | ||
| 83.4 % v7 (old) | 02/2021 | Asus ROG Strix G15 G512LW i7-10750H, GeForce RTX 2070 Mobile | 2.3 kg | 25.8 mm | 15.60" | 1920x1080 | |
| 83.7 % v7 (old) | 06/2020 | Dell G5 15 SE 5505 P89F R7 4800H, Radeon RX 5600M | 2.4 kg | 21.6 mm | 15.60" | 1920x1080 |
| SD Card Reader | |
| average JPG Copy Test (av. of 3 runs) | |
| Aorus 15P WB (Toshiba Exceria Pro SDXC 64 GB UHS-II) | |
| Genomsnitt av klass Gaming (20.9 - 210, n=54, senaste 2 åren) | |
| Dell G5 15 SE 5505 P89F (Toshiba Exceria Pro SDXC 64 GB UHS-II) | |
| maximum AS SSD Seq Read Test (1GB) | |
| Aorus 15P WB (Toshiba Exceria Pro SDXC 64 GB UHS-II) | |
| Genomsnitt av klass Gaming (25.5 - 261, n=51, senaste 2 åren) | |
| Dell G5 15 SE 5505 P89F (Toshiba Exceria Pro SDXC 64 GB UHS-II) | |
| Networking | |
| iperf3 transmit AX12 | |
| Dell G5 15 SE 5505 P89F | |
| Acer Predator Triton 300 PT315-52-79LP | |
| Aorus 15P WB | |
| Genomsnitt Intel Wi-Fi 6 AX200 (447 - 1645, n=127) | |
| Asus ROG Strix G15 G512LW | |
| iperf3 receive AX12 | |
| Dell G5 15 SE 5505 P89F | |
| Acer Predator Triton 300 PT315-52-79LP | |
| Aorus 15P WB | |
| Genomsnitt Intel Wi-Fi 6 AX200 (523 - 1684, n=128) | |
| Asus ROG Strix G15 G512LW | |


")
")
| |||||||||||||||||||||||||
Distribution av ljusstyrkan: 91 %
Mitt på batteriet: 275 cd/m²
Kontrast: 833:1 (Svärta: 0.33 cd/m²)
ΔE ColorChecker Calman: 2.72 | ∀{0.5-29.43 Ø4.72}
calibrated: 2.09
ΔE Greyscale Calman: 2.3 | ∀{0.09-98 Ø4.97}
90% sRGB (Argyll 1.6.3 3D)
65% AdobeRGB 1998 (Argyll 1.6.3 3D)
64.6% AdobeRGB 1998 (Argyll 3D)
91.3% sRGB (Argyll 3D)
63% Display P3 (Argyll 3D)
Gamma: 2.266
CCT: 6933 K
| Aorus 15P WB BOE HF NV156FHM-N4G, IPS, 1920x1080, 15.6" | Acer Predator Triton 300 PT315-52-79LP BOE08FB, IPS, 1920x1080, 15.6" | Asus ROG Strix G15 G512LW Sharp LQ156M1JW09, IPS, 1920x1080, 15.6" | Dell G5 15 SE 5505 P89F BOE NV156FH, WVA, 1920x1080, 15.6" | |
|---|---|---|---|---|
| Display | -37% | 7% | -1% | |
| Display P3 Coverage (%) | 63 | 39.51 -37% | 67.8 8% | 63 0% |
| sRGB Coverage (%) | 91.3 | 58.1 -36% | 98.3 8% | 90.1 -1% |
| AdobeRGB 1998 Coverage (%) | 64.6 | 40.81 -37% | 68.5 6% | 64.1 -1% |
| Response Times | -175% | -48% | -75% | |
| Response Time Grey 50% / Grey 80% * (ms) | 8.8 ? | 29.2 ? -232% | 16 ? -82% | 20.4 ? -132% |
| Response Time Black / White * (ms) | 9.2 ? | 20 ? -117% | 10.4 ? -13% | 10.8 ? -17% |
| PWM Frequency (Hz) | 23580 ? | 198.4 ? | ||
| Screen | -65% | -19% | -12% | |
| Brightness middle (cd/m²) | 275 | 279 1% | 300.9 9% | 292 6% |
| Brightness (cd/m²) | 268 | 257 -4% | 289 8% | 290 8% |
| Brightness Distribution (%) | 91 | 89 -2% | 92 1% | 77 -15% |
| Black Level * (cd/m²) | 0.33 | 0.31 6% | 0.31 6% | 0.27 18% |
| Contrast (:1) | 833 | 900 8% | 971 17% | 1081 30% |
| Colorchecker dE 2000 * | 2.72 | 5.84 -115% | 3.54 -30% | 3.99 -47% |
| Colorchecker dE 2000 max. * | 4.45 | 21.8 -390% | 9.82 -121% | 6.11 -37% |
| Colorchecker dE 2000 calibrated * | 2.09 | 4.54 -117% | 1 52% | 3.02 -44% |
| Greyscale dE 2000 * | 2.3 | 3.1 -35% | 5.9 -157% | 3.3 -43% |
| Gamma | 2.266 97% | 2.116 104% | 2.37 93% | 2.25 98% |
| CCT | 6933 94% | 6577 99% | 7456 87% | 7047 92% |
| Color Space (Percent of AdobeRGB 1998) (%) | 65 | 41 -37% | 63.3 -3% | 58.1 -11% |
| Color Space (Percent of sRGB) (%) | 90 | 59 -34% | 98.3 9% | 89.7 0% |
| Totalt genomsnitt (program/inställningar) | -92% /
-74% | -20% /
-18% | -29% /
-18% |
* ... mindre är bättre
Visa svarstider
| ↔ Svarstid svart till vitt | ||
|---|---|---|
| 9.2 ms ... stiga ↗ och falla ↘ kombinerat | ↗ 4.8 ms stiga | 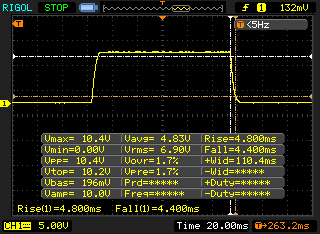 |
| ↘ 4.4 ms hösten | ||
| Skärmen visar snabba svarsfrekvenser i våra tester och bör passa för spel. I jämförelse sträcker sig alla testade enheter från 0.1 (minst) till 240 (maximalt) ms. » 26 % av alla enheter är bättre. Det betyder att den uppmätta svarstiden är bättre än genomsnittet av alla testade enheter (19.8 ms). | ||
| ↔ Svarstid 50 % grått till 80 % grått | ||
| 8.8 ms ... stiga ↗ och falla ↘ kombinerat | ↗ 4.4 ms stiga | 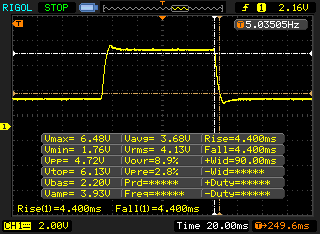 |
| ↘ 4.4 ms hösten | ||
| Skärmen visar snabba svarsfrekvenser i våra tester och bör passa för spel. I jämförelse sträcker sig alla testade enheter från 0.165 (minst) till 636 (maximalt) ms. » 22 % av alla enheter är bättre. Det betyder att den uppmätta svarstiden är bättre än genomsnittet av alla testade enheter (31 ms). | ||
Skärmflimmer / PWM (Puls-Width Modulation)
| Skärmflimmer / PWM upptäcktes inte | 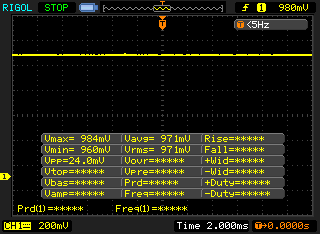 | ||
Som jämförelse: 52 % av alla testade enheter använder inte PWM för att dämpa skärmen. Om PWM upptäcktes mättes ett medelvärde av 7763 (minst: 5 - maximum: 343500) Hz. | |||
| Cinebench R15 | |
| CPU Single 64Bit | |
| Genomsnitt av klass Gaming (188.8 - 343, n=109, senaste 2 åren) | |
| Asus ROG Strix G15 G512LW | |
| Acer Predator Triton 300 PT315-52-79LP | |
| Aorus 15P WB | |
| Genomsnitt Intel Core i7-10750H (184 - 213, n=45) | |
| Dell G5 15 SE 5505 P89F | |
| CPU Multi 64Bit | |
| Genomsnitt av klass Gaming (1578 - 6271, n=108, senaste 2 åren) | |
| Dell G5 15 SE 5505 P89F | |
| Asus ROG Strix G15 G512LW | |
| Aorus 15P WB | |
| Acer Predator Triton 300 PT315-52-79LP | |
| Genomsnitt Intel Core i7-10750H (804 - 1418, n=50) | |
| Blender - v2.79 BMW27 CPU | |
| Genomsnitt Intel Core i7-10750H (322 - 587, n=43) | |
| Acer Predator Triton 300 PT315-52-79LP | |
| Aorus 15P WB | |
| Asus ROG Strix G15 G512LW | |
| Dell G5 15 SE 5505 P89F | |
| Genomsnitt av klass Gaming (80 - 330, n=107, senaste 2 åren) | |
| 7-Zip 18.03 | |
| 7z b 4 -mmt1 | |
| Genomsnitt av klass Gaming (4199 - 7436, n=108, senaste 2 åren) | |
| Aorus 15P WB | |
| Asus ROG Strix G15 G512LW | |
| Genomsnitt Intel Core i7-10750H (4504 - 5470, n=43) | |
| Acer Predator Triton 300 PT315-52-79LP | |
| Dell G5 15 SE 5505 P89F | |
| 7z b 4 | |
| Genomsnitt av klass Gaming (33491 - 148086, n=108, senaste 2 åren) | |
| Dell G5 15 SE 5505 P89F | |
| Asus ROG Strix G15 G512LW | |
| Aorus 15P WB | |
| Acer Predator Triton 300 PT315-52-79LP | |
| Genomsnitt Intel Core i7-10750H (26040 - 37345, n=43) | |
| Cinebench R20 | |
| CPU (Single Core) | |
| Genomsnitt av klass Gaming (442 - 895, n=109, senaste 2 åren) | |
| Aorus 15P WB | |
| Dell G5 15 SE 5505 P89F | |
| Asus ROG Strix G15 G512LW | |
| Acer Predator Triton 300 PT315-52-79LP | |
| Genomsnitt Intel Core i7-10750H (431 - 504, n=43) | |
| CPU (Multi Core) | |
| Genomsnitt av klass Gaming (4029 - 16108, n=109, senaste 2 åren) | |
| Dell G5 15 SE 5505 P89F | |
| Asus ROG Strix G15 G512LW | |
| Acer Predator Triton 300 PT315-52-79LP | |
| Aorus 15P WB | |
| Genomsnitt Intel Core i7-10750H (1749 - 3325, n=43) | |
| Geekbench 5.5 | |
| Single-Core | |
| Genomsnitt av klass Gaming (986 - 2474, n=108, senaste 2 åren) | |
| Asus ROG Strix G15 G512LW | |
| Aorus 15P WB | |
| Acer Predator Triton 300 PT315-52-79LP | |
| Genomsnitt Intel Core i7-10750H (1114 - 1333, n=43) | |
| Dell G5 15 SE 5505 P89F | |
| Multi-Core | |
| Genomsnitt av klass Gaming (6460 - 27010, n=108, senaste 2 åren) | |
| Dell G5 15 SE 5505 P89F | |
| Asus ROG Strix G15 G512LW | |
| Acer Predator Triton 300 PT315-52-79LP | |
| Aorus 15P WB | |
| Genomsnitt Intel Core i7-10750H (4443 - 6674, n=43) | |
| HWBOT x265 Benchmark v2.2 - 4k Preset | |
| Genomsnitt av klass Gaming (11.5 - 44.3, n=108, senaste 2 åren) | |
| Dell G5 15 SE 5505 P89F | |
| Asus ROG Strix G15 G512LW | |
| Aorus 15P WB | |
| Acer Predator Triton 300 PT315-52-79LP | |
| Genomsnitt Intel Core i7-10750H (5.54 - 11.6, n=43) | |
| LibreOffice - 20 Documents To PDF | |
| Dell G5 15 SE 5505 P89F | |
| Genomsnitt Intel Core i7-10750H (43.1 - 99.2, n=43) | |
| Aorus 15P WB | |
| Genomsnitt av klass Gaming (19 - 88.8, n=108, senaste 2 åren) | |
| Acer Predator Triton 300 PT315-52-79LP | |
| Asus ROG Strix G15 G512LW | |
| R Benchmark 2.5 - Overall mean | |
| Genomsnitt Intel Core i7-10750H (0.578 - 0.708, n=42) | |
| Acer Predator Triton 300 PT315-52-79LP | |
| Asus ROG Strix G15 G512LW | |
| Aorus 15P WB | |
| Dell G5 15 SE 5505 P89F | |
| Genomsnitt av klass Gaming (0.3439 - 0.759, n=109, senaste 2 åren) | |
* ... mindre är bättre
| PCMark 8 Home Score Accelerated v2 | 4410 poäng | |
| PCMark 8 Creative Score Accelerated v2 | 6169 poäng | |
| PCMark 8 Work Score Accelerated v2 | 5556 poäng | |
| PCMark 10 Score | 6301 poäng | |
Hjälp | ||
| PCMark 10 - Score | |
| Genomsnitt av klass Gaming (5828 - 11574, n=95, senaste 2 åren) | |
| Aorus 15P WB | |
| Dell G5 15 SE 5505 P89F | |
| Genomsnitt Intel Core i7-10750H, NVIDIA GeForce RTX 2070 Max-Q (5208 - 6301, n=3) | |
| Asus ROG Strix G15 G512LW | |
| Acer Predator Triton 300 PT315-52-79LP | |
| DPC Latencies / LatencyMon - interrupt to process latency (max), Web, Youtube, Prime95 | |
| Asus ROG Strix G15 G512LW | |
| Dell G5 15 SE 5505 P89F | |
| Acer Predator Triton 300 PT315-52-79LP | |
| Aorus 15P WB | |
* ... mindre är bättre

| Aorus 15P WB ADATA XPG SX8200 Pro (ASX8200PNP-512GT) | Acer Predator Triton 300 PT315-52-79LP WDC PC SN730 SDBQNTY-1T00 | Asus ROG Strix G15 G512LW Toshiba XG5-P KXG50PNV2T04 | Dell G5 15 SE 5505 P89F Samsung PM991 MZ9LQ512HALU | Genomsnitt ADATA XPG SX8200 Pro (ASX8200PNP-512GT) | |
|---|---|---|---|---|---|
| CrystalDiskMark 5.2 / 6 | -3% | -31% | -23% | -1% | |
| Write 4K (MB/s) | 131.7 | 117.5 -11% | 116.5 -12% | 142.1 8% | 149.5 ? 14% |
| Read 4K (MB/s) | 55.7 | 47.36 -15% | 27.6 -50% | 46.43 -17% | 53.6 ? -4% |
| Write Seq (MB/s) | 2273 | 2748 21% | 1020 -55% | 1108 -51% | 2346 ? 3% |
| Read Seq (MB/s) | 2533 | 2084 -18% | 1999 -21% | 1622 -36% | 2501 ? -1% |
| Write 4K Q32T1 (MB/s) | 475.1 | 407.3 -14% | 375.9 -21% | 467 -2% | 419 ? -12% |
| Read 4K Q32T1 (MB/s) | 590 | 474.6 -20% | 398.5 -32% | 525 -11% | 520 ? -12% |
| Write Seq Q32T1 (MB/s) | 2373 | 3069 29% | 1015 -57% | 1203 -49% | 2463 ? 4% |
| Read Seq Q32T1 (MB/s) | 3068 | 3154 3% | 3049 -1% | 2288 -25% | 2997 ? -2% |
| AS SSD | 47% | -44% | -35% | 8% | |
| Seq Read (MB/s) | 2241 | 2369 6% | 1933 -14% | 1386 -38% | 2688 ? 20% |
| Seq Write (MB/s) | 2121 | 2446 15% | 787 -63% | 1234 -42% | 1888 ? -11% |
| 4K Read (MB/s) | 52.3 | 40.61 -22% | 26.4 -50% | 41.32 -21% | 53.3 ? 2% |
| 4K Write (MB/s) | 116.2 | 103.2 -11% | 109.8 -6% | 128 10% | 124.8 ? 7% |
| 4K-64 Read (MB/s) | 713 | 1637 130% | 848 19% | 854 20% | 714 ? 0% |
| 4K-64 Write (MB/s) | 827 | 1961 137% | 923 12% | 721 -13% | 1114 ? 35% |
| Access Time Read * (ms) | 0.054 | 0.06 -11% | 0.044 19% | 0.098 -81% | 0.05575 ? -3% |
| Access Time Write * (ms) | 0.031 | 0.036 -16% | 0.158 -410% | 0.095 -206% | 0.03125 ? -1% |
| Score Read (Points) | 989 | 1915 94% | 1067 8% | 1034 5% | 1036 ? 5% |
| Score Write (Points) | 1155 | 2309 100% | 1112 -4% | 973 -16% | 1428 ? 24% |
| Score Total (Points) | 2659 | 5205 96% | 2669 0% | 2536 -5% | 2968 ? 12% |
| Totalt genomsnitt (program/inställningar) | 22% /
26% | -38% /
-39% | -29% /
-30% | 4% /
4% |
* ... mindre är bättre
DiskSpd Read Loop, Queue Depth 8
| 3DMark 11 Performance | 19910 poäng | |
| 3DMark Cloud Gate Standard Score | 39445 poäng | |
| 3DMark Fire Strike Score | 16759 poäng | |
| 3DMark Time Spy Score | 6920 poäng | |
Hjälp | ||
| 3DMark 11 - 1280x720 Performance GPU | |
| Genomsnitt av klass Gaming (21841 - 80022, n=106, senaste 2 åren) | |
| Asus ROG Strix G15 G512LW | |
| Dell G5 15 SE 5505 P89F | |
| Aorus 15P WB | |
| Genomsnitt NVIDIA GeForce RTX 2070 Max-Q (14723 - 27694, n=31) | |
| Acer Predator Triton 300 PT315-52-79LP | |
| 3DMark | |
| 1280x720 Cloud Gate Standard Graphics | |
| Genomsnitt av klass Gaming (86886 - 223650, n=62, senaste 2 åren) | |
| Asus ROG Strix G15 G512LW | |
| Aorus 15P WB | |
| Genomsnitt NVIDIA GeForce RTX 2070 Max-Q (39014 - 134255, n=28) | |
| Dell G5 15 SE 5505 P89F | |
| 1920x1080 Fire Strike Graphics | |
| Genomsnitt av klass Gaming (12242 - 62849, n=118, senaste 2 åren) | |
| Asus ROG Strix G15 G512LW | |
| Dell G5 15 SE 5505 P89F | |
| Aorus 15P WB | |
| Genomsnitt NVIDIA GeForce RTX 2070 Max-Q (11563 - 21191, n=31) | |
| Acer Predator Triton 300 PT315-52-79LP | |
| 2560x1440 Time Spy Graphics | |
| Genomsnitt av klass Gaming (5012 - 26212, n=117, senaste 2 åren) | |
| Asus ROG Strix G15 G512LW | |
| Aorus 15P WB | |
| Genomsnitt NVIDIA GeForce RTX 2070 Max-Q (5948 - 8065, n=28) | |
| Dell G5 15 SE 5505 P89F | |
| Acer Predator Triton 300 PT315-52-79LP | |
| The Witcher 3 - 1920x1080 Ultra Graphics & Postprocessing (HBAO+) | |
| Genomsnitt av klass Gaming (95 - 240, n=8, senaste 2 åren) | |
| Asus ROG Strix G15 G512LW | |
| Aorus 15P WB | |
| Genomsnitt NVIDIA GeForce RTX 2070 Max-Q (56 - 83.8, n=31) | |
| Dell G5 15 SE 5505 P89F | |
| Acer Predator Triton 300 PT315-52-79LP | |
| Far Cry 5 - 1920x1080 Ultra Preset AA:T | |
| Genomsnitt av klass Gaming (70 - 151, n=9, senaste 2 åren) | |
| Aorus 15P WB | |
| Genomsnitt NVIDIA GeForce RTX 2070 Max-Q (67 - 101, n=7) | |
| Acer Predator Triton 300 PT315-52-79LP | |
| Doom Eternal - 1920x1080 Ultra Preset | |
| Aorus 15P WB | |
| Genomsnitt NVIDIA GeForce RTX 2070 Max-Q (125.6 - 137.9, n=4) | |
| Dell G5 15 SE 5505 P89F | |
| X-Plane 11.11 - 1920x1080 high (fps_test=3) | |
| Genomsnitt av klass Gaming (52.1 - 143.5, n=113, senaste 2 åren) | |
| Genomsnitt NVIDIA GeForce RTX 2070 Max-Q (61.6 - 85.3, n=11) | |
| Aorus 15P WB | |
| Acer Predator Triton 300 PT315-52-79LP | |
| Asus ROG Strix G15 G512LW | |
| Dell G5 15 SE 5505 P89F | |
| Call of Duty Black Ops Cold War - 1920x1080 Highest Settings | |
| Aorus 15P WB | |
| Genomsnitt NVIDIA GeForce RTX 2070 Max-Q (n=1) | |
| Yakuza Like a Dragon - 1920x1080 Ultra Preset | |
| Aorus 15P WB | |
| Genomsnitt NVIDIA GeForce RTX 2070 Max-Q (n=1) | |
| Star Wars Squadrons - 1920x1080 Ultra Preset | |
| Aorus 15P WB | |
| Genomsnitt NVIDIA GeForce RTX 2070 Max-Q (n=1) | |
| låg | med. | hög | ultra | |
|---|---|---|---|---|
| The Witcher 3 (2015) | 275.4 | 222.4 | 129.2 | 69.8 |
| Dota 2 Reborn (2015) | 150.7 | 136.2 | 124.8 | 115.1 |
| X-Plane 11.11 (2018) | 106 | 93.3 | 78.8 | |
| Far Cry 5 (2018) | 132 | 109 | 102 | 97 |
| Doom Eternal (2020) | 260.8 | 152.7 | 136.4 | 131.1 |
| Crysis Remastered (2020) | 196 | 117 | 56.6 | 43 |
| Star Wars Squadrons (2020) | 272.2 | 192.7 | 182.4 | 172.4 |
| Watch Dogs Legion (2020) | 107 | 88 | 77 | 51 |
| Assassin´s Creed Valhalla (2020) | 113 | 75 | 63 | 55 |
| Call of Duty Black Ops Cold War (2020) | 159 | 79.3 | 70.5 | 64.1 |
| Yakuza Like a Dragon (2020) | 111.1 | 80.8 | 81.1 | 72 |
| Immortals Fenyx Rising (2020) | 117 | 78 | 66 | 61 |
| Cyberpunk 2077 1.0 (2020) | 106 | 62 | 51.5 | 43.8 |
Ljudnivå
| Låg belastning |
| 29 / 30 / 31 dB(A) |
| Hög belastning |
| 41 / 45 dB(A) |
 | ||
30 dB tyst 40 dB(A) hörbar 50 dB(A) högt ljud |
||
min: | ||
| Aorus 15P WB i7-10750H, GeForce RTX 2070 Max-Q | Acer Predator Triton 300 PT315-52-79LP i7-10750H, GeForce RTX 2060 Mobile | Asus ROG Strix G15 G512LW i7-10750H, GeForce RTX 2070 Mobile | Dell G5 15 SE 5505 P89F R7 4800H, Radeon RX 5600M | Genomsnitt av klass Gaming | |
|---|---|---|---|---|---|
| Noise | -3% | -7% | 1% | 1% | |
| av / miljö * (dB) | 25 | 25 -0% | 25.7 -3% | 28 -12% | 24.1 ? 4% |
| Idle Minimum * (dB) | 29 | 25 14% | 25.7 11% | 28 3% | 25.9 ? 11% |
| Idle Average * (dB) | 30 | 29 3% | 29.7 1% | 28 7% | 27.4 ? 9% |
| Idle Maximum * (dB) | 31 | 34 -10% | 34 -10% | 28 10% | 29.9 ? 4% |
| Load Average * (dB) | 41 | 44 -7% | 38.9 5% | 28 32% | 43 ? -5% |
| Witcher 3 ultra * (dB) | 43 | 49 -14% | 54.1 -26% | 50.6 -18% | |
| Load Maximum * (dB) | 45 | 49 -9% | 57.4 -28% | 50.6 -12% | 54.1 ? -20% |
* ... mindre är bättre
(-) Den maximala temperaturen på ovansidan är 47 °C / 117 F, jämfört med genomsnittet av 40.4 °C / 105 F , allt från 21.2 till 68.8 °C för klassen Gaming.
(-) Botten värms upp till maximalt 62 °C / 144 F, jämfört med genomsnittet av 43.2 °C / 110 F
(+) Vid tomgångsbruk är medeltemperaturen för ovansidan 24.7 °C / 76 F, jämfört med enhetsgenomsnittet på 33.9 °C / ### class_avg_f### F.
(±) När du spelar The Witcher 3 är medeltemperaturen för ovansidan 37 °C / 99 F, jämfört med enhetsgenomsnittet på 33.9 °C / ## #class_avg_f### F.
(+) Handledsstöden och pekplattan når maximal hudtemperatur (32 °C / 89.6 F) och är därför inte varma.
(-) Medeltemperaturen för handledsstödsområdet på liknande enheter var 28.8 °C / 83.8 F (-3.2 °C / -5.8 F).
| Aorus 15P WB i7-10750H, GeForce RTX 2070 Max-Q | Acer Predator Triton 300 PT315-52-79LP i7-10750H, GeForce RTX 2060 Mobile | Asus ROG Strix G15 G512LW i7-10750H, GeForce RTX 2070 Mobile | Dell G5 15 SE 5505 P89F R7 4800H, Radeon RX 5600M | Genomsnitt av klass Gaming | |
|---|---|---|---|---|---|
| Heat | -18% | -4% | -7% | -5% | |
| Maximum Upper Side * (°C) | 47 | 55 -17% | 53.4 -14% | 53 -13% | 45.2 ? 4% |
| Maximum Bottom * (°C) | 62 | 65 -5% | 49 21% | 57.6 7% | 48.1 ? 22% |
| Idle Upper Side * (°C) | 26 | 32 -23% | 29.6 -14% | 27.4 -5% | 31.1 ? -20% |
| Idle Bottom * (°C) | 27 | 34 -26% | 29.4 -9% | 31 -15% | 34.3 ? -27% |
* ... mindre är bättre
Aorus 15P WB ljudanalys
(±) | högtalarljudstyrkan är genomsnittlig men bra (76 dB)
Bas 100 - 315 Hz
(-) | nästan ingen bas - i genomsnitt 20.8% lägre än medianen
(±) | linjäriteten för basen är genomsnittlig (13% delta till föregående frekvens)
Mellan 400 - 2000 Hz
(±) | högre mellan - i genomsnitt 5.4% högre än median
(+) | mids är linjära (4.9% delta till föregående frekvens)
Högsta 2 - 16 kHz
(+) | balanserade toppar - endast 2.6% från medianen
(+) | toppar är linjära (6.7% delta till föregående frekvens)
Totalt 100 - 16 000 Hz
(±) | linjäriteten för det totala ljudet är genomsnittlig (20.4% skillnad mot median)
Jämfört med samma klass
» 72% av alla testade enheter i den här klassen var bättre, 6% liknande, 22% sämre
» Den bästa hade ett delta på 6%, genomsnittet var 18%, sämst var 132%
Jämfört med alla testade enheter
» 53% av alla testade enheter var bättre, 8% liknande, 39% sämre
» Den bästa hade ett delta på 4%, genomsnittet var 24%, sämst var 134%
| Av/Standby | |
| Låg belastning | |
| Hög belastning |
|
Förklaring:
min: | |
| Aorus 15P WB i7-10750H, GeForce RTX 2070 Max-Q | Acer Predator Triton 300 PT315-52-79LP i7-10750H, GeForce RTX 2060 Mobile | Asus ROG Strix G15 G512LW i7-10750H, GeForce RTX 2070 Mobile | Dell G5 15 SE 5505 P89F R7 4800H, Radeon RX 5600M | Genomsnitt av klass Gaming | |
|---|---|---|---|---|---|
| Power Consumption | 22% | -33% | 27% | -13% | |
| Idle Minimum * (Watt) | 13 | 4 69% | 16.2 -25% | 6.5 50% | 13.1 ? -1% |
| Idle Average * (Watt) | 15 | 10 33% | 24.1 -61% | 10.6 29% | 18.8 ? -25% |
| Idle Maximum * (Watt) | 19 | 19 -0% | 30.8 -62% | 11 42% | 24.4 ? -28% |
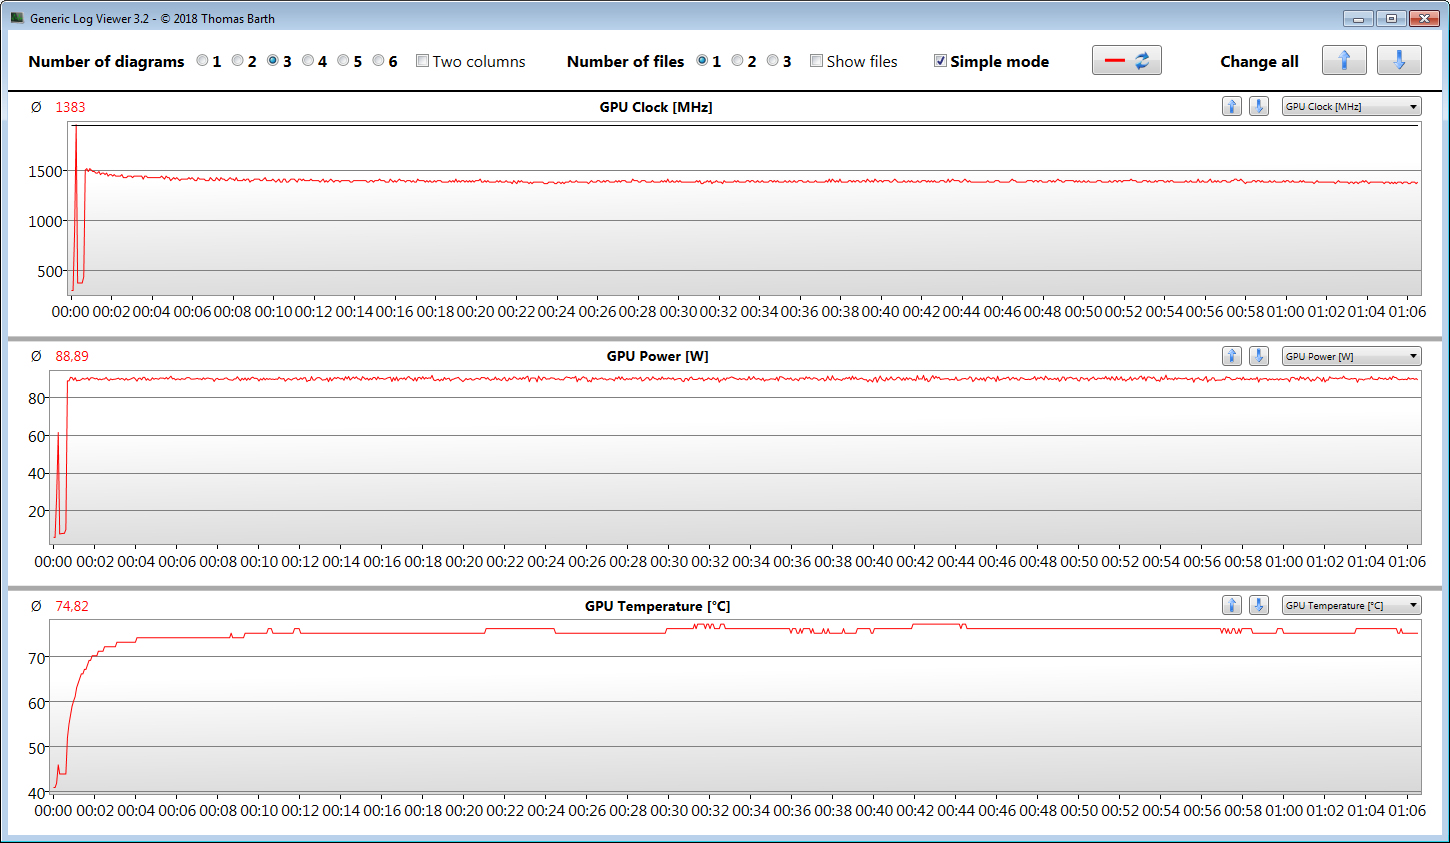
| Load Average * (Watt) | 100 | 96 4% | 127.6 -28% | 84.1 16% | 108.6 ? -9% |
| Witcher 3 ultra * (Watt) | 150 | 136 9% | 187.5 -25% | 152.9 -2% | |
| Load Maximum * (Watt) | 249 | 214 14% | 239 4% | 180.4 28% | 254 ? -2% |
* ... mindre är bättre
| Aorus 15P WB i7-10750H, GeForce RTX 2070 Max-Q, 94.24 Wh | Acer Predator Triton 300 PT315-52-79LP i7-10750H, GeForce RTX 2060 Mobile, 58.7 Wh | Asus ROG Strix G15 G512LW i7-10750H, GeForce RTX 2070 Mobile, 66 Wh | Dell G5 15 SE 5505 P89F R7 4800H, Radeon RX 5600M, 51 Wh | Genomsnitt av klass Gaming | |
|---|---|---|---|---|---|
| Batteridrifttid | -24% | -10% | -16% | -15% | |
| Reader / Idle (h) | 11.3 | 9.6 -15% | 11.2 -1% | 8.71 ? -23% | |
| H.264 (h) | 8.1 | 8.28 ? 2% | |||
| WiFi v1.3 (h) | 7.1 | 5.5 -23% | 6.4 -10% | 6.2 -13% | 6.96 ? -2% |
| Load (h) | 2.3 | 1.5 -35% | 1.5 -35% | 1.47 ? -36% |
För
Emot
Läs den fullständiga versionen av den här recensionen på engelska här.
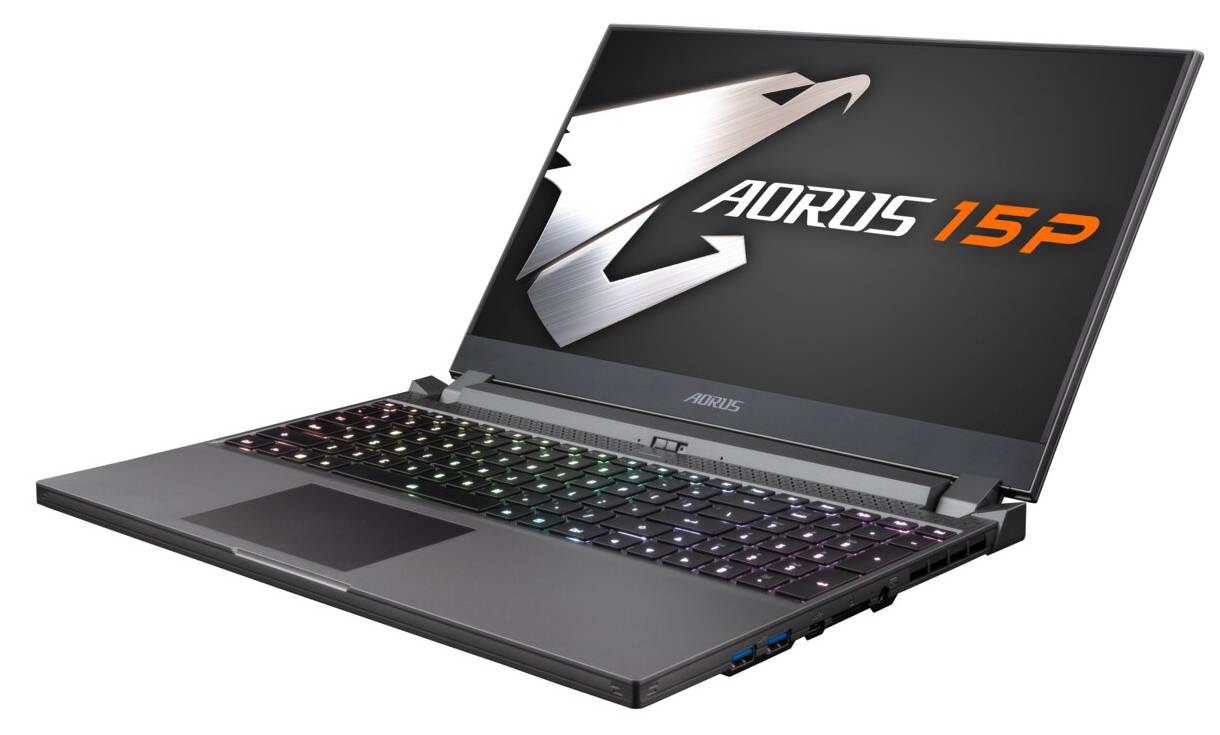
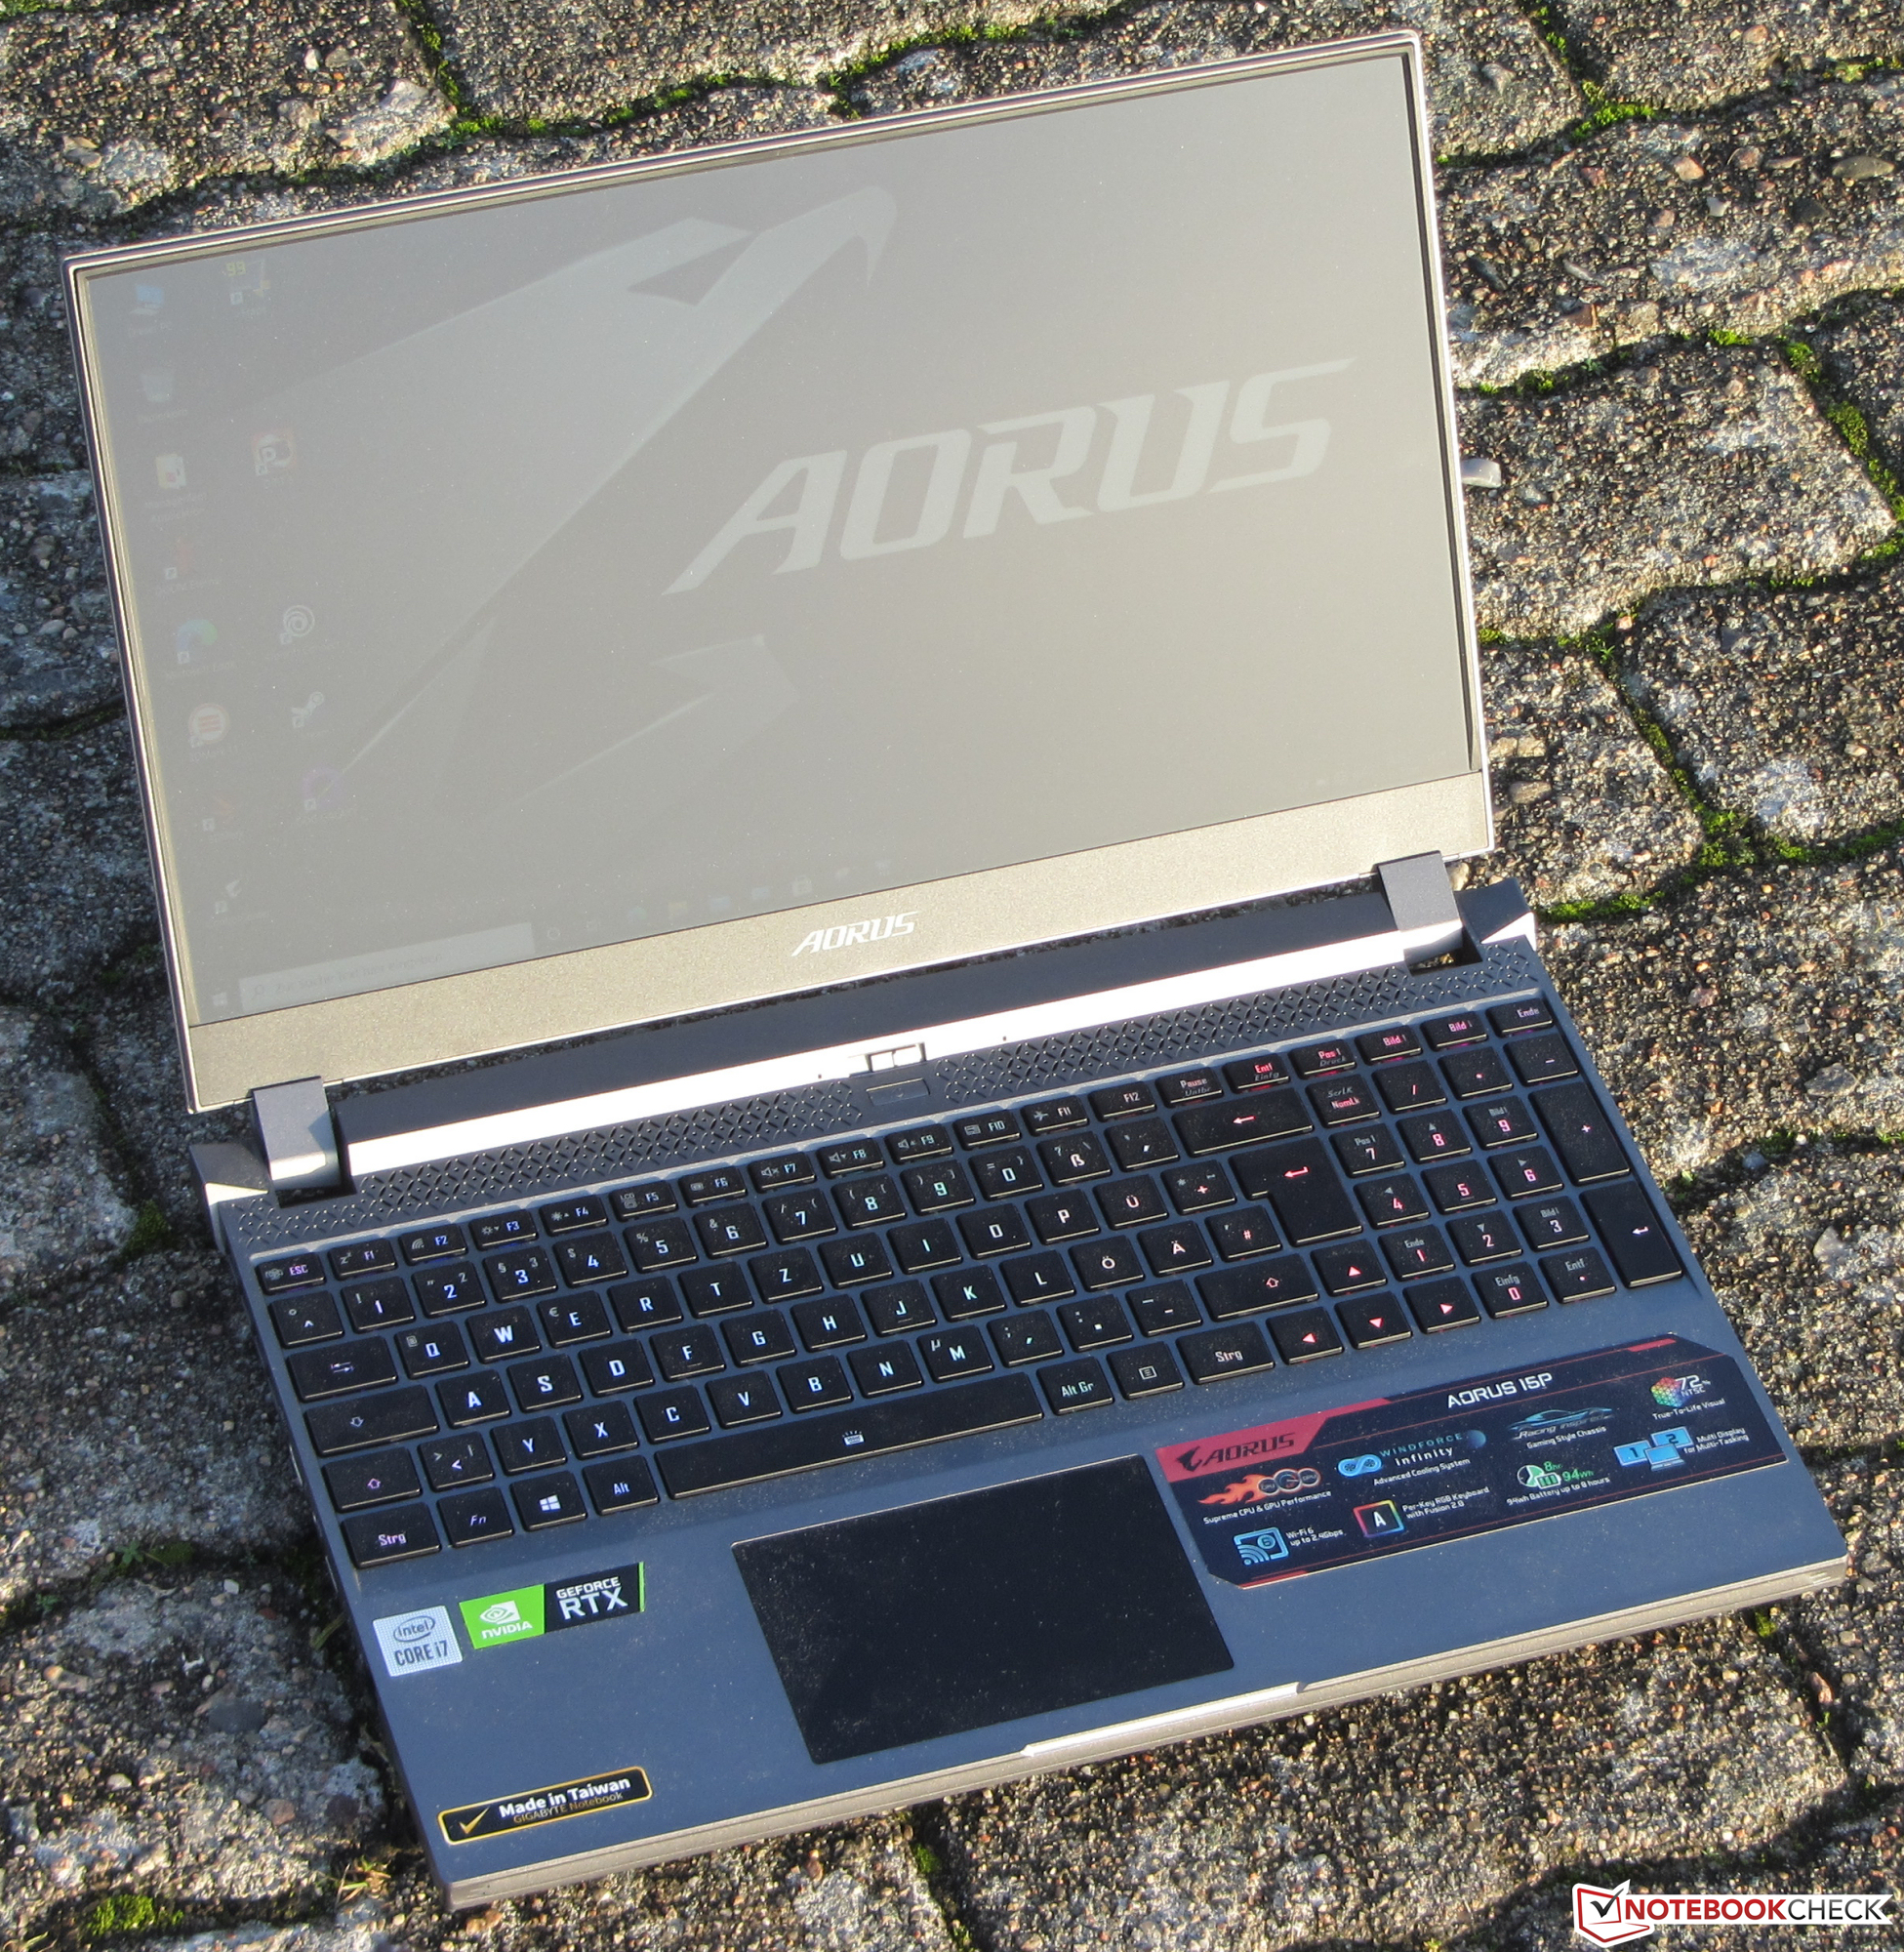
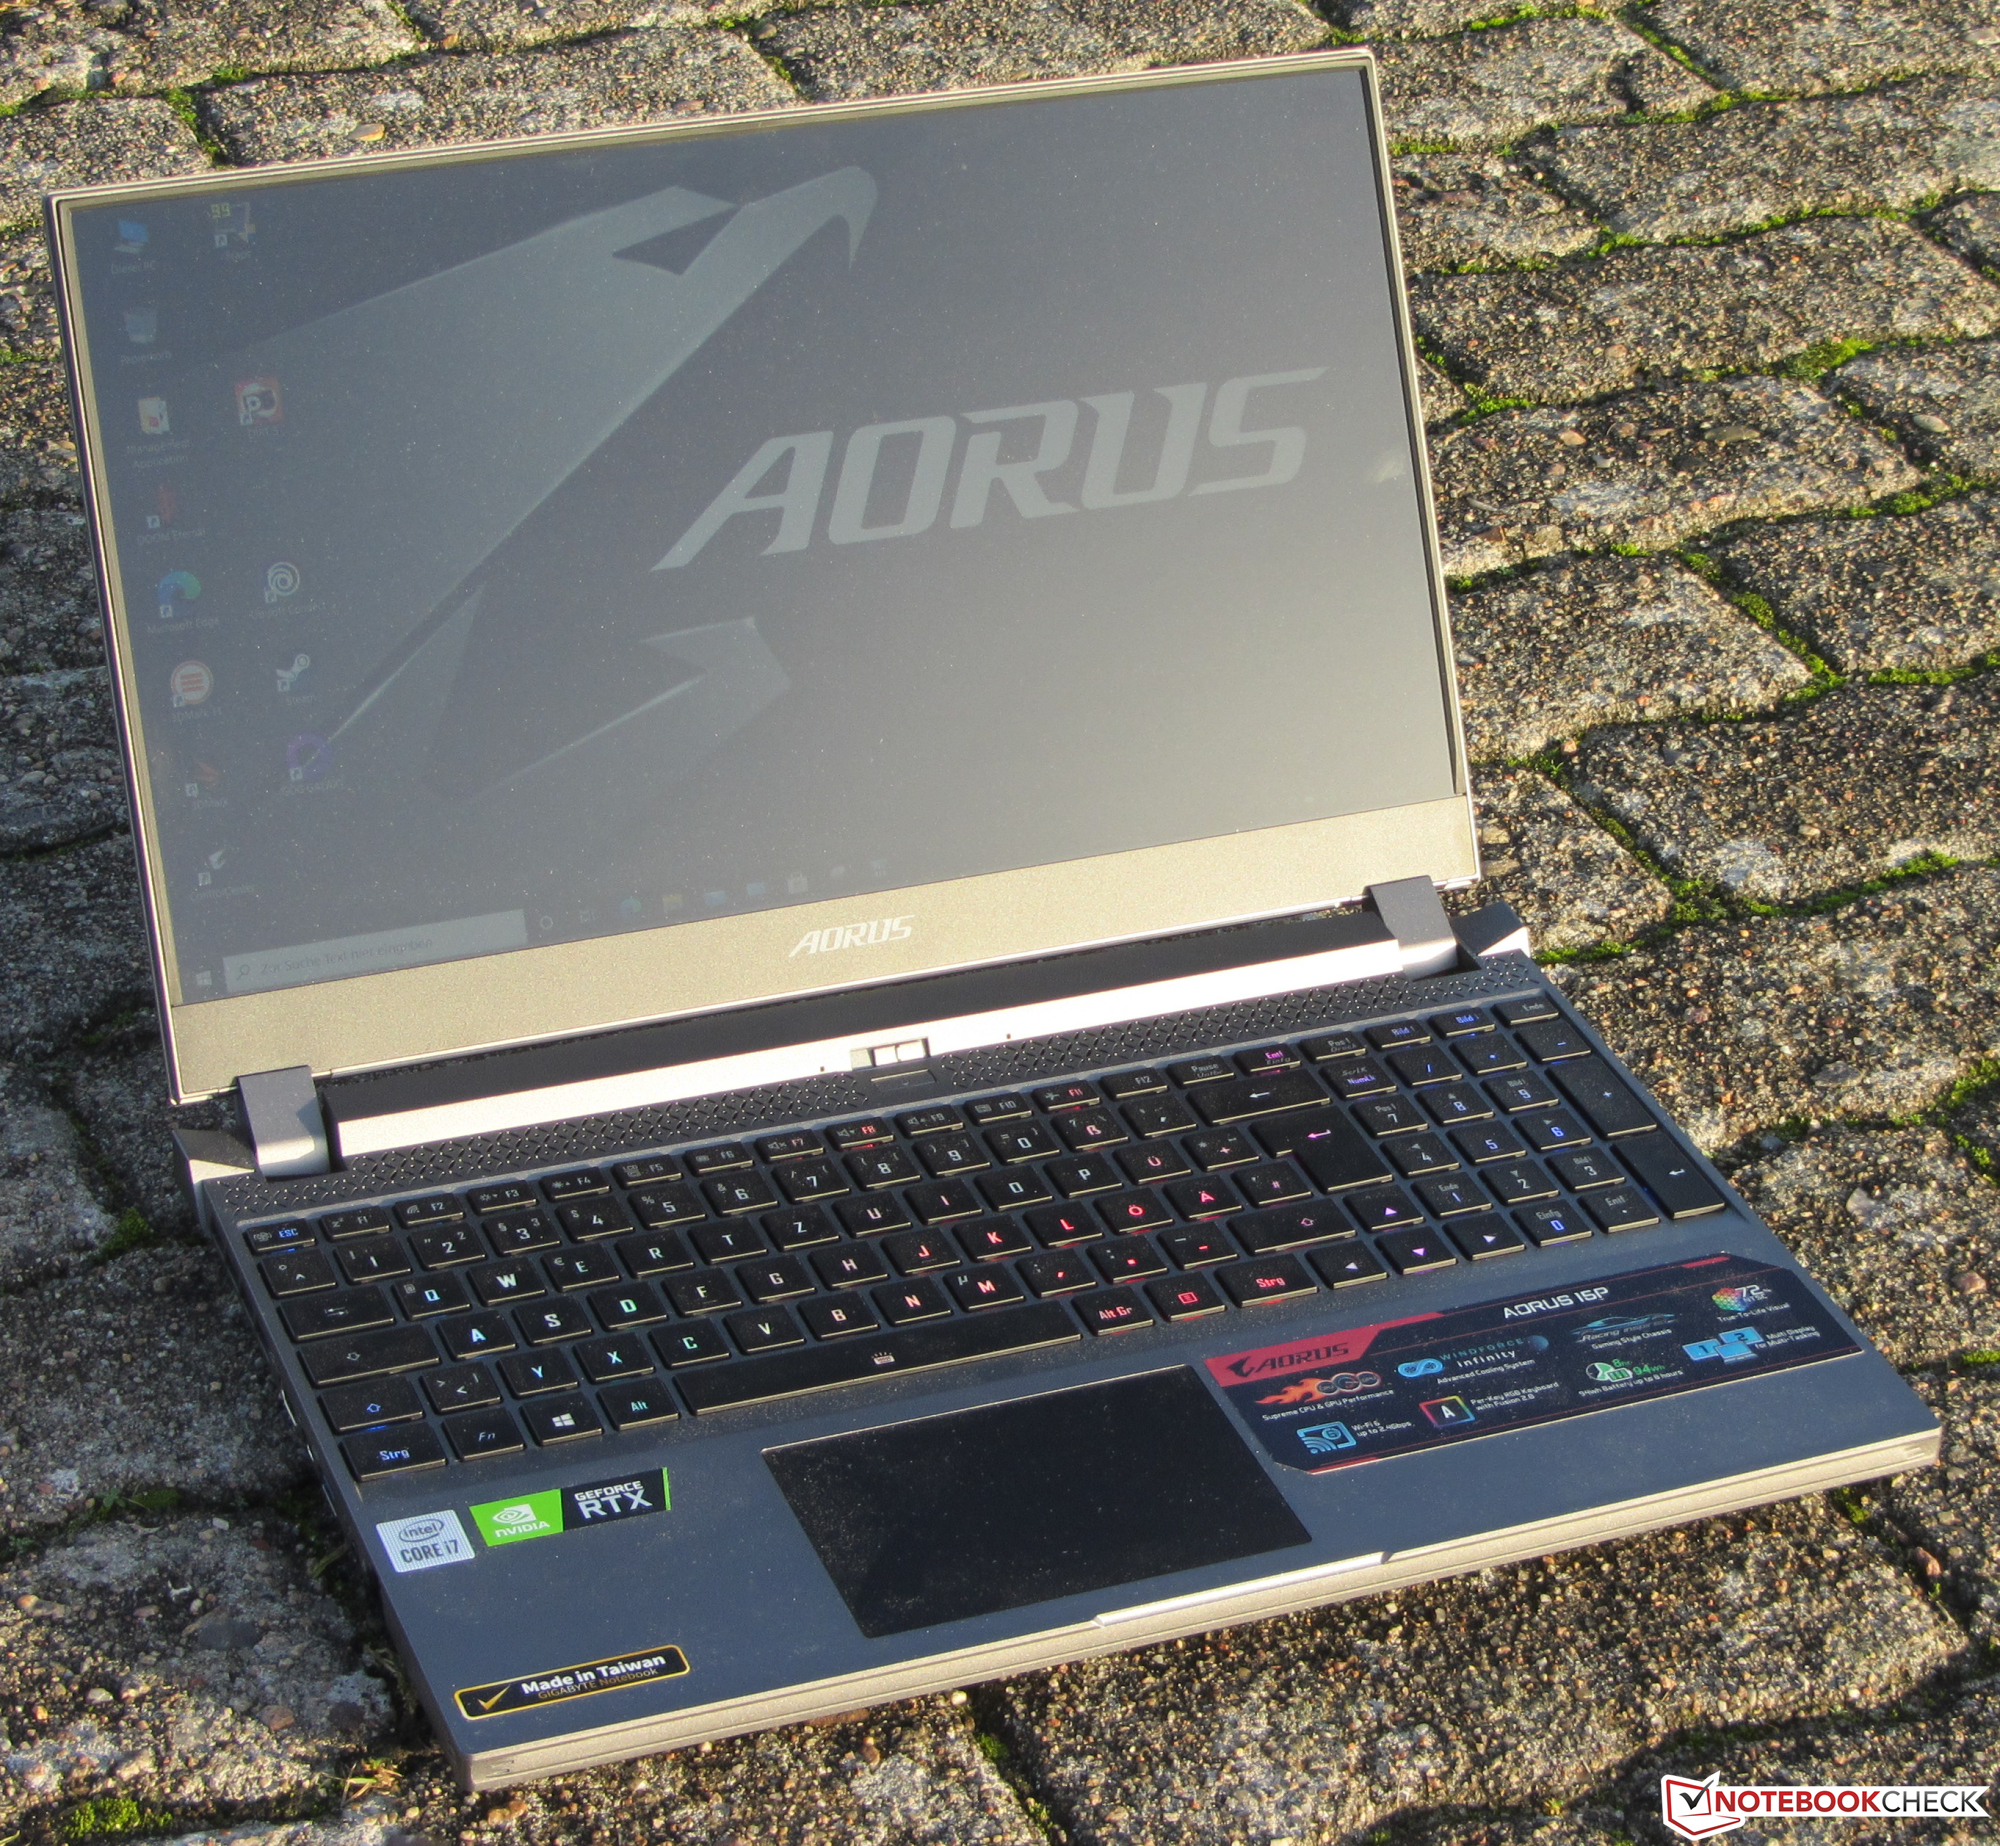
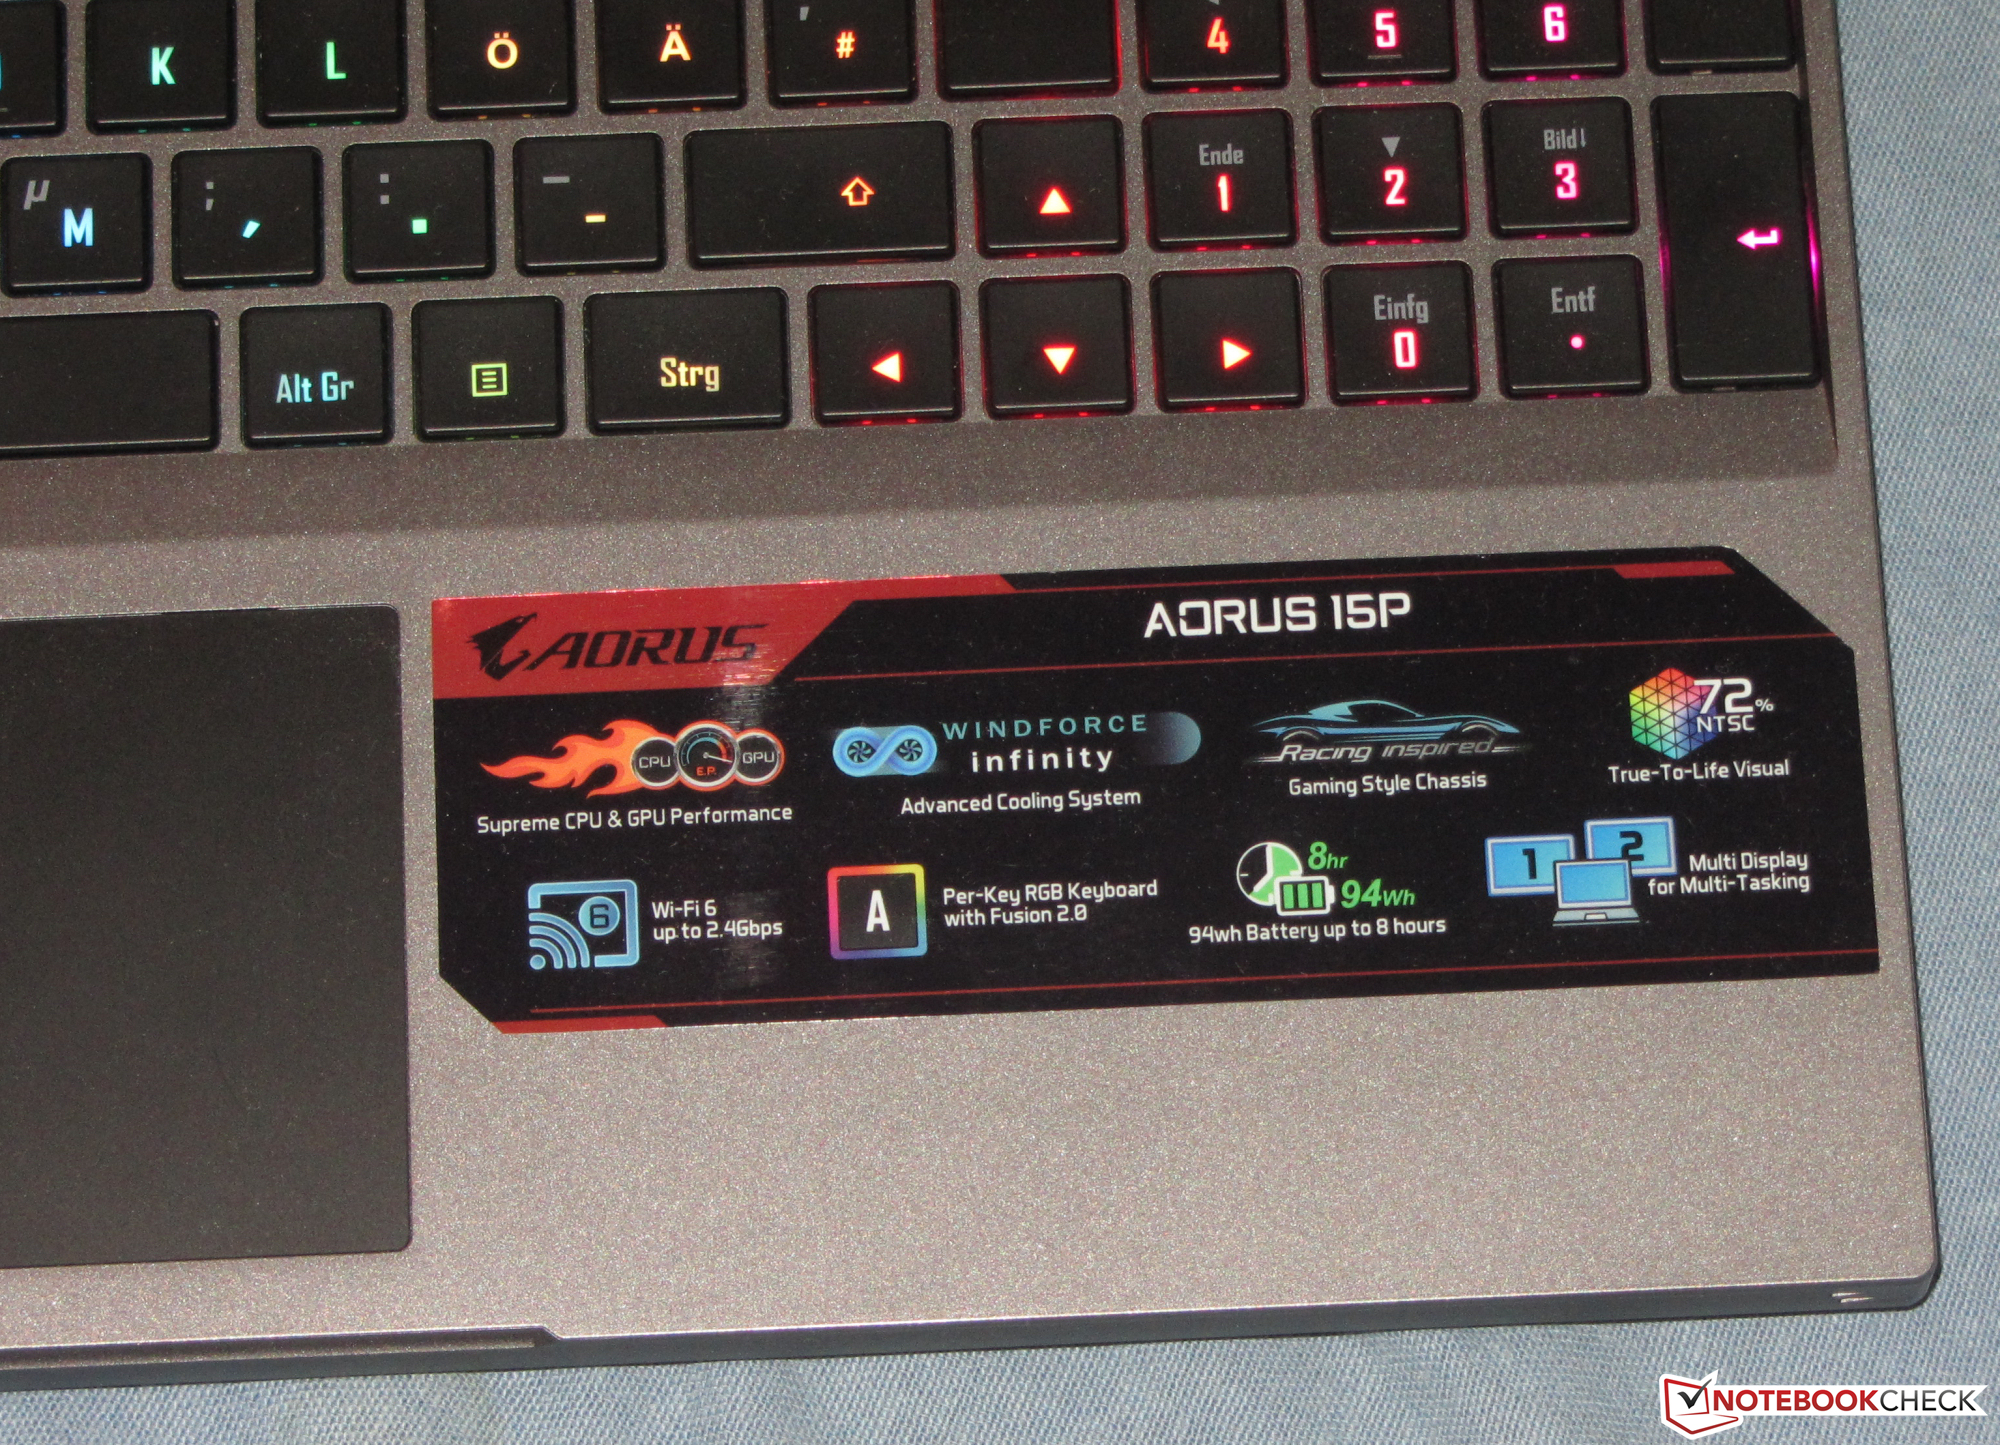
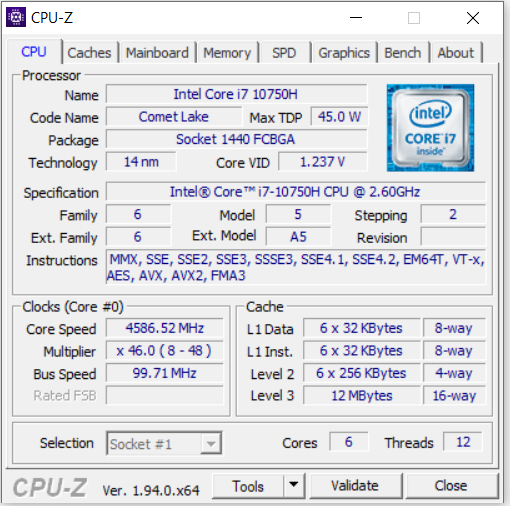
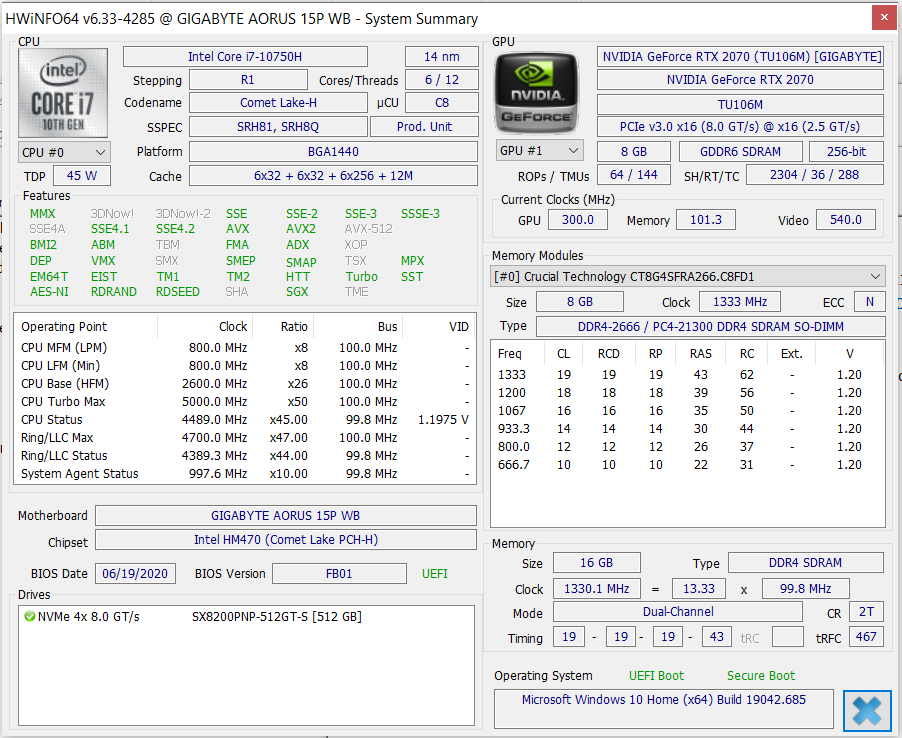
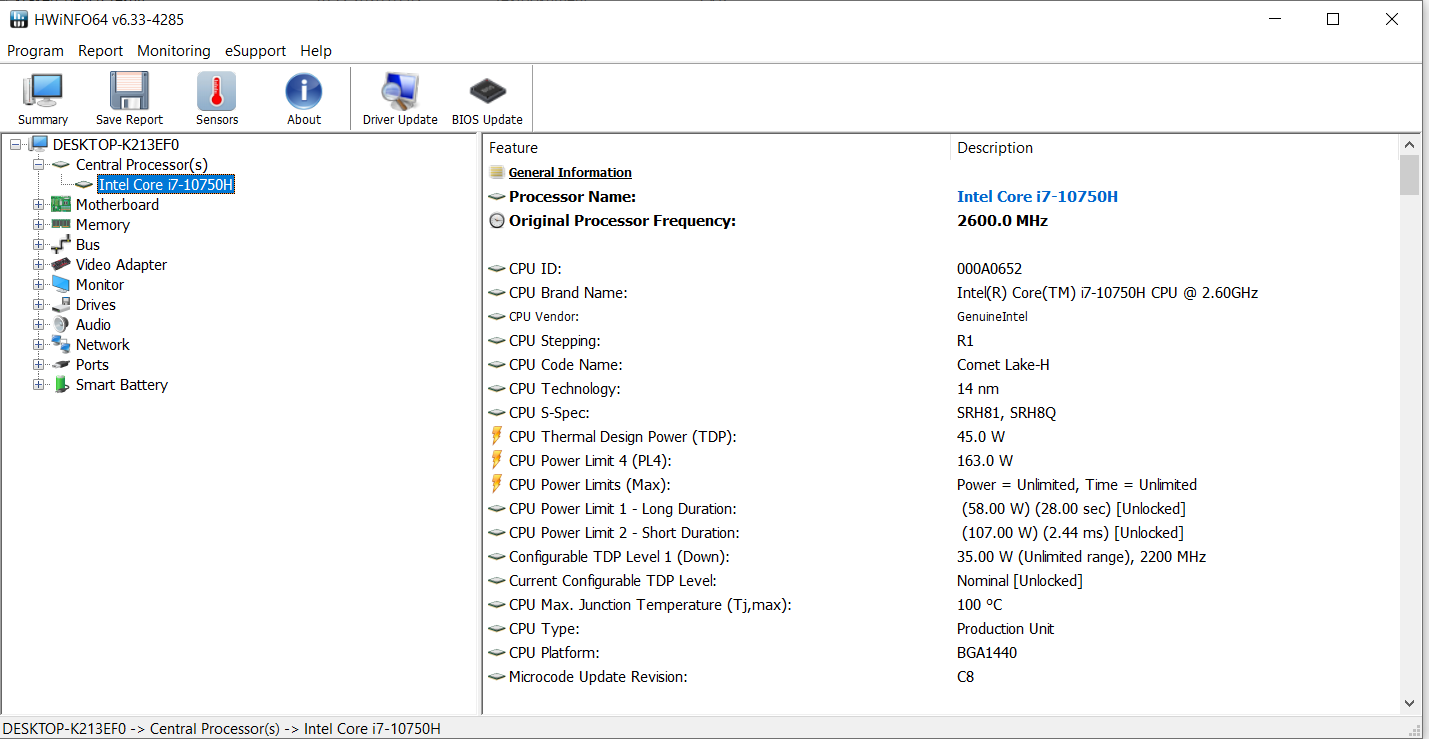
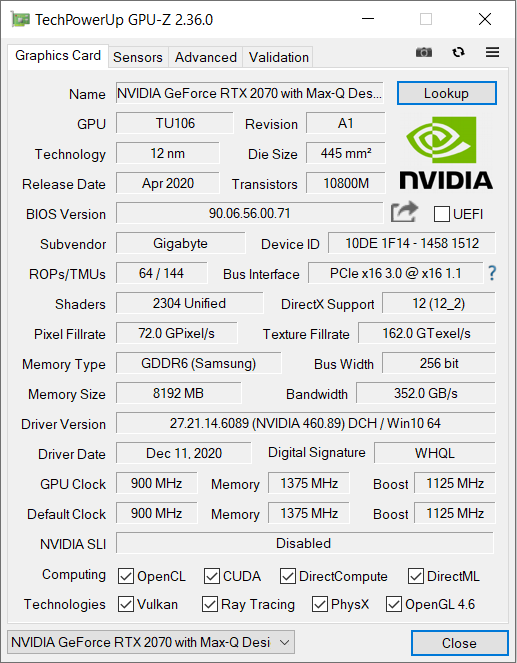
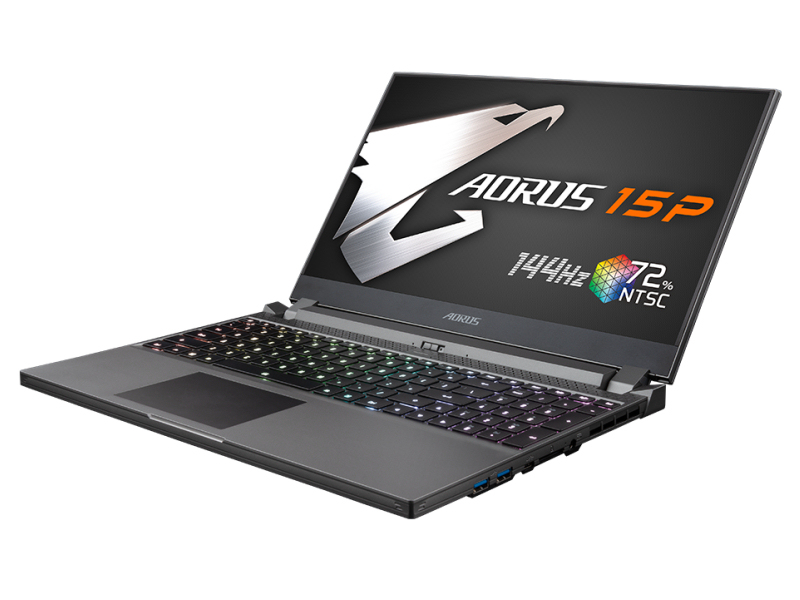
Gigabyte har släppt en kompakt spellaptop på 15.6 tum i form av Aorus 15P WB, och den kan visa alla moderna spel smidigt på sin skärm tack vare en Core i7-10750H processor och ett GeForce RTX 2070 Max-Q grafikkort. Det går oftast att välja Full HD och höga eller maximala grafikinställningar.
Aorus 15P WB är en välavrundad spellaptop som inte har några större svagheter.
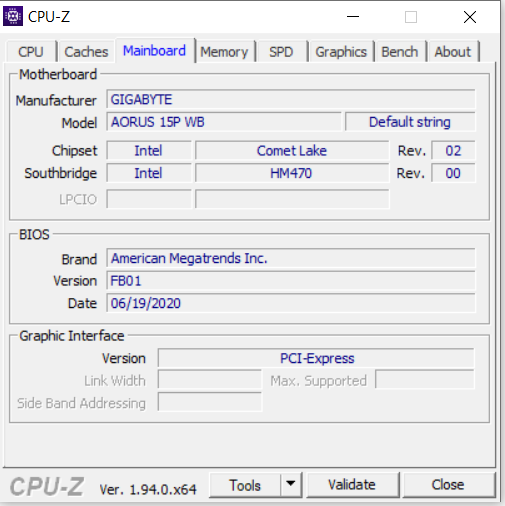
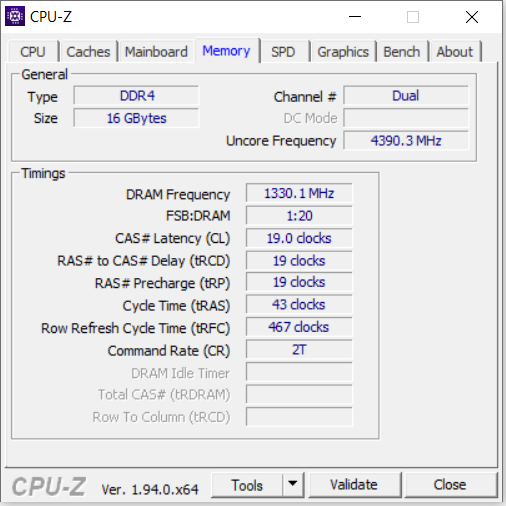
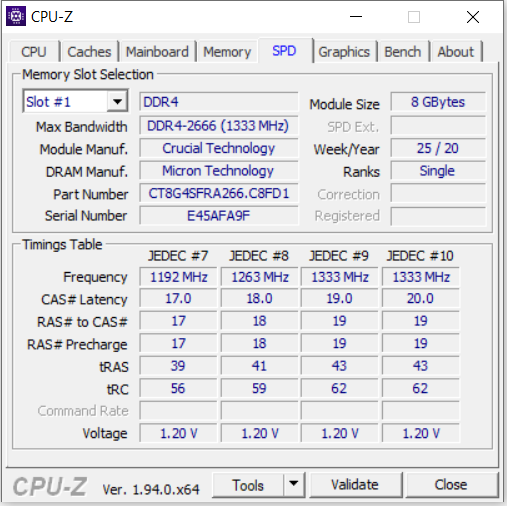
Hårdvaran har stöd av 16 GB RAM (2x 8 GB, dubbla kanaler, max 64 GB) samt en NVMe SSD på 512 GB. Lagringskapaciteten är inte direkt generös för en spellaptop. Det går dock att sätta i en andra NVMe SSD vid behov. Eftersom det är lätt att ta bort bottenplattan borde datorn vara enkel att uppgradera.
Skärmen (Full HD, IPS, 144 Hz) har stabila betraktningsvinklar, en matt yta, snabba responstider, bra färgåtergivning och ett skapligt färgomfång. Men den kunde haft högre ljusstyrka och kontrast. Tangentbordet (som har RGB-bakgrundsbelysning) visade sig passa bra för vardagsbruk. Vidare måste vi nämna den utmärkta batteritiden. En laddning är tillräckligt för en praktisk batteritid på 7-8 timmar - det finns gott om kontorslaptops som inte klarar det.
Aorus 15P WB
- 01/02/2021 v7 (old)
Sascha Mölck
Price comparison
