Test: Asus ZenBook Pro 15 UX535 - Kan fortfarande bli lite mer Zen (Sammanfattning)
Testgrupp
Gradering | Datum | Modell | Vikt | Höjd | Storlek | Upplösning | Pris |
|---|---|---|---|---|---|---|---|
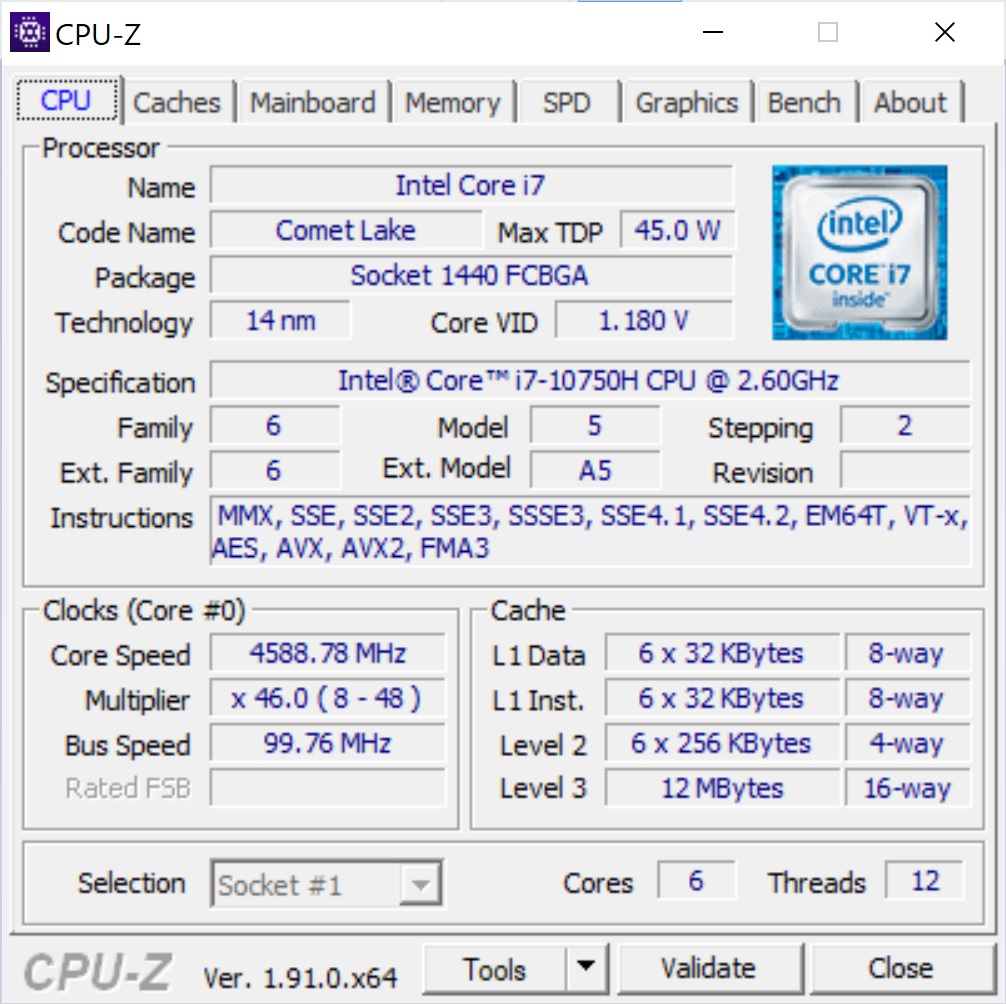
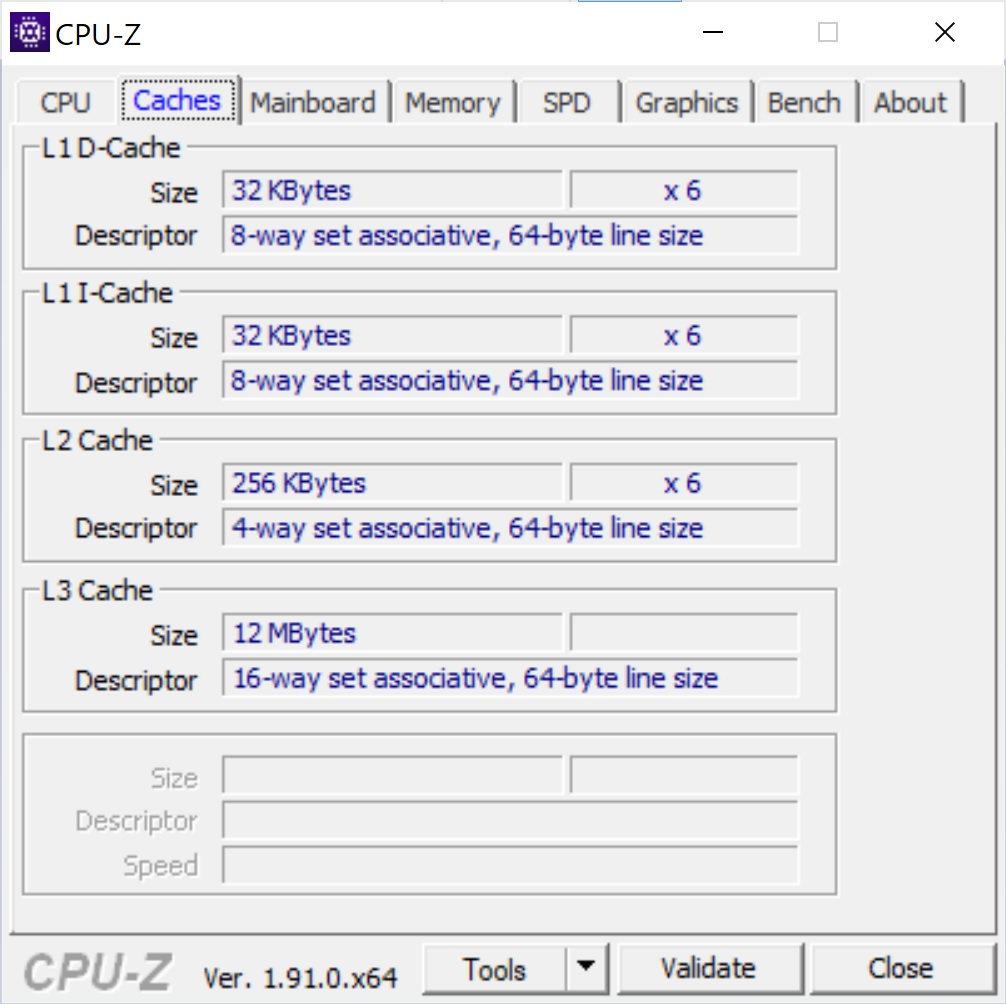
| 87 % v7 (old) | 12/2020 | Asus ZenBook UX535-M01440 i7-10750H, GeForce GTX 1650 Ti Max-Q | 2 kg | 20 mm | 15.60" | 3840x2160 | |
| 85.2 % v7 (old) | 03/2020 | Asus ZenBook 15 UX534FTC-A8190T i7-10510U, GeForce GTX 1650 Max-Q | 1.6 kg | 18.9 mm | 15.60" | 1920x1080 | |
| 90.1 % v7 (old) | 06/2020 | Dell XPS 15 9500 Core i7 4K UHD i7-10875H, GeForce GTX 1650 Ti Mobile | 2 kg | 18 mm | 15.60" | 3840x2400 | |
| 87.1 % v7 (old) | 02/2020 | Lenovo ThinkPad X1 Extreme 2019 20QV000WGE i7-9750H, GeForce GTX 1650 Mobile | 1.7 kg | 18.7 mm | 15.60" | 3840x2160 | |
| 79.8 % v7 (old) | 07/2020 | Acer Nitro 5 AN515-44-R5FT R5 4600H, GeForce GTX 1650 Ti Mobile | 2.2 kg | 24 mm | 15.60" | 1920x1080 | |
| 87.8 % v6 (old) | 06/2018 | Asus ZenBook Pro 15 UX580GE i9-8950HK, GeForce GTX 1050 Ti Mobile | 1.9 kg | 18.9 mm | 15.60" | 3840x2160 |
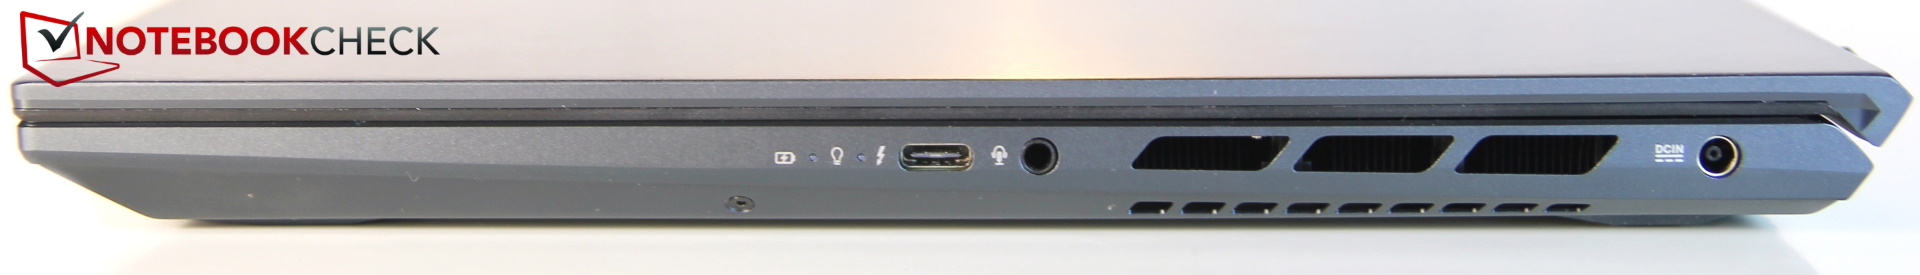
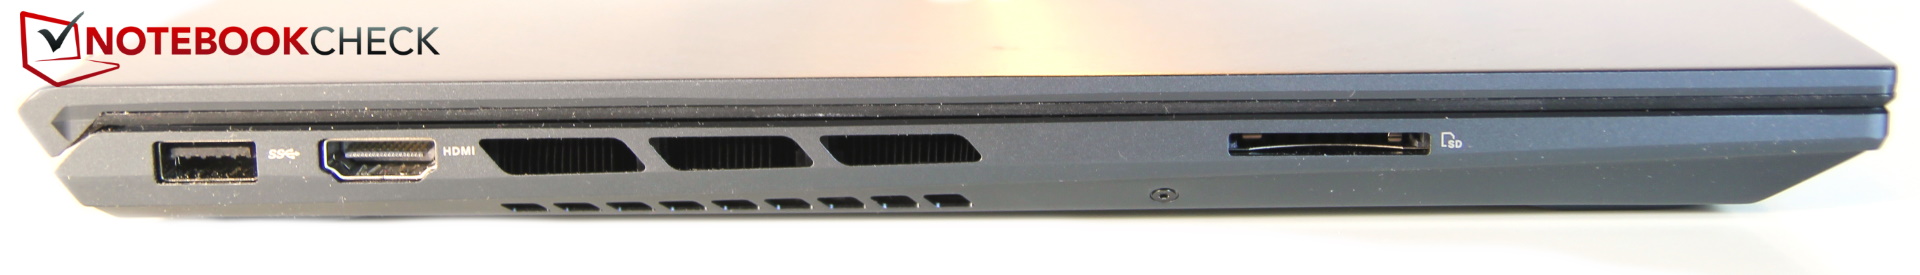
| SD Card Reader | |
| average JPG Copy Test (av. of 3 runs) | |
| Dell XPS 15 9500 Core i7 4K UHD (Toshiba Exceria Pro SDXC 64 GB UHS-II) | |
| Lenovo ThinkPad X1 Extreme 2019 20QV000WGE (Toshiba Exceria Pro SDXC 64 GB UHS-II) | |
| Genomsnitt av klass Multimedia (23 - 531, n=44, senaste 2 åren) | |
| Asus ZenBook UX535-M01440 (Toshiba Exceria Pro M501 microSDXC 64GB) | |
| Asus ZenBook Pro 15 UX580GE (Toshiba Exceria Pro M501 UHS-II) | |
| maximum AS SSD Seq Read Test (1GB) | |
| Lenovo ThinkPad X1 Extreme 2019 20QV000WGE (Toshiba Exceria Pro SDXC 64 GB UHS-II) | |
| Dell XPS 15 9500 Core i7 4K UHD (Toshiba Exceria Pro SDXC 64 GB UHS-II) | |
| Genomsnitt av klass Multimedia (27.9 - 1455, n=43, senaste 2 åren) | |
| Asus ZenBook UX535-M01440 (Toshiba Exceria Pro M501 microSDXC 64GB) | |


| |||||||||||||||||||||||||
Distribution av ljusstyrkan: 84 %
Mitt på batteriet: 397 cd/m²
Kontrast: 1149:1 (Svärta: 0.35 cd/m²)
ΔE ColorChecker Calman: 2.47 | ∀{0.5-29.43 Ø4.72}
calibrated: 2.36
ΔE Greyscale Calman: 2.26 | ∀{0.09-98 Ø4.97}
99% AdobeRGB 1998 (Argyll 1.6.3 3D)
70.1% AdobeRGB 1998 (Argyll 3D)
99.5% sRGB (Argyll 3D)
68.8% Display P3 (Argyll 3D)
Gamma: 2.49
CCT: 6285 K
| Asus ZenBook UX535-M01440 BOE0866, IPS, 3840x2160, 15.6" | Asus ZenBook 15 UX534FTC-A8190T BOE CQ NV156FHM-N63, IPS, 1920x1080, 15.6" | Dell XPS 15 9500 Core i7 4K UHD Sharp LQ156R1, IPS, 3840x2400, 15.6" | Lenovo ThinkPad X1 Extreme 2019 20QV000WGE NE156QUM-N66, IPS, 3840x2160, 15.6" | Acer Nitro 5 AN515-44-R5FT Panda LM156LF-2F01 (NCP004D), IPS, 1920x1080, 15.6" | Asus ZenBook Pro 15 UX580GE AU Optronics B156ZAN03.1, IPS, 3840x2160, 15.6" | |
|---|---|---|---|---|---|---|
| Display | -10% | 24% | 19% | -39% | 22% | |
| Display P3 Coverage (%) | 68.8 | 65 -6% | 89.7 30% | 82 19% | 41.16 -40% | 85.9 25% |
| sRGB Coverage (%) | 99.5 | 86.2 -13% | 100 1% | 99.1 0% | 61.8 -38% | 100 1% |
| AdobeRGB 1998 Coverage (%) | 70.1 | 62.9 -10% | 99.8 42% | 96.9 38% | 42.56 -39% | 99.1 41% |
| Response Times | -33% | -49% | -32% | -23% | -12% | |
| Response Time Grey 50% / Grey 80% * (ms) | 34 ? | 45 ? -32% | 54 ? -59% | 46.4 ? -36% | 40.8 ? -20% | 44 ? -29% |
| Response Time Black / White * (ms) | 24 ? | 32 ? -33% | 33.2 ? -38% | 30.4 ? -27% | 30 ? -25% | 22.8 ? 5% |
| PWM Frequency (Hz) | ||||||
| Screen | -31% | -18% | -35% | -55% | -30% | |
| Brightness middle (cd/m²) | 402 | 299 -26% | 557.9 39% | 464 15% | 287 -29% | 357.6 -11% |
| Brightness (cd/m²) | 375 | 280 -25% | 541 44% | 448 19% | 271 -28% | 350 -7% |
| Brightness Distribution (%) | 84 | 89 6% | 91 8% | 90 7% | 88 5% | 85 1% |
| Black Level * (cd/m²) | 0.35 | 0.21 40% | 0.39 -11% | 0.36 -3% | 0.25 29% | 0.35 -0% |
| Contrast (:1) | 1149 | 1424 24% | 1431 25% | 1289 12% | 1148 0% | 1022 -11% |
| Colorchecker dE 2000 * | 2.47 | 4.76 -93% | 4.54 -84% | 4.2 -70% | 4.77 -93% | 4.12 -67% |
| Colorchecker dE 2000 max. * | 4.32 | 9 -108% | 7.92 -83% | 11.4 -164% | 17.15 -297% | 9.91 -129% |
| Colorchecker dE 2000 calibrated * | 2.36 | 3.82 -62% | 0.8 66% | 3.73 -58% | 4.23 -79% | |
| Greyscale dE 2000 * | 2.26 | 3.53 -56% | 3.2 -42% | 7.2 -219% | 2.7 -19% | 1.8 20% |
| Gamma | 2.49 88% | 2.3 96% | 1.99 111% | 2.17 101% | 2.115 104% | 2.17 101% |
| CCT | 6285 103% | 7228 90% | 6451 101% | 6345 102% | 7187 90% | 6613 98% |
| Color Space (Percent of AdobeRGB 1998) (%) | 99 | 56 -43% | 89.5 -10% | 85.2 -14% | 43 -57% | 87.5 -12% |
| Color Space (Percent of sRGB) (%) | 86 | 100 | 99 | 61 | 100 | |
| Totalt genomsnitt (program/inställningar) | -25% /
-27% | -14% /
-13% | -16% /
-24% | -39% /
-47% | -7% /
-17% |
* ... mindre är bättre
Visa svarstider
| ↔ Svarstid svart till vitt | ||
|---|---|---|
| 24 ms ... stiga ↗ och falla ↘ kombinerat | ↗ 13 ms stiga | 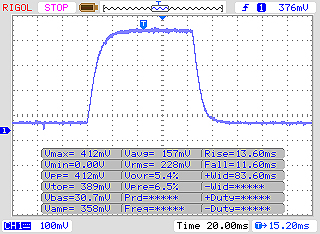 |
| ↘ 11 ms hösten | ||
| Skärmen visar bra svarsfrekvens i våra tester, men kan vara för långsam för konkurrenskraftiga spelare. I jämförelse sträcker sig alla testade enheter från 0.1 (minst) till 240 (maximalt) ms. » 54 % av alla enheter är bättre. Detta innebär att den uppmätta svarstiden är sämre än genomsnittet av alla testade enheter (19.8 ms). | ||
| ↔ Svarstid 50 % grått till 80 % grått | ||
| 34 ms ... stiga ↗ och falla ↘ kombinerat | ↗ 16 ms stiga | 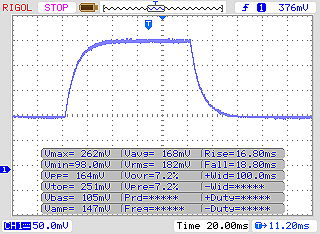 |
| ↘ 18 ms hösten | ||
| Skärmen visar långsamma svarsfrekvenser i våra tester och kommer att vara otillfredsställande för spelare. I jämförelse sträcker sig alla testade enheter från 0.165 (minst) till 636 (maximalt) ms. » 47 % av alla enheter är bättre. Det betyder att den uppmätta svarstiden liknar genomsnittet av alla testade enheter (31 ms). | ||
Skärmflimmer / PWM (Puls-Width Modulation)
| Skärmflimmer / PWM upptäcktes inte | 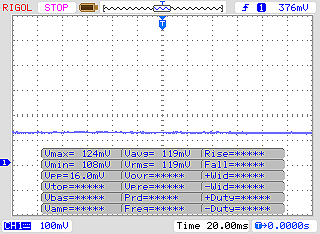 | ||
Som jämförelse: 52 % av alla testade enheter använder inte PWM för att dämpa skärmen. Om PWM upptäcktes mättes ett medelvärde av 7781 (minst: 5 - maximum: 343500) Hz. | |||
Cinebench R15: CPU Single 64Bit | CPU Multi 64Bit
Blender: v2.79 BMW27 CPU
7-Zip 18.03: 7z b 4 -mmt1 | 7z b 4
Geekbench 5.5: Single-Core | Multi-Core
HWBOT x265 Benchmark v2.2: 4k Preset
LibreOffice : 20 Documents To PDF
R Benchmark 2.5: Overall mean
| Cinebench R20 / CPU (Single Core) | |
| Genomsnitt av klass Multimedia (425 - 853, n=64, senaste 2 åren) | |
| Dell XPS 15 9500 Core i7 4K UHD | |
| Genomsnitt Intel Core i7-10750H (431 - 504, n=43) | |
| Asus ZenBook UX535-M01440 | |
| Asus ZenBook 15 UX534FTC-A8190T | |
| Acer Nitro 5 AN515-44-R5FT | |
| Cinebench R20 / CPU (Multi Core) | |
| Genomsnitt av klass Multimedia (1887 - 12912, n=64, senaste 2 åren) | |
| Dell XPS 15 9500 Core i7 4K UHD | |
| Acer Nitro 5 AN515-44-R5FT | |
| Asus ZenBook UX535-M01440 | |
| Genomsnitt Intel Core i7-10750H (1749 - 3325, n=43) | |
| Asus ZenBook 15 UX534FTC-A8190T | |
| Cinebench R15 / CPU Single 64Bit | |
| Genomsnitt av klass Multimedia (184.8 - 326, n=66, senaste 2 åren) | |
| Dell XPS 15 9500 Core i7 4K UHD | |
| Asus ZenBook UX535-M01440 | |
| Genomsnitt Intel Core i7-10750H (184 - 213, n=45) | |
| Asus ZenBook Pro 15 UX580GE | |
| Lenovo ThinkPad X1 Extreme 2019 20QV000WGE | |
| Asus ZenBook 15 UX534FTC-A8190T | |
| Acer Nitro 5 AN515-44-R5FT | |
| Cinebench R15 / CPU Multi 64Bit | |
| Genomsnitt av klass Multimedia (856 - 5224, n=68, senaste 2 åren) | |
| Acer Nitro 5 AN515-44-R5FT | |
| Dell XPS 15 9500 Core i7 4K UHD | |
| Asus ZenBook UX535-M01440 | |
| Genomsnitt Intel Core i7-10750H (804 - 1418, n=50) | |
| Asus ZenBook Pro 15 UX580GE | |
| Lenovo ThinkPad X1 Extreme 2019 20QV000WGE | |
| Asus ZenBook 15 UX534FTC-A8190T | |
| Blender / v2.79 BMW27 CPU | |
| Lenovo ThinkPad X1 Extreme 2019 20QV000WGE | |
| Asus ZenBook UX535-M01440 | |
| Genomsnitt Intel Core i7-10750H (322 - 587, n=43) | |
| Dell XPS 15 9500 Core i7 4K UHD | |
| Acer Nitro 5 AN515-44-R5FT | |
| Genomsnitt av klass Multimedia (100 - 557, n=65, senaste 2 åren) | |
| 7-Zip 18.03 / 7z b 4 -mmt1 | |
| Genomsnitt av klass Multimedia (3666 - 7545, n=63, senaste 2 åren) | |
| Dell XPS 15 9500 Core i7 4K UHD | |
| Asus ZenBook UX535-M01440 | |
| Genomsnitt Intel Core i7-10750H (4504 - 5470, n=43) | |
| Lenovo ThinkPad X1 Extreme 2019 20QV000WGE | |
| Acer Nitro 5 AN515-44-R5FT | |
| 7-Zip 18.03 / 7z b 4 | |
| Genomsnitt av klass Multimedia (26062 - 130368, n=62, senaste 2 åren) | |
| Acer Nitro 5 AN515-44-R5FT | |
| Dell XPS 15 9500 Core i7 4K UHD | |
| Genomsnitt Intel Core i7-10750H (26040 - 37345, n=43) | |
| Asus ZenBook UX535-M01440 | |
| Lenovo ThinkPad X1 Extreme 2019 20QV000WGE | |
| Geekbench 5.5 / Single-Core | |
| Genomsnitt av klass Multimedia (805 - 2974, n=62, senaste 2 åren) | |
| Dell XPS 15 9500 Core i7 4K UHD | |
| Asus ZenBook UX535-M01440 | |
| Genomsnitt Intel Core i7-10750H (1114 - 1333, n=43) | |
| Asus ZenBook 15 UX534FTC-A8190T | |
| Acer Nitro 5 AN515-44-R5FT | |
| Geekbench 5.5 / Multi-Core | |
| Genomsnitt av klass Multimedia (4652 - 20422, n=62, senaste 2 åren) | |
| Dell XPS 15 9500 Core i7 4K UHD | |
| Genomsnitt Intel Core i7-10750H (4443 - 6674, n=43) | |
| Asus ZenBook UX535-M01440 | |
| Acer Nitro 5 AN515-44-R5FT | |
| Asus ZenBook 15 UX534FTC-A8190T | |
| HWBOT x265 Benchmark v2.2 / 4k Preset | |
| Genomsnitt av klass Multimedia (5.26 - 36.1, n=63, senaste 2 åren) | |
| Dell XPS 15 9500 Core i7 4K UHD | |
| Asus ZenBook UX535-M01440 | |
| Genomsnitt Intel Core i7-10750H (5.54 - 11.6, n=43) | |
| Acer Nitro 5 AN515-44-R5FT | |
| Lenovo ThinkPad X1 Extreme 2019 20QV000WGE | |
| LibreOffice / 20 Documents To PDF | |
| Asus ZenBook UX535-M01440 | |
| Acer Nitro 5 AN515-44-R5FT | |
| Genomsnitt Intel Core i7-10750H (43.1 - 99.2, n=43) | |
| Dell XPS 15 9500 Core i7 4K UHD | |
| Genomsnitt av klass Multimedia (23.9 - 146.7, n=64, senaste 2 åren) | |
| R Benchmark 2.5 / Overall mean | |
| Acer Nitro 5 AN515-44-R5FT | |
| Genomsnitt Intel Core i7-10750H (0.578 - 0.708, n=42) | |
| Asus ZenBook UX535-M01440 | |
| Dell XPS 15 9500 Core i7 4K UHD | |
| Genomsnitt av klass Multimedia (0.3604 - 0.947, n=63, senaste 2 åren) | |
* ... mindre är bättre
| PCMark 8 Home Score Accelerated v2 | 3357 poäng | |
| PCMark 8 Work Score Accelerated v2 | 4272 poäng | |
| PCMark 10 Score | 4887 poäng | |
Hjälp | ||
| DPC Latencies / LatencyMon - interrupt to process latency (max), Web, Youtube, Prime95 | |
| Dell XPS 15 9500 Core i7 4K UHD | |
| Acer Nitro 5 AN515-44-R5FT | |
| Asus ZenBook UX535-M01440 | |
* ... mindre är bättre
| Asus ZenBook UX535-M01440 WDC PC SN730 SDBPNTY-1T00 | Asus ZenBook 15 UX534FTC-A8190T Samsung SSD PM981 MZVLB1T0HALR | Dell XPS 15 9500 Core i7 4K UHD SK Hynix PC611 512GB | Lenovo ThinkPad X1 Extreme 2019 20QV000WGE Samsung SSD PM981 MZVLB512HAJQ | Acer Nitro 5 AN515-44-R5FT SK Hynix BC511 HFM512GDJTNI | Asus ZenBook Pro 15 UX580GE Samsung SSD PM961 1TB M.2 PCIe 3.0 x4 NVMe (MZVLW1T0) | Genomsnitt WDC PC SN730 SDBPNTY-1T00 | |
|---|---|---|---|---|---|---|---|
| CrystalDiskMark 5.2 / 6 | 12% | 4% | 14% | -17% | -5% | 17% | |
| Write 4K (MB/s) | 110 | 138.1 26% | 123.3 12% | 148.1 35% | 94.7 -14% | 125 14% | 139.9 ? 27% |
| Read 4K (MB/s) | 43.44 | 45.89 6% | 41.85 -4% | 47.31 9% | 38.91 -10% | 44.68 3% | 44.5 ? 2% |
| Write Seq (MB/s) | 1957 | 2147 10% | 2054 5% | 1414 -28% | 1056 -46% | 1059 -46% | 2346 ? 20% |
| Read Seq (MB/s) | 1615 | 2188 35% | 1617 0% | 1320 -18% | 1183 -27% | 772 -52% | 2102 ? 30% |
| Write 4K Q32T1 (MB/s) | 341.6 | 427.8 25% | 413 21% | 493.6 44% | 445.3 30% | 507 48% | 442 ? 29% |
| Read 4K Q32T1 (MB/s) | 364.3 | 404 11% | 377.5 4% | 594 63% | 477.7 31% | 614 69% | 460 ? 26% |
| Write Seq Q32T1 (MB/s) | 3081 | 2396 -22% | 2705 -12% | 2970 -4% | 1063 -65% | 1763 -43% | 3049 ? -1% |
| Read Seq Q32T1 (MB/s) | 3251 | 3454 6% | 3442 6% | 3472 7% | 2154 -34% | 2171 -33% | 3285 ? 1% |
| AS SSD | 20% | -10% | 29% | -16% | 6% | 20% | |
| Seq Read (MB/s) | 1886 | 2643 40% | 2072 10% | 2352 25% | 1504 -20% | 2099 11% | 2606 ? 38% |
| Seq Write (MB/s) | 1221 | 1533 26% | 1486 22% | 2106 72% | 1064 -13% | 1729 42% | 1935 ? 58% |
| 4K Read (MB/s) | 41.16 | 49.12 19% | 47.41 15% | 55 34% | 51.5 25% | 37.78 -8% | 42.9 ? 4% |
| 4K Write (MB/s) | 101.2 | 134.7 33% | 117.6 16% | 138.1 36% | 123.2 22% | 100.9 0% | 129.1 ? 28% |
| 4K-64 Read (MB/s) | 1022 | 1028 1% | 967 -5% | 1265 24% | 703 -31% | 1431 40% | 1361 ? 33% |
| 4K-64 Write (MB/s) | 1618 | 1353 -16% | 715 -56% | 1952 21% | 730 -55% | 1273 -21% | 1920 ? 19% |
| Access Time Read * (ms) | 0.058 | 0.033 43% | 0.057 2% | 0.053 9% | 0.064 -10% | 0.04 31% | 0.0689 ? -19% |
| Access Time Write * (ms) | 0.037 | 0.028 24% | 0.096 -159% | 0.027 27% | 0.031 16% | 0.036 3% | 0.06215 ? -68% |
| Score Read (Points) | 1252 | 1342 7% | 1222 -2% | 1556 24% | 905 -28% | 1679 34% | 1664 ? 33% |
| Score Write (Points) | 1841 | 1641 -11% | 981 -47% | 2301 25% | 960 -48% | 1547 -16% | 2242 ? 22% |
| Score Total (Points) | 3706 | 3622 -2% | 2809 -24% | 4650 25% | 2321 -37% | 4065 10% | 4726 ? 28% |
| Copy ISO MB/s (MB/s) | 1611 | 2226 38% | 1999 24% | 1045 -35% | 2041 ? 27% | ||
| Copy Program MB/s (MB/s) | 509 | 506 -1% | 627 23% | 430.9 -15% | 552 ? 8% | ||
| Copy Game MB/s (MB/s) | 677 | 1230 82% | 1001 48% | 728 8% | 1183 ? 75% | ||
| Totalt genomsnitt (program/inställningar) | 16% /
17% | -3% /
-5% | 22% /
23% | -17% /
-17% | 1% /
2% | 19% /
19% |
* ... mindre är bättre

DiskSpd Read Loop, Queue Depth 8
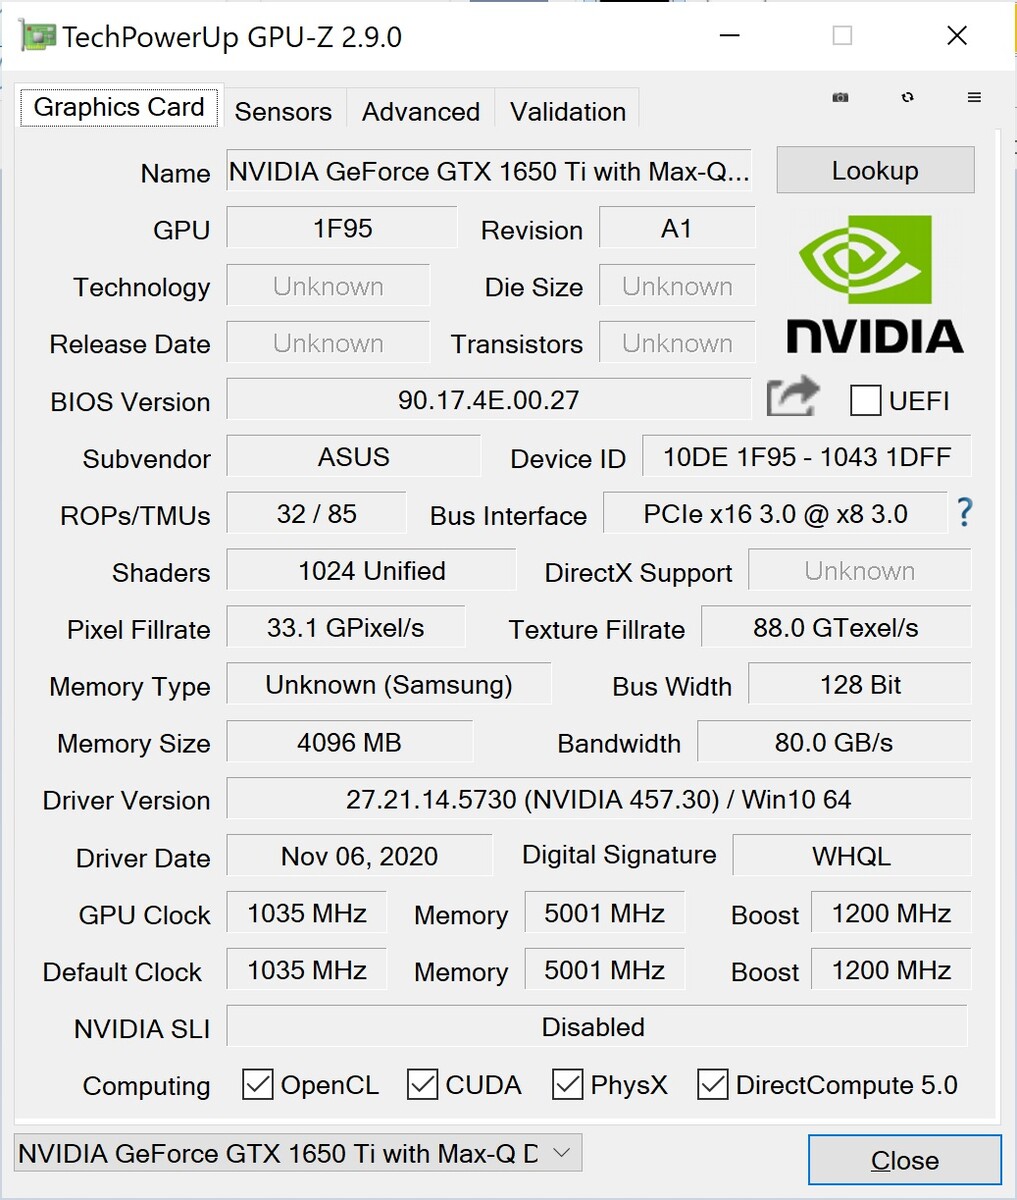
| 3DMark 11 Performance | 10610 poäng | |
| 3DMark Cloud Gate Standard Score | 18333 poäng | |
| 3DMark Fire Strike Score | 7432 poäng | |
| 3DMark Time Spy Score | 3236 poäng | |
Hjälp | ||
| Rise of the Tomb Raider | |
| 1024x768 Lowest Preset | |
| Asus ZenBook UX535-M01440 | |
| Lenovo ThinkPad X1 Extreme 2019 20QV000WGE | |
| Genomsnitt NVIDIA GeForce GTX 1650 Ti Max-Q (89.7 - 163.4, n=2) | |
| 1366x768 Medium Preset AF:2x | |
| Asus ZenBook UX535-M01440 | |
| Lenovo ThinkPad X1 Extreme 2019 20QV000WGE | |
| Genomsnitt NVIDIA GeForce GTX 1650 Ti Max-Q (84.7 - 107.4, n=2) | |
| Asus ZenBook Pro 15 UX580GE | |
| 1920x1080 High Preset AA:FX AF:4x | |
| Asus ZenBook UX535-M01440 | |
| Genomsnitt NVIDIA GeForce GTX 1650 Ti Max-Q (58.1 - 60.5, n=2) | |
| Lenovo ThinkPad X1 Extreme 2019 20QV000WGE | |
| Asus ZenBook Pro 15 UX580GE | |
| 1920x1080 Very High Preset AA:FX AF:16x | |
| Genomsnitt NVIDIA GeForce GTX 1650 Ti Max-Q (48.9 - 49.1, n=2) | |
| Asus ZenBook UX535-M01440 | |
| Lenovo ThinkPad X1 Extreme 2019 20QV000WGE | |
| Asus ZenBook Pro 15 UX580GE | |
| låg | med. | hög | ultra | 4K | |
|---|---|---|---|---|---|
| The Witcher 3 (2015) | 167.9 | 100.3 | 55 | 30.7 | 16.8 |
| Dota 2 Reborn (2015) | 144 | 127 | 112 | 106 | |
| Rise of the Tomb Raider (2016) | 163.4 | 107.4 | 60.5 | 48.9 | 19.9 |
| X-Plane 11.11 (2018) | 86.6 | 79.4 | 67.5 | ||
| Shadow of the Tomb Raider (2018) | 115 | 55 | 46 | 40 | 15 |
Ljudnivå
| Låg belastning |
| 24.6 / 24.6 / 24.6 dB(A) |
| Hög belastning |
| 41.3 / 41.4 dB(A) |
 | ||
30 dB tyst 40 dB(A) hörbar 50 dB(A) högt ljud |
||
min: | ||
| Asus ZenBook UX535-M01440 GeForce GTX 1650 Ti Max-Q, i7-10750H, WDC PC SN730 SDBPNTY-1T00 | Asus ZenBook 15 UX534FTC-A8190T GeForce GTX 1650 Max-Q, i7-10510U, Samsung SSD PM981 MZVLB1T0HALR | Dell XPS 15 9500 Core i7 4K UHD GeForce GTX 1650 Ti Mobile, i7-10875H, SK Hynix PC611 512GB | Lenovo ThinkPad X1 Extreme 2019 20QV000WGE GeForce GTX 1650 Mobile, i7-9750H, Samsung SSD PM981 MZVLB512HAJQ | Acer Nitro 5 AN515-44-R5FT GeForce GTX 1650 Ti Mobile, R5 4600H, SK Hynix BC511 HFM512GDJTNI | Asus ZenBook Pro 15 UX580GE GeForce GTX 1050 Ti Mobile, i9-8950HK, Samsung SSD PM961 1TB M.2 PCIe 3.0 x4 NVMe (MZVLW1T0) | |
|---|---|---|---|---|---|---|
| Noise | -8% | -12% | -4% | -22% | -13% | |
| av / miljö * (dB) | 24.6 | 30.3 -23% | 28.4 -15% | 28.5 -16% | 30 -22% | 28 -14% |
| Idle Minimum * (dB) | 24.6 | 30.3 -23% | 28.4 -15% | 28.5 -16% | 30 -22% | 28.6 -16% |
| Idle Average * (dB) | 24.6 | 30.3 -23% | 28.4 -15% | 28.5 -16% | 32 -30% | 29.9 -22% |
| Idle Maximum * (dB) | 24.6 | 30.9 -26% | 28.4 -15% | 28.5 -16% | 34 -38% | 30.5 -24% |
| Load Average * (dB) | 41.3 | 31.3 24% | 46 -11% | 36.3 12% | 46 -11% | 42.5 -3% |
| Witcher 3 ultra * (dB) | 42 | 38.1 9% | 42 -0% | 36.3 14% | 47 -12% | 44.8 -7% |
| Load Maximum * (dB) | 41.4 | 38.2 8% | 47.1 -14% | 36.3 12% | 49 -18% | 44.8 -8% |
* ... mindre är bättre
(+) Den maximala temperaturen på ovansidan är 37.8 °C / 100 F, jämfört med genomsnittet av 36.8 °C / 98 F , allt från 21 till 71 °C för klassen Multimedia.
(±) Botten värms upp till maximalt 44.2 °C / 112 F, jämfört med genomsnittet av 39.1 °C / 102 F
(+) Vid tomgångsbruk är medeltemperaturen för ovansidan 25.8 °C / 78 F, jämfört med enhetsgenomsnittet på 31.3 °C / ### class_avg_f### F.
(+) När du spelar The Witcher 3 är medeltemperaturen för ovansidan 31.7 °C / 89 F, jämfört med enhetsgenomsnittet på 31.3 °C / ## #class_avg_f### F.
(+) Handledsstöden och pekplattan är kallare än hudtemperaturen med maximalt 29.6 °C / 85.3 F och är därför svala att ta på.
(±) Medeltemperaturen för handledsstödsområdet på liknande enheter var 28.7 °C / 83.7 F (-0.9 °C / -1.6 F).
| Asus ZenBook UX535-M01440 GeForce GTX 1650 Ti Max-Q, i7-10750H, WDC PC SN730 SDBPNTY-1T00 | Asus ZenBook 15 UX534FTC-A8190T GeForce GTX 1650 Max-Q, i7-10510U, Samsung SSD PM981 MZVLB1T0HALR | Dell XPS 15 9500 Core i7 4K UHD GeForce GTX 1650 Ti Mobile, i7-10875H, SK Hynix PC611 512GB | Lenovo ThinkPad X1 Extreme 2019 20QV000WGE GeForce GTX 1650 Mobile, i7-9750H, Samsung SSD PM981 MZVLB512HAJQ | Acer Nitro 5 AN515-44-R5FT GeForce GTX 1650 Ti Mobile, R5 4600H, SK Hynix BC511 HFM512GDJTNI | Asus ZenBook Pro 15 UX580GE GeForce GTX 1050 Ti Mobile, i9-8950HK, Samsung SSD PM961 1TB M.2 PCIe 3.0 x4 NVMe (MZVLW1T0) | |
|---|---|---|---|---|---|---|
| Heat | 4% | -15% | -5% | -11% | -18% | |
| Maximum Upper Side * (°C) | 37.8 | 41.4 -10% | 44 -16% | 46.8 -24% | 49 -30% | 42.4 -12% |
| Maximum Bottom * (°C) | 44.2 | 40.3 9% | 48.8 -10% | 52.4 -19% | 50 -13% | 50.8 -15% |
| Idle Upper Side * (°C) | 28.1 | 25.7 9% | 33 -17% | 24.7 12% | 28 -0% | 33 -17% |
| Idle Bottom * (°C) | 27.7 | 25.8 7% | 32.4 -17% | 25 10% | 28 -1% | 35.2 -27% |
* ... mindre är bättre
Asus ZenBook UX535-M01440 ljudanalys
(±) | högtalarljudstyrkan är genomsnittlig men bra (74 dB)
Bas 100 - 315 Hz
(-) | nästan ingen bas - i genomsnitt 18.7% lägre än medianen
(±) | linjäriteten för basen är genomsnittlig (13.6% delta till föregående frekvens)
Mellan 400 - 2000 Hz
(+) | balanserad mellan - endast 1.8% från medianen
(+) | mids är linjära (4.5% delta till föregående frekvens)
Högsta 2 - 16 kHz
(±) | högre toppar - i genomsnitt 5.6% högre än medianen
(±) | linjäriteten för toppar är genomsnittlig (7.3% delta till föregående frekvens)
Totalt 100 - 16 000 Hz
(±) | linjäriteten för det totala ljudet är genomsnittlig (18% skillnad mot median)
Jämfört med samma klass
» 54% av alla testade enheter i den här klassen var bättre, 7% liknande, 39% sämre
» Den bästa hade ett delta på 5%, genomsnittet var 17%, sämst var 45%
Jämfört med alla testade enheter
» 38% av alla testade enheter var bättre, 8% liknande, 54% sämre
» Den bästa hade ett delta på 4%, genomsnittet var 24%, sämst var 134%
Apple MacBook 12 (Early 2016) 1.1 GHz ljudanalys
(+) | högtalare kan spela relativt högt (83.6 dB)
Bas 100 - 315 Hz
(±) | reducerad bas - i genomsnitt 11.3% lägre än medianen
(±) | linjäriteten för basen är genomsnittlig (14.2% delta till föregående frekvens)
Mellan 400 - 2000 Hz
(+) | balanserad mellan - endast 2.4% från medianen
(+) | mids är linjära (5.5% delta till föregående frekvens)
Högsta 2 - 16 kHz
(+) | balanserade toppar - endast 2% från medianen
(+) | toppar är linjära (4.5% delta till föregående frekvens)
Totalt 100 - 16 000 Hz
(+) | det totala ljudet är linjärt (10.2% skillnad mot median)
Jämfört med samma klass
» 7% av alla testade enheter i den här klassen var bättre, 2% liknande, 91% sämre
» Den bästa hade ett delta på 5%, genomsnittet var 18%, sämst var 53%
Jämfört med alla testade enheter
» 5% av alla testade enheter var bättre, 1% liknande, 94% sämre
» Den bästa hade ett delta på 4%, genomsnittet var 24%, sämst var 134%
| Av/Standby | |
| Låg belastning | |
| Hög belastning |
|
Förklaring:
min: | |
| Asus ZenBook UX535-M01440 i7-10750H, GeForce GTX 1650 Ti Max-Q, WDC PC SN730 SDBPNTY-1T00, IPS, 3840x2160, 15.6" | Asus ZenBook 15 UX534FTC-A8190T i7-10510U, GeForce GTX 1650 Max-Q, Samsung SSD PM981 MZVLB1T0HALR, IPS, 1920x1080, 15.6" | Dell XPS 15 9500 Core i7 4K UHD i7-10875H, GeForce GTX 1650 Ti Mobile, SK Hynix PC611 512GB, IPS, 3840x2400, 15.6" | Lenovo ThinkPad X1 Extreme 2019 20QV000WGE i7-9750H, GeForce GTX 1650 Mobile, Samsung SSD PM981 MZVLB512HAJQ, IPS, 3840x2160, 15.6" | Acer Nitro 5 AN515-44-R5FT R5 4600H, GeForce GTX 1650 Ti Mobile, SK Hynix BC511 HFM512GDJTNI, IPS, 1920x1080, 15.6" | Asus ZenBook Pro 15 UX580GE i9-8950HK, GeForce GTX 1050 Ti Mobile, Samsung SSD PM961 1TB M.2 PCIe 3.0 x4 NVMe (MZVLW1T0), IPS, 3840x2160, 15.6" | Genomsnitt NVIDIA GeForce GTX 1650 Ti Max-Q | Genomsnitt av klass Multimedia | |
|---|---|---|---|---|---|---|---|---|
| Power Consumption | 23% | -32% | -39% | 2% | -62% | -18% | 3% | |
| Idle Minimum * (Watt) | 4.4 | 2.8 36% | 5.7 -30% | 8.5 -93% | 5 -14% | 11.7 -166% | 7.23 ? -64% | 5.64 ? -28% |
| Idle Average * (Watt) | 9.8 | 7.7 21% | 13.5 -38% | 14.7 -50% | 8 18% | 18.5 -89% | 12.6 ? -29% | 10 ? -2% |
| Idle Maximum * (Watt) | 14.5 | 9.4 35% | 19.6 -35% | 19.4 -34% | 13 10% | 22.8 -57% | 16.3 ? -12% | 12.2 ? 16% |
| Load Average * (Watt) | 83 | 57 31% | 114.1 -37% | 89.6 -8% | 69 17% | 97.5 -17% | 80.6 ? 3% | 64.8 ? 22% |
| Witcher 3 ultra * (Watt) | 67 | 62 7% | 93 -39% | 96.1 -43% | 78 -16% | 102.9 -54% | ||
| Load Maximum * (Watt) | 123 | 116 6% | 135.2 -10% | 129.8 -6% | 124 -1% | 111.1 10% | 107.7 ? 12% | 111.7 ? 9% |
* ... mindre är bättre
| Asus ZenBook UX535-M01440 i7-10750H, GeForce GTX 1650 Ti Max-Q, 96 Wh | Asus ZenBook 15 UX534FTC-A8190T i7-10510U, GeForce GTX 1650 Max-Q, 71 Wh | Dell XPS 15 9500 Core i7 4K UHD i7-10875H, GeForce GTX 1650 Ti Mobile, 86 Wh | Lenovo ThinkPad X1 Extreme 2019 20QV000WGE i7-9750H, GeForce GTX 1650 Mobile, 80 Wh | Acer Nitro 5 AN515-44-R5FT R5 4600H, GeForce GTX 1650 Ti Mobile, 57.48 Wh | Asus ZenBook Pro 15 UX580GE i9-8950HK, GeForce GTX 1050 Ti Mobile, 71 Wh | Genomsnitt av klass Multimedia | |
|---|---|---|---|---|---|---|---|
| Batteridrifttid | 23% | 5% | -51% | -23% | -32% | 20% | |
| Reader / Idle (h) | 18.3 | 27.2 49% | 23 26% | 13.8 -25% | 14 -23% | 25.2 ? 38% | |
| H.264 (h) | 11.9 | 11.9 0% | 4.7 -61% | 16.4 ? 38% | |||
| WiFi v1.3 (h) | 10.1 | 12.4 23% | 9.1 -10% | 4.8 -52% | 8.7 -14% | 6.3 -38% | 12 ? 19% |
| Load (h) | 2 | 2.4 20% | 2 0% | 1.2 -40% | 1.4 -30% | 1.3 -35% | 1.675 ? -16% |
För
Emot
Omdöme - ScreenPad är en unik funktion, Ryzen kunde varit en förbättring
Läs den fullständiga versionen av den här recensionen på engelska här.
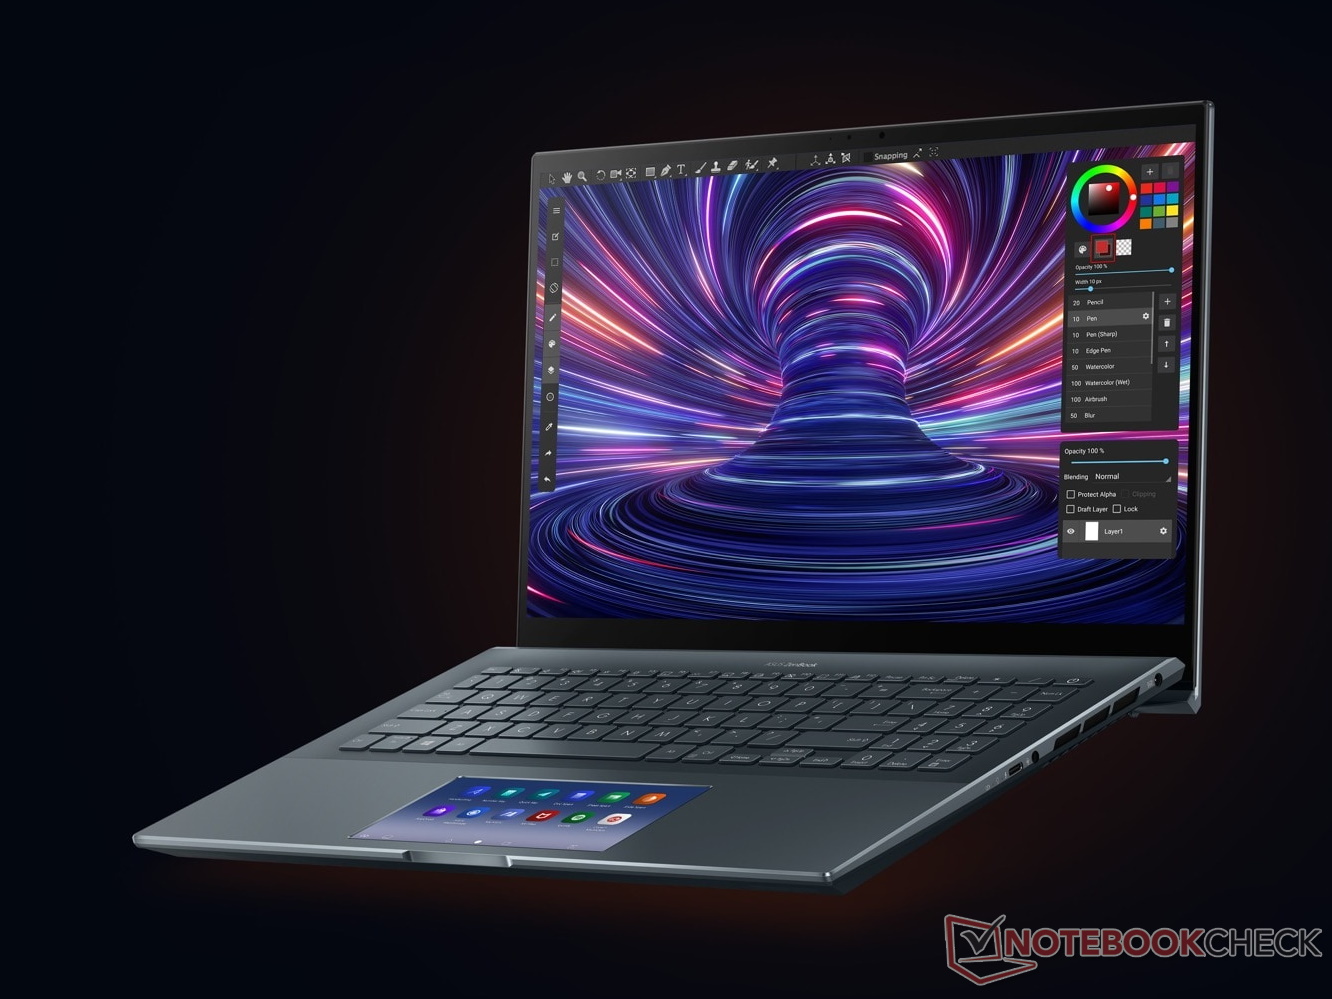
ZenBook Pro 15 UX535 känns högkvalitativ och lyckas övertyga med många positiva egenskaper, exempelvis en 4K-skärm med tunn infattning och exakta färger, bra batteritid samt återhållsam energiförbrukning och kylning. ScreenPad-skärmen som är inbyggd i styrplattan fångar verkligen blicken och ger användbara extrakontroller åt kreatörer.
Faktum är att den inte har några negativa egenskaper, men det finns definitivt saker vi störde oss på. Att man först måste ta bort fastlimmade gummifötter för att komma åt de dolda skruvarna vid service är en sådan grej. En annan ganska irriterande aspekt är att prestandan sjunker betydligt vid batteridrift. Detta begränsar mobiliteten för datorns tänkta målgrupp, som ofta har ganska höga krav på prestanda. I synnerhet för den gruppen borde ZenBook erbjuda lite mer Zen: en Ryzen-processor hade passat ZenBook väl och då hade vi inte ens haft problem med att prestandan inte var helt stabil. Asus slösar bort potential här.
Asus ZenBook Pro 15 UX535 är en högkvalitativ laptop för kreatörer som övertygar med många fördelar och endast ett fåtal irritationsmoment. ScreenPad är en användbar funktion men en högpresterande Ryzen-processor hade också passat ZenBook bra.
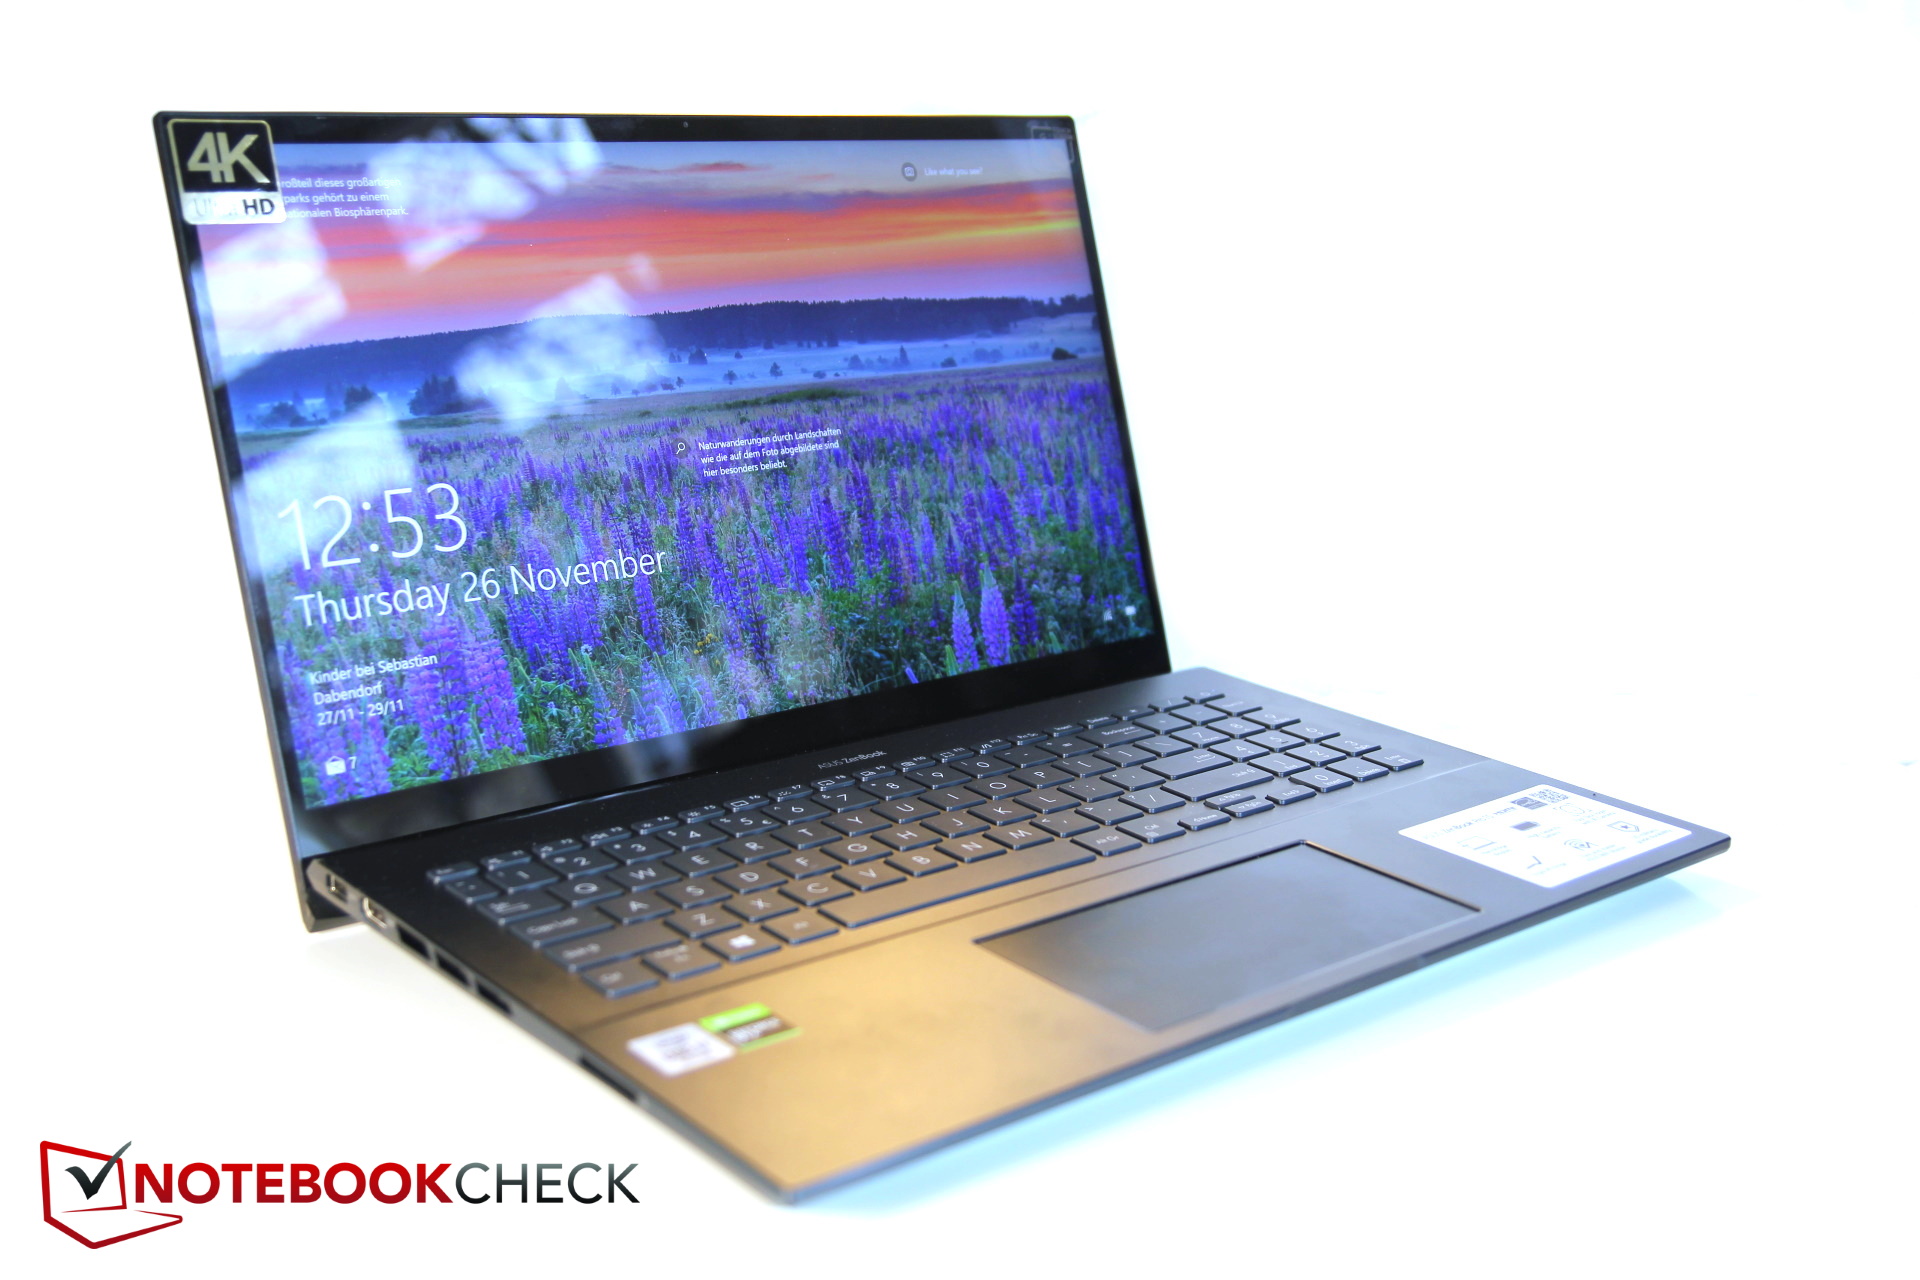
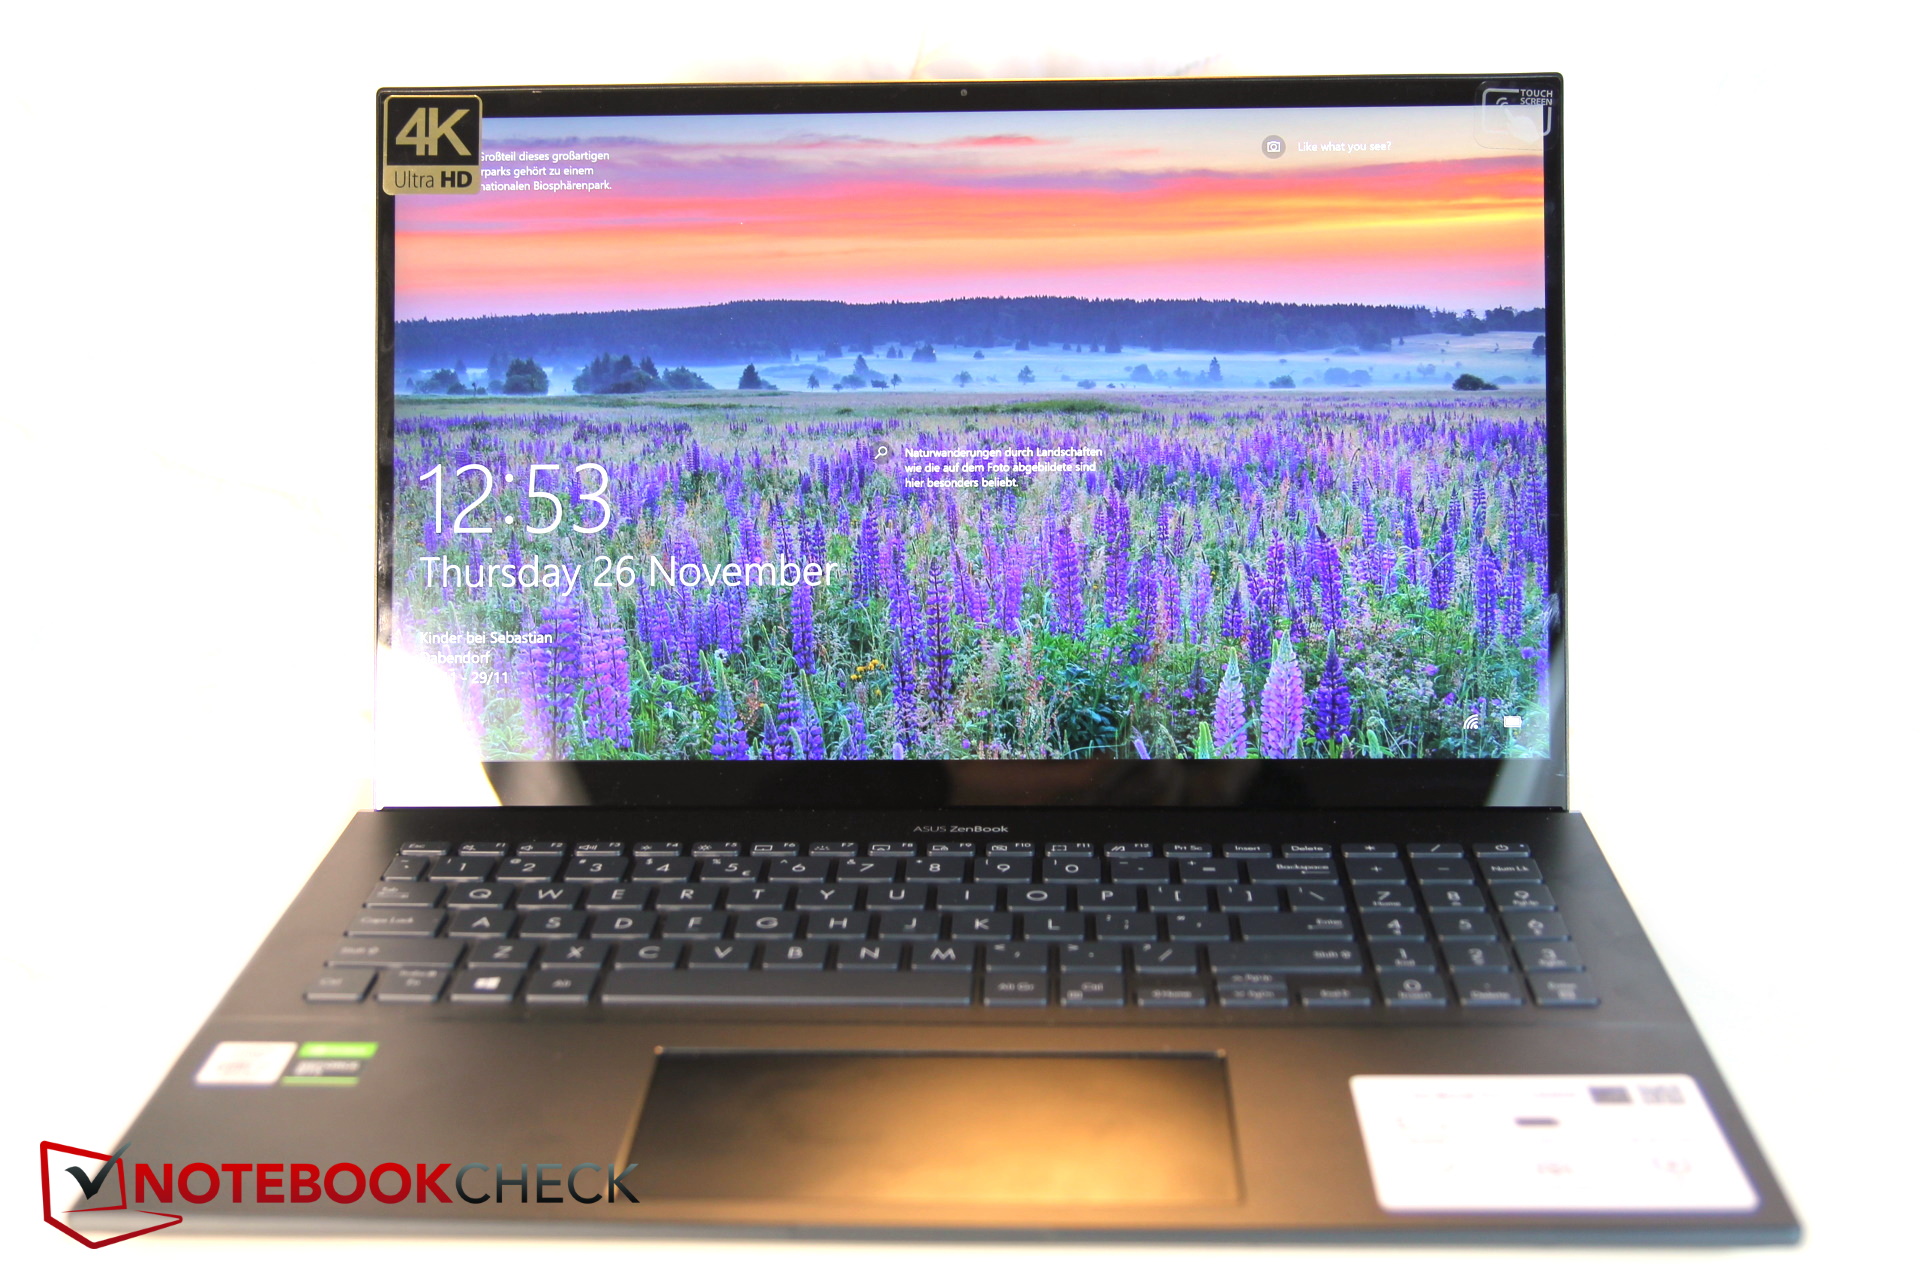
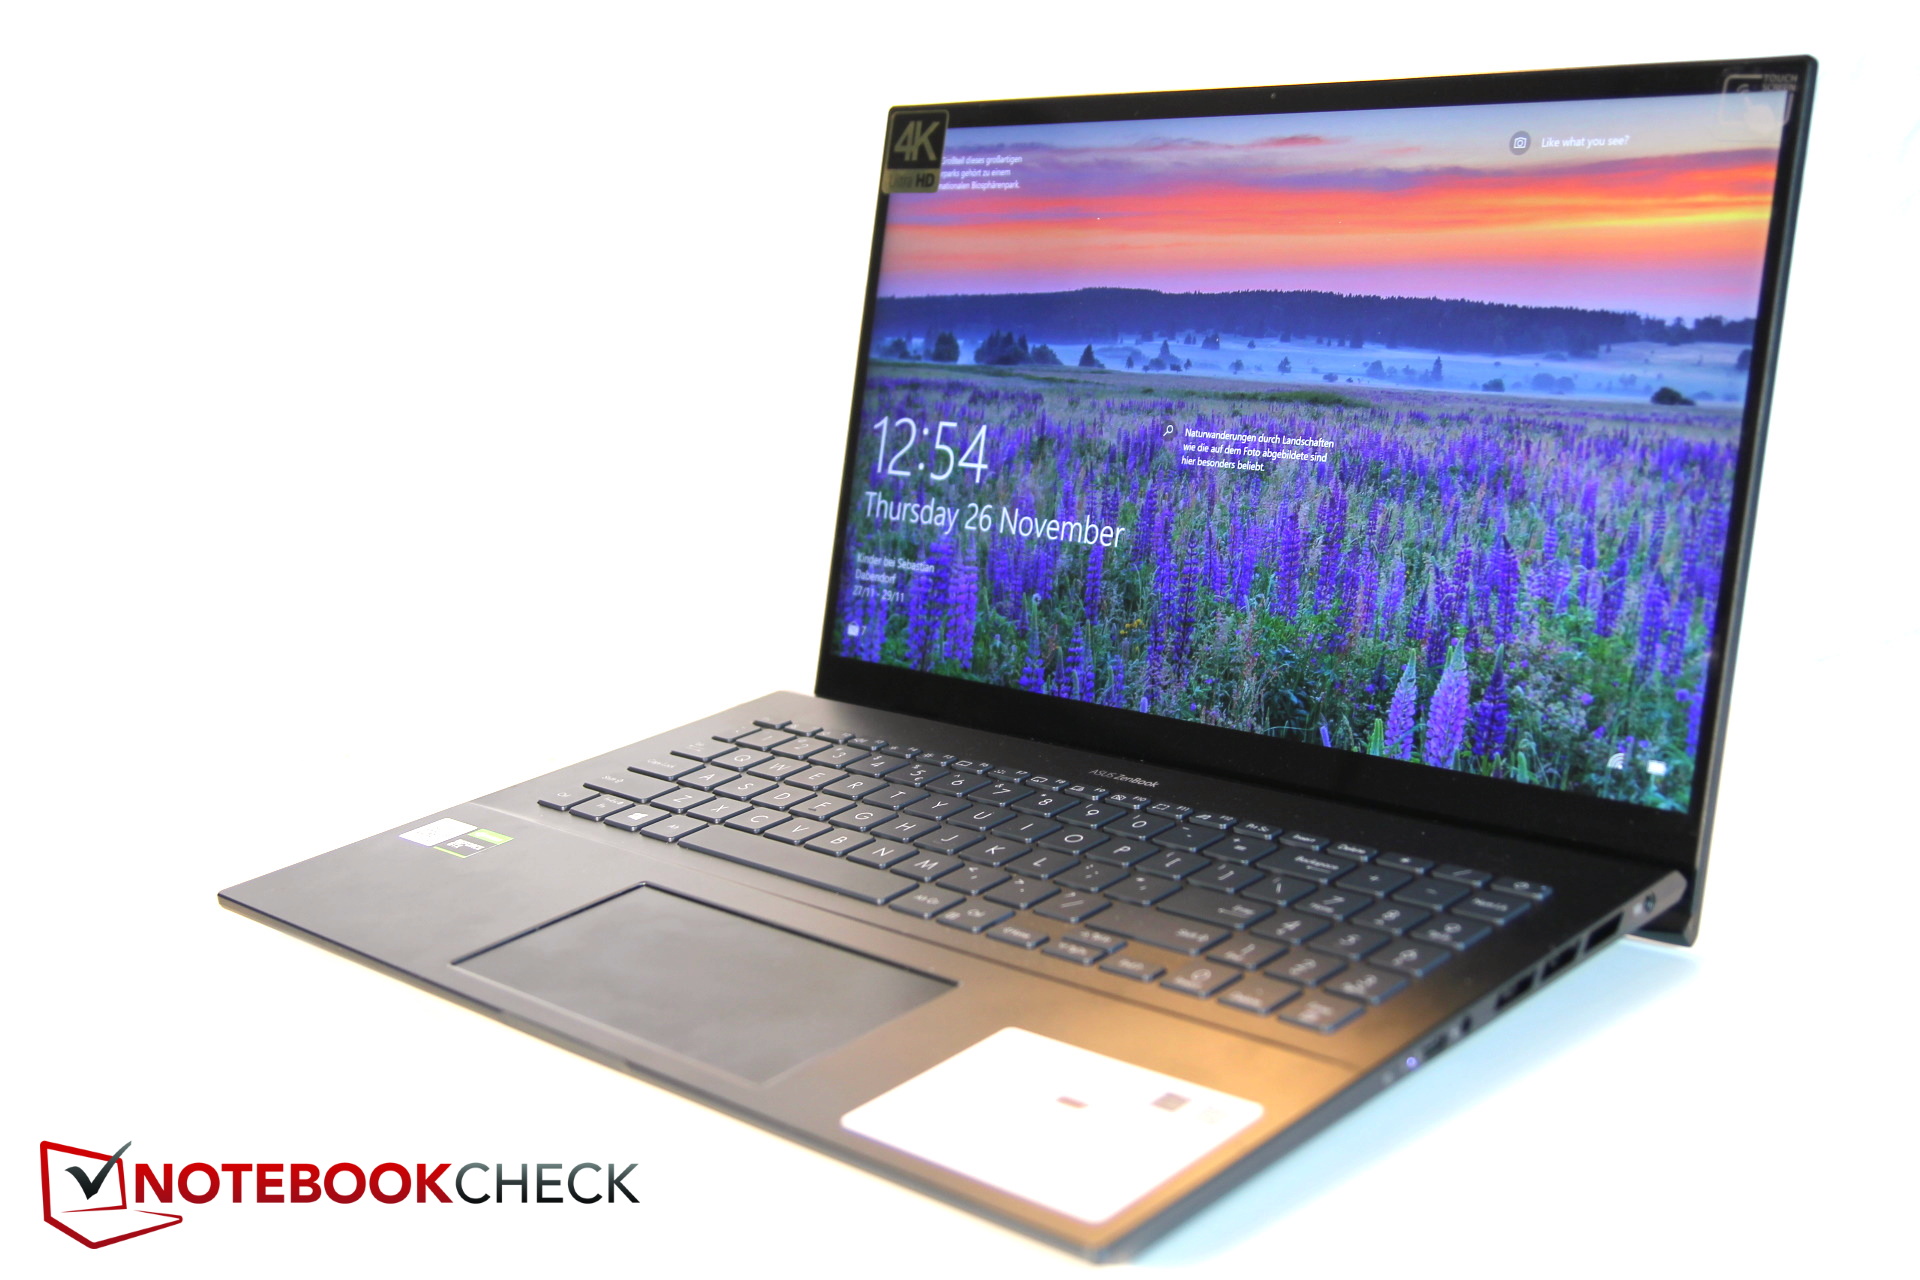
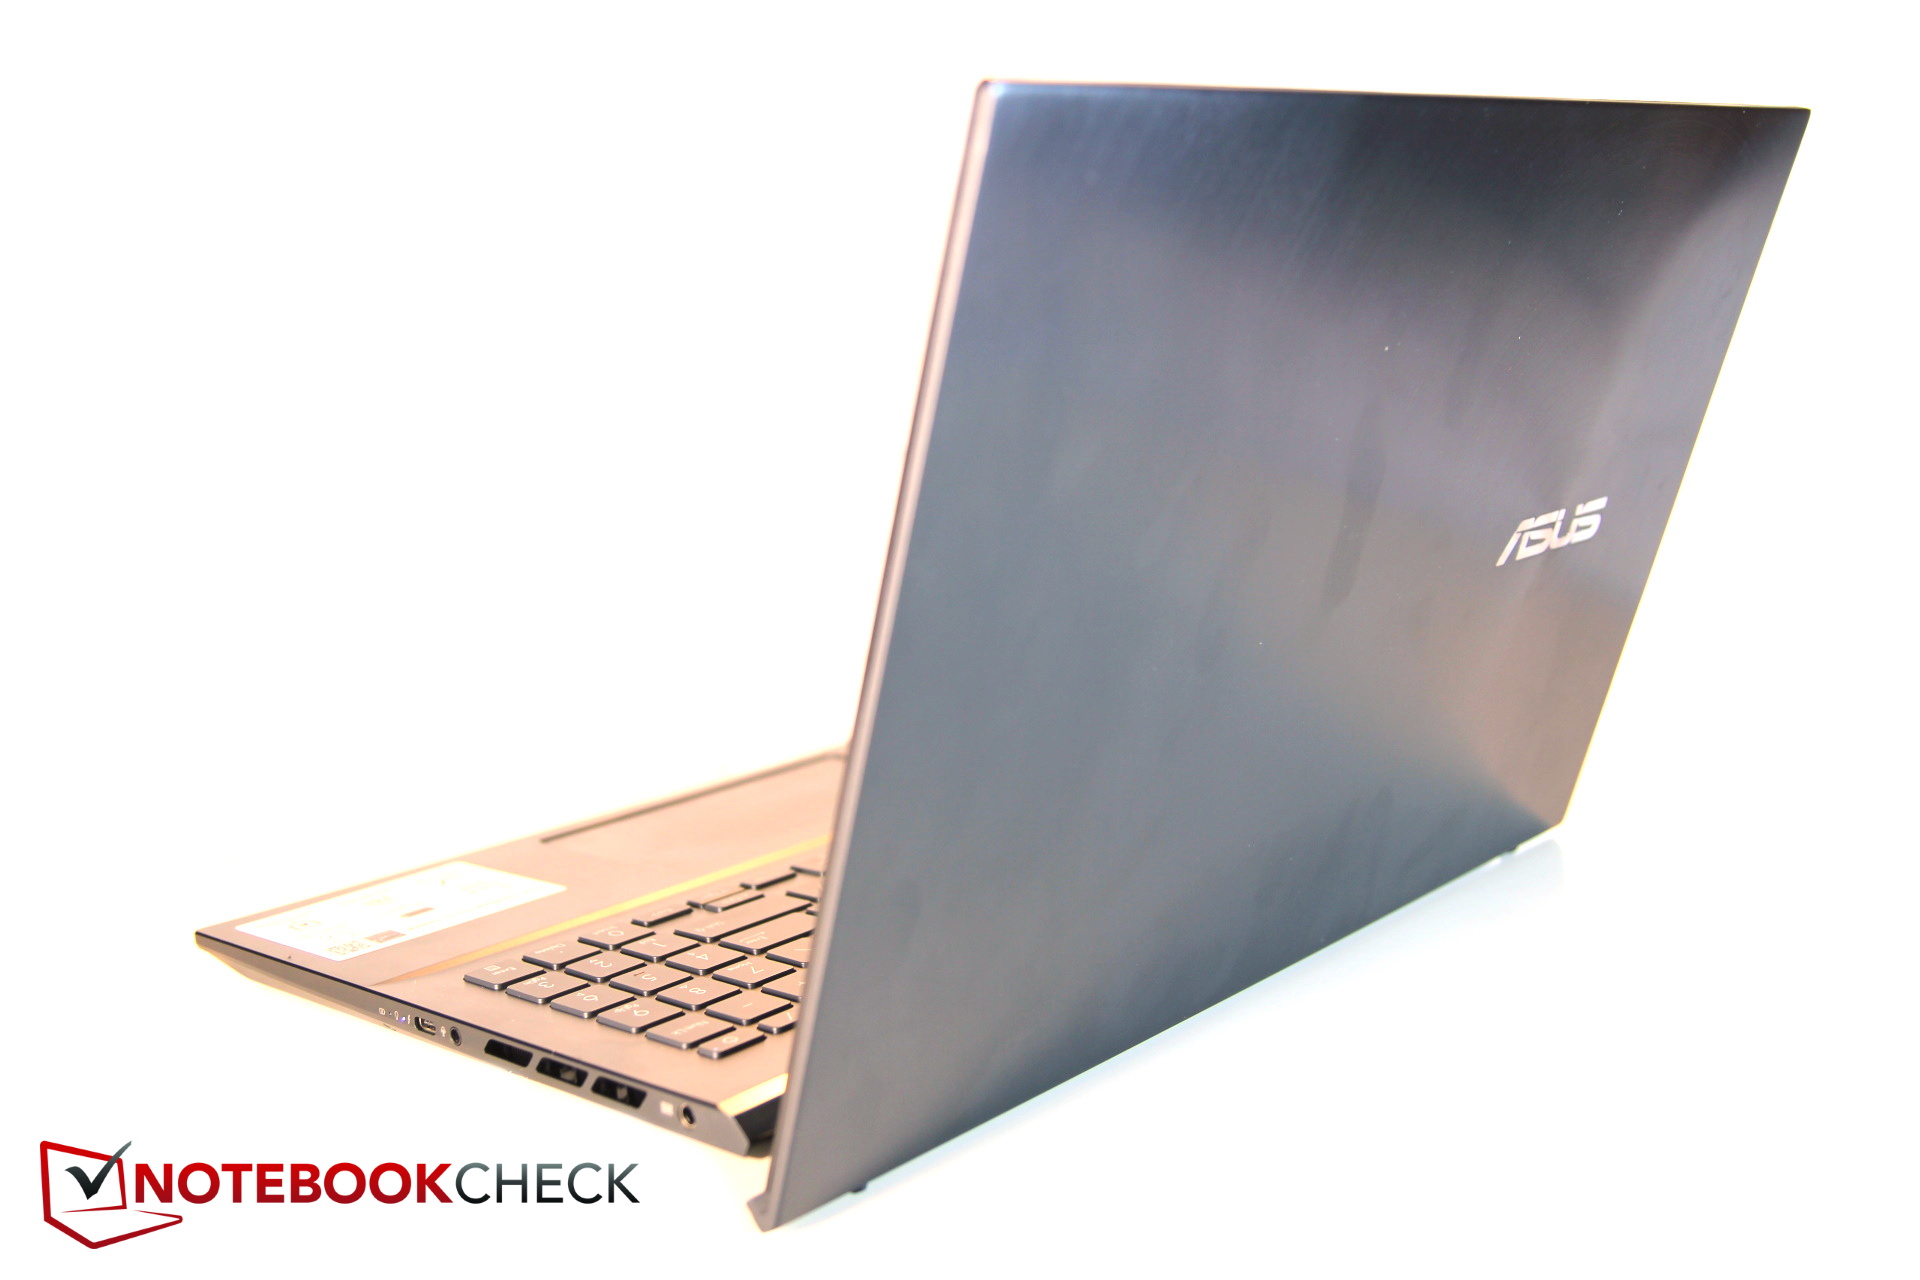
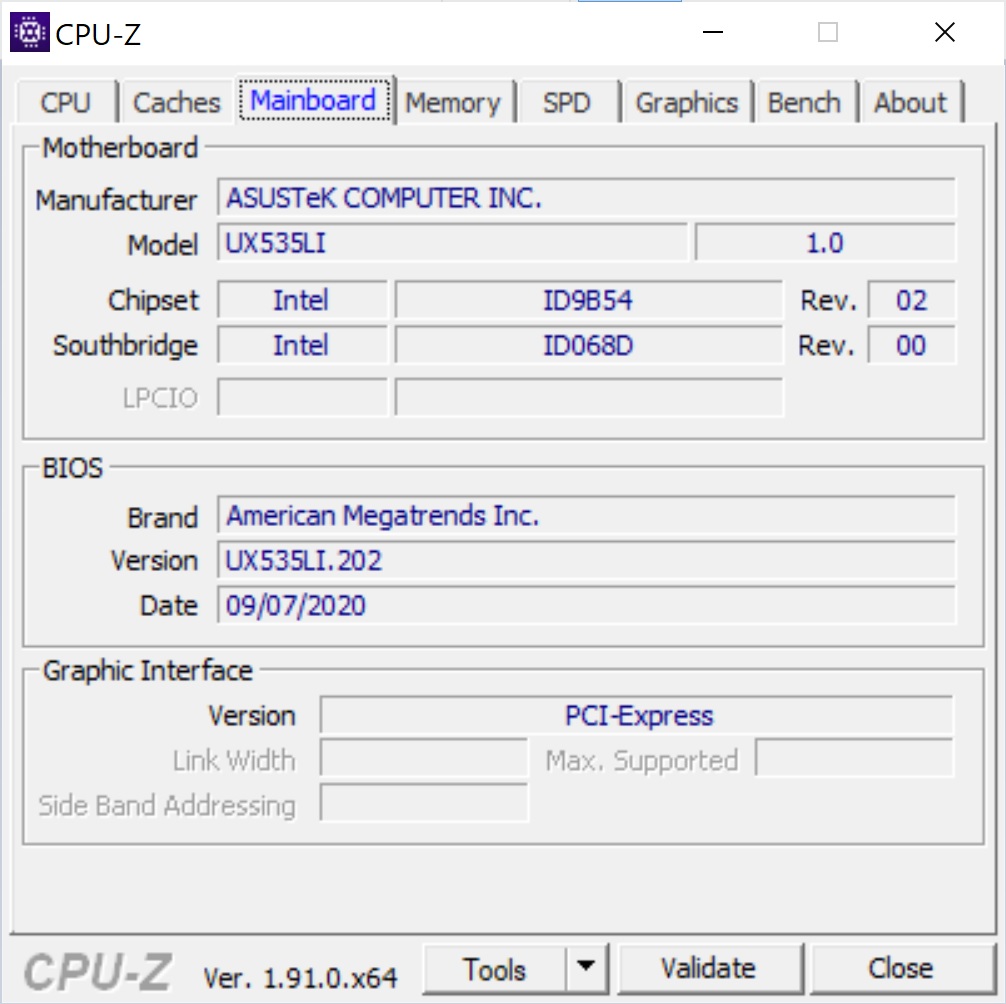
Asus ZenBook UX535-M01440
- 12/02/2020 v7 (old)
Christian Hintze
Price comparison
