Test: Huawei MateBook 14 (i7-8565U, GeForce MX250) Laptop (Sammanfattning)
| Networking | |
| iperf3 transmit AX12 | |
| Huawei MateBook 14 KLV-W29 | |
| Asus ZenBook S13 UX392FN | |
| Huawei Matebook X Pro i5 | |
| LG Gram 14Z980-U.AAW5U1 | |
| iperf3 receive AX12 | |
| Asus ZenBook S13 UX392FN | |
| Huawei MateBook 14 KLV-W29 | |
| Huawei Matebook X Pro i5 | |
| LG Gram 14Z980-U.AAW5U1 | |
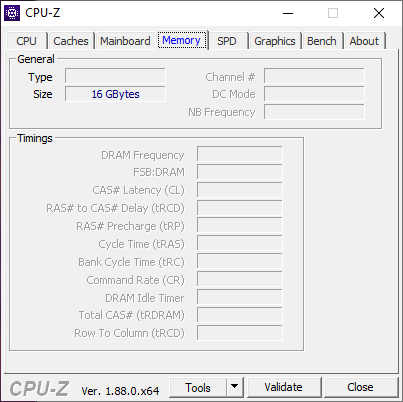
| |||||||||||||||||||||||||
Distribution av ljusstyrkan: 95 %
Mitt på batteriet: 401.7 cd/m²
Kontrast: 956:1 (Svärta: 0.42 cd/m²)
ΔE ColorChecker Calman: 4.11 | ∀{0.5-29.43 Ø4.73}
calibrated: 1.36
ΔE Greyscale Calman: 6.1 | ∀{0.09-98 Ø4.97}
98.6% sRGB (Argyll 1.6.3 3D)
62.7% AdobeRGB 1998 (Argyll 1.6.3 3D)
68.1% AdobeRGB 1998 (Argyll 3D)
97.8% sRGB (Argyll 3D)
66.6% Display P3 (Argyll 3D)
Gamma: 2.19
CCT: 7222 K
| Huawei MateBook 14 KLV-W29 Chi Mei CMN8C02, IPS, 14", 2160x1440 | Huawei Matebook X Pro i5 Tianma XM, IPS, 13.9", 3000x2000 | LG Gram 14Z980-U.AAW5U1 LG Philips LP140WF7-SPG1, IPS, 14", 1920x1080 | Asus ZenBook S13 UX392FN Tianma XM, IPS, 13.9", 1920x1080 | Dell XPS 13 9380 2019 ID: AUO 282B B133ZAN Dell: 90NTH, IPS, 13.3", 3840x2160 | Lenovo Yoga C930-13IKB B139HAN03_0, IPS, 13.9", 1920x1080 | |
|---|---|---|---|---|---|---|
| Display | -2% | -3% | 0% | -4% | -3% | |
| Display P3 Coverage (%) | 66.6 | 65.9 -1% | 64.7 -3% | 67.5 1% | 64.7 -3% | 64.3 -3% |
| sRGB Coverage (%) | 97.8 | 95.2 -3% | 94.3 -4% | 95.8 -2% | 93.1 -5% | 94.6 -3% |
| AdobeRGB 1998 Coverage (%) | 68.1 | 67.6 -1% | 66 -3% | 69 1% | 65.3 -4% | 66.2 -3% |
| Response Times | 0% | -4% | -8% | -43% | -4% | |
| Response Time Grey 50% / Grey 80% * (ms) | 38 ? | 40.4 ? -6% | 36.8 ? 3% | 47.2 ? -24% | 58 ? -53% | 40.8 ? -7% |
| Response Time Black / White * (ms) | 27.2 ? | 25.6 ? 6% | 30 ? -10% | 24.8 ? 9% | 36 ? -32% | 27.6 ? -1% |
| PWM Frequency (Hz) | ||||||
| Screen | 9% | -6% | 21% | 1% | -17% | |
| Brightness middle (cd/m²) | 401.7 | 442.7 10% | 333.8 -17% | 466 16% | 404 1% | 316 -21% |
| Brightness (cd/m²) | 386 | 428 11% | 307 -20% | 462 20% | 389 1% | 291 -25% |
| Brightness Distribution (%) | 95 | 84 -12% | 83 -13% | 90 -5% | 85 -11% | 83 -13% |
| Black Level * (cd/m²) | 0.42 | 0.31 26% | 0.4 5% | 0.33 21% | 0.37 12% | 0.36 14% |
| Contrast (:1) | 956 | 1428 49% | 835 -13% | 1412 48% | 1092 14% | 878 -8% |
| Colorchecker dE 2000 * | 4.11 | 2.24 45% | 3.54 14% | 1.93 53% | 3.72 9% | 5.9 -44% |
| Colorchecker dE 2000 max. * | 8.93 | 7.19 19% | 5.8 35% | 4.26 52% | 7.38 17% | 12.9 -44% |
| Colorchecker dE 2000 calibrated * | 1.36 | 1.11 18% | 2.36 -74% | 1.99 -46% | 2.06 -51% | 1.3 4% |
| Greyscale dE 2000 * | 6.1 | 9.7 -59% | 4.7 23% | 1.7 72% | 4.44 27% | 8.6 -41% |
| Gamma | 2.19 100% | 1.42 155% | 2.14 103% | 2.15 102% | 2.34 94% | 2.1 105% |
| CCT | 7222 90% | 6227 104% | 6261 104% | 6382 102% | 7095 92% | 6854 95% |
| Color Space (Percent of AdobeRGB 1998) (%) | 62.7 | 61.6 -2% | 61.2 -2% | 62.2 -1% | 60 -4% | 60.7 -3% |
| Color Space (Percent of sRGB) (%) | 98.6 | 95 -4% | 94.7 -4% | 95.7 -3% | 93 -6% | 94.5 -4% |
| Totalt genomsnitt (program/inställningar) | 2% /
6% | -4% /
-5% | 4% /
13% | -15% /
-6% | -8% /
-13% |
* ... mindre är bättre
Visa svarstider
| ↔ Svarstid svart till vitt | ||
|---|---|---|
| 27.2 ms ... stiga ↗ och falla ↘ kombinerat | ↗ 17.2 ms stiga | 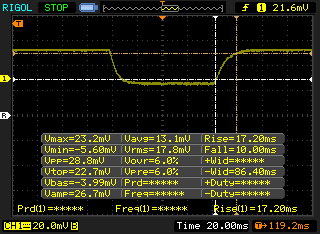 |
| ↘ 10 ms hösten | ||
| Skärmen visar relativt långsamma svarsfrekvenser i våra tester och kan vara för långsam för spelare. I jämförelse sträcker sig alla testade enheter från 0.1 (minst) till 240 (maximalt) ms. » 69 % av alla enheter är bättre. Detta innebär att den uppmätta svarstiden är sämre än genomsnittet av alla testade enheter (19.9 ms). | ||
| ↔ Svarstid 50 % grått till 80 % grått | ||
| 38 ms ... stiga ↗ och falla ↘ kombinerat | ↗ 19.6 ms stiga | 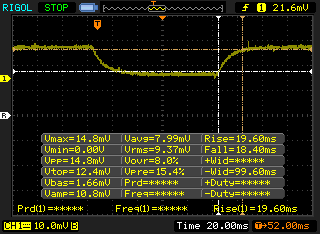 |
| ↘ 18.4 ms hösten | ||
| Skärmen visar långsamma svarsfrekvenser i våra tester och kommer att vara otillfredsställande för spelare. I jämförelse sträcker sig alla testade enheter från 0.165 (minst) till 636 (maximalt) ms. » 55 % av alla enheter är bättre. Detta innebär att den uppmätta svarstiden är sämre än genomsnittet av alla testade enheter (31.1 ms). | ||
Skärmflimmer / PWM (Puls-Width Modulation)
| Skärmflimmer / PWM upptäcktes inte |  | ||
Som jämförelse: 52 % av alla testade enheter använder inte PWM för att dämpa skärmen. Om PWM upptäcktes mättes ett medelvärde av 7794 (minst: 5 - maximum: 343500) Hz. | |||
| PCMark 8 Home Score Accelerated v2 | 3612 poäng | |
| PCMark 8 Work Score Accelerated v2 | 4796 poäng | |
| PCMark 10 Score | 4205 poäng | |
Hjälp | ||
| Huawei MateBook 14 KLV-W29 Samsung SSD PM981 MZVLB512HAJQ | Huawei Matebook X Pro i5 Samsung PM961 MZVLW256HEHP | LG Gram 14Z980-U.AAW5U1 SK Hynix SC313 HFS256G39TNF | Dell XPS 13 9380 2019 SK hynix PC401 HFS256GD9TNG | Asus ZenBook S13 UX392FN WDC PC SN520 SDAPNUW-512G | Lenovo Yoga C930-13IKB SK hynix PC401 HFS256GD9TNG | |
|---|---|---|---|---|---|---|
| AS SSD | -25% | -70% | -45% | -15% | -55% | |
| Seq Read (MB/s) | 1225 | 2416 97% | 476.1 -61% | 2035 66% | 1224 0% | 1850 51% |
| Seq Write (MB/s) | 1386 | 1170 -16% | 487.4 -65% | 658 -53% | 907 -35% | 661 -52% |
| 4K Read (MB/s) | 56.4 | 48.33 -14% | 30.57 -46% | 39.74 -30% | 41.46 -26% | 38.04 -33% |
| 4K Write (MB/s) | 137.6 | 103.1 -25% | 66.1 -52% | 105.7 -23% | 126.2 -8% | 95 -31% |
| 4K-64 Read (MB/s) | 1190 | 1039 -13% | 352.9 -70% | 461 -61% | 1021 -14% | 434.3 -64% |
| 4K-64 Write (MB/s) | 1377 | 399.6 -71% | 263.1 -81% | 300.1 -78% | 1251 -9% | 266.3 -81% |
| Access Time Read * (ms) | 0.046 | 0.058 -26% | 0.092 -100% | 0.061 -33% | 0.053 -15% | 0.069 -50% |
| Access Time Write * (ms) | 0.026 | 0.036 -38% | 0.055 -112% | 0.051 -96% | 0.027 -4% | 0.056 -115% |
| Score Read (Points) | 1369 | 1329 -3% | 431 -69% | 704 -49% | 1185 -13% | 657 -52% |
| Score Write (Points) | 1653 | 620 -62% | 378 -77% | 471 -72% | 1468 -11% | 427 -74% |
| Score Total (Points) | 3743 | 2575 -31% | 1040 -72% | 1479 -60% | 3250 -13% | 1373 -63% |
| Copy ISO MB/s (MB/s) | 1837 | 739 -60% | 514 -72% | 893 -51% | 1404 -24% | 539 -71% |
| Copy Program MB/s (MB/s) | 473.6 | 312.3 -34% | 259.3 -45% | 287.9 -39% | 402.4 -15% | 209.7 -56% |
| Copy Game MB/s (MB/s) | 1216 | 486.3 -60% | 521 -57% | 618 -49% | 902 -26% | 340 -72% |
* ... mindre är bättre

| 3DMark 11 Performance | 4681 poäng | |
| 3DMark Cloud Gate Standard Score | 13455 poäng | |
| 3DMark Fire Strike Score | 3350 poäng | |
| 3DMark Time Spy Score | 1240 poäng | |
Hjälp | ||
| The Witcher 3 - 1366x768 Medium Graphics & Postprocessing | |
| Lenovo Legion Y730-15ICH i5-8300H | |
| MSI GF63 8RC-040XPL | |
| Razer Blade Stealth i7-8565U | |
| Huawei MateBook 14 KLV-W29 | |
| Asus GL552JX-CN154H | |
| Genomsnitt NVIDIA GeForce MX250 (30 - 40, n=27) | |
| Asus ZenBook S13 UX392FN | |
| Asus VivoBook S410UQ-NH74 | |
| Rise of the Tomb Raider - 1366x768 Medium Preset AF:2x | |
| Lenovo Legion Y730-15ICH i5-8300H | |
| Razer Blade Stealth i7-8565U | |
| Huawei MateBook 14 KLV-W29 | |
| Genomsnitt NVIDIA GeForce MX250 (39 - 46.2, n=5) | |
| Asus ZenBook S13 UX392FN | |
| Asus VivoBook S410UQ-NH74 | |
| Dell XPS 13 9380 2019 | |
| låg | med. | hög | ultra | |
|---|---|---|---|---|
| The Witcher 3 (2015) | 64.5 | 36.5 | 21 | 11.9 |
| Rise of the Tomb Raider (2016) | 74.9 | 43.7 | 24.1 | 19.4 |
| Overwatch (2016) | 171.7 | 122.5 | 58 | 35 |
| Huawei MateBook 14 KLV-W29 GeForce MX250, i7-8565U, Samsung SSD PM981 MZVLB512HAJQ | Huawei Matebook X Pro i5 GeForce MX150, i5-8250U, Samsung PM961 MZVLW256HEHP | LG Gram 14Z980-U.AAW5U1 UHD Graphics 620, i5-8250U, SK Hynix SC313 HFS256G39TNF | Asus ZenBook S13 UX392FN GeForce MX150, i7-8565U, WDC PC SN520 SDAPNUW-512G | Lenovo Yoga C930-13IKB UHD Graphics 620, i5-8250U, SK hynix PC401 HFS256GD9TNG | Razer Blade Stealth i7-8565U GeForce MX150, i7-8565U, Lite-On CA3-8D256-Q11 | |
|---|---|---|---|---|---|---|
| Noise | -0% | 3% | -1% | 3% | -3% | |
| av / miljö * (dB) | 28.1 | 27.9 1% | 28.2 -0% | 28.1 -0% | 29.3 -4% | 28.4 -1% |
| Idle Minimum * (dB) | 28.1 | 27.9 1% | 28.4 -1% | 28.1 -0% | 29.3 -4% | 28.5 -1% |
| Idle Average * (dB) | 28.1 | 27.9 1% | 28.4 -1% | 28.1 -0% | 29.3 -4% | 29 -3% |
| Idle Maximum * (dB) | 29.7 | 27.9 6% | 28.4 4% | 29 2% | 29.7 -0% | 29.1 2% |
| Load Average * (dB) | 31.2 | 36.2 -16% | 35.7 -14% | 41.1 -32% | 31.8 -2% | 42.8 -37% |
| Witcher 3 ultra * (dB) | 44.5 | 45 -1% | 41.1 8% | 41.4 7% | ||
| Load Maximum * (dB) | 47.5 | 45.2 5% | 34.2 28% | 41.1 13% | 32.7 31% | 41.6 12% |
* ... mindre är bättre
Ljudnivå
| Låg belastning |
| 28.1 / 28.1 / 29.7 dB(A) |
| Hög belastning |
| 31.2 / 47.5 dB(A) |
 | ||
30 dB tyst 40 dB(A) hörbar 50 dB(A) högt ljud |
||
min: | ||
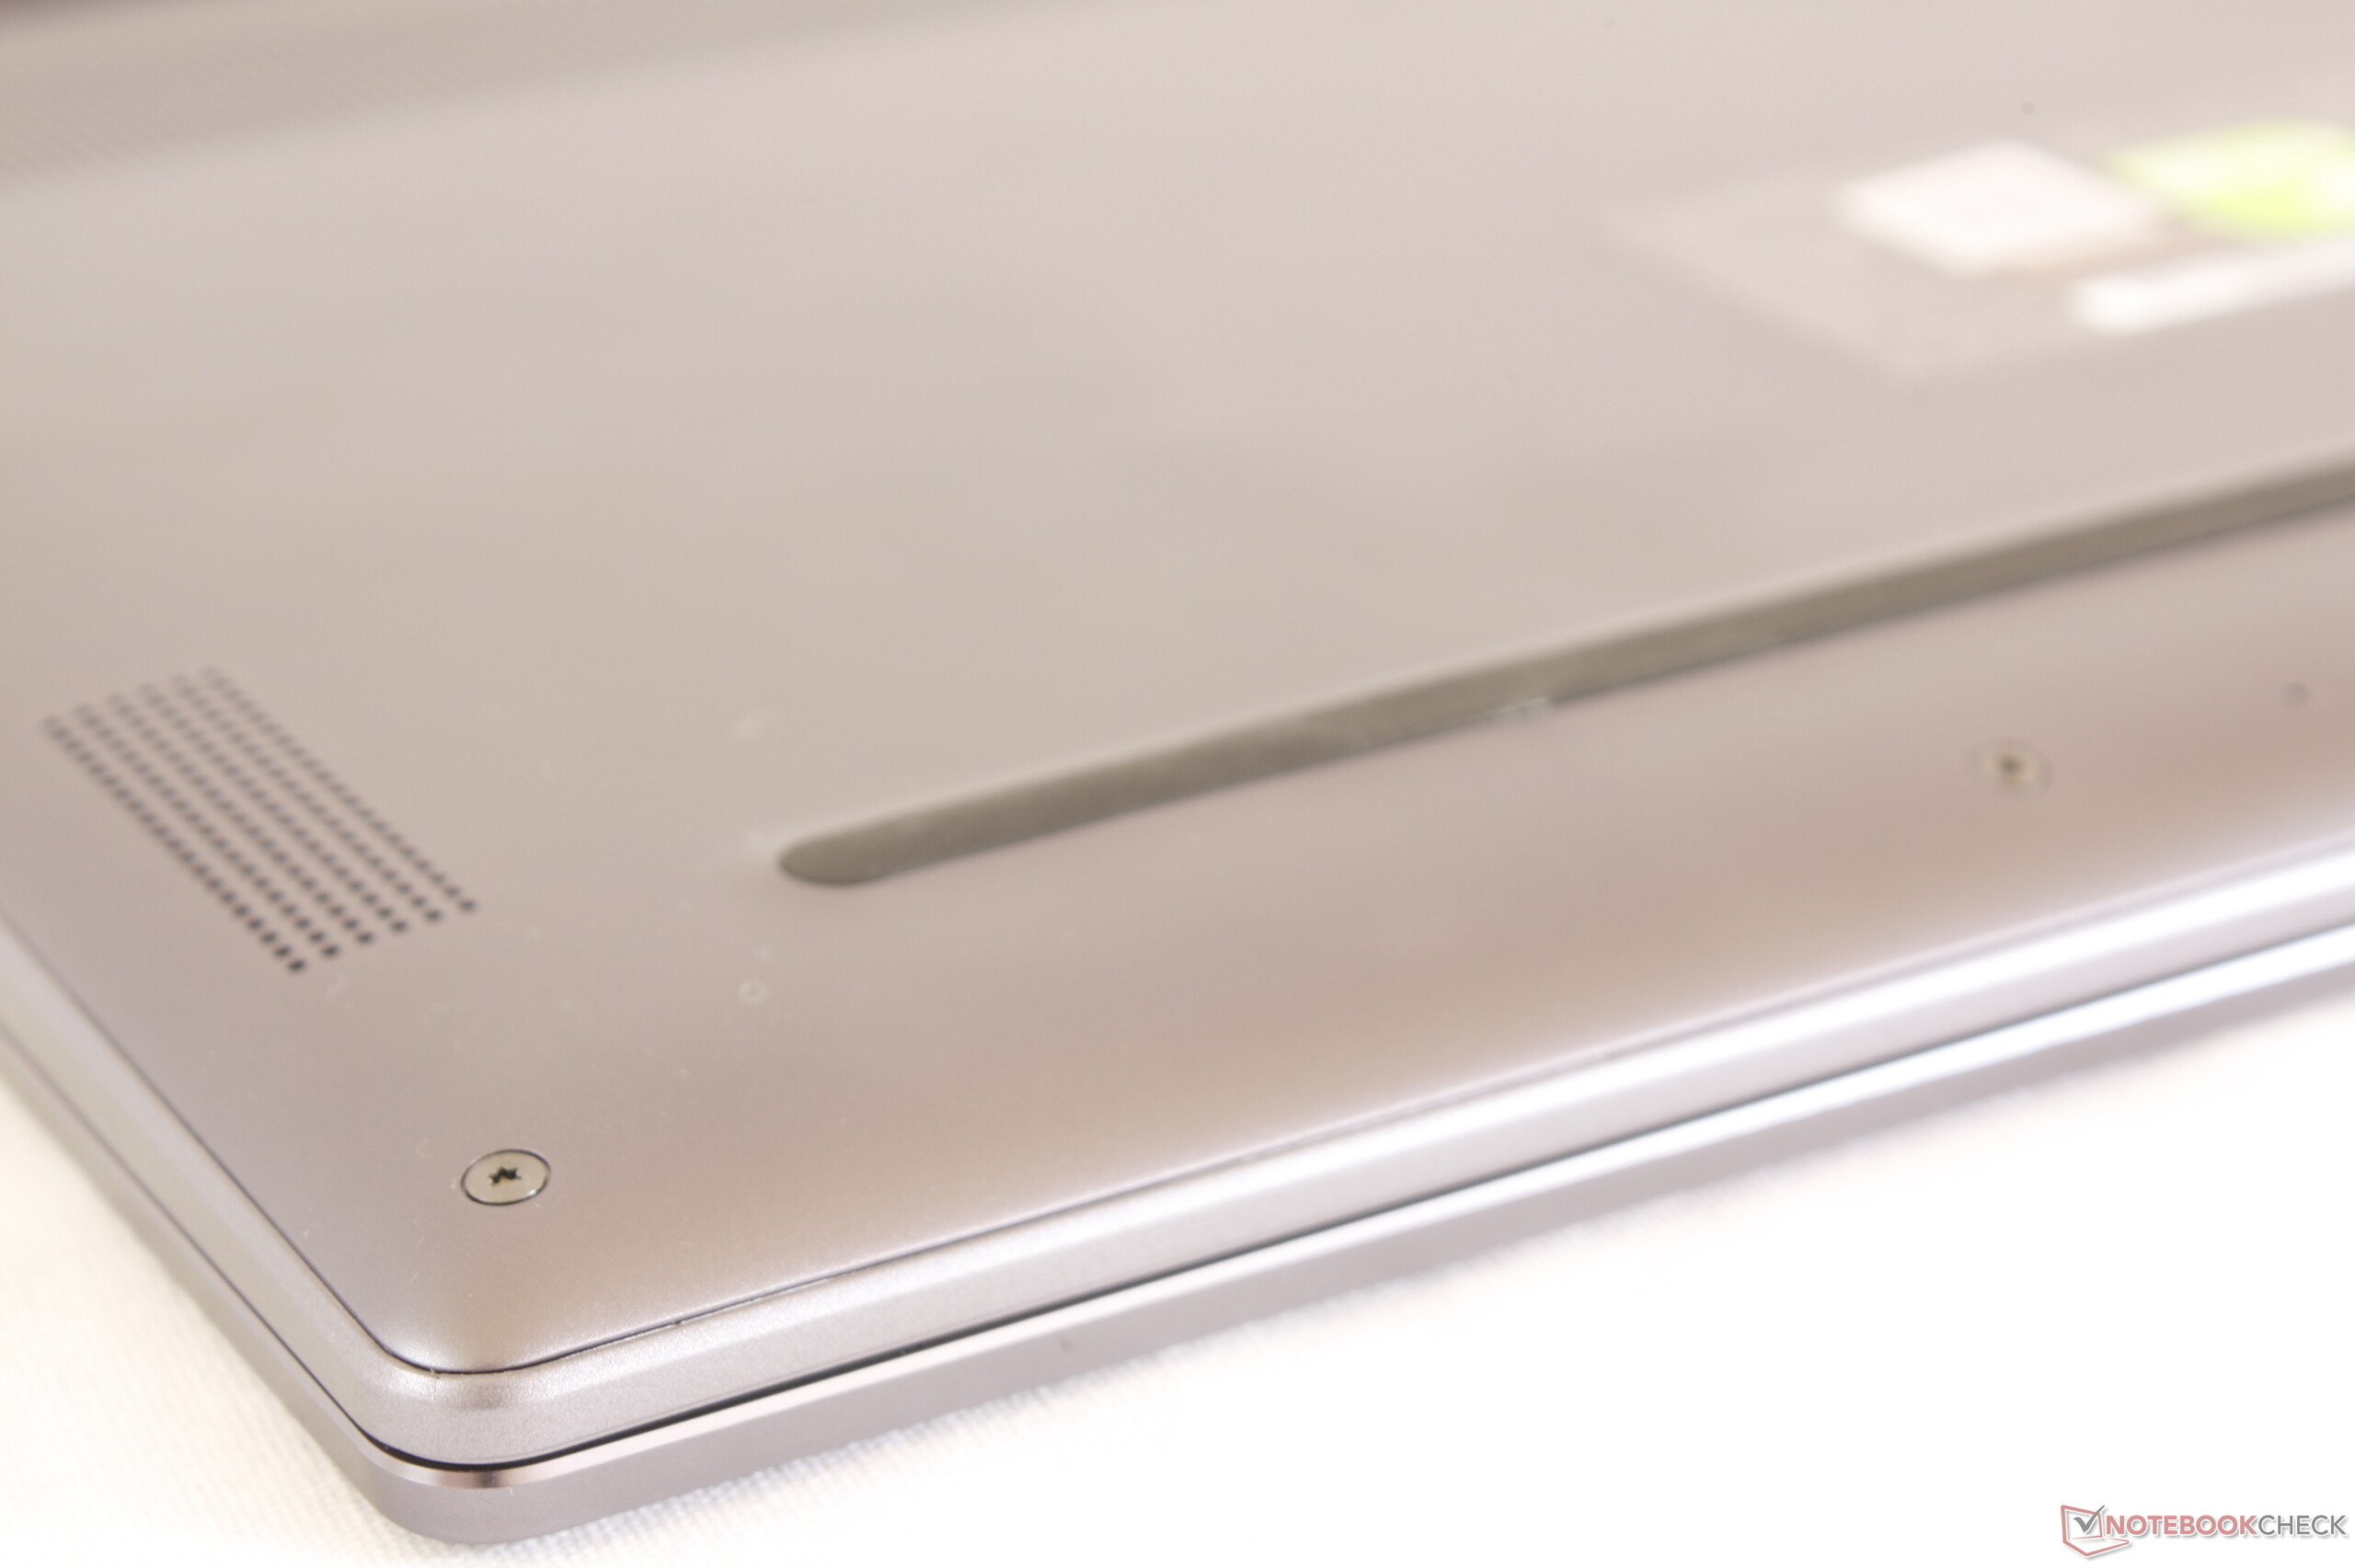
(-) Den maximala temperaturen på ovansidan är 48.2 °C / 119 F, jämfört med genomsnittet av 35.9 °C / 97 F , allt från 21.4 till 59 °C för klassen Subnotebook.
(-) Botten värms upp till maximalt 53.6 °C / 128 F, jämfört med genomsnittet av 39.2 °C / 103 F
(+) Vid tomgångsbruk är medeltemperaturen för ovansidan 30.2 °C / 86 F, jämfört med enhetsgenomsnittet på 30.8 °C / ### class_avg_f### F.
(±) När du spelar The Witcher 3 är medeltemperaturen för ovansidan 37.4 °C / 99 F, jämfört med enhetsgenomsnittet på 30.8 °C / ## #class_avg_f### F.
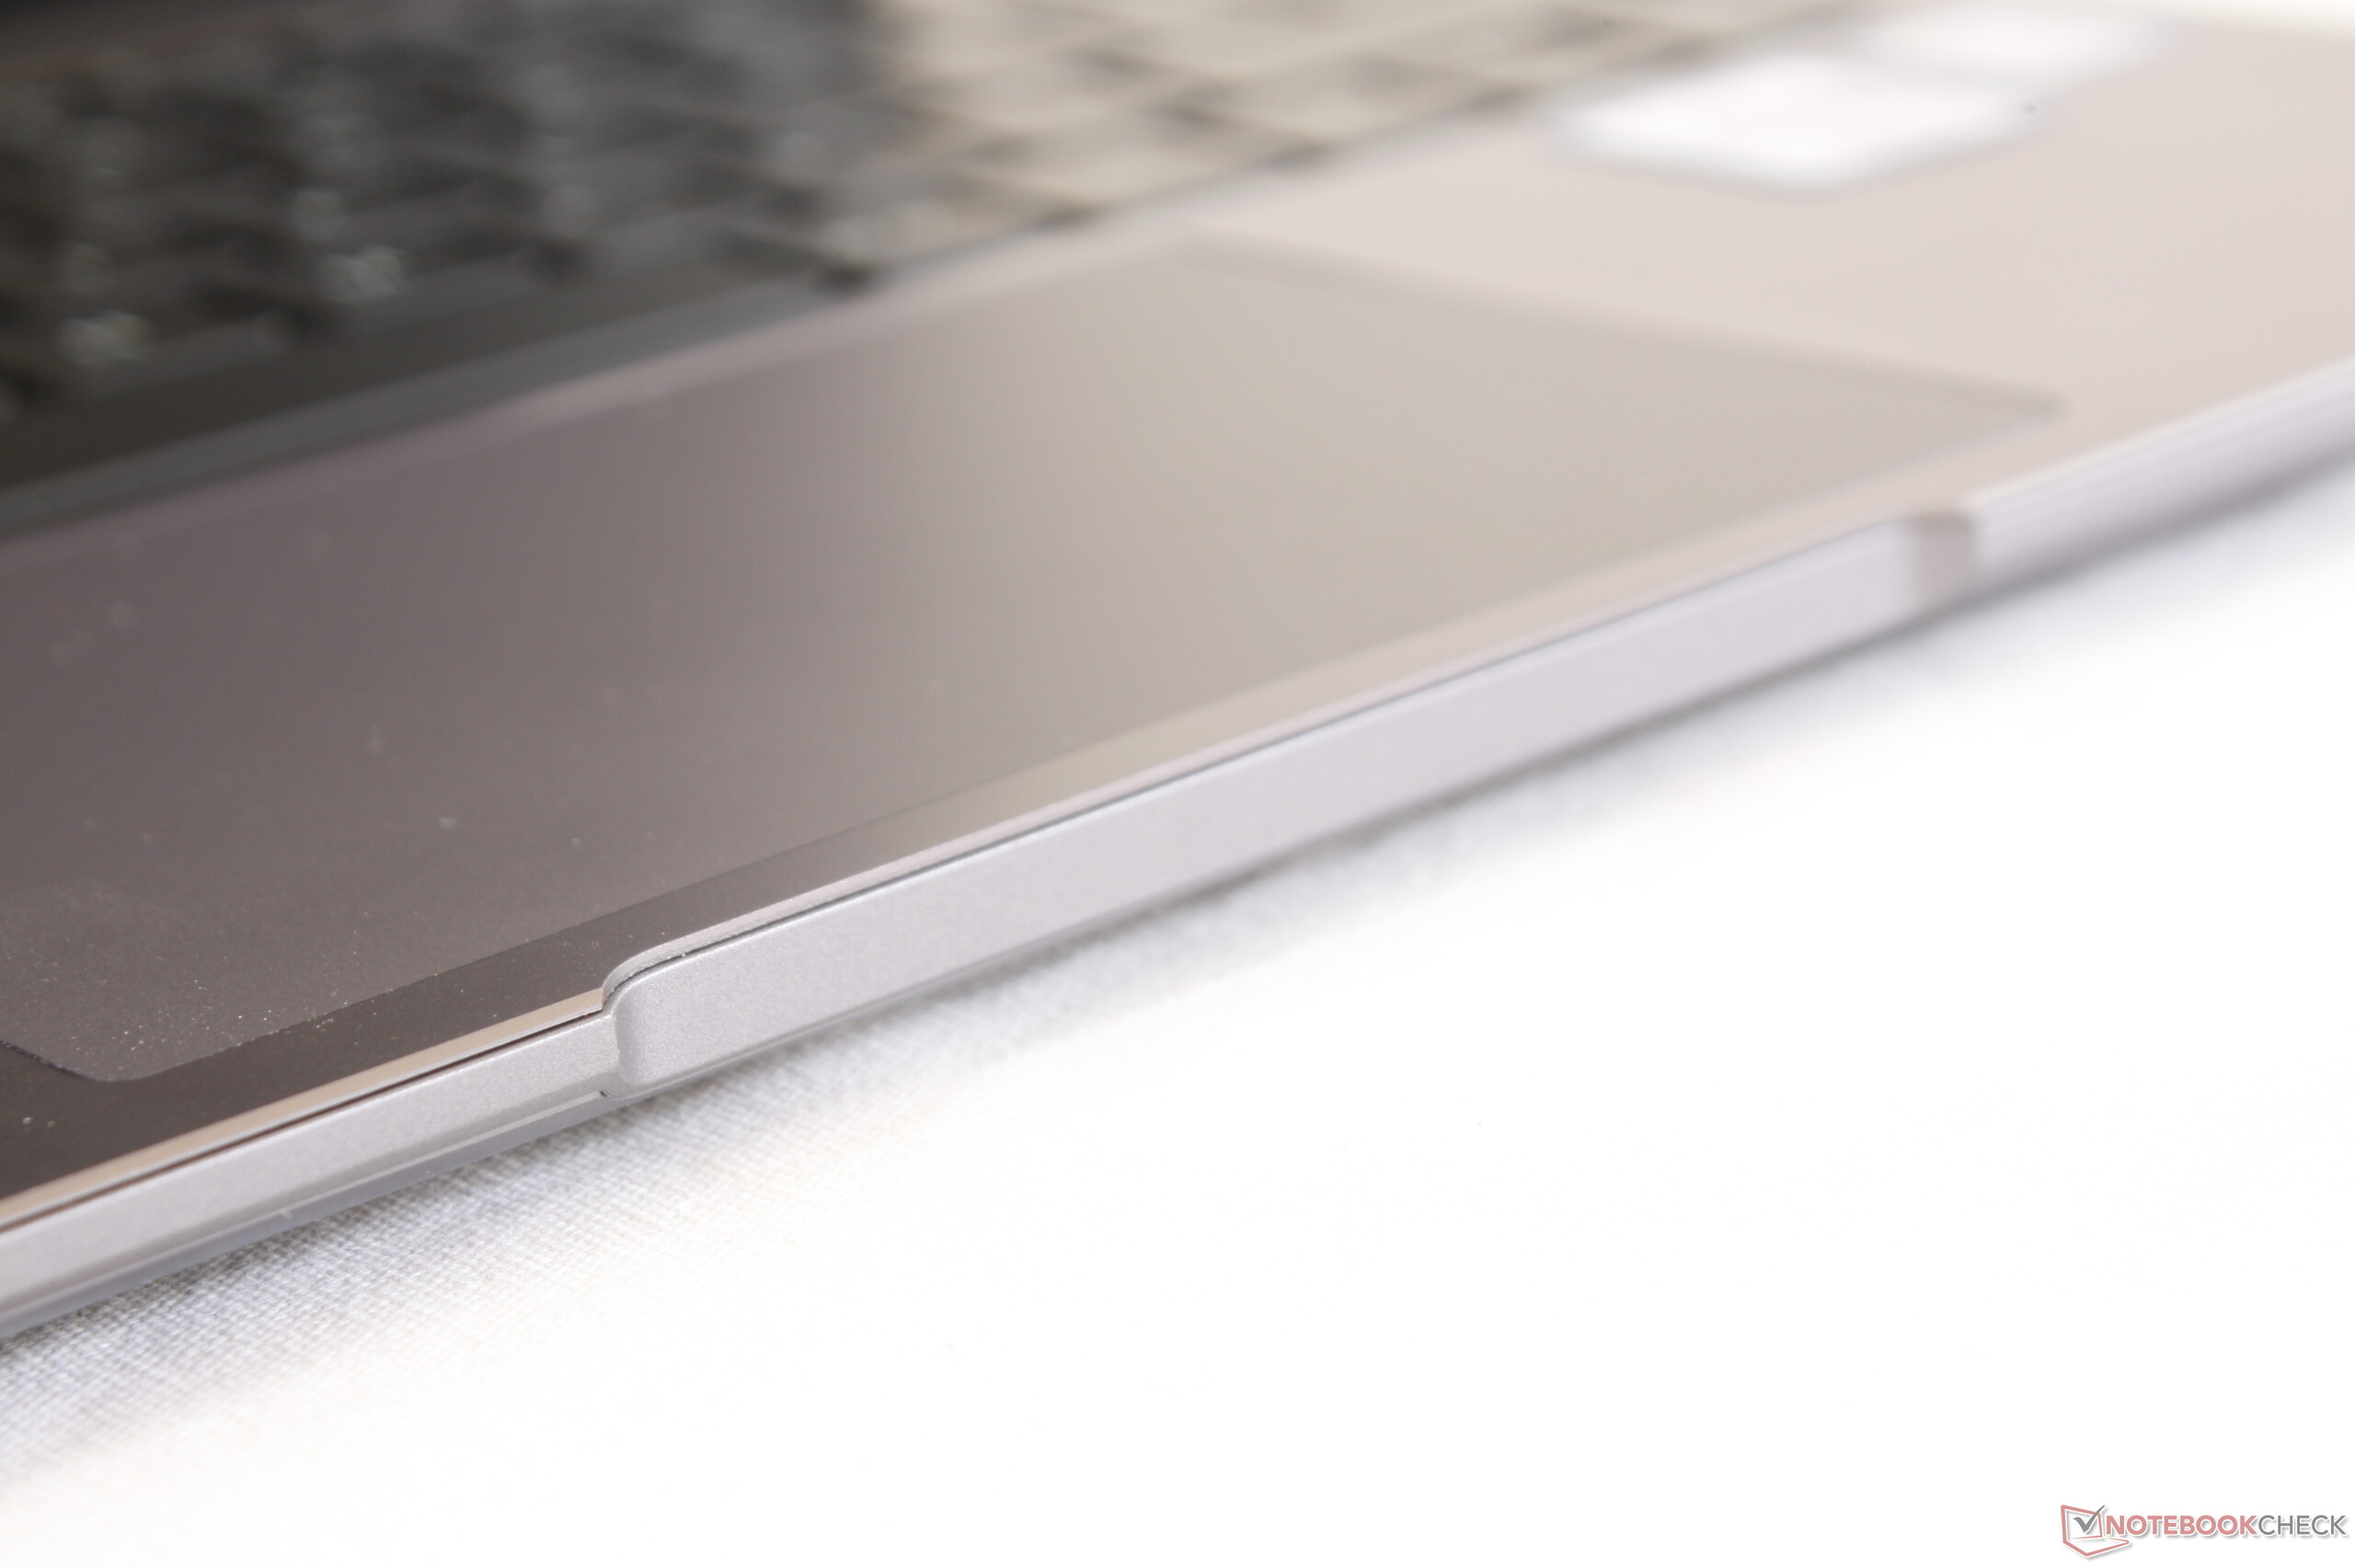
(±) Handledsstöden och pekplattan kan bli väldigt varma vid beröring med maximalt 36.8 °C / 98.2 F.
(-) Medeltemperaturen för handledsstödsområdet på liknande enheter var 28.2 °C / 82.8 F (-8.6 °C / -15.4 F).
Huawei MateBook 14 KLV-W29 ljudanalys
(±) | högtalarljudstyrkan är genomsnittlig men bra (74.2 dB)
Bas 100 - 315 Hz
(±) | reducerad bas - i genomsnitt 14.4% lägre än medianen
(±) | linjäriteten för basen är genomsnittlig (13.8% delta till föregående frekvens)
Mellan 400 - 2000 Hz
(±) | högre mellan - i genomsnitt 5.1% högre än median
(+) | mids är linjära (5.4% delta till föregående frekvens)
Högsta 2 - 16 kHz
(+) | balanserade toppar - endast 3.1% från medianen
(+) | toppar är linjära (6.6% delta till föregående frekvens)
Totalt 100 - 16 000 Hz
(±) | linjäriteten för det totala ljudet är genomsnittlig (19.9% skillnad mot median)
Jämfört med samma klass
» 63% av alla testade enheter i den här klassen var bättre, 8% liknande, 29% sämre
» Den bästa hade ett delta på 5%, genomsnittet var 18%, sämst var 53%
Jämfört med alla testade enheter
» 51% av alla testade enheter var bättre, 7% liknande, 42% sämre
» Den bästa hade ett delta på 4%, genomsnittet var 24%, sämst var 134%
Apple MacBook 12 (Early 2016) 1.1 GHz ljudanalys
(+) | högtalare kan spela relativt högt (83.6 dB)
Bas 100 - 315 Hz
(±) | reducerad bas - i genomsnitt 11.3% lägre än medianen
(±) | linjäriteten för basen är genomsnittlig (14.2% delta till föregående frekvens)
Mellan 400 - 2000 Hz
(+) | balanserad mellan - endast 2.4% från medianen
(+) | mids är linjära (5.5% delta till föregående frekvens)
Högsta 2 - 16 kHz
(+) | balanserade toppar - endast 2% från medianen
(+) | toppar är linjära (4.5% delta till föregående frekvens)
Totalt 100 - 16 000 Hz
(+) | det totala ljudet är linjärt (10.2% skillnad mot median)
Jämfört med samma klass
» 7% av alla testade enheter i den här klassen var bättre, 2% liknande, 91% sämre
» Den bästa hade ett delta på 5%, genomsnittet var 18%, sämst var 53%
Jämfört med alla testade enheter
» 5% av alla testade enheter var bättre, 1% liknande, 94% sämre
» Den bästa hade ett delta på 4%, genomsnittet var 24%, sämst var 134%
| Av/Standby | |
| Låg belastning | |
| Hög belastning |
|
Förklaring:
min: | |
| Huawei MateBook 14 KLV-W29 i7-8565U, GeForce MX250, Samsung SSD PM981 MZVLB512HAJQ, IPS, 2160x1440, 14" | Huawei Matebook X Pro i5 i5-8250U, GeForce MX150, Samsung PM961 MZVLW256HEHP, IPS, 3000x2000, 13.9" | LG Gram 14Z980-U.AAW5U1 i5-8250U, UHD Graphics 620, SK Hynix SC313 HFS256G39TNF, IPS, 1920x1080, 14" | Asus ZenBook S13 UX392FN i7-8565U, GeForce MX150, WDC PC SN520 SDAPNUW-512G, IPS, 1920x1080, 13.9" | Lenovo Yoga C930-13IKB i5-8250U, UHD Graphics 620, SK hynix PC401 HFS256GD9TNG, IPS, 1920x1080, 13.9" | Razer Blade Stealth i7-8565U i7-8565U, GeForce MX150, Lite-On CA3-8D256-Q11, IPS, 1920x1080, 13.3" | |
|---|---|---|---|---|---|---|
| Power Consumption | 11% | 40% | 18% | 21% | -11% | |
| Idle Minimum * (Watt) | 3.7 | 3.5 5% | 2.7 27% | 3.4 8% | 3.3 11% | 6.7 -81% |
| Idle Average * (Watt) | 9.3 | 8.9 4% | 6 35% | 6.3 32% | 6.8 27% | 8.6 8% |
| Idle Maximum * (Watt) | 12.8 | 12.3 4% | 6.5 49% | 10.4 19% | 9.5 26% | 9.4 27% |
| Load Average * (Watt) | 58.8 | 54.2 8% | 32.5 45% | 51 13% | 40.8 31% | 64.1 -9% |
| Witcher 3 ultra * (Watt) | 55.8 | 42.4 24% | 39 30% | 63.7 -14% | ||
| Load Maximum * (Watt) | 65 | 52.1 20% | 35.5 45% | 62.7 4% | 57 12% | 64.1 1% |
* ... mindre är bättre
| Huawei MateBook 14 KLV-W29 i7-8565U, GeForce MX250, 57.4 Wh | Huawei Matebook X Pro i5 i5-8250U, GeForce MX150, 57.4 Wh | LG Gram 14Z980-U.AAW5U1 i5-8250U, UHD Graphics 620, 72 Wh | Dell XPS 13 9380 2019 i5-8265U, UHD Graphics 620, 52 Wh | Asus ZenBook S13 UX392FN i7-8565U, GeForce MX150, 50 Wh | Lenovo Yoga C930-13IKB i5-8250U, UHD Graphics 620, 60 Wh | |
|---|---|---|---|---|---|---|
| Batteridrifttid | 7% | 50% | 1% | 4% | 9% | |
| Reader / Idle (h) | 23.9 | 20.7 -13% | 37.3 56% | 17.2 -28% | 28.5 19% | 23.9 0% |
| WiFi v1.3 (h) | 8.4 | 9.3 11% | 12 43% | 8.3 -1% | 8.4 0% | 9.2 10% |
| Load (h) | 1.8 | 2.2 22% | 2.7 50% | 2.4 33% | 1.7 -6% | 2.1 17% |
För
Emot
Läs den fullständiga versionen av den här recensionen på engelska här.
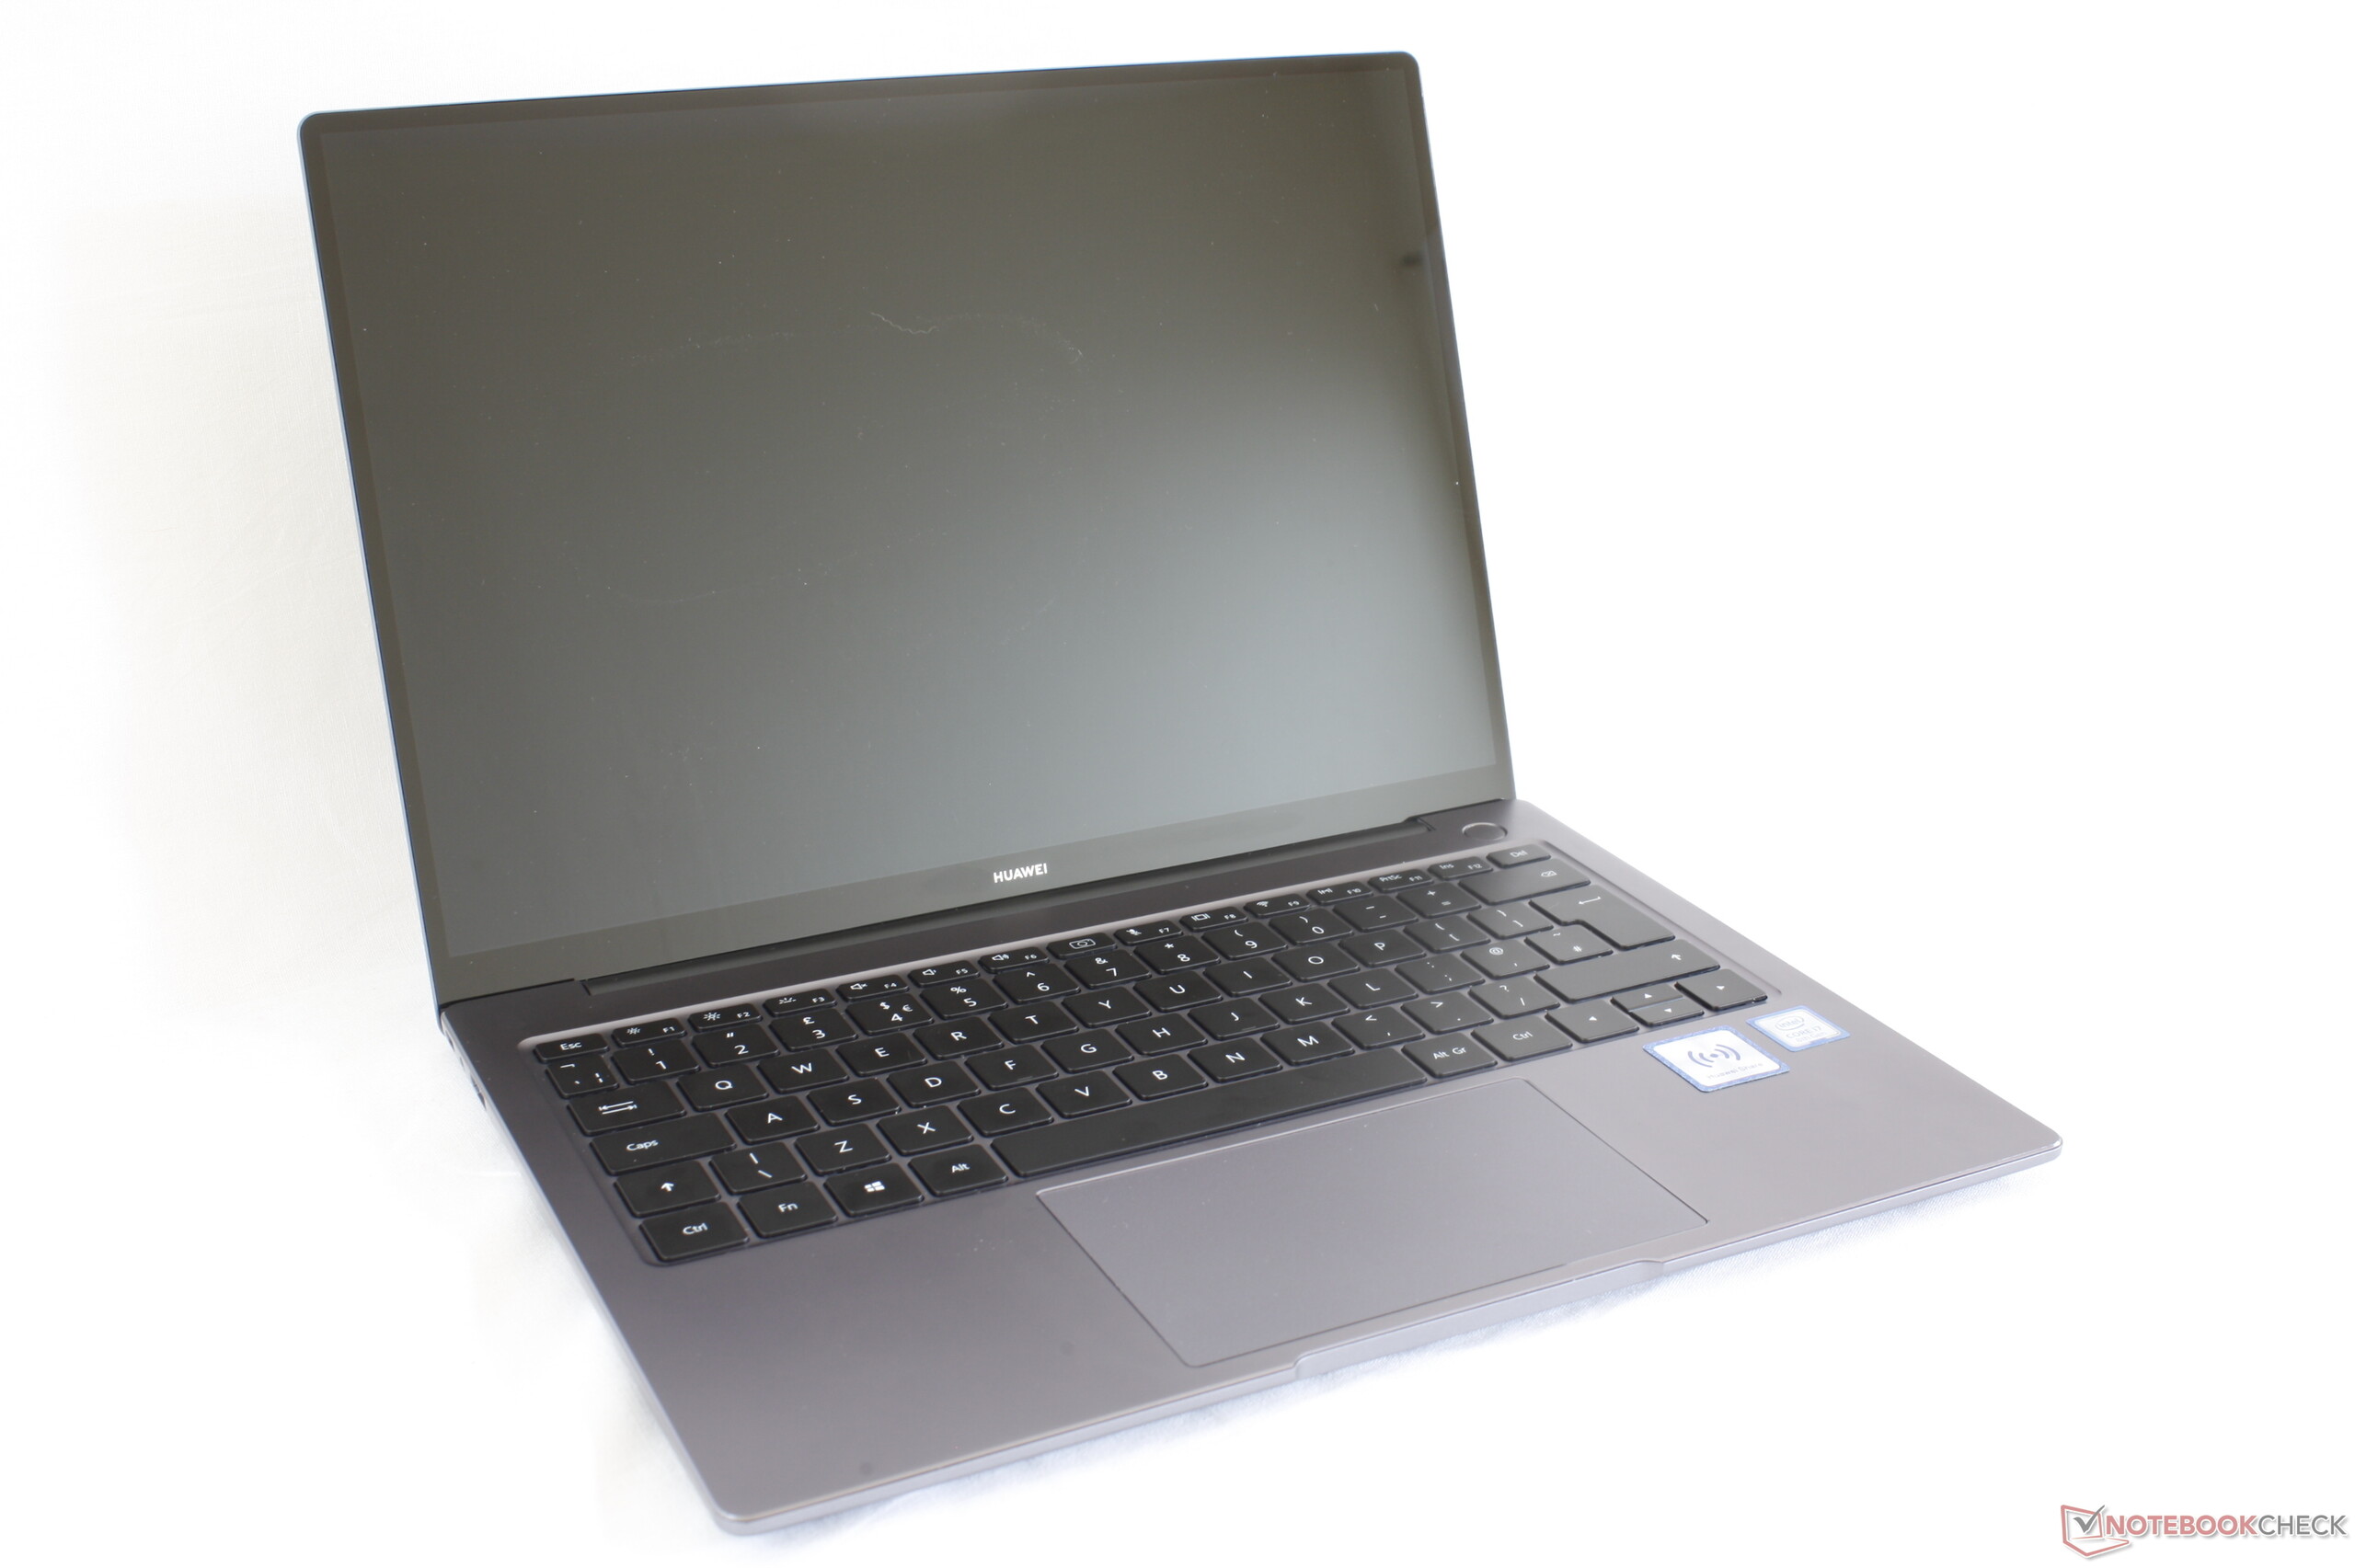
MateBook 13 får Microsoft Surface Laptop att se utdaterad ut. För runt samma pris är detta onekligen den bästa 3:2-datorn i fråga om funktioner, konstruktionskvalitet, skärm och i synnerhet grafikprestanda. Om kombinationen av ett unikt bildförhållande och en relativt högpresterande GPU är tilltalande så är MateBook 14 för dig.
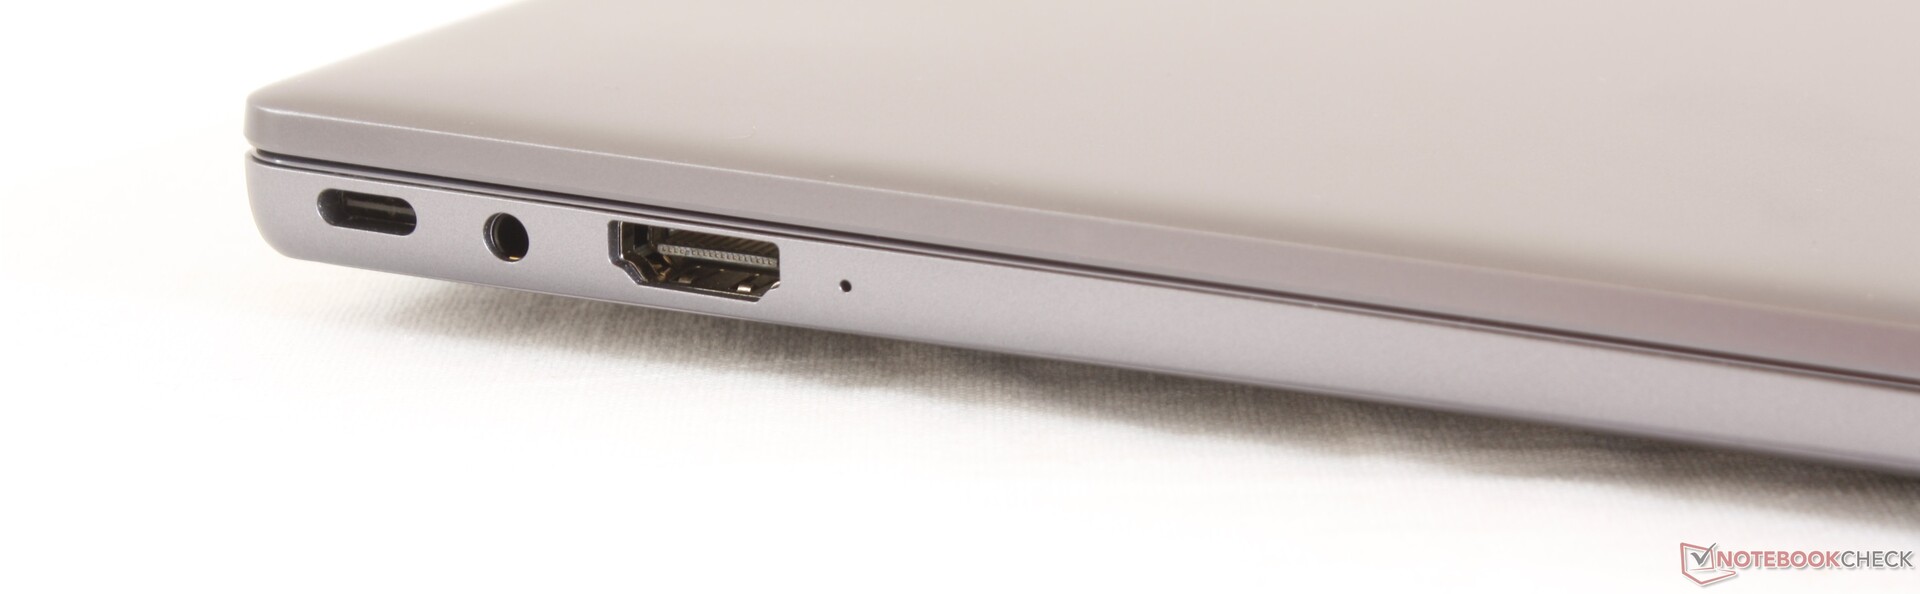
Om du däremot i huvudsak ska spela upp multimedia eller spela spel snarare än syssla med ordbehandling och surfande så passar en mer traditionell 16:9-Ultrabook med Thunderbolt 3-anslutning såsom Asus ZenBook S13 UX392 eller Razer Blade Stealth troligen bättre. MX250-kortet som sitter i MateBook 14 är knappt bättre än MX150-kortet som sitter i MateBook 13 och processorn har fortfarande svag Turbo Boost.
MateBook X Pro som släpps under 2019 kommer ha exakt samma kombination av CPU och GPU som MateBook 14 men i ett ännu tunnare hölje med fler USB Typ C-portar och en mer högupplöst tryckkänslig skärm. Nackdelen är förstås att den kommer att hamna i ett högre prisspann på 16.000 - 20.000 kronor istället för de 15.000 kronor som MateBook 14 kostar. Om du tycker att MateBook X Pro låter tilltalande men är tveksam till det höga priset bör du ta en titt på MateBook 14. Vi rekommenderar SKU:n med Core i5-8265U framför den med i7-8565U eftersom CPU-prestandan ändå kommer vara nästan identisk.
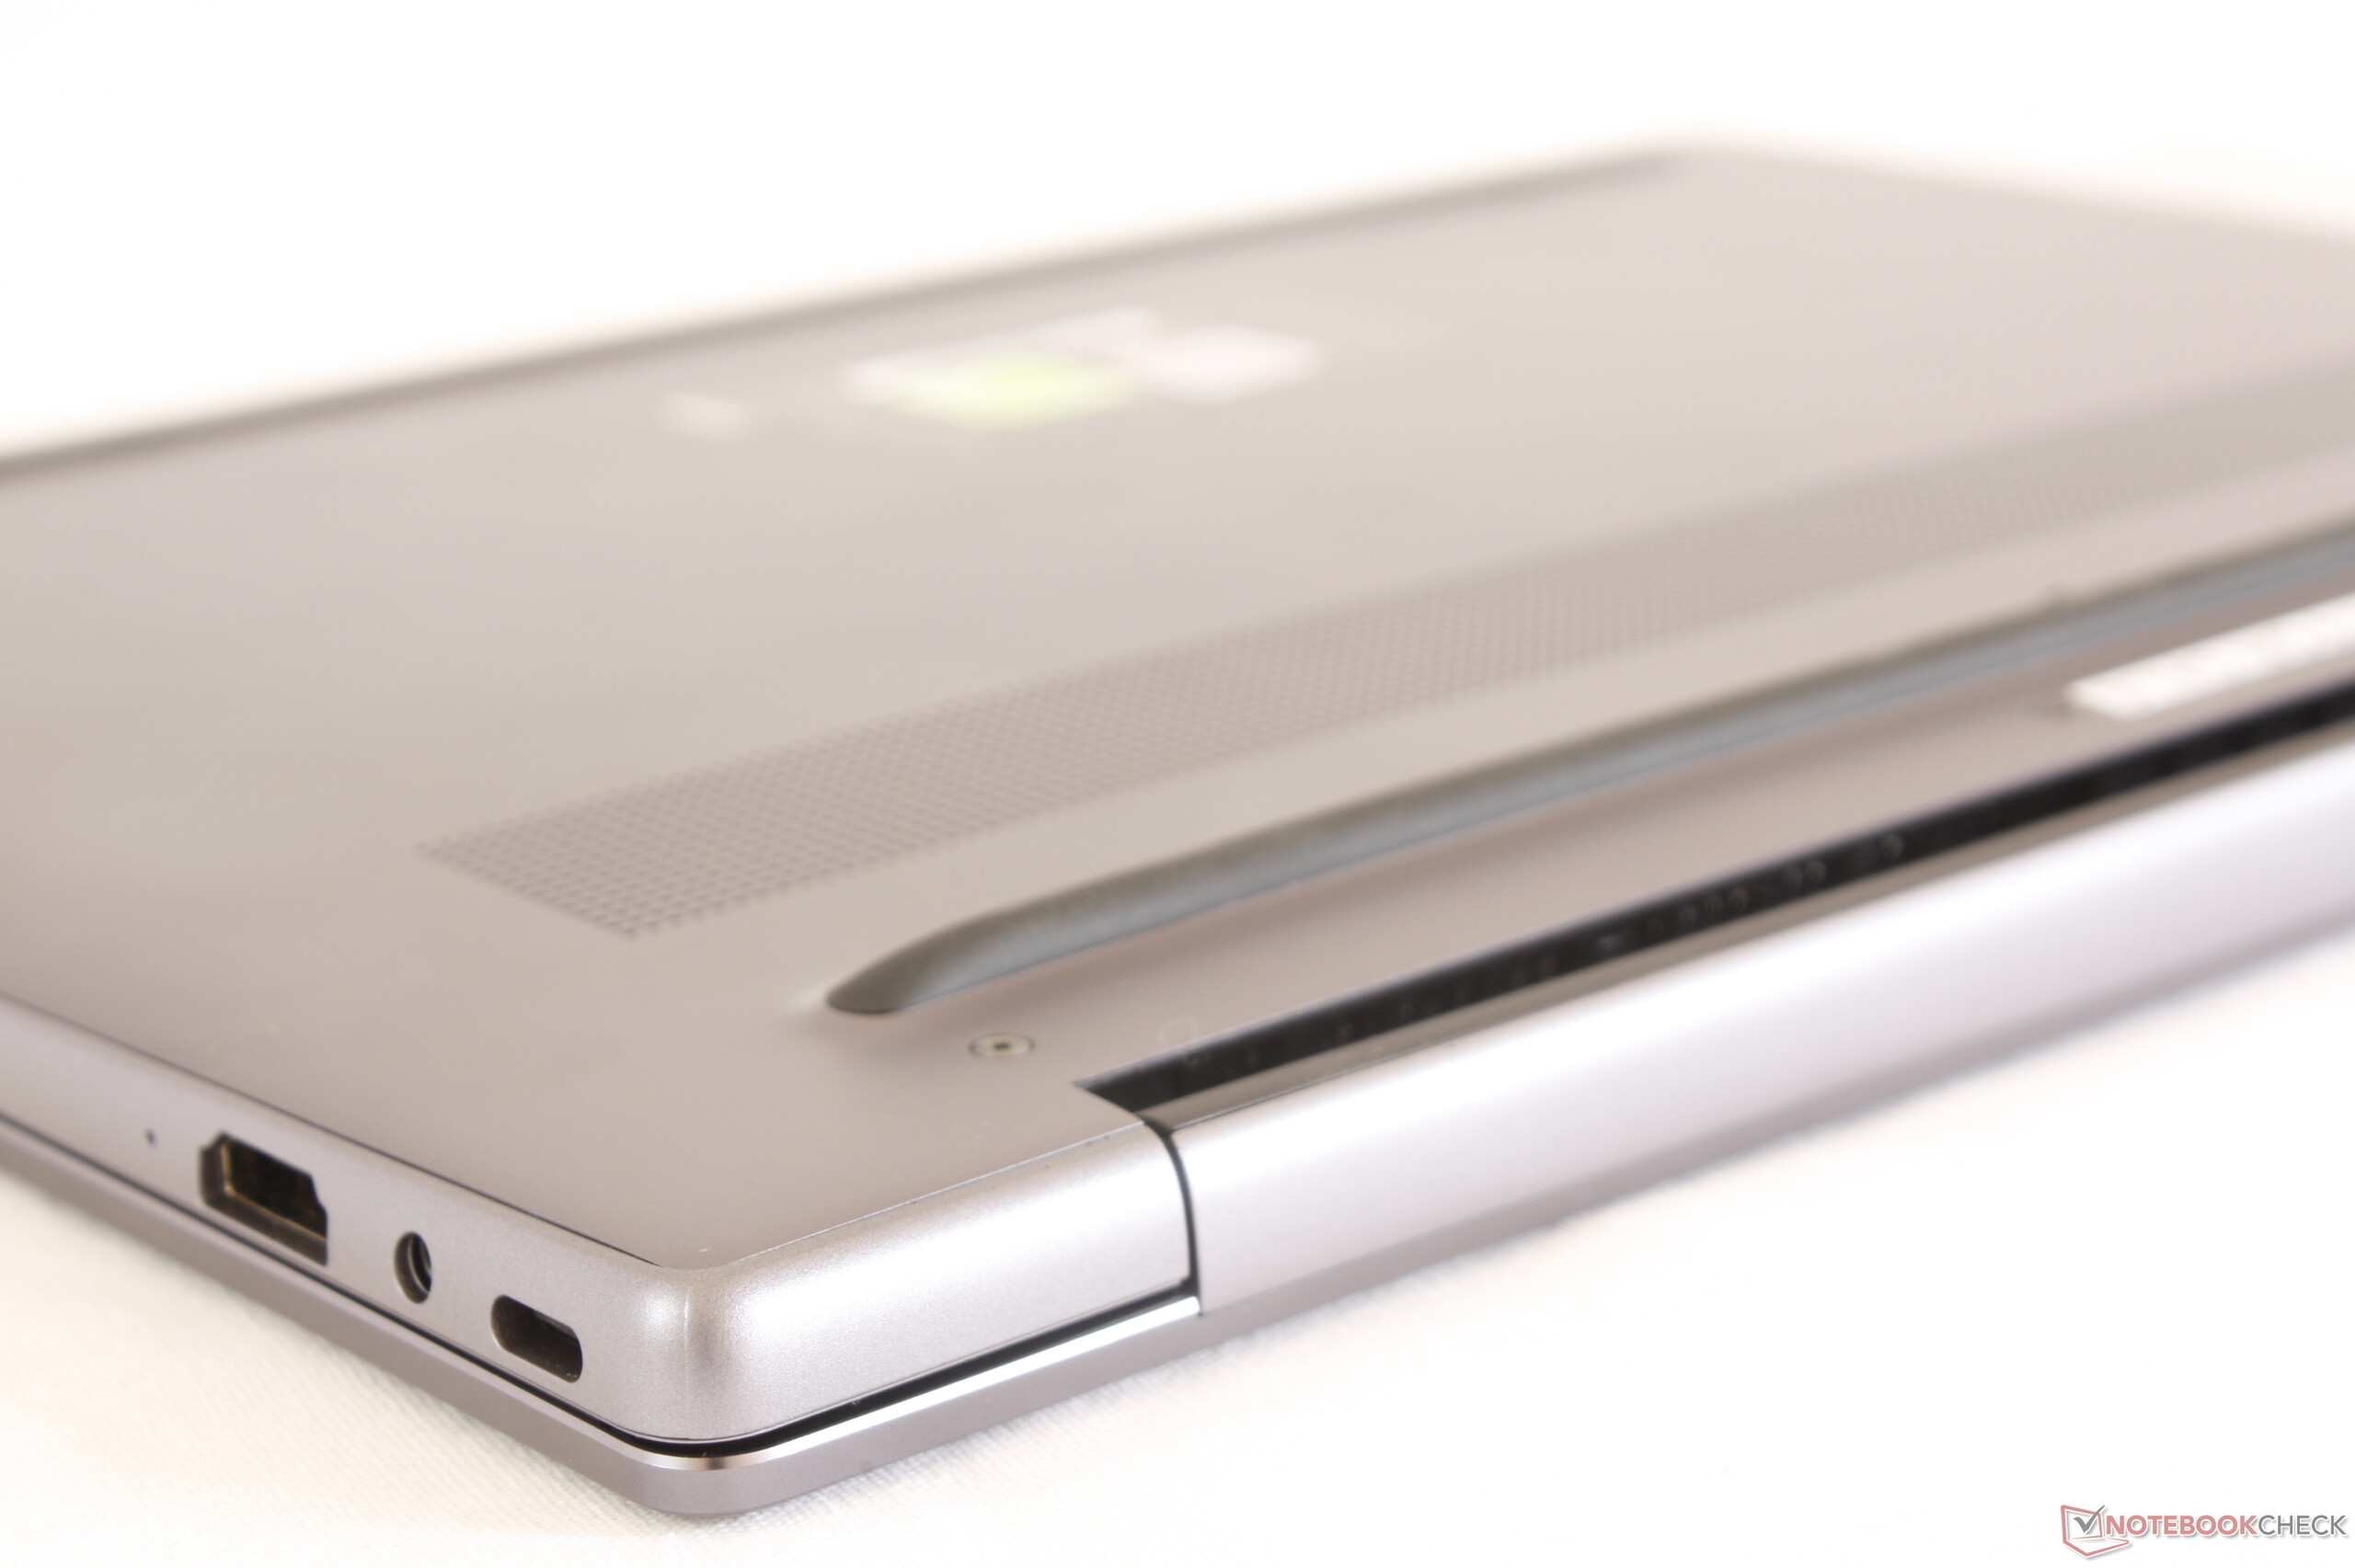
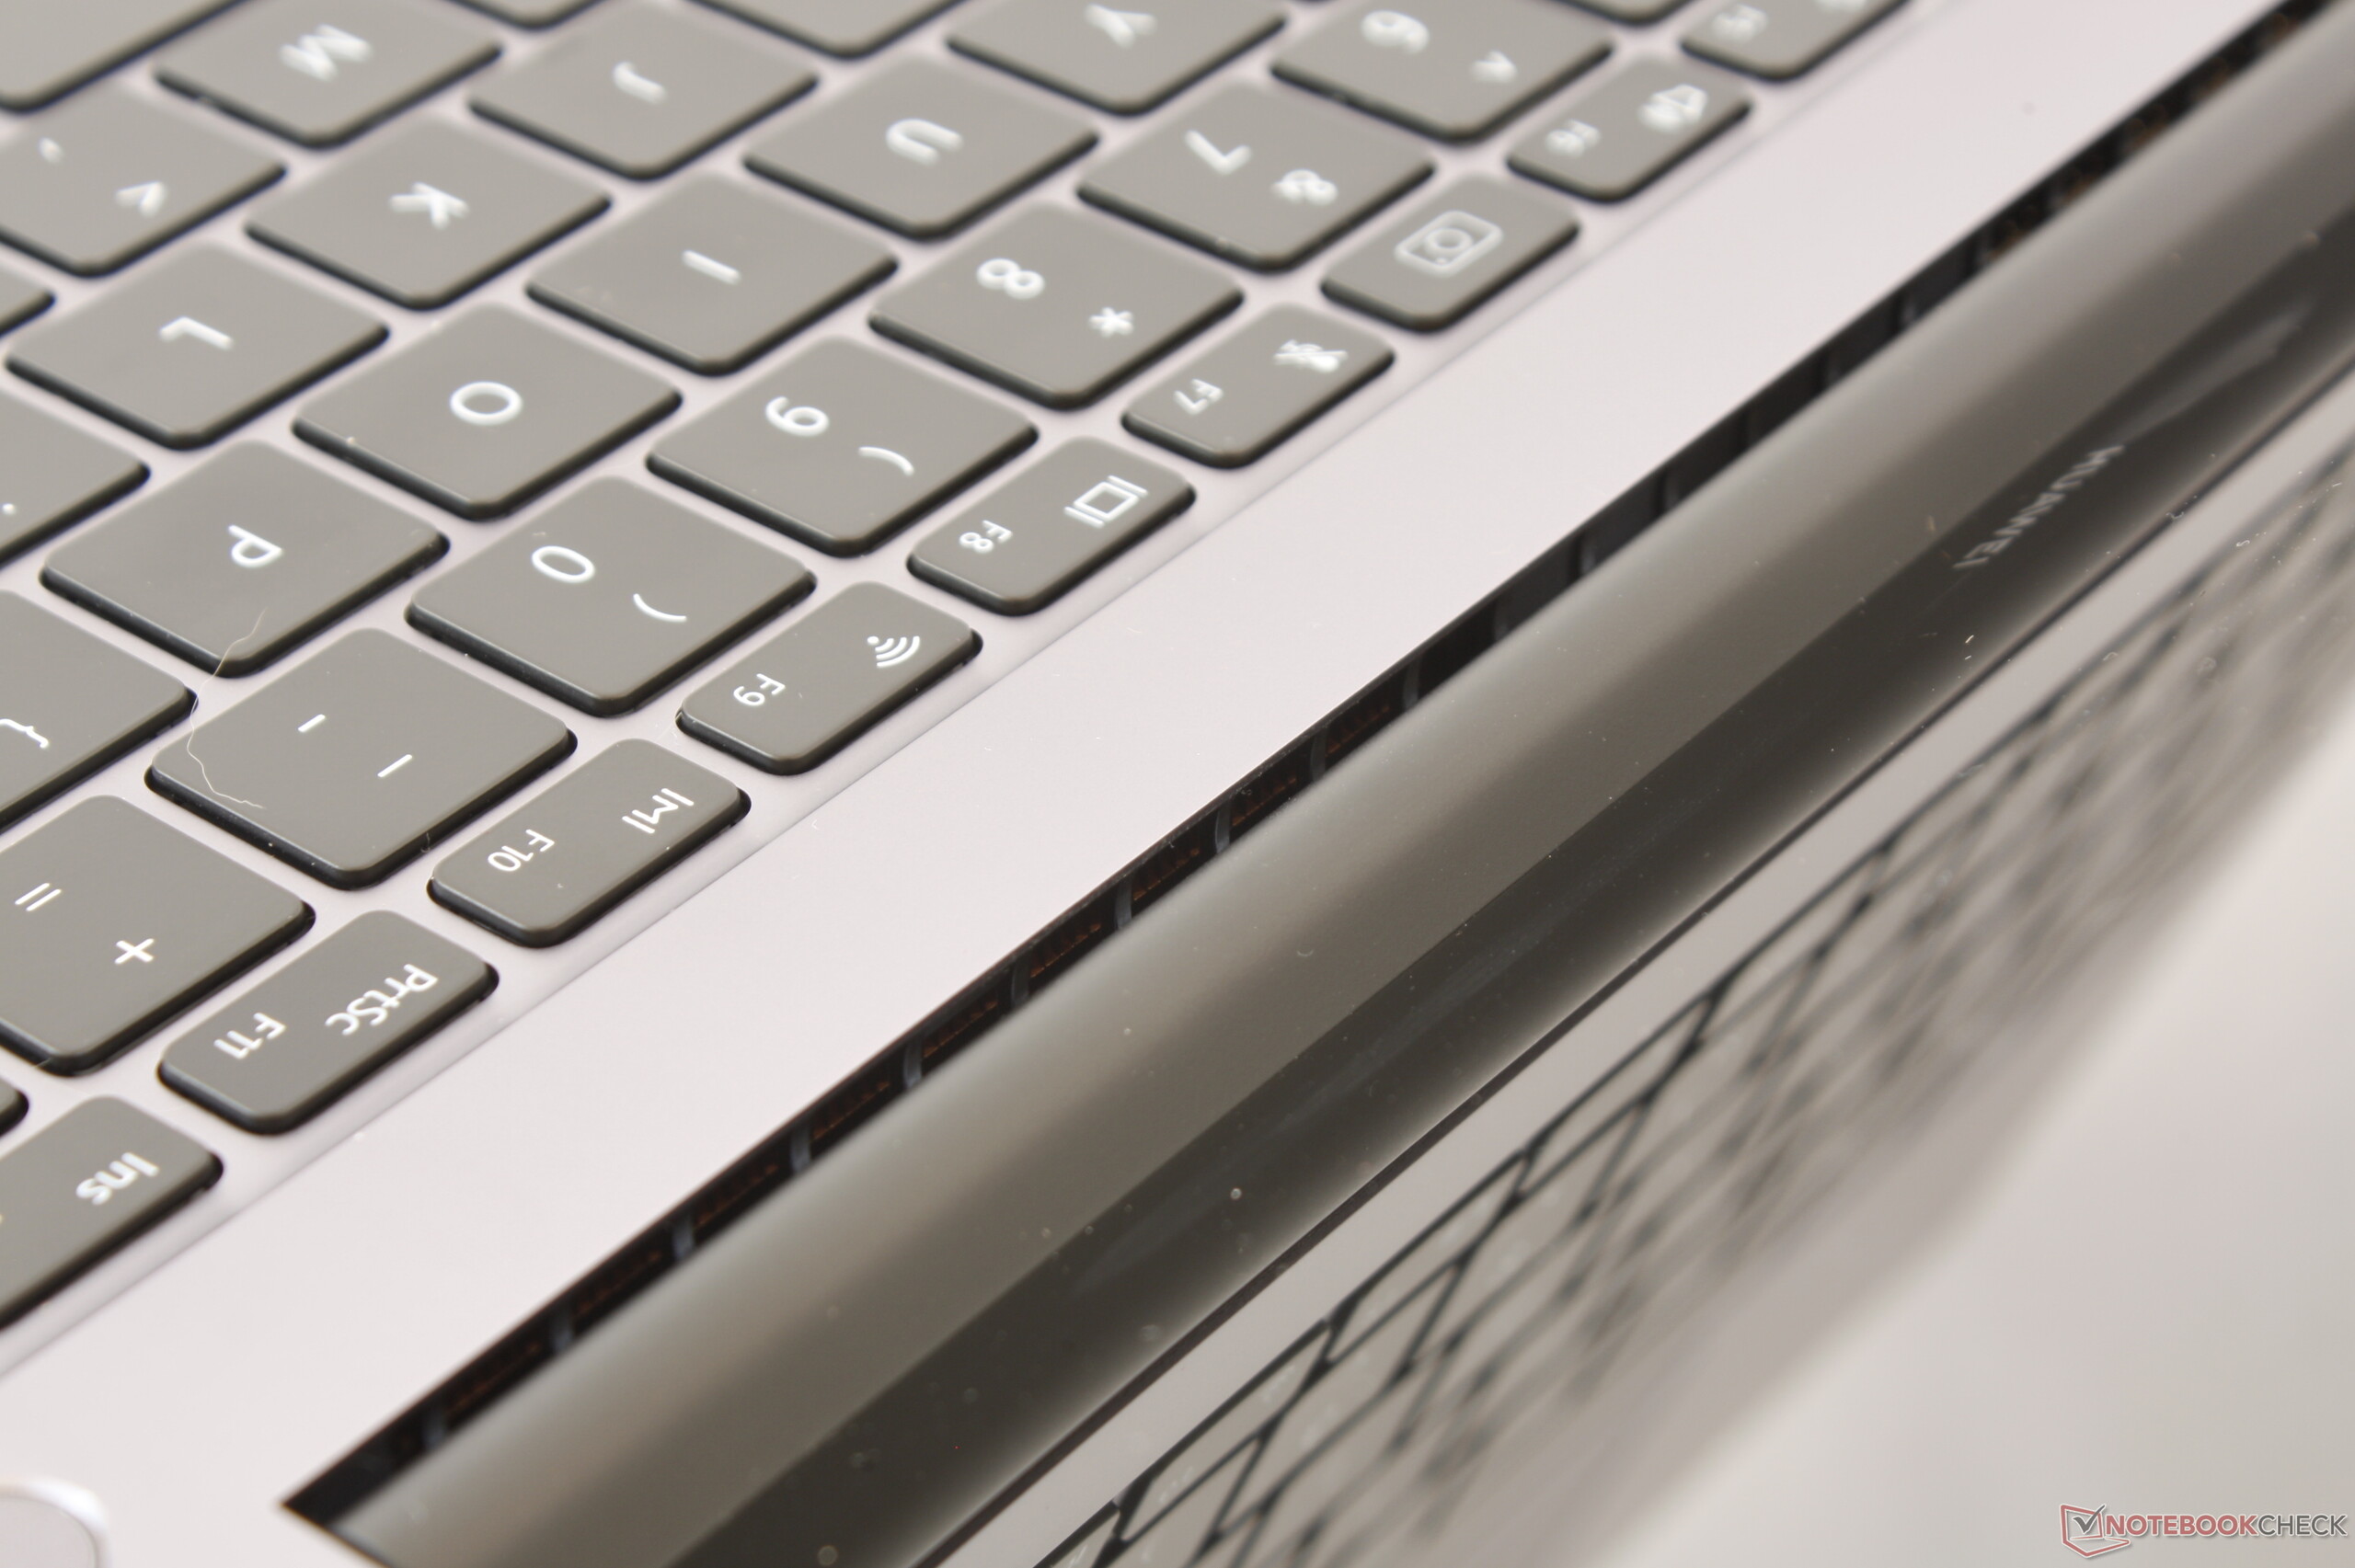
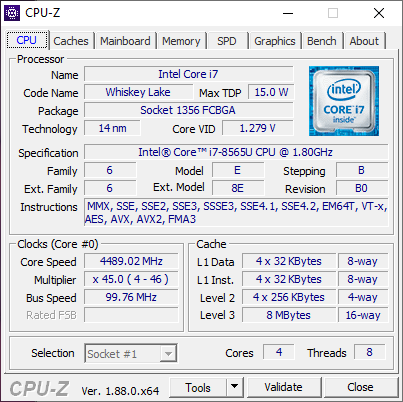
En Core i7-8565U CPU och en GeForce MX250 GPU på 25W erbjuder ganska lite jämfört med den kombination av en Core i7-8550U och ett GeForce MX150 på 25W som satt i MateBook 13. Även om detta är en av de bästa Ultrabook-modellerna med en 3:2-skärm som finns på marknaden så skulle den definitivt kunna vara ännu bättre när det kommer till portar, klickplattans återkoppling och webbkamerans placering.
Huawei MateBook 14 KLV-W29
- 05/06/2019 v6 (old)
Allen Ngo
Price comparison
