Test: Huawei MateBook X (i5-7200U, 256 GB) (sammanfattning)


| Networking | |
| iperf3 transmit AX12 | |
| Huawei MateBook X | |
| Microsoft Surface Pro (2017) i5 | |
| Lenovo IdeaPad 710S Plus-13IKB | |
| Dell XPS 13 9360 FHD i5 | |
| iperf3 receive AX12 | |
| Lenovo IdeaPad 710S Plus-13IKB | |
| Microsoft Surface Pro (2017) i5 | |
| Dell XPS 13 9360 FHD i5 | |
| Huawei MateBook X | |
| |||||||||||||||||||||||||
Distribution av ljusstyrkan: 88 %
Mitt på batteriet: 408 cd/m²
Kontrast: 907:1 (Svärta: 0.45 cd/m²)
ΔE ColorChecker Calman: 1.55 | ∀{0.5-29.43 Ø4.71}
ΔE Greyscale Calman: 1.91 | ∀{0.09-98 Ø4.96}
96% sRGB (Argyll 1.6.3 3D)
61% AdobeRGB 1998 (Argyll 1.6.3 3D)
66.8% AdobeRGB 1998 (Argyll 3D)
96.2% sRGB (Argyll 3D)
65.8% Display P3 (Argyll 3D)
Gamma: 2.34
CCT: 6491 K
| Huawei MateBook X Chi Mei CMN8201 / P130ZDZ-EF1, , 2160x1440, 13.3" | HP EliteBook 1030 G1-X2F03EA Sharp SHP1465, , 3200x1800, 13.3" | Dell XPS 13 9360 FHD i5 Sharp SHP1449 LQ133M1, , 1920x1080, 13.3" | Lenovo IdeaPad 710S Plus-13IKB LG Philips LP133WF4-SPB1 (LGD04EF), , 1920x1080, 13.3" | Microsoft Surface Pro (2017) i5 LG Display LP123WQ112604, , 2736x1824, 12.3" | |
|---|---|---|---|---|---|
| Display | 1% | -25% | -8% | 3% | |
| Display P3 Coverage (%) | 65.8 | 67.6 3% | 48.94 -26% | 65.3 -1% | 67.6 3% |
| sRGB Coverage (%) | 96.2 | 94.7 -2% | 73.3 -24% | 82.9 -14% | 99 3% |
| AdobeRGB 1998 Coverage (%) | 66.8 | 69 3% | 50.5 -24% | 60.6 -9% | 69.1 3% |
| Response Times | -18% | -19% | -29% | -24% | |
| Response Time Grey 50% / Grey 80% * (ms) | 33 ? | 42.4 ? -28% | 32.8 ? 1% | 45 ? -36% | 42 ? -27% |
| Response Time Black / White * (ms) | 24 ? | 25.6 ? -7% | 33.2 ? -38% | 29 ? -21% | 29 ? -21% |
| PWM Frequency (Hz) | 21000 | ||||
| Screen | -40% | -86% | -60% | -25% | |
| Brightness middle (cd/m²) | 408 | 401 -2% | 351.2 -14% | 343 -16% | 417 2% |
| Brightness (cd/m²) | 395 | 369 -7% | 325 -18% | 306 -23% | 401 2% |
| Brightness Distribution (%) | 88 | 85 -3% | 89 1% | 81 -8% | 88 0% |
| Black Level * (cd/m²) | 0.45 | 0.35 22% | 0.195 57% | 0.3 33% | 0.29 36% |
| Contrast (:1) | 907 | 1146 26% | 1801 99% | 1143 26% | 1438 59% |
| Colorchecker dE 2000 * | 1.55 | 3.5 -126% | 7.4 -377% | 4.73 -205% | 3.63 -134% |
| Colorchecker dE 2000 max. * | 2.19 | 6.33 -189% | 9.08 -315% | 9.05 -313% | 6.74 -208% |
| Greyscale dE 2000 * | 1.91 | 4.13 -116% | 6.71 -251% | 3.29 -72% | 2.18 -14% |
| Gamma | 2.34 94% | 2.28 96% | 2.74 80% | 2.36 93% | 3.09 71% |
| CCT | 6491 100% | 6508 100% | 7222 90% | 6437 101% | 6767 96% |
| Color Space (Percent of AdobeRGB 1998) (%) | 61 | 61.56 1% | 50.48 -17% | 54 -11% | 63 3% |
| Color Space (Percent of sRGB) (%) | 96 | 94.64 -1% | 73.31 -24% | 83 -14% | 99 3% |
| Totalt genomsnitt (program/inställningar) | -19% /
-28% | -43% /
-65% | -32% /
-46% | -15% /
-19% |
* ... mindre är bättre
Visa svarstider
| ↔ Svarstid svart till vitt | ||
|---|---|---|
| 24 ms ... stiga ↗ och falla ↘ kombinerat | ↗ 12 ms stiga | 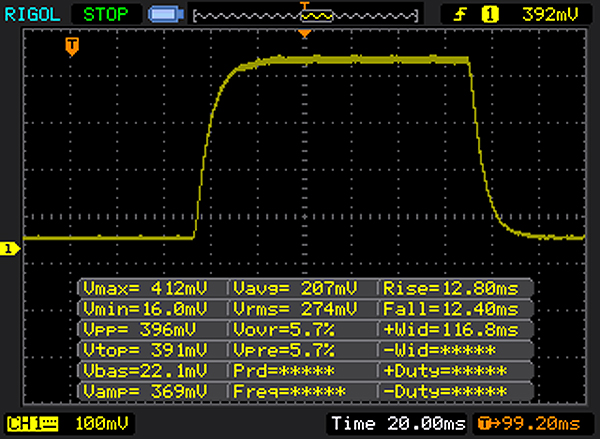 |
| ↘ 12 ms hösten | ||
| Skärmen visar bra svarsfrekvens i våra tester, men kan vara för långsam för konkurrenskraftiga spelare. I jämförelse sträcker sig alla testade enheter från 0.1 (minst) till 240 (maximalt) ms. » 54 % av alla enheter är bättre. Detta innebär att den uppmätta svarstiden är sämre än genomsnittet av alla testade enheter (19.8 ms). | ||
| ↔ Svarstid 50 % grått till 80 % grått | ||
| 33 ms ... stiga ↗ och falla ↘ kombinerat | ↗ 15 ms stiga | 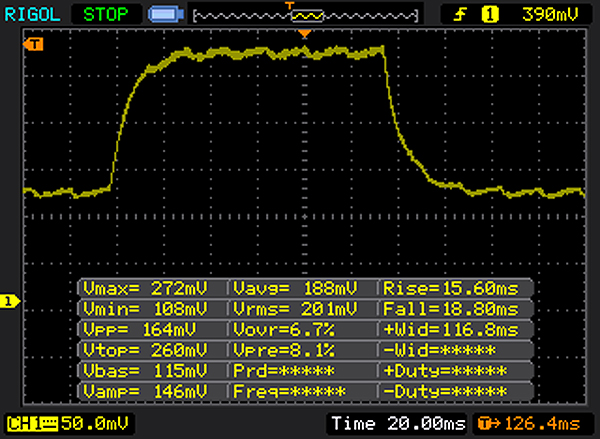 |
| ↘ 18 ms hösten | ||
| Skärmen visar långsamma svarsfrekvenser i våra tester och kommer att vara otillfredsställande för spelare. I jämförelse sträcker sig alla testade enheter från 0.165 (minst) till 636 (maximalt) ms. » 45 % av alla enheter är bättre. Det betyder att den uppmätta svarstiden liknar genomsnittet av alla testade enheter (31 ms). | ||
Skärmflimmer / PWM (Puls-Width Modulation)
| Skärmflimmer / PWM upptäcktes inte | ||
Som jämförelse: 52 % av alla testade enheter använder inte PWM för att dämpa skärmen. Om PWM upptäcktes mättes ett medelvärde av 7754 (minst: 5 - maximum: 343500) Hz. | ||
| PCMark 8 Home Score Accelerated v2 | 3507 poäng | |
| PCMark 8 Work Score Accelerated v2 | 4276 poäng | |
Hjälp | ||
| Huawei MateBook X LITEON CB1-SD256 | HP EliteBook 1030 G1-X2F03EA Sandisk X300 SD7SN6S-512G-1006 | Dell XPS 13 9360 FHD i5 Toshiba NVMe THNSN5256GPUK | Lenovo IdeaPad 710S Plus-13IKB Samsung PM961 NVMe MZVLW512HMJP | Microsoft Surface Pro (2017) i5 Samsung PM971 KUS030202M | |
|---|---|---|---|---|---|
| CrystalDiskMark 3.0 | -21% | 41% | 117% | 30% | |
| Read Seq (MB/s) | 741 | 387.5 -48% | 1233 66% | 1577 113% | 723 -2% |
| Write Seq (MB/s) | 461.2 | 348.7 -24% | 733 59% | 1472 219% | 853 85% |
| Read 512 (MB/s) | 504 | 239.9 -52% | 1036 106% | 1165 131% | 225 -55% |
| Write 512 (MB/s) | 310.3 | 335.3 8% | 439.9 42% | 1244 301% | 445 43% |
| Read 4k (MB/s) | 29.48 | 30.34 3% | 29.31 -1% | 54.8 86% | 46 56% |
| Write 4k (MB/s) | 68.1 | 75.9 11% | 116.9 72% | 121.5 78% | 125 84% |
| Read 4k QD32 (MB/s) | 498.9 | 311.3 -38% | 479.2 -4% | 407.5 -18% | 423 -15% |
| Write 4k QD32 (MB/s) | 257.5 | 192.8 -25% | 218.3 -15% | 321.4 25% | 373 45% |

| 3DMark 11 - 1280x720 Performance GPU | |
| Lenovo IdeaPad 710S Plus-13IKB | |
| Dell XPS 13 9360 FHD i5 | |
| Huawei MateBook X | |
| HP EliteBook 1030 G1-X2F03EA | |
| 3DMark | |
| 1280x720 Cloud Gate Standard Graphics | |
| Lenovo IdeaPad 710S Plus-13IKB | |
| Dell XPS 13 9360 FHD i5 | |
| Huawei MateBook X | |
| Microsoft Surface Pro (2017) i5 | |
| HP EliteBook 1030 G1-X2F03EA | |
| 1920x1080 Fire Strike Graphics | |
| Lenovo IdeaPad 710S Plus-13IKB | |
| Dell XPS 13 9360 FHD i5 | |
| HP EliteBook 1030 G1-X2F03EA | |
| Microsoft Surface Pro (2017) i5 | |
| Huawei MateBook X | |
| 3DMark 11 Performance | 1667 poäng | |
| 3DMark Ice Storm Standard Score | 54224 poäng | |
| 3DMark Cloud Gate Standard Score | 5691 poäng | |
| 3DMark Fire Strike Score | 785 poäng | |
Hjälp | ||
| låg | med. | hög | ultra | |
|---|---|---|---|---|
| Battlefield 1 (2016) | 11.7 | |||
| Farming Simulator 17 (2016) | 61.2 | 40.8 | 14 | |
| For Honor (2017) | 20.2 |
(±) Den maximala temperaturen på ovansidan är 40.4 °C / 105 F, jämfört med genomsnittet av 35.9 °C / 97 F , allt från 21.4 till 59 °C för klassen Subnotebook.
(±) Botten värms upp till maximalt 41.2 °C / 106 F, jämfört med genomsnittet av 39.2 °C / 103 F
(+) Vid tomgångsbruk är medeltemperaturen för ovansidan 25.3 °C / 78 F, jämfört med enhetsgenomsnittet på 30.8 °C / ### class_avg_f### F.
(+) Handledsstöden och pekplattan når maximal hudtemperatur (32.8 °C / 91 F) och är därför inte varma.
(-) Medeltemperaturen för handledsstödsområdet på liknande enheter var 28.2 °C / 82.8 F (-4.6 °C / -8.2 F).
Huawei MateBook X ljudanalys
(-) | inte särskilt höga högtalare (66 dB)
Bas 100 - 315 Hz
(±) | reducerad bas - i genomsnitt 8.3% lägre än medianen
(±) | linjäriteten för basen är genomsnittlig (7.6% delta till föregående frekvens)
Mellan 400 - 2000 Hz
(+) | balanserad mellan - endast 3.3% från medianen
(+) | mids är linjära (6.2% delta till föregående frekvens)
Högsta 2 - 16 kHz
(+) | balanserade toppar - endast 2.6% från medianen
(+) | toppar är linjära (6.6% delta till föregående frekvens)
Totalt 100 - 16 000 Hz
(+) | det totala ljudet är linjärt (14.7% skillnad mot median)
Jämfört med samma klass
» 31% av alla testade enheter i den här klassen var bättre, 5% liknande, 64% sämre
» Den bästa hade ett delta på 5%, genomsnittet var 18%, sämst var 53%
Jämfört med alla testade enheter
» 19% av alla testade enheter var bättre, 4% liknande, 77% sämre
» Den bästa hade ett delta på 4%, genomsnittet var 23%, sämst var 134%
HP EliteBook 1030 G1-X2F03EA ljudanalys
(+) | högtalare kan spela relativt högt (83.3 dB)
Bas 100 - 315 Hz
(-) | nästan ingen bas - i genomsnitt 22.7% lägre än medianen
(±) | linjäriteten för basen är genomsnittlig (11.2% delta till föregående frekvens)
Mellan 400 - 2000 Hz
(+) | balanserad mellan - endast 4.1% från medianen
(±) | linjäriteten för mids är genomsnittlig (7.5% delta till föregående frekvens)
Högsta 2 - 16 kHz
(+) | balanserade toppar - endast 2.2% från medianen
(+) | toppar är linjära (5.2% delta till föregående frekvens)
Totalt 100 - 16 000 Hz
(±) | linjäriteten för det totala ljudet är genomsnittlig (19.8% skillnad mot median)
Jämfört med samma klass
» 63% av alla testade enheter i den här klassen var bättre, 7% liknande, 31% sämre
» Den bästa hade ett delta på 5%, genomsnittet var 18%, sämst var 53%
Jämfört med alla testade enheter
» 51% av alla testade enheter var bättre, 7% liknande, 42% sämre
» Den bästa hade ett delta på 4%, genomsnittet var 23%, sämst var 134%
Dell XPS 13 9360 FHD i5 ljudanalys
(-) | inte särskilt höga högtalare (70.3 dB)
Bas 100 - 315 Hz
(±) | reducerad bas - i genomsnitt 6.9% lägre än medianen
(±) | linjäriteten för basen är genomsnittlig (10.5% delta till föregående frekvens)
Mellan 400 - 2000 Hz
(+) | balanserad mellan - endast 3.7% från medianen
(+) | mids är linjära (4% delta till föregående frekvens)
Högsta 2 - 16 kHz
(+) | balanserade toppar - endast 2% från medianen
(±) | linjäriteten för toppar är genomsnittlig (10.3% delta till föregående frekvens)
Totalt 100 - 16 000 Hz
(±) | linjäriteten för det totala ljudet är genomsnittlig (18.3% skillnad mot median)
Jämfört med samma klass
» 53% av alla testade enheter i den här klassen var bättre, 7% liknande, 40% sämre
» Den bästa hade ett delta på 5%, genomsnittet var 18%, sämst var 53%
Jämfört med alla testade enheter
» 40% av alla testade enheter var bättre, 8% liknande, 52% sämre
» Den bästa hade ett delta på 4%, genomsnittet var 23%, sämst var 134%
Lenovo IdeaPad 710S Plus-13IKB ljudanalys
(±) | högtalarljudstyrkan är genomsnittlig men bra (73 dB)
Bas 100 - 315 Hz
(-) | nästan ingen bas - i genomsnitt 21.4% lägre än medianen
(±) | linjäriteten för basen är genomsnittlig (12.2% delta till föregående frekvens)
Mellan 400 - 2000 Hz
(±) | högre mellan - i genomsnitt 6.7% högre än median
(±) | linjäriteten för mids är genomsnittlig (10.6% delta till föregående frekvens)
Högsta 2 - 16 kHz
(+) | balanserade toppar - endast 2.2% från medianen
(+) | toppar är linjära (6.9% delta till föregående frekvens)
Totalt 100 - 16 000 Hz
(±) | linjäriteten för det totala ljudet är genomsnittlig (24.4% skillnad mot median)
Jämfört med samma klass
» 82% av alla testade enheter i den här klassen var bättre, 4% liknande, 13% sämre
» Den bästa hade ett delta på 5%, genomsnittet var 18%, sämst var 53%
Jämfört med alla testade enheter
» 74% av alla testade enheter var bättre, 6% liknande, 20% sämre
» Den bästa hade ett delta på 4%, genomsnittet var 23%, sämst var 134%
Microsoft Surface Pro (2017) i5 ljudanalys
(-) | inte särskilt höga högtalare (68 dB)
Bas 100 - 315 Hz
(±) | reducerad bas - i genomsnitt 9.7% lägre än medianen
(±) | linjäriteten för basen är genomsnittlig (7% delta till föregående frekvens)
Mellan 400 - 2000 Hz
(+) | balanserad mellan - endast 4.6% från medianen
(+) | mids är linjära (6.3% delta till föregående frekvens)
Högsta 2 - 16 kHz
(+) | balanserade toppar - endast 2.1% från medianen
(+) | toppar är linjära (5.2% delta till föregående frekvens)
Totalt 100 - 16 000 Hz
(±) | linjäriteten för det totala ljudet är genomsnittlig (18.2% skillnad mot median)
Jämfört med samma klass
» 40% av alla testade enheter i den här klassen var bättre, 7% liknande, 53% sämre
» Den bästa hade ett delta på 6%, genomsnittet var 20%, sämst var 57%
Jämfört med alla testade enheter
» 39% av alla testade enheter var bättre, 8% liknande, 53% sämre
» Den bästa hade ett delta på 4%, genomsnittet var 23%, sämst var 134%
| Av/Standby | |
| Låg belastning | |
| Hög belastning |
|
Förklaring:
min: | |
| Huawei MateBook X i5-7200U, HD Graphics 620, LITEON CB1-SD256, , 2160x1440, 13.3" | HP EliteBook 1030 G1-X2F03EA 6Y75, HD Graphics 515, Sandisk X300 SD7SN6S-512G-1006, IPS, 3200x1800, 13.3" | Dell XPS 13 9360 FHD i5 i5-7200U, HD Graphics 620, Toshiba NVMe THNSN5256GPUK, IPS, 1920x1080, 13.3" | Lenovo IdeaPad 710S Plus-13IKB i7-7500U, GeForce 940MX, Samsung PM961 NVMe MZVLW512HMJP, IPS, 1920x1080, 13.3" | Microsoft Surface Pro (2017) i5 i5-7300U, HD Graphics 620, Samsung PM971 KUS030202M, IPS, 2736x1824, 12.3" | |
|---|---|---|---|---|---|
| Power Consumption | 20% | 38% | 10% | 28% | |
| Idle Minimum * (Watt) | 4.6 | 4 13% | 4.1 11% | 3.6 22% | 3.6 22% |
| Idle Average * (Watt) | 11 | 8 27% | 4.2 62% | 7.4 33% | 8.1 26% |
| Idle Maximum * (Watt) | 12 | 8.6 28% | 5.1 57% | 8.7 27% | 8.7 27% |
| Load Average * (Watt) | 39.5 | 26.5 33% | 22.1 44% | 43 -9% | 25.5 35% |
| Load Maximum * (Watt) | 34.6 | 34.8 -1% | 29.4 15% | 42 -21% | 23.5 32% |
* ... mindre är bättre
| Huawei MateBook X i5-7200U, HD Graphics 620, 40 Wh | HP EliteBook 1030 G1-X2F03EA 6Y75, HD Graphics 515, 40 Wh | Dell XPS 13 9360 FHD i5 i5-7200U, HD Graphics 620, 60 Wh | Lenovo IdeaPad 710S Plus-13IKB i7-7500U, GeForce 940MX, 46 Wh | Microsoft Surface Pro (2017) i5 i5-7300U, HD Graphics 620, 45 Wh | |
|---|---|---|---|---|---|
| Batteridrifttid | 0% | 84% | -17% | 77% | |
| Reader / Idle (h) | 8.5 | 10.3 21% | 21.6 154% | 7.8 -8% | 17.6 107% |
| WiFi v1.3 (h) | 5.6 | 5.1 -9% | 11.3 102% | 5.6 0% | 12.4 121% |
| Load (h) | 2.7 | 2.4 -11% | 2.6 -4% | 1.5 -44% | 2.8 4% |
| H.264 (h) | 6.3 |
För
Emot
Läs hela testet på engelska här.
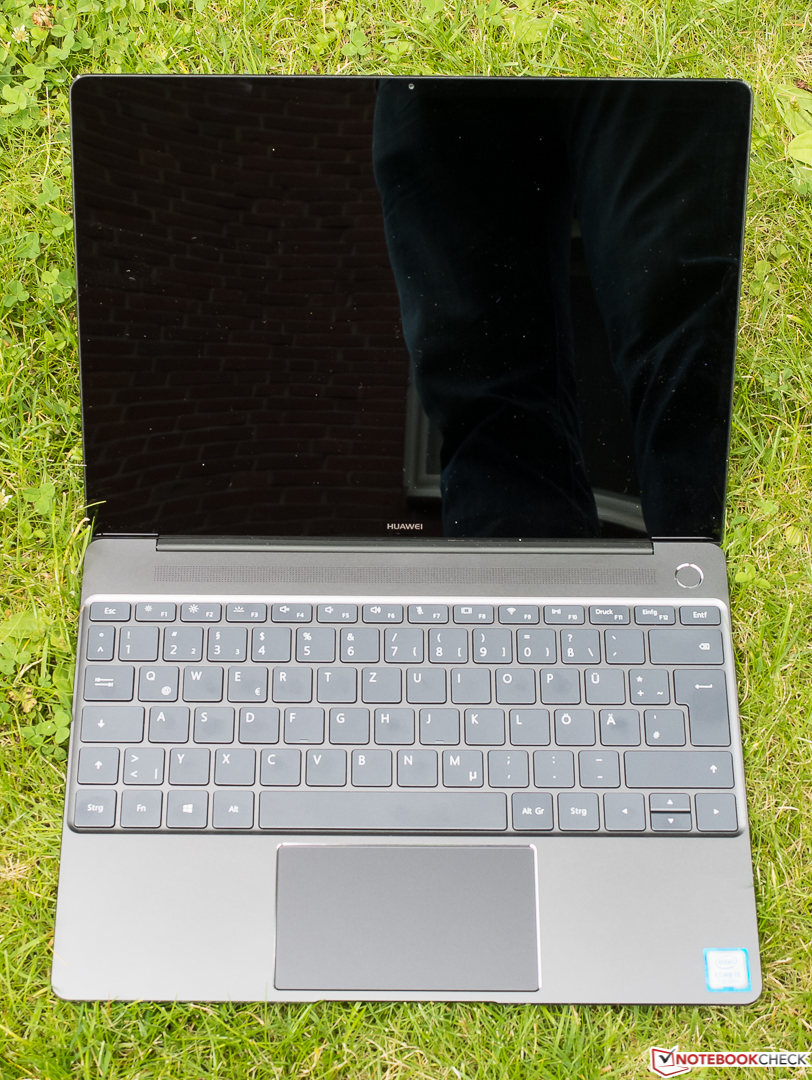
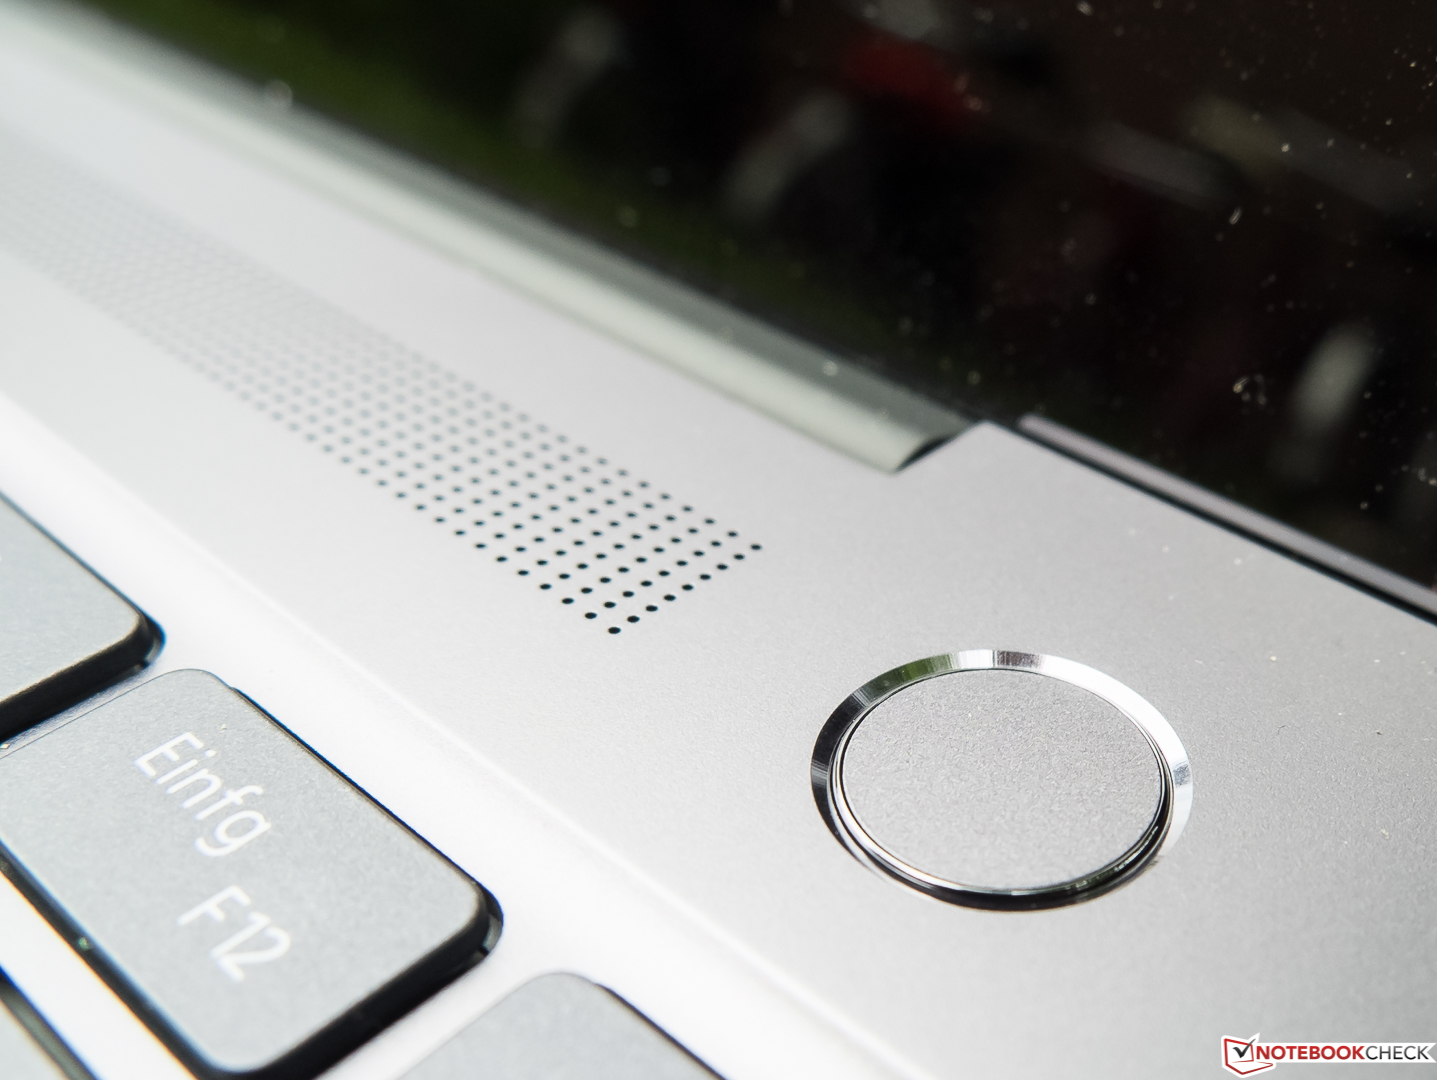
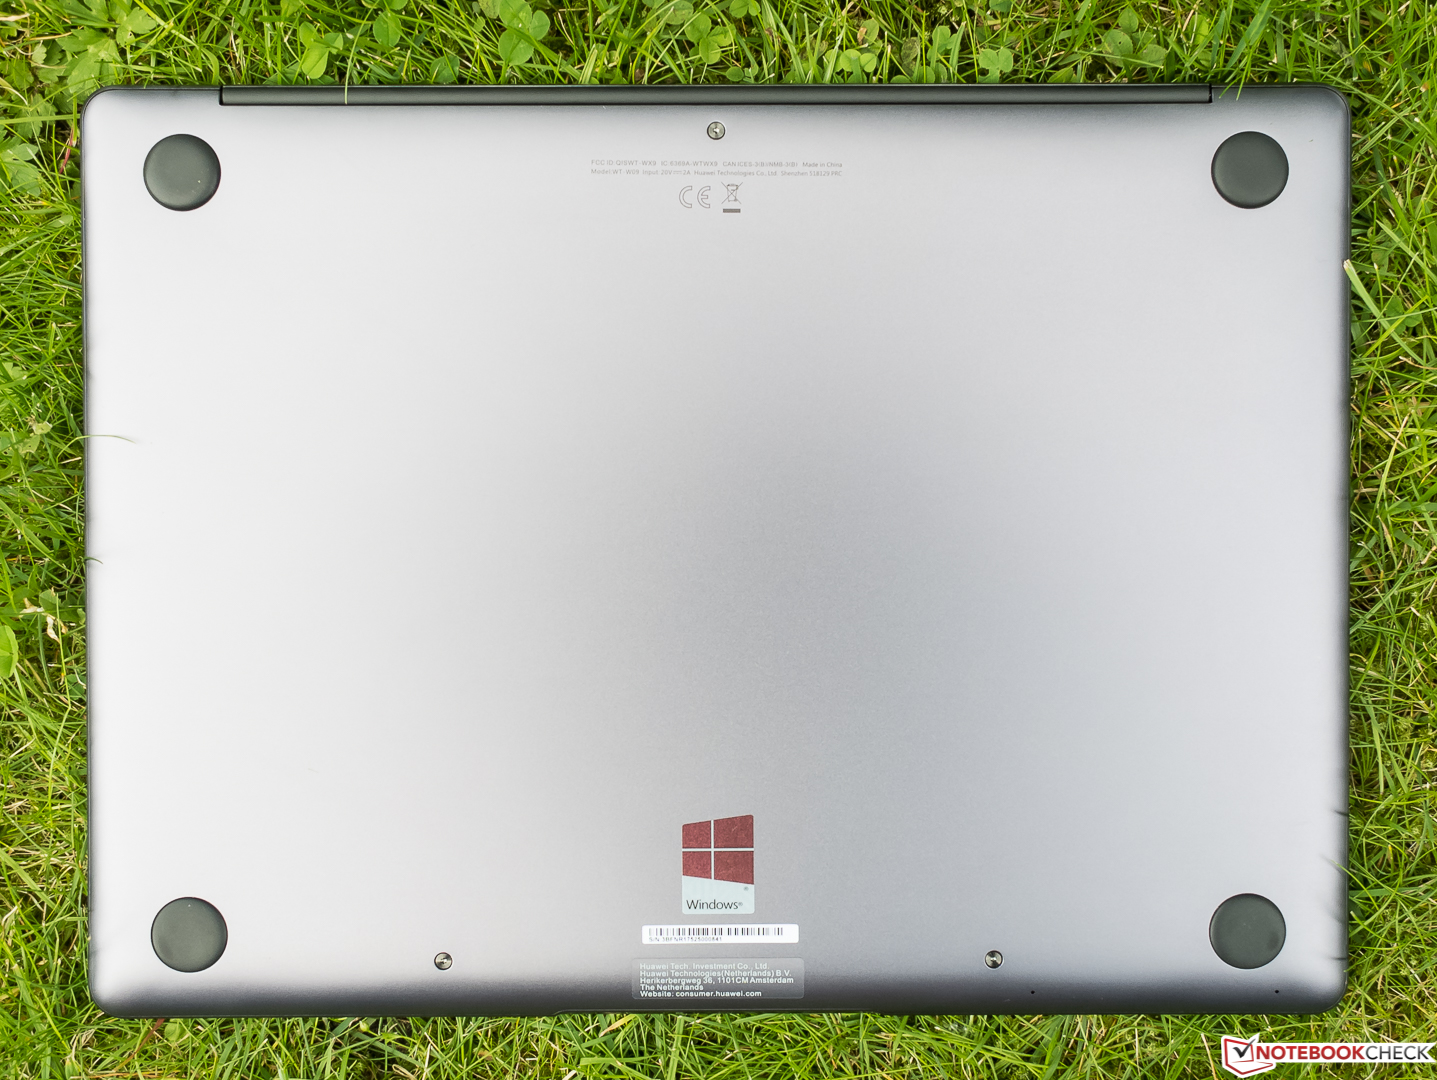
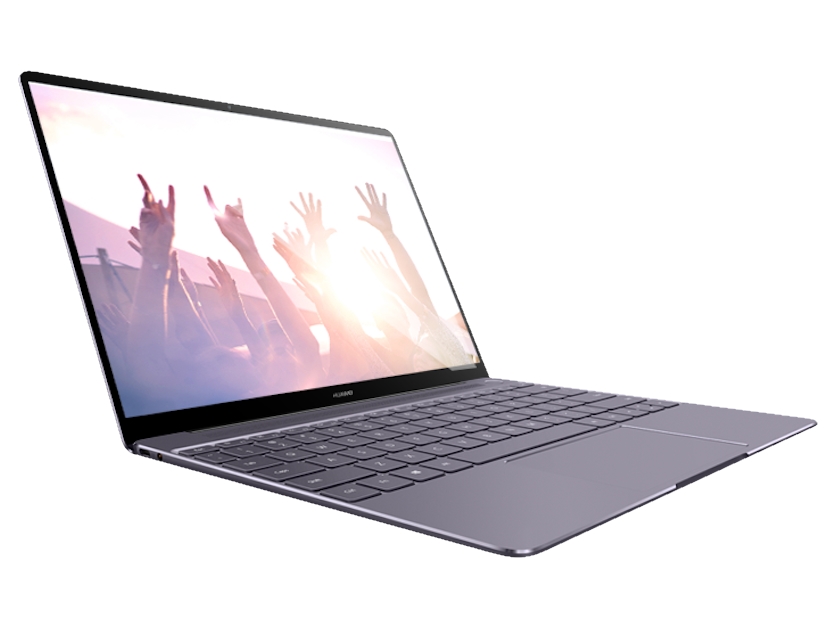
Enligt vår uppfattning är Huaweis debut på laptopmarknaden lyckad. Den välbyggda MateBook X, i det alltmer populära formatet 3:2, är kompakt, robust, ser bra ut och har ett nytt passivt MEPCM-kylsystem. Det sistnämnda är tillräckligt effektivt under normal drift, även om det når sina gränser under konstant belastning. De tillgängliga säkerhetsfunktionerna, som fingeravtryckssensor och TPM 2.0, understryker den mobila aspekten.
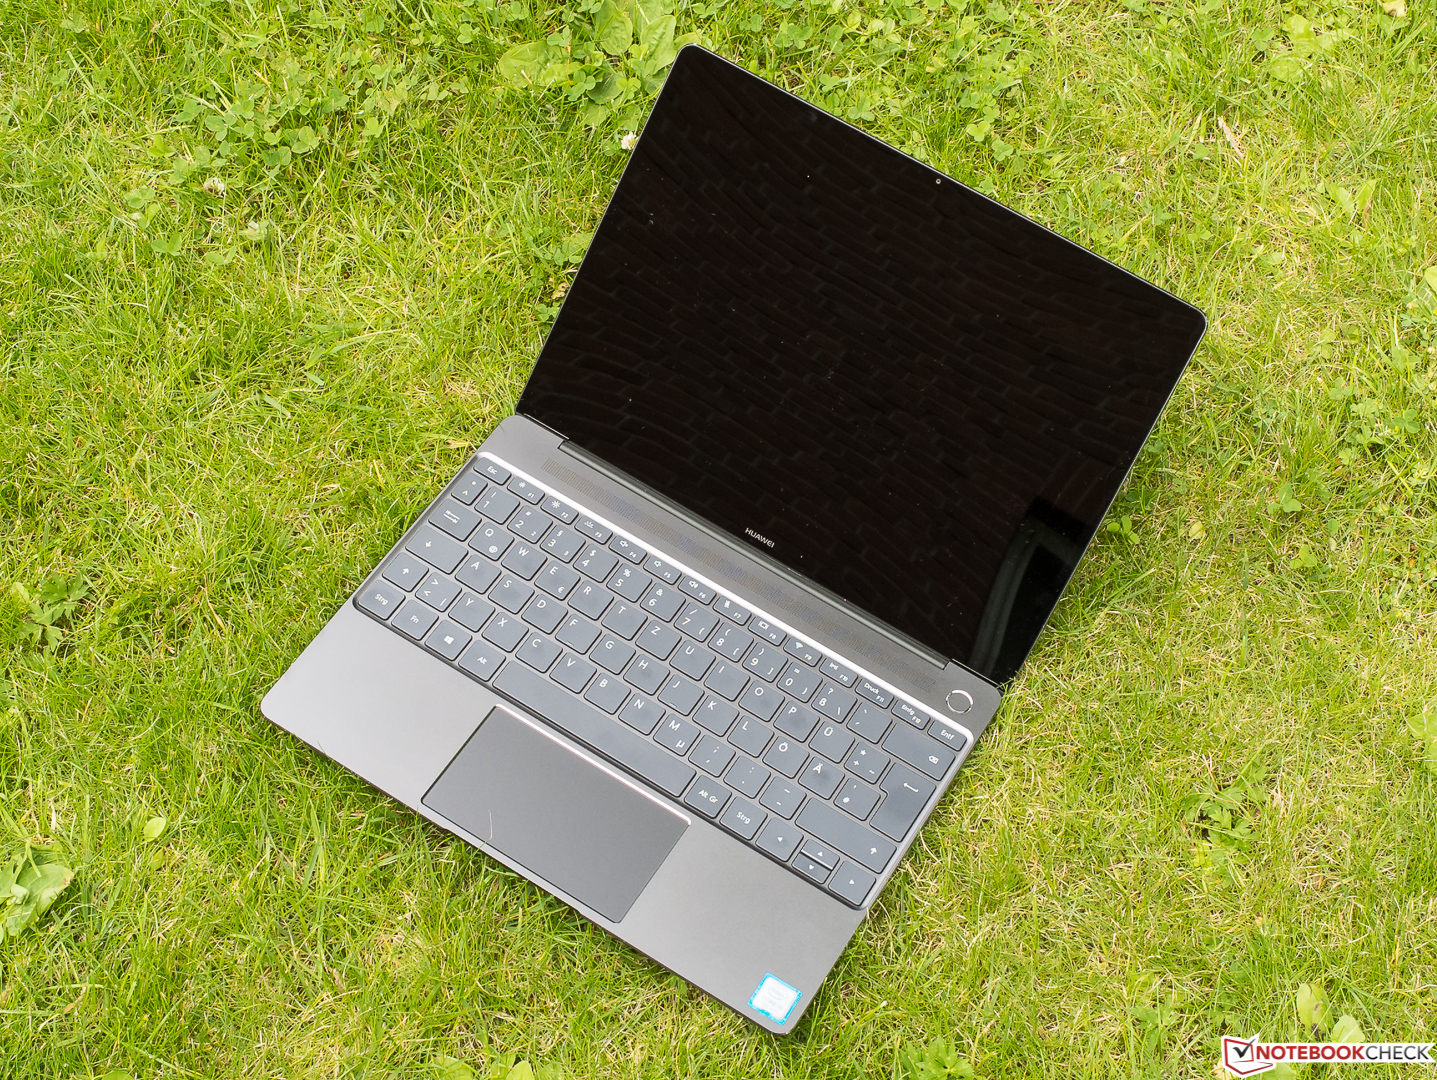
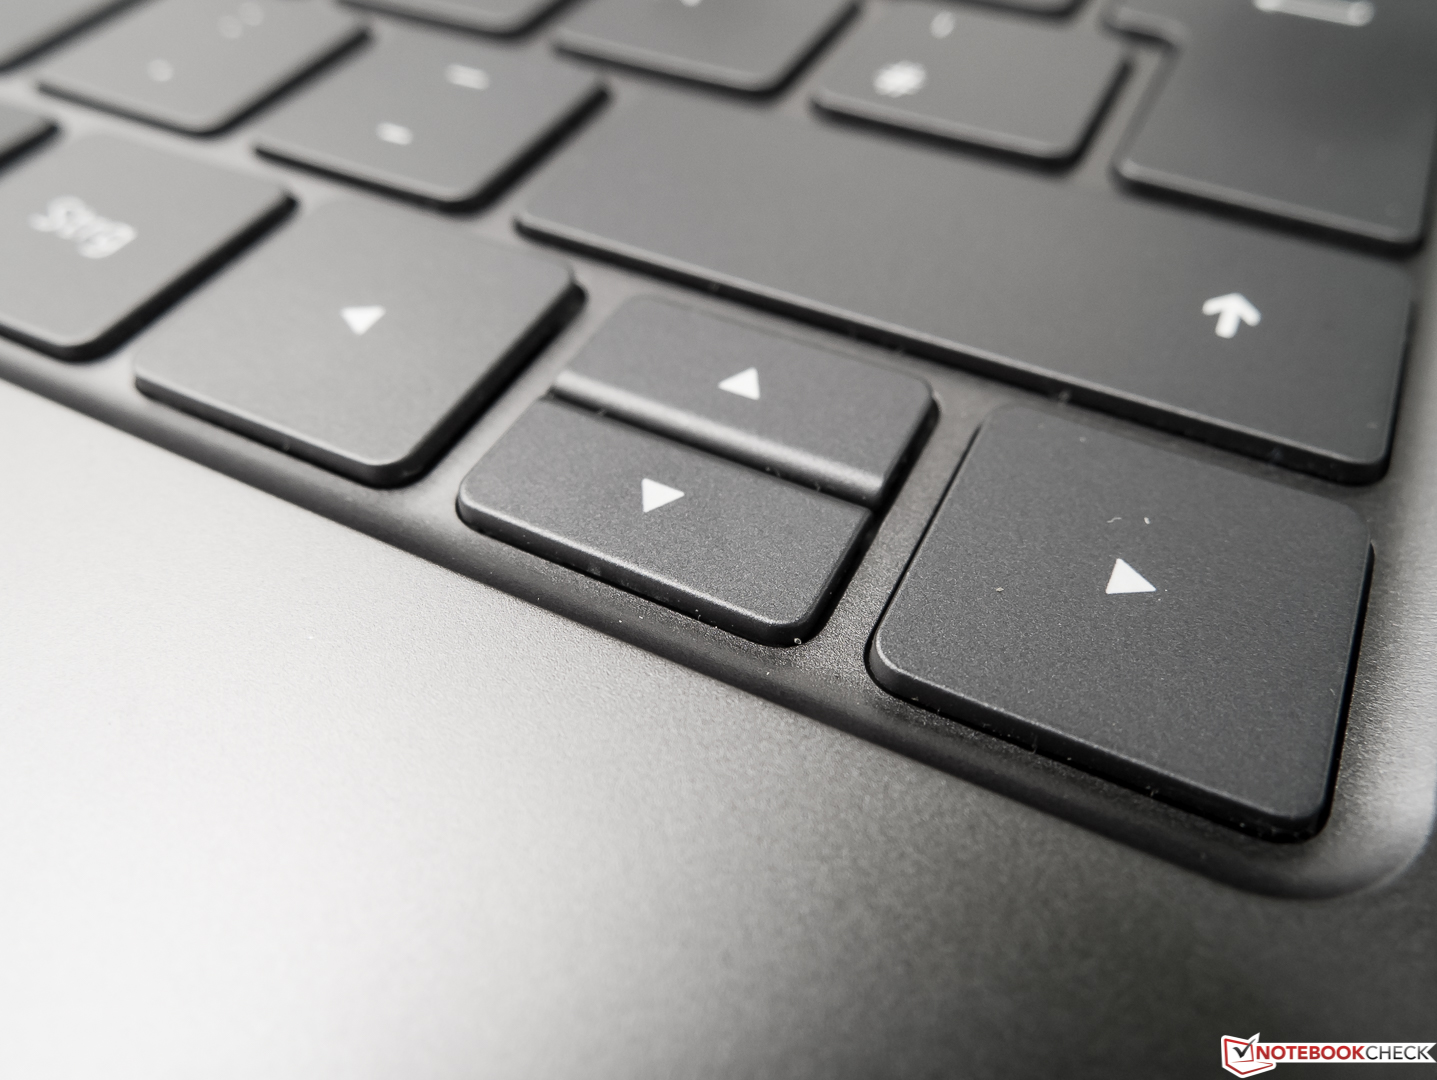
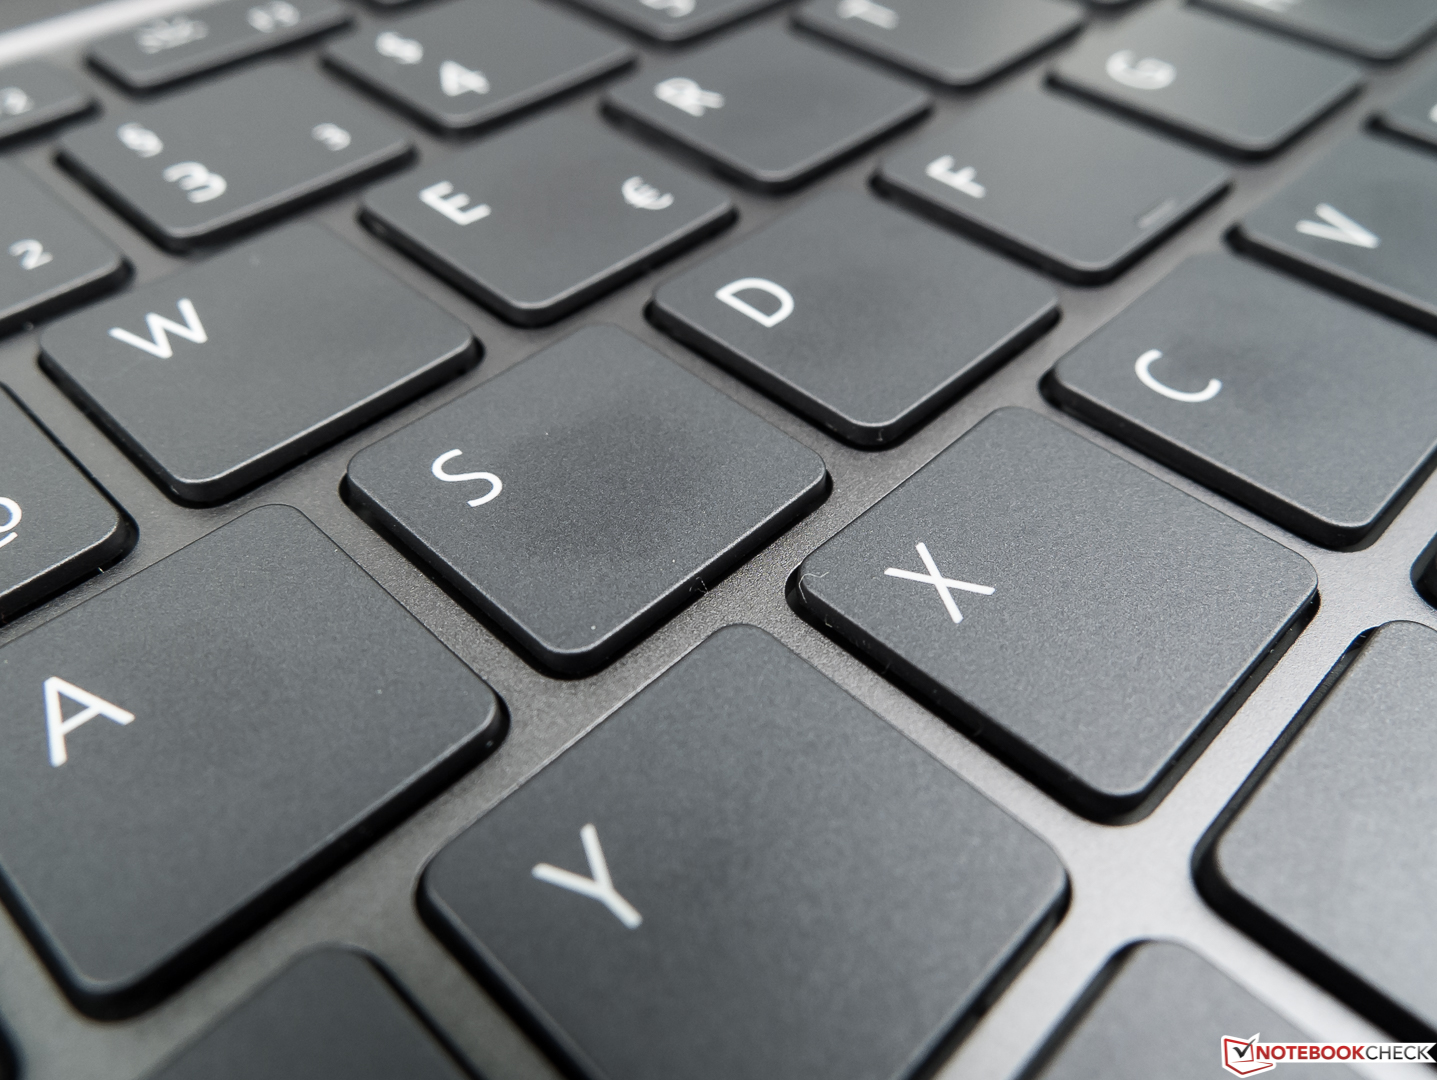
Det går kanske att vänja sig vid tangentbordet, som med sin svampiga återkoppling inte var optimalt för testaren. Den för höga energiförbrukningen – och därmed den dåliga batteritiden – kan eventuellt lösas med en BIOS- eller UEFI-uppdatering, då det verkar vara ett mjukvaruproblem. Pekplattan var ett annat aber.
Att anslutningsmöjligheterna ofta tvingar dig att använda den medföljande adaptern är en annan invändning, eftersom du inte får glömma den hemma. Visserligen hade inte chassikonceptet varit genomförbart på något annat sätt. De enda svagheterna i den överlag utmärkta skärmen är dess något höga svärta och naturligtvis den reflekterande ytan.
Om Huawei kunde få grepp om den höga energiförbrukningen och den därför låga batteritiden skulle MateBook X få ett ännu bättre betyg, men den når ändå upp i 87%, vilket trots allt är utmärkt.
Huawei MateBook X
- 07/26/2017 v6 (old)
Sven Kloevekorn