Test: Dell Inspiron 14 5000 5482 2-in-1 (i7-8565U) Omvandlingsbar (Sammanfattning)
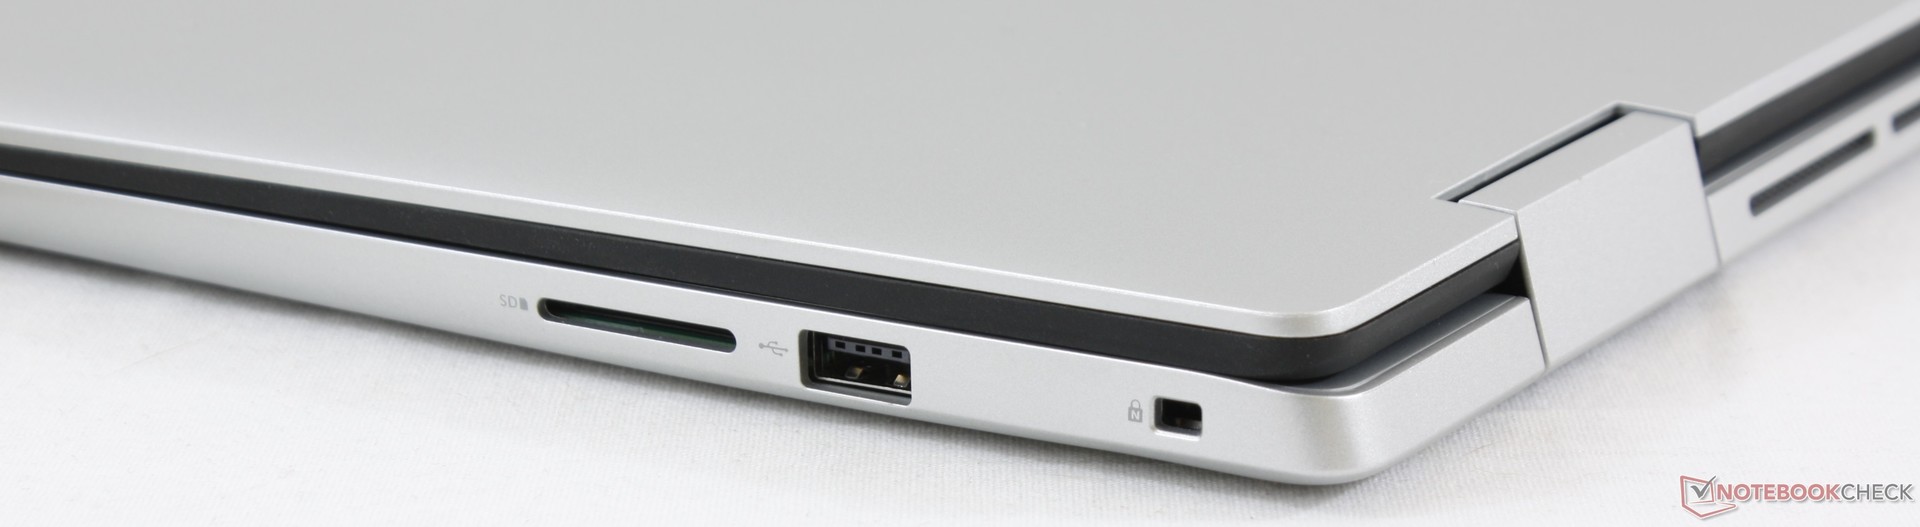
| SD Card Reader | |
| average JPG Copy Test (av. of 3 runs) | |
| Dell XPS 13 9370 i7 UHD (Toshiba Exceria Pro UHS-II) | |
| Dell Inspiron 14 5000 5482 2-in-1 (Toshiba Exceria Pro SDXC 64 GB UHS-II) | |
| Lenovo Yoga 530-14IKB-81EK00CWGE (Toshiba Exceria Pro SDXC 64 GB UHS-II) | |
| Asus VivoBook Flip 14 TP412UA-DB51T (Toshiba Exceria Pro SDXC 64 GB UHS-II) | |
| maximum AS SSD Seq Read Test (1GB) | |
| Dell XPS 13 9370 i7 UHD (Toshiba Exceria Pro UHS-II) | |
| Dell Inspiron 14 5000 5482 2-in-1 (Toshiba Exceria Pro SDXC 64 GB UHS-II) | |
| Lenovo Yoga 530-14IKB-81EK00CWGE (Toshiba Exceria Pro SDXC 64 GB UHS-II) | |
| Asus VivoBook Flip 14 TP412UA-DB51T (Toshiba Exceria Pro SDXC 64 GB UHS-II) | |
| |||||||||||||||||||||||||
Distribution av ljusstyrkan: 78 %
Mitt på batteriet: 193.6 cd/m²
Kontrast: 1139:1 (Svärta: 0.17 cd/m²)
ΔE ColorChecker Calman: 6.99 | ∀{0.5-29.43 Ø4.71}
calibrated: 4.86
ΔE Greyscale Calman: 5.7 | ∀{0.09-98 Ø4.96}
58.1% sRGB (Calman 2D)
37.6% AdobeRGB 1998 (Argyll 1.6.3 3D)
41.91% AdobeRGB 1998 (Argyll 3D)
58.6% sRGB (Argyll 3D)
40.57% Display P3 (Argyll 3D)
Gamma: 2.12
CCT: 5845 K
| Dell Inspiron 14 5000 5482 2-in-1 NV14N4H, IPS, 14", 1920x1080 | Lenovo Yoga 530-14IKB-81EK00CWGE InfoVision M140NWF5 R2, IPS, 14", 1920x1080 | Asus VivoBook Flip 14 TP412UA-DB51T AUO B140HAN04.0, IPS, 14", 1920x1080 | Dell XPS 13 9365-4537 2-in-1 Sharp LQ133Z1, IPS, 13.3", 3200x1800 | Lenovo Yoga C930-13IKB B139HAN03_0, IPS, 13.9", 1920x1080 | Huawei Matebook X Pro i5 Tianma XM, IPS, 13.9", 3000x2000 | |
|---|---|---|---|---|---|---|
| Display | 3% | -2% | 59% | 59% | 62% | |
| Display P3 Coverage (%) | 40.57 | 41.52 2% | 39.42 -3% | 64.4 59% | 64.3 58% | 65.9 62% |
| sRGB Coverage (%) | 58.6 | 62.1 6% | 59.2 1% | 92.9 59% | 94.6 61% | 95.2 62% |
| AdobeRGB 1998 Coverage (%) | 41.91 | 42.92 2% | 40.73 -3% | 66.1 58% | 66.2 58% | 67.6 61% |
| Response Times | 17% | 21% | 17% | 24% | 27% | |
| Response Time Grey 50% / Grey 80% * (ms) | 58.8 ? | 45 ? 23% | 38 ? 35% | 48 ? 18% | 40.8 ? 31% | 40.4 ? 31% |
| Response Time Black / White * (ms) | 33.2 ? | 30 ? 10% | 30.8 ? 7% | 28 ? 16% | 27.6 ? 17% | 25.6 ? 23% |
| PWM Frequency (Hz) | 198.4 ? | 520 ? | ||||
| Screen | 36% | 13% | 47% | 14% | 43% | |
| Brightness middle (cd/m²) | 193.6 | 240 24% | 255.5 32% | 348 80% | 316 63% | 442.7 129% |
| Brightness (cd/m²) | 181 | 234 29% | 242 34% | 306 69% | 291 61% | 428 136% |
| Brightness Distribution (%) | 78 | 93 19% | 87 12% | 78 0% | 83 6% | 84 8% |
| Black Level * (cd/m²) | 0.17 | 0.11 35% | 0.29 -71% | 0.2 -18% | 0.36 -112% | 0.31 -82% |
| Contrast (:1) | 1139 | 2182 92% | 881 -23% | 1740 53% | 878 -23% | 1428 25% |
| Colorchecker dE 2000 * | 6.99 | 4.98 29% | 4.18 40% | 2.79 60% | 5.9 16% | 2.24 68% |
| Colorchecker dE 2000 max. * | 23.58 | 10.75 54% | 19.15 19% | 5.53 77% | 12.9 45% | 7.19 70% |
| Colorchecker dE 2000 calibrated * | 4.86 | 3.33 31% | 3.8 22% | 1.3 73% | 1.11 77% | |
| Greyscale dE 2000 * | 5.7 | 3.51 38% | 2.2 61% | 3.47 39% | 8.6 -51% | 9.7 -70% |
| Gamma | 2.12 104% | 2.2 100% | 2.05 107% | 2.54 87% | 2.1 105% | 1.42 155% |
| CCT | 5845 111% | 6606 98% | 6599 98% | 6564 99% | 6854 95% | 6227 104% |
| Color Space (Percent of AdobeRGB 1998) (%) | 37.6 | 40 6% | 37.5 0% | 60 60% | 60.7 61% | 61.6 64% |
| Color Space (Percent of sRGB) (%) | 62 | 59.1 | 93 | 94.5 | 95 | |
| Totalt genomsnitt (program/inställningar) | 19% /
27% | 11% /
11% | 41% /
45% | 32% /
24% | 44% /
44% |
* ... mindre är bättre
Visa svarstider
| ↔ Svarstid svart till vitt | ||
|---|---|---|
| 33.2 ms ... stiga ↗ och falla ↘ kombinerat | ↗ 20 ms stiga | 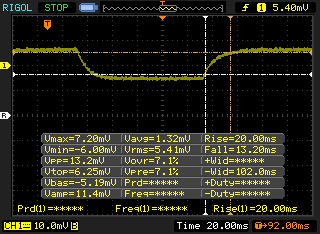 |
| ↘ 13.2 ms hösten | ||
| Skärmen visar långsamma svarsfrekvenser i våra tester och kommer att vara otillfredsställande för spelare. I jämförelse sträcker sig alla testade enheter från 0.1 (minst) till 240 (maximalt) ms. » 90 % av alla enheter är bättre. Detta innebär att den uppmätta svarstiden är sämre än genomsnittet av alla testade enheter (19.8 ms). | ||
| ↔ Svarstid 50 % grått till 80 % grått | ||
| 58.8 ms ... stiga ↗ och falla ↘ kombinerat | ↗ 25.6 ms stiga | 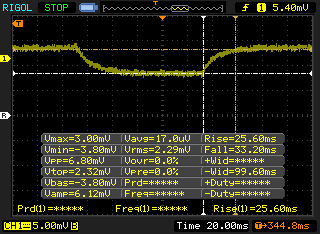 |
| ↘ 33.2 ms hösten | ||
| Skärmen visar långsamma svarsfrekvenser i våra tester och kommer att vara otillfredsställande för spelare. I jämförelse sträcker sig alla testade enheter från 0.165 (minst) till 636 (maximalt) ms. » 95 % av alla enheter är bättre. Detta innebär att den uppmätta svarstiden är sämre än genomsnittet av alla testade enheter (30.9 ms). | ||
Skärmflimmer / PWM (Puls-Width Modulation)
| Skärmflimmer / PWM upptäckt | 198.4 Hz | ≤ 98 % ljusstyrka inställning | 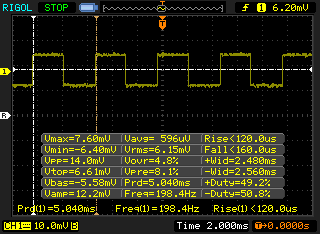 |
Displayens bakgrundsbelysning flimrar vid 198.4 Hz (i värsta fall, t.ex. med PWM) Flimrande upptäckt vid en ljusstyrkeinställning på 98 % och lägre. Det ska inte finnas något flimmer eller PWM över denna ljusstyrkeinställning. Frekvensen för 198.4 Hz är relativt låg, så känsliga användare kommer sannolikt att märka flimmer och uppleva ansträngda ögon vid den angivna ljusstyrkeinställningen och nedan. Som jämförelse: 52 % av alla testade enheter använder inte PWM för att dämpa skärmen. Om PWM upptäcktes mättes ett medelvärde av 7748 (minst: 5 - maximum: 343500) Hz. | |||
* ... mindre är bättre
| PCMark 8 Home Score Accelerated v2 | 3537 poäng | |
| PCMark 8 Work Score Accelerated v2 | 5032 poäng | |
| PCMark 10 Score | 4069 poäng | |
Hjälp | ||
| Dell Inspiron 14 5000 5482 2-in-1 SK Hynix BC501 NVMe 256 GB | Lenovo Yoga 530-14IKB-81EK00CWGE SK hynix PC401 HFS256GD9TNG | Asus VivoBook Flip 14 TP412UA-DB51T Micron 1100 MTFDDAV256TBN | Dell XPS 13 9365-4537 2-in-1 Toshiba NVMe THNSN5256GPUK | Lenovo Yoga C930-13IKB SK hynix PC401 HFS256GD9TNG | Huawei Matebook X Pro i5 Samsung PM961 MZVLW256HEHP | |
|---|---|---|---|---|---|---|
| AS SSD | 13% | -41% | -22% | -5% | 51% | |
| Seq Read (MB/s) | 576 | 2071 260% | 437.9 -24% | 1342 133% | 1850 221% | 2416 319% |
| Seq Write (MB/s) | 471.6 | 721 53% | 350.3 -26% | 543 15% | 661 40% | 1170 148% |
| 4K Read (MB/s) | 39.48 | 34.44 -13% | 23.31 -41% | 34.77 -12% | 38.04 -4% | 48.33 22% |
| 4K Write (MB/s) | 112.4 | 91 -19% | 64.7 -42% | 85.8 -24% | 95 -15% | 103.1 -8% |
| 4K-64 Read (MB/s) | 522 | 448.2 -14% | 234.3 -55% | 512 -2% | 434.3 -17% | 1039 99% |
| 4K-64 Write (MB/s) | 416.5 | 268.9 -35% | 279.4 -33% | 249.4 -40% | 266.3 -36% | 399.6 -4% |
| Access Time Read * (ms) | 0.046 | 0.046 -0% | 0.079 -72% | 0.169 -267% | 0.069 -50% | 0.058 -26% |
| Access Time Write * (ms) | 0.032 | 0.054 -69% | 0.056 -75% | 0.041 -28% | 0.056 -75% | 0.036 -13% |
| Score Read (Points) | 619 | 690 11% | 301 -51% | 681 10% | 657 6% | 1329 115% |
| Score Write (Points) | 576 | 432 -25% | 379 -34% | 389 -32% | 427 -26% | 620 8% |
| Score Total (Points) | 1520 | 1416 -7% | 839 -45% | 1388 -9% | 1373 -10% | 2575 69% |
| Copy ISO MB/s (MB/s) | 773 | 414.4 -46% | 714 -8% | 539 -30% | 739 -4% | |
| Copy Program MB/s (MB/s) | 344.4 | 364.3 6% | 264.7 -23% | 209.7 -39% | 312.3 -9% | |
| Copy Game MB/s (MB/s) | 536 | 354 -34% | 457.8 -15% | 340 -37% | 486.3 -9% | |
| CrystalDiskMark 5.2 / 6 | 12% | -48% | 1% | 19% | ||
| Write 4K (MB/s) | 111.8 | 123.1 10% | 66.5 -41% | 94.5 -15% | 116.5 4% | |
| Read 4K (MB/s) | 42.6 | 43.24 2% | 24.65 -42% | 39.95 -6% | 42.18 -1% | |
| Write Seq (MB/s) | 716 | 763 7% | 413.2 -42% | 531 -26% | 1079 51% | |
| Read Seq (MB/s) | 1107 | 1632 47% | 465.2 -58% | 1499 35% | 1030 -7% | |
| Write 4K Q32T1 (MB/s) | 451.5 | 268.6 -41% | 227 -50% | 315.3 -30% | 225.7 -50% | |
| Read 4K Q32T1 (MB/s) | 316.8 | 345.2 9% | 188.4 -41% | 279.8 -12% | 302.9 -4% | |
| Write Seq Q32T1 (MB/s) | 809 | 800 -1% | 439.9 -46% | 829 2% | 1174 45% | |
| Read Seq Q32T1 (MB/s) | 1610 | 2620 63% | 533 -67% | 2570 60% | 3394 111% | |
| Write 4K Q8T8 (MB/s) | 332 | |||||
| Read 4K Q8T8 (MB/s) | 488.6 | |||||
| Totalt genomsnitt (program/inställningar) | 13% /
13% | -45% /
-44% | -22% /
-22% | -2% /
-3% | 35% /
39% |
* ... mindre är bättre

| 3DMark 06 Standard Score | 10342 poäng | |
| 3DMark 11 Performance | 1911 poäng | |
| 3DMark Cloud Gate Standard Score | 8073 poäng | |
| 3DMark Fire Strike Score | 1025 poäng | |
Hjälp | ||
| låg | med. | hög | ultra | |
|---|---|---|---|---|
| BioShock Infinite (2013) | 51.1 | 30.3 | 24.5 | 7.6 |
| Rocket League (2017) | 50.6 | 24.3 | 15.7 | |
| Shadow of the Tomb Raider (2018) | 12 |
| Dell Inspiron 14 5000 5482 2-in-1 UHD Graphics 620, i7-8565U, SK Hynix BC501 NVMe 256 GB | Lenovo Yoga 530-14IKB-81EK00CWGE UHD Graphics 620, i5-8250U, SK hynix PC401 HFS256GD9TNG | Asus VivoBook Flip 14 TP412UA-DB51T UHD Graphics 620, i5-8250U, Micron 1100 MTFDDAV256TBN | Huawei Matebook X Pro i5 GeForce MX150, i5-8250U, Samsung PM961 MZVLW256HEHP | Microsoft Surface Laptop i7 Iris Plus Graphics 640, i7-7660U, Samsung PM971 KUS040202M | Lenovo ThinkPad A485-20MU000CGE Vega 8, R5 PRO 2500U, Samsung SSD PM981 MZVLB256HAHQ | |
|---|---|---|---|---|---|---|
| Noise | -3% | -2% | -3% | -10% | 2% | |
| av / miljö * (dB) | 28.2 | 30.3 -7% | 28.4 -1% | 27.9 1% | 30.5 -8% | 29.3 -4% |
| Idle Minimum * (dB) | 28.2 | 30.3 -7% | 28.4 -1% | 27.9 1% | 30.9 -10% | 29.3 -4% |
| Idle Average * (dB) | 28.2 | 30.3 -7% | 28.4 -1% | 27.9 1% | 30.9 -10% | 29.3 -4% |
| Idle Maximum * (dB) | 29.4 | 30.3 -3% | 28.4 3% | 27.9 5% | 30.9 -5% | 29.6 -1% |
| Load Average * (dB) | 35.8 | 36.1 -1% | 35.7 -0% | 36.2 -1% | 40.2 -12% | 31.6 12% |
| Load Maximum * (dB) | 35.8 | 33.9 5% | 39 -9% | 45.2 -26% | 40.2 -12% | 31.6 12% |
| Witcher 3 ultra * (dB) | 45 |
* ... mindre är bättre
Ljudnivå
| Låg belastning |
| 28.2 / 28.2 / 29.4 dB(A) |
| Hög belastning |
| 35.8 / 35.8 dB(A) |
 | ||
30 dB tyst 40 dB(A) hörbar 50 dB(A) högt ljud |
||
min: | ||
(+) Den maximala temperaturen på ovansidan är 33.2 °C / 92 F, jämfört med genomsnittet av 35.4 °C / 96 F , allt från 19.6 till 60 °C för klassen Convertible.
(±) Botten värms upp till maximalt 42.6 °C / 109 F, jämfört med genomsnittet av 36.9 °C / 98 F
(+) Vid tomgångsbruk är medeltemperaturen för ovansidan 23.9 °C / 75 F, jämfört med enhetsgenomsnittet på 30.3 °C / ### class_avg_f### F.
(+) Handledsstöden och pekplattan är kallare än hudtemperaturen med maximalt 24.2 °C / 75.6 F och är därför svala att ta på.
(+) Medeltemperaturen för handledsstödsområdet på liknande enheter var 28 °C / 82.4 F (+3.8 °C / 6.8 F).
Dell Inspiron 14 5000 5482 2-in-1 ljudanalys
(-) | inte särskilt höga högtalare (68.2 dB)
Bas 100 - 315 Hz
(-) | nästan ingen bas - i genomsnitt 16.4% lägre än medianen
(±) | linjäriteten för basen är genomsnittlig (8.9% delta till föregående frekvens)
Mellan 400 - 2000 Hz
(+) | balanserad mellan - endast 4.2% från medianen
(±) | linjäriteten för mids är genomsnittlig (7.3% delta till föregående frekvens)
Högsta 2 - 16 kHz
(+) | balanserade toppar - endast 3.4% från medianen
(±) | linjäriteten för toppar är genomsnittlig (8.6% delta till föregående frekvens)
Totalt 100 - 16 000 Hz
(±) | linjäriteten för det totala ljudet är genomsnittlig (20.1% skillnad mot median)
Jämfört med samma klass
» 51% av alla testade enheter i den här klassen var bättre, 6% liknande, 43% sämre
» Den bästa hade ett delta på 6%, genomsnittet var 20%, sämst var 57%
Jämfört med alla testade enheter
» 52% av alla testade enheter var bättre, 8% liknande, 40% sämre
» Den bästa hade ett delta på 4%, genomsnittet var 23%, sämst var 134%
Apple MacBook 12 (Early 2016) 1.1 GHz ljudanalys
(+) | högtalare kan spela relativt högt (83.6 dB)
Bas 100 - 315 Hz
(±) | reducerad bas - i genomsnitt 11.3% lägre än medianen
(±) | linjäriteten för basen är genomsnittlig (14.2% delta till föregående frekvens)
Mellan 400 - 2000 Hz
(+) | balanserad mellan - endast 2.4% från medianen
(+) | mids är linjära (5.5% delta till föregående frekvens)
Högsta 2 - 16 kHz
(+) | balanserade toppar - endast 2% från medianen
(+) | toppar är linjära (4.5% delta till föregående frekvens)
Totalt 100 - 16 000 Hz
(+) | det totala ljudet är linjärt (10.2% skillnad mot median)
Jämfört med samma klass
» 7% av alla testade enheter i den här klassen var bättre, 2% liknande, 90% sämre
» Den bästa hade ett delta på 5%, genomsnittet var 18%, sämst var 53%
Jämfört med alla testade enheter
» 5% av alla testade enheter var bättre, 1% liknande, 94% sämre
» Den bästa hade ett delta på 4%, genomsnittet var 23%, sämst var 134%
| Av/Standby | |
| Låg belastning | |
| Hög belastning |
|
Förklaring:
min: | |
| Dell Inspiron 14 5000 5482 2-in-1 i7-8565U, UHD Graphics 620, SK Hynix BC501 NVMe 256 GB, IPS, 1920x1080, 14" | Lenovo Yoga 530-14IKB-81EK00CWGE i5-8250U, UHD Graphics 620, SK hynix PC401 HFS256GD9TNG, IPS, 1920x1080, 14" | Asus VivoBook Flip 14 TP412UA-DB51T i5-8250U, UHD Graphics 620, Micron 1100 MTFDDAV256TBN, IPS, 1920x1080, 14" | Dell XPS 13 9365-4537 2-in-1 i5-7Y54, HD Graphics 615, Toshiba NVMe THNSN5256GPUK, IPS, 3200x1800, 13.3" | Lenovo Yoga C930-13IKB i5-8250U, UHD Graphics 620, SK hynix PC401 HFS256GD9TNG, IPS, 1920x1080, 13.9" | Huawei Matebook X Pro i5 i5-8250U, GeForce MX150, Samsung PM961 MZVLW256HEHP, IPS, 3000x2000, 13.9" | |
|---|---|---|---|---|---|---|
| Power Consumption | 13% | 18% | -37% | -10% | -31% | |
| Idle Minimum * (Watt) | 3.4 | 3.3 3% | 3.3 3% | 8.2 -141% | 3.3 3% | 3.5 -3% |
| Idle Average * (Watt) | 6.4 | 5.8 9% | 5.2 19% | 10.8 -69% | 6.8 -6% | 8.9 -39% |
| Idle Maximum * (Watt) | 7.8 | 8 -3% | 5.6 28% | 12.7 -63% | 9.5 -22% | 12.3 -58% |
| Load Average * (Watt) | 36.7 | 29.2 20% | 32.9 10% | 22.6 38% | 40.8 -11% | 54.2 -48% |
| Load Maximum * (Watt) | 49.3 | 31.1 37% | 35.2 29% | 24.6 50% | 57 -16% | 52.1 -6% |
| Witcher 3 ultra * (Watt) | 42.4 |
* ... mindre är bättre
| Dell Inspiron 14 5000 5482 2-in-1 i7-8565U, UHD Graphics 620, 42 Wh | Lenovo Yoga 530-14IKB-81EK00CWGE i5-8250U, UHD Graphics 620, 45 Wh | Asus VivoBook Flip 14 TP412UA-DB51T i5-8250U, UHD Graphics 620, 42 Wh | Dell XPS 13 9365-4537 2-in-1 i5-7Y54, HD Graphics 615, 46 Wh | Lenovo Yoga C930-13IKB i5-8250U, UHD Graphics 620, 60 Wh | Huawei Matebook X Pro i5 i5-8250U, GeForce MX150, 57.4 Wh | |
|---|---|---|---|---|---|---|
| Batteridrifttid | 13% | 33% | -6% | 54% | 48% | |
| Reader / Idle (h) | 12.4 | 15.3 23% | 23.9 93% | 20.7 67% | ||
| WiFi v1.3 (h) | 7.2 | 7 -3% | 9.6 33% | 6.8 -6% | 9.2 28% | 9.3 29% |
| Load (h) | 1.5 | 1.8 20% | 2.1 40% | 2.2 47% |
För
Emot
Läs den fullständiga versionen av den här recensionen på engelska här.
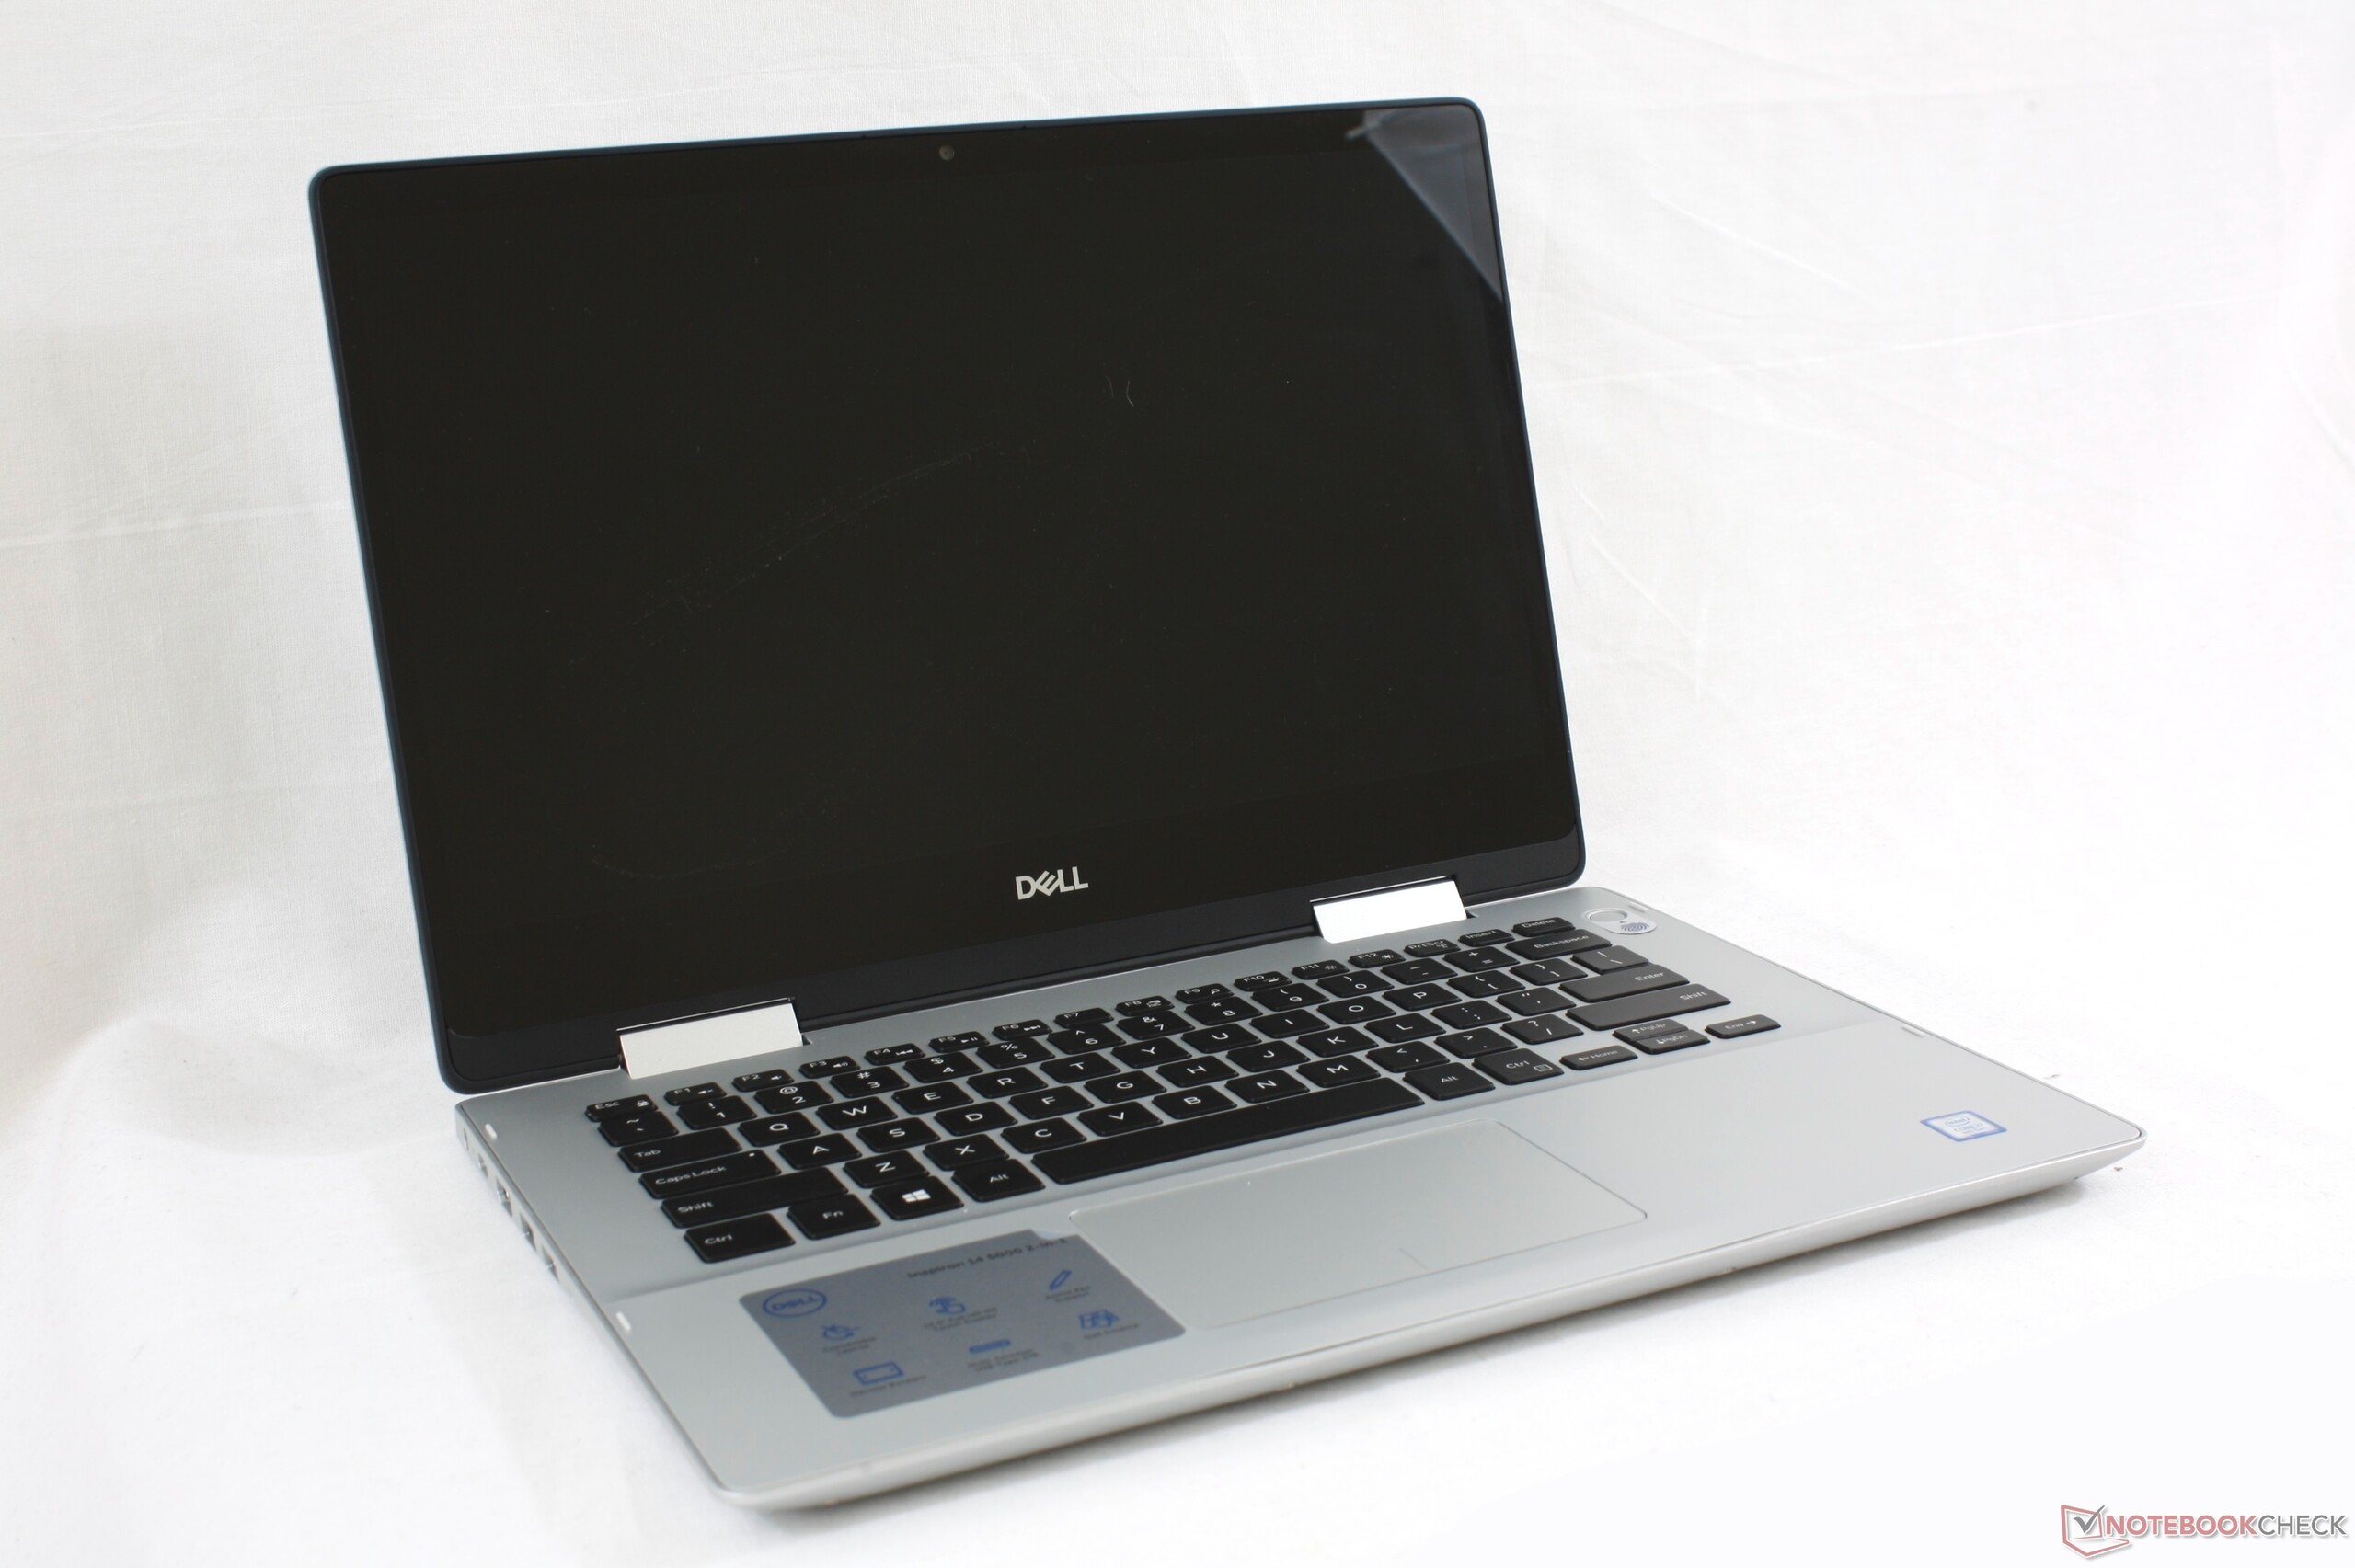
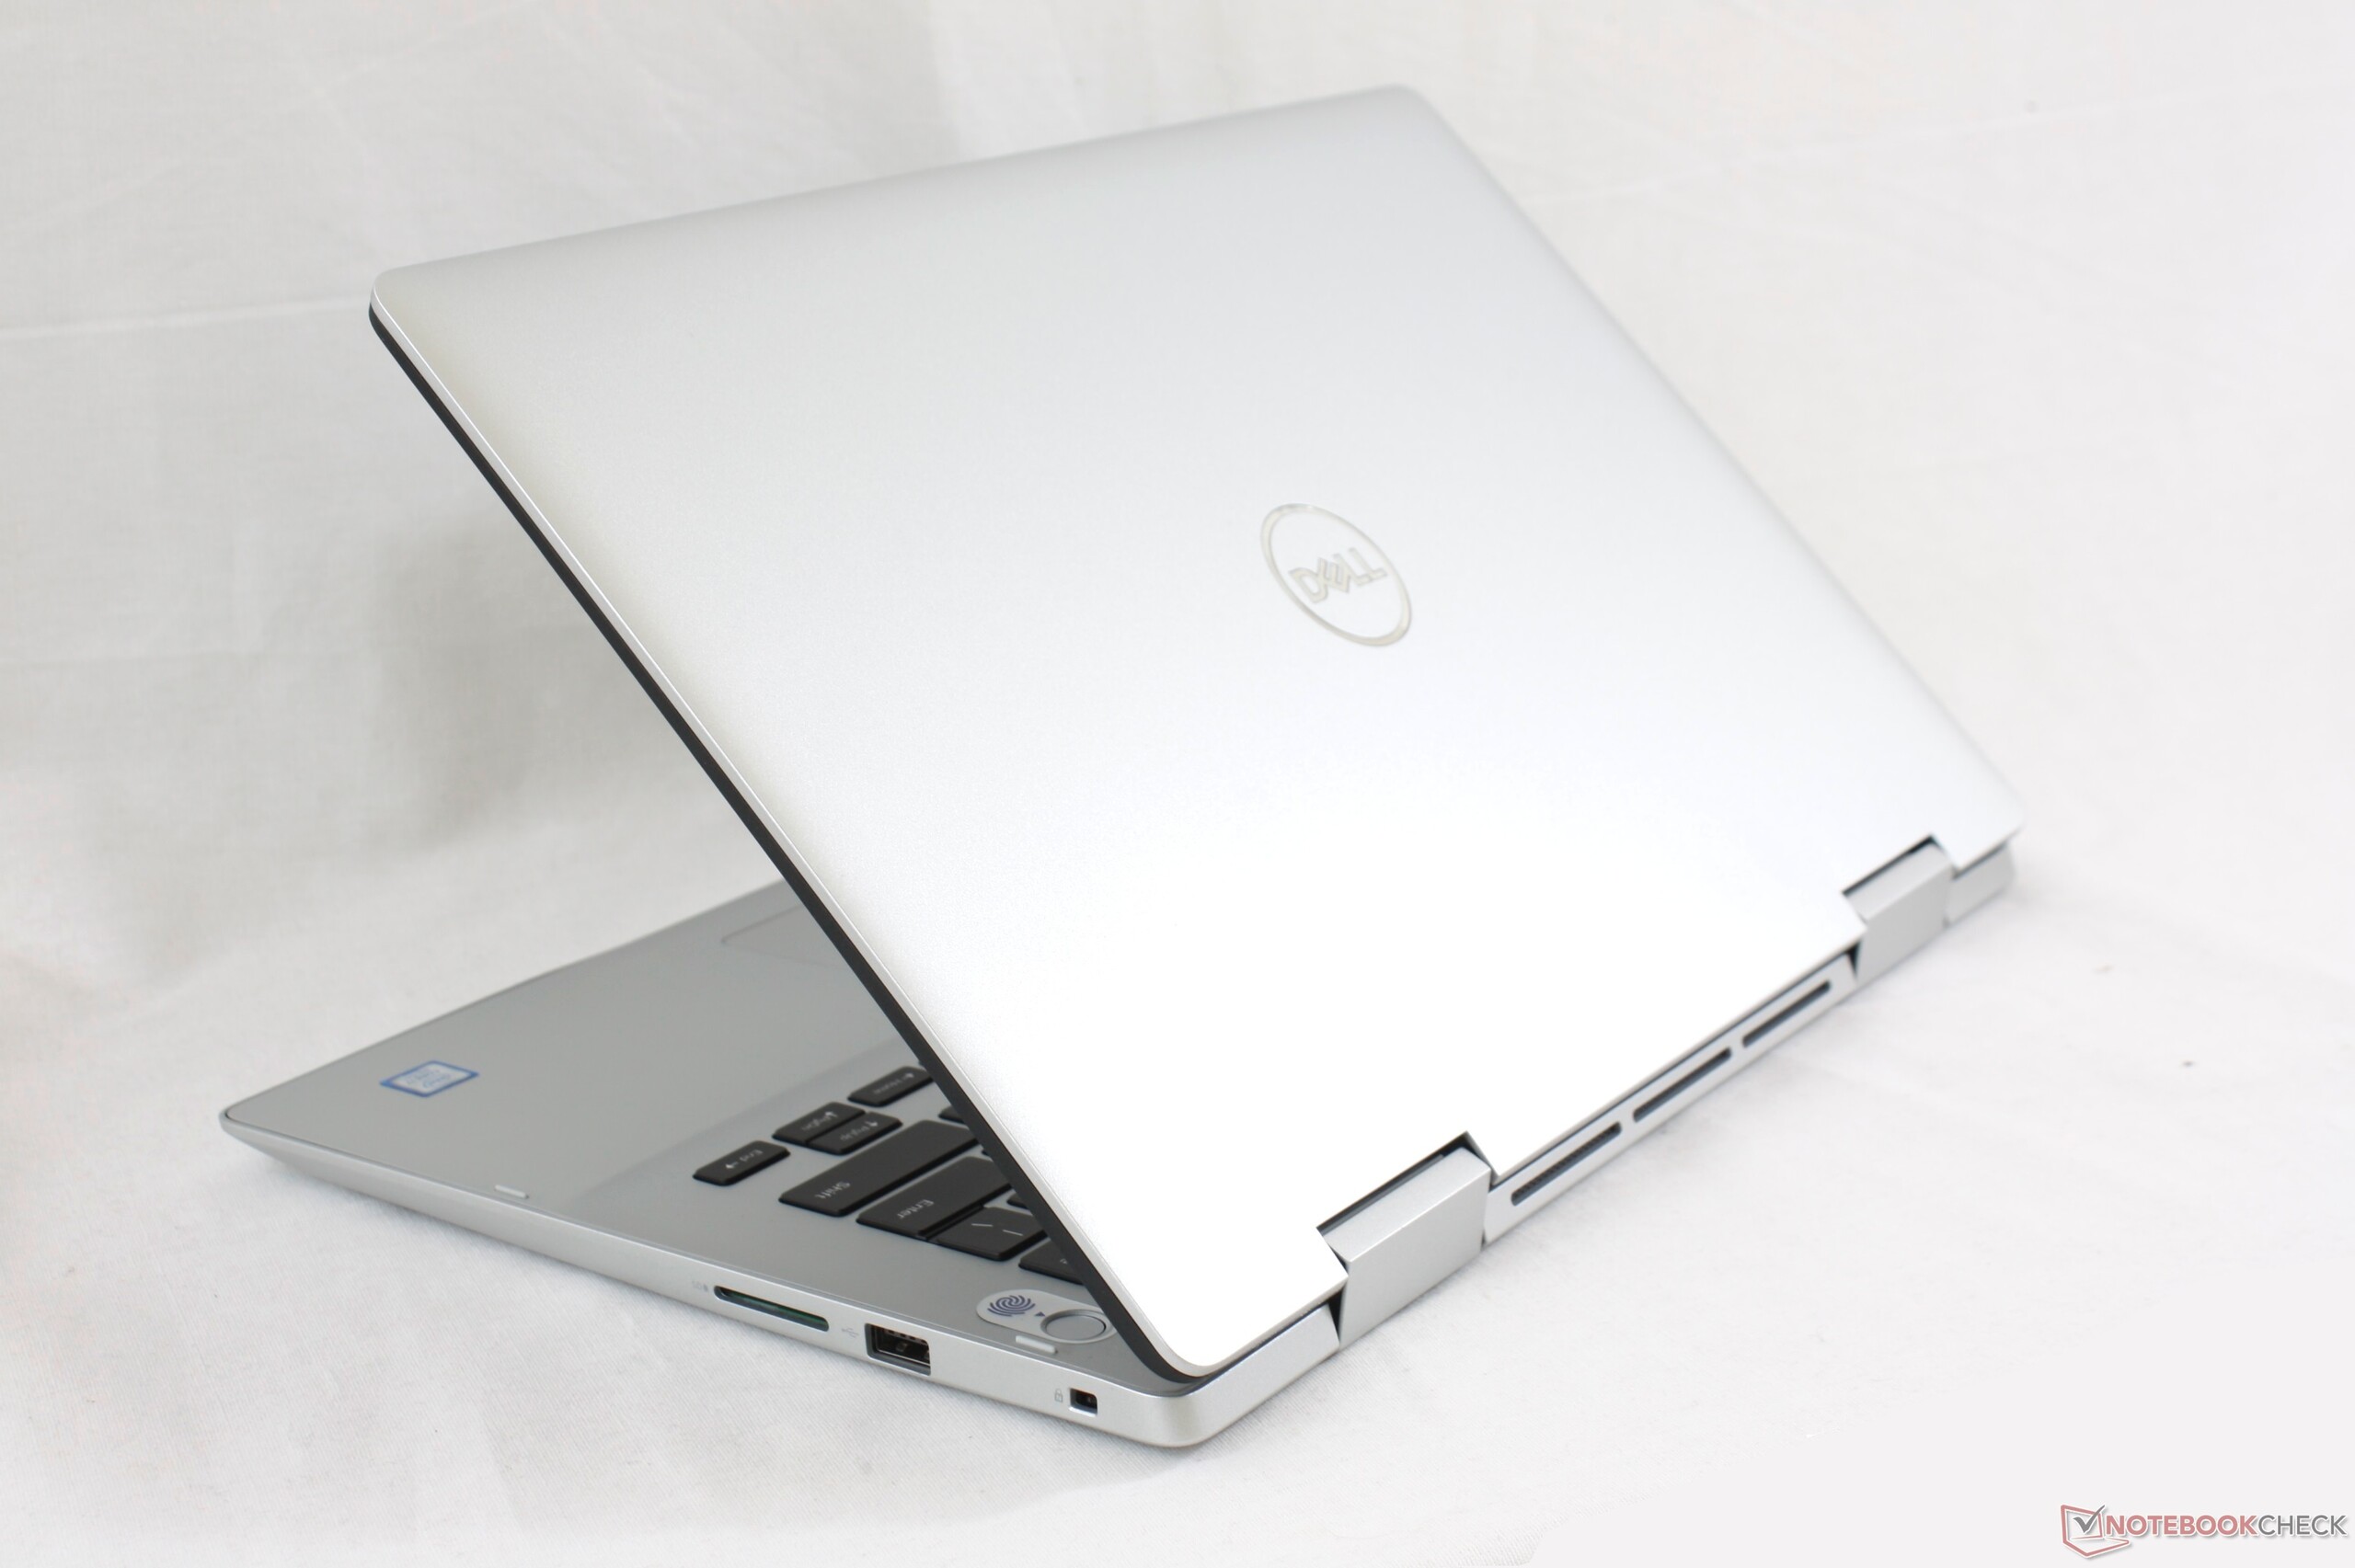
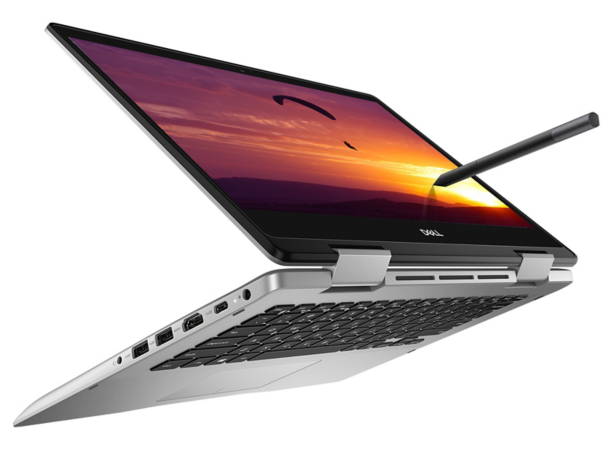
Den senaste omvandlingsbara Inspiron-modellen är välavrundad om än genomsnittlig. Den ger inte direkt det lilla extra för att locka köpare från konkurrenterna. Små fördelar som en ljusstark skärm, en gratis WACOM-penna eller snabbare laddning hade ökat systemets attraktion eller gett det en liten fördel som fått det att stå ut från mängden.
Tack vare det riktigt överkomliga utgångspriset och en tryckkänslig 1080p-skärm är Inspiron 14 5482 2-in-1 bäst lämpad för studentbruk, multimediauppspelning i hemmet eller till en bilresa då och då. Alternativ som Yoga 530 och VivoBook Flip 14 är definitivt mindre och lättare men kostar också en aning mer.
En välavrundad omvandlingsbar på instegsnivå för nybörjare. Den är ett billigt "tillbaka till skolan"-alternativ även om den inte erbjuder något extraordinärt för sin kategori.
Dell Inspiron 14 5000 5482 2-in-1
- 12/07/2018 v6 (old)
Allen Ngo
Price comparison
