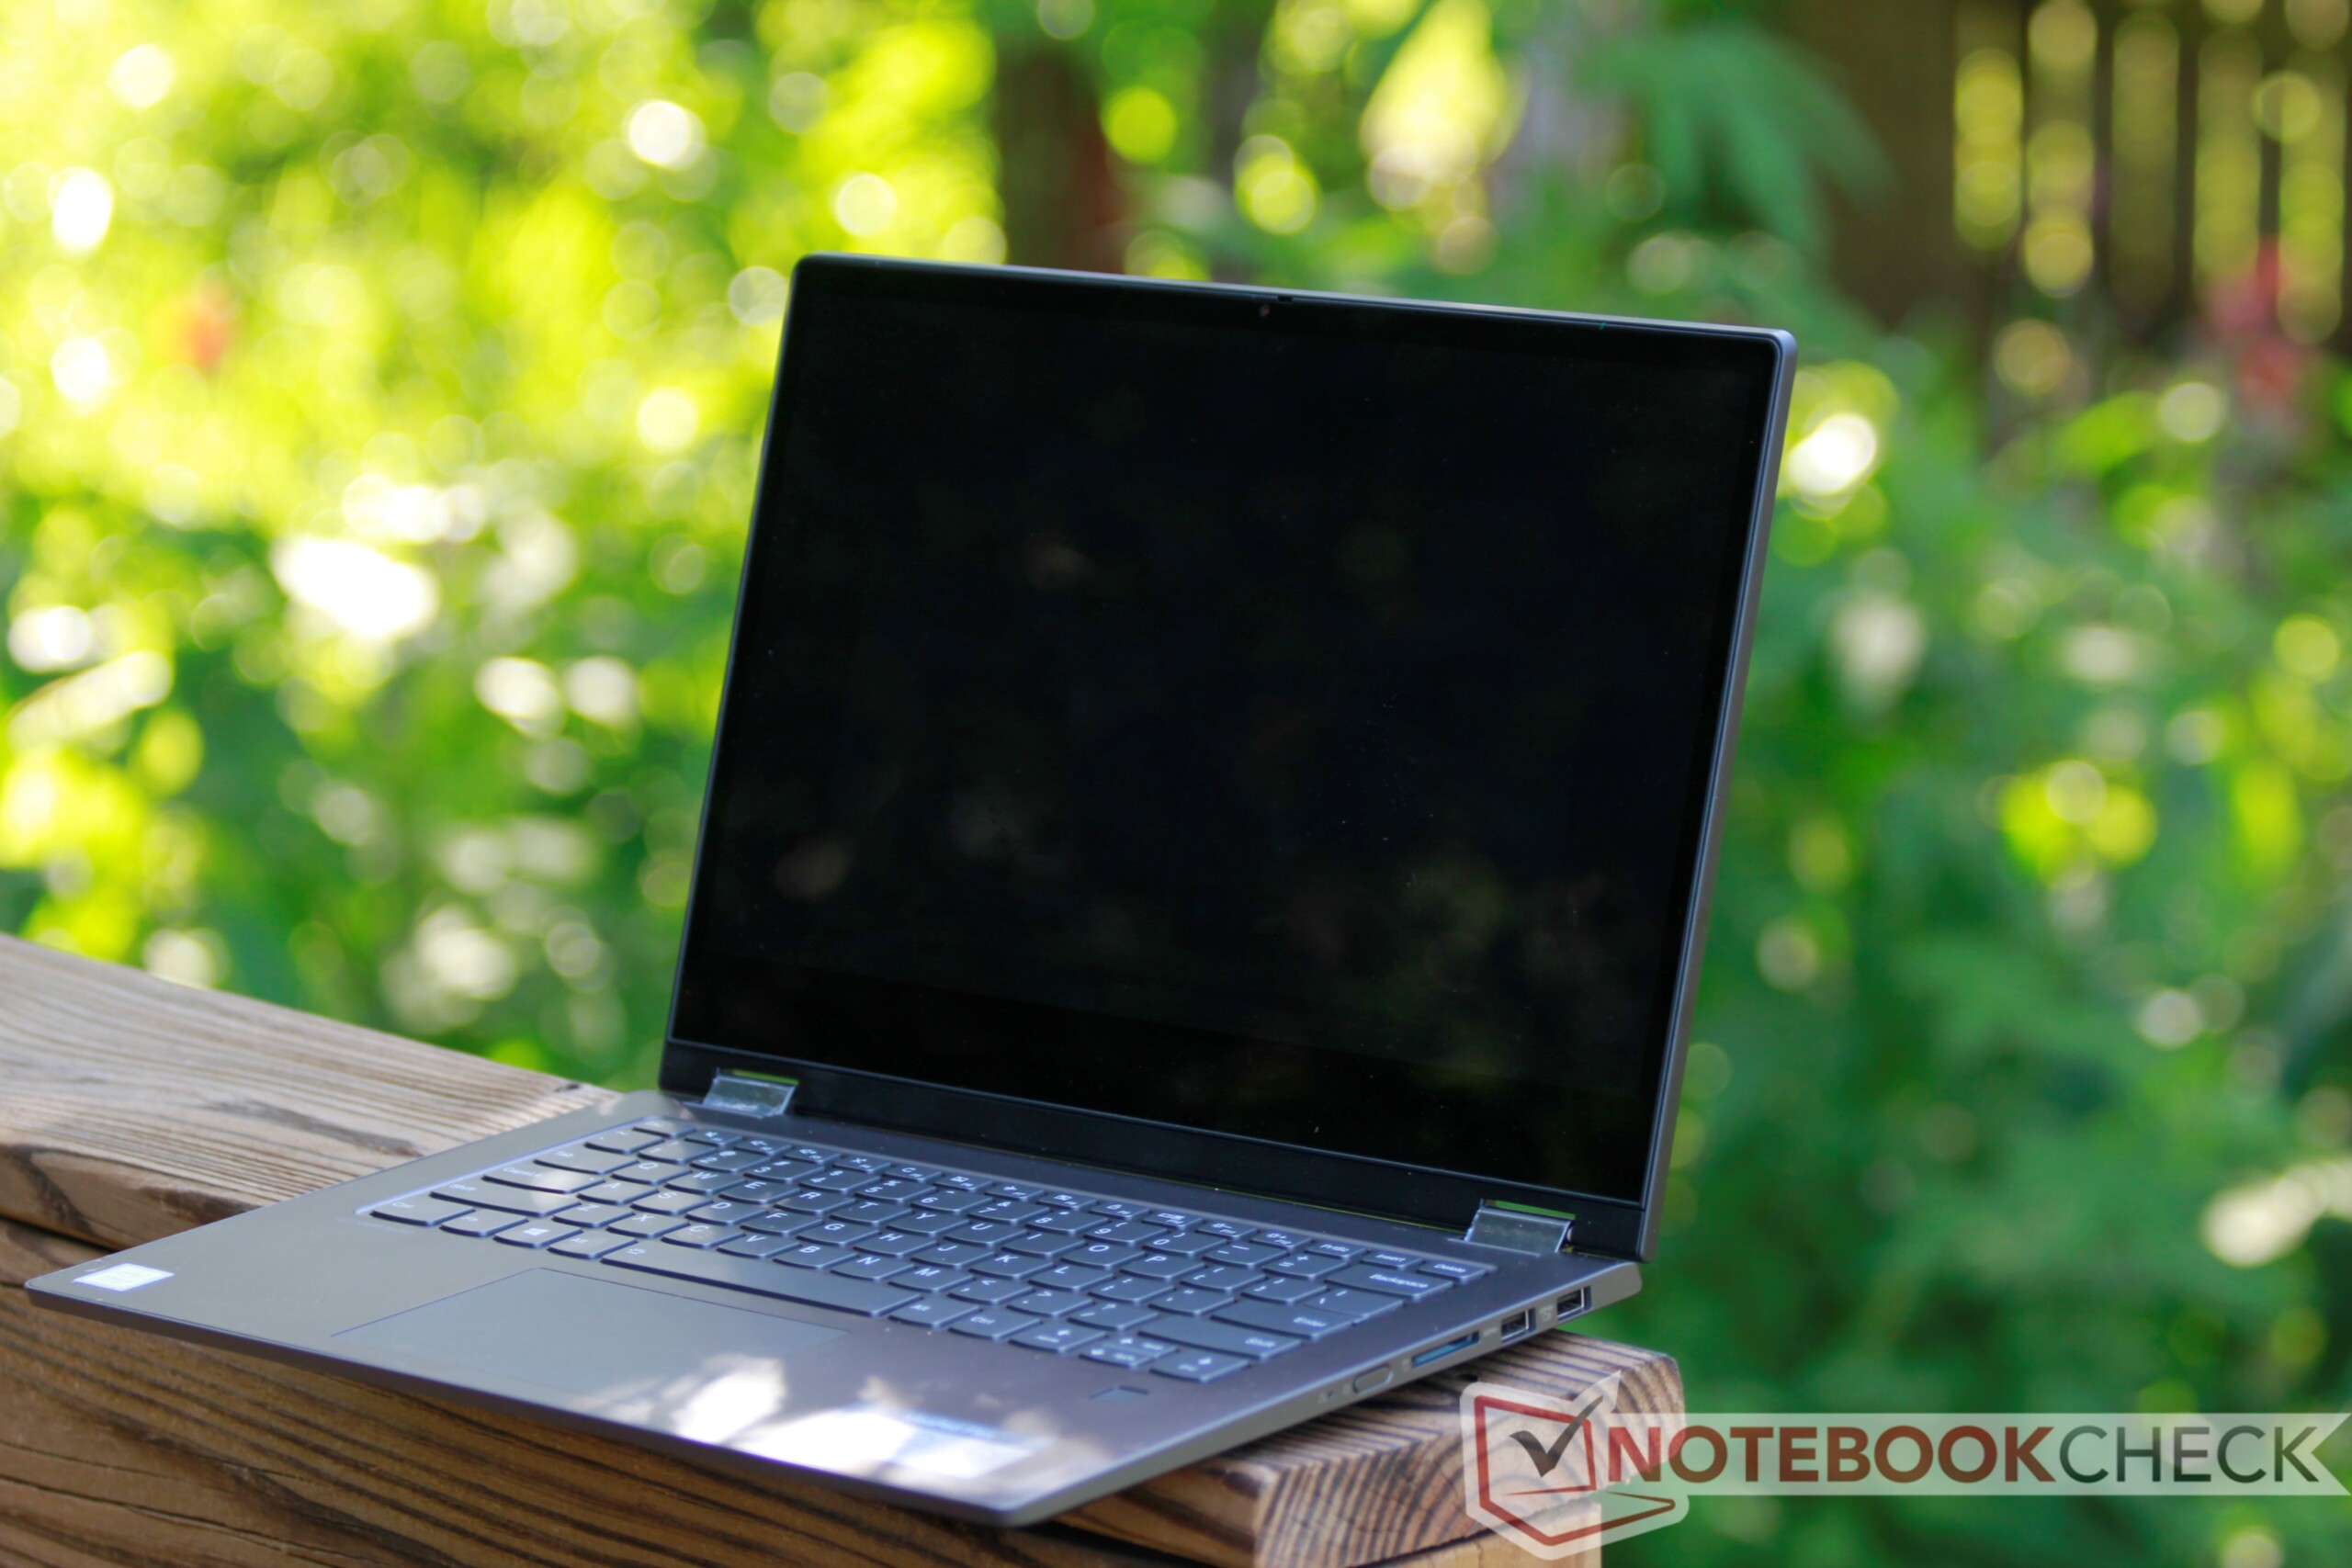
Test: Lenovo Flex 14 (2019, Core i5-8265U) - En genomsnittlig omvandlingsbar till ett bra pris
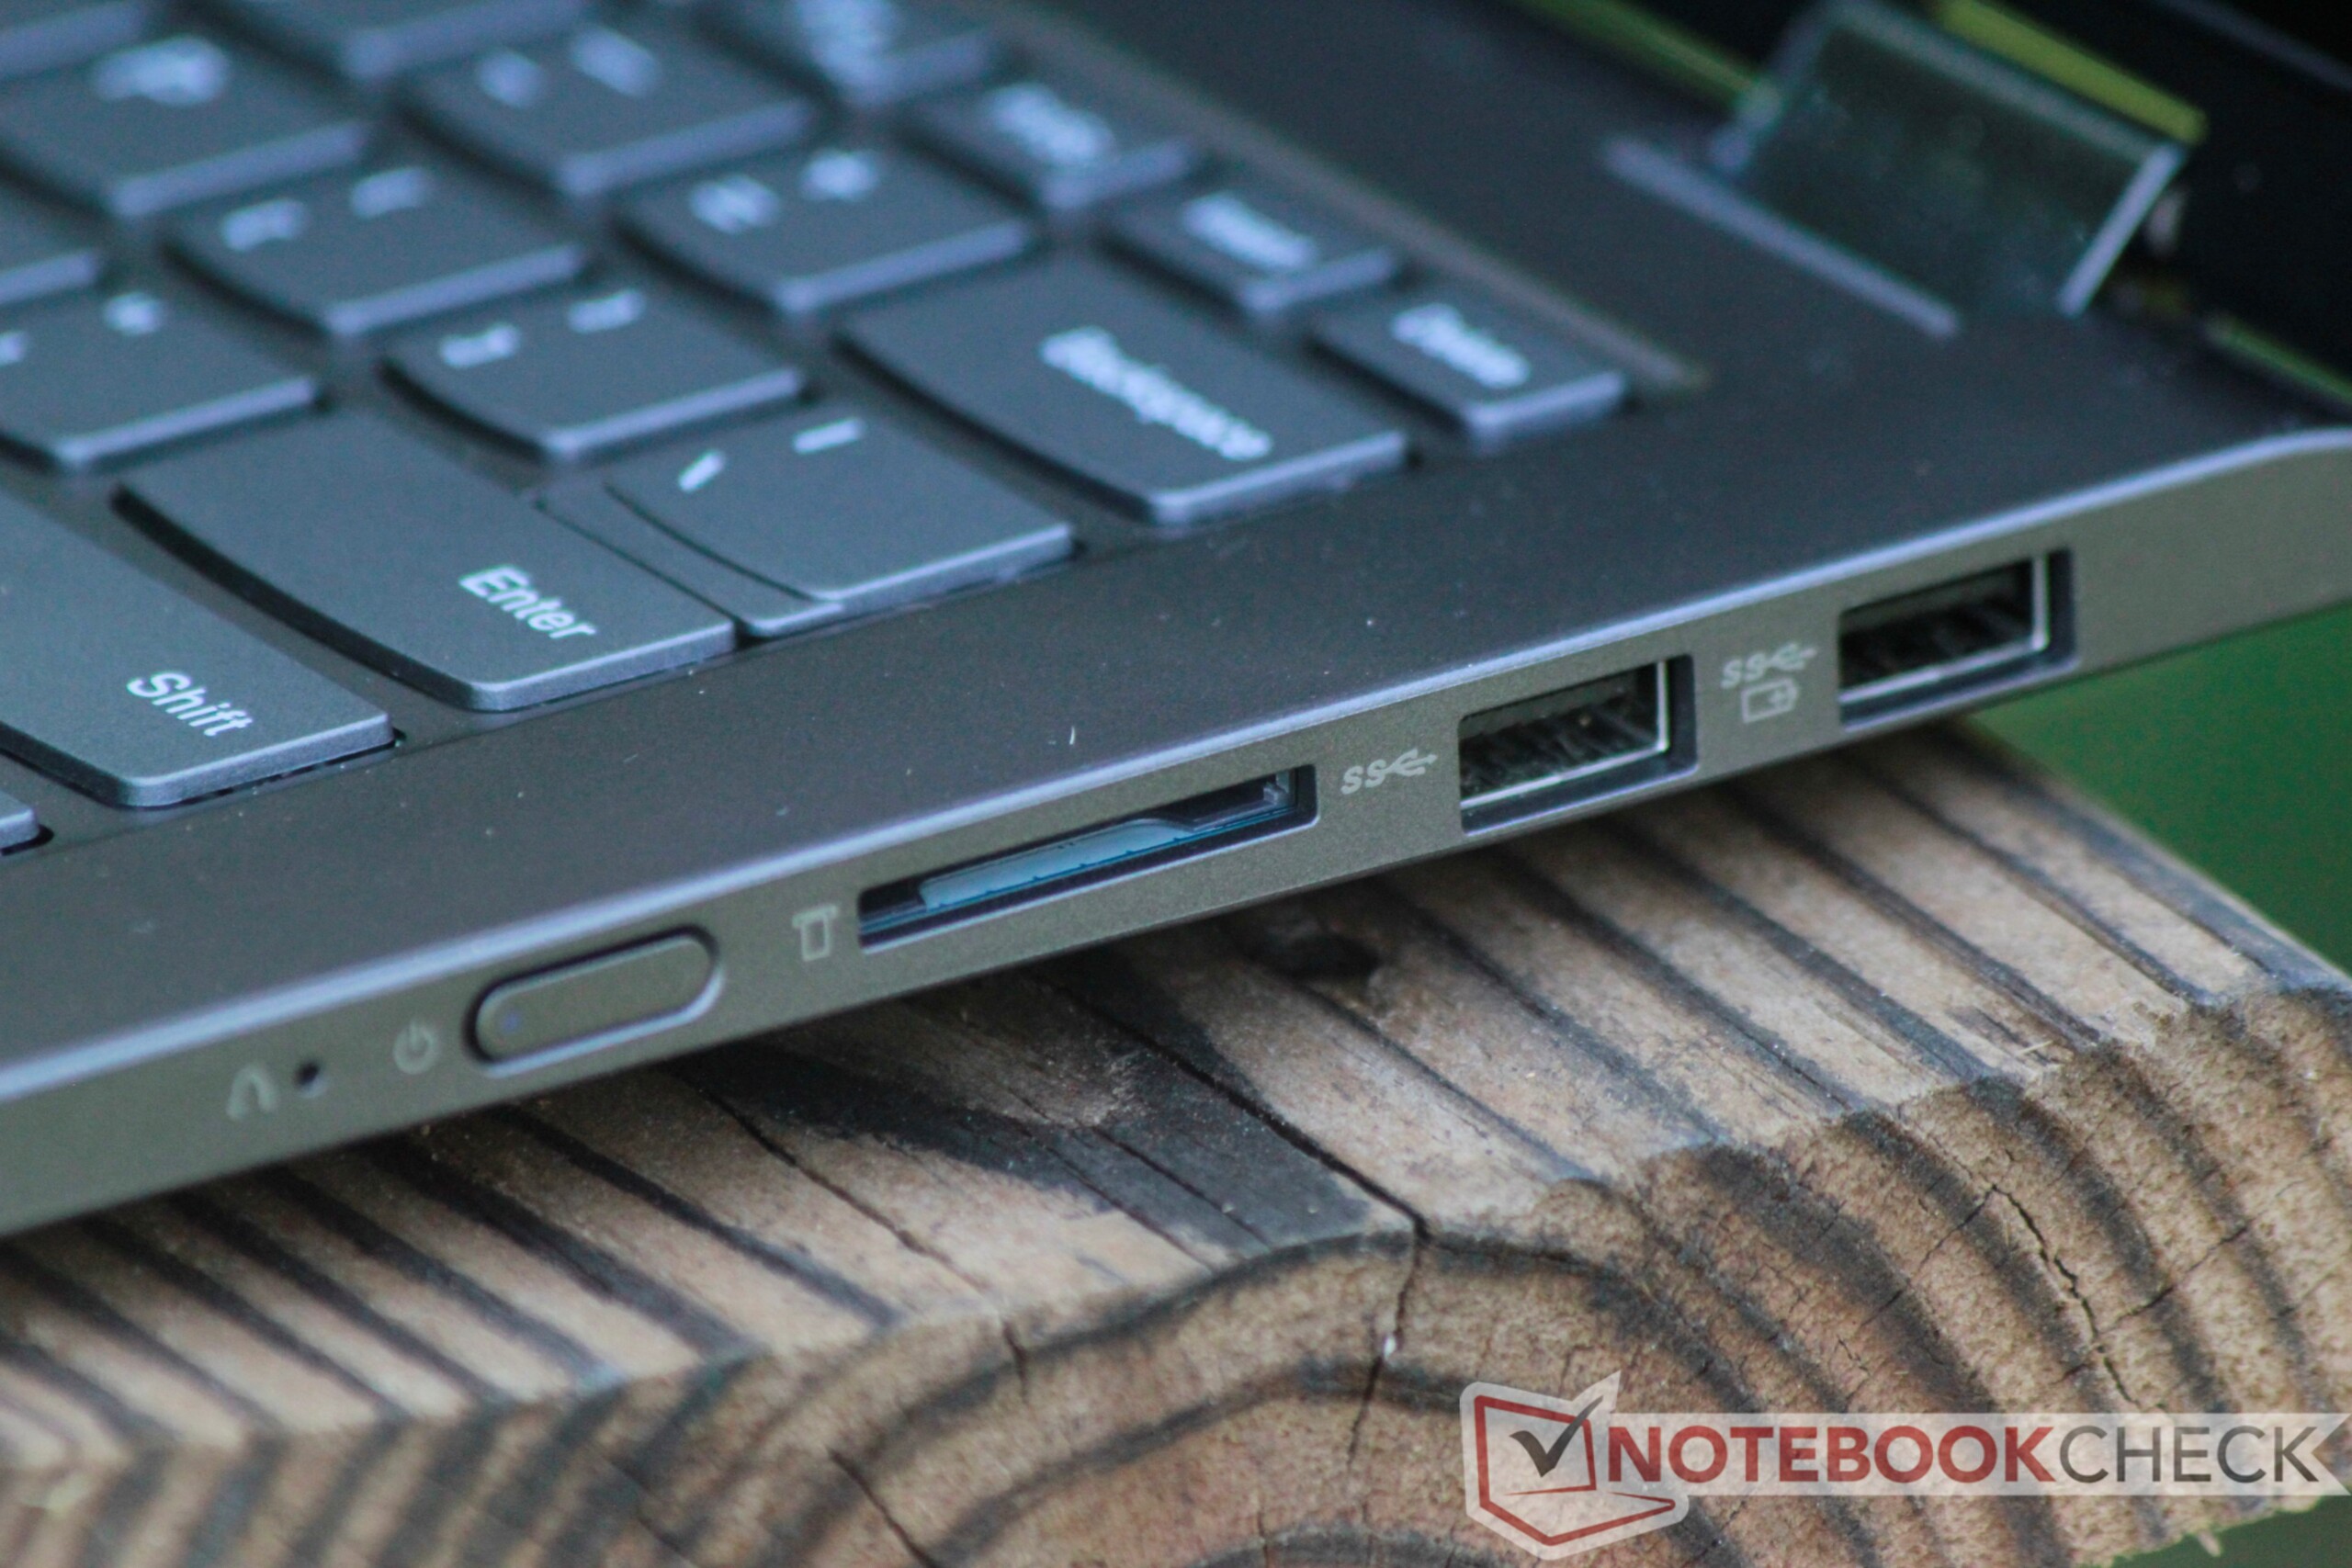
| SD Card Reader | |
| average JPG Copy Test (av. of 3 runs) | |
| Lenovo Flex 14IWL (Toshiba Exceria Pro SDXC 64 GB UHS-II) | |
| HP Envy x360 13-ar0601ng (Toshiba Exceria Pro M501 microSDXC 64GB) | |
| Genomsnitt av klass Convertible (28.1 - 197, n=23, senaste 2 åren) | |
| Dell Inspiron 14 5000 5482 2-in-1 (Toshiba Exceria Pro SDXC 64 GB UHS-II) | |
| Asus VivoBook Flip 14 TP412UA-DB51T (Toshiba Exceria Pro SDXC 64 GB UHS-II) | |
| Acer Spin 5 SP515-51GN-80A3 (Toshiba Exceria Pro SDXC 64 GB UHS-II) | |
| maximum AS SSD Seq Read Test (1GB) | |
| Genomsnitt av klass Convertible (28.9 - 254, n=22, senaste 2 åren) | |
| HP Envy x360 13-ar0601ng (Toshiba Exceria Pro M501 microSDXC 64GB) | |
| Lenovo Flex 14IWL (Toshiba Exceria Pro SDXC 64 GB UHS-II) | |
| Dell Inspiron 14 5000 5482 2-in-1 (Toshiba Exceria Pro SDXC 64 GB UHS-II) | |
| Asus VivoBook Flip 14 TP412UA-DB51T (Toshiba Exceria Pro SDXC 64 GB UHS-II) | |
| Acer Spin 5 SP515-51GN-80A3 (Toshiba Exceria Pro SDXC 64 GB UHS-II) | |
| |||||||||||||||||||||||||
Distribution av ljusstyrkan: 89 %
Mitt på batteriet: 284.2 cd/m²
Kontrast: 580:1 (Svärta: 0.49 cd/m²)
ΔE ColorChecker Calman: 4.59 | ∀{0.5-29.43 Ø4.73}
calibrated: 4.57
ΔE Greyscale Calman: 3.9 | ∀{0.09-98 Ø4.97}
59% sRGB (Argyll 1.6.3 3D)
38% AdobeRGB 1998 (Argyll 1.6.3 3D)
41.32% AdobeRGB 1998 (Argyll 3D)
59% sRGB (Argyll 3D)
40% Display P3 (Argyll 3D)
Gamma: 2.123
CCT: 6679 K
| Lenovo Flex 14IWL BOE BOE06F2, IPS, 14", 1920x1080 | HP Envy x360 13-ar0601ng InfoVision, M133NVF3 R2, IPS, 120 Hz, 13.3", 1920x1080 | Dell Inspiron 14 5000 5482 2-in-1 NV14N4H, IPS, 14", 1920x1080 | Asus VivoBook Flip 14 TP412UA-DB51T AUO B140HAN04.0, IPS, 14", 1920x1080 | Acer Spin 5 SP515-51GN-80A3 AUO, B156HAN06.1, a-Si TFT-LCD, LCM, IPS, 15.6", 1920x1080 | |
|---|---|---|---|---|---|
| Display | 55% | 0% | -1% | -2% | |
| Display P3 Coverage (%) | 40 | 63 58% | 40.57 1% | 39.42 -1% | 38.73 -3% |
| sRGB Coverage (%) | 59 | 90.8 54% | 58.6 -1% | 59.2 0% | 58.3 -1% |
| AdobeRGB 1998 Coverage (%) | 41.32 | 63.8 54% | 41.91 1% | 40.73 -1% | 40.02 -3% |
| Response Times | 9% | -47% | -10% | -13% | |
| Response Time Grey 50% / Grey 80% * (ms) | 30.4 ? | 35 ? -15% | 58.8 ? -93% | 38 ? -25% | 42 ? -38% |
| Response Time Black / White * (ms) | 32.8 ? | 22 ? 33% | 33.2 ? -1% | 30.8 ? 6% | 29 ? 12% |
| PWM Frequency (Hz) | 352.1 ? | 4065 ? | 198.4 ? | ||
| Screen | 55% | -5% | 12% | 34% | |
| Brightness middle (cd/m²) | 284.2 | 633 123% | 193.6 -32% | 255.5 -10% | 221 -22% |
| Brightness (cd/m²) | 271 | 675 149% | 181 -33% | 242 -11% | 224 -17% |
| Brightness Distribution (%) | 89 | 75 -16% | 78 -12% | 87 -2% | 89 0% |
| Black Level * (cd/m²) | 0.49 | 0.55 -12% | 0.17 65% | 0.29 41% | 0.12 76% |
| Contrast (:1) | 580 | 1151 98% | 1139 96% | 881 52% | 1842 218% |
| Colorchecker dE 2000 * | 4.59 | 3.12 32% | 6.99 -52% | 4.18 9% | 4.12 10% |
| Colorchecker dE 2000 max. * | 18.03 | 6.37 65% | 23.58 -31% | 19.15 -6% | 6.41 64% |
| Colorchecker dE 2000 calibrated * | 4.57 | 1.83 60% | 4.86 -6% | 3.8 17% | |
| Greyscale dE 2000 * | 3.9 | 3.89 -0% | 5.7 -46% | 2.2 44% | 3.4 13% |
| Gamma | 2.123 104% | 2.39 92% | 2.12 104% | 2.05 107% | 2.54 87% |
| CCT | 6679 97% | 6476 100% | 5845 111% | 6599 98% | 6893 94% |
| Color Space (Percent of AdobeRGB 1998) (%) | 38 | 59 55% | 37.6 -1% | 37.5 -1% | 37 -3% |
| Color Space (Percent of sRGB) (%) | 59 | 91 54% | 59.1 0% | 58 -2% | |
| Totalt genomsnitt (program/inställningar) | 40% /
50% | -17% /
-10% | 0% /
7% | 6% /
20% |
* ... mindre är bättre
Visa svarstider
| ↔ Svarstid svart till vitt | ||
|---|---|---|
| 32.8 ms ... stiga ↗ och falla ↘ kombinerat | ↗ 21.2 ms stiga | 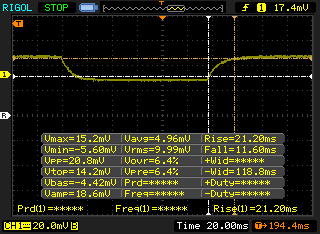 |
| ↘ 11.6 ms hösten | ||
| Skärmen visar långsamma svarsfrekvenser i våra tester och kommer att vara otillfredsställande för spelare. I jämförelse sträcker sig alla testade enheter från 0.1 (minst) till 240 (maximalt) ms. » 88 % av alla enheter är bättre. Detta innebär att den uppmätta svarstiden är sämre än genomsnittet av alla testade enheter (19.9 ms). | ||
| ↔ Svarstid 50 % grått till 80 % grått | ||
| 30.4 ms ... stiga ↗ och falla ↘ kombinerat | ↗ 22 ms stiga | 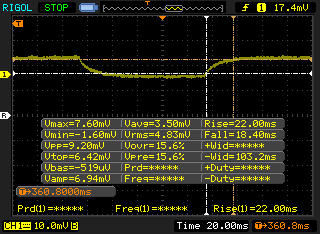 |
| ↘ 18.4 ms hösten | ||
| Skärmen visar långsamma svarsfrekvenser i våra tester och kommer att vara otillfredsställande för spelare. I jämförelse sträcker sig alla testade enheter från 0.165 (minst) till 636 (maximalt) ms. » 41 % av alla enheter är bättre. Det betyder att den uppmätta svarstiden liknar genomsnittet av alla testade enheter (31.1 ms). | ||
Skärmflimmer / PWM (Puls-Width Modulation)
| Skärmflimmer / PWM upptäckt | 352.1 Hz | ≤ 99 % ljusstyrka inställning | 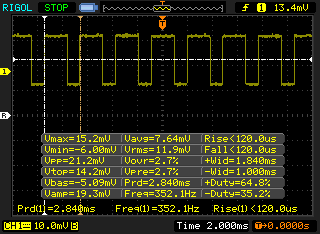 |
Displayens bakgrundsbelysning flimrar vid 352.1 Hz (i värsta fall, t.ex. med PWM) Flimrande upptäckt vid en ljusstyrkeinställning på 99 % och lägre. Det ska inte finnas något flimmer eller PWM över denna ljusstyrkeinställning. Frekvensen för 352.1 Hz är relativt hög, så de flesta användare som är känsliga för PWM bör inte märka något flimmer. Det finns dock rapporter om att vissa användare fortfarande är känsliga för PWM vid 500 Hz och högre, så var uppmärksam. Som jämförelse: 52 % av alla testade enheter använder inte PWM för att dämpa skärmen. Om PWM upptäcktes mättes ett medelvärde av 7798 (minst: 5 - maximum: 343500) Hz. | |||
| Cinebench R10 | |
| Rendering Multiple CPUs 32Bit | |
| Genomsnitt av klass Convertible (24911 - 67475, n=8, senaste 2 åren) | |
| Genomsnitt Intel Core i5-8265U (16318 - 22962, n=9) | |
| Acer Spin 5 SP515-51GN-80A3 | |
| Dell Latitude 7400 2-in-1 | |
| Lenovo Ideapad 330S-15ARR-81FB00C7GE | |
| Rendering Single 32Bit | |
| Genomsnitt av klass Convertible (7163 - 10030, n=8, senaste 2 åren) | |
| Dell Latitude 7400 2-in-1 | |
| Acer Spin 5 SP515-51GN-80A3 | |
| Genomsnitt Intel Core i5-8265U (5841 - 6209, n=9) | |
| Lenovo Ideapad 330S-15ARR-81FB00C7GE | |
| wPrime 2.10 - 1024m | |
| Dell Latitude 7400 2-in-1 | |
| Genomsnitt Intel Core i5-8265U (371 - 433, n=2) | |
| Genomsnitt av klass Convertible (262 - 547, n=3, senaste 2 åren) | |
* ... mindre är bättre
| PCMark 8 Home Score Accelerated v2 | 3438 poäng | |
| PCMark 8 Work Score Accelerated v2 | 4852 poäng | |
| PCMark 10 Score | 3896 poäng | |
Hjälp | ||
| Lenovo Flex 14IWL Samsung SSD PM981 MZVLB256HAHQ | HP Envy x360 13-ar0601ng SK Hynix BC501 HFM512GDJTNG | Dell Inspiron 14 5000 5482 2-in-1 SK Hynix BC501 NVMe 256 GB | Asus VivoBook Flip 14 TP412UA-DB51T Micron 1100 MTFDDAV256TBN | Acer Spin 5 SP515-51GN-80A3 Intel SSD 600p SSDPEKKW256G7 | |
|---|---|---|---|---|---|
| AS SSD | -36% | -36% | -67% | -45% | |
| Seq Read (MB/s) | 2533 | 1412 -44% | 576 -77% | 437.9 -83% | 1402 -45% |
| Seq Write (MB/s) | 1438 | 540 -62% | 471.6 -67% | 350.3 -76% | 577 -60% |
| 4K Read (MB/s) | 51.7 | 32.24 -38% | 39.48 -24% | 23.31 -55% | 31.89 -38% |
| 4K Write (MB/s) | 109.4 | 74.7 -32% | 112.4 3% | 64.7 -41% | 117.6 7% |
| 4K-64 Read (MB/s) | 771 | 567 -26% | 522 -32% | 234.3 -70% | 278.1 -64% |
| 4K-64 Write (MB/s) | 1268 | 700 -45% | 416.5 -67% | 279.4 -78% | 331.9 -74% |
| Access Time Read * (ms) | 0.053 | 0.049 8% | 0.046 13% | 0.079 -49% | 0.079 -49% |
| Access Time Write * (ms) | 0.034 | 0.048 -41% | 0.032 6% | 0.056 -65% | 0.03 12% |
| Score Read (Points) | 1076 | 741 -31% | 619 -42% | 301 -72% | 450 -58% |
| Score Write (Points) | 1521 | 829 -45% | 576 -62% | 379 -75% | 507 -67% |
| Score Total (Points) | 3106 | 1913 -38% | 1520 -51% | 839 -73% | 1157 -63% |
| Copy ISO MB/s (MB/s) | 521 | 773 | 414.4 | 607 | |
| Copy Program MB/s (MB/s) | 253.1 | 344.4 | 364.3 | 228.5 | |
| Copy Game MB/s (MB/s) | 392.9 | 536 | 354 | 420.5 | |
| CrystalDiskMark 5.2 / 6 | -34% | -22% | -58% | -32% | |
| Write 4K (MB/s) | 136.5 | 88.3 -35% | 111.8 -18% | 66.5 -51% | 132.3 -3% |
| Read 4K (MB/s) | 45.74 | 34.84 -24% | 42.6 -7% | 24.65 -46% | 35.38 -23% |
| Write Seq (MB/s) | 740 | 716 | 413.2 | 592 | |
| Read Seq (MB/s) | 985 | 1107 | 465.2 | 1186 | |
| Write 4K Q32T1 (MB/s) | 380.5 | 313.7 -18% | 451.5 19% | 227 -40% | 323 -15% |
| Read 4K Q32T1 (MB/s) | 437.5 | 243.1 -44% | 316.8 -28% | 188.4 -57% | 289.2 -34% |
| Write Seq Q32T1 (MB/s) | 1502 | 846 -44% | 809 -46% | 439.9 -71% | 593 -61% |
| Read Seq Q32T1 (MB/s) | 3357 | 1783 -47% | 1610 -52% | 533 -84% | 1569 -53% |
| Write 4K Q8T8 (MB/s) | 1435 | 305.7 -79% | |||
| Read 4K Q8T8 (MB/s) | 572 | 698 22% | |||
| Totalt genomsnitt (program/inställningar) | -35% /
-35% | -29% /
-31% | -63% /
-64% | -39% /
-40% |
* ... mindre är bättre

| 3DMark 11 | |
| 1280x720 Performance GPU | |
| Genomsnitt av klass Convertible (1505 - 40732, n=48, senaste 2 åren) | |
| Acer Spin 5 SP515-51GN-80A3 | |
| Lenovo IdeaPad S540-14IWL | |
| HP Envy x360 13-ar0601ng | |
| Lenovo Ideapad 330S-15ARR-81FB00C7GE | |
| Lenovo Ideapad S340-14IWL-81N70056GE | |
| Dell Inspiron 15 3585 (2300U, Vega 6) | |
| Genomsnitt Intel UHD Graphics 620 (1144 - 3432, n=244) | |
| Lenovo Flex 14IWL | |
| 1280x720 Performance Combined | |
| Genomsnitt av klass Convertible (1952 - 17837, n=47, senaste 2 åren) | |
| Acer Spin 5 SP515-51GN-80A3 | |
| Lenovo IdeaPad S540-14IWL | |
| Lenovo Ideapad S340-14IWL-81N70056GE | |
| Lenovo Ideapad 330S-15ARR-81FB00C7GE | |
| Dell Inspiron 15 3585 (2300U, Vega 6) | |
| HP Envy x360 13-ar0601ng | |
| Genomsnitt Intel UHD Graphics 620 (927 - 2505, n=244) | |
| Lenovo Flex 14IWL | |
| 3DMark | |
| 1280x720 Cloud Gate Standard Graphics | |
| Genomsnitt av klass Convertible (7885 - 57566, n=32, senaste 2 åren) | |
| Acer Spin 5 SP515-51GN-80A3 | |
| Lenovo IdeaPad S540-14IWL | |
| Lenovo Ideapad S340-14IWL-81N70056GE | |
| Lenovo Ideapad 330S-15ARR-81FB00C7GE | |
| Dell Inspiron 15 3585 (2300U, Vega 6) | |
| HP Envy x360 13-ar0601ng | |
| Genomsnitt Intel UHD Graphics 620 (6205 - 16400, n=225) | |
| Lenovo Flex 14IWL | |
| 1920x1080 Fire Strike Graphics | |
| Genomsnitt av klass Convertible (1185 - 27447, n=48, senaste 2 åren) | |
| Acer Spin 5 SP515-51GN-80A3 | |
| Lenovo IdeaPad S540-14IWL | |
| Lenovo Ideapad S340-14IWL-81N70056GE | |
| Lenovo Ideapad 330S-15ARR-81FB00C7GE | |
| Dell Inspiron 15 3585 (2300U, Vega 6) | |
| HP Envy x360 13-ar0601ng | |
| Genomsnitt Intel UHD Graphics 620 (557 - 2608, n=213) | |
| Lenovo Flex 14IWL | |
| 3DMark 11 Performance | 1832 poäng | |
| 3DMark Cloud Gate Standard Score | 7359 poäng | |
| 3DMark Fire Strike Score | 991 poäng | |
Hjälp | ||
| The Witcher 3 | |
| 1024x768 The Witcher 3 low | |
| Genomsnitt av klass Convertible (22 - 141.5, n=6, senaste 2 åren) | |
| Genomsnitt Intel UHD Graphics 620 (8.8 - 50.9, n=64) | |
| 1366x768 The Witcher 3 medium | |
| Genomsnitt av klass Convertible (39 - 81.2, n=5, senaste 2 åren) | |
| Genomsnitt Intel UHD Graphics 620 (8 - 27.9, n=29) | |
| 1920x1080 The Witcher 3 high | |
| Genomsnitt av klass Convertible (22 - 44.5, n=5, senaste 2 åren) | |
| Genomsnitt Intel UHD Graphics 620 (4.2 - 13.5, n=17) | |
| 1920x1080 The Witcher 3 ultra | |
| Genomsnitt av klass Convertible (11 - 101, n=6, senaste 2 åren) | |
| Genomsnitt Intel UHD Graphics 620 (2.97 - 5.2, n=7) | |
| låg | med. | hög | ultra | |
|---|---|---|---|---|
| BioShock Infinite (2013) | 40 | 27 | 19 | 7 |
| Farming Simulator 17 (2016) | 52 | 41 | 23 | 13 |
| Rocket League (2017) | 42 | 30 | 23 |
Ljudnivå
| Låg belastning |
| 28.4 / 28.4 / 29.1 dB(A) |
| Hög belastning |
| 33.8 / 37.7 dB(A) |
 | ||
30 dB tyst 40 dB(A) hörbar 50 dB(A) högt ljud |
||
min: | ||
(+) Den maximala temperaturen på ovansidan är 37.6 °C / 100 F, jämfört med genomsnittet av 35.4 °C / 96 F , allt från 19.6 till 60 °C för klassen Convertible.
(-) Botten värms upp till maximalt 45.8 °C / 114 F, jämfört med genomsnittet av 36.9 °C / 98 F
(+) Vid tomgångsbruk är medeltemperaturen för ovansidan 26.5 °C / 80 F, jämfört med enhetsgenomsnittet på 30.3 °C / ### class_avg_f### F.
(+) Handledsstöden och pekplattan är kallare än hudtemperaturen med maximalt 25.6 °C / 78.1 F och är därför svala att ta på.
(+) Medeltemperaturen för handledsstödsområdet på liknande enheter var 28 °C / 82.4 F (+2.4 °C / 4.3 F).
Lenovo Flex 14IWL ljudanalys
(±) | högtalarljudstyrkan är genomsnittlig men bra (72.6 dB)
Bas 100 - 315 Hz
(±) | reducerad bas - i genomsnitt 11.3% lägre än medianen
(±) | linjäriteten för basen är genomsnittlig (11.1% delta till föregående frekvens)
Mellan 400 - 2000 Hz
(±) | högre mellan - i genomsnitt 5.8% högre än median
(+) | mids är linjära (3.6% delta till föregående frekvens)
Högsta 2 - 16 kHz
(+) | balanserade toppar - endast 1.3% från medianen
(±) | linjäriteten för toppar är genomsnittlig (7.4% delta till föregående frekvens)
Totalt 100 - 16 000 Hz
(±) | linjäriteten för det totala ljudet är genomsnittlig (16.9% skillnad mot median)
Jämfört med samma klass
» 31% av alla testade enheter i den här klassen var bättre, 7% liknande, 61% sämre
» Den bästa hade ett delta på 6%, genomsnittet var 20%, sämst var 57%
Jämfört med alla testade enheter
» 30% av alla testade enheter var bättre, 8% liknande, 62% sämre
» Den bästa hade ett delta på 4%, genomsnittet var 24%, sämst var 134%
Asus VivoBook Flip 14 TP412UA-DB51T ljudanalys
(±) | högtalarljudstyrkan är genomsnittlig men bra (77 dB)
Bas 100 - 315 Hz
(-) | nästan ingen bas - i genomsnitt 18.2% lägre än medianen
(±) | linjäriteten för basen är genomsnittlig (12.3% delta till föregående frekvens)
Mellan 400 - 2000 Hz
(+) | balanserad mellan - endast 3.2% från medianen
(+) | mids är linjära (6.4% delta till föregående frekvens)
Högsta 2 - 16 kHz
(+) | balanserade toppar - endast 4.6% från medianen
(+) | toppar är linjära (5.6% delta till föregående frekvens)
Totalt 100 - 16 000 Hz
(±) | linjäriteten för det totala ljudet är genomsnittlig (18.4% skillnad mot median)
Jämfört med samma klass
» 41% av alla testade enheter i den här klassen var bättre, 7% liknande, 53% sämre
» Den bästa hade ett delta på 6%, genomsnittet var 20%, sämst var 57%
Jämfört med alla testade enheter
» 41% av alla testade enheter var bättre, 8% liknande, 52% sämre
» Den bästa hade ett delta på 4%, genomsnittet var 24%, sämst var 134%
| Av/Standby | |
| Låg belastning | |
| Hög belastning |
|
Förklaring:
min: | |
| Lenovo Flex 14IWL i5-8265U, UHD Graphics 620, Samsung SSD PM981 MZVLB256HAHQ, IPS, 1920x1080, 14" | HP Envy x360 13-ar0601ng R7 3700U, Vega 10, SK Hynix BC501 HFM512GDJTNG, IPS, 120 Hz, 1920x1080, 13.3" | Dell Inspiron 14 5000 5482 2-in-1 i7-8565U, UHD Graphics 620, SK Hynix BC501 NVMe 256 GB, IPS, 1920x1080, 14" | Asus VivoBook Flip 14 TP412UA-DB51T i5-8250U, UHD Graphics 620, Micron 1100 MTFDDAV256TBN, IPS, 1920x1080, 14" | Acer Spin 5 SP515-51GN-80A3 i5-8550U, GeForce GTX 1050 Mobile, Intel SSD 600p SSDPEKKW256G7, a-Si TFT-LCD, LCM, IPS, 1920x1080, 15.6" | |
|---|---|---|---|---|---|
| Power Consumption | 37% | 32% | 45% | -2% | |
| Idle Minimum * (Watt) | 9.4 | 3.2 66% | 3.4 64% | 3.3 65% | 3.9 59% |
| Idle Average * (Watt) | 13.3 | 2.8 79% | 6.4 52% | 5.2 61% | 6.7 50% |
| Idle Maximum * (Watt) | 13.9 | 12.4 11% | 7.8 44% | 5.6 60% | 8.7 37% |
| Load Average * (Watt) | 39.7 | 24.2 39% | 36.7 8% | 32.9 17% | 74 -86% |
| Load Maximum * (Watt) | 46.5 | 50 -8% | 49.3 -6% | 35.2 24% | 79 -70% |
* ... mindre är bättre
| Lenovo Flex 14IWL i5-8265U, UHD Graphics 620, 45 Wh | HP Envy x360 13-ar0601ng R7 3700U, Vega 10, 53 Wh | Dell Inspiron 14 5000 5482 2-in-1 i7-8565U, UHD Graphics 620, 42 Wh | Asus VivoBook Flip 14 TP412UA-DB51T i5-8250U, UHD Graphics 620, 42 Wh | Acer Spin 5 SP515-51GN-80A3 i5-8550U, GeForce GTX 1050 Mobile, 48 Wh | |
|---|---|---|---|---|---|
| Batteridrifttid | 10% | -5% | -8% | -7% | |
| Reader / Idle (h) | 13.6 | 10.5 -23% | 12.4 -9% | 12.7 -7% | |
| WiFi v1.3 (h) | 10.4 | 7.3 -30% | 7.2 -31% | 9.6 -8% | 6.2 -40% |
| Load (h) | 1.2 | 2.2 83% | 1.5 25% | 1.5 25% |
För
Emot
Omdöme - Bra, men det finns bättre alternativ
Läs den fullständiga versionen av den här recensionen på engelska här.
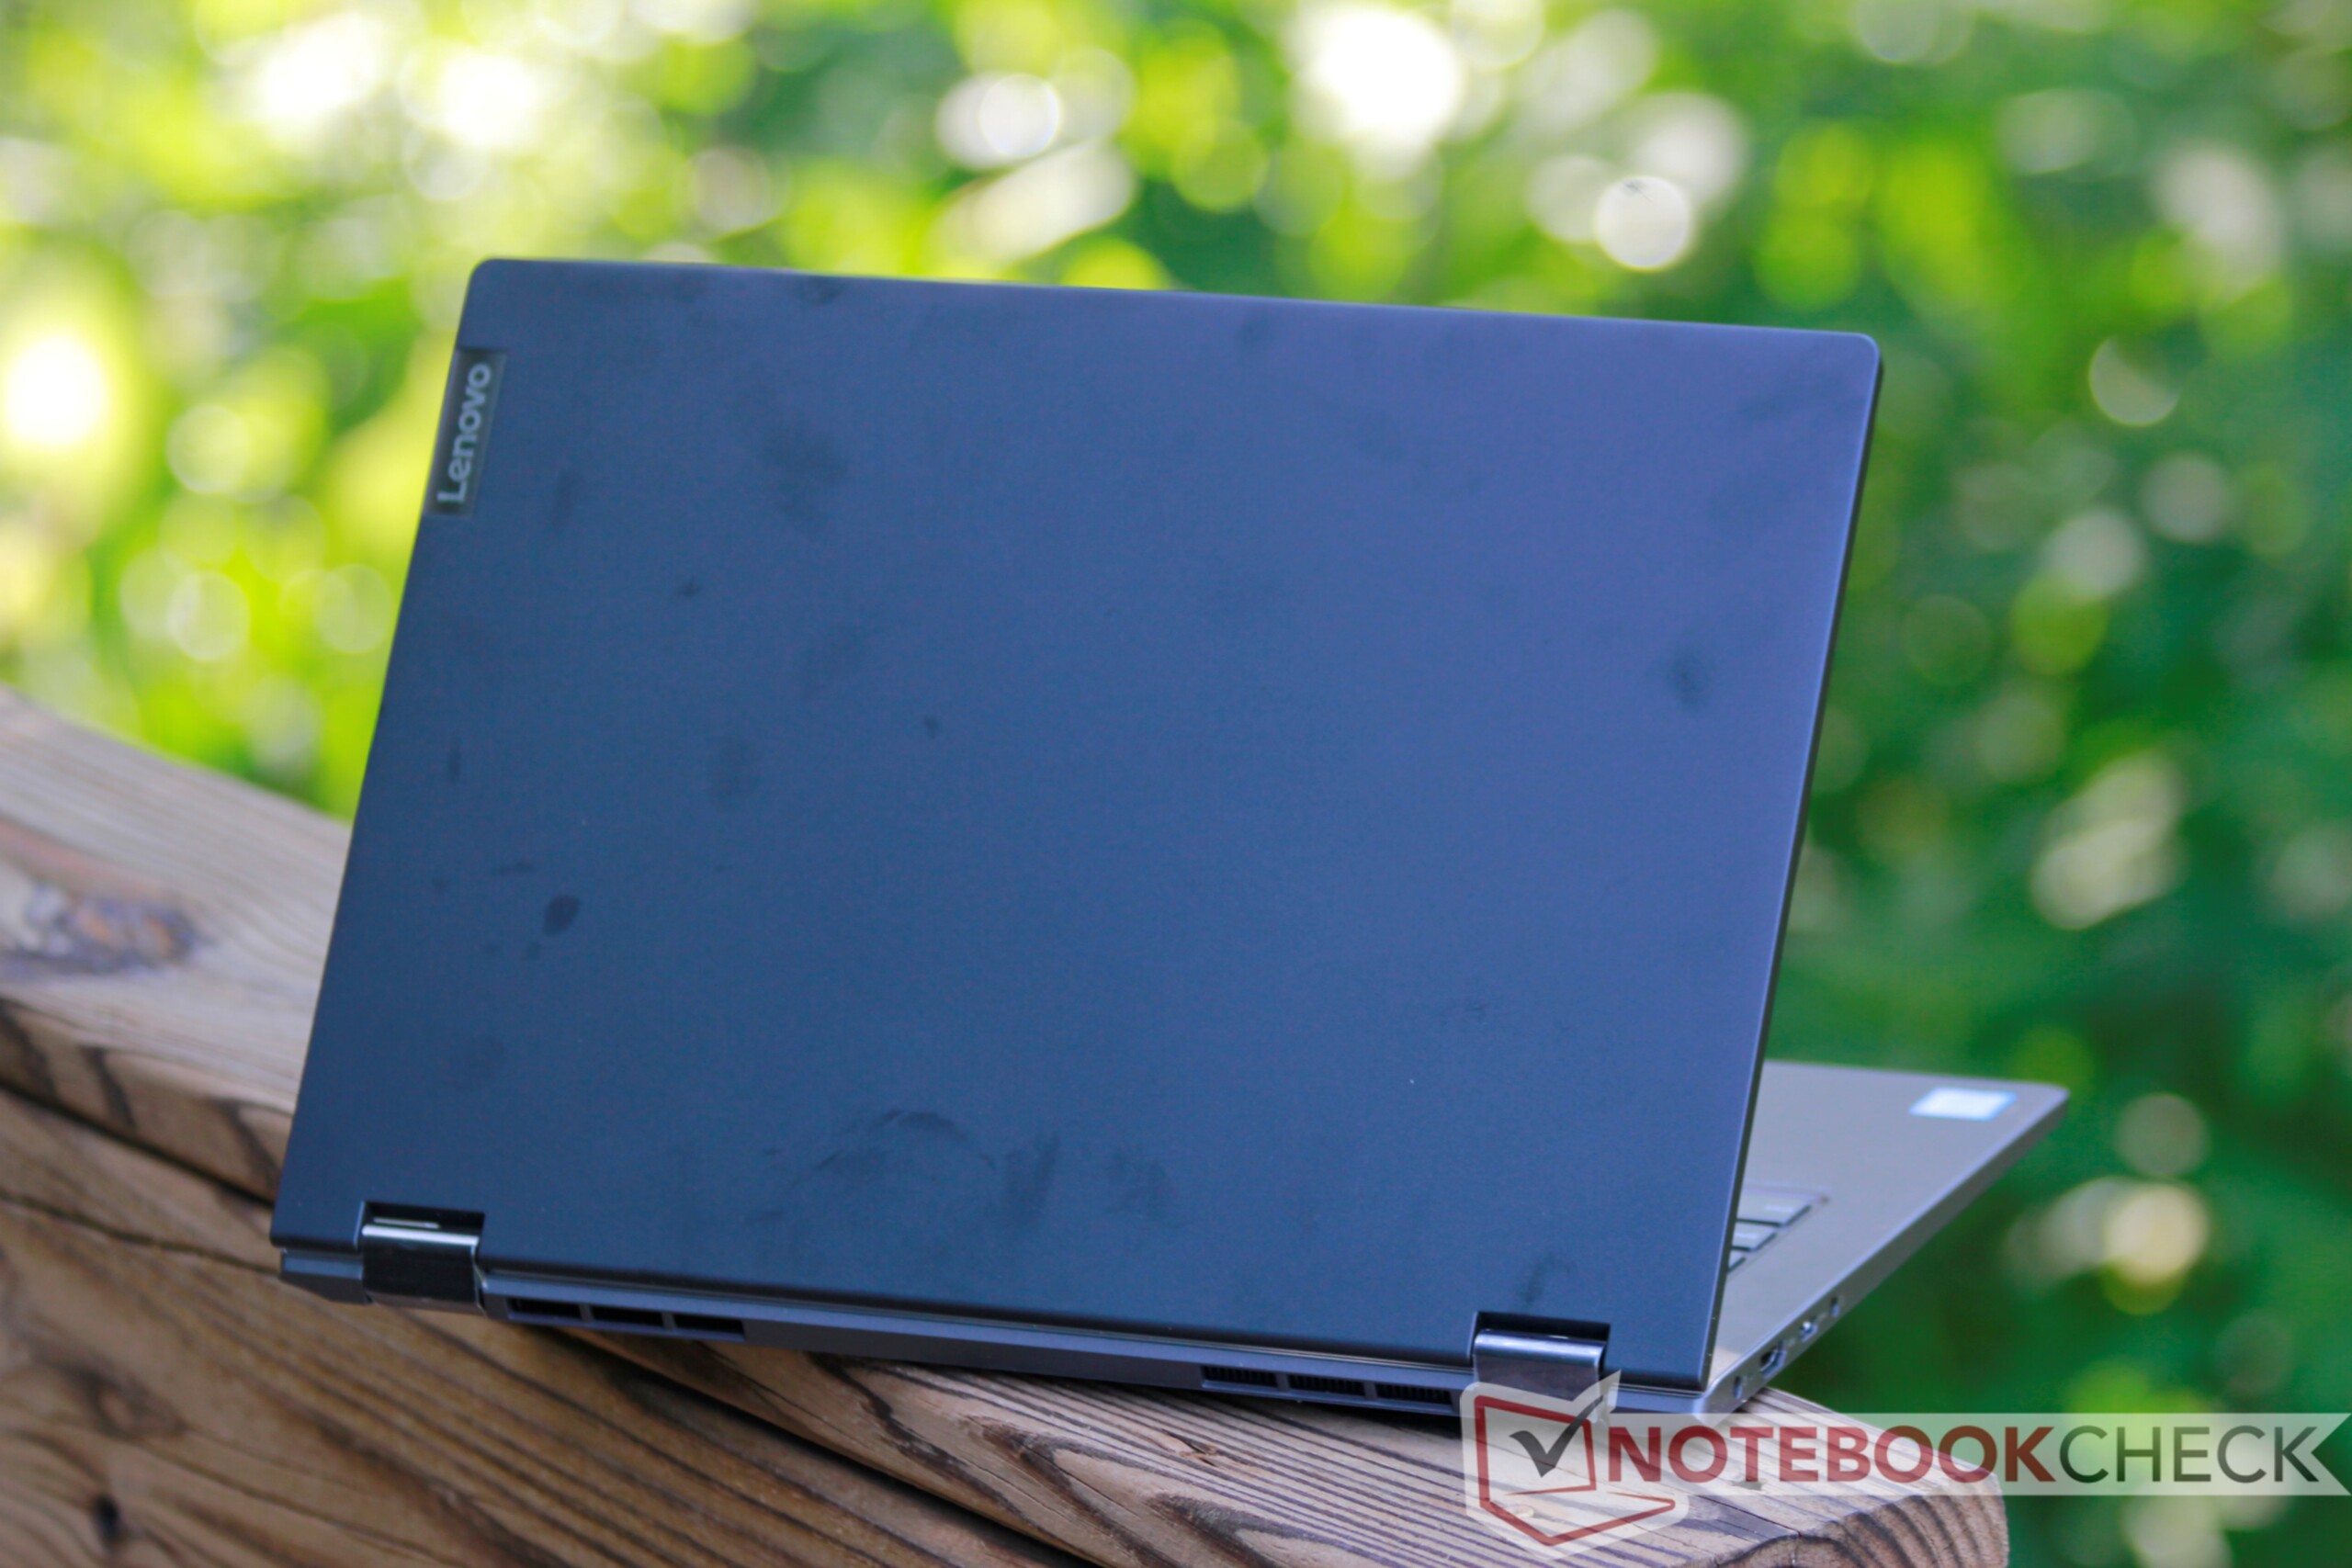
Lenovo Flex 14 är en blandad kompott. Dess styrkor är batteritiden och lagringens hastighet. Det är svårt att hitta en laptop med en NVMe-enhet för 8.000 kronor och faktum att Flex 14 står sig hela dagen på en laddning är grädden på moset. Men Flex 14 kompromissar med tangentbordet, plasthöljet och den mediokra skärmen.
Flex 14 är kanske bäst lämpad för studenter som letar efter en billig omvandlingsbar och som inte har något emot att offra tangentbord, konstruktionskvalitet och skärmljusstyrka. Det finns liknande alternativ som är billigare (exempelvis Asus VivoBook Flip 14). Lite mer pengar räcker till de överlägsna modellerna Yoga 730 och ThinkPad X390 Yoga, som är bättre än Flex 14 på alla områden. HP Envy x360 13 är också ett gångbart alternativ; för ytterligare 1.000 - 2.000 kronor har Envy x360 en mer ljusstark skärm, ett bättre tangentbord och bättre grafikprestanda. Den har dock några timmar kortare batteritid.
Det är svårt att placera Flex 14. Även om den inte misslyckas i någon specifik kategori så lyckas den heller inte bra i någon. Flex 14 är en allt-i-allo som inte bemästrar något och den lyckas inte stå ut från mängden på något meningsfullt sätt.
Lenovo Flex 14IWL
- 07/10/2019 v6 (old)
Sam Medley
Price comparison
