Test: Dell Vostro 15-5581 - En kontorslaptop med ett MX130 för enklare spel
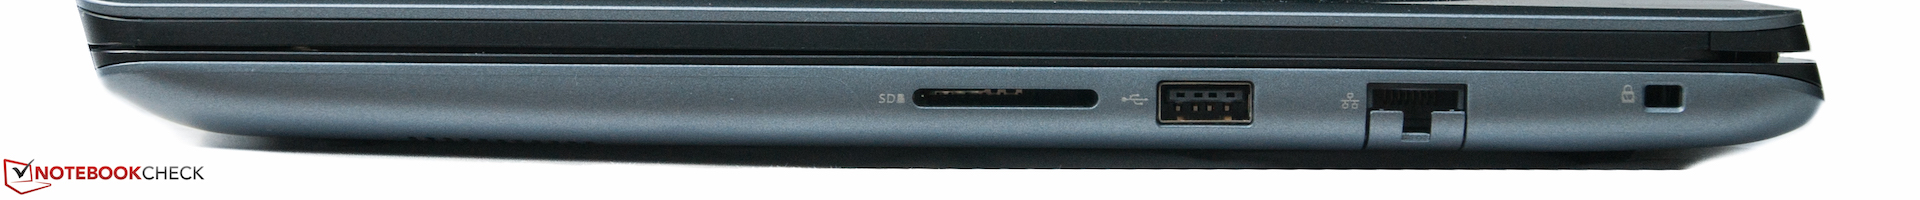

| SD Card Reader | |
| average JPG Copy Test (av. of 3 runs) | |
| HP ProBook 450 G6-5TJ93EA (Toshiba Exceria Pro SDXC 64 GB UHS-II) | |
| Genomsnitt av klass Office (19.8 - 198.5, n=22, senaste 2 åren) | |
| HP 250 G7 6HM85ES (Toshiba Exceria Pro SDXC 64 GB UHS-II) | |
| Dell Vostro 15-5568 (Toshiba Exceria Pro SDXC 64 GB UHS-II) | |
| Dell Vostro 15-5568 (Toshiba Exceria Pro SDXC 64 GB UHS-II) | |
| Acer TravelMate X3410-M-50DD (Toshiba Exceria Pro SDXC 64 GB UHS-II) | |
| Dell Vostro 15-5581 (Toshiba Exceria Pro SDXC 64 GB UHS-II) | |
| maximum AS SSD Seq Read Test (1GB) | |
| HP ProBook 450 G6-5TJ93EA (Toshiba Exceria Pro SDXC 64 GB UHS-II) | |
| Genomsnitt av klass Office (27.4 - 249, n=21, senaste 2 åren) | |
| HP 250 G7 6HM85ES (Toshiba Exceria Pro SDXC 64 GB UHS-II) | |
| Dell Vostro 15-5581 (Toshiba Exceria Pro SDXC 64 GB UHS-II) | |
| Dell Vostro 15-5568 (Toshiba Exceria Pro SDXC 64 GB UHS-II) | |
| Acer TravelMate X3410-M-50DD (Toshiba Exceria Pro SDXC 64 GB UHS-II) | |
| Dell Vostro 15-5568 (Toshiba Exceria Pro SDXC 64 GB UHS-II) | |
| Networking | |
| iperf3 transmit AX12 | |
| Acer TravelMate X3410-M-50DD | |
| Dell Vostro 15-5581 | |
| HP 250 G7 6HM85ES | |
| Dell Vostro 15-5568 | |
| Dell Vostro 15-5568 | |
| iperf3 receive AX12 | |
| Acer TravelMate X3410-M-50DD | |
| Dell Vostro 15-5581 | |
| HP 250 G7 6HM85ES | |
| Dell Vostro 15-5568 | |
| Dell Vostro 15-5568 | |
| |||||||||||||||||||||||||
Distribution av ljusstyrkan: 87 %
Mitt på batteriet: 231 cd/m²
Kontrast: 1777:1 (Svärta: 0.13 cd/m²)
ΔE ColorChecker Calman: 4.81 | ∀{0.5-29.43 Ø4.72}
calibrated: 4.2
ΔE Greyscale Calman: 5.19 | ∀{0.09-98 Ø4.97}
58% sRGB (Argyll 1.6.3 3D)
37% AdobeRGB 1998 (Argyll 1.6.3 3D)
40.15% AdobeRGB 1998 (Argyll 3D)
58.5% sRGB (Argyll 3D)
38.86% Display P3 (Argyll 3D)
Gamma: 2.33
CCT: 7088 K
| Dell Vostro 15-5581 156CL04 1G2XW, , 1920x1080, 15.6" | Dell Vostro 15-5568 Chi Mei CMN15C4, , 1920x1080, 15.6" | Dell Vostro 15-5568 Chi Mei CMN154C-8KV42 , , 1920x1080, 15.6" | HP 250 G7 6HM85ES BOE0687, , 1920x1080, 15.6" | Acer TravelMate X3410-M-50DD N140HCA-EAC, , 1920x1080, 14" | |
|---|---|---|---|---|---|
| Display | 3% | 2% | 8% | ||
| Display P3 Coverage (%) | 38.86 | 40.14 3% | 39.61 2% | 41.96 8% | |
| sRGB Coverage (%) | 58.5 | 60 3% | 59.5 2% | 63 8% | |
| AdobeRGB 1998 Coverage (%) | 40.15 | 41.5 3% | 40.93 2% | 43.37 8% | |
| Response Times | 15% | -17% | 21% | -14% | |
| Response Time Grey 50% / Grey 80% * (ms) | 36 ? | 41 ? -14% | 47.6 ? -32% | 41 ? -14% | 42 ? -17% |
| Response Time Black / White * (ms) | 27 ? | 15 ? 44% | 27.2 ? -1% | 12 ? 56% | 30 ? -11% |
| PWM Frequency (Hz) | 208 ? | 26000 ? | 25000 ? | 24500 ? | |
| Screen | -62% | -71% | -69% | 6% | |
| Brightness middle (cd/m²) | 231 | 239 3% | 229 -1% | 205 -11% | 255 10% |
| Brightness (cd/m²) | 213 | 219 3% | 222 4% | 205 -4% | 218 2% |
| Brightness Distribution (%) | 87 | 86 -1% | 82 -6% | 88 1% | 72 -17% |
| Black Level * (cd/m²) | 0.13 | 0.43 -231% | 0.56 -331% | 0.52 -300% | 0.08 38% |
| Contrast (:1) | 1777 | 556 -69% | 409 -77% | 394 -78% | 3188 79% |
| Colorchecker dE 2000 * | 4.81 | 10.11 -110% | 10.36 -115% | 11.15 -132% | 5.01 -4% |
| Colorchecker dE 2000 max. * | 8.33 | 17.33 -108% | 14.95 -79% | 19.08 -129% | 17.44 -109% |
| Colorchecker dE 2000 calibrated * | 4.2 | 2.98 29% | 4.06 3% | ||
| Greyscale dE 2000 * | 5.19 | 10.88 -110% | 10.9 -110% | 12.62 -143% | 3 42% |
| Gamma | 2.33 94% | 2.33 94% | 2.21 100% | 2.38 92% | 2.26 97% |
| CCT | 7088 92% | 11924 55% | 10084 64% | 14189 46% | 6185 105% |
| Color Space (Percent of AdobeRGB 1998) (%) | 37 | 38 3% | 37.69 2% | 38 3% | 40 8% |
| Color Space (Percent of sRGB) (%) | 58 | 60 3% | 57.92 0% | 59 2% | 63 9% |
| Totalt genomsnitt (program/inställningar) | -15% /
-39% | -44% /
-62% | -15% /
-45% | 0% /
4% |
* ... mindre är bättre
Visa svarstider
| ↔ Svarstid svart till vitt | ||
|---|---|---|
| 27 ms ... stiga ↗ och falla ↘ kombinerat | ↗ 16 ms stiga | 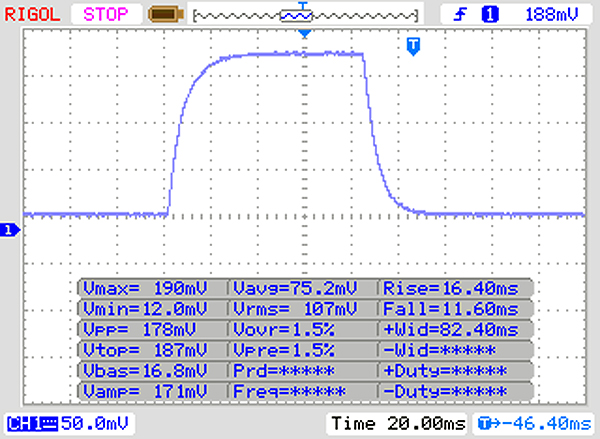 |
| ↘ 11 ms hösten | ||
| Skärmen visar relativt långsamma svarsfrekvenser i våra tester och kan vara för långsam för spelare. I jämförelse sträcker sig alla testade enheter från 0.1 (minst) till 240 (maximalt) ms. » 67 % av alla enheter är bättre. Detta innebär att den uppmätta svarstiden är sämre än genomsnittet av alla testade enheter (19.8 ms). | ||
| ↔ Svarstid 50 % grått till 80 % grått | ||
| 36 ms ... stiga ↗ och falla ↘ kombinerat | ↗ 18 ms stiga | 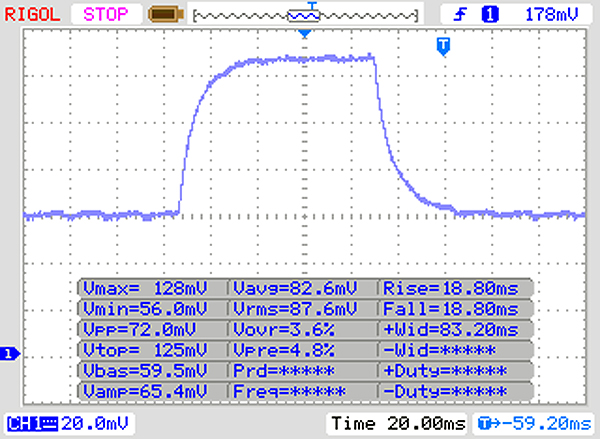 |
| ↘ 18 ms hösten | ||
| Skärmen visar långsamma svarsfrekvenser i våra tester och kommer att vara otillfredsställande för spelare. I jämförelse sträcker sig alla testade enheter från 0.165 (minst) till 636 (maximalt) ms. » 51 % av alla enheter är bättre. Detta innebär att den uppmätta svarstiden är sämre än genomsnittet av alla testade enheter (31 ms). | ||
Skärmflimmer / PWM (Puls-Width Modulation)
| Skärmflimmer / PWM upptäckt | 208 Hz | ≤ 10 % ljusstyrka inställning | 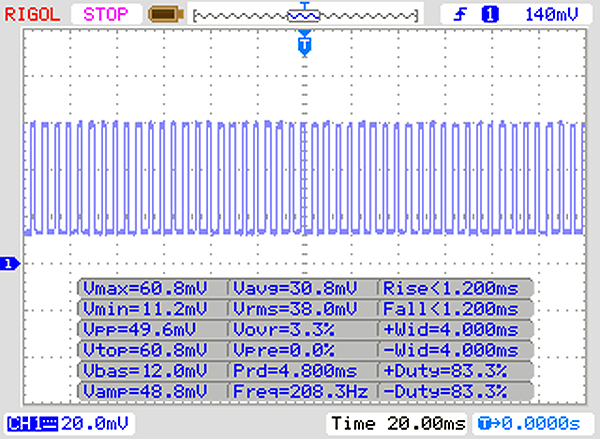 |
Displayens bakgrundsbelysning flimrar vid 208 Hz (i värsta fall, t.ex. med PWM) Flimrande upptäckt vid en ljusstyrkeinställning på 10 % och lägre. Det ska inte finnas något flimmer eller PWM över denna ljusstyrkeinställning. Frekvensen för 208 Hz är relativt låg, så känsliga användare kommer sannolikt att märka flimmer och uppleva ansträngda ögon vid den angivna ljusstyrkeinställningen och nedan. Som jämförelse: 52 % av alla testade enheter använder inte PWM för att dämpa skärmen. Om PWM upptäcktes mättes ett medelvärde av 7769 (minst: 5 - maximum: 343500) Hz. | |||
| Cinebench R15 | |
| CPU Single 64Bit | |
| Genomsnitt av klass Office (99.5 - 312, n=75, senaste 2 åren) | |
| Asus VivoBook 14 F412FJ-EB084T | |
| Lenovo ThinkPad E490-20N8000RGE | |
| Genomsnitt Intel Core i5-8265U (111 - 164, n=35) | |
| HP 250 G7 6HM85ES | |
| Dell Vostro 15-5568 | |
| Dell Vostro 15-5568 | |
| Dell Vostro 15-5581 | |
| CPU Multi 64Bit | |
| Genomsnitt av klass Office (250 - 3380, n=75, senaste 2 åren) | |
| Asus VivoBook 14 F412FJ-EB084T | |
| Dell Vostro 15-5581 | |
| Genomsnitt Intel Core i5-8265U (457 - 750, n=38) | |
| Lenovo ThinkPad E490-20N8000RGE | |
| HP 250 G7 6HM85ES | |
| Dell Vostro 15-5568 | |
| Dell Vostro 15-5568 | |
| PCMark 8 Home Score Accelerated v2 | 3727 poäng | |
| PCMark 8 Work Score Accelerated v2 | 4946 poäng | |
| PCMark 10 Score | 3272 poäng | |
Hjälp | ||
| Dell Vostro 15-5581 SK hynix BC501 HFM128GDJTNG-831 | Dell Vostro 15-5568 SanDisk X400 256GB, SATA (SD8SB8U-256G) | Dell Vostro 15-5568 Micron SSD 1100 (MTFDDAV256TBN) | HP 250 G7 6HM85ES WDC PC SN520 SDAPNUW-512G | Genomsnitt SK hynix BC501 HFM128GDJTNG-831 | |
|---|---|---|---|---|---|
| CrystalDiskMark 5.2 / 6 | 12% | 182% | 24% | ||
| Write 4K (MB/s) | 129.3 | 109.5 -15% | 179.3 39% | 108.2 ? -16% | |
| Read 4K (MB/s) | 41.02 | 26.43 -36% | 47.7 16% | 39.3 ? -4% | |
| Write Seq (MB/s) | 203.4 | 474.2 133% | 1265 522% | 284 ? 40% | |
| Read Seq (MB/s) | 271.2 | 482.8 78% | 1184 337% | 772 ? 185% | |
| Write 4K Q32T1 (MB/s) | 252.3 | 160.5 -36% | 450.6 79% | 239 ? -5% | |
| Read 4K Q32T1 (MB/s) | 281.4 | 221.5 -21% | 556 98% | 279 ? -1% | |
| Write Seq Q32T1 (MB/s) | 319.8 | 500 56% | 1455 355% | 303 ? -5% | |
| Read Seq Q32T1 (MB/s) | 1589 | 533 -66% | 1717 8% | 1597 ? 1% | |
| AS SSD | -20% | -14% | 188% | -8% | |
| Seq Read (MB/s) | 1195 | 502 -58% | 492.6 -59% | 1477 24% | 1157 ? -3% |
| Seq Write (MB/s) | 370.2 | 465.2 26% | 462.2 25% | 1339 262% | 359 ? -3% |
| 4K Read (MB/s) | 39.14 | 26.84 -31% | 25.59 -35% | 46.26 18% | 34.3 ? -12% |
| 4K Write (MB/s) | 115.5 | 50.3 -56% | 87.6 -24% | 143.9 25% | 105.6 ? -9% |
| 4K-64 Read (MB/s) | 257.9 | 357.9 39% | 231.9 -10% | 937 263% | 257 ? 0% |
| 4K-64 Write (MB/s) | 166.2 | 156.4 -6% | 290.7 75% | 1190 616% | 153.5 ? -8% |
| Access Time Read * (ms) | 0.073 | 0.098 -34% | 0.149 -104% | 0.046 37% | 0.09467 ? -30% |
| Access Time Write * (ms) | 0.045 | 0.083 -84% | 0.057 -27% | 0.024 47% | 0.04667 ? -4% |
| Score Read (Points) | 417 | 435 4% | 307 -26% | 1131 171% | 407 ? -2% |
| Score Write (Points) | 319 | 253 -21% | 424 33% | 1468 360% | 295 ? -8% |
| Score Total (Points) | 922 | 917 -1% | 896 -3% | 3181 245% | 883 ? -4% |
| Copy ISO MB/s (MB/s) | 267.5 | 765 | 245 ? | ||
| Copy Program MB/s (MB/s) | 106.4 | 239.9 | 135.3 ? | ||
| Copy Game MB/s (MB/s) | 161.1 | 528 | 223 ? | ||
| Totalt genomsnitt (program/inställningar) | -20% /
-20% | -1% /
-3% | 185% /
185% | 8% /
6% |
* ... mindre är bättre

| 3DMark 11 Performance | 2692 poäng | |
| 3DMark Cloud Gate Standard Score | 10635 poäng | |
| 3DMark Fire Strike Score | 2115 poäng | |
| 3DMark Time Spy Score | 724 poäng | |
Hjälp | ||
| låg | med. | hög | ultra | |
|---|---|---|---|---|
| BioShock Infinite (2013) | 83.6 | 57.3 | 51 | 48.7 |
Ljudnivå
| Låg belastning |
| 30.6 / 31.6 / 31.6 dB(A) |
| Hög belastning |
| 42.6 / 42.8 dB(A) |
 | ||
30 dB tyst 40 dB(A) hörbar 50 dB(A) högt ljud |
||
min: | ||
(±) Den maximala temperaturen på ovansidan är 44.7 °C / 112 F, jämfört med genomsnittet av 34.3 °C / 94 F , allt från 21.2 till 62.5 °C för klassen Office.
(±) Botten värms upp till maximalt 43.6 °C / 110 F, jämfört med genomsnittet av 36.8 °C / 98 F
(+) Vid tomgångsbruk är medeltemperaturen för ovansidan 27.2 °C / 81 F, jämfört med enhetsgenomsnittet på 29.5 °C / ### class_avg_f### F.
(+) Handledsstöden och pekplattan är kallare än hudtemperaturen med maximalt 27.1 °C / 80.8 F och är därför svala att ta på.
(±) Medeltemperaturen för handledsstödsområdet på liknande enheter var 27.5 °C / 81.5 F (+0.4 °C / 0.7 F).
Dell Vostro 15-5581 ljudanalys
(-) | inte särskilt höga högtalare (70.3 dB)
Bas 100 - 315 Hz
(-) | nästan ingen bas - i genomsnitt 18.9% lägre än medianen
(±) | linjäriteten för basen är genomsnittlig (11.1% delta till föregående frekvens)
Mellan 400 - 2000 Hz
(+) | balanserad mellan - endast 3.6% från medianen
(±) | linjäriteten för mids är genomsnittlig (7.7% delta till föregående frekvens)
Högsta 2 - 16 kHz
(+) | balanserade toppar - endast 1.9% från medianen
(+) | toppar är linjära (5.9% delta till föregående frekvens)
Totalt 100 - 16 000 Hz
(±) | linjäriteten för det totala ljudet är genomsnittlig (18.9% skillnad mot median)
Jämfört med samma klass
» 35% av alla testade enheter i den här klassen var bättre, 7% liknande, 57% sämre
» Den bästa hade ett delta på 7%, genomsnittet var 21%, sämst var 53%
Jämfört med alla testade enheter
» 44% av alla testade enheter var bättre, 8% liknande, 48% sämre
» Den bästa hade ett delta på 4%, genomsnittet var 24%, sämst var 134%
Apple MacBook 12 (Early 2016) 1.1 GHz ljudanalys
(+) | högtalare kan spela relativt högt (83.6 dB)
Bas 100 - 315 Hz
(±) | reducerad bas - i genomsnitt 11.3% lägre än medianen
(±) | linjäriteten för basen är genomsnittlig (14.2% delta till föregående frekvens)
Mellan 400 - 2000 Hz
(+) | balanserad mellan - endast 2.4% från medianen
(+) | mids är linjära (5.5% delta till föregående frekvens)
Högsta 2 - 16 kHz
(+) | balanserade toppar - endast 2% från medianen
(+) | toppar är linjära (4.5% delta till föregående frekvens)
Totalt 100 - 16 000 Hz
(+) | det totala ljudet är linjärt (10.2% skillnad mot median)
Jämfört med samma klass
» 7% av alla testade enheter i den här klassen var bättre, 2% liknande, 91% sämre
» Den bästa hade ett delta på 5%, genomsnittet var 18%, sämst var 53%
Jämfört med alla testade enheter
» 5% av alla testade enheter var bättre, 1% liknande, 94% sämre
» Den bästa hade ett delta på 4%, genomsnittet var 24%, sämst var 134%
| Av/Standby | |
| Låg belastning | |
| Hög belastning |
|
Förklaring:
min: | |
| Dell Vostro 15-5581 i5-8265U, GeForce MX130, SK hynix BC501 HFM128GDJTNG-831, IPS, 1920x1080, 15.6" | Dell Vostro 15-5568 i7-7500U, GeForce 940MX, Micron SSD 1100 (MTFDDAV256TBN), TN LED, 1920x1080, 15.6" | HP ProBook 450 G6-5TJ93EA i7-8565U, GeForce MX130, Samsung SSD PM981 MZVLB512HAJQ, IPS, 1920x1080, 15.6" | HP 250 G7 6HM85ES i5-8265U, UHD Graphics 620, WDC PC SN520 SDAPNUW-512G, TN, 1920x1080, 15.6" | Genomsnitt NVIDIA GeForce MX130 | Genomsnitt av klass Office | |
|---|---|---|---|---|---|---|
| Power Consumption | 11% | -6% | 26% | -10% | -3% | |
| Idle Minimum * (Watt) | 5 | 3.1 38% | 3.12 38% | 3.2 36% | 4.54 ? 9% | 4.41 ? 12% |
| Idle Average * (Watt) | 7.9 | 6.3 20% | 6.3 20% | 5.7 28% | 6.98 ? 12% | 7.38 ? 7% |
| Idle Maximum * (Watt) | 11.2 | 6.5 42% | 9.78 13% | 6.1 46% | 9.08 ? 19% | 8.59 ? 23% |
| Load Average * (Watt) | 34 | 46 -35% | 57.6 -69% | 36.5 -7% | 54.1 ? -59% | 43.3 ? -27% |
| Load Maximum * (Watt) | 50.2 | 54 -8% | 67.3 -34% | 37.5 25% | 66.4 ? -32% | 64.5 ? -28% |
| Witcher 3 ultra * (Watt) | 42 |
* ... mindre är bättre
| Dell Vostro 15-5581 i5-8265U, GeForce MX130, 42 Wh | Dell Vostro 15-5568 i7-7500U, GeForce 940MX, 42 Wh | Dell Vostro 15-5568 i5-7200U, HD Graphics 620, 42 Wh | HP 250 G7 6HM85ES i5-8265U, UHD Graphics 620, 41 Wh | Genomsnitt av klass Office | |
|---|---|---|---|---|---|
| Batteridrifttid | -17% | 16% | -1% | 79% | |
| Reader / Idle (h) | 12.5 | 13.3 6% | 16.9 35% | 13.9 11% | 23.7 ? 90% |
| H.264 (h) | 6.6 | 8.5 29% | 7.1 8% | 15 ? 127% | |
| WiFi v1.3 (h) | 6.8 | 4.3 -37% | 6 -12% | 5.7 -16% | 12.8 ? 88% |
| Load (h) | 1.6 | 1.3 -19% | 1.8 13% | 1.5 -6% | 1.793 ? 12% |
För
Emot
Läs den fullständiga versionen av den här recensionen på engelska här.
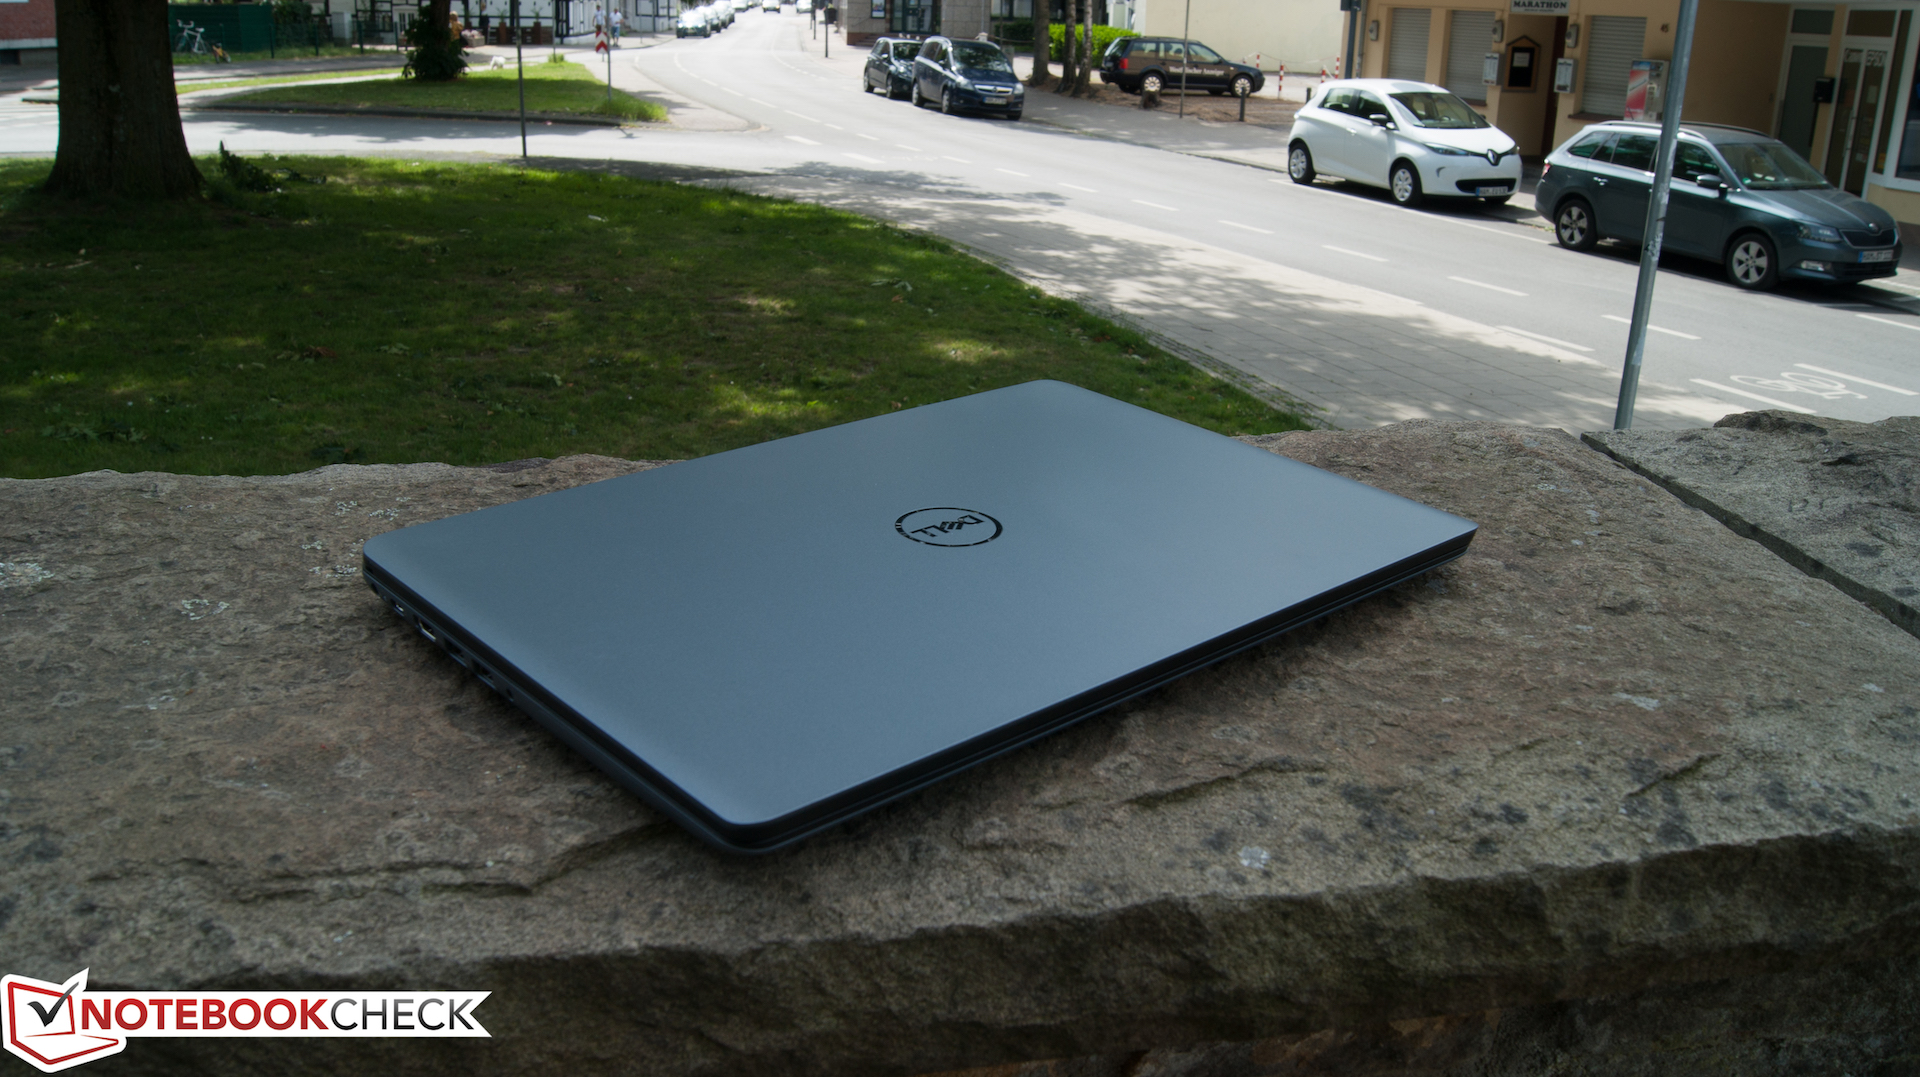
Den har en tjusig design, även om plasthöljet har en del hantverksmässiga motsägelser. Dell har dessutom utrustat Vostro 15-5581 med skapliga inmatningsenheter, så du kommer aldrig behöva känna behovet av att hämta en extern mus eller ett externt tangentbord.
Tyvärr var skärmen i vår recensionsenhet en besvikelse tack vare oacceptabelt låg ljusstyrka. Den hade dock stabila betraktningsvinklar och en matt yta, så reflektioner från starka ljuskällor bör inte bli ett problem.
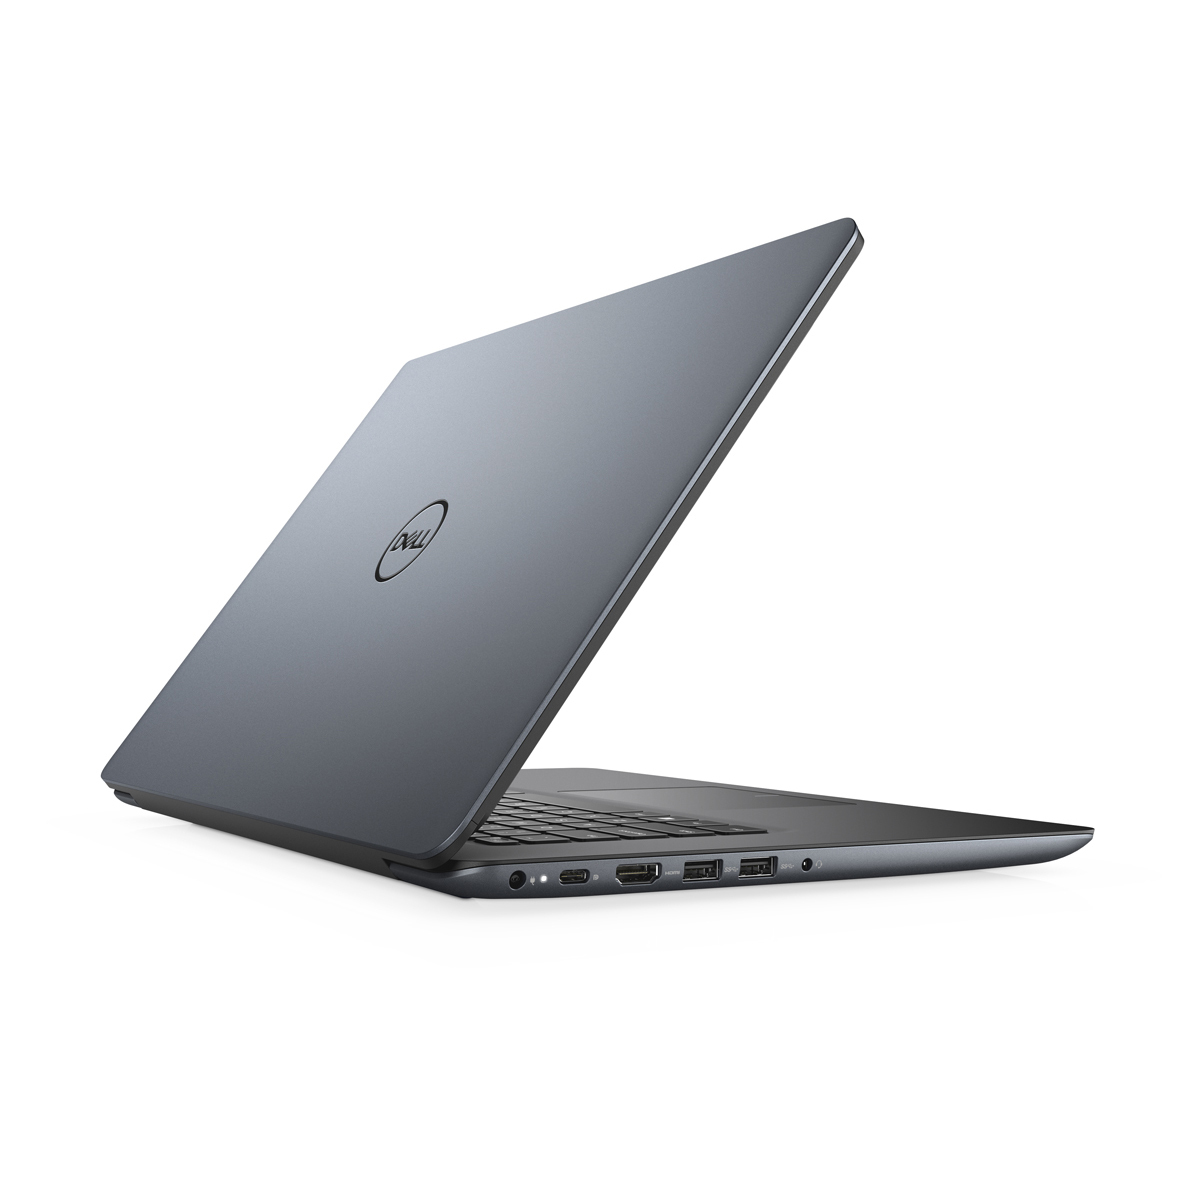
På plussidan så har Vostro 15-5581 tillräckligt med kraft för att hantera alla vanliga kontorsuppgifter. Tack vare dess GeForce MX130 GPU klarar den till och med en del mer grafikintensiva sådana. Men enheten kan inte få ut mesta möjliga ur dessa två komponenter och fläkten betedde sig för aggressivt för vårt tycke. Vostro 15-5581 har dock redan tagit stora steg framåt jämfört med sin föregångare: mer kraft, bättre inmatningsenheter och bättre batteritid.
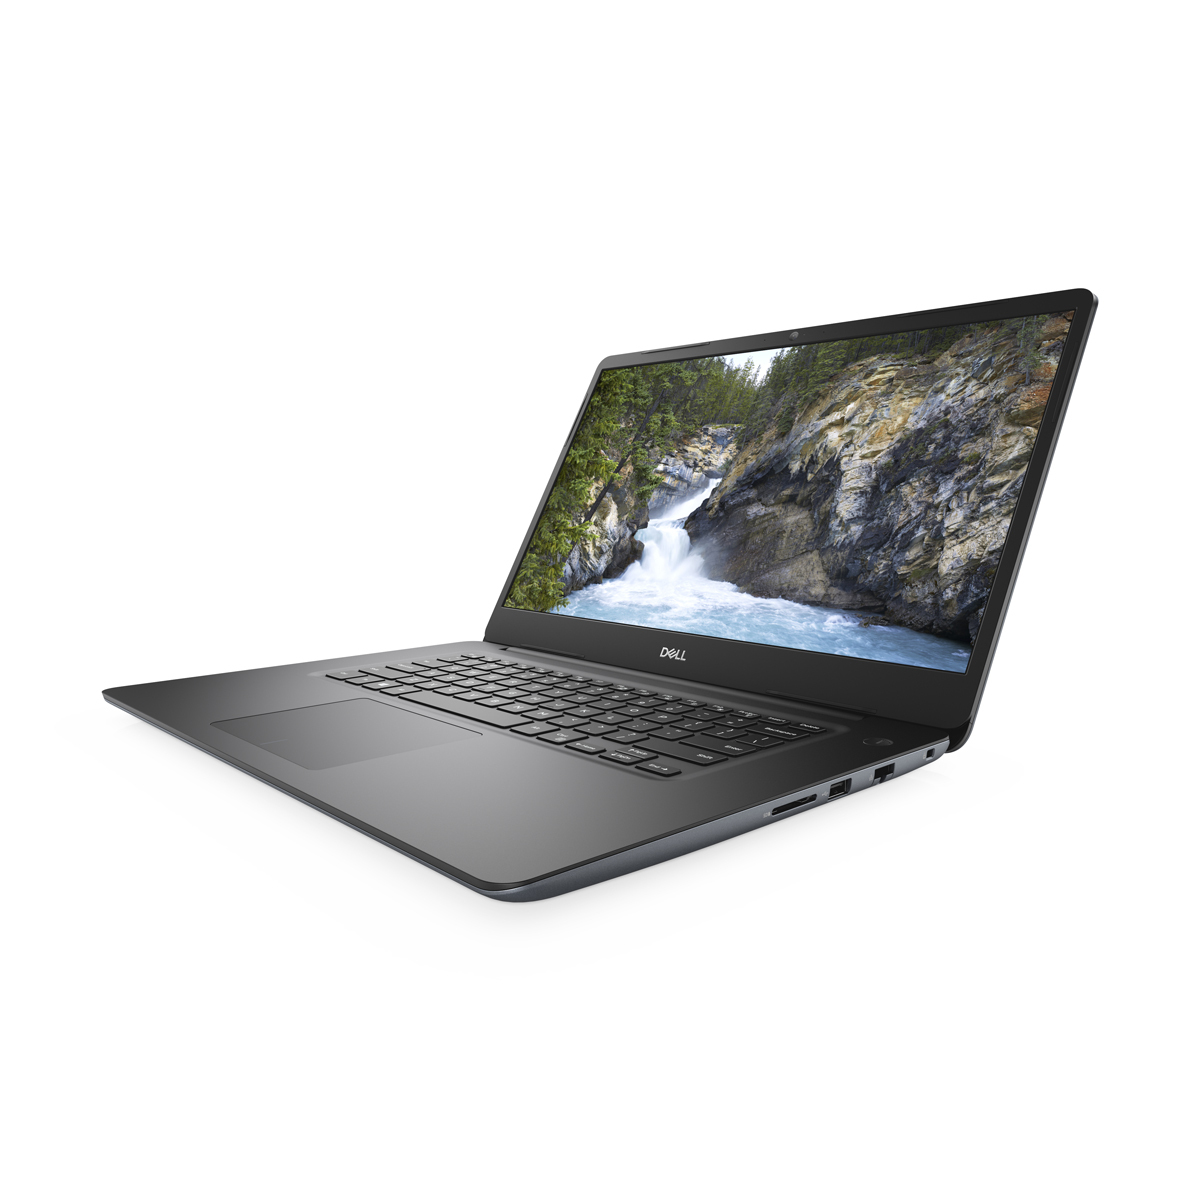
Dell Vostro 15-5581 är en genomsnittlig laptop på 15.6 tum. Den kommer inte direkt att inspirera, men det var heller inte tanken. Den får helt enkelt jobbet gjort.
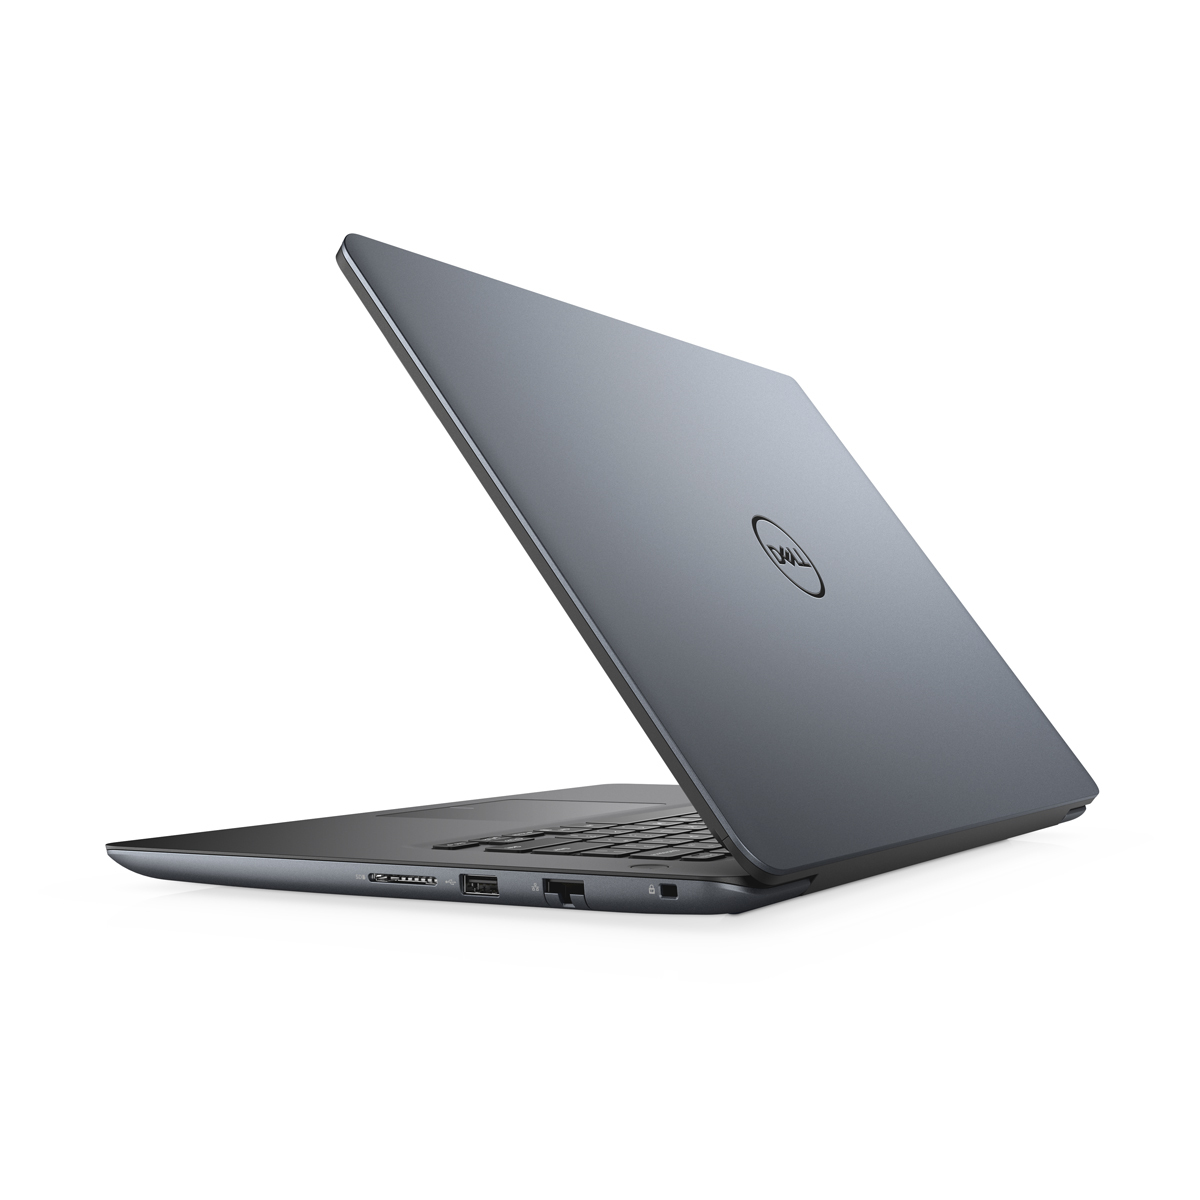
Sammanfattningsvis lyckas Vostro 15-5581 bra på en del områden såsom batteritid och CPU-prestanda. En dålig skärm, en aggressiv fläkt och en jämförelsevis långsam SSD-enhet spolierar vad som annars hade varit en gedigen kontorslaptop.
Dell Vostro 15-5581
- 06/17/2019 v6 (old)
Nino Ricchizzi
Price comparison
