Test: HP Spectre x360 15-bl002xx (sammanfattning)


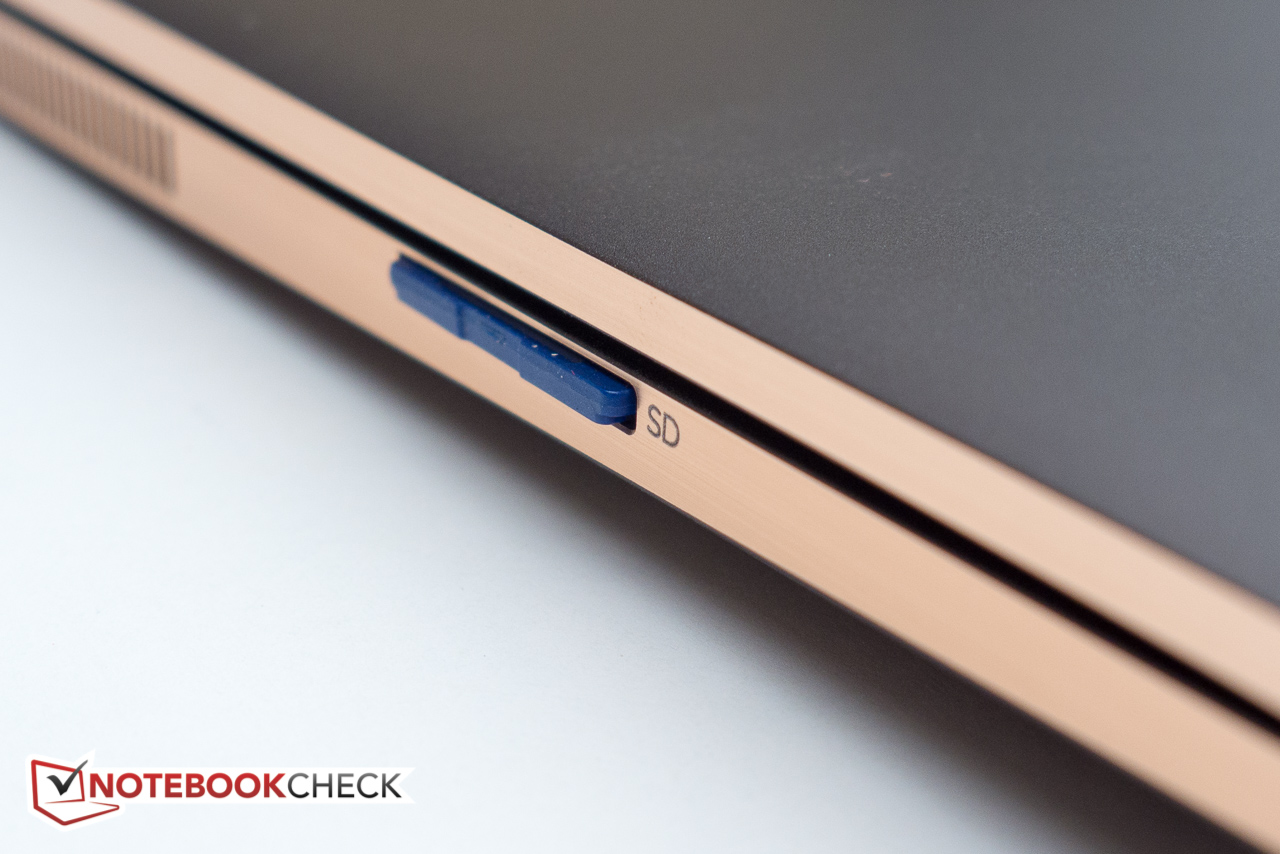

| SD Card Reader | |
| average JPG Copy Test (av. of 3 runs) | |
| HP Spectre x360 15-bl002xx | |
| Lenovo Yoga 710-14IKB 80V4002HGE | |
| Dell XPS 15 2017 9560 (7300HQ, Full-HD) | |
| Dell Inspiron 15 5568 | |
| maximum AS SSD Seq Read Test (1GB) | |
| HP Spectre x360 15-bl002xx | |
| Dell XPS 15 2017 9560 (7300HQ, Full-HD) | |
| Lenovo Yoga 710-14IKB 80V4002HGE | |
| Dell Inspiron 15 5568 | |
| Networking | |
| iperf3 transmit AX12 | |
| HP Spectre x360 15-bl002xx | |
| iperf3 receive AX12 | |
| HP Spectre x360 15-bl002xx | |
| |||||||||||||||||||||||||
Distribution av ljusstyrkan: 83 %
Mitt på batteriet: 351.5 cd/m²
Kontrast: 1465:1 (Svärta: 0.24 cd/m²)
ΔE ColorChecker Calman: 3.3 | ∀{0.5-29.43 Ø4.71}
ΔE Greyscale Calman: 1.9 | ∀{0.09-98 Ø4.96}
88.2% sRGB (Argyll 1.6.3 3D)
64.4% AdobeRGB 1998 (Argyll 1.6.3 3D)
64.4% AdobeRGB 1998 (Argyll 3D)
88.2% sRGB (Argyll 3D)
67.9% Display P3 (Argyll 3D)
Gamma: 2.09
CCT: 6784 K
| HP Spectre x360 15-bl002xx UHD UWVA eDP BrightView WLED-backlit , IPS, 15.6", 3840x2160 | HP Spectre x360 15-ap012dx IPS, 15.6", 3840x2160 | Dell XPS 15 2017 9560 (7300HQ, Full-HD) Sharp SHP1453 LQ156M1, LED IGZO IPS InfinityEdge, 15.6", 1920x1080 | Lenovo ThinkPad X1 Yoga-20FRS1VS00 Samsung ATNA40JU01-0, OLED, 14", 2560x1440 | Lenovo Yoga 710-14IKB 80V4002HGE AU Optronics B140HAN03.0, a-Si WLED TFT, IPS, 14", 1920x1080 | Dell Inspiron 15 5568 AU Optronics B156HW01 V0, IPS, 15.6", 1920x1080 | |
|---|---|---|---|---|---|---|
| Display | -3% | 8% | -3% | -39% | ||
| Display P3 Coverage (%) | 67.9 | 62.8 -8% | 68.9 1% | 62 -9% | 38.04 -44% | |
| sRGB Coverage (%) | 88.2 | 88.2 0% | 98.9 12% | 89.5 1% | 57.1 -35% | |
| AdobeRGB 1998 Coverage (%) | 64.4 | 63.9 -1% | 70.9 10% | 63.3 -2% | 39.3 -39% | |
| Response Times | 27% | -29% | 98% | -3% | 24% | |
| Response Time Grey 50% / Grey 80% * (ms) | 44 ? | 32.8 ? 25% | 54 ? -23% | 1 ? 98% | 53 ? -20% | 42 ? 5% |
| Response Time Black / White * (ms) | 38.8 ? | 28 ? 28% | 52.4 ? -35% | 1 ? 97% | 33 ? 15% | 22 ? 43% |
| PWM Frequency (Hz) | 1000 ? | 240 ? | 50 ? | |||
| Screen | -29% | -33% | -27% | -60% | -32% | |
| Brightness middle (cd/m²) | 351.5 | 298 -15% | 400 14% | 279 -21% | 340 -3% | 266 -24% |
| Brightness (cd/m²) | 336 | 295 -12% | 392 17% | 277 -18% | 302 -10% | 249 -26% |
| Brightness Distribution (%) | 83 | 88 6% | 89 7% | 91 10% | 77 -7% | 85 2% |
| Black Level * (cd/m²) | 0.24 | 0.57 -138% | 0.26 -8% | 0.31 -29% | 0.26 -8% | |
| Contrast (:1) | 1465 | 523 -64% | 1538 5% | 1097 -25% | 1023 -30% | |
| Colorchecker dE 2000 * | 3.3 | 4.43 -34% | 4.9 -48% | 5.15 -56% | 6.75 -105% | 4.98 -51% |
| Colorchecker dE 2000 max. * | 7.3 | 6.62 9% | 11 -51% | 8.28 -13% | 12.4 -70% | 11.82 -62% |
| Greyscale dE 2000 * | 1.9 | 2.45 -29% | 7.2 -279% | 5.44 -186% | 8.47 -346% | 2.68 -41% |
| Gamma | 2.09 105% | 2.45 90% | 2.11 104% | 2.28 96% | 2.22 99% | 2.27 97% |
| CCT | 6784 96% | 6326 103% | 6911 94% | 5686 114% | 6557 99% | 6583 99% |
| Color Space (Percent of AdobeRGB 1998) (%) | 64.4 | 57.2 -11% | 64.2 0% | 98 52% | 58 -10% | 36 -44% |
| Color Space (Percent of sRGB) (%) | 88.2 | 87.8 0% | 98.9 12% | 100 13% | 89 1% | 57 -35% |
| Totalt genomsnitt (program/inställningar) | -2% /
-16% | -18% /
-24% | 36% /
-2% | -22% /
-41% | -16% /
-26% |
* ... mindre är bättre
Visa svarstider
| ↔ Svarstid svart till vitt | ||
|---|---|---|
| 38.8 ms ... stiga ↗ och falla ↘ kombinerat | ↗ 6.4 ms stiga | 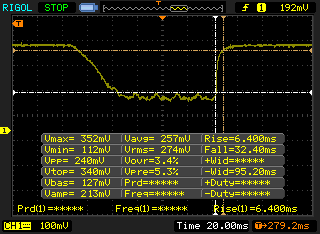 |
| ↘ 32.4 ms hösten | ||
| Skärmen visar långsamma svarsfrekvenser i våra tester och kommer att vara otillfredsställande för spelare. I jämförelse sträcker sig alla testade enheter från 0.1 (minst) till 240 (maximalt) ms. » 96 % av alla enheter är bättre. Detta innebär att den uppmätta svarstiden är sämre än genomsnittet av alla testade enheter (19.8 ms). | ||
| ↔ Svarstid 50 % grått till 80 % grått | ||
| 44 ms ... stiga ↗ och falla ↘ kombinerat | ↗ 20.4 ms stiga | 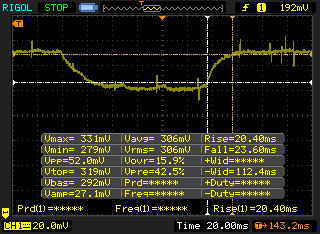 |
| ↘ 23.6 ms hösten | ||
| Skärmen visar långsamma svarsfrekvenser i våra tester och kommer att vara otillfredsställande för spelare. I jämförelse sträcker sig alla testade enheter från 0.165 (minst) till 636 (maximalt) ms. » 73 % av alla enheter är bättre. Detta innebär att den uppmätta svarstiden är sämre än genomsnittet av alla testade enheter (31 ms). | ||
Skärmflimmer / PWM (Puls-Width Modulation)
| Skärmflimmer / PWM upptäckt | 1000 Hz | ≤ 99 % ljusstyrka inställning | 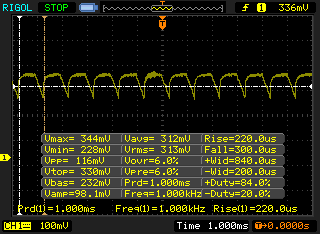 |
Displayens bakgrundsbelysning flimrar vid 1000 Hz (i värsta fall, t.ex. med PWM) Flimrande upptäckt vid en ljusstyrkeinställning på 99 % och lägre. Det ska inte finnas något flimmer eller PWM över denna ljusstyrkeinställning. Frekvensen för 1000 Hz är ganska hög, så de flesta användare som är känsliga för PWM bör inte märka något flimmer. Som jämförelse: 52 % av alla testade enheter använder inte PWM för att dämpa skärmen. Om PWM upptäcktes mättes ett medelvärde av 7754 (minst: 5 - maximum: 343500) Hz. | |||
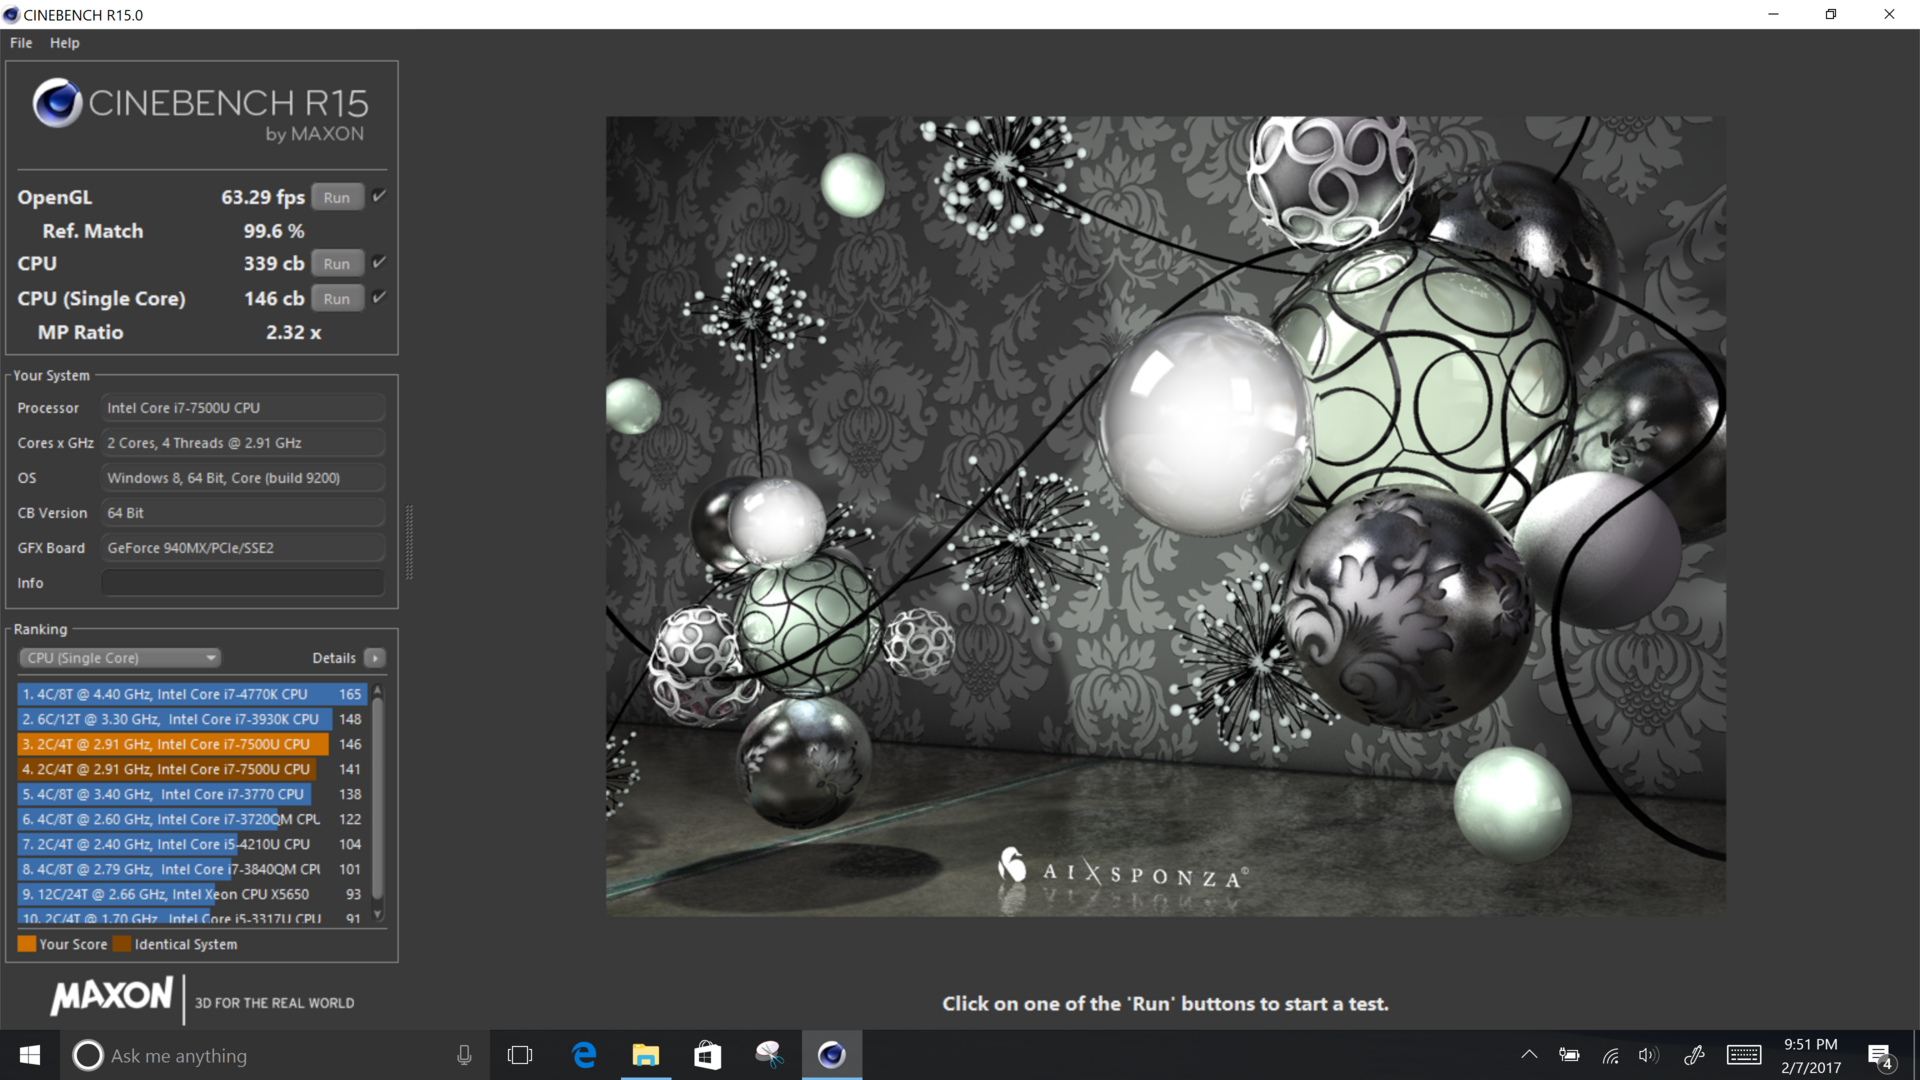
| Cinebench R15 | |
| CPU Single 64Bit | |
| Lenovo Yoga 910-13IKB-80VF004CGE | |
| Dell XPS 15 2017 9560 (7300HQ, Full-HD) | |
| HP Spectre x360 15-bl002xx | |
| Lenovo ThinkPad X1 Yoga-20FRS1VS00 | |
| Dell Inspiron 15 5568 | |
| HP Spectre x360 15-ap012dx | |
| CPU Multi 64Bit | |
| Dell XPS 15 2017 9560 (7300HQ, Full-HD) | |
| Lenovo Yoga 910-13IKB-80VF004CGE | |
| HP Spectre x360 15-bl002xx | |
| HP Spectre x360 15-ap012dx | |
| Dell Inspiron 15 5568 | |
| Lenovo ThinkPad X1 Yoga-20FRS1VS00 | |
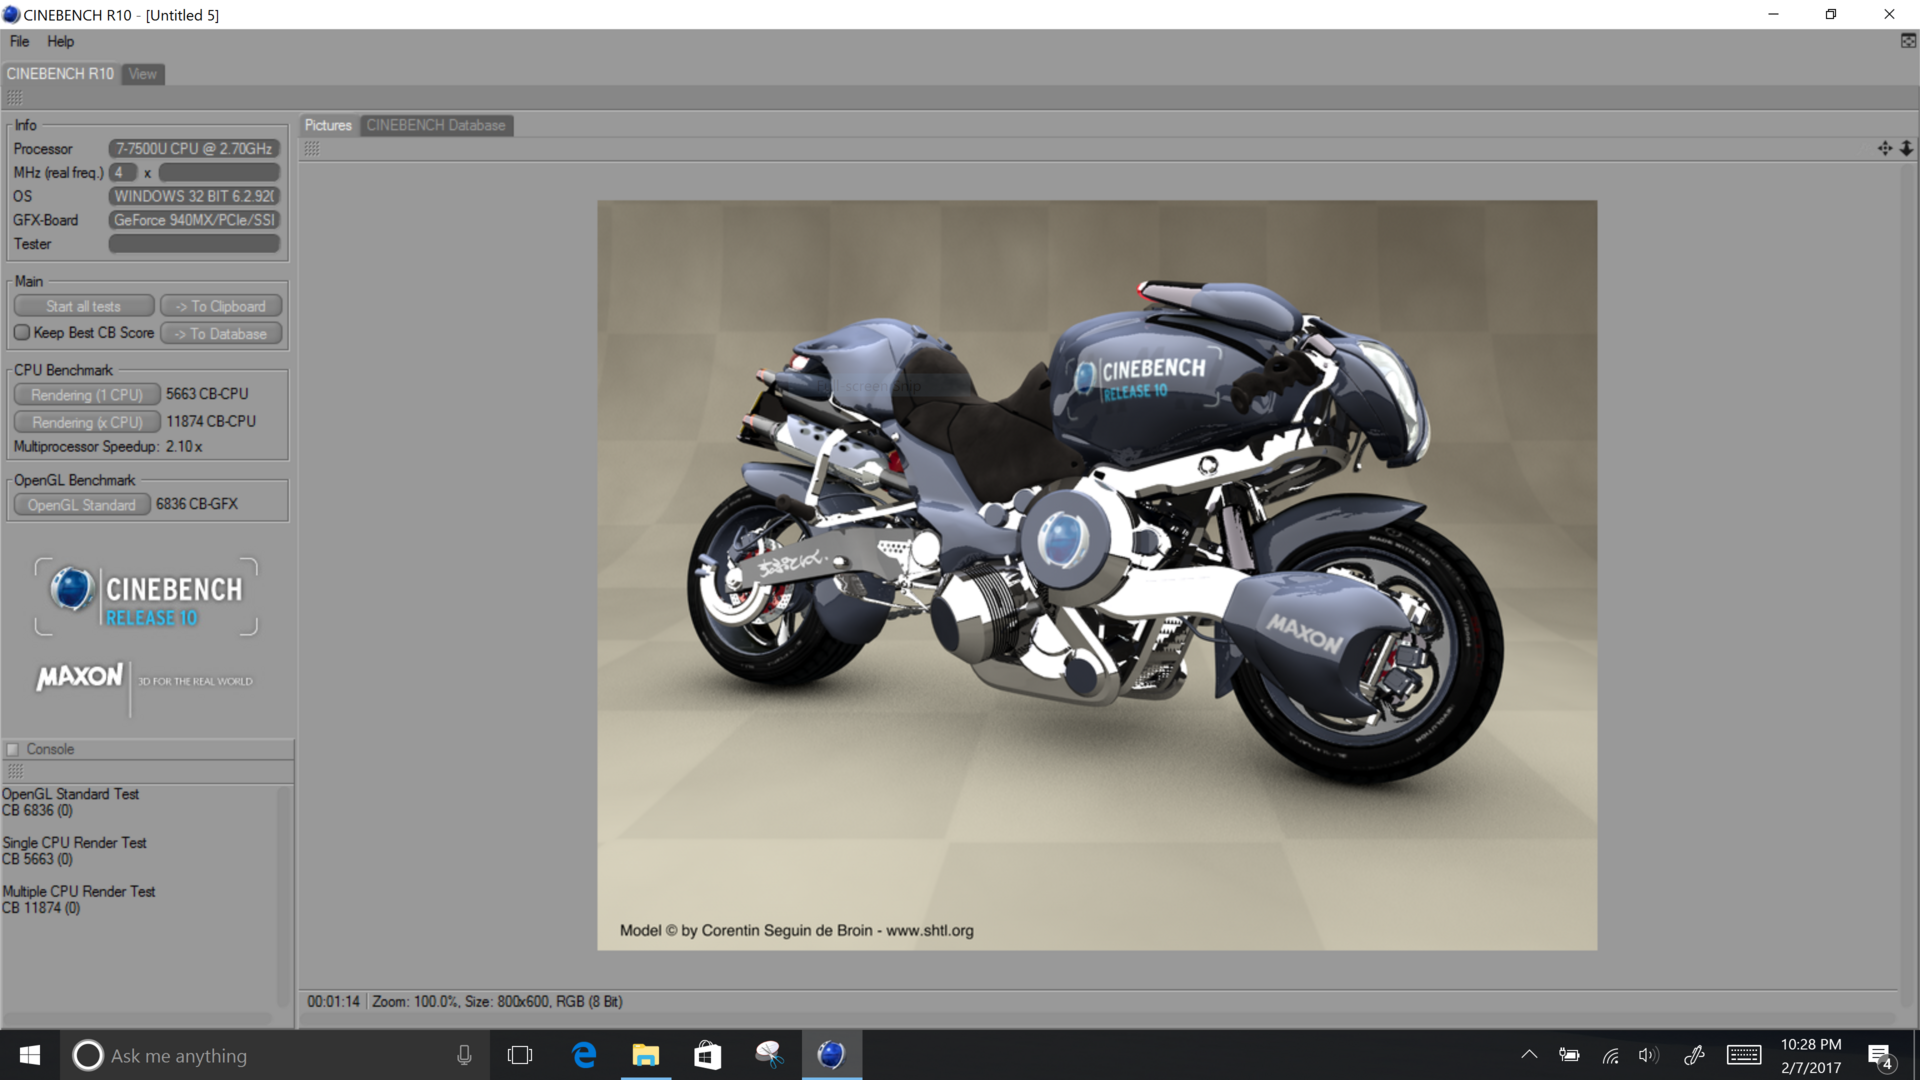
| Cinebench R10 | |
| Rendering Multiple CPUs 32Bit | |
| HP Spectre x360 15-bl002xx | |
| HP Spectre x360 15-ap012dx | |
| Rendering Single 32Bit | |
| HP Spectre x360 15-bl002xx | |
| HP Spectre x360 15-ap012dx | |
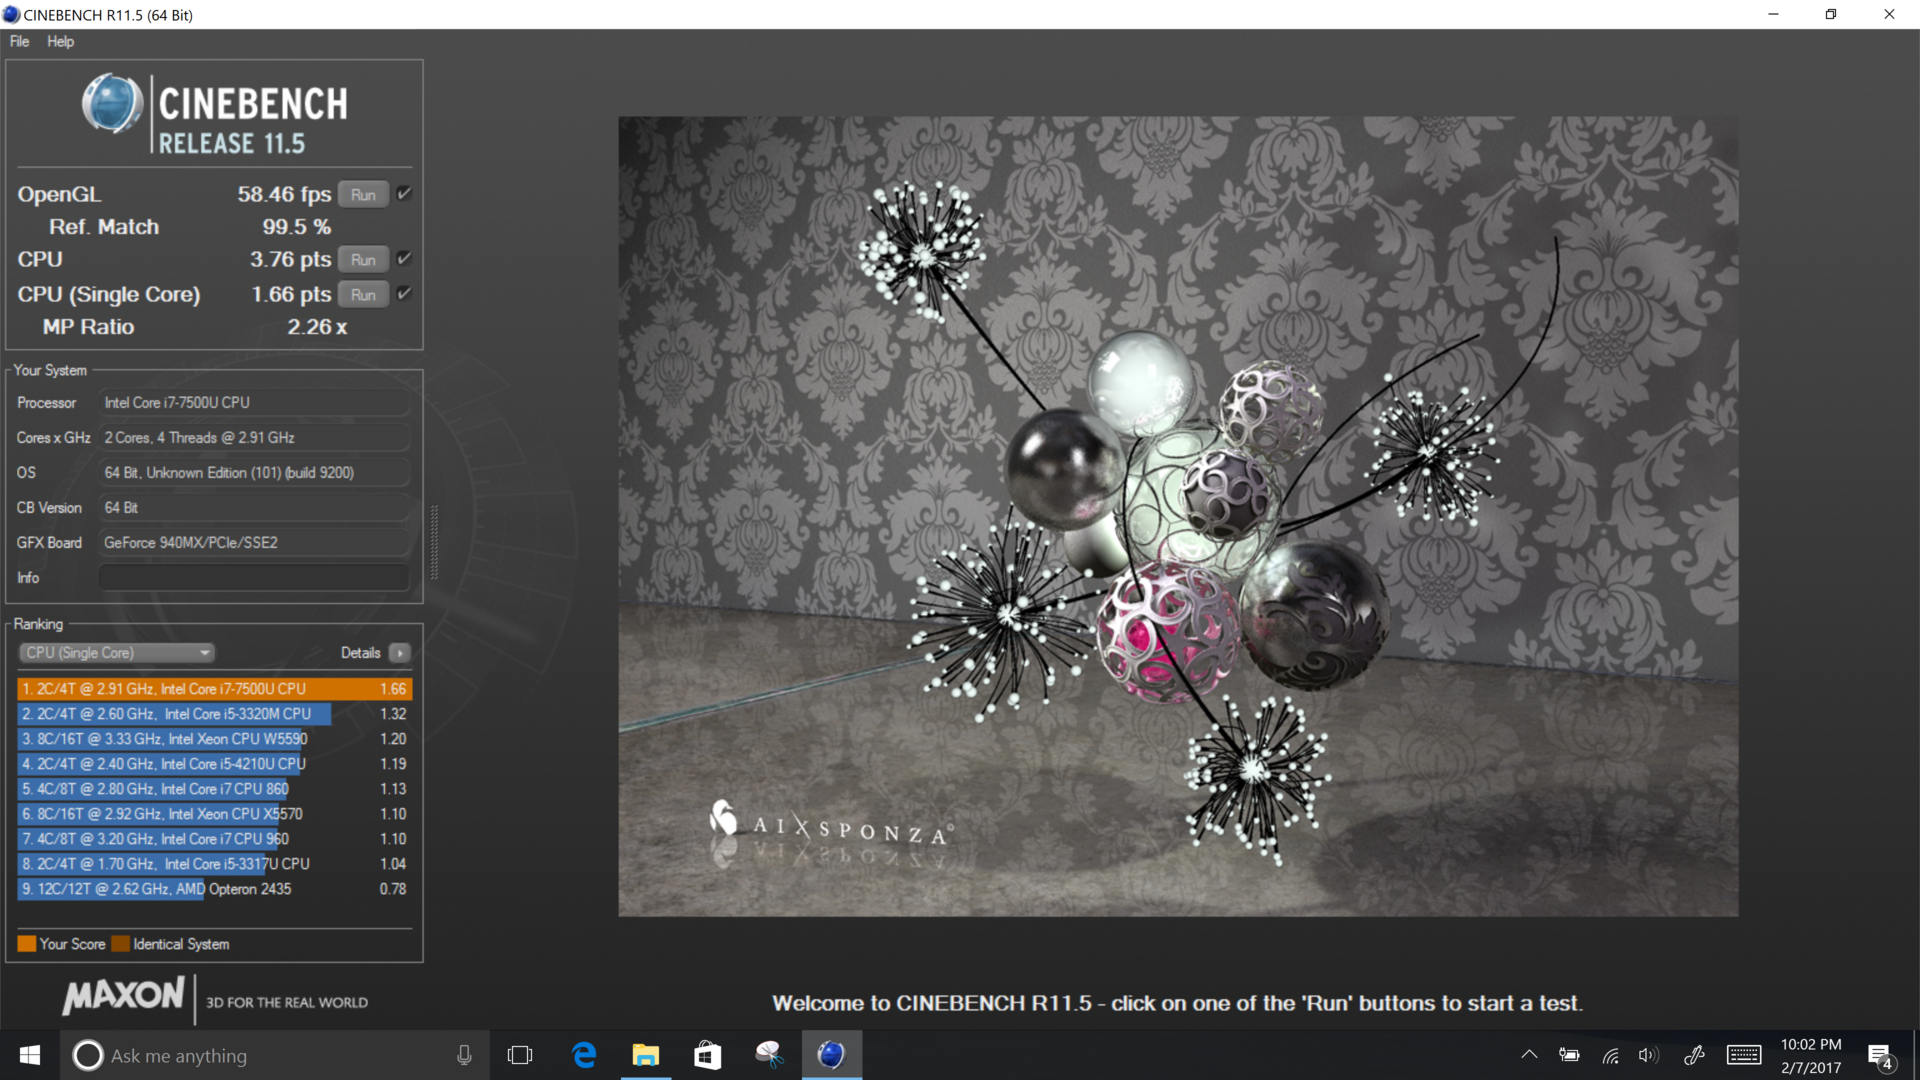
| Cinebench R11.5 | |
| CPU Single 64Bit | |
| HP Spectre x360 15-bl002xx | |
| Lenovo ThinkPad X1 Yoga-20FRS1VS00 | |
| HP Spectre x360 15-ap012dx | |
| CPU Multi 64Bit | |
| HP Spectre x360 15-bl002xx | |
| HP Spectre x360 15-ap012dx | |
| Lenovo ThinkPad X1 Yoga-20FRS1VS00 | |
| wPrime 2.10 - 1024m | |
| HP Spectre x360 15-ap012dx | |
| HP Spectre x360 15-bl002xx | |
* ... mindre är bättre
| PCMark 8 | |
| Home Score Accelerated v2 | |
| Dell XPS 15 2017 9560 (7300HQ, Full-HD) | |
| Dell Inspiron 15 5568 | |
| Lenovo Yoga 910-13IKB-80VF004CGE | |
| Lenovo ThinkPad X1 Yoga-20FRS1VS00 | |
| HP Spectre x360 15-bl002xx | |
| HP Spectre x360 15-ap012dx | |
| Work Score Accelerated v2 | |
| Dell XPS 15 2017 9560 (7300HQ, Full-HD) | |
| Dell Inspiron 15 5568 | |
| Lenovo ThinkPad X1 Yoga-20FRS1VS00 | |
| HP Spectre x360 15-bl002xx | |
| HP Spectre x360 15-ap012dx | |
| Creative Score Accelerated v2 | |
| HP Spectre x360 15-bl002xx | |
| HP Spectre x360 15-ap012dx | |
| PCMark 8 Home Score Accelerated v2 | 3249 poäng | |
| PCMark 8 Creative Score Accelerated v2 | 4542 poäng | |
| PCMark 8 Work Score Accelerated v2 | 4016 poäng | |
Hjälp | ||
| HP Spectre x360 15-bl002xx Toshiba XG4 NVMe (THNSN5512GPUK) | Lenovo Yoga 910-13IKB-80VF004CGE Samsung PM951 NVMe MZVLV512 | HP Spectre x360 15-ap012dx Sandisk X300 SD7SN6S-256G-1006 | Dell XPS 15 2017 9560 (7300HQ, Full-HD) WDC WD10SPCX-75KHST0 + SanDisk Z400s M.2 2242 32 GB Cache | Lenovo ThinkPad X1 Yoga-20FRS1VS00 Samsung SSD PM961 1TB M.2 PCIe 3.0 x4 NVMe (MZSLW1T0) | Dell Inspiron 15 5568 Toshiba THNSNK256GCS8 | |
|---|---|---|---|---|---|---|
| CrystalDiskMark 3.0 | -1% | -50% | -90% | -4% | -55% | |
| Read Seq (MB/s) | 1266 | 1412 12% | 475.6 -62% | 123 -90% | 1510 19% | 458.6 -64% |
| Write Seq (MB/s) | 982 | 578 -41% | 425 -57% | 74.2 -92% | 1193 21% | 270 -73% |
| Read 512 (MB/s) | 834 | 701 -16% | 258.4 -69% | 101.7 -88% | 397.4 -52% | |
| Write 512 (MB/s) | 714 | 580 -19% | 318.9 -55% | 42.51 -94% | 242 -66% | |
| Read 4k (MB/s) | 40.72 | 43.5 7% | 35.48 -13% | 10.84 -73% | 37 -9% | 19.88 -51% |
| Write 4k (MB/s) | 139.4 | 159.7 15% | 93 -33% | 1.021 -99% | 126 -10% | 86.7 -38% |
| Read 4k QD32 (MB/s) | 527 | 570 8% | 281.2 -47% | 69.8 -87% | 404 -23% | 275.3 -48% |
| Write 4k QD32 (MB/s) | 395.2 | 488.7 24% | 138.7 -65% | 1.057 -100% | 319 -19% | 197.6 -50% |

| 3DMark 11 | |
| 1280x720 Performance GPU | |
| Dell XPS 15 2017 9560 (7300HQ, Full-HD) | |
| HP Spectre x360 15-bl002xx | |
| Lenovo Yoga 910-13IKB-80VF004CGE | |
| Dell Inspiron 15 5568 | |
| Lenovo ThinkPad X1 Yoga-20FRS1VS00 | |
| HP Spectre x360 15-ap012dx | |
| Lenovo Yoga 710-14IKB 80V4002HGE | |
| 1280x720 Performance Combined | |
| Dell XPS 15 2017 9560 (7300HQ, Full-HD) | |
| HP Spectre x360 15-bl002xx | |
| Lenovo Yoga 910-13IKB-80VF004CGE | |
| Dell Inspiron 15 5568 | |
| Lenovo ThinkPad X1 Yoga-20FRS1VS00 | |
| HP Spectre x360 15-ap012dx | |
| Lenovo Yoga 710-14IKB 80V4002HGE | |
| 3DMark | |
| 1280x720 Cloud Gate Standard Graphics | |
| Dell XPS 15 2017 9560 (7300HQ, Full-HD) | |
| HP Spectre x360 15-bl002xx | |
| Lenovo Yoga 910-13IKB-80VF004CGE | |
| Dell Inspiron 15 5568 | |
| Lenovo ThinkPad X1 Yoga-20FRS1VS00 | |
| Lenovo Yoga 710-14IKB 80V4002HGE | |
| HP Spectre x360 15-ap012dx | |
| 1920x1080 Fire Strike Graphics | |
| Dell XPS 15 2017 9560 (7300HQ, Full-HD) | |
| HP Spectre x360 15-bl002xx | |
| Lenovo Yoga 910-13IKB-80VF004CGE | |
| Lenovo ThinkPad X1 Yoga-20FRS1VS00 | |
| HP Spectre x360 15-ap012dx | |
| Lenovo Yoga 710-14IKB 80V4002HGE | |
| 1920x1080 Ice Storm Extreme Graphics | |
| Lenovo Yoga 710-14IKB 80V4002HGE | |
| HP Spectre x360 15-bl002xx | |
| HP Spectre x360 15-ap012dx | |
| 3DMark 11 Performance | 2772 poäng | |
| 3DMark Ice Storm Standard Score | 22543 poäng | |
| 3DMark Cloud Gate Standard Score | 7908 poäng | |
| 3DMark Fire Strike Score | 1926 poäng | |
| 3DMark Fire Strike Extreme Score | 969 poäng | |
Hjälp | ||
| låg | med. | hög | ultra | |
|---|---|---|---|---|
| Anno 2070 (2011) | 190.1 | 83.2 | 50.5 | 27.1 |
| Sleeping Dogs (2012) | 122.4 | 93.6 | 45.5 | 11.9 |
| Hitman: Absolution (2012) | 77.2 | 56.6 | 27.5 | 10.8 |
| Tomb Raider (2013) | 184.4 | 92.7 | 52.1 | 26.5 |
| BioShock Infinite (2013) | 127.5 | 69.8 | 59 | 21.6 |
| Company of Heroes 2 (2013) | 28.4 | 24.2 | 14.6 | 8.7 |
| Middle-earth: Shadow of Mordor (2014) | 55.3 | 32.5 | 19.3 | 15.1 |
| Rise of the Tomb Raider (2016) | 38.5 | 18.4 | 15.3 | 13.8 |
Ljudnivå
| Låg belastning |
| 28.5 / 28.5 / 36.3 dB(A) |
| Hög belastning |
| 42.7 / 42.7 dB(A) |
 | ||
30 dB tyst 40 dB(A) hörbar 50 dB(A) högt ljud |
||
min: | ||
| HP Spectre x360 15-bl002xx GeForce 940MX, i7-7500U, Toshiba XG4 NVMe (THNSN5512GPUK) | Lenovo Yoga 910-13IKB-80VF004CGE HD Graphics 620, i7-7500U, Samsung PM951 NVMe MZVLV512 | HP Spectre x360 15-ap012dx HD Graphics 520, 6200U, Sandisk X300 SD7SN6S-256G-1006 | Dell XPS 15 2017 9560 (7300HQ, Full-HD) GeForce GTX 1050 Mobile, i5-7300HQ, WDC WD10SPCX-75KHST0 + SanDisk Z400s M.2 2242 32 GB Cache | Lenovo ThinkPad X1 Yoga-20FRS1VS00 HD Graphics 520, 6600U, Samsung SSD PM961 1TB M.2 PCIe 3.0 x4 NVMe (MZSLW1T0) | Dell Inspiron 15 5568 HD Graphics 520, 6500U, Toshiba THNSNK256GCS8 | Lenovo Yoga 710-14IKB 80V4002HGE HD Graphics 620, i5-7200U, Samsung MZYTY256HDHP | |
|---|---|---|---|---|---|---|---|
| Noise | 2% | 5% | -7% | 7% | -0% | 4% | |
| av / miljö * (dB) | 28.5 | 31.7 -11% | 29.5 -4% | 30.3 -6% | 28.9 -1% | 31.2 -9% | 30.16 -6% |
| Idle Minimum * (dB) | 28.5 | 31.7 -11% | 29.5 -4% | 31.6 -11% | 28.9 -1% | 32.8 -15% | 30.16 -6% |
| Idle Average * (dB) | 28.5 | 31.7 -11% | 29.5 -4% | 31.6 -11% | 28.9 -1% | 32.8 -15% | 30.16 -6% |
| Idle Maximum * (dB) | 36.3 | 31.7 13% | 29.6 18% | 33.4 8% | 28.9 20% | 33.8 7% | 30.5 16% |
| Load Average * (dB) | 42.7 | 38.4 10% | 38.1 11% | 47.8 -12% | 35.3 17% | 36.3 15% | 37.2 13% |
| Load Maximum * (dB) | 42.7 | 34.7 19% | 38.2 11% | 47.8 -12% | 38.9 9% | 36.3 15% | 37 13% |
* ... mindre är bättre
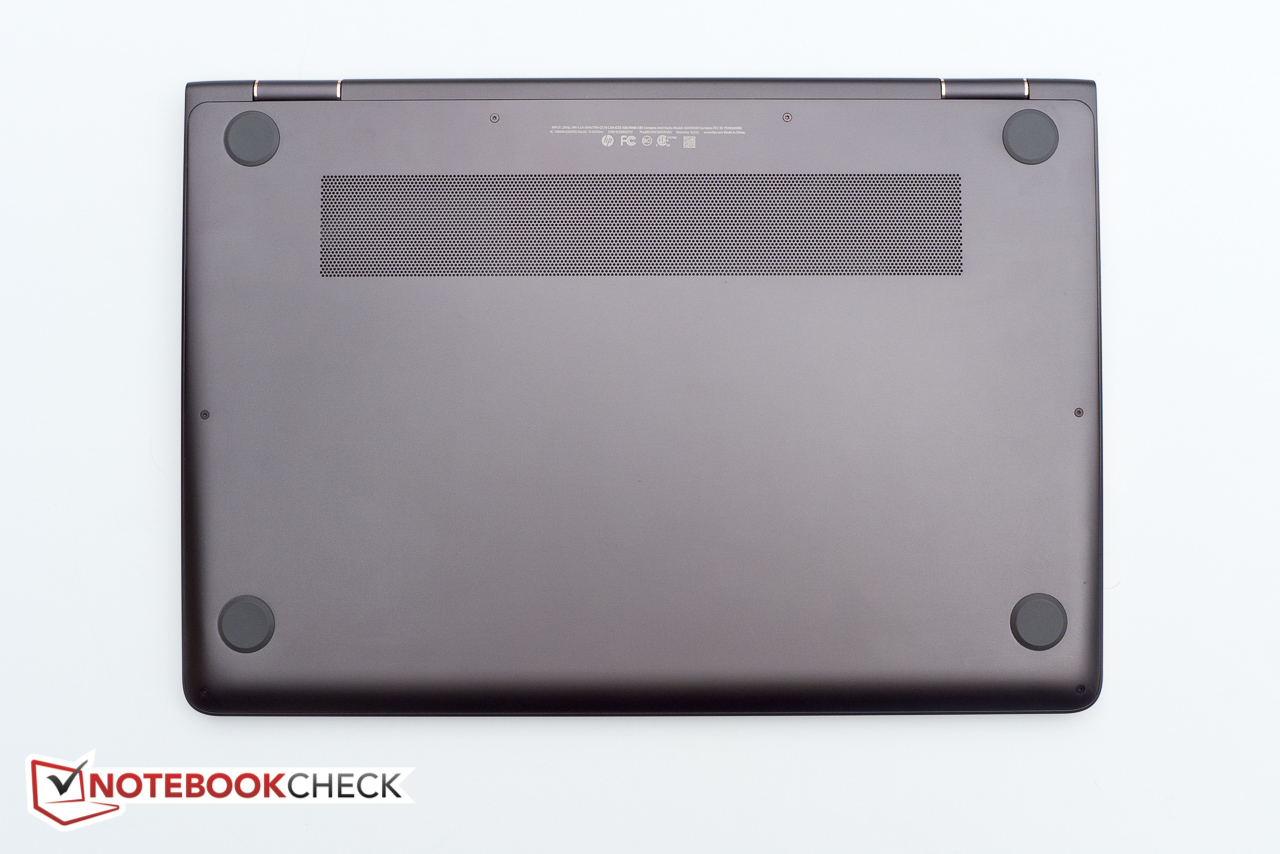
(-) Den maximala temperaturen på ovansidan är 47 °C / 117 F, jämfört med genomsnittet av 36.8 °C / 98 F , allt från 21 till 71 °C för klassen Multimedia.
(-) Botten värms upp till maximalt 50.2 °C / 122 F, jämfört med genomsnittet av 39.1 °C / 102 F
(+) Vid tomgångsbruk är medeltemperaturen för ovansidan 28.6 °C / 83 F, jämfört med enhetsgenomsnittet på 31.3 °C / ### class_avg_f### F.
(+) Handledsstöden och pekplattan når maximal hudtemperatur (33.4 °C / 92.1 F) och är därför inte varma.
(-) Medeltemperaturen för handledsstödsområdet på liknande enheter var 28.7 °C / 83.7 F (-4.7 °C / -8.4 F).
HP Spectre x360 15-bl002xx ljudanalys
(±) | högtalarljudstyrkan är genomsnittlig men bra (72.9 dB)
Bas 100 - 315 Hz
(±) | reducerad bas - i genomsnitt 14.8% lägre än medianen
(±) | linjäriteten för basen är genomsnittlig (14% delta till föregående frekvens)
Mellan 400 - 2000 Hz
(+) | balanserad mellan - endast 4.4% från medianen
(±) | linjäriteten för mids är genomsnittlig (10.1% delta till föregående frekvens)
Högsta 2 - 16 kHz
(+) | balanserade toppar - endast 1.2% från medianen
(+) | toppar är linjära (4.9% delta till föregående frekvens)
Totalt 100 - 16 000 Hz
(±) | linjäriteten för det totala ljudet är genomsnittlig (20.3% skillnad mot median)
Jämfört med samma klass
» 68% av alla testade enheter i den här klassen var bättre, 9% liknande, 24% sämre
» Den bästa hade ett delta på 5%, genomsnittet var 17%, sämst var 45%
Jämfört med alla testade enheter
» 53% av alla testade enheter var bättre, 8% liknande, 39% sämre
» Den bästa hade ett delta på 4%, genomsnittet var 23%, sämst var 134%
Apple MacBook 12 (Early 2016) 1.1 GHz ljudanalys
(+) | högtalare kan spela relativt högt (83.6 dB)
Bas 100 - 315 Hz
(±) | reducerad bas - i genomsnitt 11.3% lägre än medianen
(±) | linjäriteten för basen är genomsnittlig (14.2% delta till föregående frekvens)
Mellan 400 - 2000 Hz
(+) | balanserad mellan - endast 2.4% från medianen
(+) | mids är linjära (5.5% delta till föregående frekvens)
Högsta 2 - 16 kHz
(+) | balanserade toppar - endast 2% från medianen
(+) | toppar är linjära (4.5% delta till föregående frekvens)
Totalt 100 - 16 000 Hz
(+) | det totala ljudet är linjärt (10.2% skillnad mot median)
Jämfört med samma klass
» 7% av alla testade enheter i den här klassen var bättre, 2% liknande, 90% sämre
» Den bästa hade ett delta på 5%, genomsnittet var 18%, sämst var 53%
Jämfört med alla testade enheter
» 5% av alla testade enheter var bättre, 1% liknande, 94% sämre
» Den bästa hade ett delta på 4%, genomsnittet var 23%, sämst var 134%
| Av/Standby | |
| Låg belastning | |
| Hög belastning |
|
Förklaring:
min: | |
| HP Spectre x360 15-bl002xx i7-7500U, GeForce 940MX, Toshiba XG4 NVMe (THNSN5512GPUK), IPS, 3840x2160, 15.6" | Lenovo Yoga 910-13IKB-80VF004CGE i7-7500U, HD Graphics 620, Samsung PM951 NVMe MZVLV512, IPS, 3840x2160, 13.9" | HP Spectre x360 15-ap012dx 6200U, HD Graphics 520, Sandisk X300 SD7SN6S-256G-1006, IPS, 3840x2160, 15.6" | Dell XPS 15 2017 9560 (7300HQ, Full-HD) i5-7300HQ, GeForce GTX 1050 Mobile, WDC WD10SPCX-75KHST0 + SanDisk Z400s M.2 2242 32 GB Cache, LED IGZO IPS InfinityEdge, 1920x1080, 15.6" | Lenovo ThinkPad X1 Yoga-20FRS1VS00 6600U, HD Graphics 520, Samsung SSD PM961 1TB M.2 PCIe 3.0 x4 NVMe (MZSLW1T0), OLED, 2560x1440, 14" | Dell Inspiron 15 5568 6500U, HD Graphics 520, Toshiba THNSNK256GCS8, IPS, 1920x1080, 15.6" | |
|---|---|---|---|---|---|---|
| Power Consumption | 41% | 11% | -19% | 26% | 40% | |
| Idle Minimum * (Watt) | 8.14 | 4.3 47% | 6.5 20% | 6.6 19% | 4.7 42% | 4.34 47% |
| Idle Average * (Watt) | 10.91 | 6.3 42% | 13.3 -22% | 9 18% | 8.6 21% | 7.5 31% |
| Idle Maximum * (Watt) | 12.26 | 9 27% | 15.1 -23% | 10.7 13% | 12.2 -0% | 8.4 31% |
| Load Average * (Watt) | 45.67 | 32.7 28% | 30.8 33% | 77.5 -70% | 29.7 35% | 30.4 33% |
| Load Maximum * (Watt) | 74.94 | 28.8 62% | 38.5 49% | 130 -73% | 50.5 33% | 32.5 57% |
* ... mindre är bättre
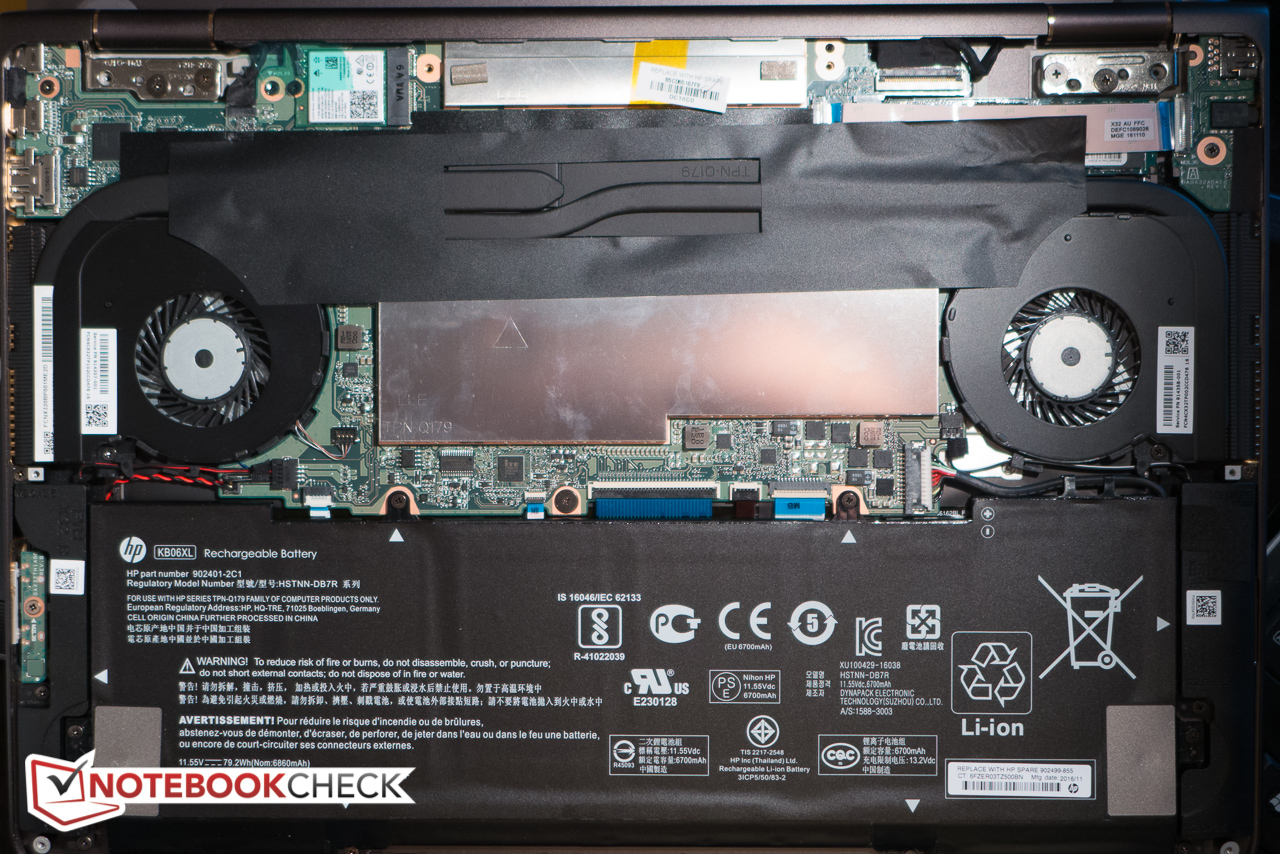
| HP Spectre x360 15-bl002xx i7-7500U, GeForce 940MX, 79.2 Wh | Lenovo Yoga 910-13IKB-80VF004CGE i7-7500U, HD Graphics 620, 78 Wh | HP Spectre x360 15-ap012dx 6200U, HD Graphics 520, 65 Wh | Dell XPS 15 2017 9560 (7300HQ, Full-HD) i5-7300HQ, GeForce GTX 1050 Mobile, 56 Wh | Lenovo ThinkPad X1 Yoga-20FRS1VS00 6600U, HD Graphics 520, 56 Wh | Dell Inspiron 15 5568 6500U, HD Graphics 520, 42 Wh | |
|---|---|---|---|---|---|---|
| Batteridrifttid | 20% | -20% | -39% | -19% | -43% | |
| Reader / Idle (h) | 14.4 | 17.8 24% | 11.8 -18% | 9.4 -35% | 13.7 -5% | 7.5 -48% |
| WiFi v1.3 (h) | 8.9 | 10.7 20% | 7.2 -19% | 5.6 -37% | 5.3 -40% | 5 -44% |
| Load (h) | 2.5 | 2.9 16% | 1.9 -24% | 1.4 -44% | 2.2 -12% | 1.6 -36% |
För
Emot
Läs originaltestet på engelska här.
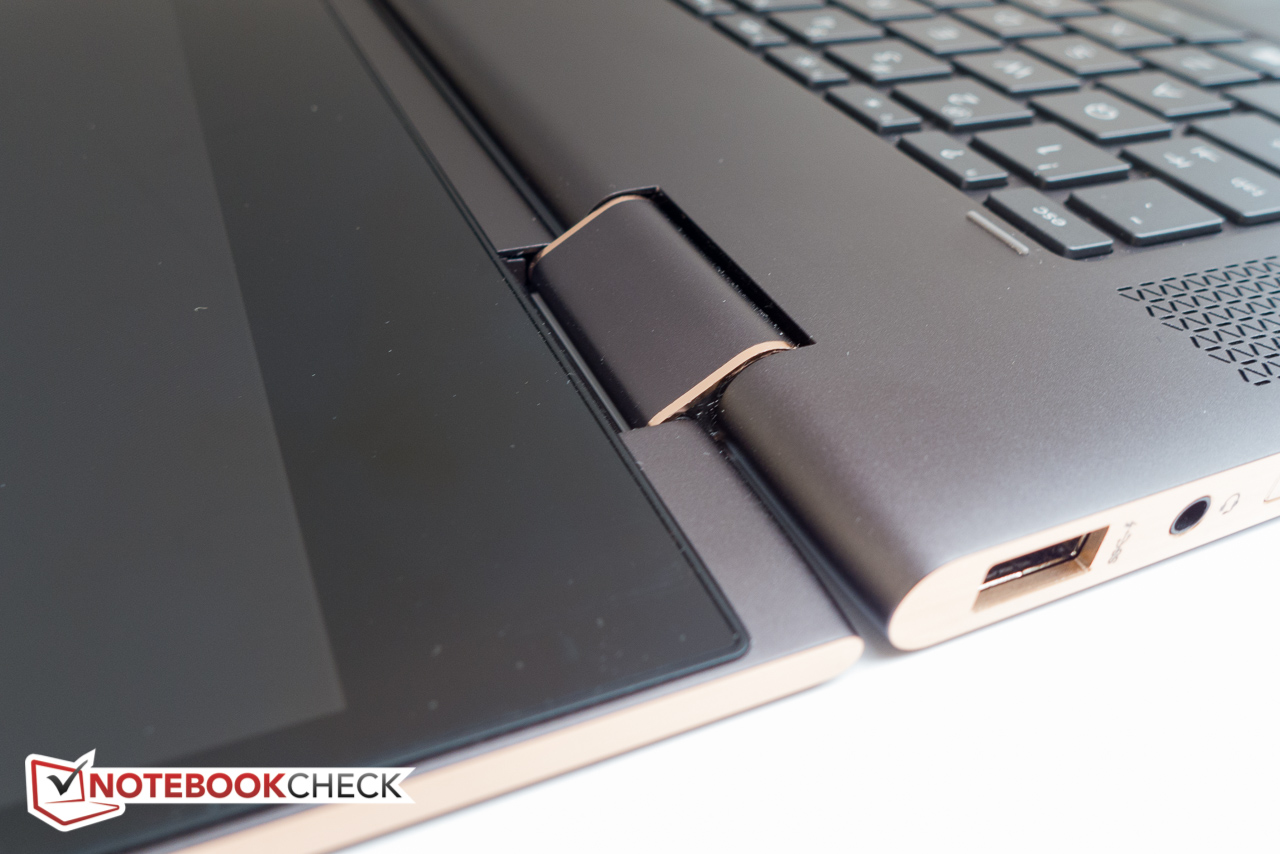
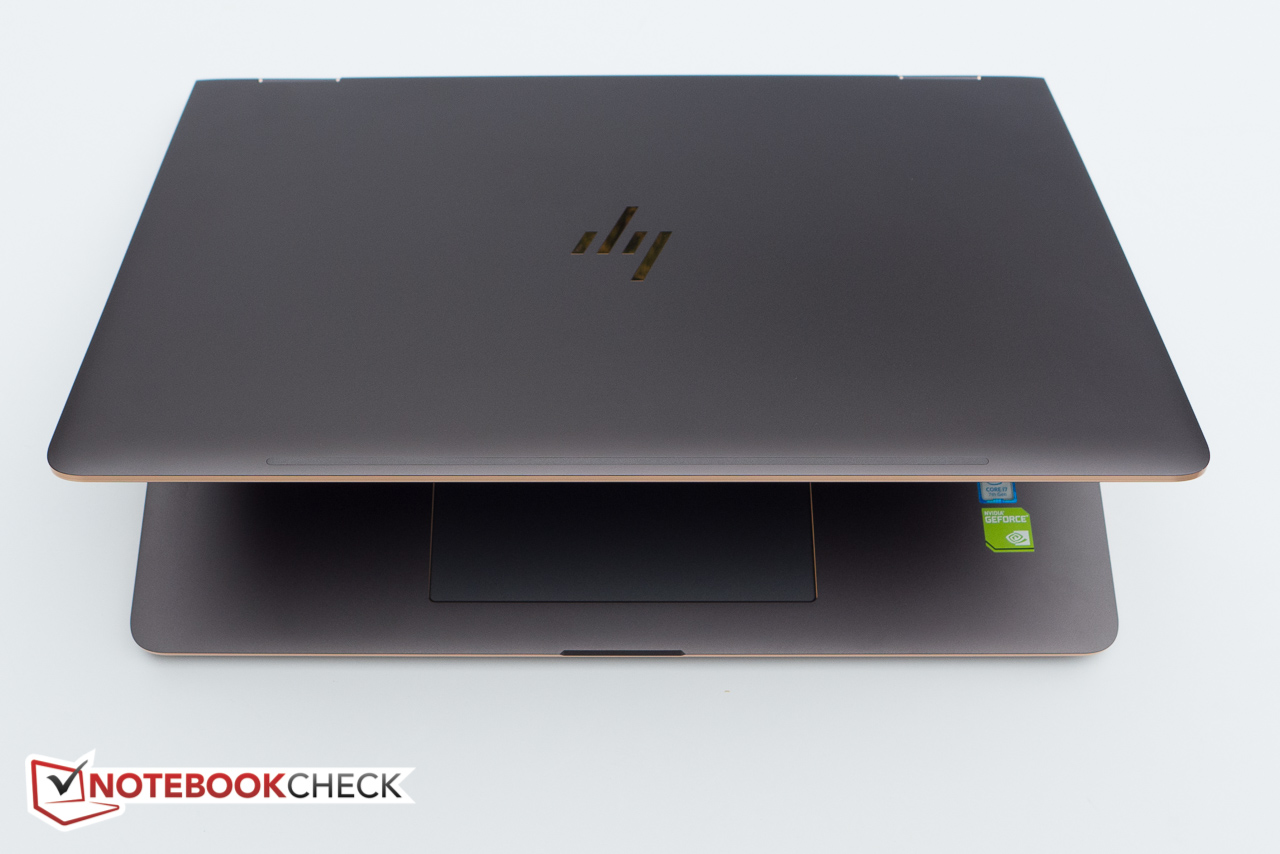
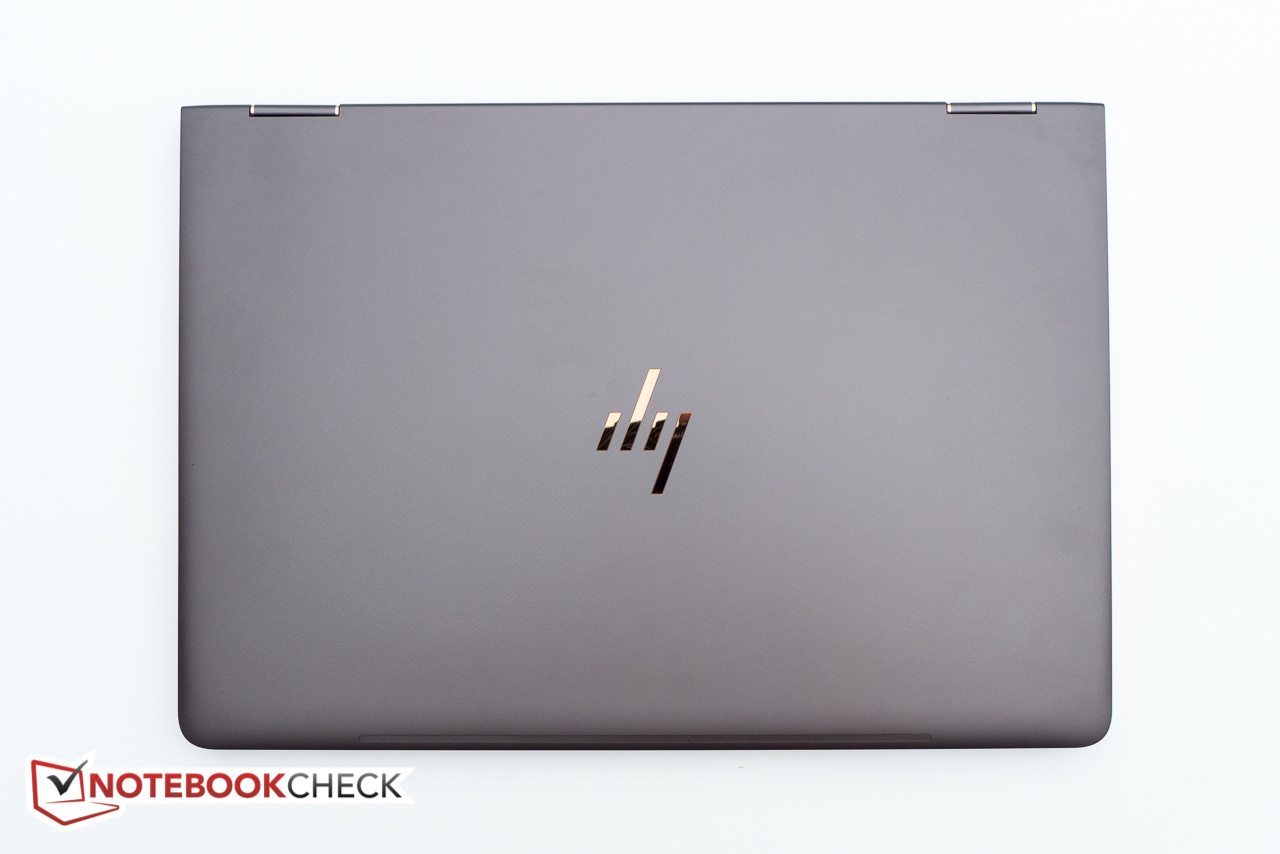
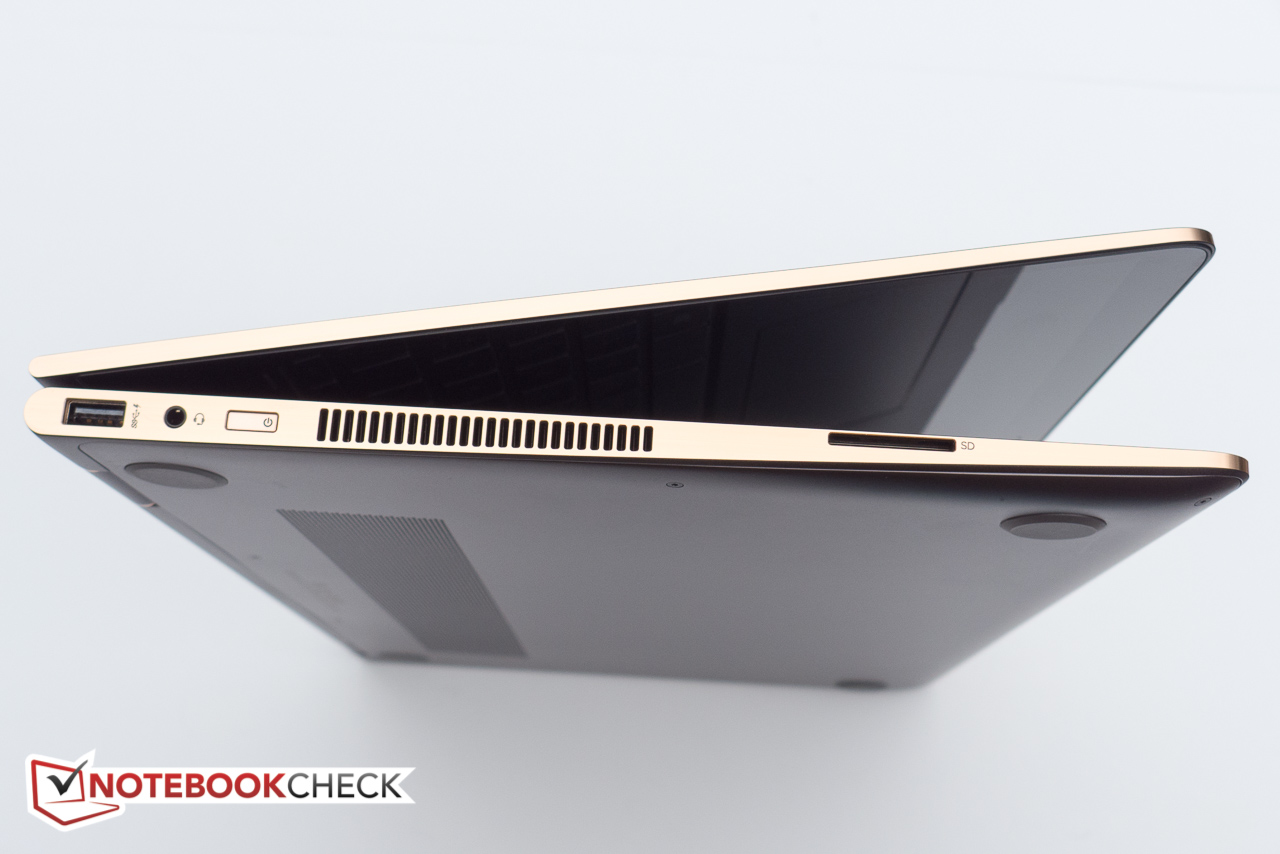
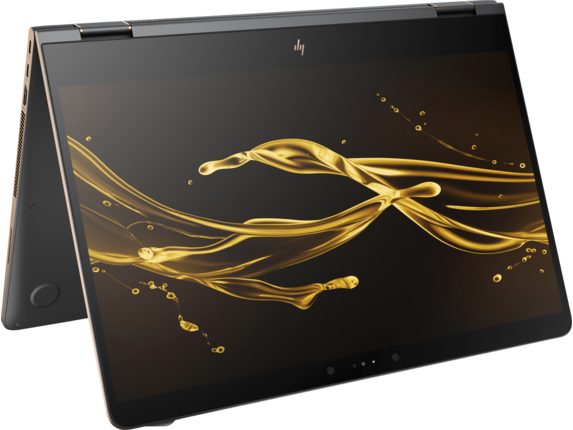
HP:s nya 15,6-tums Spectre X360 tar vid där den mindre 13,3-tummaren slutade. Aluminiumchassit är robust och känns lika bra som det ser ut, trots att det är något tjockare än tidigare. Den uppdaterade hårdvaran med Kaby Lake i7-processor och 512 GB M.2-SSD är kraftfull och hyfsat framtidssäker.
Batteriet har fått högre kapacitet, vilket resulterat i bättre batteritid jämfört med föregångaren. 4K-panelen – som nu är standard-RGB istället för PenTile – är ljusstark och levande. Inmatningsenheterna är anständiga och Active Pen gör anteckningar till en angenäm upplevelse. En av de största nyheterna är övergången till en dedikerad GPU, något som bör tilltala användare som är intresserade av enstaka spelsessioner.
Vi har förhållandevis få invändningar: det ”bondade” skärmlocket är tungt, så gångjärnen håller det inte så säkert på plats som vi skulle vilja. Det finns heller inga skyddande kanter av något slag som omger basenheten eller skärmen; datorn glider runt på släta ytor och aluminiumkanterna är benägna att dra till sig repor om 2-i-1-maskinen används i tältläge på ojämna ytor. 4K-skalningen är fortfarande inte perfekt i Windows, och uppskattar man inte det finns inga alternativ med lägre upplösning. Sist men inte minst är en 15,6-tums 2-i-1 stor och tung, även om den har ultratunna ramar, så datorns användbarhet som surfplatta kan vara något begränsad.
Men vi kan som sagt inte hitta många fel med HP Spectre X360 i 15-tumsutförandet. Den är ett av de bästa valen för den som överväger en stor 2-i-1.
HP Spectre x360 15-bl002xx
- 03/07/2017 v6 (old)
Bernhard Pechlaner
Price comparison
