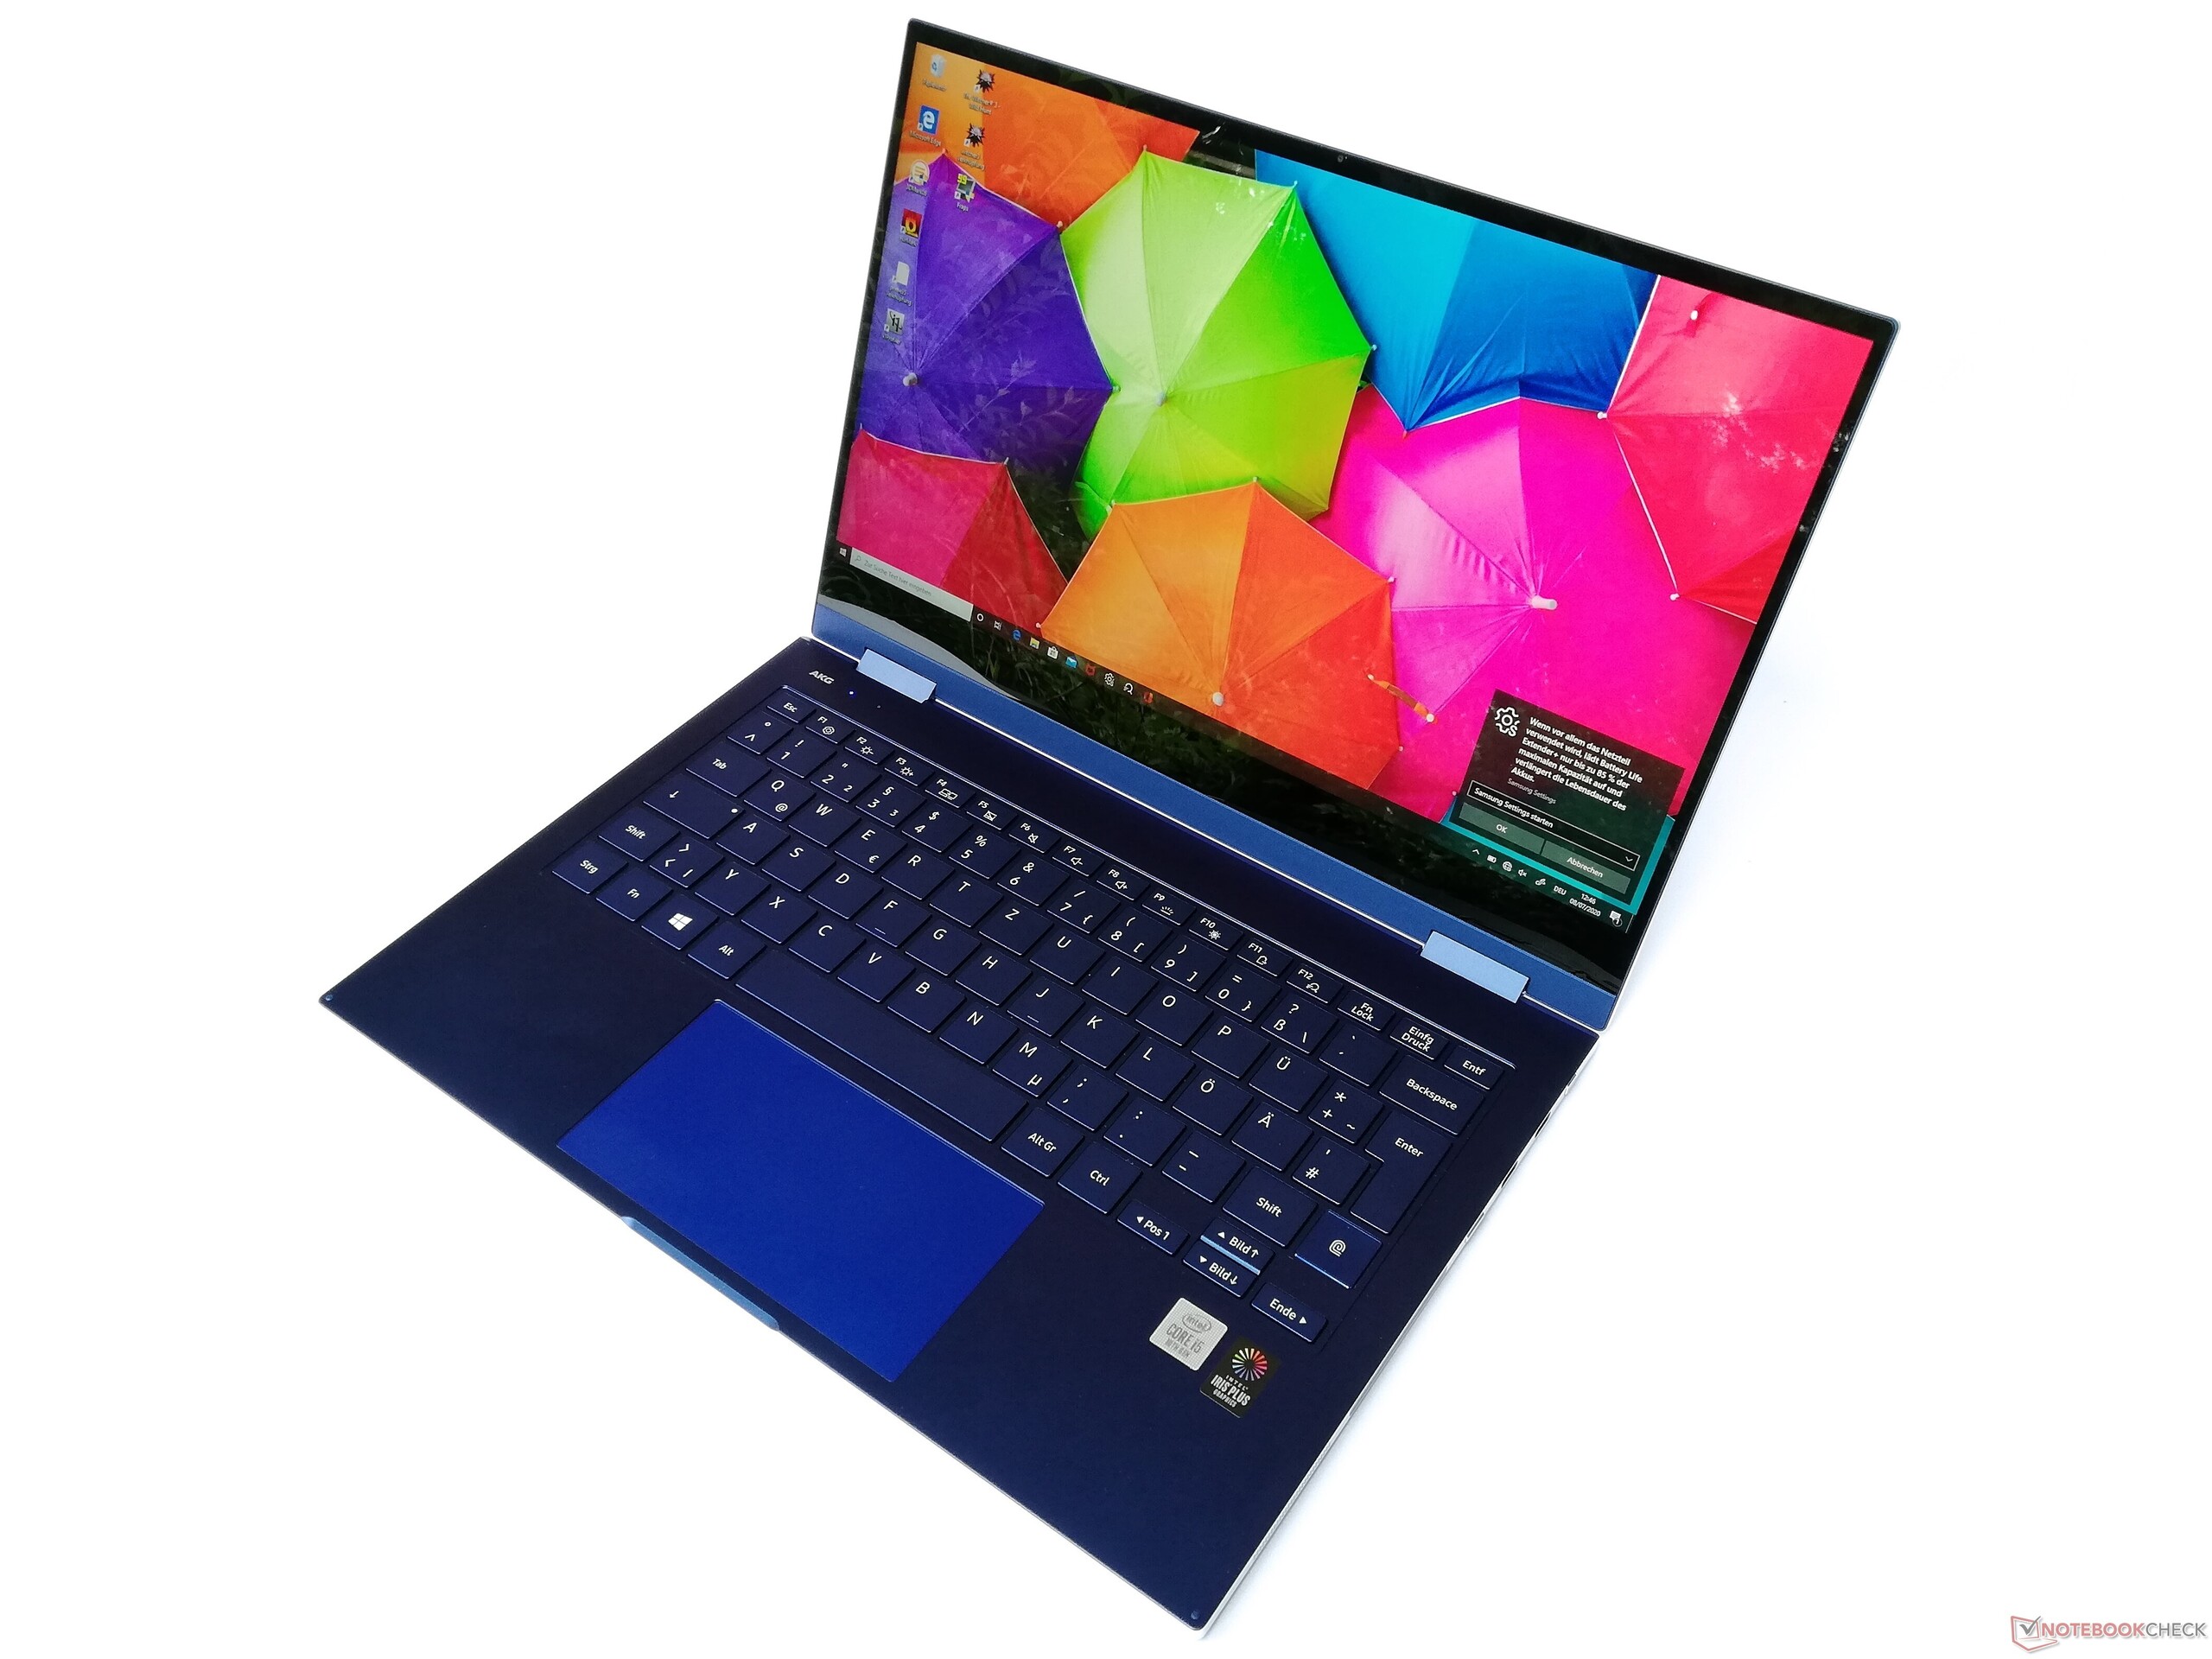
Test: Galaxy Book Flex 13.3 - Omvandlingsbar från Samsung med ljusstark skärm (Sammanfattning)
Gradering | Datum | Modell | Vikt | Höjd | Storlek | Upplösning | Pris |
|---|---|---|---|---|---|---|---|
| 84.4 % v7 (old) | 07/2020 | Samsung Galaxy Book Flex 13.3 i5-1035G4, Iris Plus Graphics G4 (Ice Lake 48 EU) | 1.2 kg | 13 mm | 13.30" | 1920x1080 | |
| 89.1 % v7 (old) | 10/2019 | Dell Latitude 7200 i5-8365U, UHD Graphics 620 | 1.2 kg | 9.35 mm | 12.30" | 1920x1280 | |
| 88.4 % v7 (old) | 11/2019 | Microsoft Surface Pro 7 Core i5-1035G4 i5-1035G4, Iris Plus Graphics G4 (Ice Lake 48 EU) | 1.1 kg | 8.5 mm | 12.30" | 2736x1824 | |
| 84.7 % v7 (old) | 07/2020 | Fujitsu Lifebook U939X i5-8265U, UHD Graphics 620 | 1 kg | 17 mm | 13.30" | 1920x1080 | |
| 88.2 % v7 (old) | 10/2019 | Lenovo Yoga C940-14IIL i7-1065G7, Iris Plus Graphics G7 (Ice Lake 64 EU) | 1.4 kg | 14.95 mm | 14.00" | 1920x1080 |
| SD Card Reader | |
| average JPG Copy Test (av. of 3 runs) | |
| Dell Latitude 7200 (Toshiba Exceria Pro M501 64 GB UHS-II) | |
| Fujitsu Lifebook U939X (Toshiba Exceria Pro SDXC 64 GB UHS-II) | |
| Samsung Galaxy Book Flex 13.3 (Toshiba Exceria Pro M501 microSDXC 64GB) | |
| Microsoft Surface Pro 7 Core i5-1035G4 (Toshiba Exceria Pro M501 64 GB UHS-II) | |
| Genomsnitt av klass Convertible (28.1 - 197, n=23, senaste 2 åren) | |
| maximum AS SSD Seq Read Test (1GB) | |
| Dell Latitude 7200 (Toshiba Exceria Pro M501 64 GB UHS-II) | |
| Fujitsu Lifebook U939X (Toshiba Exceria Pro SDXC 64 GB UHS-II) | |
| Genomsnitt av klass Convertible (28.9 - 254, n=22, senaste 2 åren) | |
| Samsung Galaxy Book Flex 13.3 (Toshiba Exceria Pro M501 microSDXC 64GB) | |
| Microsoft Surface Pro 7 Core i5-1035G4 (Toshiba Exceria Pro M501 64 GB UHS-II) | |


, i5-1035G4, Samsung SSD PM981a MZVLB256HBHQ")
, i5-1035G4, Samsung SSD PM981a MZVLB256HBHQ")
| |||||||||||||||||||||||||
Distribution av ljusstyrkan: 86 %
Mitt på batteriet: 569 cd/m²
Kontrast: 1213:1 (Svärta: 0.39 cd/m²)
ΔE ColorChecker Calman: 5.18 | ∀{0.5-29.43 Ø4.73}
ΔE Greyscale Calman: 7.04 | ∀{0.09-98 Ø4.97}
Gamma: 2.35
CCT: 6753 K
| Samsung Galaxy Book Flex 13.3 BOE087A, IPS, 1920x1080, 13.3" | Dell Latitude 7200 SHP14A3 LQ123N1, IPS LED, 1920x1280, 12.3" | Microsoft Surface Pro 7 Core i5-1035G4 LG Philips LP123WQ112604, IPS, 2736x1824, 12.3" | Fujitsu Lifebook U939X Sharp SHP14B0, IPS, 1920x1080, 13.3" | Lenovo Yoga C940-14IIL LP140WF9-SPE2, IPS LED, 1920x1080, 14" | |
|---|---|---|---|---|---|
| Display | |||||
| Display P3 Coverage (%) | 71.6 | 66 | 66.6 | 66 | |
| sRGB Coverage (%) | 99.5 | 93.8 | 96.9 | 97.9 | |
| AdobeRGB 1998 Coverage (%) | 72.6 | 66.9 | 67.9 | 67.3 | |
| Response Times | -24% | 12% | -23% | -12% | |
| Response Time Grey 50% / Grey 80% * (ms) | 44 ? | 52 ? -18% | 34.8 ? 21% | 54.4 ? -24% | 49.6 ? -13% |
| Response Time Black / White * (ms) | 27 ? | 34.8 ? -29% | 26.4 ? 2% | 32.8 ? -21% | 30 ? -11% |
| PWM Frequency (Hz) | 1645 ? | 21550 ? | |||
| Screen | 29% | 3% | 9% | 28% | |
| Brightness middle (cd/m²) | 473 | 401 -15% | 480.4 2% | 325 -31% | 384 -19% |
| Brightness (cd/m²) | 434 | 385 -11% | 485 12% | 310 -29% | 363 -16% |
| Brightness Distribution (%) | 86 | 88 2% | 91 6% | 89 3% | 90 5% |
| Black Level * (cd/m²) | 0.39 | 0.28 28% | 0.48 -23% | 0.29 26% | 0.17 56% |
| Contrast (:1) | 1213 | 1432 18% | 1001 -17% | 1121 -8% | 2259 86% |
| Colorchecker dE 2000 * | 5.18 | 1.8 65% | 5 3% | 3.2 38% | 3.5 32% |
| Colorchecker dE 2000 max. * | 10.01 | 3.4 66% | 7.72 23% | 6.2 38% | 5.5 45% |
| Greyscale dE 2000 * | 7.04 | 1.6 77% | 5.9 16% | 4.4 37% | 4.6 35% |
| Gamma | 2.35 94% | 2.14 103% | 2.38 92% | 2.21 100% | 2.32 95% |
| CCT | 6753 96% | 6702 97% | 7805 83% | 7430 87% | 6884 94% |
| Colorchecker dE 2000 calibrated * | 1.1 | 2.44 | 1.1 | 1 | |
| Color Space (Percent of AdobeRGB 1998) (%) | 66.6 | 60.3 | 62.9 | 62 | |
| Color Space (Percent of sRGB) (%) | 99.4 | 93.2 | 96.6 | 97.7 | |
| Totalt genomsnitt (program/inställningar) | 3% /
18% | 8% /
5% | -7% /
3% | 8% /
20% |
* ... mindre är bättre
Visa svarstider
| ↔ Svarstid svart till vitt | ||
|---|---|---|
| 27 ms ... stiga ↗ och falla ↘ kombinerat | ↗ 15 ms stiga | 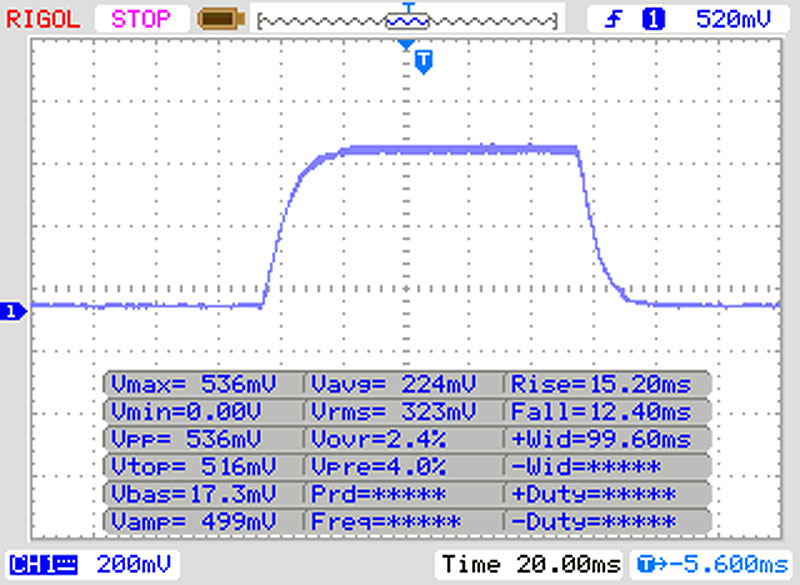 |
| ↘ 12 ms hösten | ||
| Skärmen visar relativt långsamma svarsfrekvenser i våra tester och kan vara för långsam för spelare. I jämförelse sträcker sig alla testade enheter från 0.1 (minst) till 240 (maximalt) ms. » 67 % av alla enheter är bättre. Detta innebär att den uppmätta svarstiden är sämre än genomsnittet av alla testade enheter (19.9 ms). | ||
| ↔ Svarstid 50 % grått till 80 % grått | ||
| 44 ms ... stiga ↗ och falla ↘ kombinerat | ↗ 19 ms stiga | 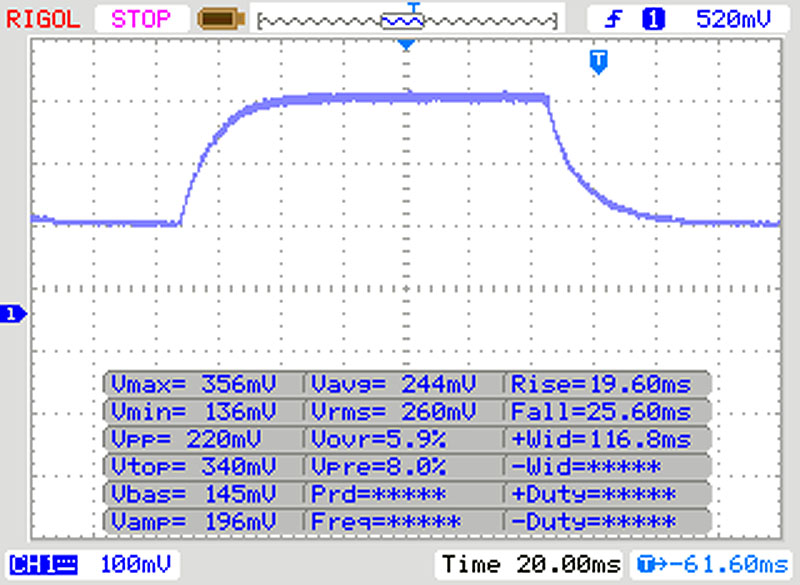 |
| ↘ 15 ms hösten | ||
| Skärmen visar långsamma svarsfrekvenser i våra tester och kommer att vara otillfredsställande för spelare. I jämförelse sträcker sig alla testade enheter från 0.165 (minst) till 636 (maximalt) ms. » 73 % av alla enheter är bättre. Detta innebär att den uppmätta svarstiden är sämre än genomsnittet av alla testade enheter (31.1 ms). | ||
Skärmflimmer / PWM (Puls-Width Modulation)
| Skärmflimmer / PWM upptäcktes inte | 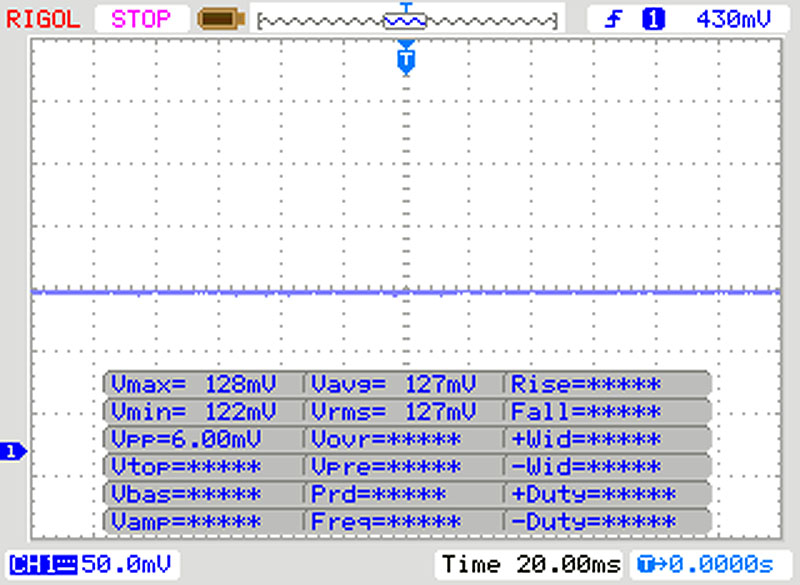 | ||
Som jämförelse: 52 % av alla testade enheter använder inte PWM för att dämpa skärmen. Om PWM upptäcktes mättes ett medelvärde av 7798 (minst: 5 - maximum: 343500) Hz. | |||
Cinebench R15: CPU Single 64Bit | CPU Multi 64Bit
Blender: v2.79 BMW27 CPU
7-Zip 18.03: 7z b 4 -mmt1 | 7z b 4
Geekbench 5.5: Single-Core | Multi-Core
HWBOT x265 Benchmark v2.2: 4k Preset
LibreOffice : 20 Documents To PDF
R Benchmark 2.5: Overall mean
| Cinebench R20 / CPU (Single Core) | |
| Genomsnitt av klass Convertible (273 - 834, n=49, senaste 2 åren) | |
| Microsoft Surface Pro 7 Core i5-1035G4 | |
| Dell Latitude 7200 | |
| Samsung Galaxy Book Flex 13.3 | |
| Genomsnitt Intel Core i5-1035G4 (357 - 441, n=6) | |
| Fujitsu Lifebook U939X | |
| Cinebench R20 / CPU (Multi Core) | |
| Genomsnitt av klass Convertible (595 - 12102, n=49, senaste 2 åren) | |
| Dell Latitude 7200 | |
| Microsoft Surface Pro 7 Core i5-1035G4 | |
| Genomsnitt Intel Core i5-1035G4 (892 - 1648, n=6) | |
| Samsung Galaxy Book Flex 13.3 | |
| Fujitsu Lifebook U939X | |
| Cinebench R15 / CPU Single 64Bit | |
| Genomsnitt av klass Convertible (149.8 - 317, n=48, senaste 2 åren) | |
| Lenovo Yoga C940-14IIL | |
| Microsoft Surface Pro 7 Core i5-1035G4 | |
| Samsung Galaxy Book Flex 13.3 | |
| Genomsnitt Intel Core i5-1035G4 (146.4 - 172, n=5) | |
| Dell Latitude 7200 | |
| Fujitsu Lifebook U939X | |
| Cinebench R15 / CPU Multi 64Bit | |
| Genomsnitt av klass Convertible (478 - 4940, n=48, senaste 2 åren) | |
| Lenovo Yoga C940-14IIL | |
| Lenovo Yoga C940-14IIL | |
| Microsoft Surface Pro 7 Core i5-1035G4 | |
| Dell Latitude 7200 | |
| Genomsnitt Intel Core i5-1035G4 (490 - 676, n=6) | |
| Samsung Galaxy Book Flex 13.3 | |
| Fujitsu Lifebook U939X | |
| Blender / v2.79 BMW27 CPU | |
| Samsung Galaxy Book Flex 13.3 | |
| Genomsnitt Intel Core i5-1035G4 (703 - 1075, n=6) | |
| Fujitsu Lifebook U939X | |
| Microsoft Surface Pro 7 Core i5-1035G4 | |
| Dell Latitude 7200 | |
| Lenovo Yoga C940-14IIL | |
| Genomsnitt av klass Convertible (105 - 1051, n=48, senaste 2 åren) | |
| 7-Zip 18.03 / 7z b 4 -mmt1 | |
| Genomsnitt av klass Convertible (3672 - 6655, n=48, senaste 2 åren) | |
| Lenovo Yoga C940-14IIL | |
| Samsung Galaxy Book Flex 13.3 | |
| Fujitsu Lifebook U939X | |
| Dell Latitude 7200 | |
| Genomsnitt Intel Core i5-1035G4 (1307 - 4190, n=6) | |
| Microsoft Surface Pro 7 Core i5-1035G4 | |
| 7-Zip 18.03 / 7z b 4 | |
| Genomsnitt av klass Convertible (12977 - 121368, n=48, senaste 2 åren) | |
| Lenovo Yoga C940-14IIL | |
| Dell Latitude 7200 | |
| Fujitsu Lifebook U939X | |
| Genomsnitt Intel Core i5-1035G4 (11030 - 19548, n=6) | |
| Samsung Galaxy Book Flex 13.3 | |
| Microsoft Surface Pro 7 Core i5-1035G4 | |
| Geekbench 5.5 / Single-Core | |
| Genomsnitt av klass Convertible (806 - 2275, n=48, senaste 2 åren) | |
| Samsung Galaxy Book Flex 13.3 | |
| Genomsnitt Intel Core i5-1035G4 (1081 - 1277, n=5) | |
| Fujitsu Lifebook U939X | |
| Geekbench 5.5 / Multi-Core | |
| Genomsnitt av klass Convertible (1608 - 22023, n=48, senaste 2 åren) | |
| Samsung Galaxy Book Flex 13.3 | |
| Genomsnitt Intel Core i5-1035G4 (3261 - 4315, n=5) | |
| Fujitsu Lifebook U939X | |
| HWBOT x265 Benchmark v2.2 / 4k Preset | |
| Genomsnitt av klass Convertible (3.43 - 36.2, n=48, senaste 2 åren) | |
| Lenovo Yoga C940-14IIL | |
| Microsoft Surface Pro 7 Core i5-1035G4 | |
| Dell Latitude 7200 | |
| Genomsnitt Intel Core i5-1035G4 (3.37 - 5.61, n=6) | |
| Fujitsu Lifebook U939X | |
| Samsung Galaxy Book Flex 13.3 | |
| LibreOffice / 20 Documents To PDF | |
| Genomsnitt Intel Core i5-1035G4 (58.4 - 78.3, n=5) | |
| Samsung Galaxy Book Flex 13.3 | |
| Fujitsu Lifebook U939X | |
| Genomsnitt av klass Convertible (42.5 - 84.3, n=48, senaste 2 åren) | |
| R Benchmark 2.5 / Overall mean | |
| Genomsnitt Intel Core i5-1035G4 (0.701 - 0.825, n=5) | |
| Samsung Galaxy Book Flex 13.3 | |
| Fujitsu Lifebook U939X | |
| Genomsnitt av klass Convertible (0.3915 - 0.84, n=48, senaste 2 åren) | |
* ... mindre är bättre
| DPC Latencies / LatencyMon - interrupt to process latency (max), Web, Youtube, Prime95 | |
| Samsung Galaxy Book Flex 13.3 | |
| Fujitsu Lifebook U939X | |
* ... mindre är bättre
| Samsung Galaxy Book Flex 13.3 Samsung SSD PM981a MZVLB256HBHQ | Dell Latitude 7200 WDC PC SN520 SDAPNUW-512G | Microsoft Surface Pro 7 Core i5-1035G4 Toshiba BG4 KBG40ZPZ256G | Fujitsu Lifebook U939X Samsung SSD PM981 MZVLB512HAJQ | Lenovo Yoga C940-14IIL Samsung SSD PM981 MZVLB512HAJQ | Genomsnitt Samsung SSD PM981a MZVLB256HBHQ | |
|---|---|---|---|---|---|---|
| CrystalDiskMark 5.2 / 6 | -31% | -25% | -14% | -6% | -10% | |
| Write 4K (MB/s) | 157.9 | 131.9 -16% | 118.5 -25% | 158.5 0% | 128.4 -19% | 135.2 ? -14% |
| Read 4K (MB/s) | 48.37 | 45.47 -6% | 54.1 12% | 47.62 -2% | 46.37 -4% | 44.6 ? -8% |
| Write Seq (MB/s) | 2196 | 1021 -54% | 1166 -47% | 1573 -28% | 1863 -15% | 2091 ? -5% |
| Read Seq (MB/s) | 2064 | 1085 -47% | 1676 -19% | 1411 -32% | 2340 13% | 2097 ? 2% |
| Write 4K Q32T1 (MB/s) | 457 | 444.9 -3% | 330.5 -28% | 366.1 -20% | 451.1 -1% | 370 ? -19% |
| Read 4K Q32T1 (MB/s) | 514 | 366.6 -29% | 393.1 -24% | 451.9 -12% | 415.3 -19% | 372 ? -28% |
| Write Seq Q32T1 (MB/s) | 2354 | 1458 -38% | 1569 -33% | 1985 -16% | 2985 27% | 2308 ? -2% |
| Read Seq Q32T1 (MB/s) | 3557 | 1640 -54% | 2390 -33% | 3451 -3% | 2565 -28% | 3395 ? -5% |
| Write 4K Q8T8 (MB/s) | 437.2 | 451.4 | 208 ? | |||
| Read 4K Q8T8 (MB/s) | 988 | 1004 | 383 ? | |||
| AS SSD | 3% | -254% | 31% | 20% | -12% | |
| Seq Read (MB/s) | 2637 | 1294 -51% | 1590 -40% | 2723 3% | 2525 -4% | 2276 ? -14% |
| Seq Write (MB/s) | 2000 | 856 -57% | 714 -64% | 1864 -7% | 1253 -37% | 1486 ? -26% |
| 4K Read (MB/s) | 52.7 | 42.52 -19% | 50.7 -4% | 53.9 2% | 59.1 12% | 49.6 ? -6% |
| 4K Write (MB/s) | 148.4 | 141 -5% | 109.4 -26% | 143.8 -3% | 134.1 -10% | 129.5 ? -13% |
| 4K-64 Read (MB/s) | 647 | 983 52% | 924 43% | 1301 101% | 1010 56% | 683 ? 6% |
| 4K-64 Write (MB/s) | 865 | 1183 37% | 294.6 -66% | 1342 55% | 1461 69% | 895 ? 3% |
| Access Time Read * (ms) | 0.072 | 0.057 21% | 0.066 8% | 0.051 29% | 0.052 28% | 0.06433 ? 11% |
| Access Time Write * (ms) | 0.026 | 0.026 -0% | 0.697 -2581% | 0.027 -4% | 0.029 -12% | 0.04793 ? -84% |
| Score Read (Points) | 963 | 1155 20% | 1133 18% | 1627 69% | 1322 37% | 960 ? 0% |
| Score Write (Points) | 1214 | 1410 16% | 475 -61% | 1672 38% | 1721 42% | 1173 ? -3% |
| Score Total (Points) | 2653 | 3142 18% | 2157 -19% | 4097 54% | 3670 38% | 2598 ? -2% |
| Totalt genomsnitt (program/inställningar) | -14% /
-11% | -140% /
-157% | 9% /
12% | 7% /
9% | -11% /
-11% |
* ... mindre är bättre

Kontinuerlig inläsning: DiskSpd Read Loop, Queue Depth 8
| 3DMark 11 Performance | 3513 poäng | |
| 3DMark Fire Strike Score | 1922 poäng | |
| 3DMark Time Spy Score | 741 poäng | |
Hjälp | ||
| Far Cry 5 - 1280x720 Low Preset AA:T | |
| Genomsnitt av klass Convertible (15 - 142, n=20, senaste 2 åren) | |
| Genomsnitt Intel Iris Plus Graphics G4 (Ice Lake 48 EU) (18 - 20, n=2) | |
| Samsung Galaxy Book Flex 13.3 | |
| låg | med. | hög | ultra | |
|---|---|---|---|---|
| The Witcher 3 (2015) | 37.2 | 21.2 | 12.4 | |
| Dota 2 Reborn (2015) | 56 | 33.2 | 20.5 | 19.6 |
| X-Plane 11.11 (2018) | 26.5 | 14.4 | 13.2 | |
| Far Cry 5 (2018) | 18 |
Ljudnivå
| Låg belastning |
| 30.7 / 30.7 / 30.7 dB(A) |
| Hög belastning |
| 34.8 / 34.5 dB(A) |
 | ||
30 dB tyst 40 dB(A) hörbar 50 dB(A) högt ljud |
||
min: | ||
(±) Den maximala temperaturen på ovansidan är 41.6 °C / 107 F, jämfört med genomsnittet av 35.4 °C / 96 F , allt från 19.6 till 60 °C för klassen Convertible.
(±) Botten värms upp till maximalt 40.6 °C / 105 F, jämfört med genomsnittet av 36.9 °C / 98 F
(+) Vid tomgångsbruk är medeltemperaturen för ovansidan 26.7 °C / 80 F, jämfört med enhetsgenomsnittet på 30.3 °C / ### class_avg_f### F.
(±) När du spelar The Witcher 3 är medeltemperaturen för ovansidan 34 °C / 93 F, jämfört med enhetsgenomsnittet på 30.3 °C / ## #class_avg_f### F.
(+) Handledsstöden och pekplattan når maximal hudtemperatur (32.4 °C / 90.3 F) och är därför inte varma.
(-) Medeltemperaturen för handledsstödsområdet på liknande enheter var 28 °C / 82.4 F (-4.4 °C / -7.9 F).
Samsung Galaxy Book Flex 13.3 ljudanalys
(-) | inte särskilt höga högtalare (71.6 dB)
Bas 100 - 315 Hz
(-) | nästan ingen bas - i genomsnitt 22% lägre än medianen
(±) | linjäriteten för basen är genomsnittlig (11.9% delta till föregående frekvens)
Mellan 400 - 2000 Hz
(+) | balanserad mellan - endast 2.4% från medianen
(+) | mids är linjära (5.8% delta till föregående frekvens)
Högsta 2 - 16 kHz
(+) | balanserade toppar - endast 4.5% från medianen
(±) | linjäriteten för toppar är genomsnittlig (7.1% delta till föregående frekvens)
Totalt 100 - 16 000 Hz
(±) | linjäriteten för det totala ljudet är genomsnittlig (22.6% skillnad mot median)
Jämfört med samma klass
» 68% av alla testade enheter i den här klassen var bättre, 5% liknande, 27% sämre
» Den bästa hade ett delta på 6%, genomsnittet var 20%, sämst var 57%
Jämfört med alla testade enheter
» 67% av alla testade enheter var bättre, 6% liknande, 28% sämre
» Den bästa hade ett delta på 4%, genomsnittet var 24%, sämst var 134%
Apple MacBook 12 (Early 2016) 1.1 GHz ljudanalys
(+) | högtalare kan spela relativt högt (83.6 dB)
Bas 100 - 315 Hz
(±) | reducerad bas - i genomsnitt 11.3% lägre än medianen
(±) | linjäriteten för basen är genomsnittlig (14.2% delta till föregående frekvens)
Mellan 400 - 2000 Hz
(+) | balanserad mellan - endast 2.4% från medianen
(+) | mids är linjära (5.5% delta till föregående frekvens)
Högsta 2 - 16 kHz
(+) | balanserade toppar - endast 2% från medianen
(+) | toppar är linjära (4.5% delta till föregående frekvens)
Totalt 100 - 16 000 Hz
(+) | det totala ljudet är linjärt (10.2% skillnad mot median)
Jämfört med samma klass
» 7% av alla testade enheter i den här klassen var bättre, 2% liknande, 91% sämre
» Den bästa hade ett delta på 5%, genomsnittet var 18%, sämst var 53%
Jämfört med alla testade enheter
» 5% av alla testade enheter var bättre, 1% liknande, 94% sämre
» Den bästa hade ett delta på 4%, genomsnittet var 24%, sämst var 134%
| Av/Standby | |
| Låg belastning | |
| Hög belastning |
|
Förklaring:
min: | |
| Samsung Galaxy Book Flex 13.3 i5-1035G4, Iris Plus Graphics G4 (Ice Lake 48 EU), Samsung SSD PM981a MZVLB256HBHQ, IPS, 1920x1080, 13.3" | Dell Latitude 7200 i5-8365U, UHD Graphics 620, WDC PC SN520 SDAPNUW-512G, IPS LED, 1920x1280, 12.3" | Microsoft Surface Pro 7 Core i5-1035G4 i5-1035G4, Iris Plus Graphics G4 (Ice Lake 48 EU), Toshiba BG4 KBG40ZPZ256G, IPS, 2736x1824, 12.3" | Fujitsu Lifebook U939X i5-8265U, UHD Graphics 620, Samsung SSD PM981 MZVLB512HAJQ, IPS, 1920x1080, 13.3" | Lenovo Yoga C940-14IIL i7-1065G7, Iris Plus Graphics G7 (Ice Lake 64 EU), Samsung SSD PM981 MZVLB512HAJQ, IPS LED, 1920x1080, 14" | Genomsnitt Intel Iris Plus Graphics G4 (Ice Lake 48 EU) | Genomsnitt av klass Convertible | |
|---|---|---|---|---|---|---|---|
| Power Consumption | 4% | -27% | 0% | -16% | 6% | -23% | |
| Idle Minimum * (Watt) | 3.3 | 3.3 -0% | 4.5 -36% | 3.4 -3% | 3.2 3% | 3.26 ? 1% | 4.29 ? -30% |
| Idle Average * (Watt) | 8.9 | 5.8 35% | 9.2 -3% | 5.9 34% | 7 21% | 7.28 ? 18% | 7.08 ? 20% |
| Idle Maximum * (Watt) | 10.4 | 6.5 37% | 9.6 8% | 9.2 12% | 8.9 14% | 8.66 ? 17% | 8.68 ? 17% |
| Load Average * (Watt) | 40 | 37 7% | 42 -5% | 34.1 15% | 47.6 -19% | 34.4 ? 14% | 44 ? -10% |
| Witcher 3 ultra * (Watt) | 28 | ||||||
| Load Maximum * (Watt) | 32 | 51.3 -60% | 63.5 -98% | 50.5 -58% | 63.1 -97% | 38.9 ? -22% | 67.3 ? -110% |
* ... mindre är bättre
| Samsung Galaxy Book Flex 13.3 i5-1035G4, Iris Plus Graphics G4 (Ice Lake 48 EU), 69.7 Wh | Dell Latitude 7200 i5-8365U, UHD Graphics 620, 38 Wh | Microsoft Surface Pro 7 Core i5-1035G4 i5-1035G4, Iris Plus Graphics G4 (Ice Lake 48 EU), 45 Wh | Fujitsu Lifebook U939X i5-8265U, UHD Graphics 620, 50 Wh | Lenovo Yoga C940-14IIL i7-1065G7, Iris Plus Graphics G7 (Ice Lake 64 EU), 60 Wh | Genomsnitt av klass Convertible | |
|---|---|---|---|---|---|---|
| Batteridrifttid | -17% | 35% | 46% | -6% | 57% | |
| Reader / Idle (h) | 11.6 | 22.3 92% | 27.7 ? 139% | |||
| WiFi v1.3 (h) | 7.2 | 7 -3% | 10 39% | 10.5 46% | 10.6 47% | 11.9 ? 65% |
| Load (h) | 2.6 | 1.8 -31% | 1.9 -27% | 1.1 -58% | 1.779 ? -32% |
För
Emot
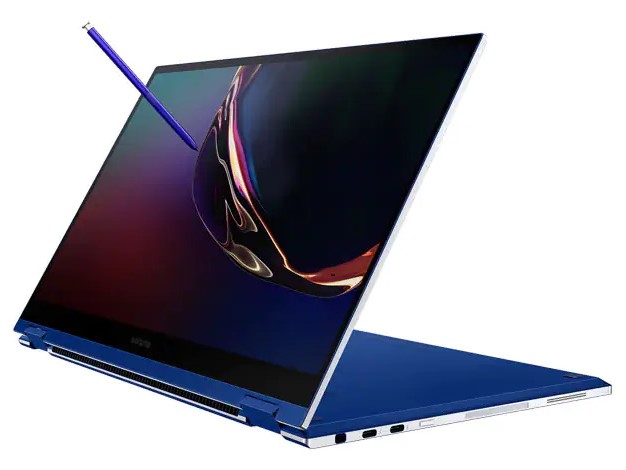
Omdöme - Samsung Galaxy Book Flex 13.3 är en gedigen omvandlingsbar
Läs den fullständiga versionen av den här recensionen på engelska här.
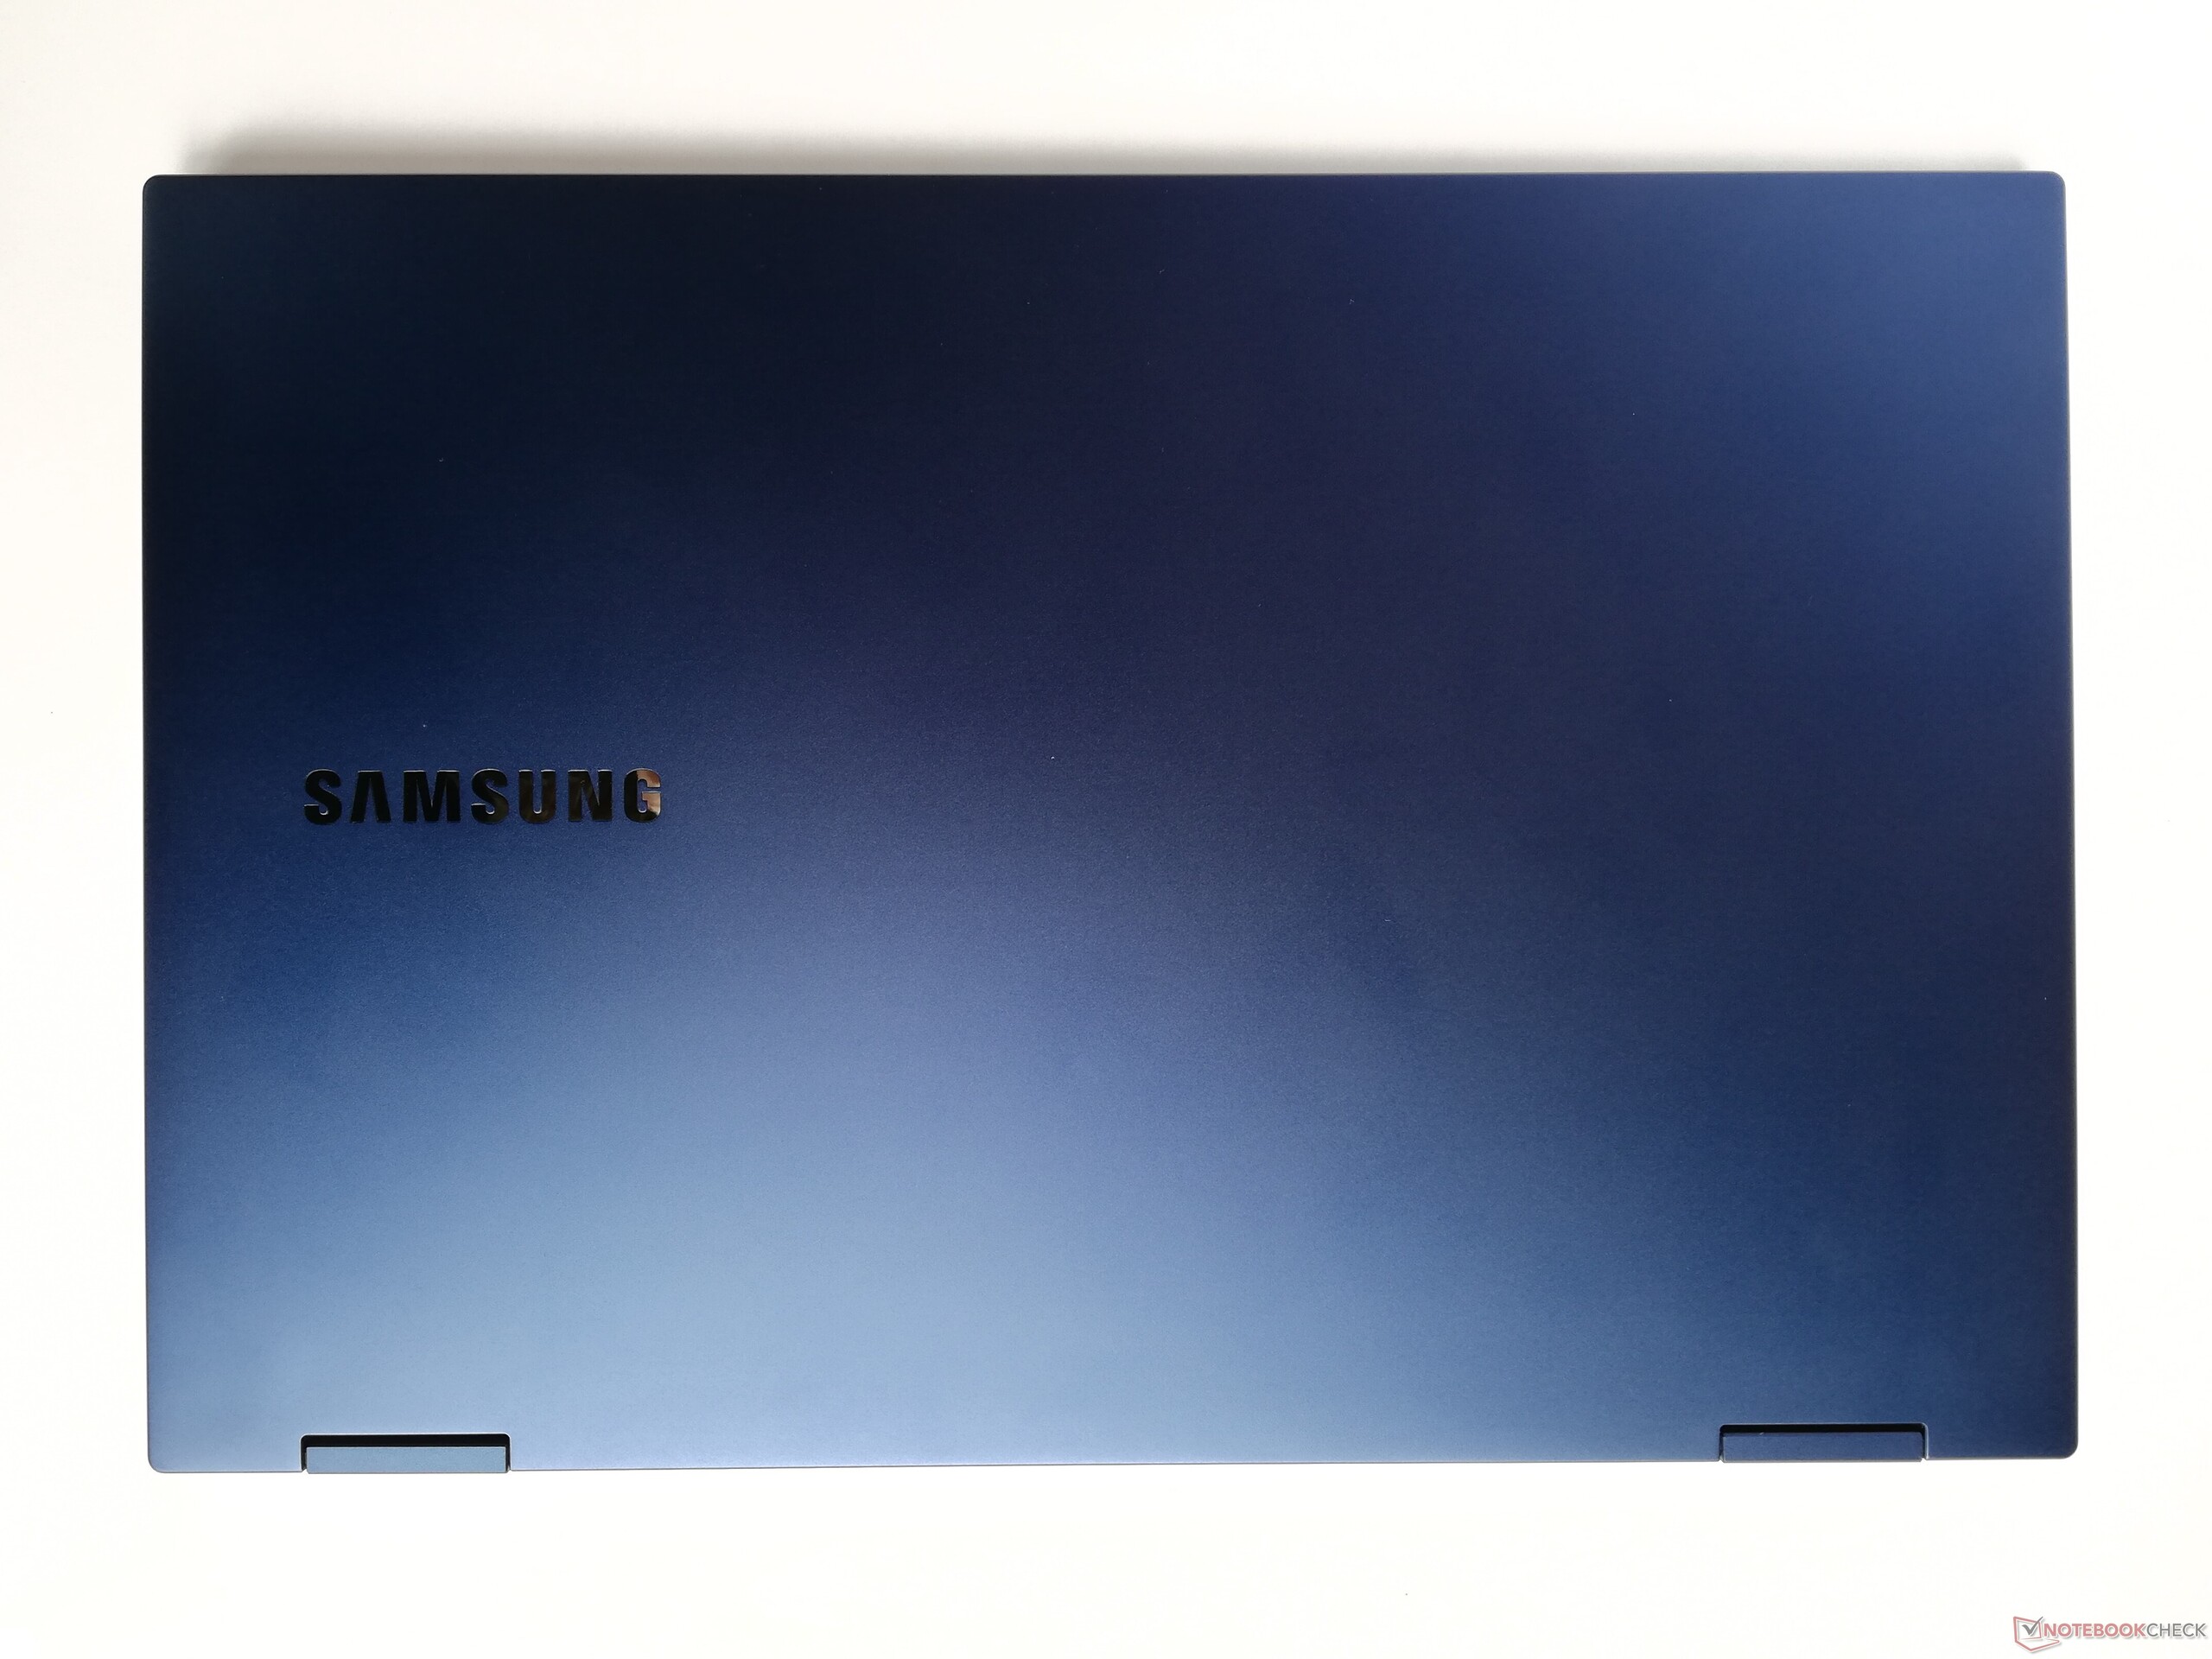
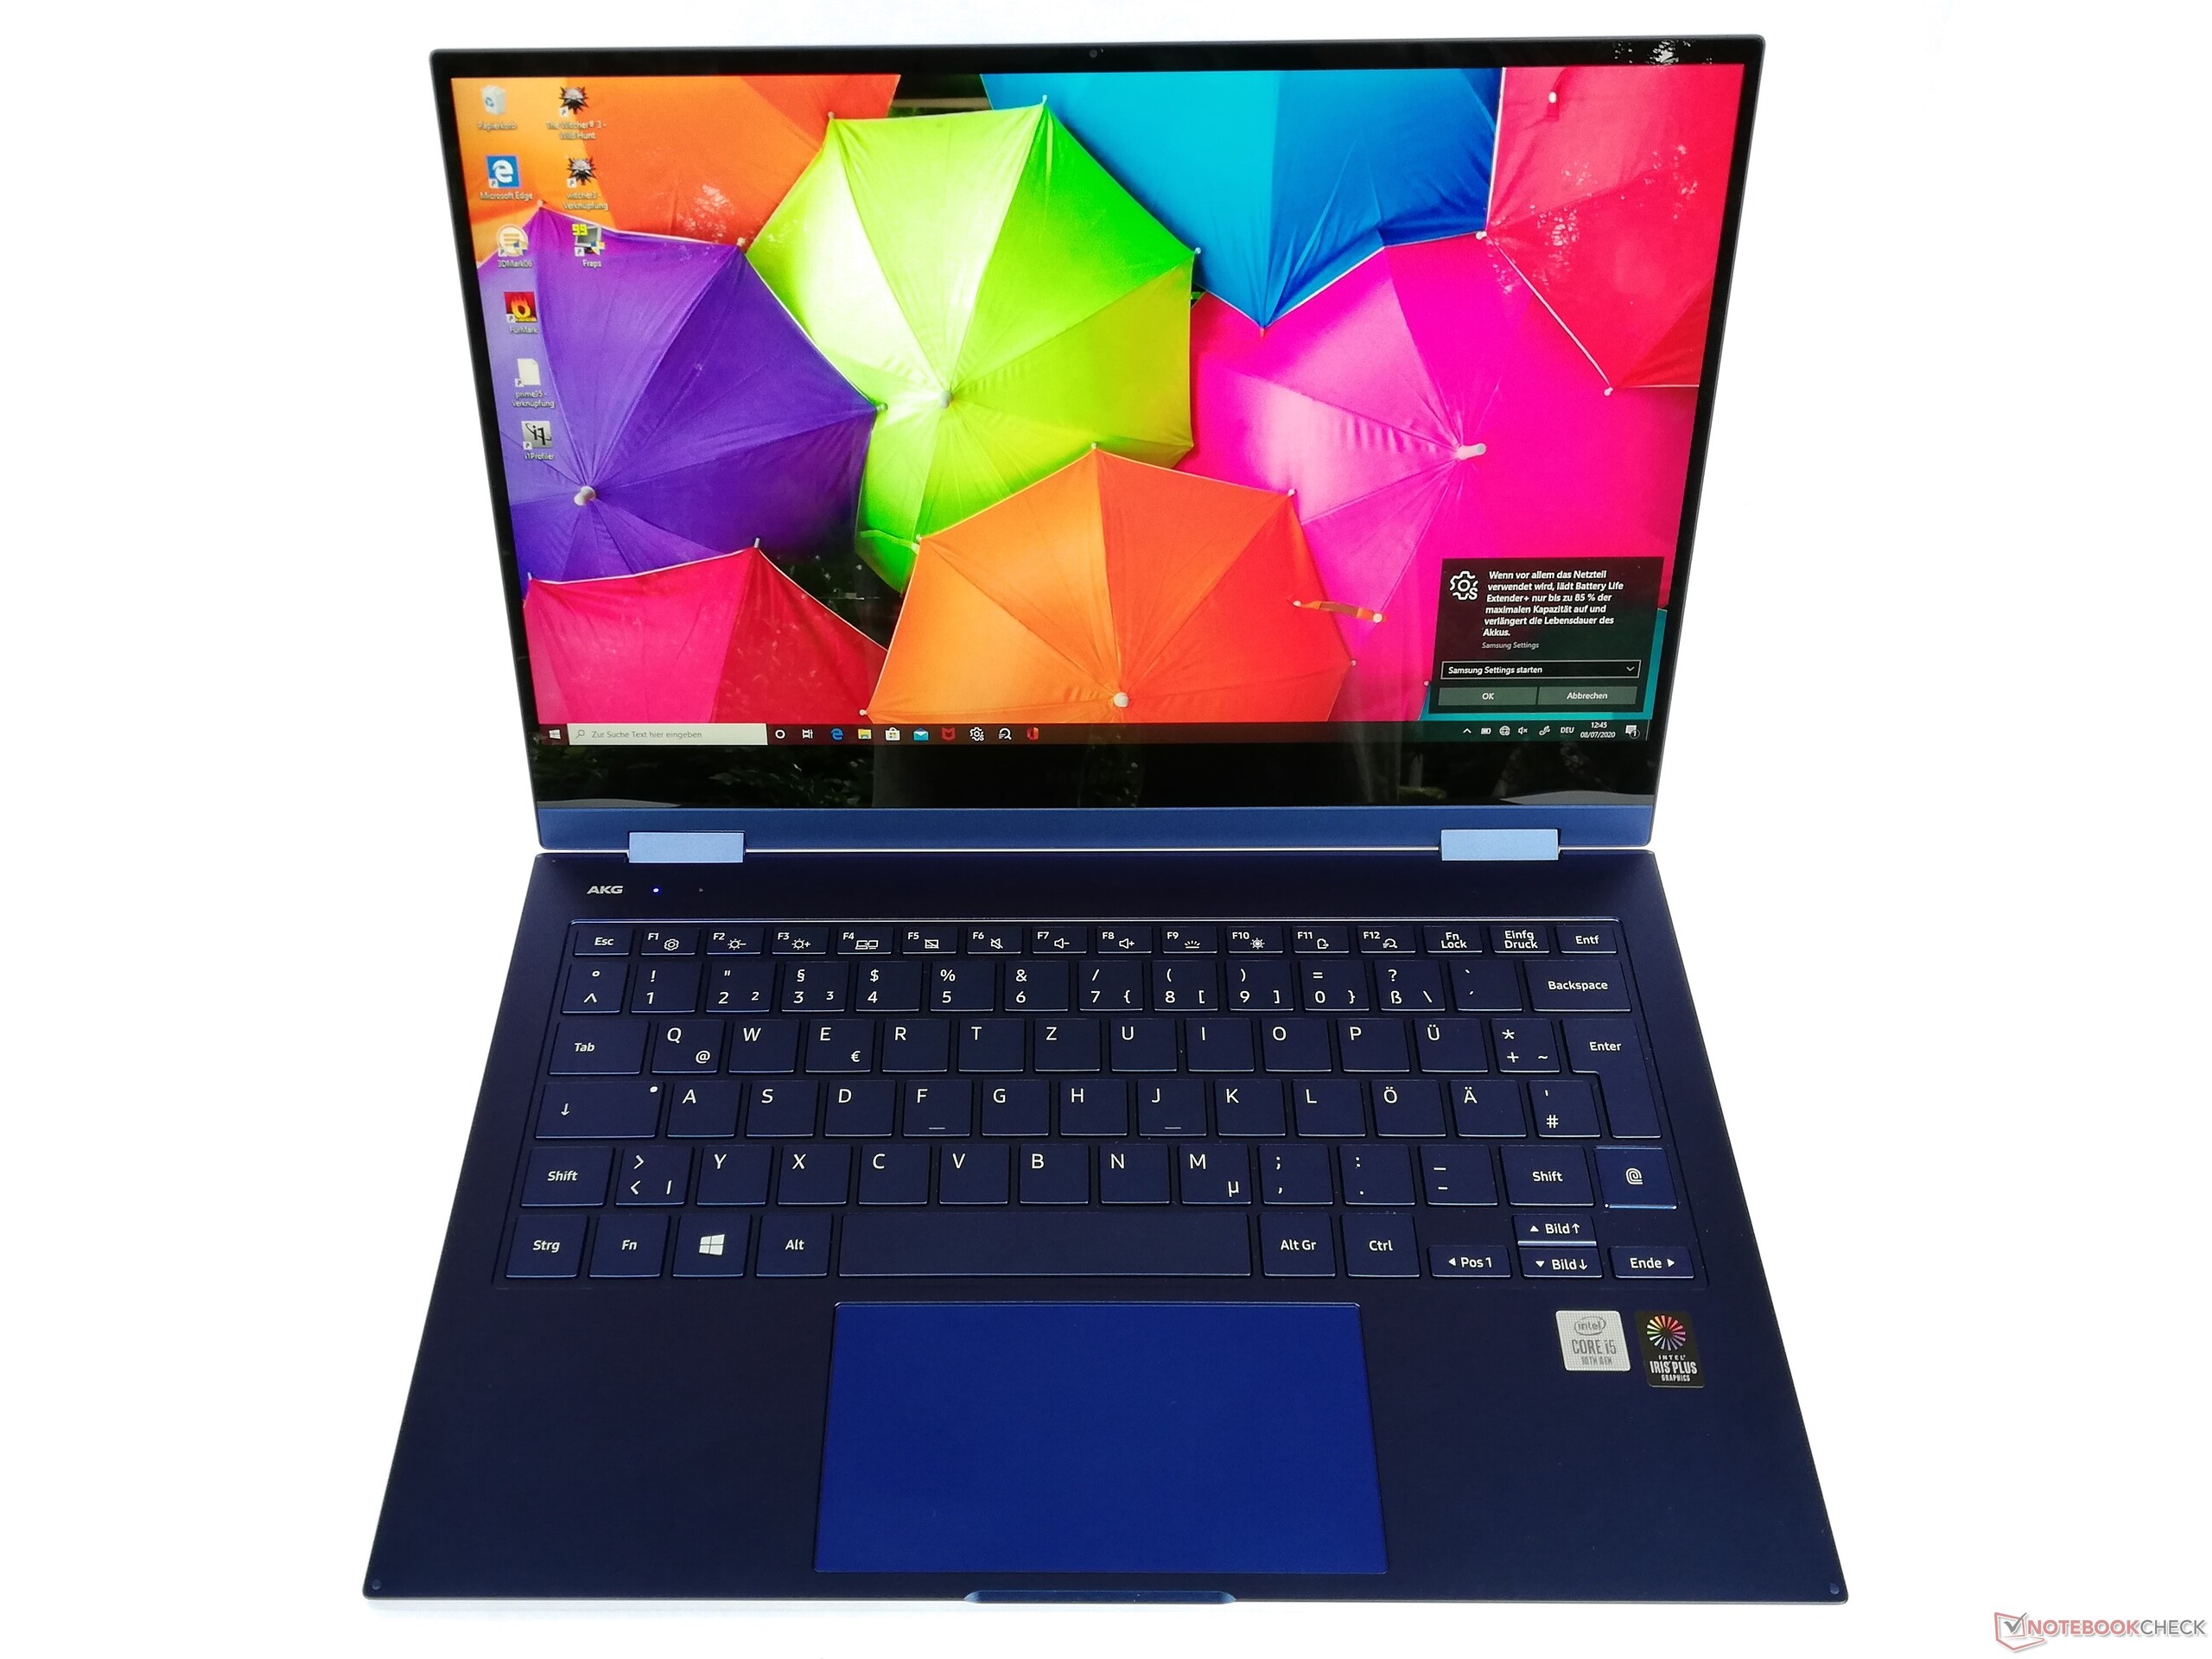
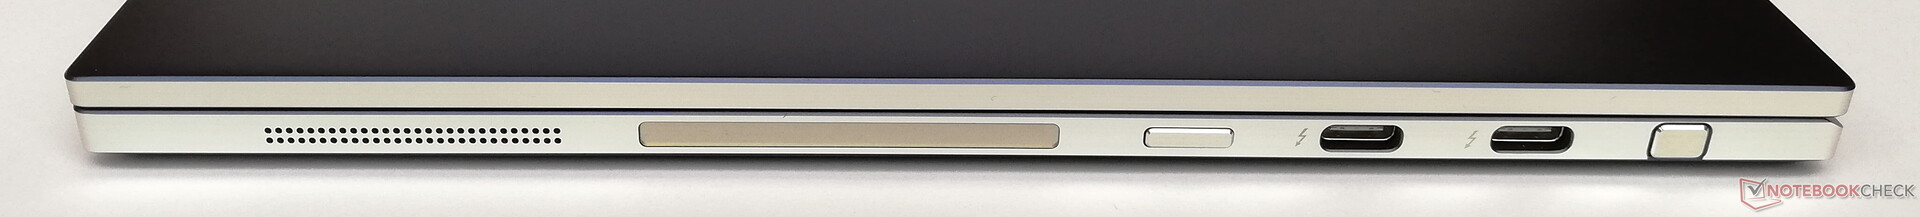
Med Galaxy Book Flex 13.3 levererar Samsung en riktigt stabil och visuellt tilltalande omvandlingsbar. Skärmen är inte riktigt så bra som den vi sett på Galaxy Book Ion 13.3, som ett exempel, men är ändå en av de bättre av sitt slag. Den tryckkänsliga skärmen reagerar direkt vid inmatning och det är lätt att arbeta med den inkluderade S-pennan. Tangentbordet och styrplattan, som ger behaglig återkoppling, förtjänar också beröm. Faktum att anslutbarheten är lite dålig kan övervinnas tack vare två Thunderbolt 3-portar.
Den som köper Samsung Galaxy Book Flex 13.3 får en tilltalande Windows-baserad omvandlingsbar som utmärker sig särskilt med sina bra inmatningsenheter.
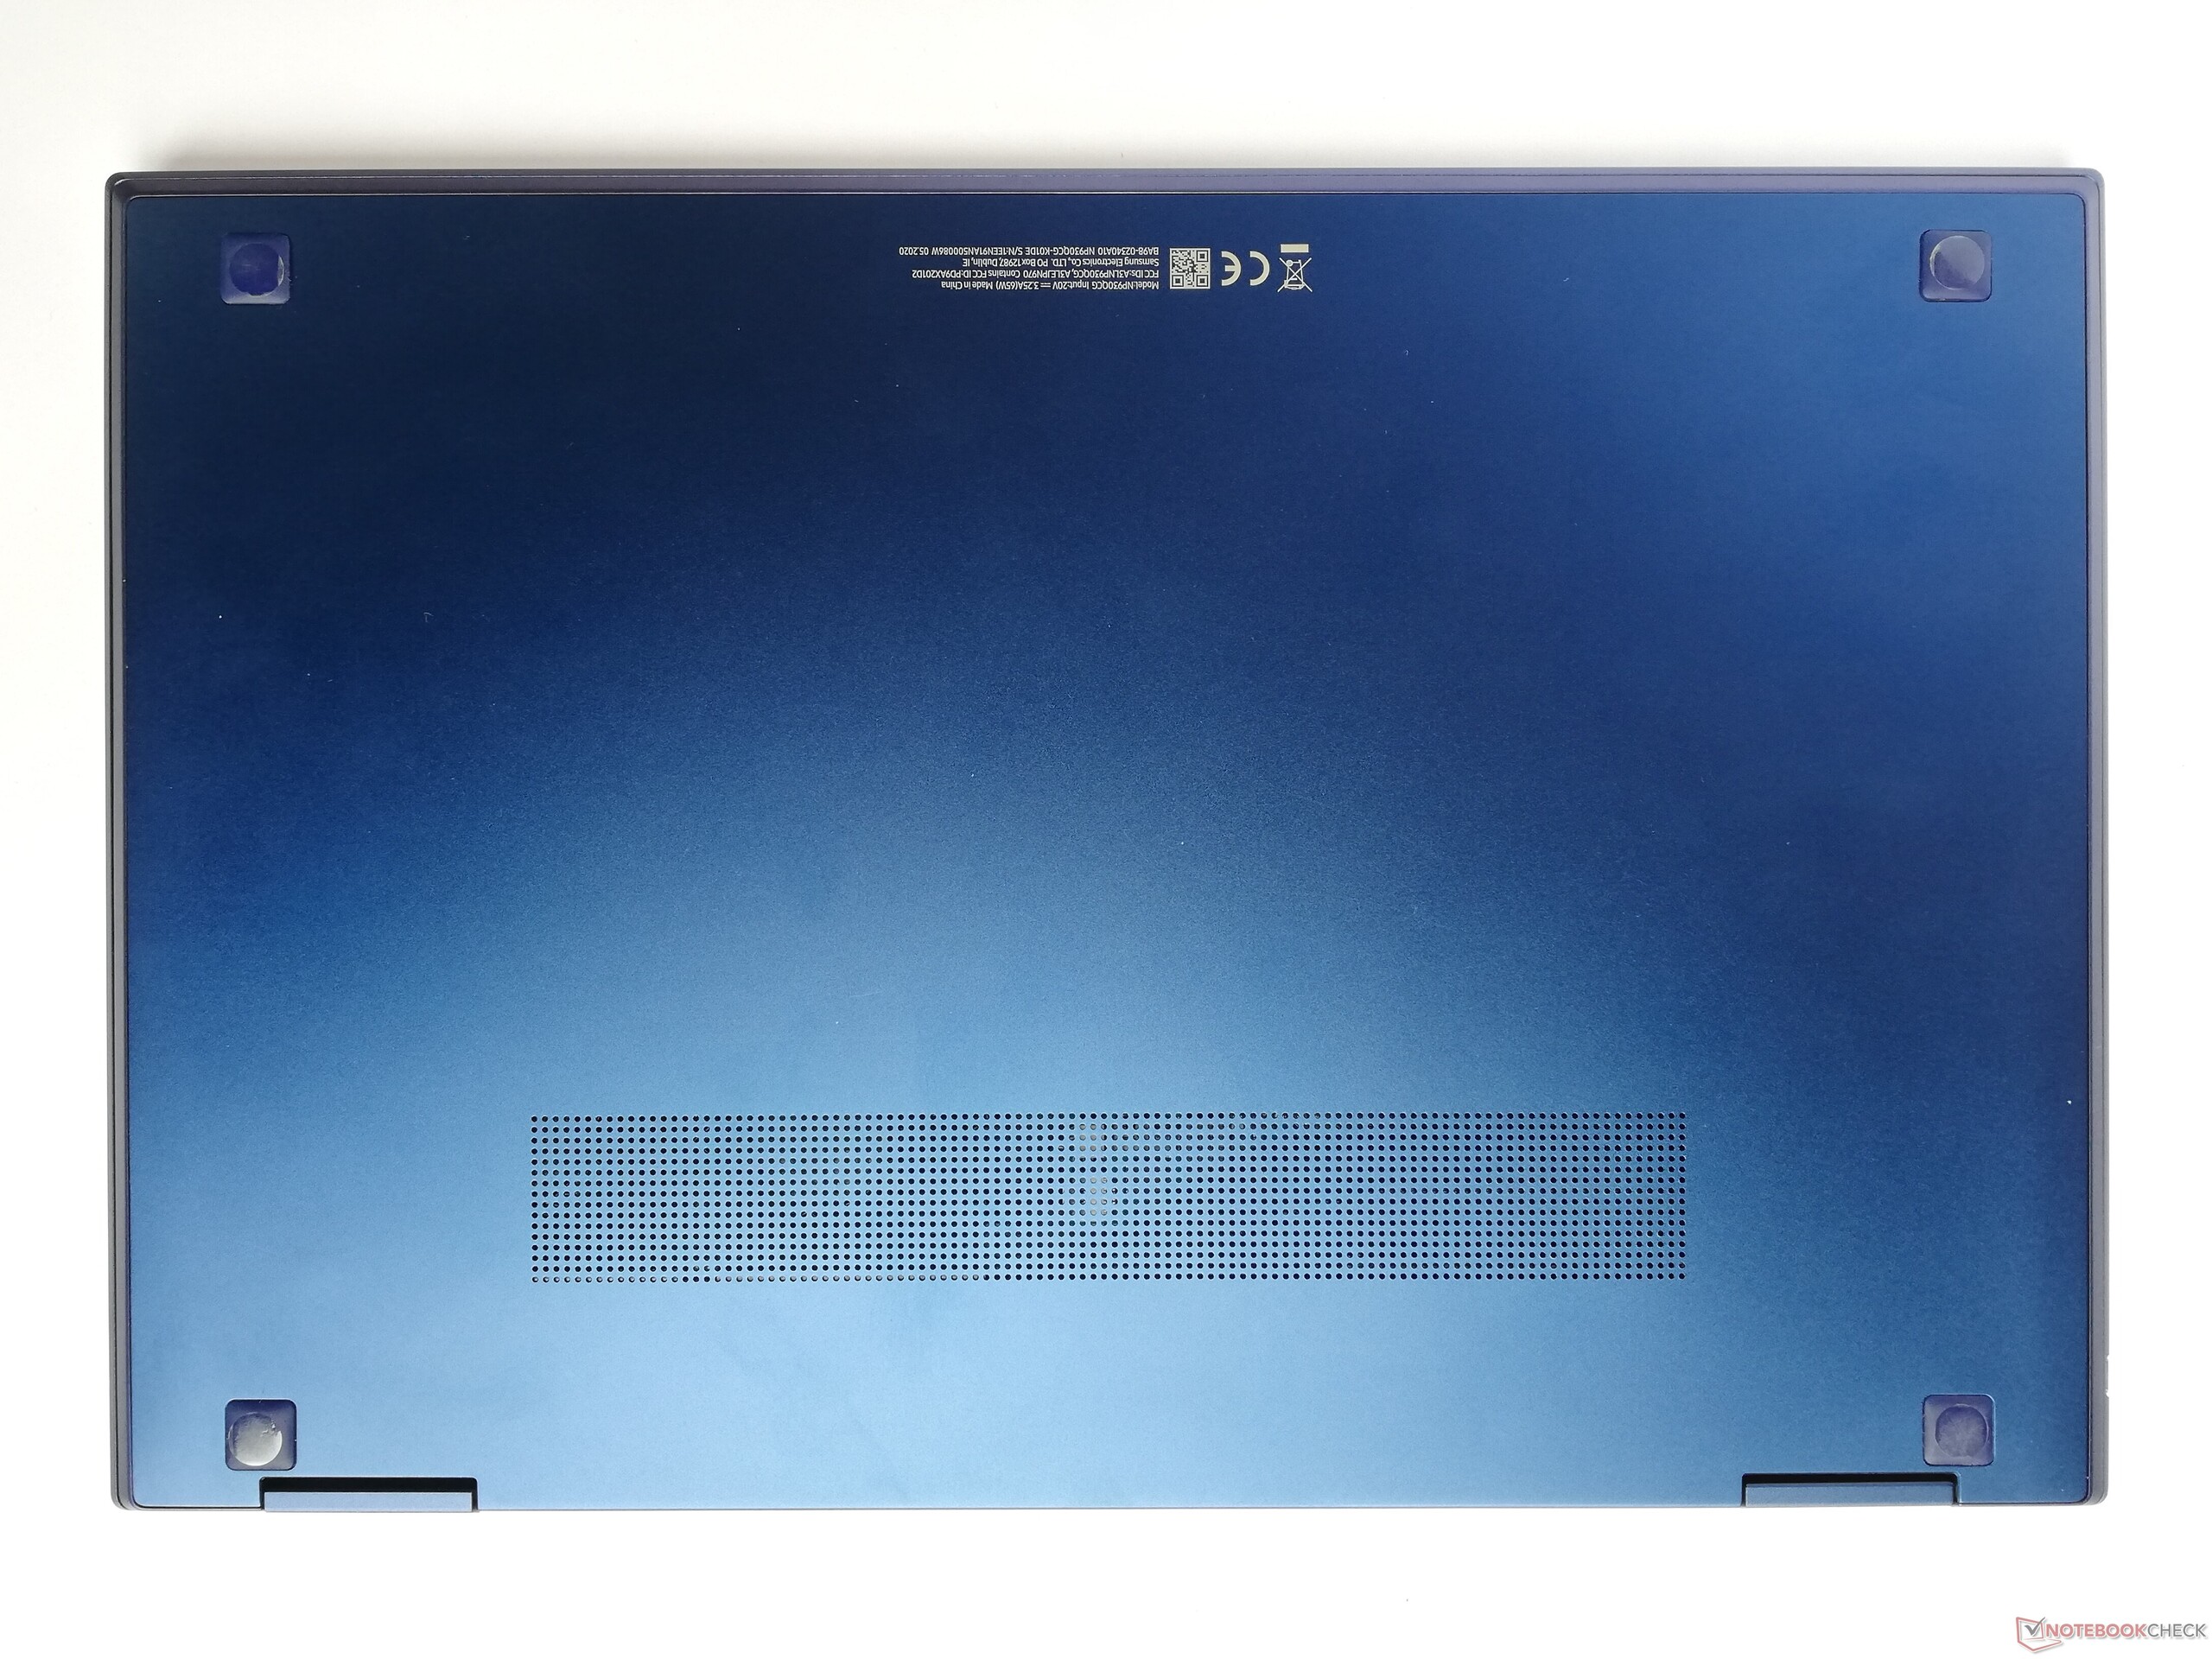
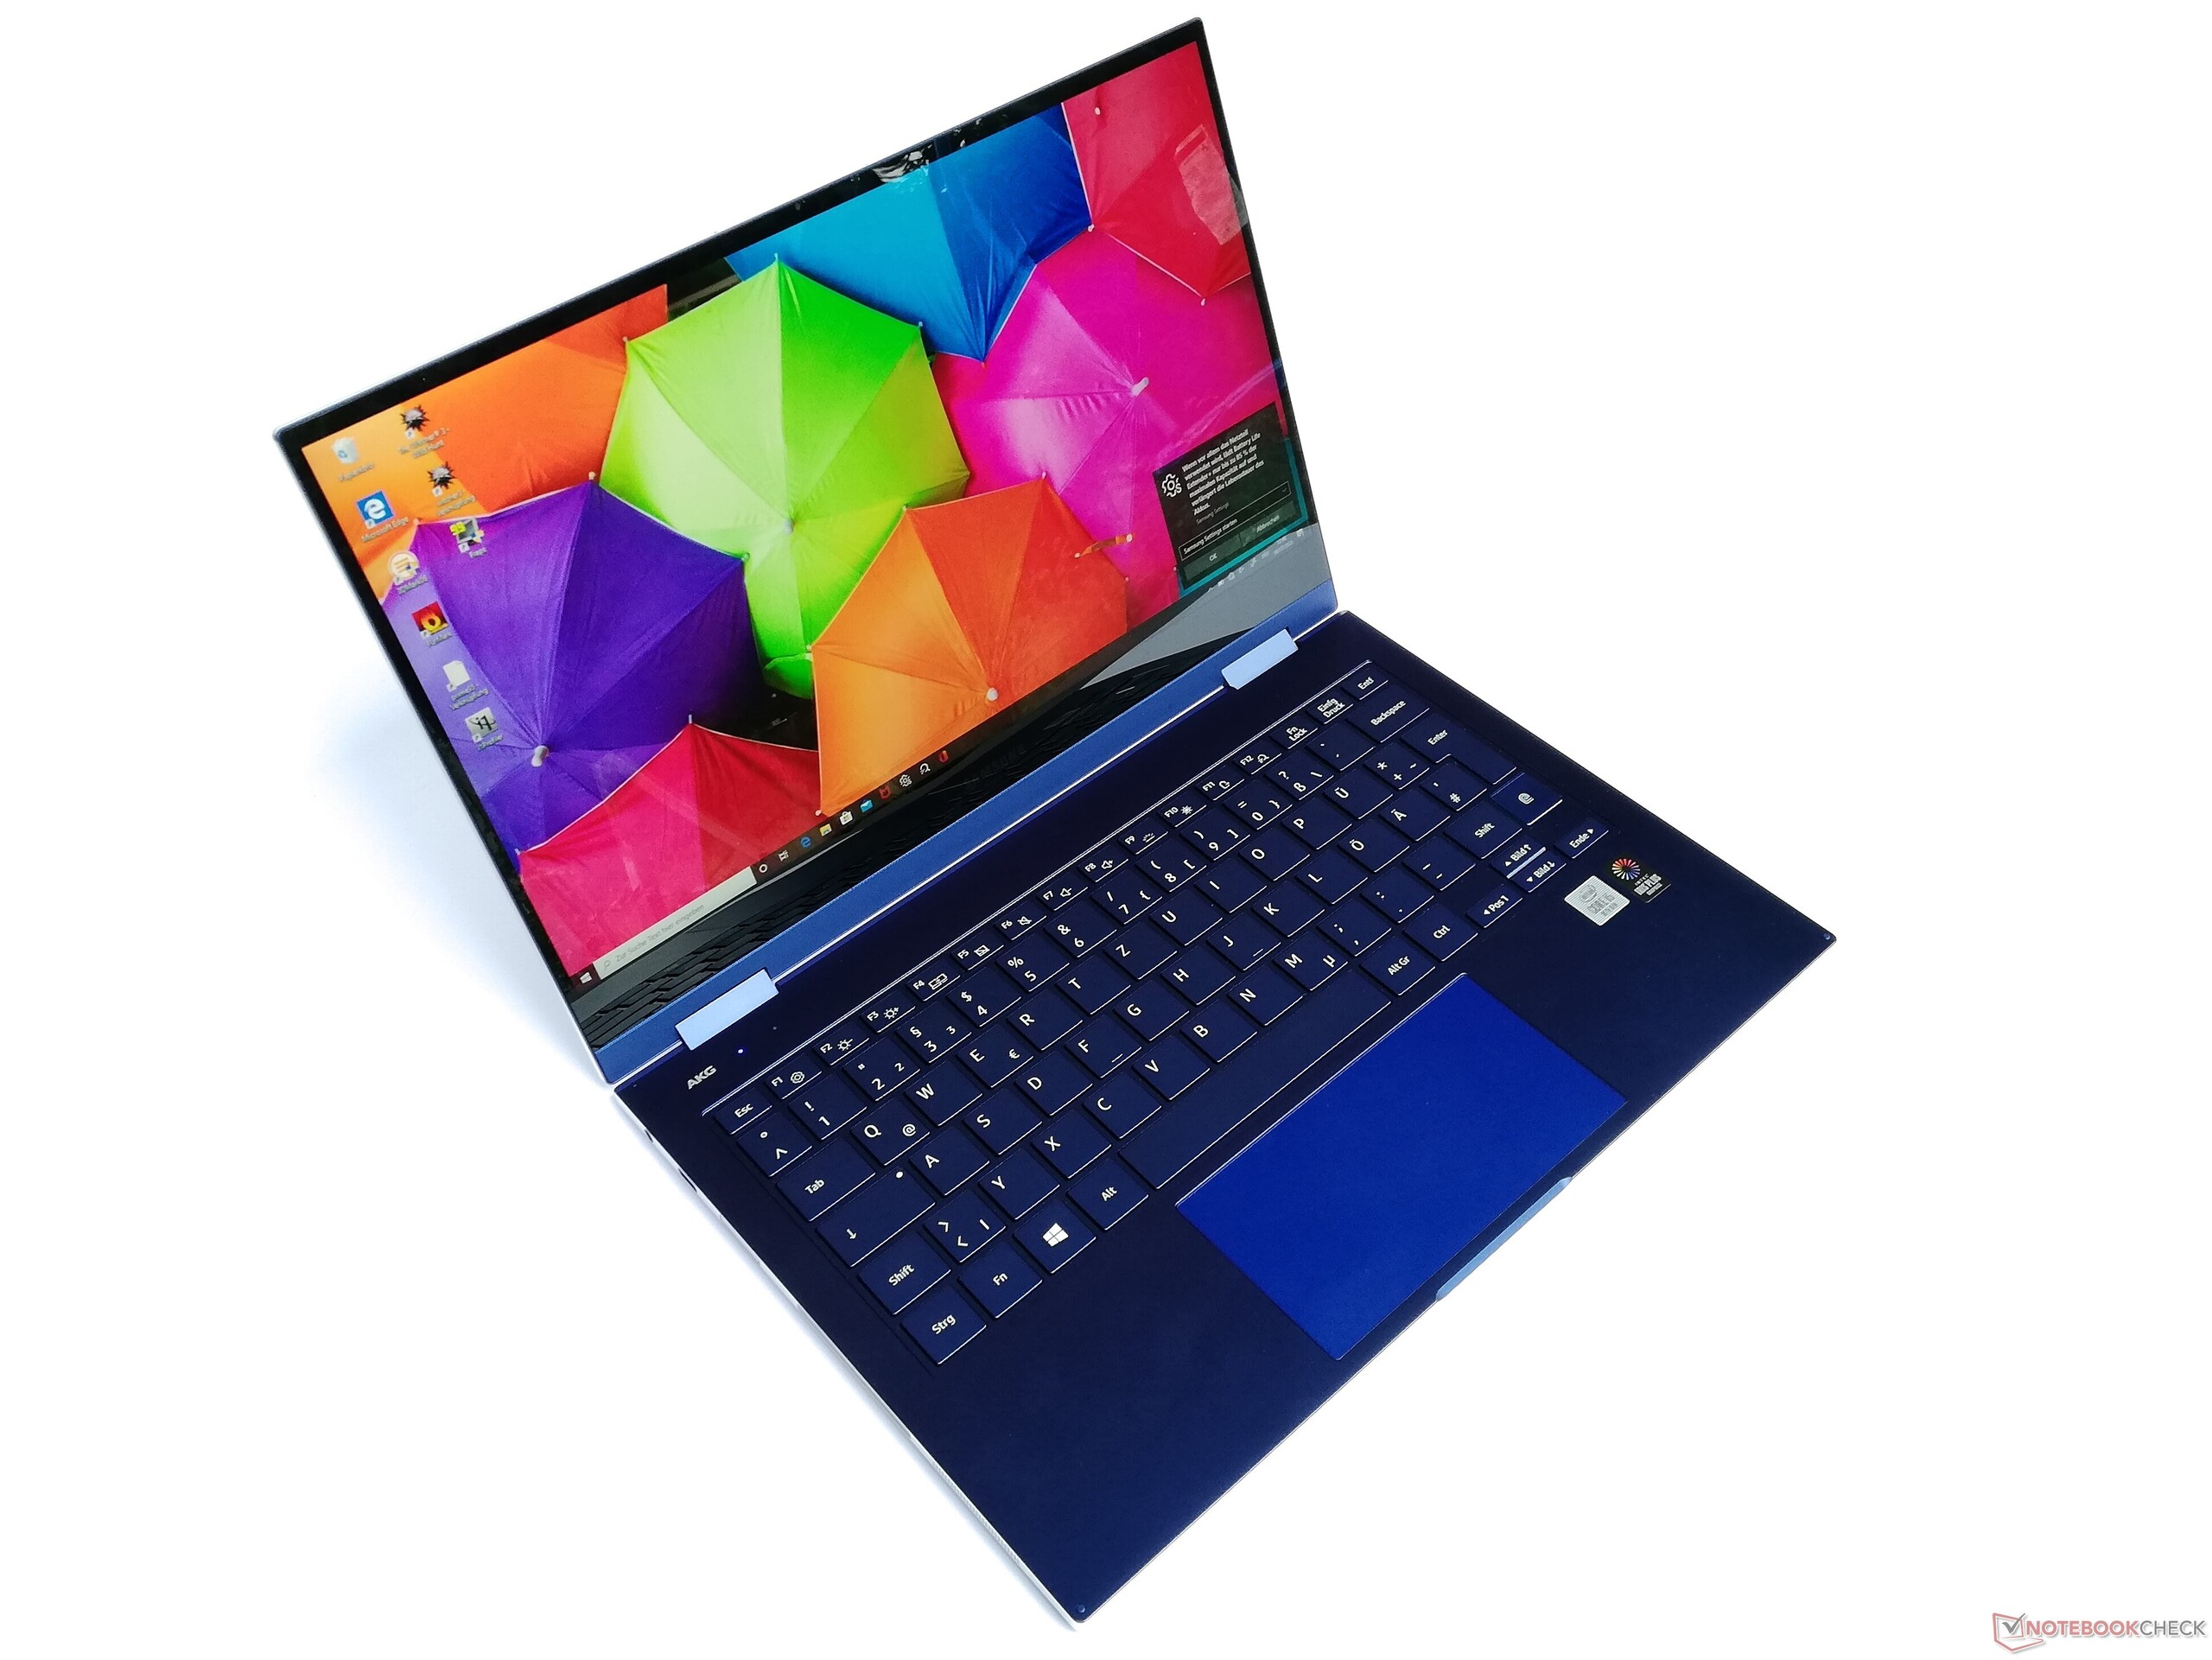
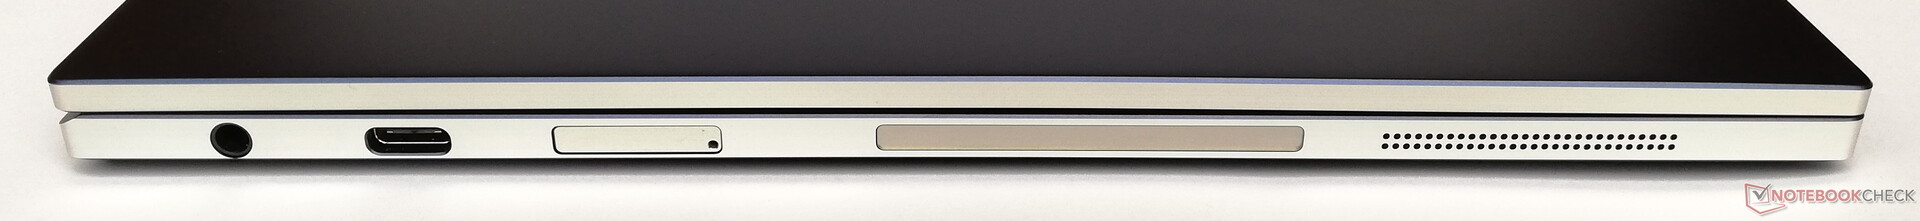
I slutändan är det bara småsaker vi kan kritisera. Ett exempel är att microSD-kort sitter i en låst lucka som bara går att ta bort med ett specialverktyg. Detta gör det onödigt svårt att byta minneskort ofta. Dessutom fläckar faktum att skärmen och basen inte ligger helt jämsides varandra i surfplatteläge ner helhetsintrycket en aning. Andra omvandlingsbara modeller som Fujitsu Lifebook U939X eller Dell Latitude 7200 är lite mer användarvänliga.
Samsung Galaxy Book Flex 13.3
- 07/20/2020 v7 (old)
Mike Wobker
Price comparison
