Test: Lenovo ThinkBook 13s - En kontorslaptop utan TrackPoint


| |||||||||||||||||||||||||
Distribution av ljusstyrkan: 92 %
Mitt på batteriet: 317 cd/m²
Kontrast: 1139:1 (Svärta: 0.28 cd/m²)
ΔE ColorChecker Calman: 2.4 | ∀{0.5-29.43 Ø4.71}
calibrated: 0.6
ΔE Greyscale Calman: 3.8 | ∀{0.09-98 Ø4.96}
99.1% sRGB (Argyll 1.6.3 3D)
63.5% AdobeRGB 1998 (Argyll 1.6.3 3D)
69.2% AdobeRGB 1998 (Argyll 3D)
99.1% sRGB (Argyll 3D)
67% Display P3 (Argyll 3D)
Gamma: 2.16
CCT: 7335 K
| Lenovo ThinkBook 13s-20R90071GE N133HCE-EN2, , 1920x1080, 13.3" | Lenovo ThinkPad L390-20NR0013GE LP133WF2-SPL8, , 1920x1080, 13.3" | Lenovo ThinkPad X390-20Q1S02M00 LP133WF7-SPB1, , 1920x1080, 13.3" | HP ProBook 430 G6-5TJ89EA CMN1375, , 1920x1080, 13.3" | Lenovo Yoga S730-13IWL B133HAN05.1, , 1920x1080, 13.3" | |
|---|---|---|---|---|---|
| Display | -40% | -3% | -37% | -1% | |
| Display P3 Coverage (%) | 67 | 40.42 -40% | 65.3 -3% | 41.87 -38% | 66.3 -1% |
| sRGB Coverage (%) | 99.1 | 60.4 -39% | 95.9 -3% | 62.6 -37% | 98.2 -1% |
| AdobeRGB 1998 Coverage (%) | 69.2 | 41.8 -40% | 66.6 -4% | 43.3 -37% | 67.8 -2% |
| Response Times | -5% | -31% | -4% | -20% | |
| Response Time Grey 50% / Grey 80% * (ms) | 40.4 ? | 42.8 ? -6% | 57.6 ? -43% | 40.8 ? -1% | 53 ? -31% |
| Response Time Black / White * (ms) | 28.8 ? | 30 ? -4% | 34 ? -18% | 30.4 ? -6% | 31 ? -8% |
| PWM Frequency (Hz) | 25000 ? | 30490 ? | 26040 ? | ||
| Screen | -124% | 0% | -89% | 4% | |
| Brightness middle (cd/m²) | 319 | 298 -7% | 356 12% | 255 -20% | 343 8% |
| Brightness (cd/m²) | 309 | 278 -10% | 336 9% | 238 -23% | 323 5% |
| Brightness Distribution (%) | 92 | 81 -12% | 88 -4% | 88 -4% | 85 -8% |
| Black Level * (cd/m²) | 0.28 | 0.33 -18% | 0.16 43% | 0.18 36% | 0.33 -18% |
| Contrast (:1) | 1139 | 903 -21% | 2225 95% | 1417 24% | 1039 -9% |
| Colorchecker dE 2000 * | 2.4 | 6.5 -171% | 3.6 -50% | 5.4 -125% | 2.38 1% |
| Colorchecker dE 2000 max. * | 6.3 | 23.9 -279% | 5.5 13% | 19.5 -210% | 3.55 44% |
| Colorchecker dE 2000 calibrated * | 0.6 | 4.9 -717% | 1.1 -83% | 4.1 -583% | |
| Greyscale dE 2000 * | 3.8 | 5.6 -47% | 4.7 -24% | 3.8 -0% | 3.01 21% |
| Gamma | 2.16 102% | 2.08 106% | 2.48 89% | 2.41 91% | 2.44 90% |
| CCT | 7335 89% | 6669 97% | 6374 102% | 7100 92% | 7198 90% |
| Color Space (Percent of AdobeRGB 1998) (%) | 63.5 | 38.4 -40% | 61.3 -3% | 39.4 -38% | 62 -2% |
| Color Space (Percent of sRGB) (%) | 99.1 | 60.1 -39% | 95.7 -3% | 62.5 -37% | 98 -1% |
| Totalt genomsnitt (program/inställningar) | -56% /
-93% | -11% /
-4% | -43% /
-69% | -6% /
-0% |
* ... mindre är bättre
Visa svarstider
| ↔ Svarstid svart till vitt | ||
|---|---|---|
| 28.8 ms ... stiga ↗ och falla ↘ kombinerat | ↗ 15.6 ms stiga | 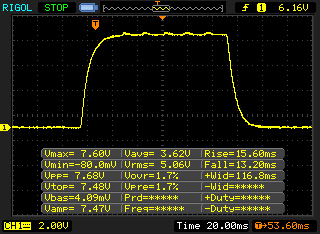 |
| ↘ 13.2 ms hösten | ||
| Skärmen visar relativt långsamma svarsfrekvenser i våra tester och kan vara för långsam för spelare. I jämförelse sträcker sig alla testade enheter från 0.1 (minst) till 240 (maximalt) ms. » 76 % av alla enheter är bättre. Detta innebär att den uppmätta svarstiden är sämre än genomsnittet av alla testade enheter (19.8 ms). | ||
| ↔ Svarstid 50 % grått till 80 % grått | ||
| 40.4 ms ... stiga ↗ och falla ↘ kombinerat | ↗ 22 ms stiga | 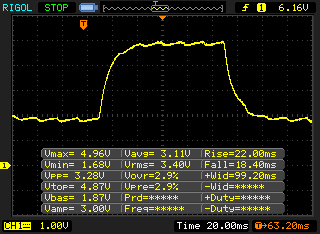 |
| ↘ 18.4 ms hösten | ||
| Skärmen visar långsamma svarsfrekvenser i våra tester och kommer att vara otillfredsställande för spelare. I jämförelse sträcker sig alla testade enheter från 0.165 (minst) till 636 (maximalt) ms. » 64 % av alla enheter är bättre. Detta innebär att den uppmätta svarstiden är sämre än genomsnittet av alla testade enheter (31 ms). | ||
Skärmflimmer / PWM (Puls-Width Modulation)
| Skärmflimmer / PWM upptäckt | 25000 Hz | ≤ 20 % ljusstyrka inställning | 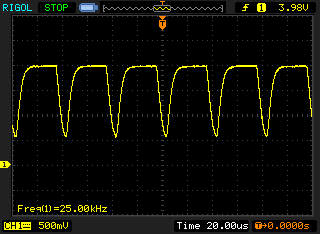 |
Displayens bakgrundsbelysning flimrar vid 25000 Hz (i värsta fall, t.ex. med PWM) Flimrande upptäckt vid en ljusstyrkeinställning på 20 % och lägre. Det ska inte finnas något flimmer eller PWM över denna ljusstyrkeinställning. Frekvensen för 25000 Hz är ganska hög, så de flesta användare som är känsliga för PWM bör inte märka något flimmer. Som jämförelse: 52 % av alla testade enheter använder inte PWM för att dämpa skärmen. Om PWM upptäcktes mättes ett medelvärde av 7757 (minst: 5 - maximum: 343500) Hz. | |||
| PCMark 8 Home Score Accelerated v2 | 3467 poäng | |
| PCMark 8 Work Score Accelerated v2 | 4841 poäng | |
| PCMark 10 Score | 3630 poäng | |
Hjälp | ||
| Lenovo ThinkBook 13s-20R90071GE SK hynix BC501 HFM512GDHTNG-8310A | Lenovo ThinkPad L390-20NR0013GE Samsung SSD PM981 MZVLB256HAHQ | Lenovo ThinkPad X390-20Q1S02M00 Intel SSD Pro 7600p SSDPEKKF512G8L | HP ProBook 430 G6-5TJ89EA WDC PC SN520 SDAPNUW-256G | Lenovo Yoga S730-13IWL Samsung SSD PM981 MZVLB1T0HALR | Genomsnitt SK hynix BC501 HFM512GDHTNG-8310A | |
|---|---|---|---|---|---|---|
| CrystalDiskMark 5.2 / 6 | 52% | 68% | 20% | 62% | 9% | |
| Write 4K (MB/s) | 89.3 | 99.6 12% | 120.7 35% | 101.8 14% | 139.6 56% | 110 ? 23% |
| Read 4K (MB/s) | 37.4 | 37.22 0% | 58.5 56% | 41.35 11% | 36.97 -1% | 40.6 ? 9% |
| Write Seq (MB/s) | 608 | 1432 136% | 1491 145% | 929 53% | 1490 145% | 677 ? 11% |
| Read Seq (MB/s) | 1019 | 2072 103% | 2760 171% | 1388 36% | 1321 30% | 1104 ? 8% |
| Write 4K Q32T1 (MB/s) | 487.9 | 439.7 -10% | 237.5 -51% | 453.5 -7% | 302.4 -38% | 438 ? -10% |
| Read 4K Q32T1 (MB/s) | 284.8 | 264.8 -7% | 336.1 18% | 286.2 0% | 375.4 32% | 338 ? 19% |
| Write Seq Q32T1 (MB/s) | 872 | 1549 78% | 1512 73% | 1302 49% | 2391 174% | 860 ? -1% |
| Read Seq Q32T1 (MB/s) | 1635 | 3318 103% | 3154 93% | 1751 7% | 3272 100% | 1786 ? 9% |

| 3DMark 11 Performance | 1937 poäng | |
| 3DMark Cloud Gate Standard Score | 8233 poäng | |
| 3DMark Fire Strike Score | 1018 poäng | |
Hjälp | ||
| låg | med. | hög | ultra | |
|---|---|---|---|---|
| BioShock Infinite (2013) | 59.1 | 30.9 | 25.2 | 8 |
| The Witcher 3 (2015) | 15.9 | |||
| Dota 2 Reborn (2015) | 72 | 42.9 | 19.2 | 16.9 |
| Rise of the Tomb Raider (2016) | 23.1 | |||
| X-Plane 11.11 (2018) | 25.4 | 17.6 |
Ljudnivå
| Låg belastning |
| 28.8 / 28.8 / 29.7 dB(A) |
| Hög belastning |
| 30.7 / 38.3 dB(A) |
 | ||
30 dB tyst 40 dB(A) hörbar 50 dB(A) högt ljud |
||
min: | ||
(±) Den maximala temperaturen på ovansidan är 40.3 °C / 105 F, jämfört med genomsnittet av 35.9 °C / 97 F , allt från 21.4 till 59 °C för klassen Subnotebook.
(±) Botten värms upp till maximalt 44.6 °C / 112 F, jämfört med genomsnittet av 39.2 °C / 103 F
(+) Vid tomgångsbruk är medeltemperaturen för ovansidan 23.4 °C / 74 F, jämfört med enhetsgenomsnittet på 30.8 °C / ### class_avg_f### F.
(+) Handledsstöden och pekplattan är kallare än hudtemperaturen med maximalt 30.2 °C / 86.4 F och är därför svala att ta på.
(±) Medeltemperaturen för handledsstödsområdet på liknande enheter var 28.2 °C / 82.8 F (-2 °C / -3.6 F).
Lenovo ThinkBook 13s-20R90071GE ljudanalys
(-) | inte särskilt höga högtalare (70.7 dB)
Bas 100 - 315 Hz
(-) | nästan ingen bas - i genomsnitt 15.9% lägre än medianen
(±) | linjäriteten för basen är genomsnittlig (14.8% delta till föregående frekvens)
Mellan 400 - 2000 Hz
(+) | balanserad mellan - endast 4.5% från medianen
(±) | linjäriteten för mids är genomsnittlig (7.1% delta till föregående frekvens)
Högsta 2 - 16 kHz
(+) | balanserade toppar - endast 2.7% från medianen
(±) | linjäriteten för toppar är genomsnittlig (11.2% delta till föregående frekvens)
Totalt 100 - 16 000 Hz
(±) | linjäriteten för det totala ljudet är genomsnittlig (21.3% skillnad mot median)
Jämfört med samma klass
» 72% av alla testade enheter i den här klassen var bättre, 5% liknande, 23% sämre
» Den bästa hade ett delta på 5%, genomsnittet var 18%, sämst var 53%
Jämfört med alla testade enheter
» 59% av alla testade enheter var bättre, 7% liknande, 33% sämre
» Den bästa hade ett delta på 4%, genomsnittet var 23%, sämst var 134%
Lenovo ThinkPad X390-20Q1S02M00 ljudanalys
(±) | högtalarljudstyrkan är genomsnittlig men bra (72.6 dB)
Bas 100 - 315 Hz
(-) | nästan ingen bas - i genomsnitt 20.8% lägre än medianen
(±) | linjäriteten för basen är genomsnittlig (13.6% delta till föregående frekvens)
Mellan 400 - 2000 Hz
(+) | balanserad mellan - endast 2.3% från medianen
(+) | mids är linjära (5.5% delta till föregående frekvens)
Högsta 2 - 16 kHz
(+) | balanserade toppar - endast 2.4% från medianen
(+) | toppar är linjära (6.1% delta till föregående frekvens)
Totalt 100 - 16 000 Hz
(±) | linjäriteten för det totala ljudet är genomsnittlig (20.5% skillnad mot median)
Jämfört med samma klass
» 66% av alla testade enheter i den här klassen var bättre, 7% liknande, 26% sämre
» Den bästa hade ett delta på 5%, genomsnittet var 18%, sämst var 53%
Jämfört med alla testade enheter
» 54% av alla testade enheter var bättre, 8% liknande, 38% sämre
» Den bästa hade ett delta på 4%, genomsnittet var 23%, sämst var 134%
| Av/Standby | |
| Låg belastning | |
| Hög belastning |
|
Förklaring:
min: | |
| Lenovo ThinkBook 13s-20R90071GE i5-8265U, UHD Graphics 620, SK hynix BC501 HFM512GDHTNG-8310A, a-Si IPS LED, 1920x1080, 13.3" | Lenovo ThinkPad L390-20NR0013GE i5-8265U, UHD Graphics 620, Samsung SSD PM981 MZVLB256HAHQ, IPS LED, 1920x1080, 13.3" | Lenovo ThinkPad X390-20Q1S02M00 i5-8265U, UHD Graphics 620, Intel SSD Pro 7600p SSDPEKKF512G8L, IPS LED, 1920x1080, 13.3" | HP ProBook 430 G6-5TJ89EA i5-8265U, UHD Graphics 620, WDC PC SN520 SDAPNUW-256G, IPS LED, 1920x1080, 13.3" | Lenovo Yoga S730-13IWL i7-8565U, UHD Graphics 620, Samsung SSD PM981 MZVLB1T0HALR, IPS LED, 1920x1080, 13.3" | Genomsnitt Intel UHD Graphics 620 | Genomsnitt av klass Subnotebook | |
|---|---|---|---|---|---|---|---|
| Power Consumption | -18% | -20% | -7% | -16% | -15% | -22% | |
| Idle Minimum * (Watt) | 3.1 | 3.8 -23% | 3.4 -10% | 3.5 -13% | 3 3% | 3.81 ? -23% | 3.76 ? -21% |
| Idle Average * (Watt) | 5.87 | 6.8 -16% | 5.6 5% | 5.76 2% | 5.6 5% | 6.94 ? -18% | 6.54 ? -11% |
| Idle Maximum * (Watt) | 6.6 | 9.8 -48% | 8.7 -32% | 8.3 -26% | 11 -67% | 8.75 ? -33% | 7.89 ? -20% |
| Load Average * (Watt) | 35.3 | 32.4 8% | 43.6 -24% | 34.8 1% | 38 -8% | 35 ? 1% | 42 ? -19% |
| Load Maximum * (Watt) | 46.5 | 52 -12% | 65 -40% | 45.7 2% | 53 -14% | 47.5 ? -2% | 64.8 ? -39% |
* ... mindre är bättre
| Lenovo ThinkBook 13s-20R90071GE i5-8265U, UHD Graphics 620, 45 Wh | Lenovo ThinkPad L390-20NR0013GE i5-8265U, UHD Graphics 620, 45 Wh | Lenovo ThinkPad X390-20Q1S02M00 i5-8265U, UHD Graphics 620, 48 Wh | HP ProBook 430 G6-5TJ89EA i5-8265U, UHD Graphics 620, 45 Wh | Lenovo Yoga S730-13IWL i7-8565U, UHD Graphics 620, 42 Wh | Genomsnitt av klass Subnotebook | |
|---|---|---|---|---|---|---|
| Batteridrifttid | -12% | 8% | 20% | -7% | 46% | |
| H.264 (h) | 10.8 | 9.4 -13% | 12.7 18% | 9.1 -16% | 8.9 -18% | 15.4 ? 43% |
| WiFi v1.3 (h) | 9.1 | 7 -23% | 8.3 -9% | 9.5 4% | 6.9 -24% | 14 ? 54% |
| Load (h) | 1.4 | 1.4 0% | 1.6 14% | 2.4 71% | 1.7 21% | 1.969 ? 41% |
| Reader / Idle (h) | 16.2 | 16.2 | 15.9 | 28.6 ? |
För
Emot
Läs den fullständiga versionen av den här recensionen på engelska här.
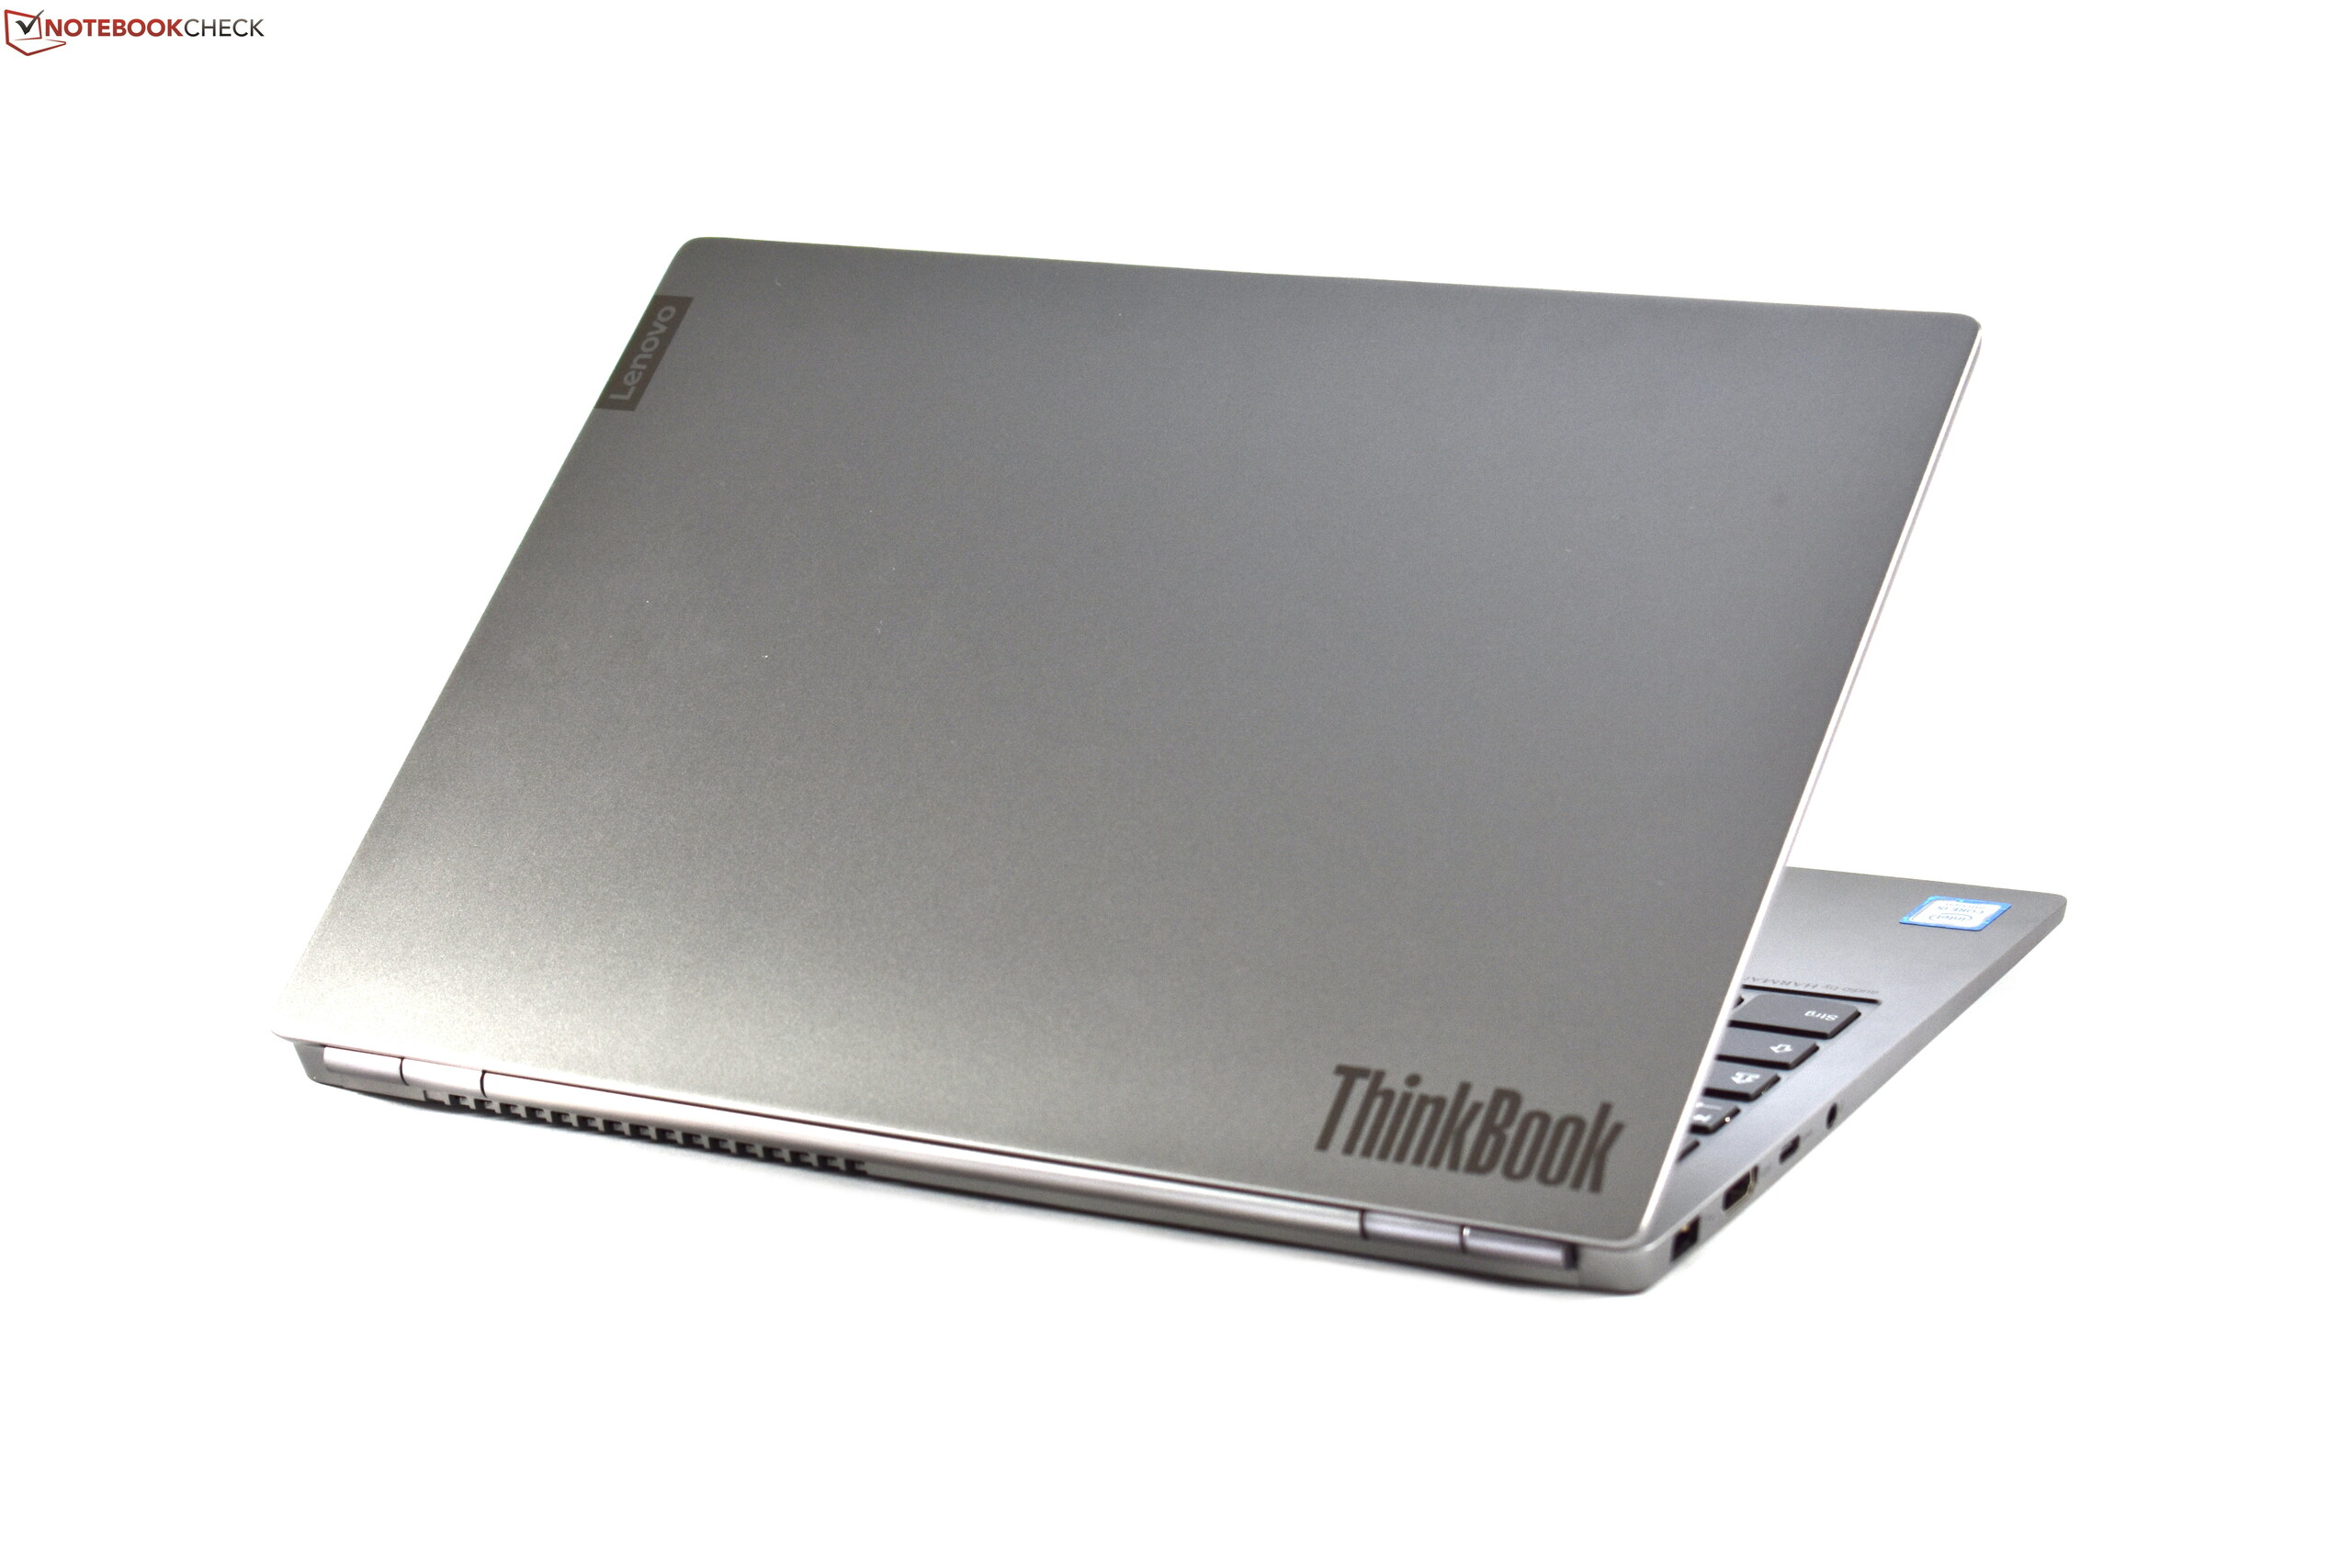
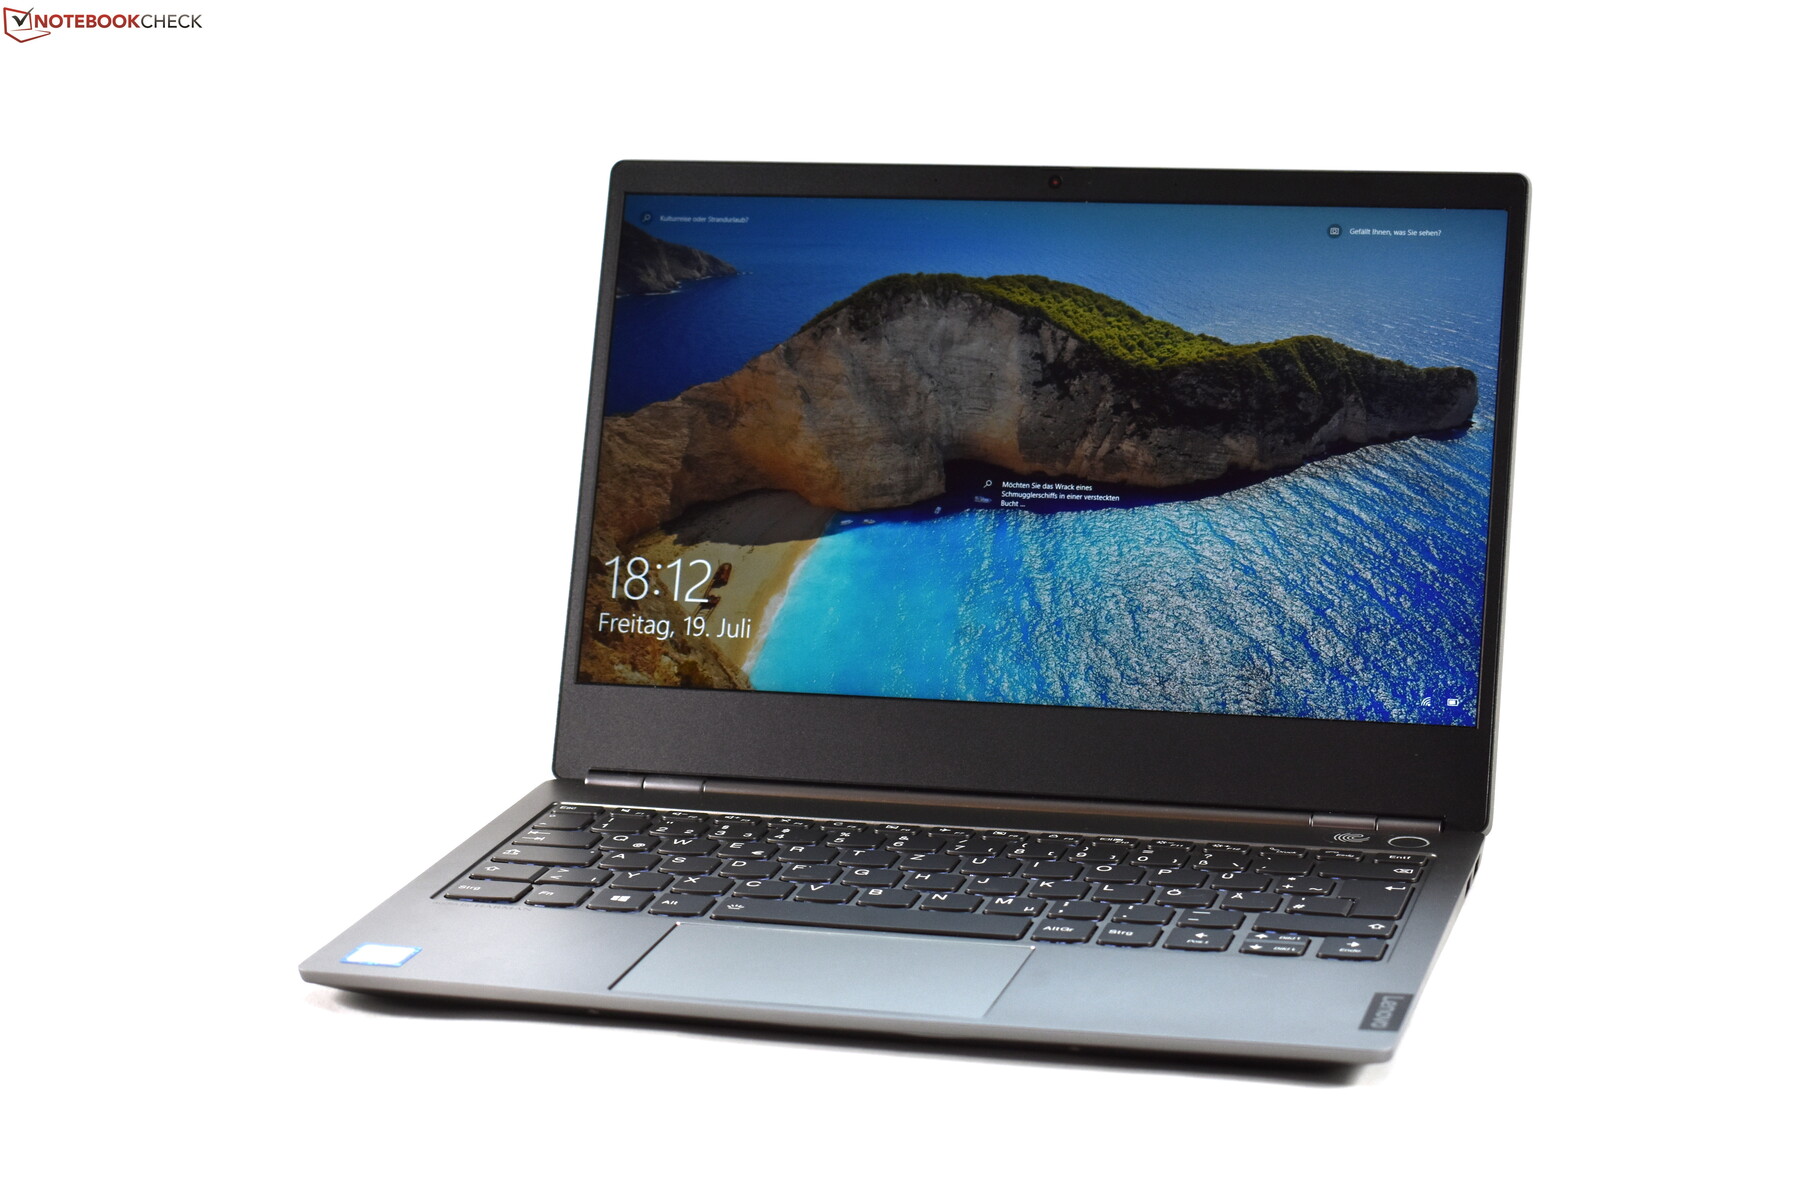
ThinkBook-serien kommer inte byta ut den etablerade ThinkPad-serien, det kan vi säkert säga efter att ha provat ThinkBook 13s. ThinkBook-serien är snarare ett tillägg till Lenovos laptoputbud som kommer tilltala den som inte gillar ThinkPad-modellerna. Det vill säga, ThinkPad 13s är nog mer av intresse för den som föredrar en MacBook Pro-liknande design snarare än en traditionell ThinkPad.
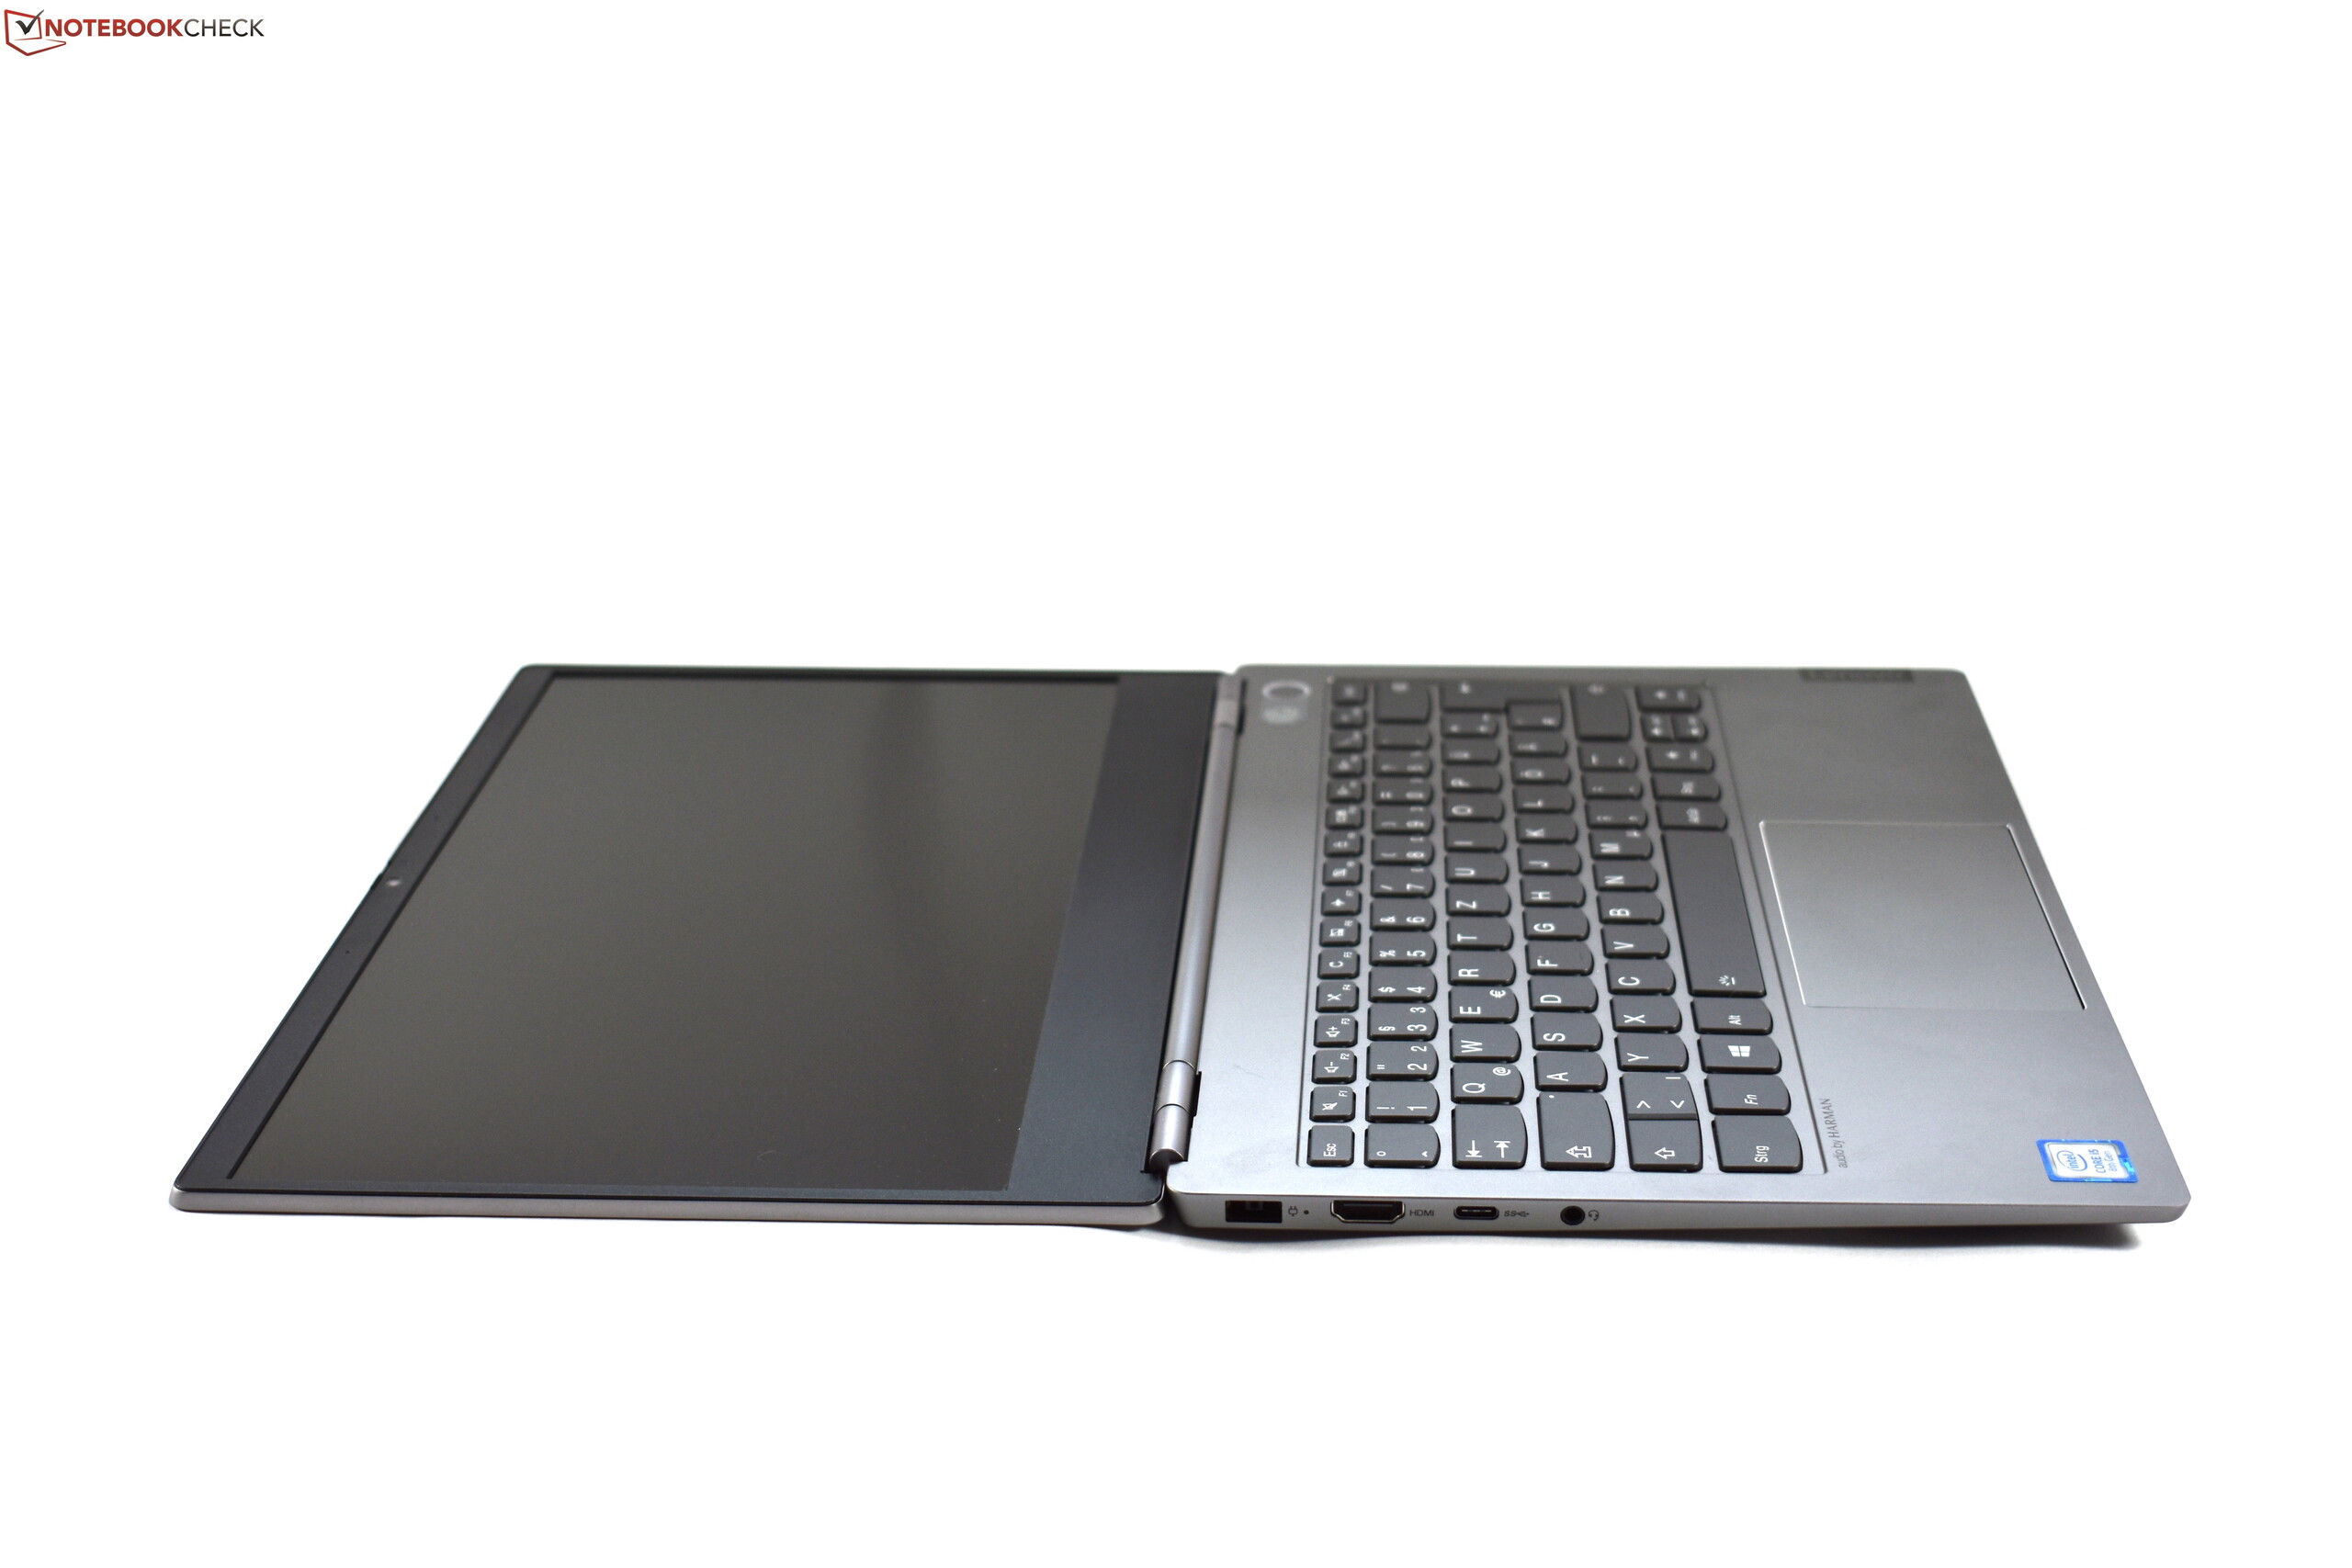
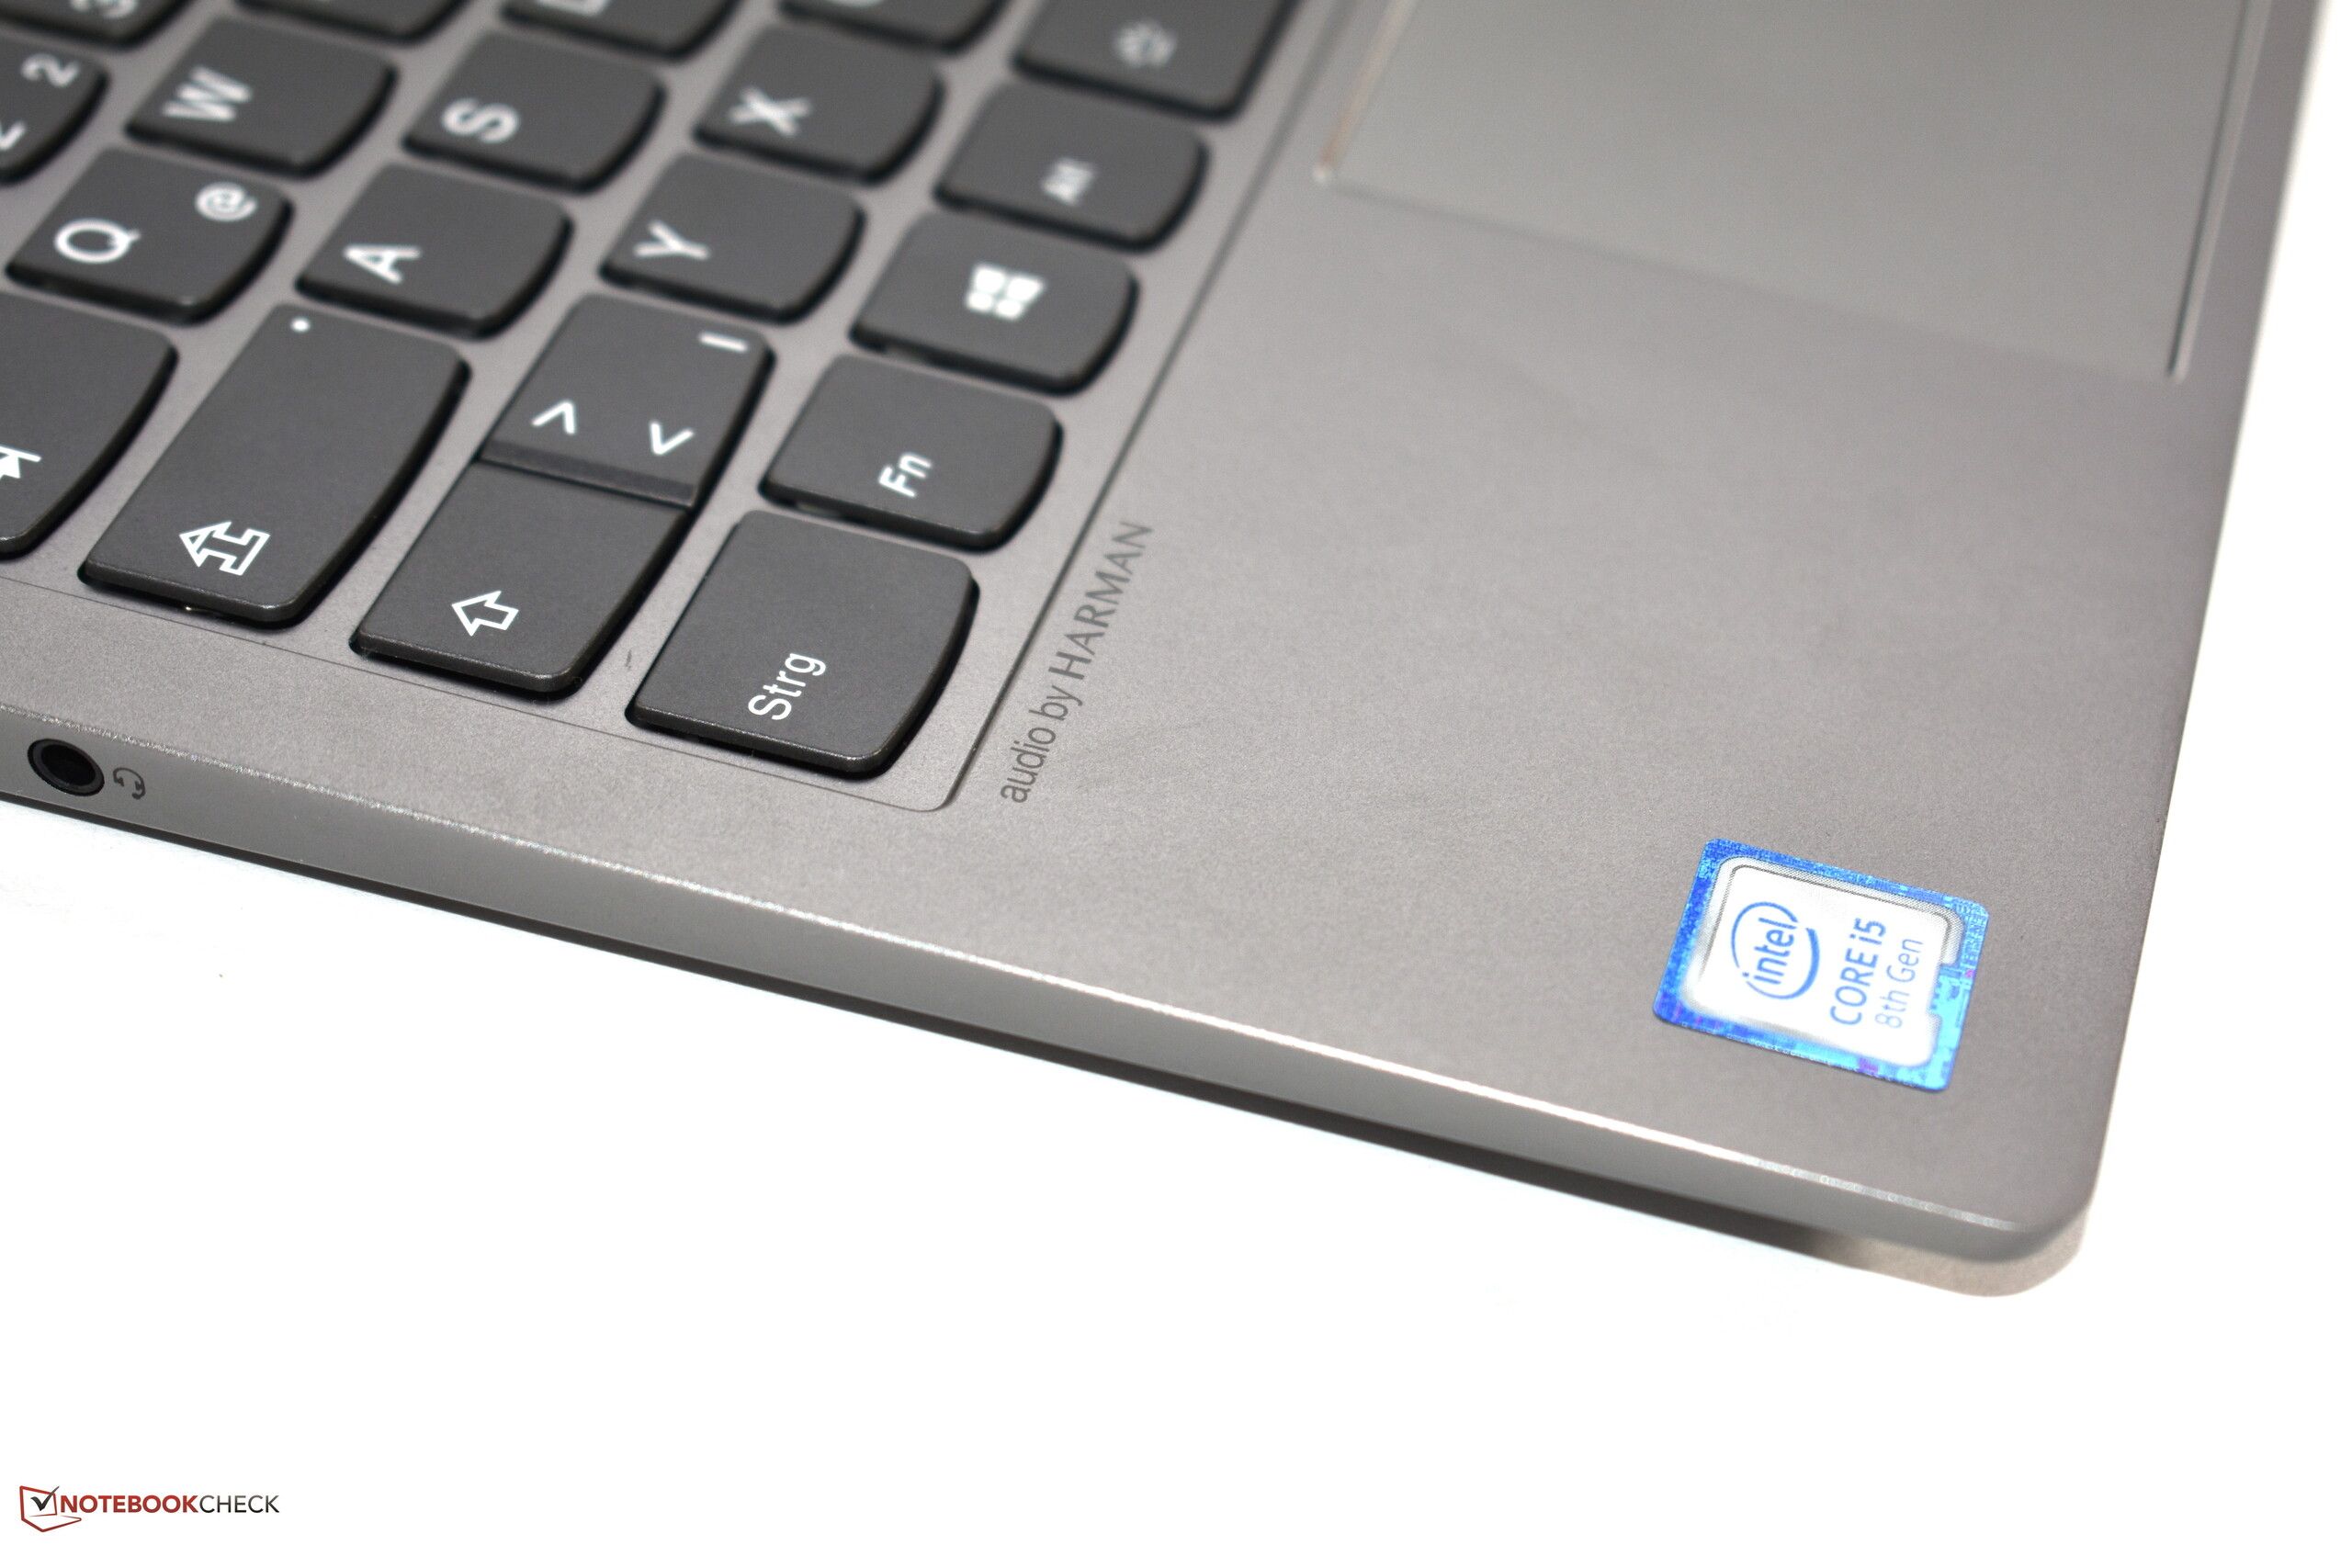
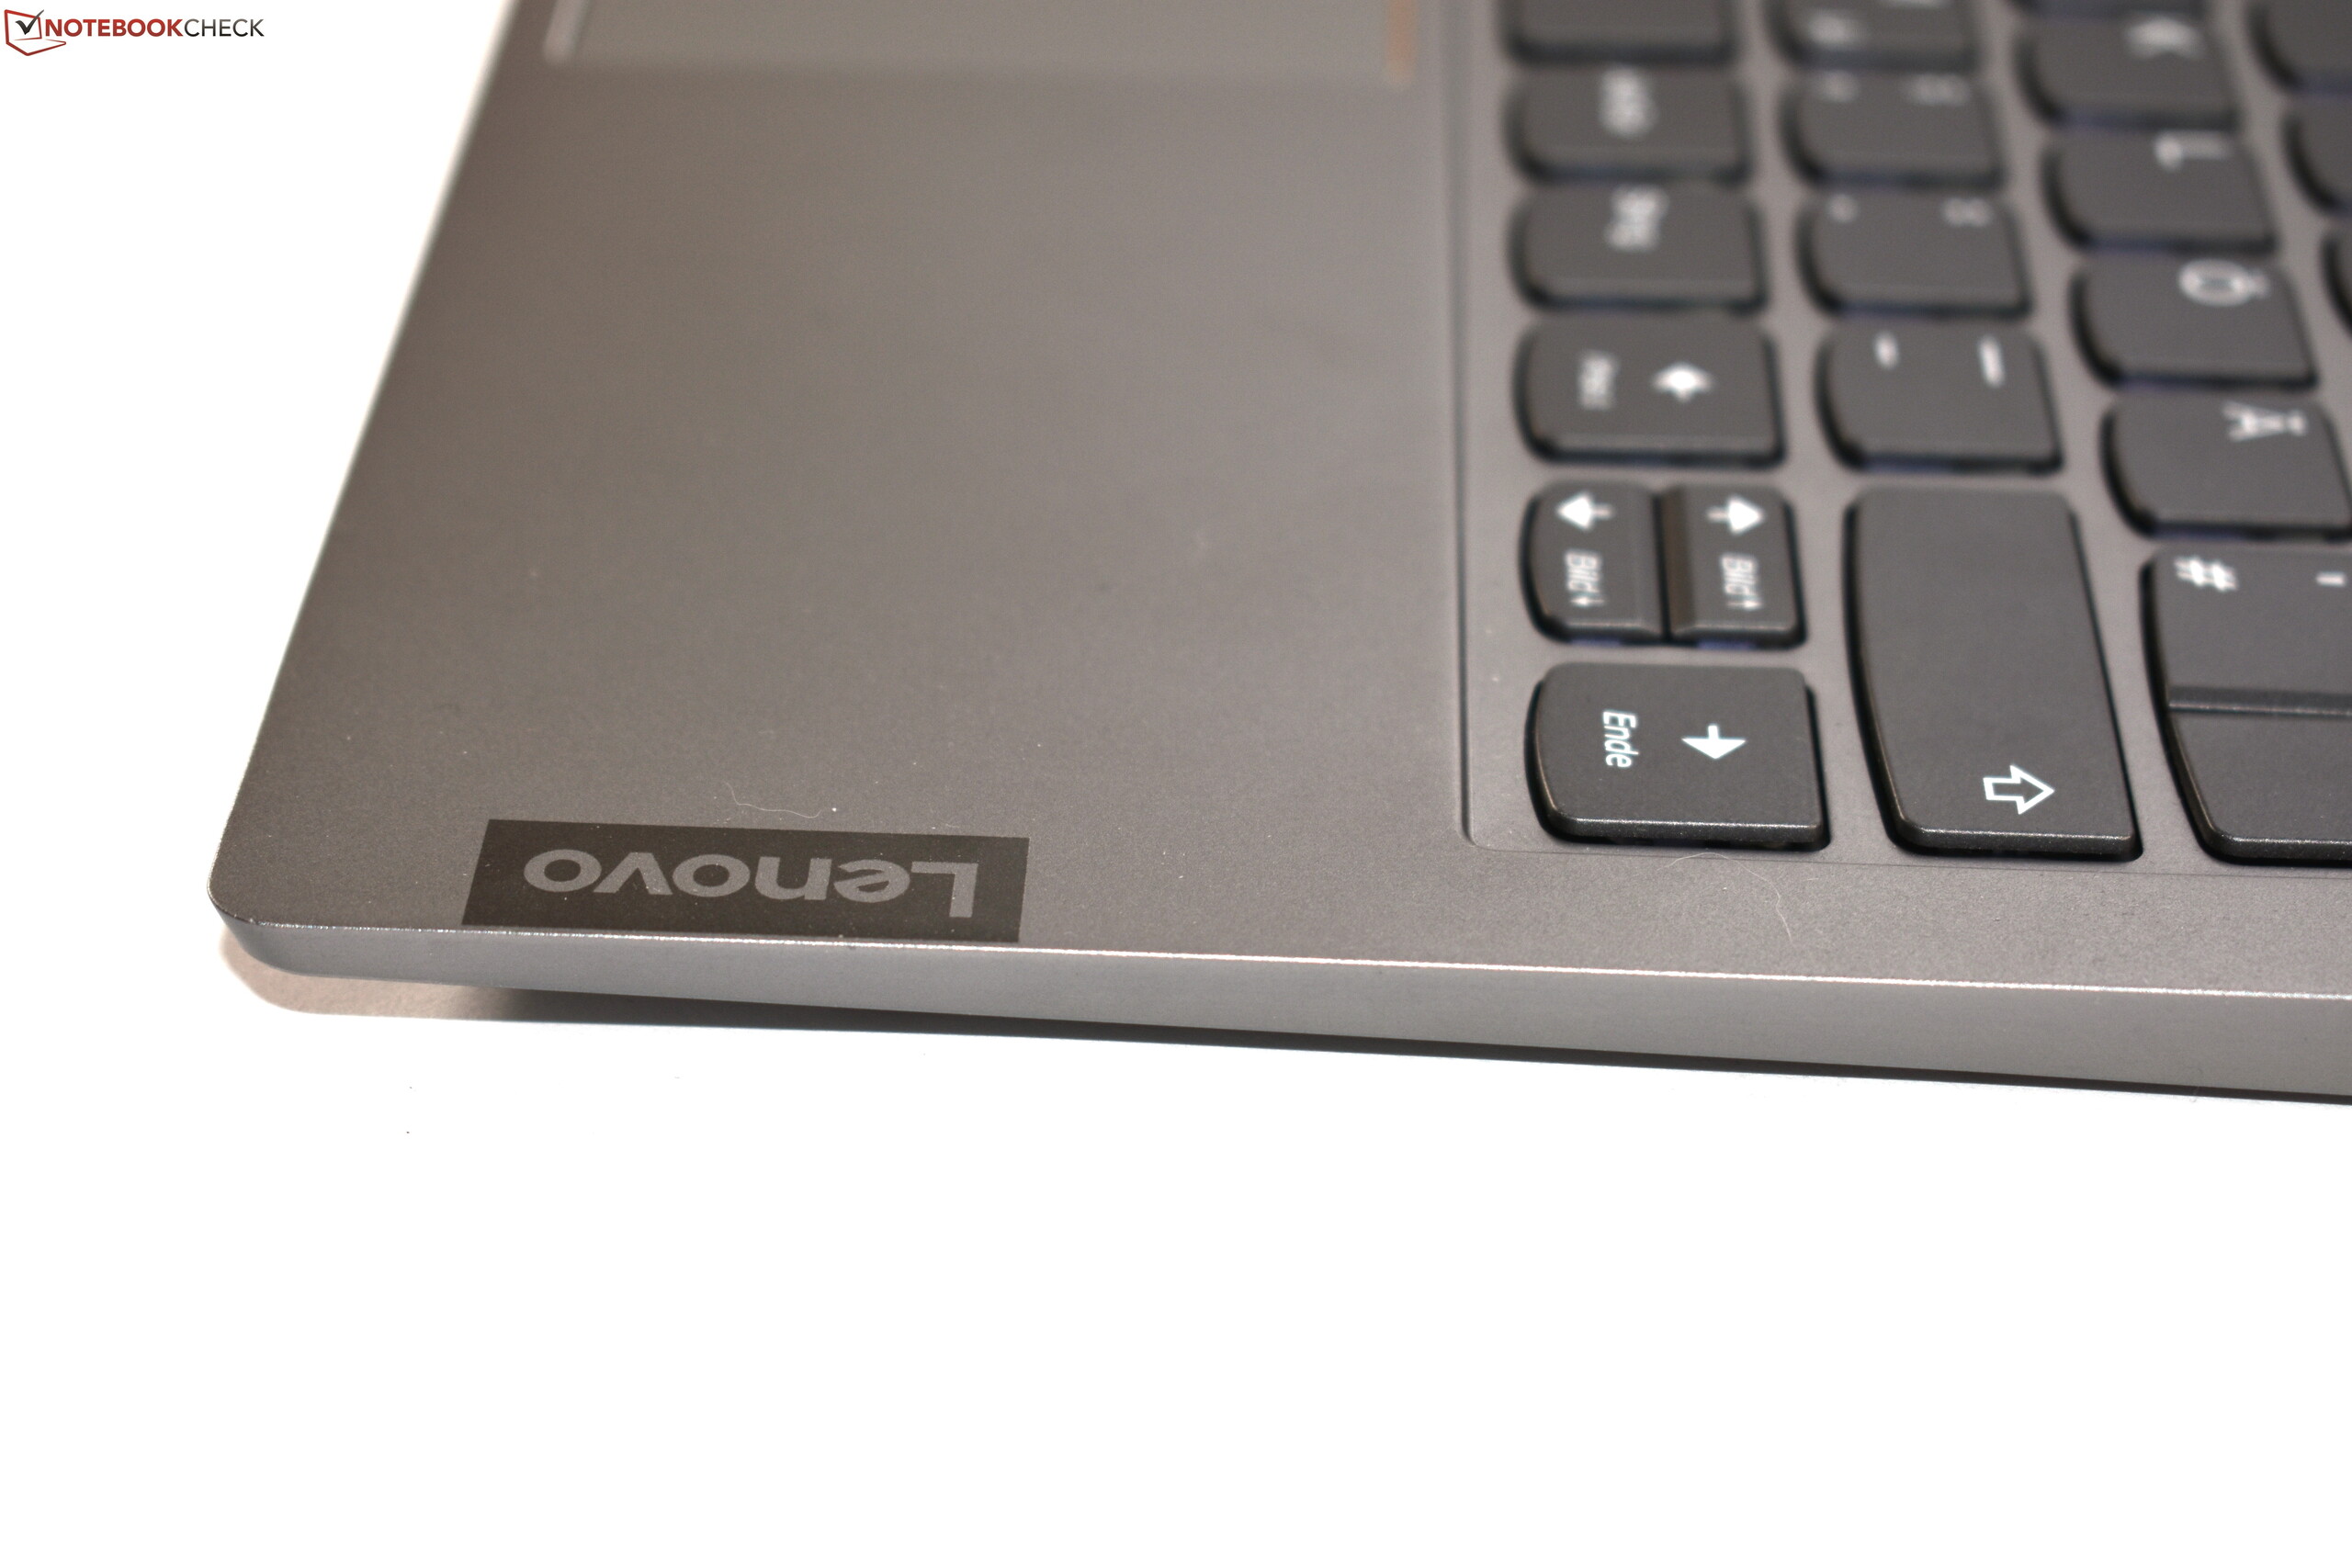
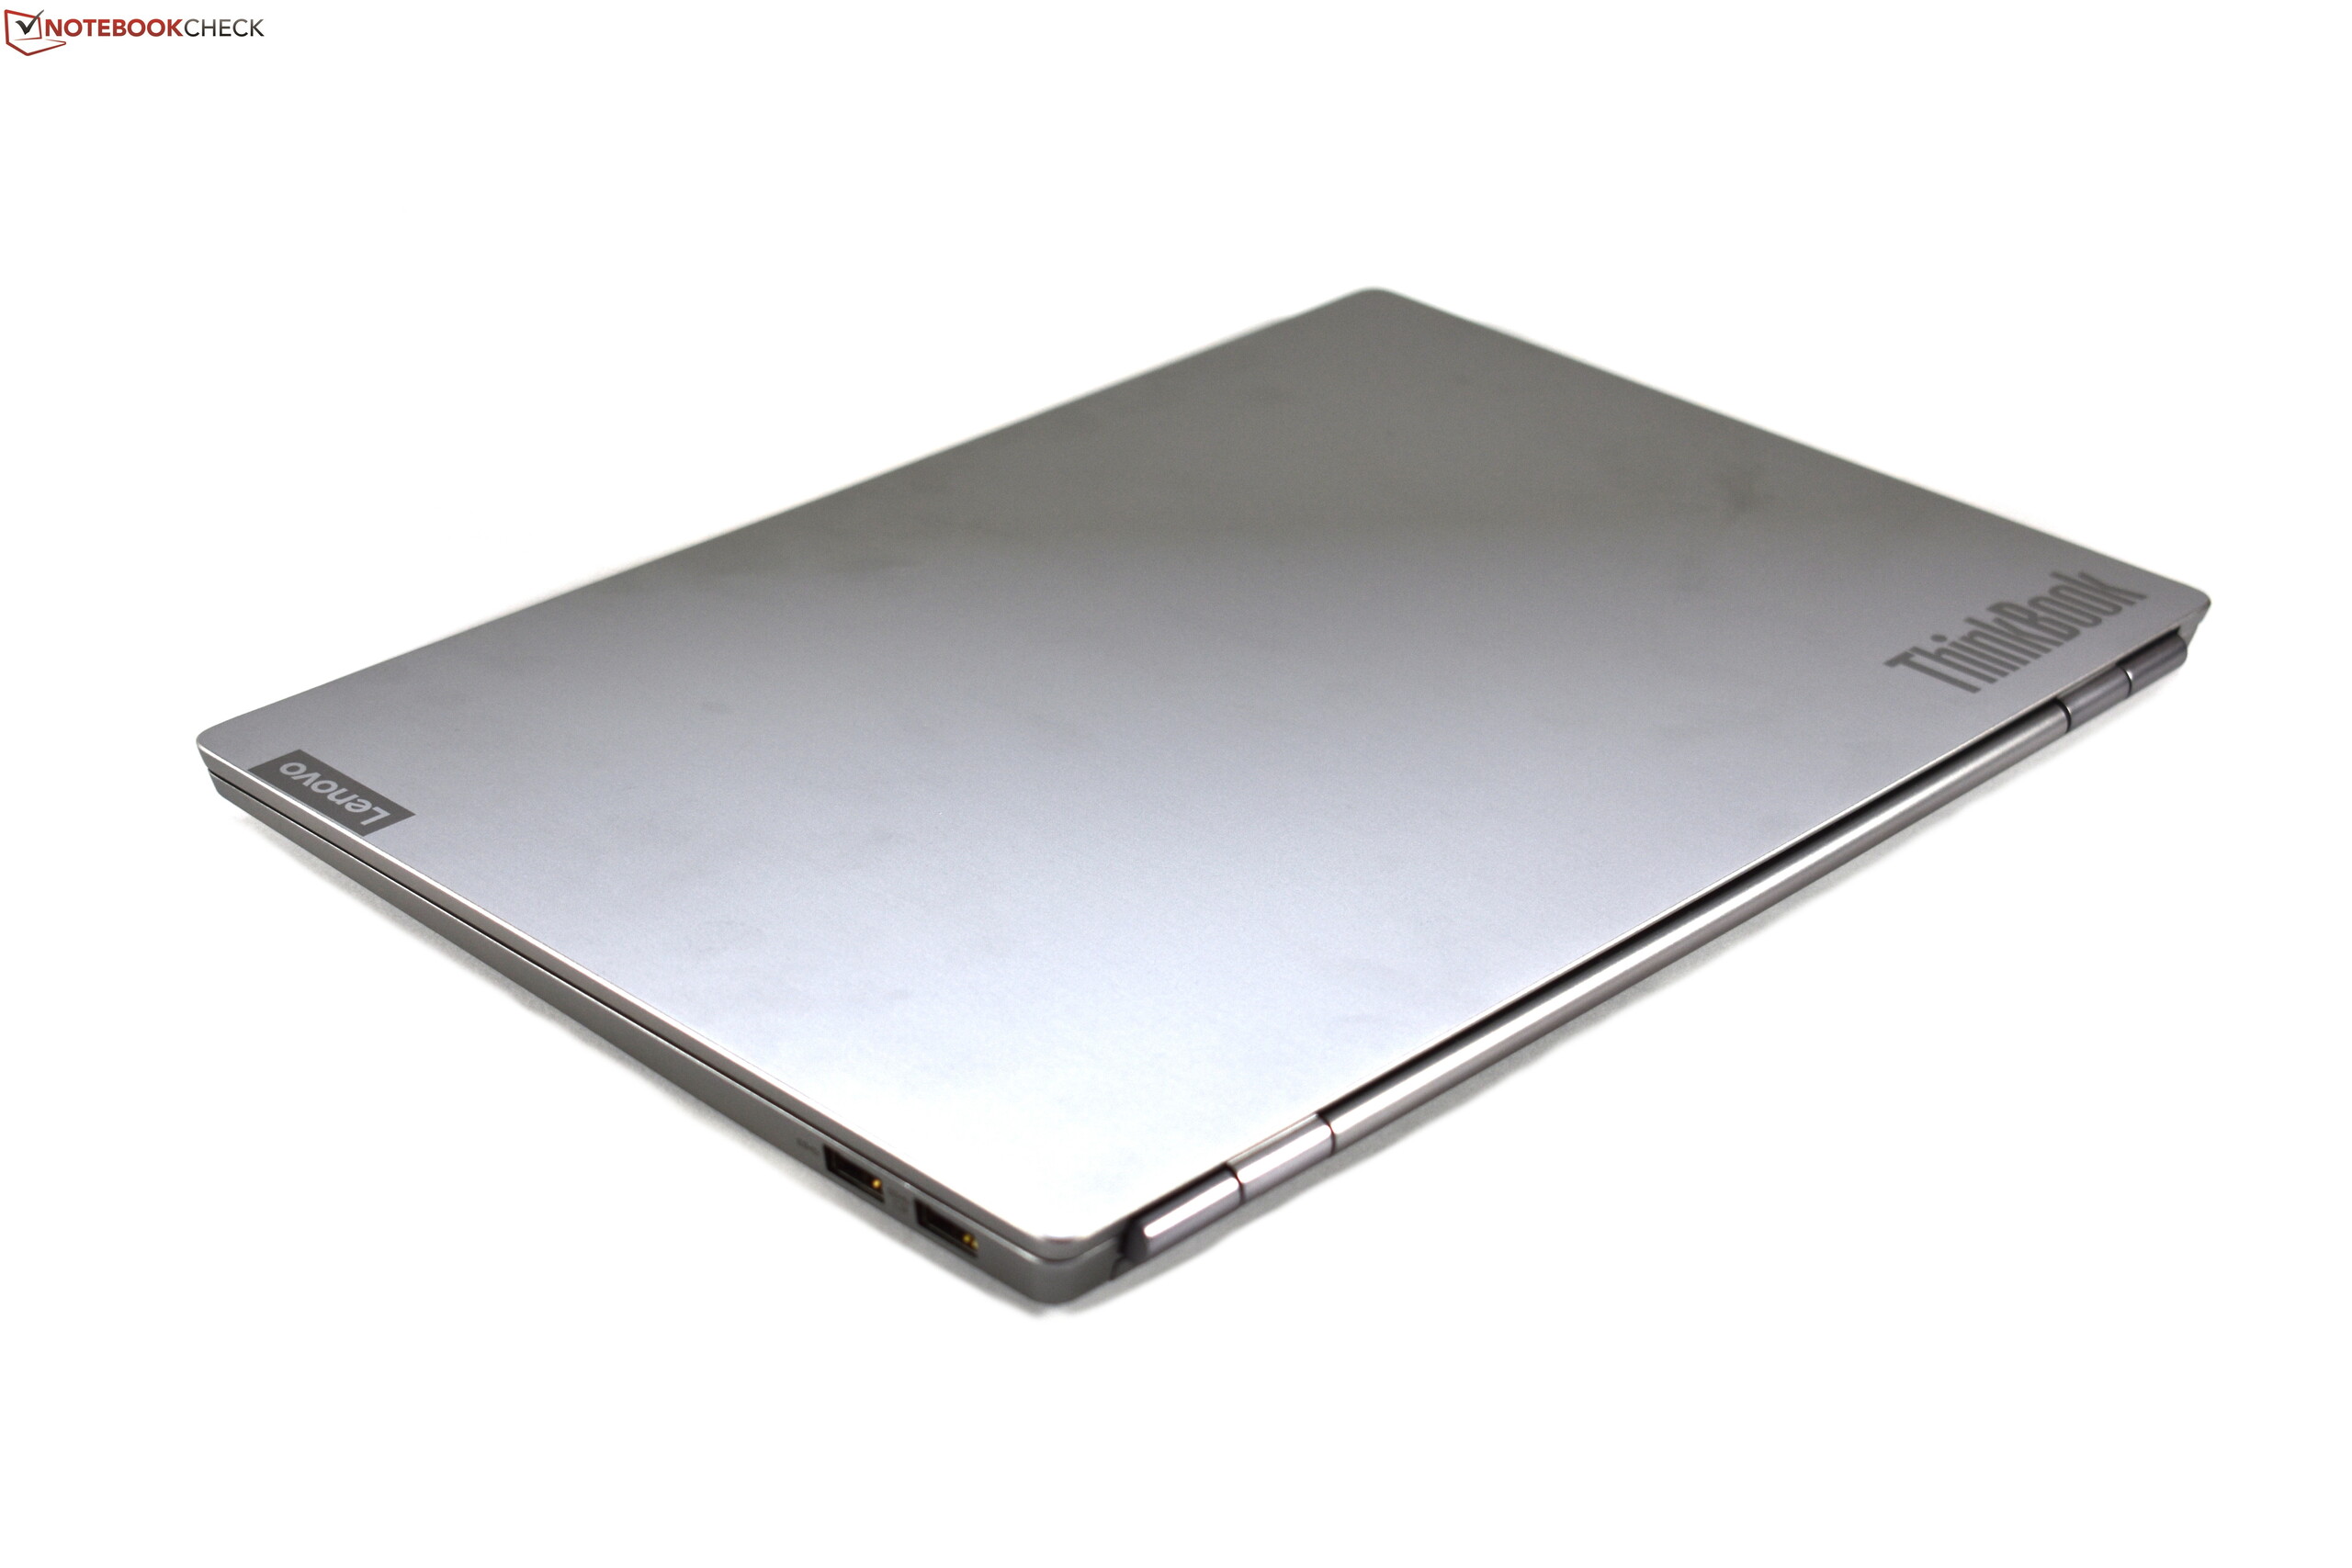
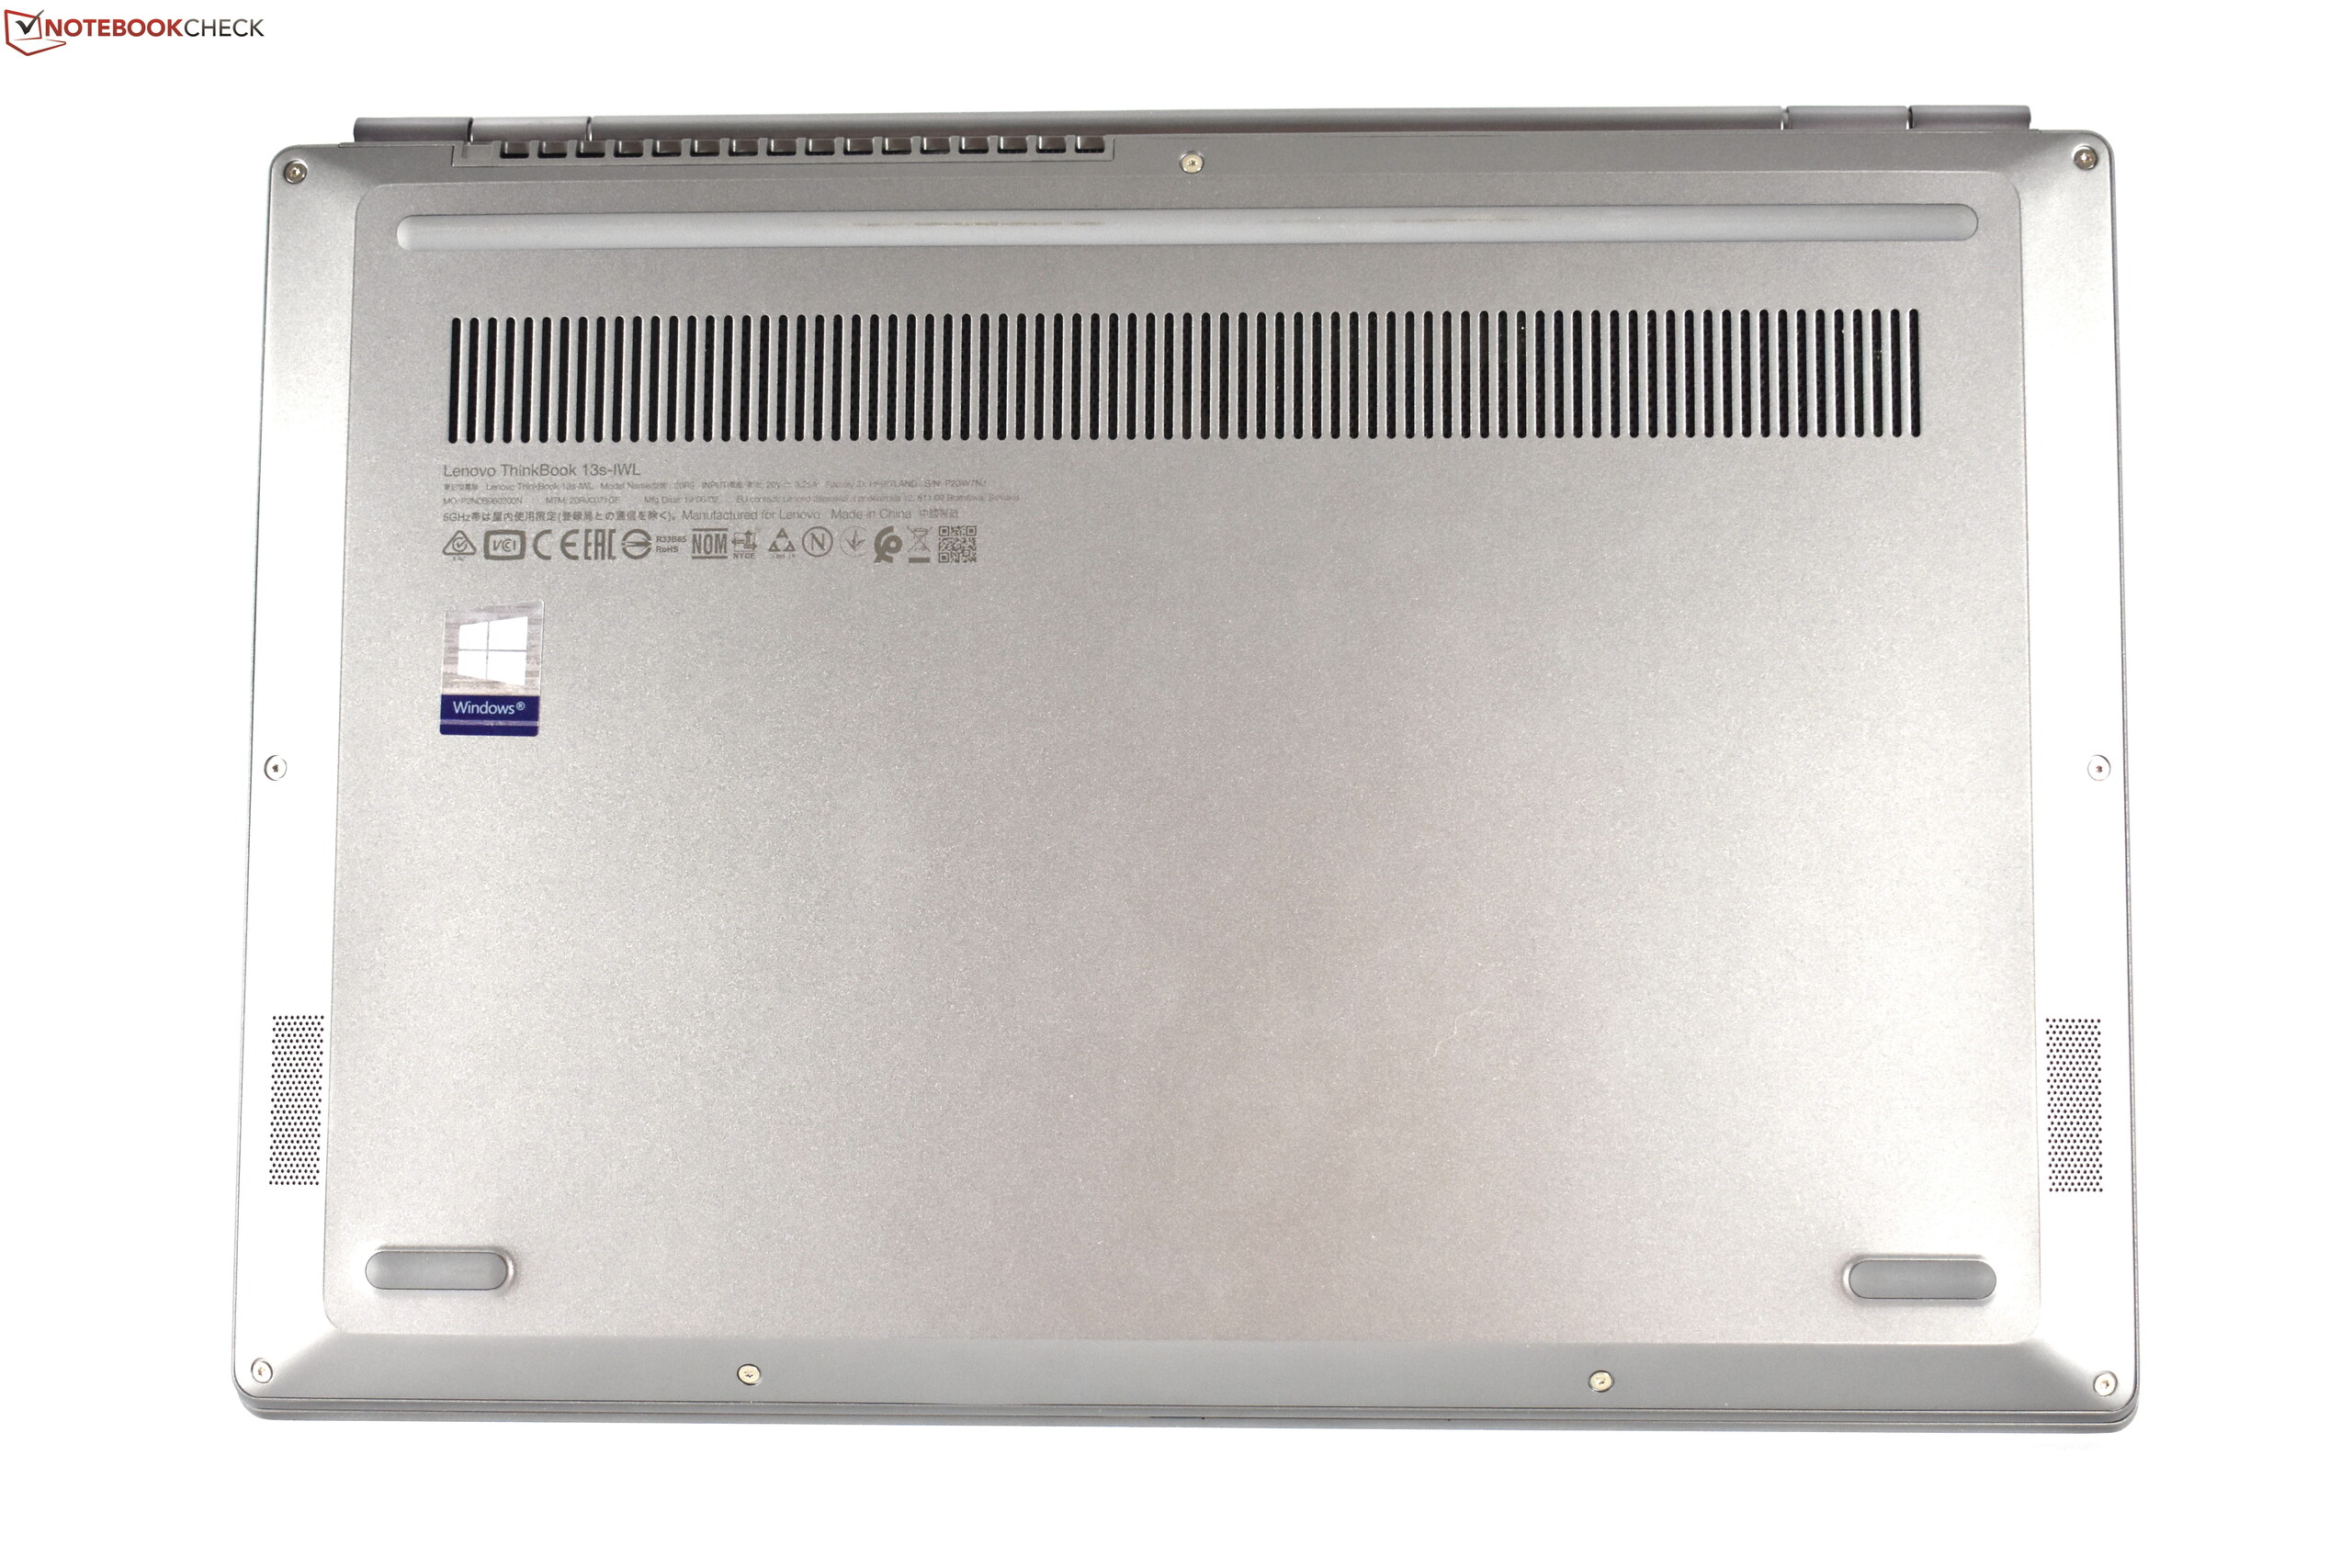
En av de tydligaste skillnaderna mellan ThinkBook 13s och dess ThinkPad-motsvarigheter är designen på höljet. Det silvergrå aluminiumhöljet känns lyxigt samtidigt som det är kompakt och lätt, även om det inte alls påminner om en modern ThinkPad. Vid det här laget är vi osäkra på om ThinkBook i förlängningen kommer visa sig vara lika robust och tålig som en ThinkPad, men en motsvarande lätt och kompakt ThinkPad är betydligt dyrare än ThinkBook 13s. Vi uppskattar dock vad Lenovo har gjort med skärmen på ThinkBook 13s: den har en matt panel som är mer ljusstark än på ThinkPad L390 samtidigt som den har bättre färgrymdstäckning. Det är dessutom trevligt med stöd för HDR. Vi kan också ge beröm för batteritiden och höljets låga yttemperaturer, precis som möjligheten att uppgradera RAM om det skulle finnas behov.
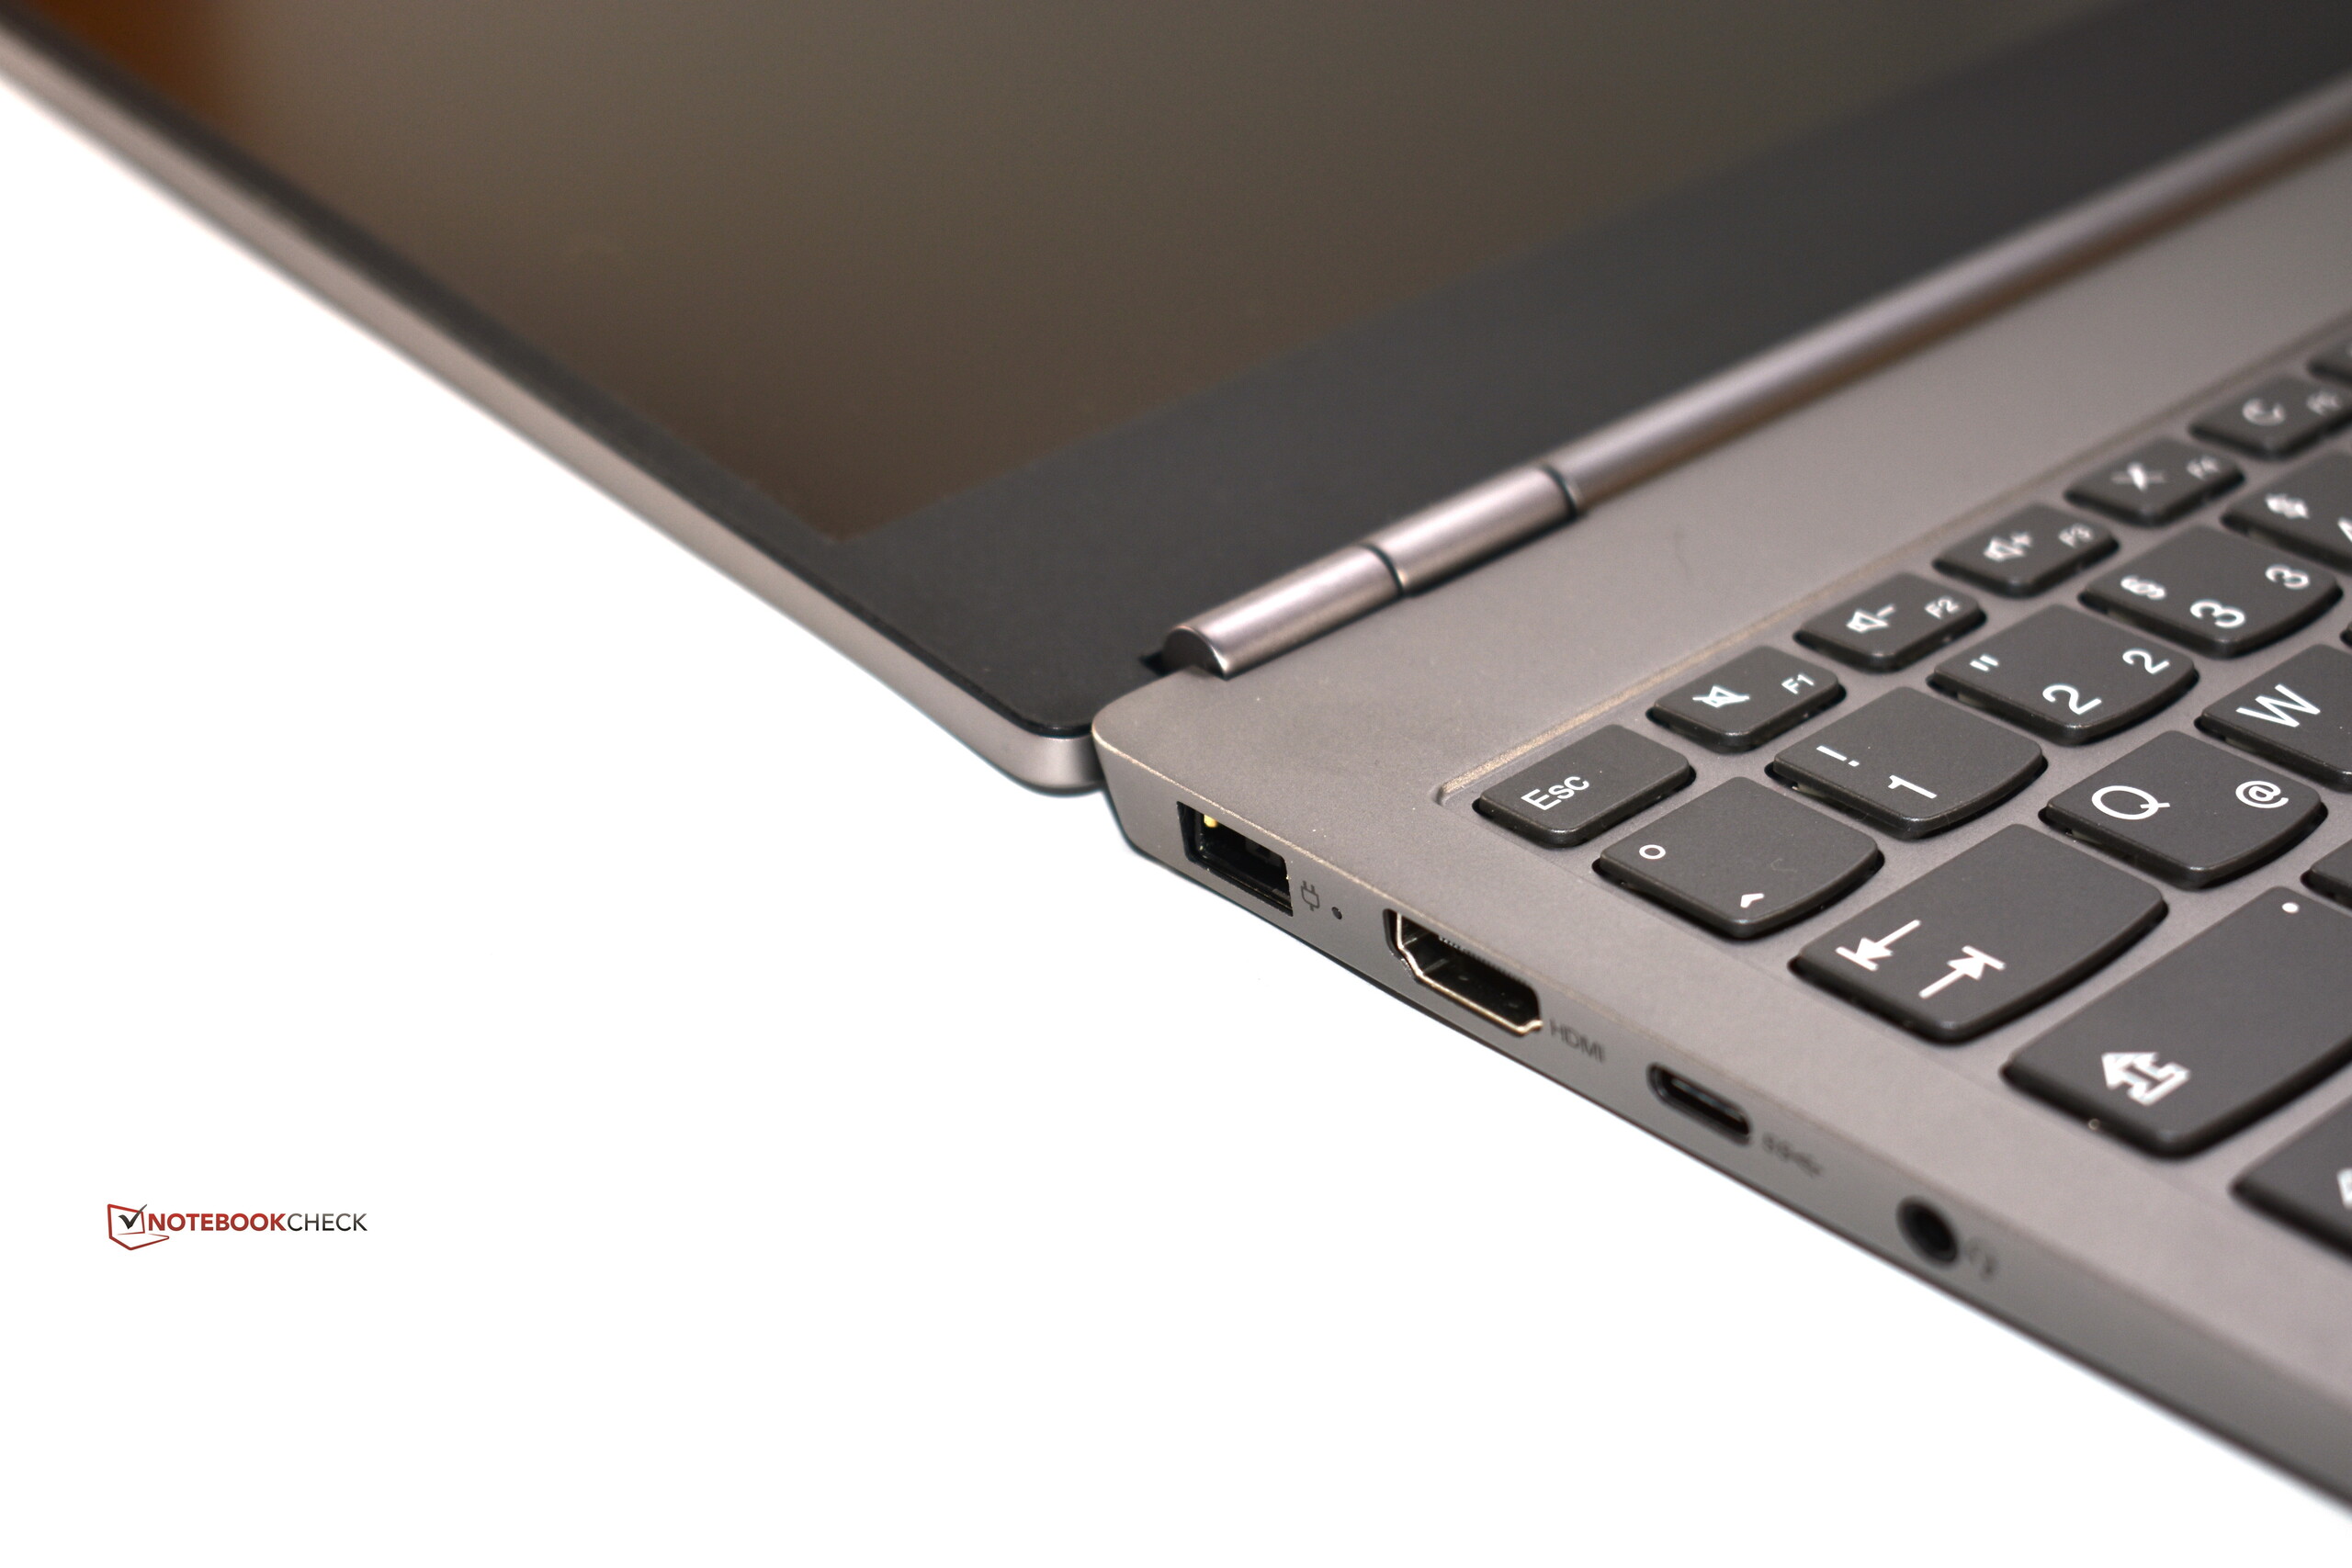
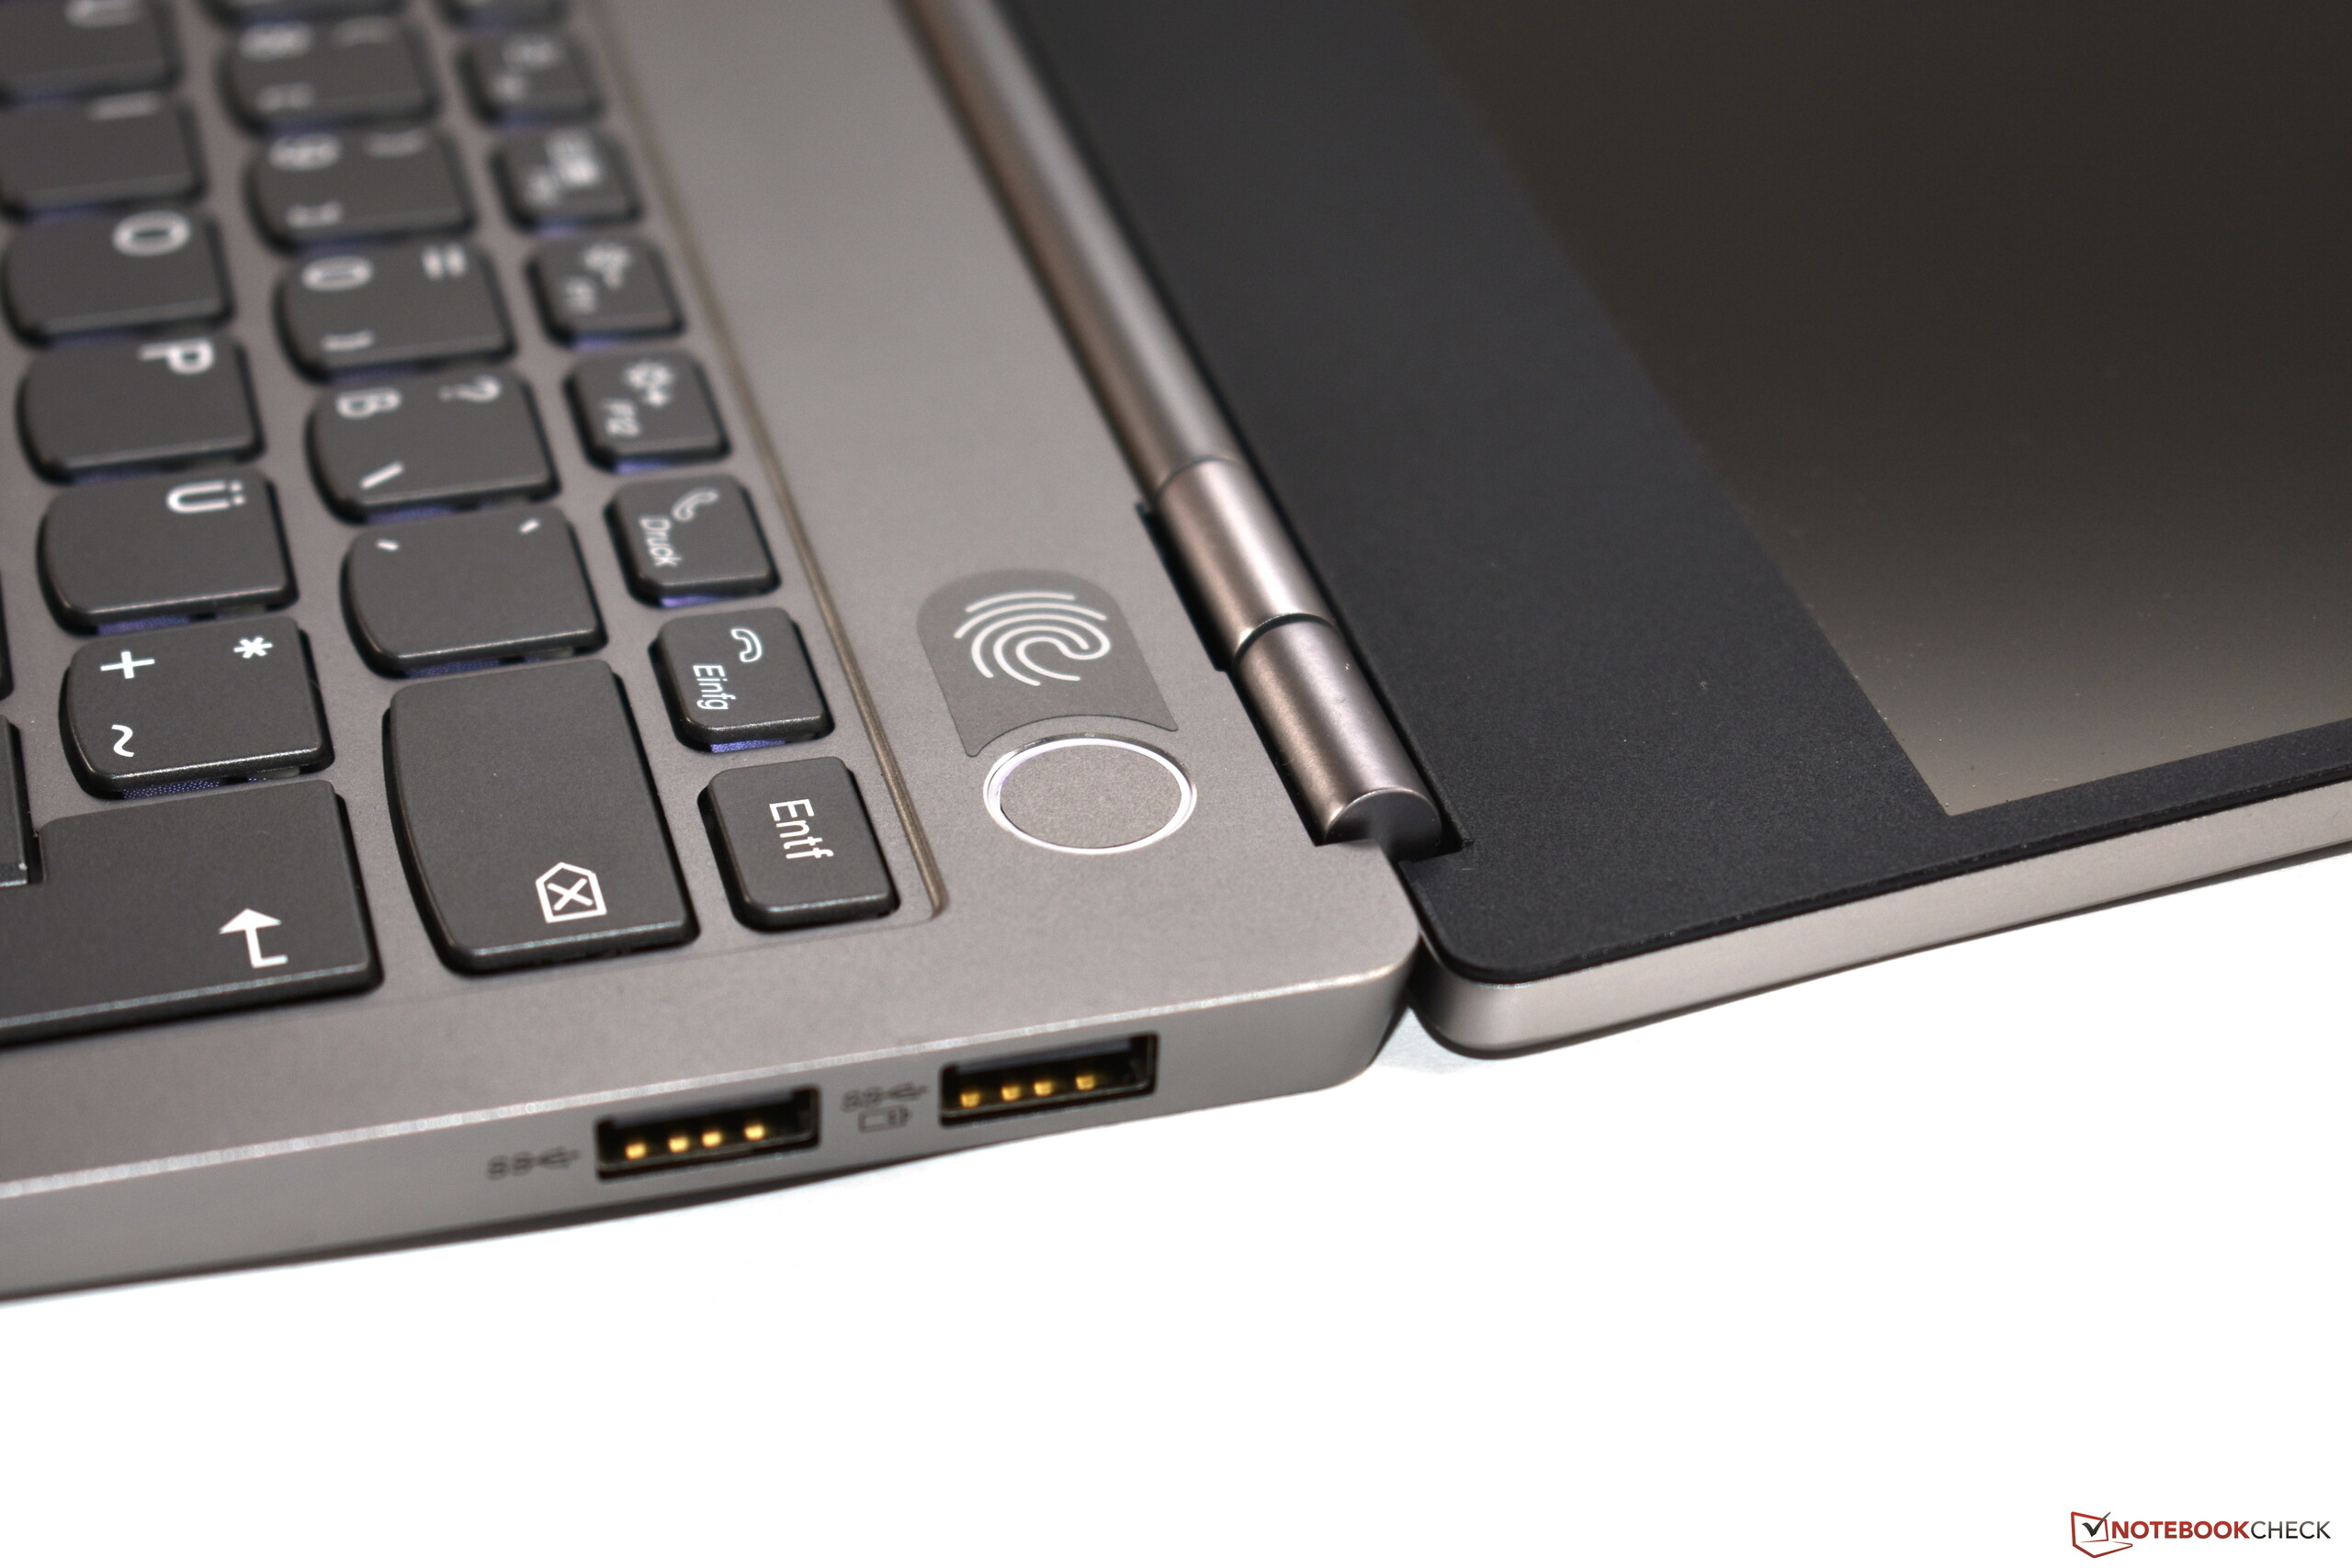
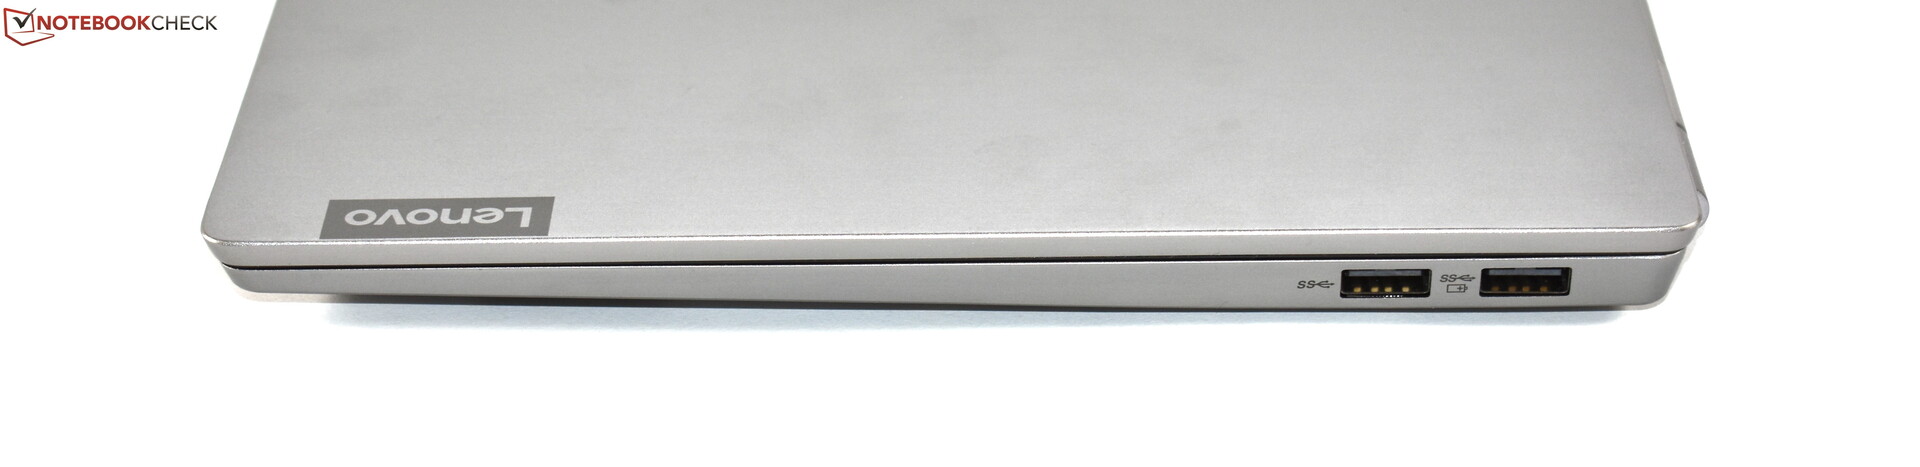
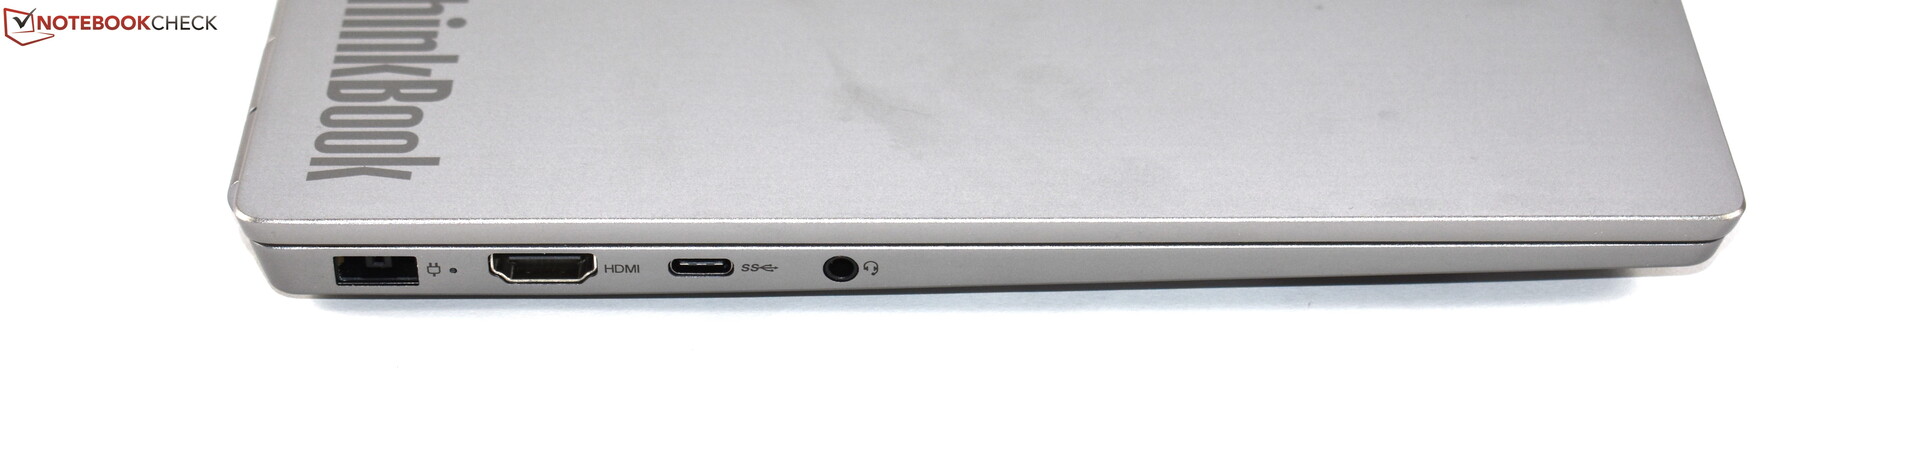
Det största problemet vi har med ThinkBook 13s är bristen på anslutningsmöjligheter. Det gäller i synnerhet säkerhets- och kommunikationsfunktionerna tillsammans med portutbudet. ThinkBook 13s kan inte tävla mot riktiga kontorslaptops i någon av de kategorierna. Även om vi inte hade förväntat oss att Lenovo skulle ha utrustat enheten med en Thunderbolt 3-port så förstår vi inte varför man inte valde att inkludera stöd för Typ C-laddning. Istället får man använda den propretiära "slim-tip"-anslutningen, som är onödigt opraktisk. Bara ett års garanti är ytterligare en röd markering i marginalen för ThinkBook 13s, vilket också gäller den stora kanten under skärmen.
IdeaPad Deluxe: ThinkBook 13s tar en del ThinkPad-funktioner som matt skärm och ThinkShutter och kombinerar dessa med IdeaPad-hårdvara. ThinkBook 13s må vara ett lockande alternativ för privatkunder, men den är inte ett alternativ till ThinkPad.
Totalt sett är Lenovo ThinkBook 13s inte en dålig laptop, men den är snarare en IdeaPad än en ThinkPad. Tangentbordet och styrplattan är bevis på det, då ThinkBook inte bara saknar en TrackPoint utan också den högkvalitativa skrivupplevelsen som vi kommit att förvänta oss av ThinkPad-modellerna. För att sammanfatta så kan ThinkBook 13s vara ett intressant alternativ till etablerade märken för privatbruk eller för studenter, men den räcker inte till om du letar efter en kontorslaptop. Med det sagt så finns det bättre bärbara datorer på 13.3 tum än ThinkBook 13s om du ändå kan klara dig utan de ThinkPad-funktioner som den saknar.
Lenovo ThinkBook 13s-20R90071GE
- 09/26/2019 v7 (old)
Benjamin Herzig
Price comparison
