Test: Asus VivoBook S13 S333JA - Utmärkt skärm till lågt pris (Sammanfattning)
Testgrupp
Gradering | Datum | Modell | Vikt | Höjd | Storlek | Upplösning | Pris |
|---|---|---|---|---|---|---|---|
| 82.3 % v7 (old) | 04/2021 | Asus VivoBook S13 S333JA-DS51 i5-1035G1, UHD Graphics G1 (Ice Lake 32 EU) | 1.2 kg | 14.9 mm | 13.30" | 1920x1080 | |
| 85 % v6 (old) | 05/2019 | Asus VivoBook S13 S330UA-EY034T i5-8550U, UHD Graphics 620 | 1.2 kg | 17.9 mm | 13.30" | 1920x1080 | |
| 85 % v7 (old) | Lenovo IdeaPad S540-13ARE-82DL000YGE R5 4600U, Vega 6 | 1.3 kg | 15.95 mm | 13.30" | 2560x1600 | ||
| 88.1 % v7 (old) | 12/2020 | Dell XPS 13 9310 Core i7 FHD i7-1165G7, Iris Xe G7 96EUs | 1.3 kg | 14.8 mm | 13.40" | 1920x1200 | |
| 81.5 % v7 (old) | 12/2020 | HP Pavilion 13-bb0015cl i7-1165G7, Iris Xe G7 96EUs | 1.2 kg | 17.7 mm | 13.30" | 3840x2160 | |
| 87.5 % v7 (old) | 08/2020 | Asus ZenBook 13 UX325JA i7-1065G7, Iris Plus Graphics G7 (Ice Lake 64 EU) | 1.1 kg | 13.9 mm | 13.30" | 1920x1080 |
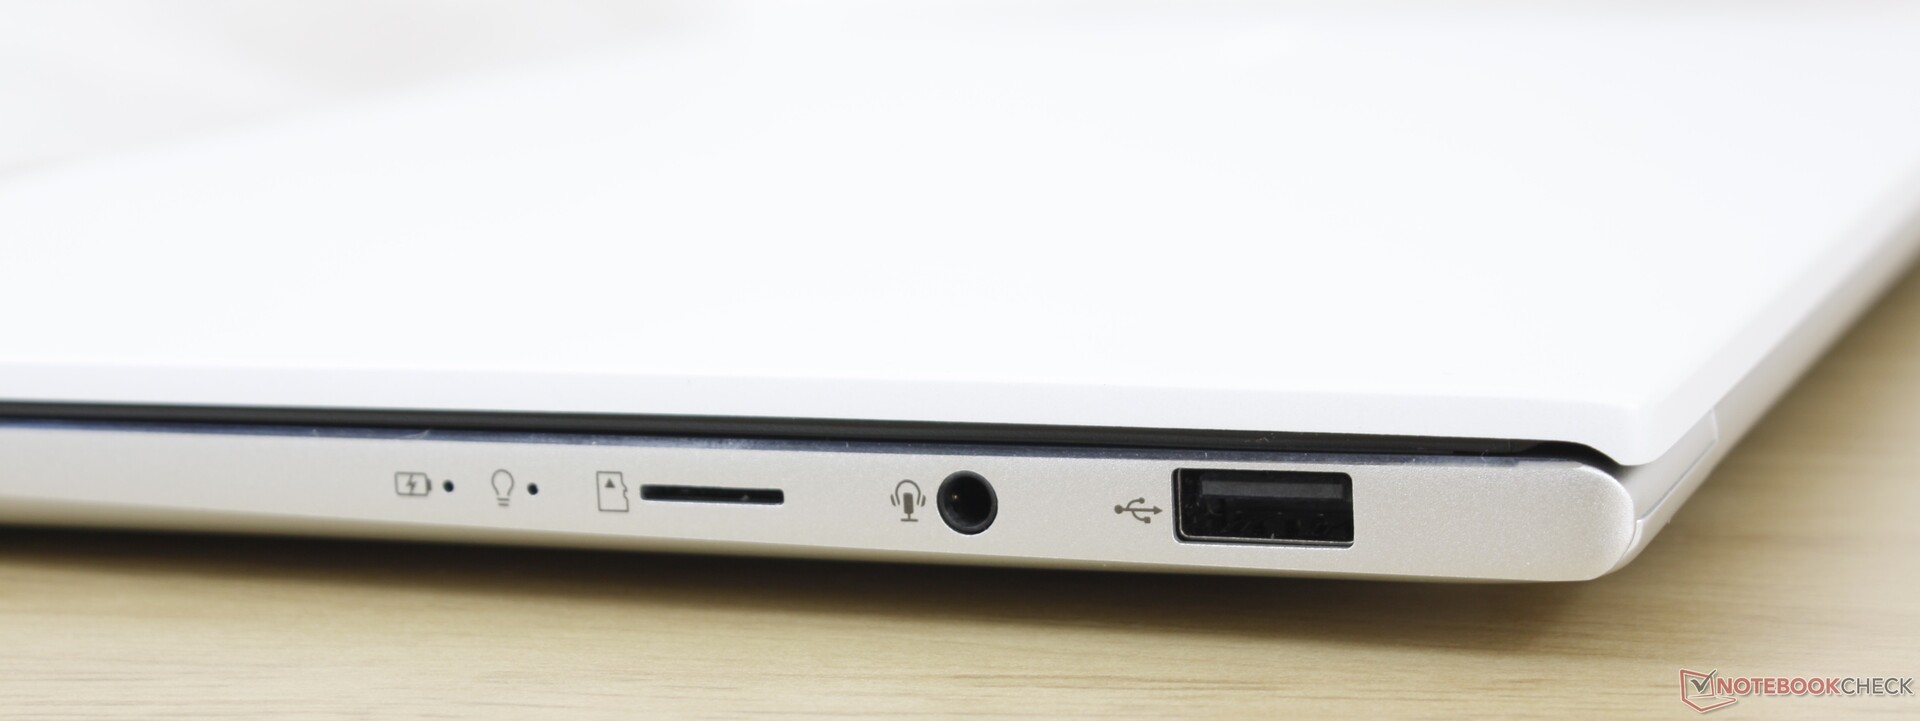
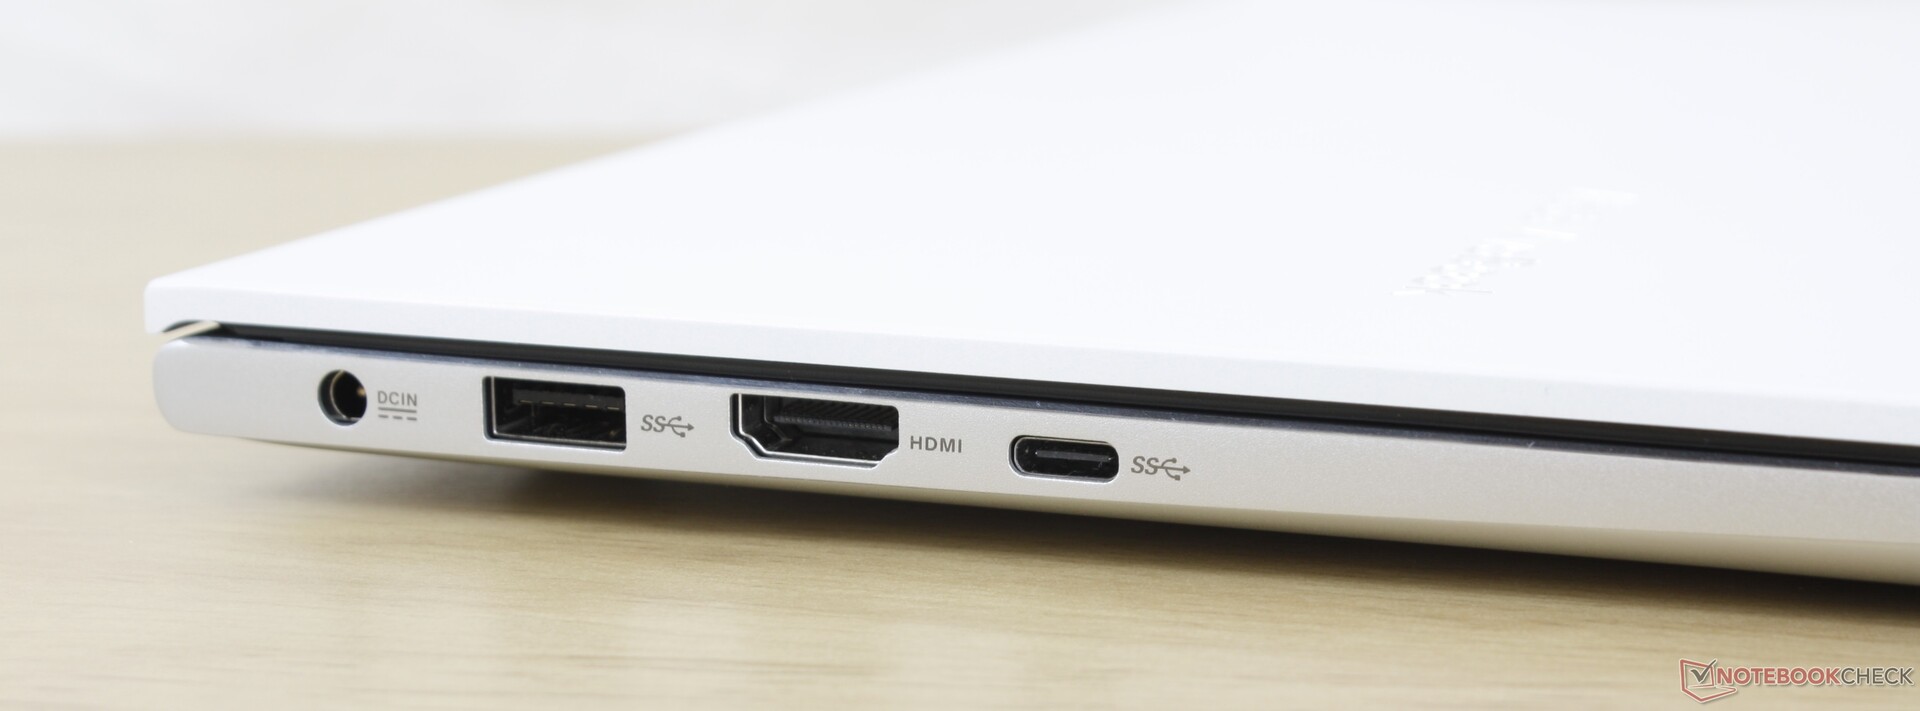
| SD Card Reader | |
| average JPG Copy Test (av. of 3 runs) | |
| Dell XPS 13 9310 Core i7 FHD (Toshiba Exceria Pro M501 64 GB UHS-II) | |
| HP Pavilion 13-bb0015cl (Toshiba Exceria Pro M501 32 GB UHS-II) | |
| Asus ZenBook 13 UX325JA (Toshiba Exceria Pro M501 microSDXC 64GB) | |
| Asus VivoBook S13 S330UA-EY034T (Toshiba Exceria Pro M501 64 GB UHS-II) | |
| Asus VivoBook S13 S333JA-DS51 (Angelbird 128GB AV Pro UHS-II) | |
| maximum AS SSD Seq Read Test (1GB) | |
| Dell XPS 13 9310 Core i7 FHD (Toshiba Exceria Pro M501 64 GB UHS-II) | |
| HP Pavilion 13-bb0015cl (Toshiba Exceria Pro M501 32 GB UHS-II) | |
| Asus ZenBook 13 UX325JA (Toshiba Exceria Pro M501 microSDXC 64GB) | |
| Asus VivoBook S13 S330UA-EY034T (Toshiba Exceria Pro M501 64 GB UHS-II) | |
| Asus VivoBook S13 S333JA-DS51 (Angelbird 128GB AV Pro UHS-II) | |
| Networking | |
| iperf3 transmit AX12 | |
| Asus ZenBook 13 UX325JA | |
| HP Pavilion 13-bb0015cl | |
| Asus VivoBook S13 S333JA-DS51 | |
| Dell XPS 13 9310 Core i7 FHD | |
| Asus VivoBook S13 S330UA-EY034T | |
| Lenovo IdeaPad S540-13ARE-82DL000YGE | |
| iperf3 receive AX12 | |
| Dell XPS 13 9310 Core i7 FHD | |
| HP Pavilion 13-bb0015cl | |
| Asus VivoBook S13 S333JA-DS51 | |
| Asus ZenBook 13 UX325JA | |
| Lenovo IdeaPad S540-13ARE-82DL000YGE | |
| Asus VivoBook S13 S330UA-EY034T | |

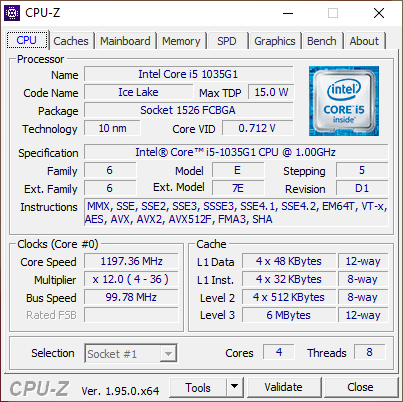
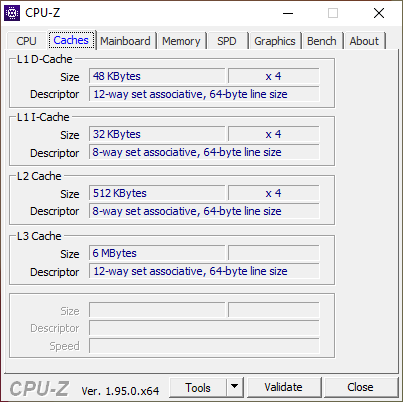
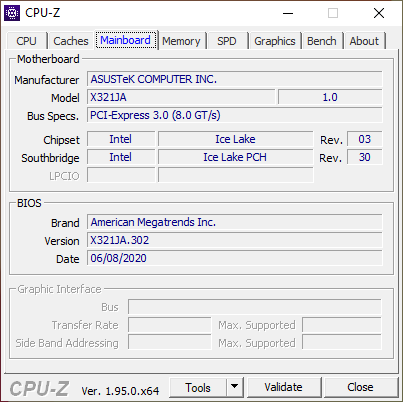
, i5-1035G1, Intel SSD 660p SSDPEKNW512G8")
, i5-1035G1, Intel SSD 660p SSDPEKNW512G8")
| |||||||||||||||||||||||||
Distribution av ljusstyrkan: 87 %
Mitt på batteriet: 313.4 cd/m²
Kontrast: 1649:1 (Svärta: 0.19 cd/m²)
ΔE ColorChecker Calman: 2.91 | ∀{0.5-29.43 Ø4.71}
calibrated: 1.45
ΔE Greyscale Calman: 4.2 | ∀{0.09-98 Ø4.96}
97.8% sRGB (Argyll 1.6.3 3D)
61.9% AdobeRGB 1998 (Argyll 1.6.3 3D)
67.3% AdobeRGB 1998 (Argyll 3D)
97.6% sRGB (Argyll 3D)
65.5% Display P3 (Argyll 3D)
Gamma: 2.09
CCT: 7368 K
| Asus VivoBook S13 S333JA-DS51 Chi Mei N133HCE-EN2, IPS, 13.3", 1920x1080 | Asus VivoBook S13 S330UA-EY034T N133HCE-EAA, IPS LED, 13.3", 1920x1080 | Lenovo IdeaPad S540-13ARE-82DL000YGE Chi Mei CMN13B0 (N133GCA-GQ1), IPS, 13.3", 2560x1600 | Dell XPS 13 9310 Core i7 FHD Sharp LQ134N1, IPS, 13.4", 1920x1200 | HP Pavilion 13-bb0015cl AUOCA8D, IPS, 13.3", 3840x2160 | Asus ZenBook 13 UX325JA Sharp LQ133M1JW40, IPS, 13.3", 1920x1080 | |
|---|---|---|---|---|---|---|
| Display | -35% | -2% | 6% | -2% | -3% | |
| Display P3 Coverage (%) | 65.5 | 42.16 -36% | 64.2 -2% | 70.9 8% | 65 -1% | 63.8 -3% |
| sRGB Coverage (%) | 97.6 | 63.2 -35% | 95.7 -2% | 99.1 2% | 93.4 -4% | 94.5 -3% |
| AdobeRGB 1998 Coverage (%) | 67.3 | 43.59 -35% | 66 -2% | 72.9 8% | 66.5 -1% | 64.9 -4% |
| Response Times | -16% | 8% | -39% | -56% | -8% | |
| Response Time Grey 50% / Grey 80% * (ms) | 35.6 ? | 40.8 ? -15% | 33 ? 7% | 52 ? -46% | 52.4 ? -47% | 47 ? -32% |
| Response Time Black / White * (ms) | 25.2 ? | 29.6 ? -17% | 23 ? 9% | 33.2 ? -32% | 41.6 ? -65% | 21 ? 17% |
| PWM Frequency (Hz) | 26040 ? | 26040 ? | 2475 ? | 250 ? | ||
| Screen | -57% | -10% | 3% | -9% | -10% | |
| Brightness middle (cd/m²) | 313.4 | 280 -11% | 321 2% | 543.3 73% | 514.1 64% | 435 39% |
| Brightness (cd/m²) | 298 | 265 -11% | 304 2% | 524 76% | 501 68% | 404 36% |
| Brightness Distribution (%) | 87 | 89 2% | 88 1% | 92 6% | 91 5% | 83 -5% |
| Black Level * (cd/m²) | 0.19 | 0.24 -26% | 0.32 -68% | 0.38 -100% | 0.37 -95% | 0.565 -197% |
| Contrast (:1) | 1649 | 1167 -29% | 1003 -39% | 1430 -13% | 1389 -16% | 770 -53% |
| Colorchecker dE 2000 * | 2.91 | 5.6 -92% | 3.41 -17% | 3.02 -4% | 4.35 -49% | 2.66 9% |
| Colorchecker dE 2000 max. * | 7.06 | 20.7 -193% | 7.61 -8% | 6.5 8% | 4.73 33% | |
| Colorchecker dE 2000 calibrated * | 1.45 | 4.3 -197% | 0.66 54% | 1.23 15% | 2.26 -56% | 1.19 18% |
| Greyscale dE 2000 * | 4.2 | 4.1 2% | 5.54 -32% | 5 -19% | 5.2 -24% | 3.65 13% |
| Gamma | 2.09 105% | 2.44 90% | 2.33 94% | 2.02 109% | 2.12 104% | 2.34 94% |
| CCT | 7368 88% | 6614 98% | 6476 100% | 6550 99% | 6308 103% | 7109 91% |
| Color Space (Percent of AdobeRGB 1998) (%) | 61.9 | 40.1 -35% | 61 -1% | 66.8 8% | 60.6 -2% | 60 -3% |
| Color Space (Percent of sRGB) (%) | 97.8 | 63 -36% | 96 -2% | 99.6 2% | 93.3 -5% | 95 -3% |
| Totalt genomsnitt (program/inställningar) | -36% /
-48% | -1% /
-6% | -10% /
-2% | -22% /
-14% | -7% /
-9% |
* ... mindre är bättre
Visa svarstider
| ↔ Svarstid svart till vitt | ||
|---|---|---|
| 25.2 ms ... stiga ↗ och falla ↘ kombinerat | ↗ 16 ms stiga | 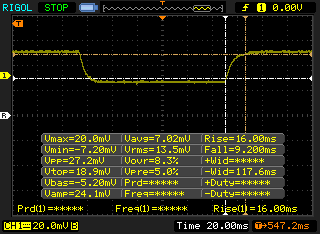 |
| ↘ 9.2 ms hösten | ||
| Skärmen visar relativt långsamma svarsfrekvenser i våra tester och kan vara för långsam för spelare. I jämförelse sträcker sig alla testade enheter från 0.1 (minst) till 240 (maximalt) ms. » 61 % av alla enheter är bättre. Detta innebär att den uppmätta svarstiden är sämre än genomsnittet av alla testade enheter (19.8 ms). | ||
| ↔ Svarstid 50 % grått till 80 % grått | ||
| 35.6 ms ... stiga ↗ och falla ↘ kombinerat | ↗ 18 ms stiga | 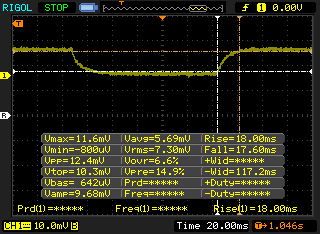 |
| ↘ 17.6 ms hösten | ||
| Skärmen visar långsamma svarsfrekvenser i våra tester och kommer att vara otillfredsställande för spelare. I jämförelse sträcker sig alla testade enheter från 0.165 (minst) till 636 (maximalt) ms. » 50 % av alla enheter är bättre. Detta innebär att den uppmätta svarstiden är sämre än genomsnittet av alla testade enheter (31 ms). | ||
Skärmflimmer / PWM (Puls-Width Modulation)
| Skärmflimmer / PWM upptäckt | 26040 Hz | ≤ 29 % ljusstyrka inställning | 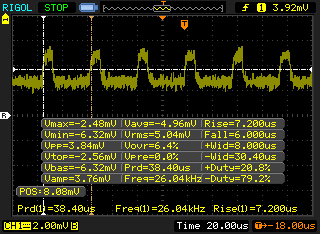 |
Displayens bakgrundsbelysning flimrar vid 26040 Hz (i värsta fall, t.ex. med PWM) Flimrande upptäckt vid en ljusstyrkeinställning på 29 % och lägre. Det ska inte finnas något flimmer eller PWM över denna ljusstyrkeinställning. Frekvensen för 26040 Hz är ganska hög, så de flesta användare som är känsliga för PWM bör inte märka något flimmer. Som jämförelse: 52 % av alla testade enheter använder inte PWM för att dämpa skärmen. Om PWM upptäcktes mättes ett medelvärde av 7754 (minst: 5 - maximum: 343500) Hz. | |||
Cinebench R15: CPU Multi 64Bit | CPU Single 64Bit
Blender: v2.79 BMW27 CPU
7-Zip 18.03: 7z b 4 -mmt1 | 7z b 4
Geekbench 5.5: Single-Core | Multi-Core
HWBOT x265 Benchmark v2.2: 4k Preset
LibreOffice : 20 Documents To PDF
R Benchmark 2.5: Overall mean
| Cinebench R20 / CPU (Multi Core) | |
| Asus VivoBook Flip 14 TM420IA | |
| Honor MagicBook 14, Ryzen 5 4500U | |
| HP Envy x360 13-ay0010nr | |
| Lenovo Yoga Slim 7i Carbon 13 ITL | |
| Asus VivoBook S13 S333JA-DS51 | |
| Lenovo ThinkPad L13 Gen2-20VH0017GE | |
| Lenovo ThinkPad L13 Gen2-20VH0017GE | |
| Genomsnitt Intel Core i5-1035G1 (1178 - 1873, n=7) | |
| Asus ZenBook 13 UX325JA | |
| HP Envy 13-ba0001ng | |
| HP Envy 13-aq0003ng | |
| Dell Latitude 13 3390 | |
| Dell XPS 13 7390 2-in-1 Core i3 | |
| Cinebench R20 / CPU (Single Core) | |
| Lenovo Yoga Slim 7i Carbon 13 ITL | |
| Lenovo ThinkPad L13 Gen2-20VH0017GE | |
| Lenovo ThinkPad L13 Gen2-20VH0017GE | |
| Asus VivoBook Flip 14 TM420IA | |
| Asus ZenBook 13 UX325JA | |
| Honor MagicBook 14, Ryzen 5 4500U | |
| HP Envy 13-ba0001ng | |
| HP Envy x360 13-ay0010nr | |
| Genomsnitt Intel Core i5-1035G1 (382 - 431, n=7) | |
| Dell XPS 13 7390 2-in-1 Core i3 | |
| Asus VivoBook S13 S333JA-DS51 | |
| HP Envy 13-aq0003ng | |
| Dell Latitude 13 3390 | |
| Blender / v2.79 BMW27 CPU | |
| Dell XPS 13 7390 2-in-1 Core i3 | |
| Dell Latitude 13 3390 | |
| Asus ZenBook 13 UX325JA | |
| HP Envy 13-ba0001ng | |
| Genomsnitt Intel Core i5-1035G1 (607 - 1002, n=9) | |
| Lenovo ThinkPad L13 Gen2-20VH0017GE | |
| Lenovo ThinkPad L13 Gen2-20VH0017GE | |
| Asus VivoBook S13 S333JA-DS51 | |
| Lenovo Yoga Slim 7i Carbon 13 ITL | |
| HP Envy x360 13-ay0010nr | |
| Honor MagicBook 14, Ryzen 5 4500U | |
| Asus VivoBook Flip 14 TM420IA | |
| 7-Zip 18.03 / 7z b 4 -mmt1 | |
| Lenovo Yoga Slim 7i Carbon 13 ITL | |
| Lenovo ThinkPad L13 Gen2-20VH0017GE | |
| Lenovo ThinkPad L13 Gen2-20VH0017GE | |
| HP Envy 13-ba0001ng | |
| Asus VivoBook Flip 14 TM420IA | |
| Asus ZenBook 13 UX325JA | |
| HP Envy x360 13-ay0010nr | |
| Honor MagicBook 14, Ryzen 5 4500U | |
| Genomsnitt Intel Core i5-1035G1 (3739 - 4318, n=8) | |
| Dell XPS 13 7390 2-in-1 Core i3 | |
| Asus VivoBook S13 S333JA-DS51 | |
| Dell Latitude 13 3390 | |
| Geekbench 5.5 / Single-Core | |
| Lenovo Yoga Slim 7i Carbon 13 ITL | |
| Lenovo ThinkPad L13 Gen2-20VH0017GE | |
| Lenovo ThinkPad L13 Gen2-20VH0017GE | |
| Asus ZenBook 13 UX325JA | |
| HP Envy 13-ba0001ng | |
| Genomsnitt Intel Core i5-1035G1 (1142 - 1240, n=7) | |
| Asus VivoBook Flip 14 TM420IA | |
| Asus VivoBook S13 S333JA-DS51 | |
| HP Envy x360 13-ay0010nr | |
| Honor MagicBook 14, Ryzen 5 4500U | |
| Geekbench 5.5 / Multi-Core | |
| Lenovo Yoga Slim 7i Carbon 13 ITL | |
| Asus VivoBook Flip 14 TM420IA | |
| Honor MagicBook 14, Ryzen 5 4500U | |
| Asus ZenBook 13 UX325JA | |
| Lenovo ThinkPad L13 Gen2-20VH0017GE | |
| Lenovo ThinkPad L13 Gen2-20VH0017GE | |
| HP Envy x360 13-ay0010nr | |
| Asus VivoBook S13 S333JA-DS51 | |
| HP Envy 13-ba0001ng | |
| Genomsnitt Intel Core i5-1035G1 (3337 - 4372, n=7) | |
| HWBOT x265 Benchmark v2.2 / 4k Preset | |
| Asus VivoBook Flip 14 TM420IA | |
| Honor MagicBook 14, Ryzen 5 4500U | |
| HP Envy x360 13-ay0010nr | |
| Asus VivoBook S13 S333JA-DS51 | |
| Lenovo Yoga Slim 7i Carbon 13 ITL | |
| Lenovo ThinkPad L13 Gen2-20VH0017GE | |
| Lenovo ThinkPad L13 Gen2-20VH0017GE | |
| Genomsnitt Intel Core i5-1035G1 (3.32 - 6.44, n=8) | |
| HP Envy 13-ba0001ng | |
| Asus ZenBook 13 UX325JA | |
| Dell Latitude 13 3390 | |
| Dell XPS 13 7390 2-in-1 Core i3 | |
| LibreOffice / 20 Documents To PDF | |
| Genomsnitt Intel Core i5-1035G1 (55.3 - 70.9, n=6) | |
| HP Envy x360 13-ay0010nr | |
| Honor MagicBook 14, Ryzen 5 4500U | |
| Asus VivoBook S13 S333JA-DS51 | |
| Asus VivoBook Flip 14 TM420IA | |
| HP Envy 13-ba0001ng | |
| Asus ZenBook 13 UX325JA | |
| Lenovo Yoga Slim 7i Carbon 13 ITL | |
| Lenovo ThinkPad L13 Gen2-20VH0017GE | |
| Lenovo ThinkPad L13 Gen2-20VH0017GE | |
| R Benchmark 2.5 / Overall mean | |
| Asus VivoBook S13 S333JA-DS51 | |
| Genomsnitt Intel Core i5-1035G1 (0.705 - 0.769, n=7) | |
| Asus ZenBook 13 UX325JA | |
| HP Envy 13-ba0001ng | |
| Honor MagicBook 14, Ryzen 5 4500U | |
| Lenovo ThinkPad L13 Gen2-20VH0017GE | |
| Lenovo ThinkPad L13 Gen2-20VH0017GE | |
| HP Envy x360 13-ay0010nr | |
| Asus VivoBook Flip 14 TM420IA | |
| Lenovo Yoga Slim 7i Carbon 13 ITL | |
Cinebench R15: CPU Multi 64Bit | CPU Single 64Bit
Blender: v2.79 BMW27 CPU
7-Zip 18.03: 7z b 4 -mmt1 | 7z b 4
Geekbench 5.5: Single-Core | Multi-Core
HWBOT x265 Benchmark v2.2: 4k Preset
LibreOffice : 20 Documents To PDF
R Benchmark 2.5: Overall mean
* ... mindre är bättre
| PCMark 8 | |
| Home Score Accelerated v2 | |
| Dell XPS 13 9310 Core i7 FHD | |
| Lenovo IdeaPad S540-13ARE-82DL000YGE | |
| HP Pavilion 13-bb0015cl | |
| Asus ZenBook 13 UX325JA | |
| Genomsnitt Intel Core i5-1035G1, Intel UHD Graphics G1 (Ice Lake 32 EU) (3469 - 3988, n=5) | |
| Asus VivoBook S13 S330UA-EY034T | |
| Work Score Accelerated v2 | |
| Asus VivoBook S13 S330UA-EY034T | |
| Lenovo IdeaPad S540-13ARE-82DL000YGE | |
| Genomsnitt Intel Core i5-1035G1, Intel UHD Graphics G1 (Ice Lake 32 EU) (2647 - 5035, n=5) | |
| Dell XPS 13 9310 Core i7 FHD | |
| Asus ZenBook 13 UX325JA | |
| HP Pavilion 13-bb0015cl | |
| PCMark 10 Score | 3875 poäng | |
Hjälp | ||
| DPC Latencies / LatencyMon - interrupt to process latency (max), Web, Youtube, Prime95 | |
| Asus VivoBook S13 S333JA-DS51 | |
| HP Pavilion 13-bb0015cl | |
| Asus ZenBook 13 UX325JA | |
| Lenovo IdeaPad S540-13ARE-82DL000YGE | |
| Dell XPS 13 9310 Core i7 FHD | |
* ... mindre är bättre
| Asus VivoBook S13 S333JA-DS51 Intel SSD 660p SSDPEKNW512G8 | Asus VivoBook S13 S330UA-EY034T Kingston RBU-SNS8180DS3512GJ | Lenovo IdeaPad S540-13ARE-82DL000YGE WDC PC SN730 SDBPNTY-256G | Dell XPS 13 9310 Core i7 FHD Micron 2300 512GB MTFDHBA512TDV | HP Pavilion 13-bb0015cl Samsung PM991 MZVLQ512HALU | Asus ZenBook 13 UX325JA Intel SSD 660p 1TB SSDPEKNW010T8 | |
|---|---|---|---|---|---|---|
| AS SSD | -46% | 32% | 49% | 38% | 15% | |
| Seq Read (MB/s) | 1482 | 485.5 -67% | 2193 48% | 2091 41% | 1632 10% | 1587 7% |
| Seq Write (MB/s) | 643 | 351 -45% | 1797 179% | 1396 117% | 896 39% | 938 46% |
| 4K Read (MB/s) | 50.2 | 30.94 -38% | 45.79 -9% | 49.29 -2% | 44.66 -11% | 51 2% |
| 4K Write (MB/s) | 122.9 | 61.6 -50% | 140.3 14% | 104.2 -15% | 128.4 4% | 141.9 15% |
| 4K-64 Read (MB/s) | 322.3 | 323.8 0% | 721 124% | 827 157% | 862 167% | 576 79% |
| 4K-64 Write (MB/s) | 815 | 439.9 -46% | 651 -20% | 1636 101% | 778 -5% | 584 -28% |
| Access Time Read * (ms) | 0.067 | 0.108 -61% | 0.086 -28% | 0.066 1% | 0.064 4% | 0.083 -24% |
| Access Time Write * (ms) | 0.138 | 0.174 -26% | 0.027 80% | 0.365 -164% | 0.081 41% | 0.04 71% |
| Score Read (Points) | 521 | 403 -23% | 986 89% | 1086 108% | 1070 105% | 785 51% |
| Score Write (Points) | 1002 | 537 -46% | 971 -3% | 1880 88% | 996 -1% | 820 -18% |
| Score Total (Points) | 1766 | 1150 -35% | 2453 39% | 3499 98% | 2586 46% | 1990 13% |
| Copy ISO MB/s (MB/s) | 899 | 546 -39% | 1201 34% | 1544 72% | 1283 43% | 1311 46% |
| Copy Program MB/s (MB/s) | 549 | 106.2 -81% | 303 -45% | 613 12% | 806 47% | 310.3 -43% |
| Copy Game MB/s (MB/s) | 842 | 151 -82% | 436.4 -48% | 1451 72% | 1182 40% | 801 -5% |
| CrystalDiskMark 5.2 / 6 | -52% | 51% | 53% | 8% | 20% | |
| Write 4K (MB/s) | 122.6 | 64.5 -47% | 157.4 28% | 97.5 -20% | 96.5 -21% | 139.7 14% |
| Read 4K (MB/s) | 53.4 | 24.91 -53% | 48.59 -9% | 50.9 -5% | 36.81 -31% | 56.4 6% |
| Write Seq (MB/s) | 894 | 453.4 -49% | 2199 146% | 1811 103% | 1168 31% | 1265 41% |
| Read Seq (MB/s) | 1457 | 424.9 -71% | 2011 38% | 1836 26% | 1476 1% | 1492 2% |
| Write 4K Q32T1 (MB/s) | 392.9 | 257.8 -34% | 265.3 -32% | 521 33% | 389.5 -1% | 402.5 2% |
| Read 4K Q32T1 (MB/s) | 337.9 | 200.4 -41% | 478.8 42% | 357.5 6% | 347.8 3% | 329.3 -3% |
| Write Seq Q32T1 (MB/s) | 975 | 504 -48% | 2193 125% | 2879 195% | 1398 43% | 1786 83% |
| Read Seq Q32T1 (MB/s) | 1729 | 459.6 -73% | 2870 66% | 3204 85% | 2364 37% | 1923 11% |
| Write 4K Q8T8 (MB/s) | 284.4 | |||||
| Read 4K Q8T8 (MB/s) | 301.2 | |||||
| Totalt genomsnitt (program/inställningar) | -49% /
-48% | 42% /
39% | 51% /
50% | 23% /
27% | 18% /
17% |
* ... mindre är bättre

DiskSpd Read Loop, Queue Depth 8
| 3DMark 11 Performance | 2742 poäng | |
| 3DMark Cloud Gate Standard Score | 11182 poäng | |
| 3DMark Fire Strike Score | 1666 poäng | |
| 3DMark Time Spy Score | 547 poäng | |
Hjälp | ||
| Final Fantasy XV Benchmark | |
| 1280x720 Lite Quality | |
| HP Pavilion 13-bb0015cl | |
| Dell XPS 13 9310 Core i7 FHD | |
| Asus VivoBook Flip 14 TM420IA | |
| Lenovo IdeaPad S540-13ARE-82DL000YGE | |
| Honor MagicBook 14, Ryzen 5 4500U | |
| Asus VivoBook S13 S333JA-DS51 | |
| Microsoft Surface Laptop Go Core i5 | |
| Genomsnitt Intel UHD Graphics G1 (Ice Lake 32 EU) (13 - 16.8, n=8) | |
| 1920x1080 Standard Quality | |
| Dell XPS 13 9310 Core i7 FHD | |
| HP Pavilion 13-bb0015cl | |
| Asus VivoBook Flip 14 TM420IA | |
| Lenovo IdeaPad S540-13ARE-82DL000YGE | |
| Honor MagicBook 14, Ryzen 5 4500U | |
| Asus VivoBook S13 S333JA-DS51 | |
| Microsoft Surface Laptop Go Core i5 | |
| Genomsnitt Intel UHD Graphics G1 (Ice Lake 32 EU) (6.8 - 8.32, n=6) | |
| 1920x1080 High Quality | |
| Dell XPS 13 9310 Core i7 FHD | |
| HP Pavilion 13-bb0015cl | |
| Asus VivoBook Flip 14 TM420IA | |
| Lenovo IdeaPad S540-13ARE-82DL000YGE | |
| Genomsnitt Intel UHD Graphics G1 (Ice Lake 32 EU) (5.21 - 7.68, n=3) | |
| Asus VivoBook S13 S333JA-DS51 | |
| Microsoft Surface Laptop Go Core i5 | |
| låg | med. | hög | ultra | |
|---|---|---|---|---|
| Dota 2 Reborn (2015) | 84.1 | 49 | 25.7 | 23.8 |
| Final Fantasy XV Benchmark (2018) | 16.8 | 8.32 | 5.81 | |
| X-Plane 11.11 (2018) | 32.9 | 15.3 | 14.4 |
| Asus VivoBook S13 S333JA-DS51 UHD Graphics G1 (Ice Lake 32 EU), i5-1035G1, Intel SSD 660p SSDPEKNW512G8 | Asus VivoBook S13 S330UA-EY034T UHD Graphics 620, i5-8550U, Kingston RBU-SNS8180DS3512GJ | Lenovo IdeaPad S540-13ARE-82DL000YGE Vega 6, R5 4600U, WDC PC SN730 SDBPNTY-256G | Dell XPS 13 9310 Core i7 FHD Iris Xe G7 96EUs, i7-1165G7, Micron 2300 512GB MTFDHBA512TDV | HP Pavilion 13-bb0015cl Iris Xe G7 96EUs, i7-1165G7, Samsung PM991 MZVLQ512HALU | Asus ZenBook 13 UX325JA Iris Plus Graphics G7 (Ice Lake 64 EU), i7-1065G7, Intel SSD 660p 1TB SSDPEKNW010T8 | |
|---|---|---|---|---|---|---|
| Noise | -7% | -3% | 2% | -9% | -13% | |
| av / miljö * (dB) | 25 | 29 -16% | 25 -0% | 25.7 -3% | 28 -12% | 30.1 -20% |
| Idle Minimum * (dB) | 25.5 | 29 -14% | 25 2% | 25.7 -1% | 28 -10% | 30.1 -18% |
| Idle Average * (dB) | 25.5 | 29 -14% | 25 2% | 25.7 -1% | 28 -10% | 30.1 -18% |
| Idle Maximum * (dB) | 25.5 | 29 -14% | 25 2% | 25.9 -2% | 28 -10% | 30.1 -18% |
| Load Average * (dB) | 31.2 | 29.9 4% | 32.8 -5% | 26.2 16% | 35.2 -13% | 32.7 -5% |
| Load Maximum * (dB) | 38.1 | 33.3 13% | 44.5 -17% | 36.6 4% | 36.6 4% | 38.5 -1% |
| Witcher 3 ultra * (dB) | 36.5 | 36.8 | 38.6 |
* ... mindre är bättre
Ljudnivå
| Låg belastning |
| 25.5 / 25.5 / 25.5 dB(A) |
| Hög belastning |
| 31.2 / 38.1 dB(A) |
 | ||
30 dB tyst 40 dB(A) hörbar 50 dB(A) högt ljud |
||
min: | ||
(±) Den maximala temperaturen på ovansidan är 40 °C / 104 F, jämfört med genomsnittet av 35.9 °C / 97 F , allt från 21.4 till 59 °C för klassen Subnotebook.
(-) Botten värms upp till maximalt 55.6 °C / 132 F, jämfört med genomsnittet av 39.2 °C / 103 F
(+) Vid tomgångsbruk är medeltemperaturen för ovansidan 26.2 °C / 79 F, jämfört med enhetsgenomsnittet på 30.8 °C / ### class_avg_f### F.
(+) Handledsstöden och pekplattan är kallare än hudtemperaturen med maximalt 28 °C / 82.4 F och är därför svala att ta på.
(±) Medeltemperaturen för handledsstödsområdet på liknande enheter var 28.2 °C / 82.8 F (+0.2 °C / 0.4 F).
Asus VivoBook S13 S333JA-DS51 ljudanalys
(±) | högtalarljudstyrkan är genomsnittlig men bra (80.8 dB)
Bas 100 - 315 Hz
(±) | reducerad bas - i genomsnitt 13.2% lägre än medianen
(±) | linjäriteten för basen är genomsnittlig (9.9% delta till föregående frekvens)
Mellan 400 - 2000 Hz
(+) | balanserad mellan - endast 2.6% från medianen
(+) | mids är linjära (4.3% delta till föregående frekvens)
Högsta 2 - 16 kHz
(+) | balanserade toppar - endast 1.5% från medianen
(+) | toppar är linjära (3.6% delta till föregående frekvens)
Totalt 100 - 16 000 Hz
(+) | det totala ljudet är linjärt (11.3% skillnad mot median)
Jämfört med samma klass
» 12% av alla testade enheter i den här klassen var bättre, 2% liknande, 86% sämre
» Den bästa hade ett delta på 5%, genomsnittet var 18%, sämst var 53%
Jämfört med alla testade enheter
» 7% av alla testade enheter var bättre, 2% liknande, 91% sämre
» Den bästa hade ett delta på 4%, genomsnittet var 23%, sämst var 134%
Apple MacBook 12 (Early 2016) 1.1 GHz ljudanalys
(+) | högtalare kan spela relativt högt (83.6 dB)
Bas 100 - 315 Hz
(±) | reducerad bas - i genomsnitt 11.3% lägre än medianen
(±) | linjäriteten för basen är genomsnittlig (14.2% delta till föregående frekvens)
Mellan 400 - 2000 Hz
(+) | balanserad mellan - endast 2.4% från medianen
(+) | mids är linjära (5.5% delta till föregående frekvens)
Högsta 2 - 16 kHz
(+) | balanserade toppar - endast 2% från medianen
(+) | toppar är linjära (4.5% delta till föregående frekvens)
Totalt 100 - 16 000 Hz
(+) | det totala ljudet är linjärt (10.2% skillnad mot median)
Jämfört med samma klass
» 7% av alla testade enheter i den här klassen var bättre, 2% liknande, 90% sämre
» Den bästa hade ett delta på 5%, genomsnittet var 18%, sämst var 53%
Jämfört med alla testade enheter
» 5% av alla testade enheter var bättre, 1% liknande, 94% sämre
» Den bästa hade ett delta på 4%, genomsnittet var 23%, sämst var 134%
| Av/Standby | |
| Låg belastning | |
| Hög belastning |
|
Förklaring:
min: | |
| Asus VivoBook S13 S333JA-DS51 i5-1035G1, UHD Graphics G1 (Ice Lake 32 EU), Intel SSD 660p SSDPEKNW512G8, IPS, 1920x1080, 13.3" | Asus VivoBook S13 S330UA-EY034T i5-8550U, UHD Graphics 620, Kingston RBU-SNS8180DS3512GJ, IPS LED, 1920x1080, 13.3" | Lenovo IdeaPad S540-13ARE-82DL000YGE R5 4600U, Vega 6, WDC PC SN730 SDBPNTY-256G, IPS, 2560x1600, 13.3" | Dell XPS 13 9310 Core i7 FHD i7-1165G7, Iris Xe G7 96EUs, Micron 2300 512GB MTFDHBA512TDV, IPS, 1920x1200, 13.4" | HP Pavilion 13-bb0015cl i7-1165G7, Iris Xe G7 96EUs, Samsung PM991 MZVLQ512HALU, IPS, 3840x2160, 13.3" | Asus ZenBook 13 UX325JA i7-1065G7, Iris Plus Graphics G7 (Ice Lake 64 EU), Intel SSD 660p 1TB SSDPEKNW010T8, IPS, 1920x1080, 13.3" | |
|---|---|---|---|---|---|---|
| Power Consumption | -24% | -36% | -18% | -63% | -6% | |
| Idle Minimum * (Watt) | 2.8 | 2.8 -0% | 3.9 -39% | 4.6 -64% | 2.4 14% | |
| Idle Average * (Watt) | 4.8 | 5 -4% | 5.9 -23% | 10.6 -121% | 4.6 4% | |
| Idle Maximum * (Watt) | 5.4 | 8.3 -54% | 9.4 -74% | 6.3 -17% | 11.4 -111% | 9 -67% |
| Load Average * (Watt) | 35 | 42.8 -22% | 37.6 -7% | 39.7 -13% | 43.2 -23% | 36 -3% |
| Load Maximum * (Watt) | 47.6 | 65.8 -38% | 60.7 -28% | 47.5 -0% | 46 3% | 36 24% |
| Witcher 3 ultra * (Watt) | 34.8 | 39.9 | 27 |
* ... mindre är bättre
| Asus VivoBook S13 S333JA-DS51 i5-1035G1, UHD Graphics G1 (Ice Lake 32 EU), 50 Wh | Asus VivoBook S13 S330UA-EY034T i5-8550U, UHD Graphics 620, 42 Wh | Lenovo IdeaPad S540-13ARE-82DL000YGE R5 4600U, Vega 6, 56 Wh | Dell XPS 13 9310 Core i7 FHD i7-1165G7, Iris Xe G7 96EUs, 52 Wh | HP Pavilion 13-bb0015cl i7-1165G7, Iris Xe G7 96EUs, 43 Wh | Asus ZenBook 13 UX325JA i7-1065G7, Iris Plus Graphics G7 (Ice Lake 64 EU), 67 Wh | |
|---|---|---|---|---|---|---|
| Batteridrifttid | -13% | -13% | 31% | -48% | 35% | |
| Reader / Idle (h) | 26.5 | 21 -21% | 30 13% | 10.8 -59% | 26.6 0% | |
| WiFi v1.3 (h) | 9.7 | 8.4 -13% | 11 13% | 11 13% | 4.5 -54% | 13.8 42% |
| Load (h) | 1.9 | 1.3 -32% | 3.2 68% | 1.3 -32% | 3.1 63% |
För
Emot
Läs den fullständiga versionen av den här recensionen på engelska här.
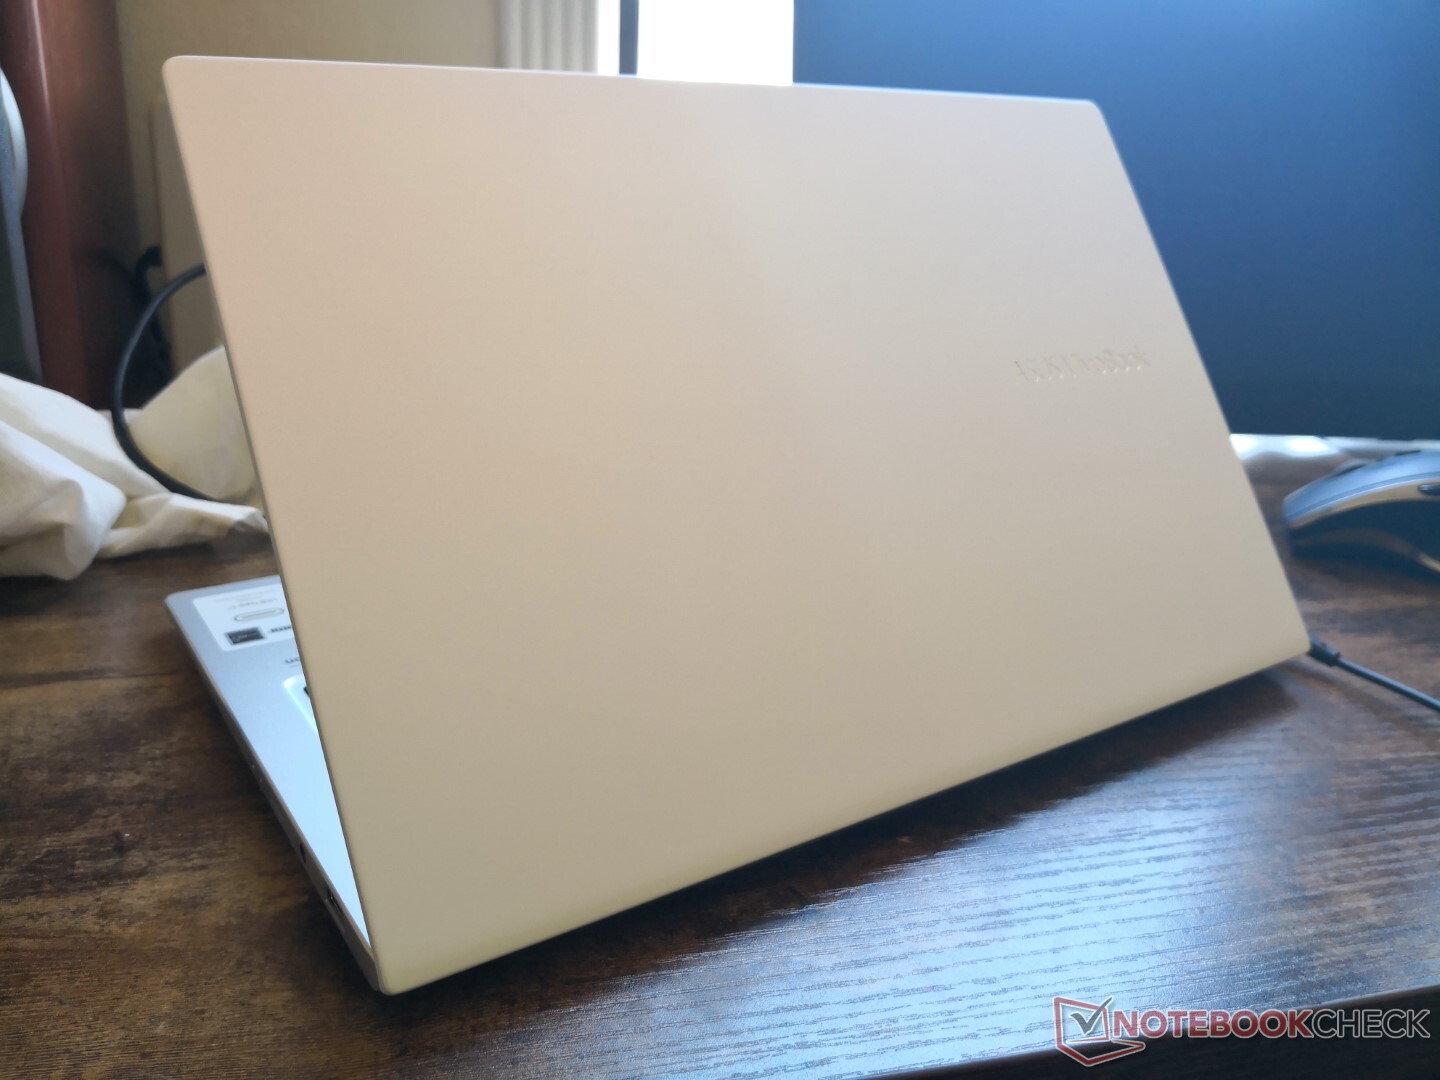
Det som förvånar mest med VivoBook S13 S333 är att den täcker hela färgrymden sRGB och har en stark visuell design i förhållande till utgångspriset på ca 7.000 kronor. Dessa områden är kanske inte på samma nivå som på en Zenbook, en Dell XPS eller en HP Specre, men de hamnar ganska nära trots ett pris som är flera tusenlappar lägre. Vill man balansera skärmkvalitet, chassikvalitet och processorprestanda utan att spräcka budgeten finns det mycket att gilla här. Vi rekommenderar i synnerhet att om möjligt leta upp varianten S333EA istället för S333JA, då den både har stöd för Thunderbolt samt snabbare Iris Xe-grafik, vilket gör den mer framtidssäkrad.
Riktigt prisvärd. S333JA brister när det kommer till grafik och vissa anslutningsmöjligheter, vilket S333EA åtgärdar.
Det finns vissa begränsningar att ha i åtanke: datorns RAM går inte att uppgradera, den har en långsam MicroSD-läsare, en svag klickplatta och relativt höga kärntemperaturer. Gör man mycket bildredigering vill man troligen investera i mer RAM och ett mer avancerat grafikalternativ än på varianten vi recenserat. VivoBook-modellerna är dessutom ofta på rea, så de mer avancerade modellerna behöver inte heller kostar särskilt mycket.
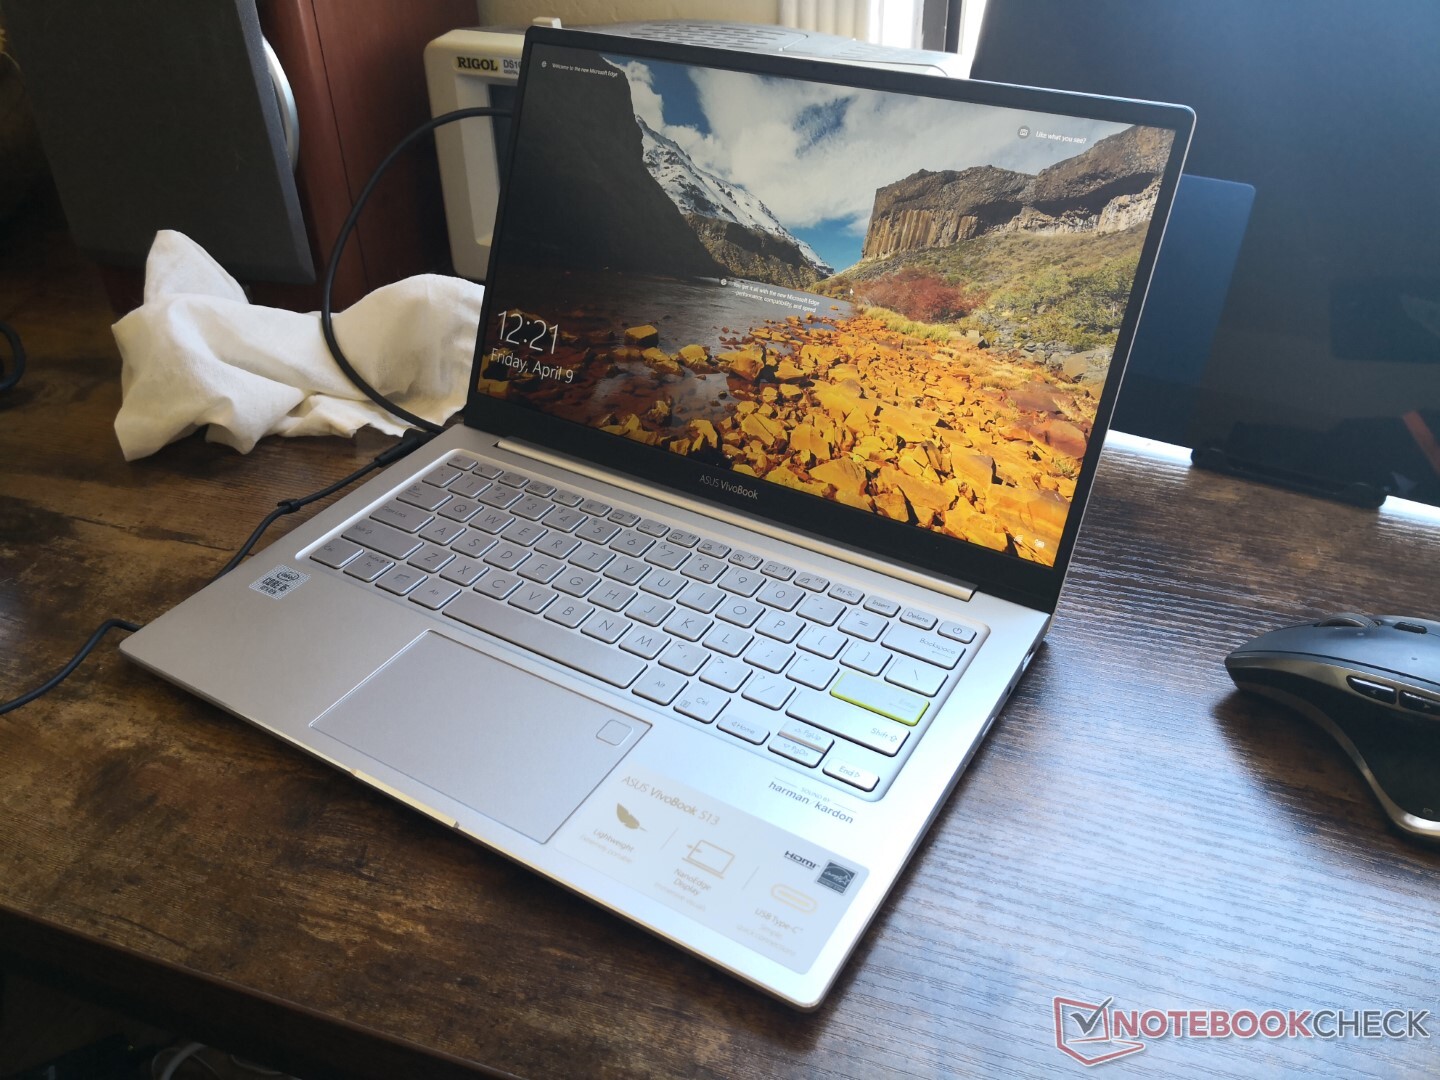
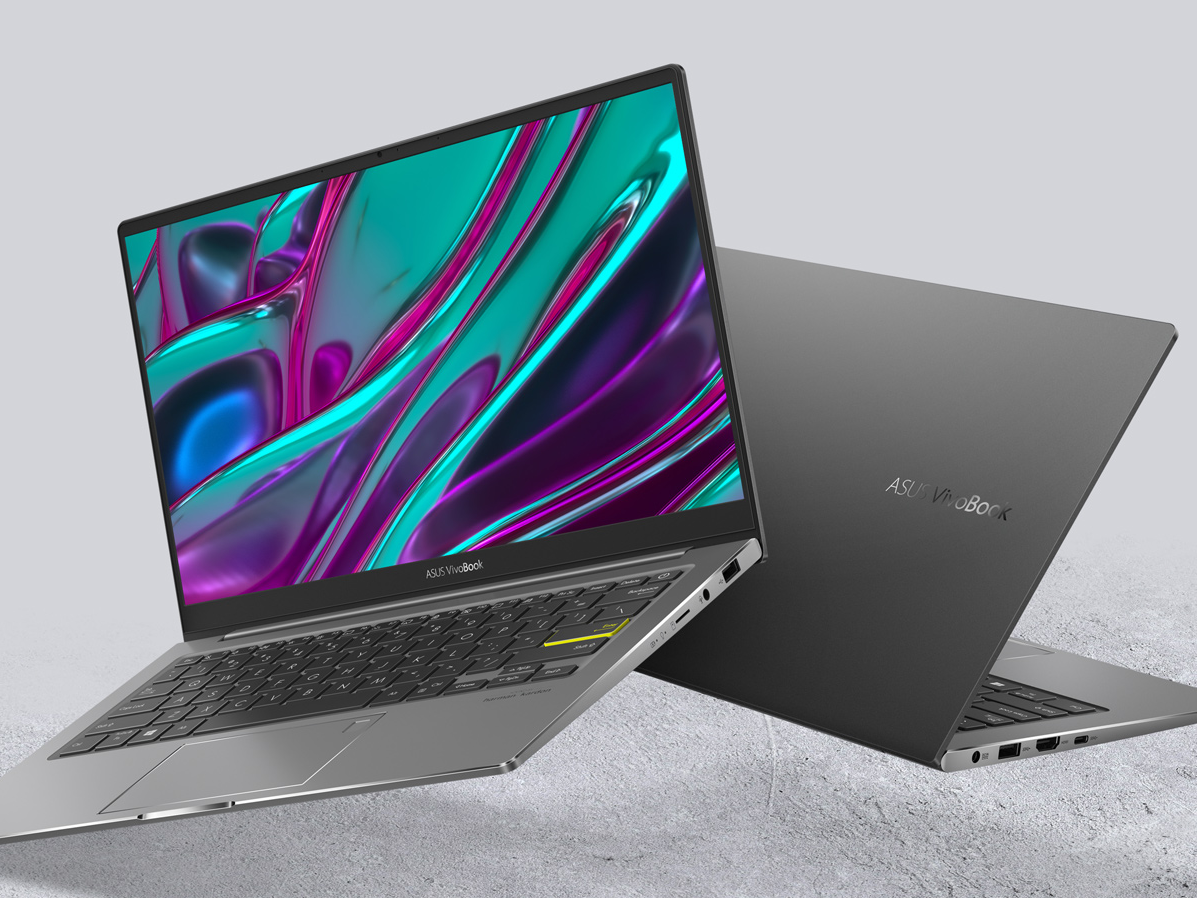
Asus VivoBook S13 S333JA-DS51
- 04/12/2021 v7 (old)
Allen Ngo
Price comparison
