Test: Dell XPS 13 9310 OLED - Bättre än IPS? (Sammanfattning)
Testgrupp
Gradering | Datum | Modell | Vikt | Höjd | Storlek | Upplösning | Pris |
|---|---|---|---|---|---|---|---|
| 88.3 % v7 (old) | 06/2021 | Dell XPS 13 9310 OLED i7-1185G7, Iris Xe G7 96EUs | 1.2 kg | 14.8 mm | 13.40" | 3456x2160 | |
| 87.4 % v7 (old) | 12/2020 | Dell XPS 13 9310 Core i7 4K i7-1185G7, Iris Xe G7 96EUs | 1.3 kg | 14.8 mm | 13.40" | 3840x2400 | |
| 88.1 % v7 (old) | 12/2020 | Dell XPS 13 9310 Core i7 FHD i7-1165G7, Iris Xe G7 96EUs | 1.3 kg | 14.8 mm | 13.40" | 1920x1200 | |
| 85.9 % v7 (old) | 11/2019 | Dell XPS 13 7390 Core i7-10710U i7-10710U, UHD Graphics 620 | 1.2 kg | 11.6 mm | 13.30" | 3840x2160 | |
| 86.9 % v7 (old) | 06/2021 | MSI Summit E13 Flip Evo A11MT i7-1185G7, Iris Xe G7 96EUs | 1.4 kg | 14.9 mm | 13.40" | 1920x1200 | |
v (old) | 09/2021 | Asus ZenBook 13 OLED UM325UA R7 5700U, Vega 8 | 1.1 kg | 14.8 mm | 13.30" | 1920x1080 |
| SD Card Reader | |
| average JPG Copy Test (av. of 3 runs) | |
| Dell XPS 13 9310 Core i7 FHD (Toshiba Exceria Pro M501 64 GB UHS-II) | |
| Dell XPS 13 9310 Core i7 4K (Toshiba Exceria Pro M501 32 GB UHS-II) | |
| Dell XPS 13 9310 OLED (AV PRO microSD 128 GB V60) | |
| Dell XPS 13 7390 Core i7-10710U (Toshiba Exceria Pro M501 64 GB UHS-II) | |
| MSI Summit E13 Flip Evo A11MT (AV PRO microSD 128 GB V60) | |
| maximum AS SSD Seq Read Test (1GB) | |
| Dell XPS 13 9310 Core i7 4K (Toshiba Exceria Pro M501 32 GB UHS-II) | |
| Dell XPS 13 9310 Core i7 FHD (Toshiba Exceria Pro M501 64 GB UHS-II) | |
| Dell XPS 13 7390 Core i7-10710U (Toshiba Exceria Pro M501 64 GB UHS-II) | |
| Dell XPS 13 9310 OLED (AV PRO microSD 128 GB V60) | |
| MSI Summit E13 Flip Evo A11MT (AV PRO microSD 128 GB V60) | |


| |||||||||||||||||||||||||
Distribution av ljusstyrkan: 97 %
Mitt på batteriet: 384 cd/m²
Kontrast: ∞:1 (Svärta: 0 cd/m²)
ΔE ColorChecker Calman: 4.56 | ∀{0.5-29.43 Ø4.73}
calibrated: 4.52
ΔE Greyscale Calman: 1.5 | ∀{0.09-98 Ø4.97}
100% sRGB (Argyll 1.6.3 3D)
87.1% AdobeRGB 1998 (Argyll 1.6.3 3D)
97.7% AdobeRGB 1998 (Argyll 3D)
100% sRGB (Argyll 3D)
99.7% Display P3 (Argyll 3D)
Gamma: 2.26
CCT: 6219 K
| Dell XPS 13 9310 OLED Samsung 134XK01, OLED, 13.4", 3456x2160 | Dell XPS 13 9310 Core i7 4K Sharp LQ134R1, IPS, 13.4", 3840x2400 | Dell XPS 13 9310 Core i7 FHD Sharp LQ134N1, IPS, 13.4", 1920x1200 | Dell XPS 13 7390 Core i7-10710U AU Optronics B133ZAN, Dell P/N: 90NTH, IPS, 13.3", 3840x2160 | MSI Summit E13 Flip Evo A11MT Sharp LQ134N1JW53, IPS, 13.4", 1920x1200 | |
|---|---|---|---|---|---|
| Display | -13% | -18% | -25% | -20% | |
| Display P3 Coverage (%) | 99.7 | 80.2 -20% | 70.9 -29% | 63.4 -36% | 69.8 -30% |
| sRGB Coverage (%) | 100 | 100 0% | 99.1 -1% | 93.7 -6% | 98.8 -1% |
| AdobeRGB 1998 Coverage (%) | 97.7 | 78.9 -19% | 72.9 -25% | 64.3 -34% | 70.6 -28% |
| Response Times | -2164% | -1837% | -1836% | -2355% | |
| Response Time Grey 50% / Grey 80% * (ms) | 2.2 ? | 59.2 ? -2591% | 52 ? -2264% | 51.6 ? -2245% | 64 ? -2809% |
| Response Time Black / White * (ms) | 2.2 ? | 40.4 ? -1736% | 33.2 ? -1409% | 33.6 ? -1427% | 44 ? -1900% |
| PWM Frequency (Hz) | 240.4 ? | 2137 ? | 2475 ? | ||
| Screen | 3% | -9% | -50% | 28% | |
| Brightness middle (cd/m²) | 384 | 508.7 32% | 543.3 41% | 408.2 6% | 551.3 44% |
| Brightness (cd/m²) | 387 | 479 24% | 524 35% | 399 3% | 517 34% |
| Brightness Distribution (%) | 97 | 84 -13% | 92 -5% | 89 -8% | 91 -6% |
| Black Level * (cd/m²) | 0.3 | 0.38 | 0.39 | 0.37 | |
| Colorchecker dE 2000 * | 4.56 | 2.72 40% | 3.02 34% | 4.6 -1% | 1.45 68% |
| Colorchecker dE 2000 max. * | 7.27 | 4.7 35% | 7.61 -5% | 11.84 -63% | 2.86 61% |
| Colorchecker dE 2000 calibrated * | 4.52 | 1.92 58% | 1.23 73% | 2.03 55% | 1.7 62% |
| Greyscale dE 2000 * | 1.5 | 3.4 -127% | 5 -233% | 7.5 -400% | 1.3 13% |
| Gamma | 2.26 97% | 2.11 104% | 2.02 109% | 2.12 104% | 2.14 103% |
| CCT | 6219 105% | 6245 104% | 6550 99% | 7966 82% | 6580 99% |
| Color Space (Percent of AdobeRGB 1998) (%) | 87.1 | 70.7 -19% | 66.8 -23% | 59.5 -32% | 65 -25% |
| Color Space (Percent of sRGB) (%) | 100 | 100 0% | 99.6 0% | 93.5 -6% | 99 -1% |
| Contrast (:1) | 1696 | 1430 | 1047 | 1490 | |
| Totalt genomsnitt (program/inställningar) | -725% /
-310% | -621% /
-272% | -637% /
-300% | -782% /
-323% |
* ... mindre är bättre
Visa svarstider
| ↔ Svarstid svart till vitt | ||
|---|---|---|
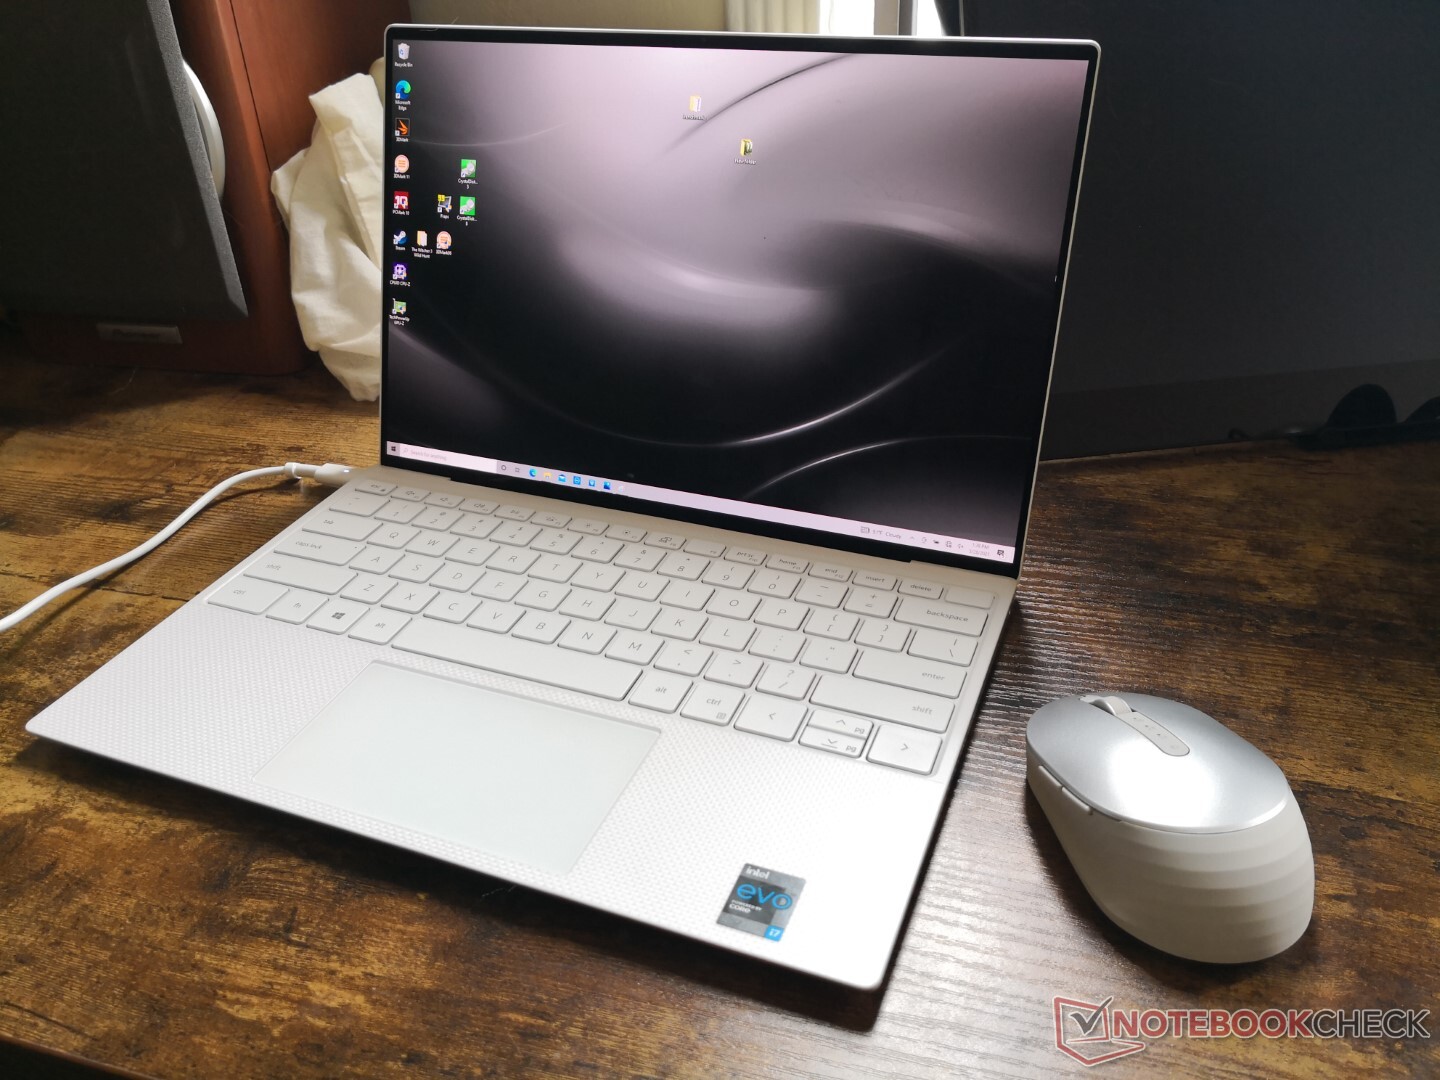
| 2.2 ms ... stiga ↗ och falla ↘ kombinerat | ↗ 1 ms stiga | 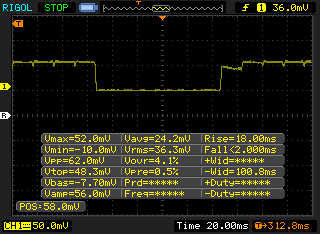 |
| ↘ 1.2 ms hösten | ||
| Skärmen visar väldigt snabba svarsfrekvenser i våra tester och borde vara mycket väl lämpad för fartfyllt spel. I jämförelse sträcker sig alla testade enheter från 0.1 (minst) till 240 (maximalt) ms. » 12 % av alla enheter är bättre. Det betyder att den uppmätta svarstiden är bättre än genomsnittet av alla testade enheter (19.9 ms). | ||
| ↔ Svarstid 50 % grått till 80 % grått | ||
| 2.2 ms ... stiga ↗ och falla ↘ kombinerat | ↗ 1.2 ms stiga | 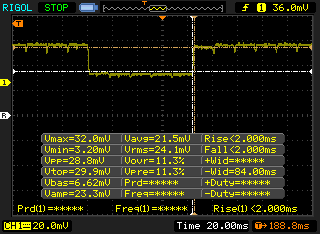 |
| ↘ 1 ms hösten | ||
| Skärmen visar väldigt snabba svarsfrekvenser i våra tester och borde vara mycket väl lämpad för fartfyllt spel. I jämförelse sträcker sig alla testade enheter från 0.165 (minst) till 636 (maximalt) ms. » 11 % av alla enheter är bättre. Det betyder att den uppmätta svarstiden är bättre än genomsnittet av alla testade enheter (31.1 ms). | ||
Skärmflimmer / PWM (Puls-Width Modulation)
| Skärmflimmer / PWM upptäckt | 240.4 Hz | ≤ 51 % ljusstyrka inställning |  |
Displayens bakgrundsbelysning flimrar vid 240.4 Hz (i värsta fall, t.ex. med PWM) Flimrande upptäckt vid en ljusstyrkeinställning på 51 % och lägre. Det ska inte finnas något flimmer eller PWM över denna ljusstyrkeinställning. Frekvensen för 240.4 Hz är relativt låg, så känsliga användare kommer sannolikt att märka flimmer och uppleva ansträngda ögon vid den angivna ljusstyrkeinställningen och nedan. Som jämförelse: 52 % av alla testade enheter använder inte PWM för att dämpa skärmen. Om PWM upptäcktes mättes ett medelvärde av 7794 (minst: 5 - maximum: 343500) Hz. | |||
Cinebench R23: Multi Core | Single Core
Cinebench R15: CPU Multi 64Bit | CPU Single 64Bit
Blender: v2.79 BMW27 CPU
7-Zip 18.03: 7z b 4 -mmt1 | 7z b 4
Geekbench 5.5: Single-Core | Multi-Core
HWBOT x265 Benchmark v2.2: 4k Preset
LibreOffice : 20 Documents To PDF
R Benchmark 2.5: Overall mean
| Cinebench R20 / CPU (Multi Core) | |
| Asus ZenBook 13 UM325S | |
| Lenovo Yoga Slim 7 14ARE05 82A20008GE | |
| Asus ZenBook 13 OLED UM325UA | |
| Dell XPS 13 7390 Core i7-10710U | |
| Genomsnitt Intel Core i7-1185G7 (1425 - 2493, n=28) | |
| Dell XPS 13 9310 OLED | |
| Dell XPS 13 9305 Core i5 FHD | |
| HP Envy 13-ba1475ng | |
| Asus VivoBook S13 S333JA-DS51 | |
| Asus ZenBook 13 UX325JA | |
| Dell Latitude 7300-P99G | |
| HP Envy 13-ba0001ng | |
| HP Envy 13-aq0003ng | |
| Cinebench R20 / CPU (Single Core) | |
| Genomsnitt Intel Core i7-1185G7 (489 - 593, n=28) | |
| Dell XPS 13 9310 OLED | |
| Asus ZenBook 13 UM325S | |
| HP Envy 13-ba1475ng | |
| Dell XPS 13 9305 Core i5 FHD | |
| Asus ZenBook 13 OLED UM325UA | |
| Lenovo Yoga Slim 7 14ARE05 82A20008GE | |
| Dell XPS 13 7390 Core i7-10710U | |
| Asus ZenBook 13 UX325JA | |
| HP Envy 13-ba0001ng | |
| Dell Latitude 7300-P99G | |
| Asus VivoBook S13 S333JA-DS51 | |
| HP Envy 13-aq0003ng | |
| Cinebench R23 / Multi Core | |
| Asus ZenBook 13 UM325S | |
| Lenovo Yoga Slim 7 14ARE05 82A20008GE | |
| Asus ZenBook 13 OLED UM325UA | |
| Dell XPS 13 9305 Core i5 FHD | |
| Genomsnitt Intel Core i7-1185G7 (3610 - 6383, n=24) | |
| Dell XPS 13 9310 OLED | |
| HP Envy 13-ba1475ng | |
| Asus VivoBook S13 S333JA-DS51 | |
| Cinebench R23 / Single Core | |
| Dell XPS 13 9310 OLED | |
| Genomsnitt Intel Core i7-1185G7 (1251 - 1532, n=24) | |
| Asus ZenBook 13 UM325S | |
| HP Envy 13-ba1475ng | |
| Dell XPS 13 9305 Core i5 FHD | |
| Asus ZenBook 13 OLED UM325UA | |
| Lenovo Yoga Slim 7 14ARE05 82A20008GE | |
| Asus VivoBook S13 S333JA-DS51 | |
| Cinebench R15 / CPU Multi 64Bit | |
| Asus ZenBook 13 UM325S | |
| Asus ZenBook 13 OLED UM325UA | |
| Lenovo Yoga Slim 7 14ARE05 82A20008GE | |
| Dell XPS 13 7390 Core i7-10710U | |
| Genomsnitt Intel Core i7-1185G7 (617 - 1066, n=32) | |
| Dell XPS 13 9310 OLED | |
| Dell XPS 13 9305 Core i5 FHD | |
| Asus ZenBook 13 UX325JA | |
| HP Envy 13-ba1475ng | |
| Dell Latitude 7300-P99G | |
| Asus VivoBook S13 S333JA-DS51 | |
| HP Envy 13-ba0001ng | |
| HP Envy 13-aq0003ng | |
| Cinebench R15 / CPU Single 64Bit | |
| Asus ZenBook 13 UM325S | |
| Dell XPS 13 9310 OLED | |
| Genomsnitt Intel Core i7-1185G7 (168 - 230, n=27) | |
| HP Envy 13-ba1475ng | |
| Dell Latitude 7300-P99G | |
| Asus ZenBook 13 OLED UM325UA | |
| Asus ZenBook 13 UX325JA | |
| Dell XPS 13 7390 Core i7-10710U | |
| Lenovo Yoga Slim 7 14ARE05 82A20008GE | |
| HP Envy 13-ba0001ng | |
| HP Envy 13-aq0003ng | |
| Asus VivoBook S13 S333JA-DS51 | |
| Blender / v2.79 BMW27 CPU | |
| Asus ZenBook 13 UX325JA | |
| HP Envy 13-ba0001ng | |
| Asus VivoBook S13 S333JA-DS51 | |
| HP Envy 13-ba1475ng | |
| Dell XPS 13 9310 OLED | |
| Dell XPS 13 9305 Core i5 FHD | |
| Genomsnitt Intel Core i7-1185G7 (478 - 745, n=28) | |
| Dell XPS 13 7390 Core i7-10710U | |
| Lenovo Yoga Slim 7 14ARE05 82A20008GE | |
| Asus ZenBook 13 OLED UM325UA | |
| Asus ZenBook 13 UM325S | |
| 7-Zip 18.03 / 7z b 4 -mmt1 | |
| Asus ZenBook 13 UM325S | |
| Genomsnitt Intel Core i7-1185G7 (3678 - 5507, n=27) | |
| HP Envy 13-ba1475ng | |
| HP Envy 13-ba0001ng | |
| Dell XPS 13 9305 Core i5 FHD | |
| Asus ZenBook 13 OLED UM325UA | |
| Dell XPS 13 7390 Core i7-10710U | |
| Lenovo Yoga Slim 7 14ARE05 82A20008GE | |
| Asus ZenBook 13 UX325JA | |
| Asus VivoBook S13 S333JA-DS51 | |
| Dell XPS 13 9310 OLED | |
| 7-Zip 18.03 / 7z b 4 | |
| Asus ZenBook 13 UM325S | |
| Asus ZenBook 13 OLED UM325UA | |
| Lenovo Yoga Slim 7 14ARE05 82A20008GE | |
| Dell XPS 13 7390 Core i7-10710U | |
| Dell XPS 13 9305 Core i5 FHD | |
| Genomsnitt Intel Core i7-1185G7 (18812 - 27693, n=27) | |
| Dell XPS 13 9310 OLED | |
| HP Envy 13-ba1475ng | |
| Asus VivoBook S13 S333JA-DS51 | |
| HP Envy 13-ba0001ng | |
| Asus ZenBook 13 UX325JA | |
| Geekbench 5.5 / Single-Core | |
| Dell XPS 13 9310 OLED | |
| Genomsnitt Intel Core i7-1185G7 (1398 - 1626, n=21) | |
| HP Envy 13-ba1475ng | |
| Asus ZenBook 13 UM325S | |
| Dell XPS 13 9305 Core i5 FHD | |
| Asus ZenBook 13 UX325JA | |
| HP Envy 13-ba0001ng | |
| Asus ZenBook 13 OLED UM325UA | |
| Asus VivoBook S13 S333JA-DS51 | |
| Lenovo Yoga Slim 7 14ARE05 82A20008GE | |
| Geekbench 5.5 / Multi-Core | |
| Asus ZenBook 13 UM325S | |
| Asus ZenBook 13 OLED UM325UA | |
| Lenovo Yoga Slim 7 14ARE05 82A20008GE | |
| Dell XPS 13 9310 OLED | |
| Genomsnitt Intel Core i7-1185G7 (4620 - 5944, n=21) | |
| Dell XPS 13 9305 Core i5 FHD | |
| HP Envy 13-ba1475ng | |
| Asus ZenBook 13 UX325JA | |
| Asus VivoBook S13 S333JA-DS51 | |
| HP Envy 13-ba0001ng | |
| HWBOT x265 Benchmark v2.2 / 4k Preset | |
| Asus ZenBook 13 UM325S | |
| Lenovo Yoga Slim 7 14ARE05 82A20008GE | |
| Asus ZenBook 13 OLED UM325UA | |
| Genomsnitt Intel Core i7-1185G7 (5.02 - 8.13, n=27) | |
| Dell XPS 13 9310 OLED | |
| Dell XPS 13 7390 Core i7-10710U | |
| HP Envy 13-ba1475ng | |
| Asus VivoBook S13 S333JA-DS51 | |
| HP Envy 13-ba0001ng | |
| Asus ZenBook 13 UX325JA | |
| LibreOffice / 20 Documents To PDF | |
| Lenovo Yoga Slim 7 14ARE05 82A20008GE | |
| Asus VivoBook S13 S333JA-DS51 | |
| Asus ZenBook 13 OLED UM325UA | |
| Dell XPS 13 9305 Core i5 FHD | |
| HP Envy 13-ba0001ng | |
| HP Envy 13-ba1475ng | |
| Asus ZenBook 13 UM325S | |
| Asus ZenBook 13 UX325JA | |
| Genomsnitt Intel Core i7-1185G7 (41.3 - 61.7, n=26) | |
| Dell XPS 13 9310 OLED | |
| R Benchmark 2.5 / Overall mean | |
| Asus VivoBook S13 S333JA-DS51 | |
| Asus ZenBook 13 UX325JA | |
| HP Envy 13-ba0001ng | |
| Dell XPS 13 9305 Core i5 FHD | |
| Lenovo Yoga Slim 7 14ARE05 82A20008GE | |
| HP Envy 13-ba1475ng | |
| Asus ZenBook 13 OLED UM325UA | |
| Dell XPS 13 9310 OLED | |
| Genomsnitt Intel Core i7-1185G7 (0.55 - 0.615, n=27) | |
| Asus ZenBook 13 UM325S | |
Cinebench R23: Multi Core | Single Core
Cinebench R15: CPU Multi 64Bit | CPU Single 64Bit
Blender: v2.79 BMW27 CPU
7-Zip 18.03: 7z b 4 -mmt1 | 7z b 4
Geekbench 5.5: Single-Core | Multi-Core
HWBOT x265 Benchmark v2.2: 4k Preset
LibreOffice : 20 Documents To PDF
R Benchmark 2.5: Overall mean
* ... mindre är bättre
| PCMark 10 Score | 5226 poäng | |
Hjälp | ||
| DPC Latencies / LatencyMon - interrupt to process latency (max), Web, Youtube, Prime95 | |
| MSI Summit E13 Flip Evo A11MT | |
| Dell XPS 13 9310 Core i7 4K | |
| Dell XPS 13 9310 OLED | |
| Dell XPS 13 9310 Core i7 FHD | |
* ... mindre är bättre
| Dell XPS 13 9310 OLED Toshiba XG6 KXG60ZNV512G | Dell XPS 13 9310 Core i7 FHD Micron 2300 512GB MTFDHBA512TDV | Dell XPS 13 7390 Core i7-10710U SK Hynix PC601 NVMe 512 GB | MSI Summit E13 Flip Evo A11MT Phison 1TB SM2801T24GKBB4S-E162 | |
|---|---|---|---|---|
| AS SSD | -43% | -25% | 23% | |
| Seq Read (MB/s) | 2694 | 2091 -22% | 1804 -33% | 3789 41% |
| Seq Write (MB/s) | 1407 | 1396 -1% | 1000 -29% | 2257 60% |
| 4K Read (MB/s) | 54.4 | 49.29 -9% | 45.1 -17% | 54.2 0% |
| 4K Write (MB/s) | 195.8 | 104.2 -47% | 115 -41% | 78.7 -60% |
| 4K-64 Read (MB/s) | 1092 | 827 -24% | 893 -18% | 1330 22% |
| 4K-64 Write (MB/s) | 1269 | 1636 29% | 732 -42% | 2038 61% |
| Access Time Read * (ms) | 0.064 | 0.066 -3% | 0.044 31% | 0.042 34% |
| Access Time Write * (ms) | 0.062 | 0.365 -489% | 0.095 -53% | 0.04 35% |
| Score Read (Points) | 1416 | 1086 -23% | 1119 -21% | 1763 25% |
| Score Write (Points) | 1606 | 1880 17% | 947 -41% | 2343 46% |
| Score Total (Points) | 3692 | 3499 -5% | 2608 -29% | 4938 34% |
| Copy ISO MB/s (MB/s) | 1782 | 1544 -13% | 1515 -15% | 2270 27% |
| Copy Program MB/s (MB/s) | 1023 | 613 -40% | 535 -48% | 670 -35% |
| Copy Game MB/s (MB/s) | 1148 | 1451 26% | 1211 5% | 1525 33% |
| CrystalDiskMark 5.2 / 6 | 41% | 30% | 95% | |
| Write 4K (MB/s) | 156.8 | 97.5 -38% | 134 -15% | 311.1 98% |
| Read 4K (MB/s) | 39.66 | 50.9 28% | 42.91 8% | 56.6 43% |
| Write Seq (MB/s) | 854 | 1811 112% | 1841 116% | 2397 181% |
| Read Seq (MB/s) | 2167 | 1836 -15% | 1707 -21% | 2277 5% |
| Write 4K Q32T1 (MB/s) | 441.1 | 521 18% | 394.7 -11% | 803 82% |
| Read 4K Q32T1 (MB/s) | 395.5 | 357.5 -10% | 398.5 1% | 849 115% |
| Write Seq Q32T1 (MB/s) | 858 | 2879 236% | 2250 162% | 2410 181% |
| Read Seq Q32T1 (MB/s) | 3258 | 3204 -2% | 3265 0% | 4954 52% |
| Totalt genomsnitt (program/inställningar) | -1% /
-13% | 3% /
-5% | 59% /
49% |
* ... mindre är bättre

DiskSpd Read Loop, Queue Depth 8
| 3DMark 11 Performance | 6398 poäng | |
| 3DMark Cloud Gate Standard Score | 15019 poäng | |
| 3DMark Fire Strike Score | 4449 poäng | |
| 3DMark Time Spy Score | 1526 poäng | |
Hjälp | ||
| Final Fantasy XV Benchmark | |
| 1280x720 Lite Quality | |
| MSI Summit E13 Flip Evo A11MT | |
| Genomsnitt Intel Iris Xe Graphics G7 96EUs (14.9 - 56.5, n=189) | |
| Dell XPS 13 9305 Core i5 FHD | |
| Dell XPS 13 9310 OLED | |
| Asus ZenBook 13 UM325S | |
| Dell XPS 13 9310 Core i7 FHD | |
| Asus ZenBook 13 OLED UM325UA | |
| Dell XPS 13 9310 Core i7 4K | |
| Asus VivoBook S13 S333JA-DS51 | |
| 1920x1080 Standard Quality | |
| MSI Summit E13 Flip Evo A11MT | |
| Genomsnitt Intel Iris Xe Graphics G7 96EUs (10.5 - 31.2, n=185) | |
| Dell XPS 13 9305 Core i5 FHD | |
| Dell XPS 13 9310 OLED | |
| Dell XPS 13 9310 Core i7 FHD | |
| Dell XPS 13 9310 Core i7 4K | |
| Asus ZenBook 13 UM325S | |
| Asus ZenBook 13 OLED UM325UA | |
| Asus VivoBook S13 S333JA-DS51 | |
| 1920x1080 High Quality | |
| Dell XPS 13 9305 Core i5 FHD | |
| MSI Summit E13 Flip Evo A11MT | |
| Genomsnitt Intel Iris Xe Graphics G7 96EUs (8.15 - 27.8, n=178) | |
| Dell XPS 13 9310 Core i7 FHD | |
| Dell XPS 13 9310 OLED | |
| Dell XPS 13 9310 Core i7 4K | |
| Asus ZenBook 13 UM325S | |
| Asus ZenBook 13 OLED UM325UA | |
| Asus VivoBook S13 S333JA-DS51 | |
| Strange Brigade | |
| 1280x720 lowest AF:1 | |
| MSI Summit E13 Flip Evo A11MT | |
| Dell XPS 13 9310 Core i7 FHD | |
| Dell XPS 13 9310 OLED | |
| Genomsnitt Intel Iris Xe Graphics G7 96EUs (48.5 - 115.1, n=172) | |
| Dell XPS 13 9305 Core i5 FHD | |
| 1920x1080 medium AA:medium AF:4 | |
| MSI Summit E13 Flip Evo A11MT | |
| Dell XPS 13 9310 Core i7 FHD | |
| Genomsnitt Intel Iris Xe Graphics G7 96EUs (18.2 - 51.4, n=170) | |
| Dell XPS 13 9310 OLED | |
| Dell XPS 13 9305 Core i5 FHD | |
| 1920x1080 high AA:high AF:8 | |
| MSI Summit E13 Flip Evo A11MT | |
| Dell XPS 13 9310 Core i7 FHD | |
| Dell XPS 13 9310 OLED | |
| Genomsnitt Intel Iris Xe Graphics G7 96EUs (15.4 - 39.8, n=169) | |
| Dell XPS 13 9305 Core i5 FHD | |
| 1920x1080 ultra AA:ultra AF:16 | |
| MSI Summit E13 Flip Evo A11MT | |
| Dell XPS 13 9310 Core i7 FHD | |
| Genomsnitt Intel Iris Xe Graphics G7 96EUs (13.2 - 31.7, n=167) | |
| Dell XPS 13 9310 OLED | |
| låg | med. | hög | ultra | QHD | 4K | |
|---|---|---|---|---|---|---|
| The Witcher 3 (2015) | 98.6 | 61.1 | 32 | 13.9 | ||
| Dota 2 Reborn (2015) | 76.1 | 74.7 | 41.6 | 43.4 | 21.5 | |
| Final Fantasy XV Benchmark (2018) | 35 | 19.9 | 15.1 | 15.1 | 15.1 | |
| X-Plane 11.11 (2018) | 25.1 | 35.2 | 29.4 | 17.1 | ||
| Strange Brigade (2018) | 88.4 | 33.2 | 29.7 | 22.3 | 16.9 |
| Dell XPS 13 9310 OLED Iris Xe G7 96EUs, i7-1185G7, Toshiba XG6 KXG60ZNV512G | Dell XPS 13 9310 Core i7 4K Iris Xe G7 96EUs, i7-1185G7, Micron 2300 512GB MTFDHBA512TDV | Dell XPS 13 9310 Core i7 FHD Iris Xe G7 96EUs, i7-1165G7, Micron 2300 512GB MTFDHBA512TDV | Dell XPS 13 7390 Core i7-10710U UHD Graphics 620, i7-10710U, SK Hynix PC601 NVMe 512 GB | MSI Summit E13 Flip Evo A11MT Iris Xe G7 96EUs, i7-1185G7, Phison 1TB SM2801T24GKBB4S-E162 | |
|---|---|---|---|---|---|
| Noise | -7% | -3% | -19% | -15% | |
| av / miljö * (dB) | 24.8 | 27.7 -12% | 25.7 -4% | 28 -13% | 24.5 1% |
| Idle Minimum * (dB) | 25 | 27.8 -11% | 25.7 -3% | 28 -12% | 24.7 1% |
| Idle Average * (dB) | 25 | 27.8 -11% | 25.7 -3% | 28 -12% | 24.7 1% |
| Idle Maximum * (dB) | 25 | 27.8 -11% | 25.9 -4% | 28 -12% | 26.4 -6% |
| Load Average * (dB) | 25.3 | 27.9 -10% | 26.2 -4% | 33.7 -33% | 37.8 -49% |
| Witcher 3 ultra * (dB) | 35.8 | 32.8 8% | 36.5 -2% | 41.4 -16% | |
| Load Maximum * (dB) | 35.8 | 37 -3% | 36.6 -2% | 46.5 -30% | 48.8 -36% |
* ... mindre är bättre
Ljudnivå
| Låg belastning |
| 25 / 25 / 25 dB(A) |
| Hög belastning |
| 25.3 / 35.8 dB(A) |
 | ||
30 dB tyst 40 dB(A) hörbar 50 dB(A) högt ljud |
||
min: | ||
| Av/Standby | |
| Låg belastning | |
| Hög belastning |
|
Förklaring:
min: | |
| Dell XPS 13 9310 OLED i7-1185G7, Iris Xe G7 96EUs, Toshiba XG6 KXG60ZNV512G, OLED, 3456x2160, 13.4" | Dell XPS 13 9310 Core i7 4K i7-1185G7, Iris Xe G7 96EUs, Micron 2300 512GB MTFDHBA512TDV, IPS, 3840x2400, 13.4" | Dell XPS 13 9310 Core i7 FHD i7-1165G7, Iris Xe G7 96EUs, Micron 2300 512GB MTFDHBA512TDV, IPS, 1920x1200, 13.4" | Dell XPS 13 7390 Core i7-10710U i7-10710U, UHD Graphics 620, SK Hynix PC601 NVMe 512 GB, IPS, 3840x2160, 13.3" | MSI Summit E13 Flip Evo A11MT i7-1185G7, Iris Xe G7 96EUs, Phison 1TB SM2801T24GKBB4S-E162, IPS, 1920x1200, 13.4" | |
|---|---|---|---|---|---|
| Power Consumption | -1% | 17% | 2% | -13% | |
| Idle Minimum * (Watt) | 5.7 | 4.3 25% | 3.9 32% | 4.7 18% | 4.8 16% |
| Idle Average * (Watt) | 6 | 8.3 -38% | 5.9 2% | 8.3 -38% | 8.4 -40% |
| Idle Maximum * (Watt) | 12.3 | 8.8 28% | 6.3 49% | 9 27% | 8.6 30% |
| Load Average * (Watt) | 44.4 | 46.2 -4% | 39.7 11% | 42 5% | 47.1 -6% |
| Witcher 3 ultra * (Watt) | 36.5 | 42.2 -16% | 34.8 5% | 51.6 -41% | |
| Load Maximum * (Watt) | 47.8 | 47.3 1% | 47.5 1% | 49 -3% | 65.9 -38% |
* ... mindre är bättre
| Dell XPS 13 9310 OLED i7-1185G7, Iris Xe G7 96EUs, 52 Wh | Dell XPS 13 9310 Core i7 4K i7-1185G7, Iris Xe G7 96EUs, 52 Wh | Dell XPS 13 9310 Core i7 FHD i7-1165G7, Iris Xe G7 96EUs, 52 Wh | Dell XPS 13 7390 Core i7-10710U i7-10710U, UHD Graphics 620, 52 Wh | MSI Summit E13 Flip Evo A11MT i7-1185G7, Iris Xe G7 96EUs, 70 Wh | |
|---|---|---|---|---|---|
| Batteridrifttid | 11% | 69% | 29% | 72% | |
| WiFi v1.3 (h) | 6.5 | 7.2 11% | 11 69% | 8.4 29% | 11.2 72% |
| Reader / Idle (h) | 30 | 21.1 | |||
| Load (h) | 3.2 | 1.8 |
För
Emot
Läs den fullständiga versionen av den här recensionen på engelska här.
I likhet med vad vi konstaterade gällande HP Spectre x360 13 så är OLED inte nödvändigtvis den slutgiltiga skärmtekniken. Den har definitivt fördelar gentemot IPS, men listan över nackdelar är nog precis lika viktig.
Den största och mest uppenbara skillnaden rör bildkvaliteten. Det går inte att säga emot att OLED är överlägset när det kommer till färger, svärta samt svart-vita/grå-grå responstider, vilket ger en märkbart bättre bildupplevelse. Om detta är viktig lyx för ditt arbete i vardagen kanske OLED är mer intressant än IPS.
De visuella fördelarna med OLED är lätta att se, men det finns några kompromisser på andra områden.
Nackdelarna med OLED-skärmen är generellt sett inte lika uppenbara vid en första anblick. För det första är både ljusstyrkan och upplösningen lägre jämfört med XPS 13 4K-alternativet. För det andra används pulsbreddsmodulering med låga frekvenser vilket kan ge mer märkbart flimmer. Slutligen varierar energiförbrukningen till stor del beroende på ljusstyrkan och vilka färger som används, vilket potentiellt sett ger kortare batteritid än IPS.
Kom ihåg att XPS 13 OLED kostar ungefär lika mycket som XPS 13 4K IPS. Man behöver därför inte betala en hel del extra för en lyxig OLED-skärm, till skillnad från många tidigare modeller med OLED som alternativ. Det gör det lättare att rekommendera OLED nuförtiden, så länge man är införstådd med dess för- och nackdelar.
Dell XPS 13 9310 OLED
- 08/31/2022 v7 (old)
Allen Ngo
Price comparison
