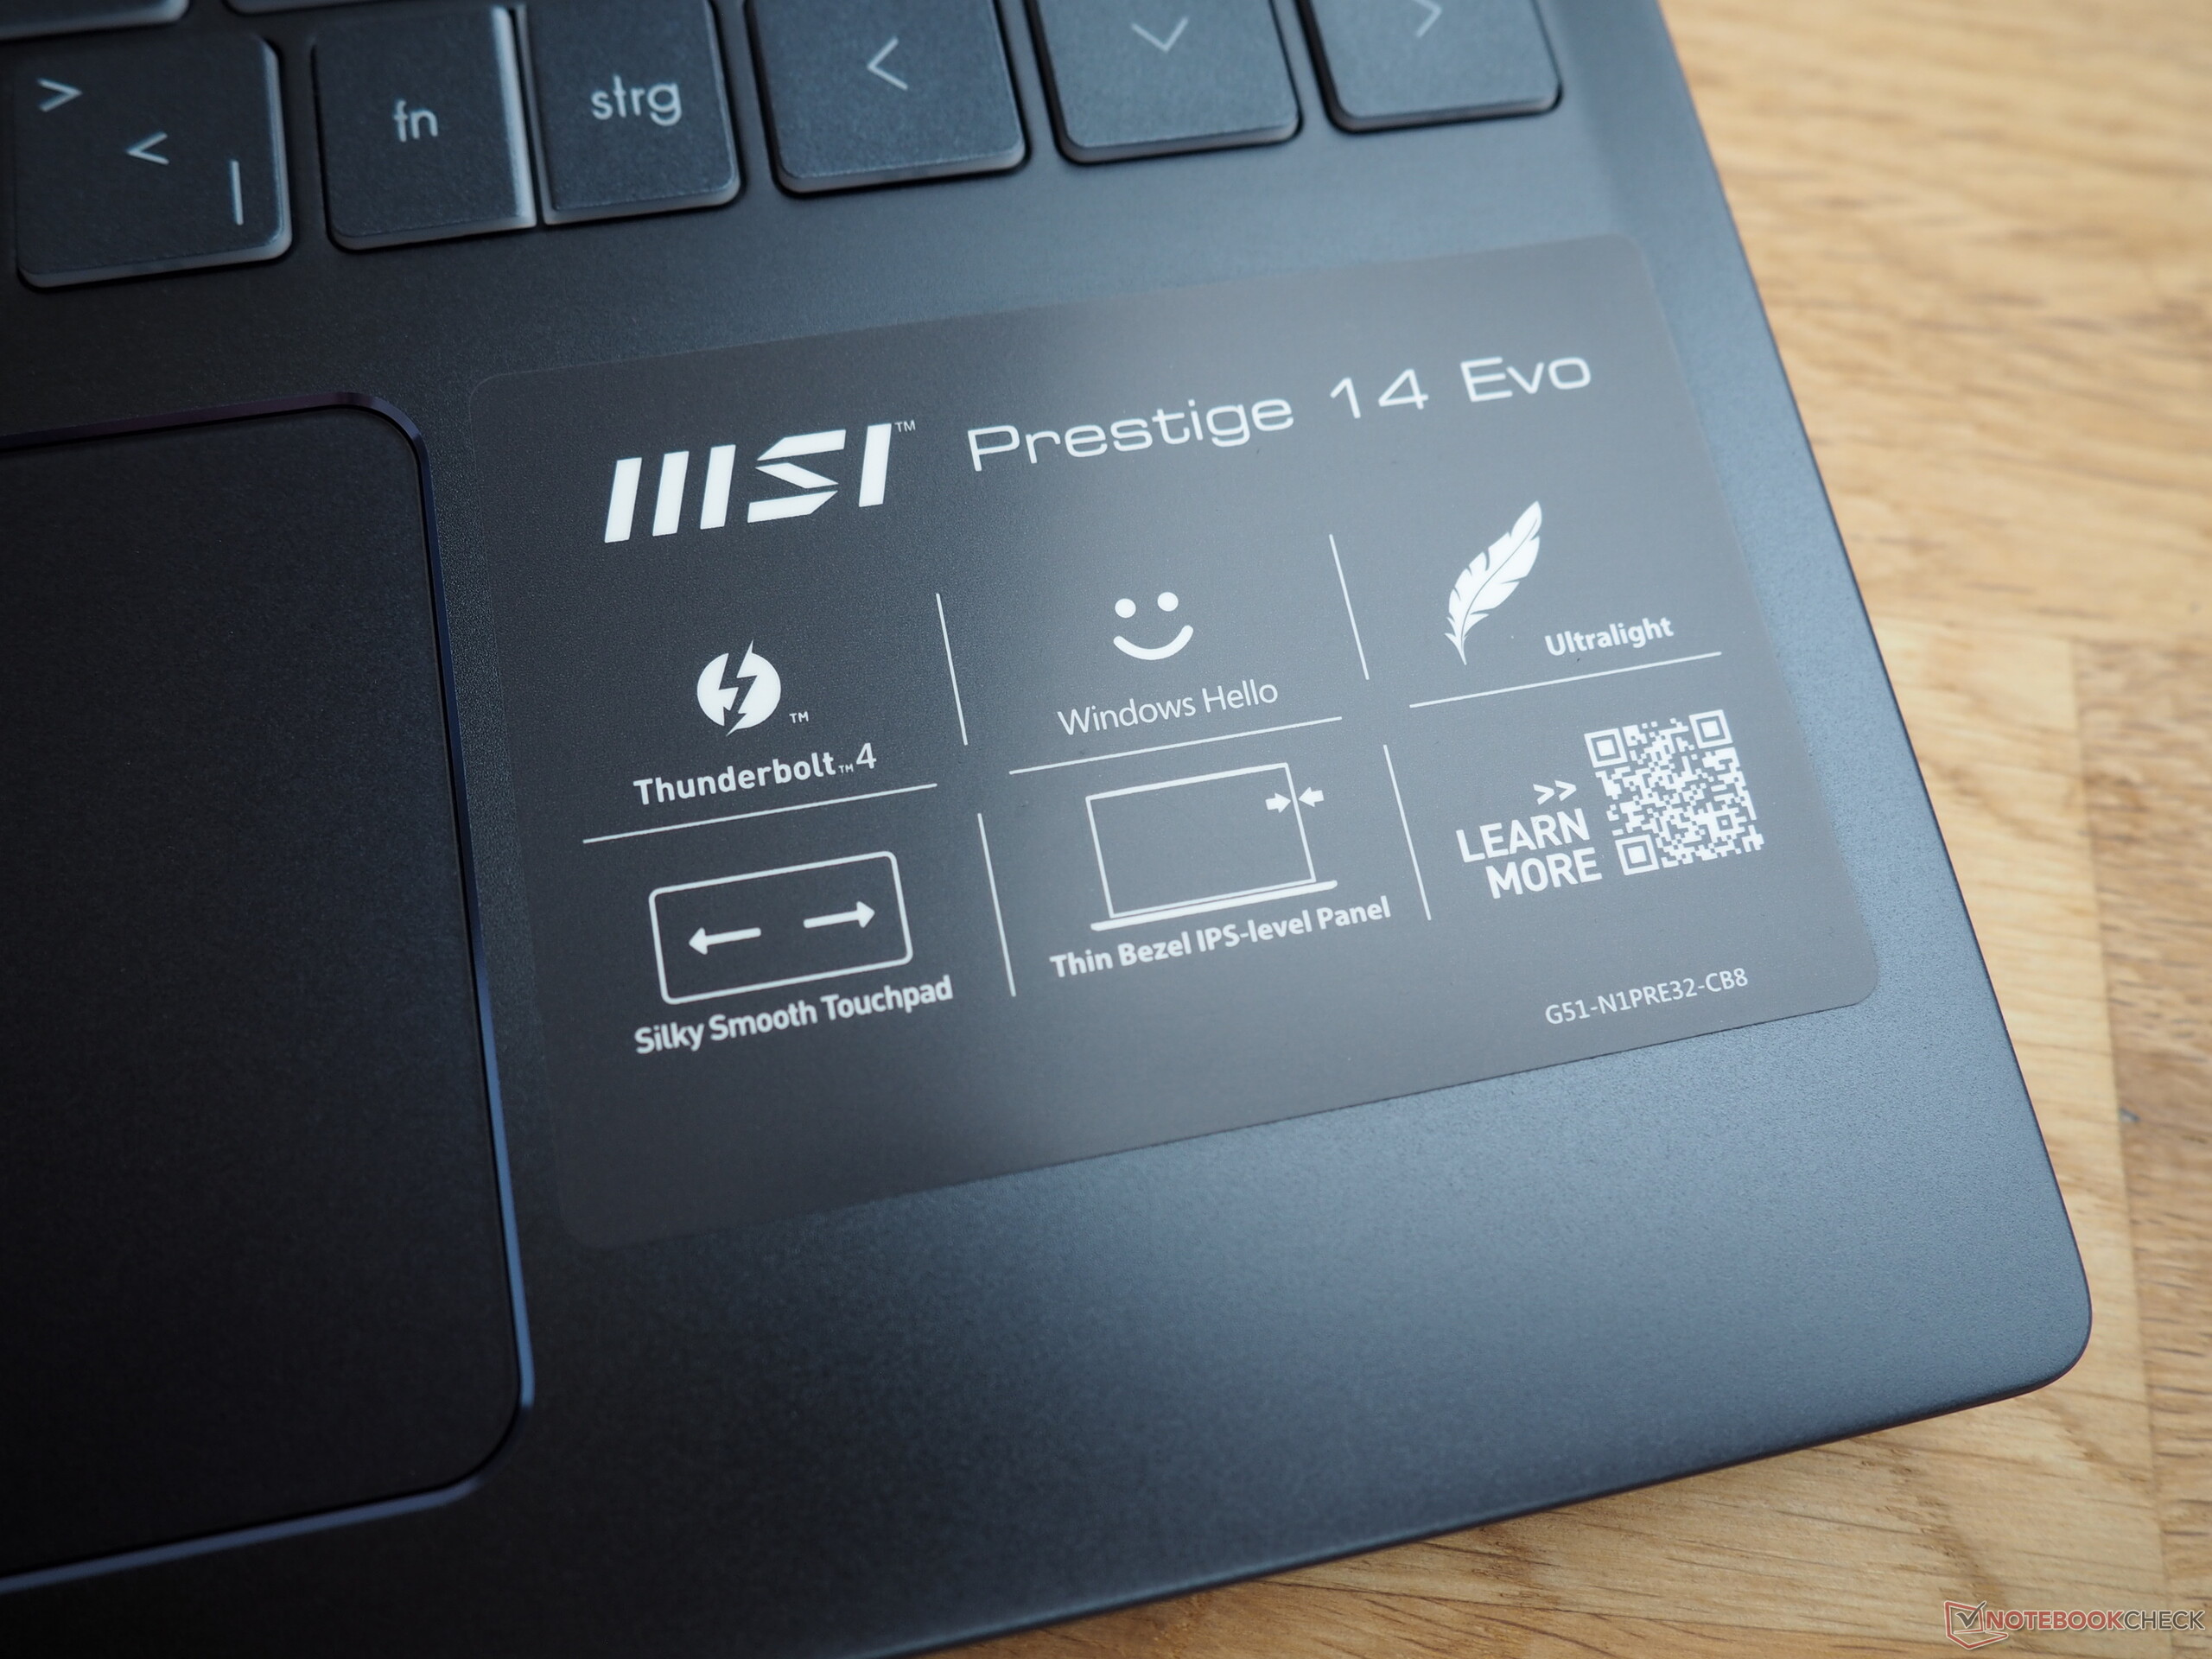
Test: MSI Prestige 14 Evo - Intel närmar sig (Sammanfattning)
Testgrupp
Gradering | Datum | Modell | Vikt | Höjd | Storlek | Upplösning | Pris |
|---|---|---|---|---|---|---|---|
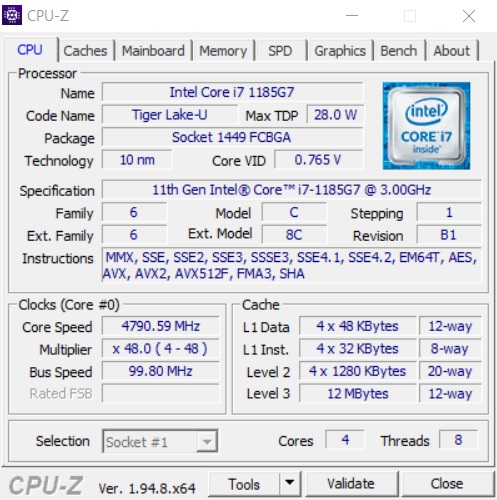
| 82.5 % v7 (old) | 12/2020 | MSI Prestige 14 Evo A11M-005 i7-1185G7, Iris Xe G7 96EUs | 1.2 kg | 16 mm | 14.00" | 1920x1080 | |
| 84.2 % v7 (old) | 10/2020 | Asus ZenBook 14 UX425EA i7-1165G7, Iris Xe G7 96EUs | 1.2 kg | 13.9 mm | 14.00" | 1920x1080 | |
| 85.3 % v7 (old) | 08/2020 | Lenovo Yoga Slim 7-14ARE R7 4800U, Vega 8 | 1.4 kg | 14.9 mm | 14.00" | 1920x1080 | |
| 88.2 % v7 (old) | 11/2020 | HP EliteBook 845 G7 Ryzen 7 Pro 4750U R7 PRO 4750U, Vega 7 | 1.4 kg | 17.9 mm | 14.00" | 1920x1080 | |
| 86.5 % v7 (old) | 06/2020 | Acer Swift 3 SF314-42-R4XJ R7 4700U, Vega 7 | 1.2 kg | 16.55 mm | 14.00" | 1920x1080 |


| |||||||||||||||||||||||||
Distribution av ljusstyrkan: 89 %
Mitt på batteriet: 293 cd/m²
Kontrast: 1628:1 (Svärta: 0.18 cd/m²)
ΔE ColorChecker Calman: 2.95 | ∀{0.5-29.43 Ø4.71}
calibrated: 0.9
ΔE Greyscale Calman: 4.2 | ∀{0.09-98 Ø4.96}
93% sRGB (Argyll 1.6.3 3D)
71% AdobeRGB 1998 (Argyll 1.6.3 3D)
70.9% AdobeRGB 1998 (Argyll 3D)
99.4% sRGB (Argyll 3D)
68.8% Display P3 (Argyll 3D)
Gamma: 2.099
CCT: 6622 K
| MSI Prestige 14 Evo A11M-005 AUO B140HAN06.2 (AUO623D), IPS-Level, 1920x1080, 14" | Asus ZenBook 14 UX425EA AU Optronics B140HAN06.8, IPS, 1920x1080, 14" | Lenovo Yoga Slim 7-14ARE AU Optronics B140HAN06.8, IPS, 1920x1080, 14" | HP EliteBook 845 G7 Ryzen 7 Pro 4750U AU Optronics AUO068B, IPS, 1920x1080, 14" | Acer Swift 3 SF314-42-R4XJ AU Optronics B140HAN04.0, IPS, 1920x1080, 14" | |
|---|---|---|---|---|---|
| Display | -1% | 2% | -1% | -45% | |
| Display P3 Coverage (%) | 68.8 | 68.6 0% | 71.7 4% | 68.2 -1% | 37.2 -46% |
| sRGB Coverage (%) | 99.4 | 98.3 -1% | 99.3 0% | 98.5 -1% | 55.9 -44% |
| AdobeRGB 1998 Coverage (%) | 70.9 | 69.8 -2% | 72.9 3% | 69.8 -2% | 38.43 -46% |
| Response Times | 19% | 17% | -15% | 28% | |
| Response Time Grey 50% / Grey 80% * (ms) | 59.6 ? | 49.6 ? 17% | 45.6 ? 23% | 65.2 ? -9% | 41 ? 31% |
| Response Time Black / White * (ms) | 32.8 ? | 26.4 ? 20% | 29.6 ? 10% | 39.6 ? -21% | 25 ? 24% |
| PWM Frequency (Hz) | |||||
| Screen | -2% | -17% | 1% | -80% | |
| Brightness middle (cd/m²) | 293 | 375.1 28% | 399.6 36% | 432.5 48% | 269 -8% |
| Brightness (cd/m²) | 277 | 371 34% | 385 39% | 405 46% | 244 -12% |
| Brightness Distribution (%) | 89 | 91 2% | 89 0% | 86 -3% | 83 -7% |
| Black Level * (cd/m²) | 0.18 | 0.34 -89% | 0.37 -106% | 0.3 -67% | 0.23 -28% |
| Contrast (:1) | 1628 | 1103 -32% | 1080 -34% | 1442 -11% | 1170 -28% |
| Colorchecker dE 2000 * | 2.95 | 1.79 39% | 3.2 -8% | 2.34 21% | 4.94 -67% |
| Colorchecker dE 2000 max. * | 6.03 | 3.05 49% | 6.44 -7% | 3.59 40% | 20.37 -238% |
| Colorchecker dE 2000 calibrated * | 0.9 | 1.79 -99% | 1.73 -92% | 1.83 -103% | 5.03 -459% |
| Greyscale dE 2000 * | 4.2 | 2.3 45% | 4.7 -12% | 2.5 40% | 1.71 59% |
| Gamma | 2.099 105% | 2.29 96% | 2.21 100% | 2.1 105% | 2.52 87% |
| CCT | 6622 98% | 6405 101% | 7184 90% | 6582 99% | 6535 99% |
| Color Space (Percent of AdobeRGB 1998) (%) | 71 | 63.9 -10% | 66.3 -7% | 63.8 -10% | 35 -51% |
| Color Space (Percent of sRGB) (%) | 93 | 98.8 6% | 99.5 7% | 99.4 7% | 56 -40% |
| Totalt genomsnitt (program/inställningar) | 5% /
0% | 1% /
-9% | -5% /
-2% | -32% /
-60% |
* ... mindre är bättre
Visa svarstider
| ↔ Svarstid svart till vitt | ||
|---|---|---|
| 32.8 ms ... stiga ↗ och falla ↘ kombinerat | ↗ 16.4 ms stiga | 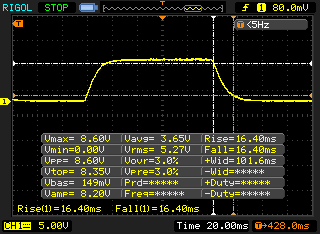 |
| ↘ 16.4 ms hösten | ||
| Skärmen visar långsamma svarsfrekvenser i våra tester och kommer att vara otillfredsställande för spelare. I jämförelse sträcker sig alla testade enheter från 0.1 (minst) till 240 (maximalt) ms. » 88 % av alla enheter är bättre. Detta innebär att den uppmätta svarstiden är sämre än genomsnittet av alla testade enheter (19.8 ms). | ||
| ↔ Svarstid 50 % grått till 80 % grått | ||
| 59.6 ms ... stiga ↗ och falla ↘ kombinerat | ↗ 26.4 ms stiga | 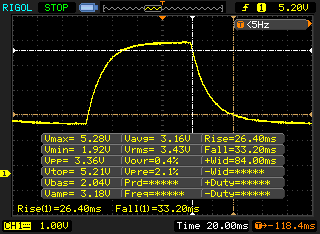 |
| ↘ 33.2 ms hösten | ||
| Skärmen visar långsamma svarsfrekvenser i våra tester och kommer att vara otillfredsställande för spelare. I jämförelse sträcker sig alla testade enheter från 0.165 (minst) till 636 (maximalt) ms. » 96 % av alla enheter är bättre. Detta innebär att den uppmätta svarstiden är sämre än genomsnittet av alla testade enheter (31 ms). | ||
Skärmflimmer / PWM (Puls-Width Modulation)
| Skärmflimmer / PWM upptäcktes inte | 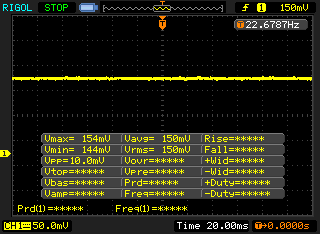 | ||
Som jämförelse: 52 % av alla testade enheter använder inte PWM för att dämpa skärmen. Om PWM upptäcktes mättes ett medelvärde av 7757 (minst: 5 - maximum: 343500) Hz. | |||
* ... mindre är bättre
| PCMark 10 Score | 4894 poäng | |
Hjälp | ||
| DPC Latencies / LatencyMon - interrupt to process latency (max), Web, Youtube, Prime95 | |
| Lenovo Yoga Slim 7-14ARE | |
| Acer Swift 3 SF314-42-R4XJ | |
| Asus ZenBook 14 UX425EA | |
| HP EliteBook 845 G7 Ryzen 7 Pro 4750U | |
| MSI Prestige 14 Evo A11M-005 | |
* ... mindre är bättre
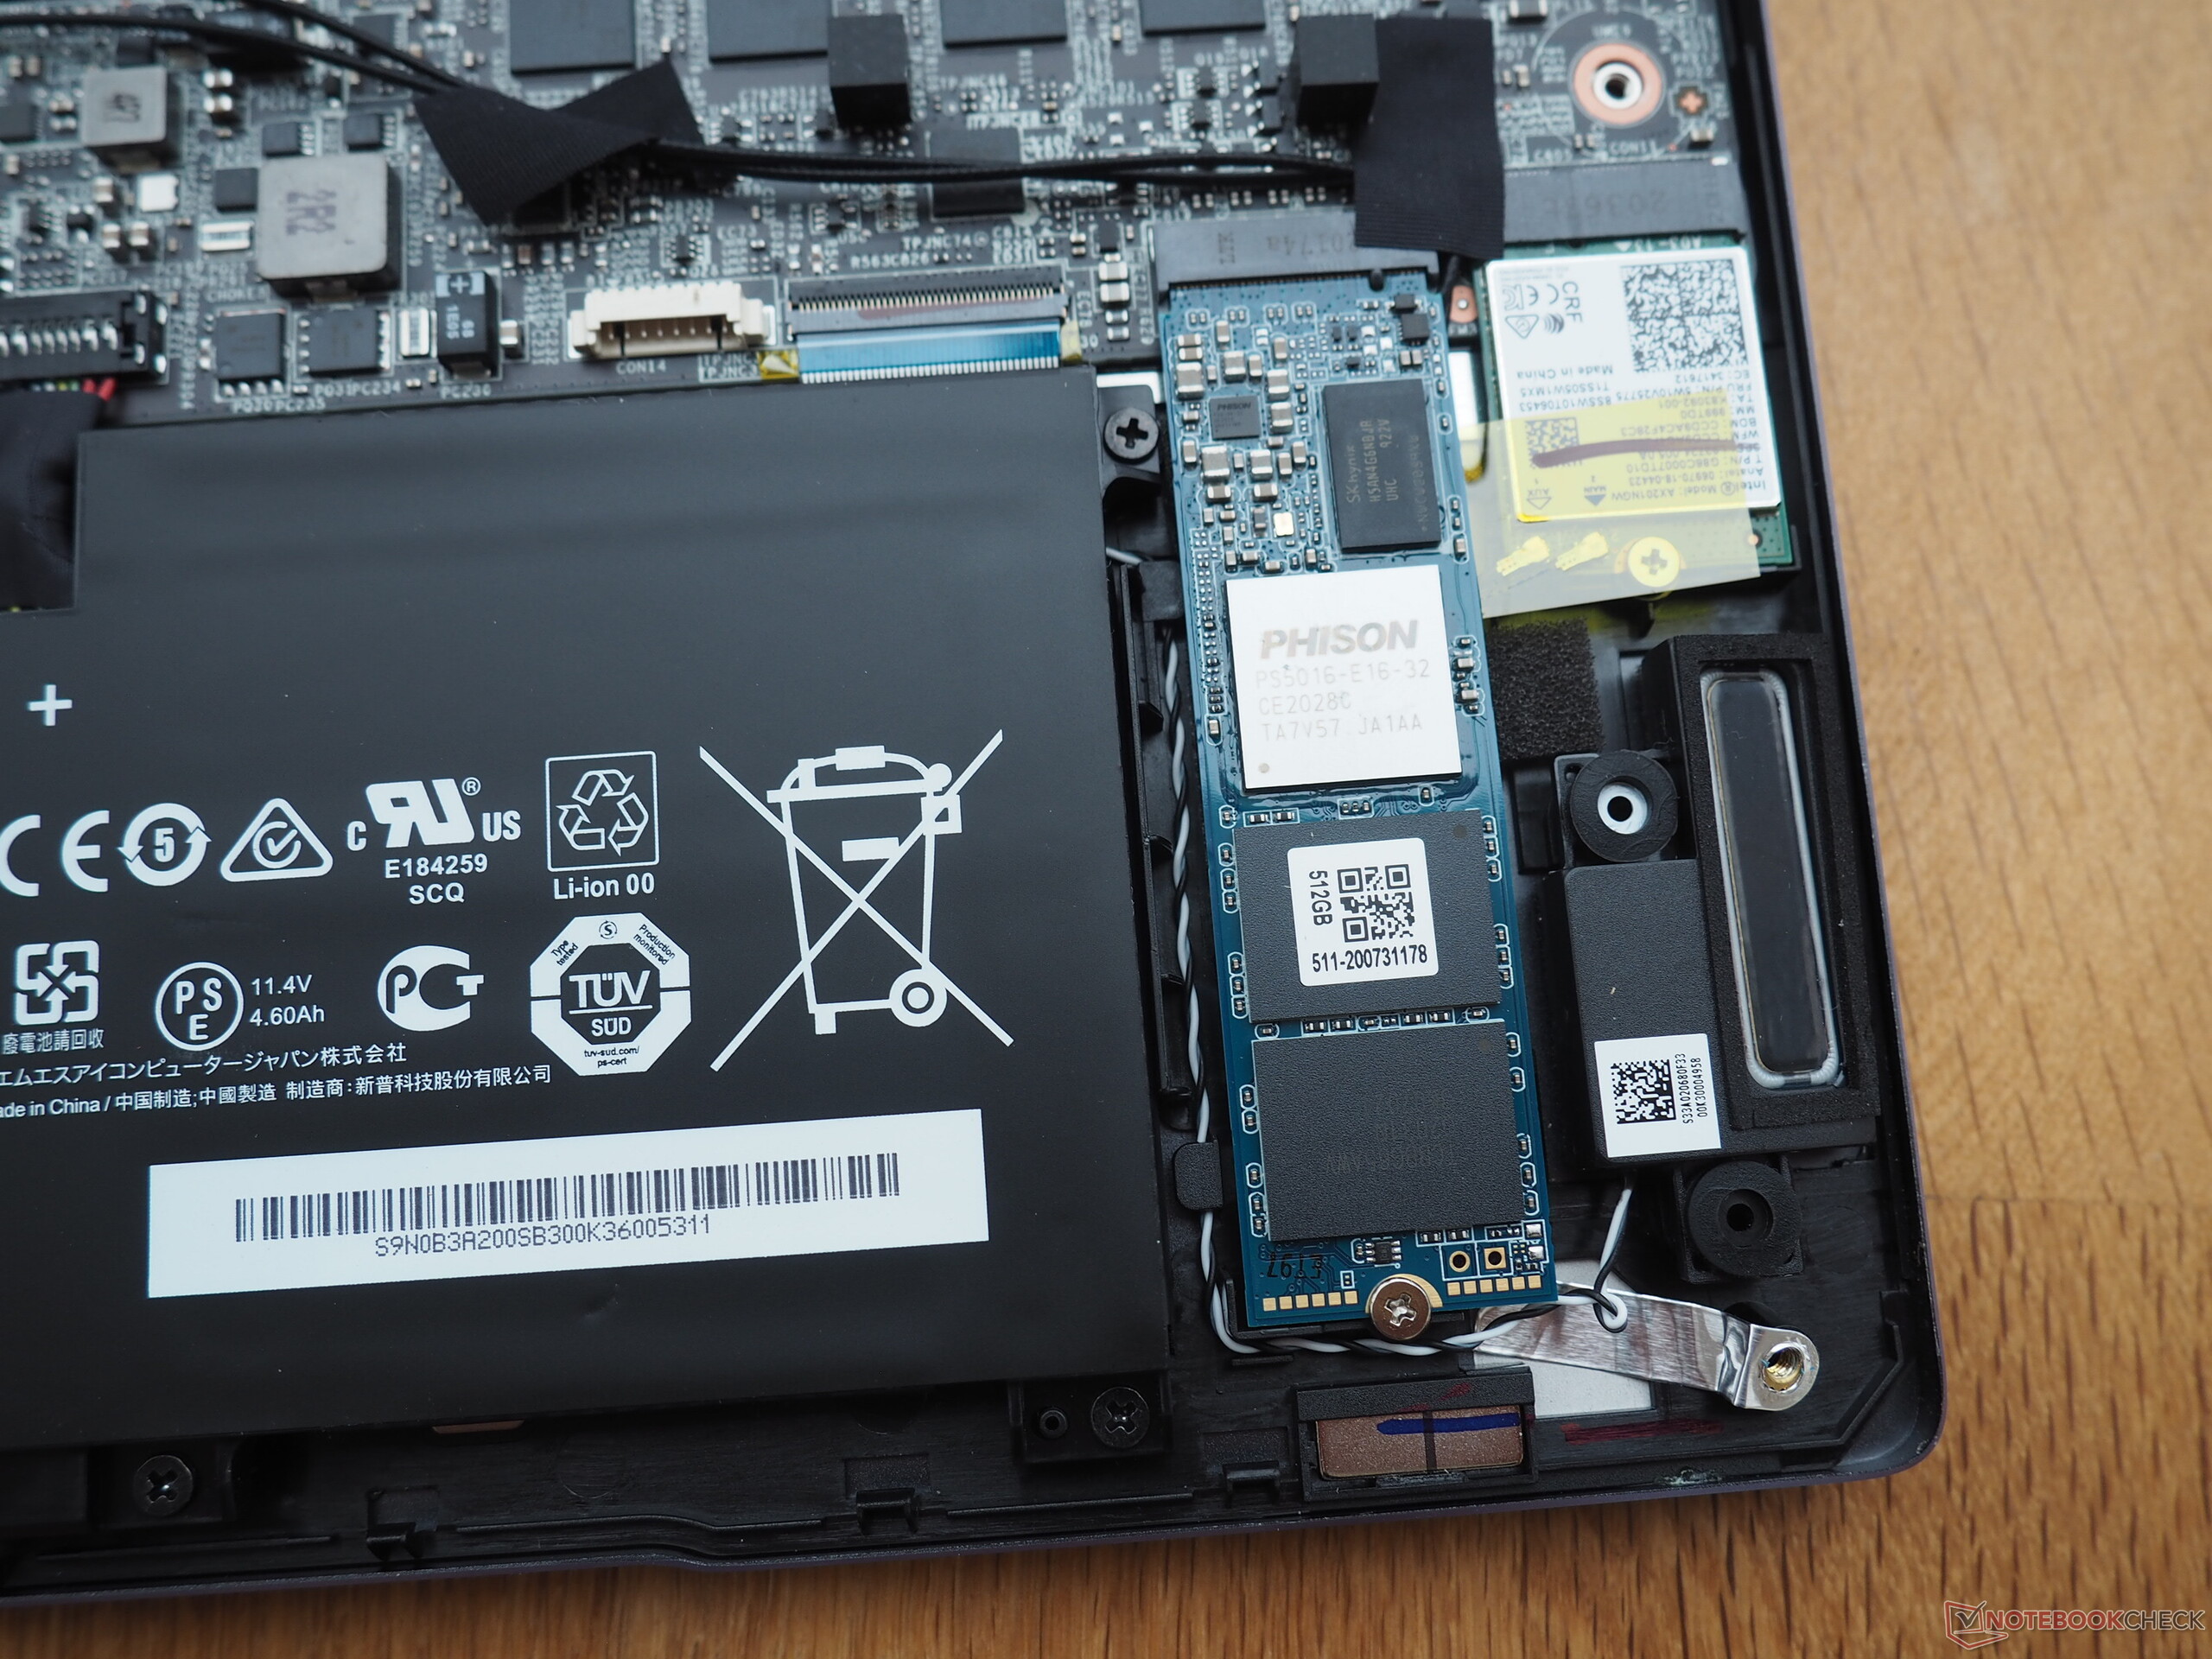
| MSI Prestige 14 Evo A11M-005 Phison 512GB SM280512GKBB4S-E162 | Asus ZenBook 14 UX425EA Intel SSD 660p 1TB SSDPEKNW010T8 | Lenovo Yoga Slim 7-14ARE Samsung SSD PM981a MZVLB512HBJQ | HP EliteBook 845 G7 Ryzen 7 Pro 4750U Samsung SSD PM981a MZVLB256HBHQ | Acer Swift 3 SF314-42-R4XJ Samsung PM991 MZVLQ1T0HALB | |
|---|---|---|---|---|---|
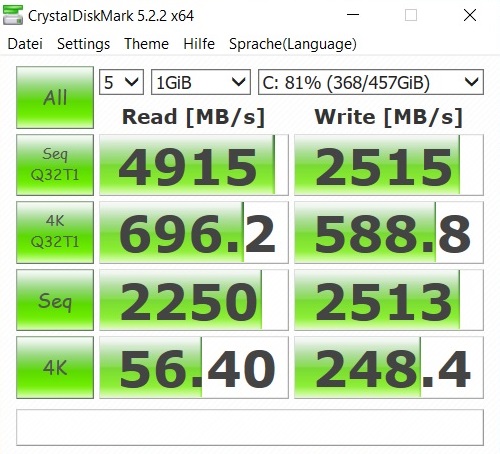
| CrystalDiskMark 5.2 / 6 | -37% | -10% | -19% | -41% | |
| Write 4K (MB/s) | 248.4 | 132.3 -47% | 146.1 -41% | 111.4 -55% | 98.8 -60% |
| Read 4K (MB/s) | 56.4 | 51.7 -8% | 47.18 -16% | 58.2 3% | 32.44 -42% |
| Write Seq (MB/s) | 2513 | 1264 -50% | 2896 15% | 2195 -13% | 1582 -37% |
| Read Seq (MB/s) | 2250 | 1484 -34% | 2754 22% | 2516 12% | 1471 -35% |
| Write 4K Q32T1 (MB/s) | 589 | 478.4 -19% | 425.8 -28% | 472.1 -20% | 375.4 -36% |
| Read 4K Q32T1 (MB/s) | 696 | 366.9 -47% | 514 -26% | 380.5 -45% | 491.9 -29% |
| Write Seq Q32T1 (MB/s) | 2515 | 1750 -30% | 2989 19% | 2339 -7% | 1574 -37% |
| Read Seq Q32T1 (MB/s) | 4915 | 1970 -60% | 3568 -27% | 3565 -27% | 2329 -53% |
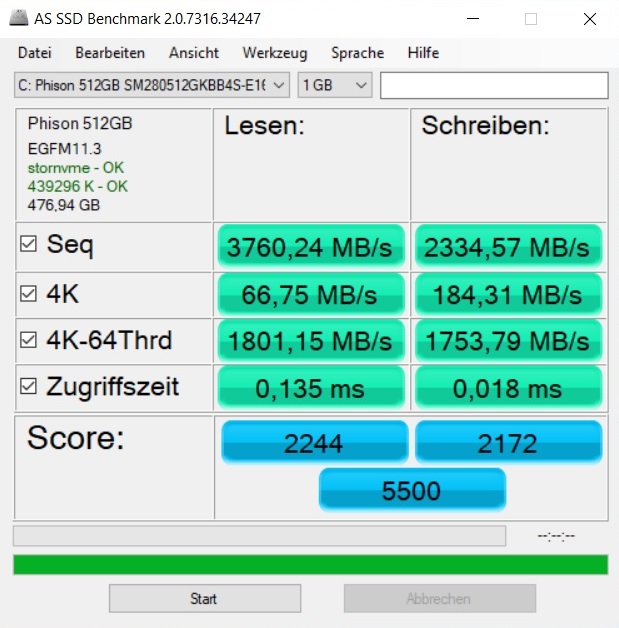
| AS SSD | -87% | -39% | -63% | -64% | |
| Seq Read (MB/s) | 3760 | 1219 -68% | 1658 -56% | 1976 -47% | 1960 -48% |
| Seq Write (MB/s) | 2335 | 947 -59% | 2464 6% | 1389 -41% | 1547 -34% |
| 4K Read (MB/s) | 66.8 | 50.9 -24% | 59.5 -11% | 50.7 -24% | 31.56 -53% |
| 4K Write (MB/s) | 184.3 | 150.9 -18% | 128.6 -30% | 105.5 -43% | 116.6 -37% |
| 4K-64 Read (MB/s) | 1801 | 587 -67% | 1576 -12% | 853 -53% | 454.7 -75% |
| 4K-64 Write (MB/s) | 1754 | 862 -51% | 1986 13% | 1970 12% | 262.1 -85% |
| Access Time Read * (ms) | 0.135 | 0.083 39% | 0.049 64% | 0.058 57% | |
| Access Time Write * (ms) | 0.018 | 0.114 -533% | 0.087 -383% | 0.104 -478% | 0.034 -89% |
| Score Read (Points) | 2244 | 760 -66% | 1802 -20% | 1101 -51% | 682 -70% |
| Score Write (Points) | 2172 | 1108 -49% | 2361 9% | 2214 2% | 533 -75% |
| Score Total (Points) | 5500 | 2260 -59% | 5133 -7% | 3862 -30% | 1552 -72% |
| Totalt genomsnitt (program/inställningar) | -62% /
-66% | -25% /
-27% | -41% /
-45% | -53% /
-54% |
* ... mindre är bättre

| 3DMark 11 Performance | 7522 poäng | |
| 3DMark Ice Storm Standard Score | 101457 poäng | |
| 3DMark Cloud Gate Standard Score | 20821 poäng | |
| 3DMark Fire Strike Score | 5332 poäng | |
| 3DMark Time Spy Score | 1859 poäng | |
Hjälp | ||
| The Witcher 3 | |
| 1920x1080 High Graphics & Postprocessing (Nvidia HairWorks Off) | |
| Genomsnitt av klass Office (23.7 - 53.4, n=3, senaste 2 åren) | |
| MSI Prestige 14 Evo A11M-005 | |
| Asus ZenBook 14 UX425EA | |
| Lenovo Yoga Slim 7-14ARE | |
| HP EliteBook 845 G7 Ryzen 7 Pro 4750U | |
| Acer Swift 3 SF314-42-R4XJ | |
| 1920x1080 Ultra Graphics & Postprocessing (HBAO+) | |
| Genomsnitt av klass Office (14.8 - 28.1, n=3, senaste 2 åren) | |
| MSI Prestige 14 Evo A11M-005 | |
| Lenovo Yoga Slim 7-14ARE | |
| HP EliteBook 845 G7 Ryzen 7 Pro 4750U | |
| Asus ZenBook 14 UX425EA | |
| Acer Swift 3 SF314-42-R4XJ | |
| låg | med. | hög | ultra | |
|---|---|---|---|---|
| GTA V (2015) | 96.4 | 87.8 | 31.9 | 12.2 |
| The Witcher 3 (2015) | 96.4 | 64.7 | 33.4 | 16 |
| Dota 2 Reborn (2015) | 83.2 | 76.4 | 54.3 | 51.6 |
| X-Plane 11.11 (2018) | 50.5 | 37 | 32.4 | |
| Shadow of the Tomb Raider (2018) | 63 | 24 | 22 | 0 |
| Battlefield V (2018) | 83.9 | 42.5 | 36.8 | 29.9 |
| Borderlands 3 (2019) | 50.3 | 26.4 | 15.9 | 12.1 |
| Ghost Recon Breakpoint (2019) | 46 allvarliga grafiska problem | 36 allvarliga grafiska problem | 32 allvarliga grafiska problem | 23 allvarliga grafiska problem |
| Valorant (2020) | 171 | 124 | 112 | |
| Horizon Zero Dawn (2020) | 0 spelet startar inte | 0 spelet startar inte | 0 spelet startar inte | 0 spelet startar inte |
| Crysis Remastered (2020) | 58.3 | 19.5 | 11.7 | 8.99 |
| FIFA 21 (2020) | 190 | 90.3 | 84.3 | 60.9 |
| Watch Dogs Legion (2020) | 46 allvarliga grafiska problem | 27 allvarliga grafiska problem | 0 allvarliga grafiska problem | 0 allvarliga grafiska problem |
| Dirt 5 (2020) | 0 spelet startar inte | 0 spelet startar inte | 0 spelet startar inte | 0 spelet startar inte |
| Assassin´s Creed Valhalla (2020) | 0 spelet startar inte | 0 spelet startar inte | 0 spelet startar inte | 0 spelet startar inte |
| Call of Duty Black Ops Cold War (2020) | 0 spelet startar inte | 0 spelet startar inte | 0 spelet startar inte | 0 spelet startar inte |
| Yakuza Like a Dragon (2020) | 43.4 | 24.4 | 23.3 | 20.2 |
| Immortals Fenyx Rising (2020) | 39 | 26 | 23 | 21 |
| Cyberpunk 2077 1.0 (2020) | 0 spelet startar inte | 0 spelet startar inte | 0 spelet startar inte | 0 spelet startar inte |
| Hitman 3 (2021) | 85 | 39 | ||
| Outriders (2021) | 49.9 | 29.9 | 26.2 | 26.2 |
| Resident Evil Village (2021) | 53.4 | 24.9 | 23.2 | 21.4 |
| Mass Effect Legendary Edition (2021) | 63.8 | 0 () | ||
| Days Gone (2021) | 31.9 | 23.4 | 21 | 16.5 |
| Monster Hunter Stories 2 (2021) | 79.6 | 56.6 | 50.1 | |
| F1 2021 (2021) | 0 spelet startar inte | 0 spelet startar inte | 0 spelet startar inte | 0 spelet startar inte |
| Deathloop (2021) | 0 spelet startar inte | |||
| New World (2021) | 35.2 | 23.6 | 20.9 | 17.1 |
| Alan Wake Remastered (2021) | 53.1 | 42.2 | ||
| Far Cry 6 (2021) | 0 spelet startar inte (crash) | 0 spelet startar inte (crash) | 0 spelet startar inte (crash) | 0 spelet startar inte (crash) |
| Back 4 Blood (2021) | 49.1 | 39.1 | 35 | 33.7 |
| Guardians of the Galaxy (2021) | 0 spelet startar inte | 0 spelet startar inte | 0 spelet startar inte | 0 spelet startar inte |
| Riders Republic (2021) | 33 | 22 | 18 | 16 |
| Call of Duty Vanguard (2021) | 0 allvarliga grafiska problem | |||
| Forza Horizon 5 (2021) | 49 | 0 () | ||
| Battlefield 2042 (2021) | 0 spelet startar inte (crash) | |||
| Farming Simulator 22 (2021) | 103 | 0 () | 0 () | 0 () |
| Halo Infinite (2021) | 0 spelet startar inte (no GPU support) |
Ljudnivå
| Låg belastning |
| 25 / 27 / 39 dB(A) |
| Hög belastning |
| 43 / 43 dB(A) |
 | ||
30 dB tyst 40 dB(A) hörbar 50 dB(A) högt ljud |
||
min: | ||
| MSI Prestige 14 Evo A11M-005 i7-1185G7, Iris Xe G7 96EUs | Asus ZenBook 14 UX425EA i7-1165G7, Iris Xe G7 96EUs | Lenovo Yoga Slim 7-14ARE R7 4800U, Vega 8 | HP EliteBook 845 G7 Ryzen 7 Pro 4750U R7 PRO 4750U, Vega 7 | Acer Swift 3 SF314-42-R4XJ R7 4700U, Vega 7 | Genomsnitt av klass Office | |
|---|---|---|---|---|---|---|
| Noise | -2% | 10% | -1% | -0% | 12% | |
| av / miljö * (dB) | 24 | 29.8 -24% | 26.3 -10% | 30 -25% | 31.2 -30% | 24.2 ? -1% |
| Idle Minimum * (dB) | 25 | 29.9 -20% | 26.5 -6% | 30.6 -22% | 31.2 -25% | 24.3 ? 3% |
| Idle Average * (dB) | 27 | 31 -15% | 26.5 2% | 30.6 -13% | 31.2 -16% | 24.6 ? 9% |
| Idle Maximum * (dB) | 39 | 31 21% | 26.5 32% | 30.6 22% | 31.2 20% | 25.3 ? 35% |
| Load Average * (dB) | 43 | 35.6 17% | 31.8 26% | 33.6 22% | 33.8 21% | 34.2 ? 20% |
| Witcher 3 ultra * (dB) | 39 | 37.4 4% | 35.9 8% | 36.3 7% | ||
| Load Maximum * (dB) | 43 | 40.8 5% | 35.9 17% | 39.2 9% | 33.5 22% | 41.4 ? 4% |
* ... mindre är bättre
(-) Den maximala temperaturen på ovansidan är 50 °C / 122 F, jämfört med genomsnittet av 34.3 °C / 94 F , allt från 21.2 till 62.5 °C för klassen Office.
(-) Botten värms upp till maximalt 61 °C / 142 F, jämfört med genomsnittet av 36.8 °C / 98 F
(+) Vid tomgångsbruk är medeltemperaturen för ovansidan 27.6 °C / 82 F, jämfört med enhetsgenomsnittet på 29.5 °C / ### class_avg_f### F.
(-) När du spelar The Witcher 3 är medeltemperaturen för ovansidan 41.3 °C / 106 F, jämfört med enhetsgenomsnittet på 29.5 °C / ## #class_avg_f### F.
(-) Handledsstöden och pekplattan kan bli väldigt varma vid beröring med maximalt 41 °C / 105.8 F.
(-) Medeltemperaturen för handledsstödsområdet på liknande enheter var 27.5 °C / 81.5 F (-13.5 °C / -24.3 F).
| MSI Prestige 14 Evo A11M-005 i7-1185G7, Iris Xe G7 96EUs | Asus ZenBook 14 UX425EA i7-1165G7, Iris Xe G7 96EUs | Lenovo Yoga Slim 7-14ARE R7 4800U, Vega 8 | HP EliteBook 845 G7 Ryzen 7 Pro 4750U R7 PRO 4750U, Vega 7 | Acer Swift 3 SF314-42-R4XJ R7 4700U, Vega 7 | Genomsnitt av klass Office | |
|---|---|---|---|---|---|---|
| Heat | 11% | 14% | 13% | 16% | 13% | |
| Maximum Upper Side * (°C) | 50 | 41 18% | 43.8 12% | 43.6 13% | 39.5 21% | 40.4 ? 19% |
| Maximum Bottom * (°C) | 61 | 44.4 27% | 43 30% | 52.6 14% | 43.6 29% | 42.5 ? 30% |
| Idle Upper Side * (°C) | 28 | 28 -0% | 24.8 11% | 22.4 20% | 25.9 7% | 27.3 ? 2% |
| Idle Bottom * (°C) | 29 | 29.8 -3% | 28.6 1% | 27.2 6% | 26.6 8% | 28.5 ? 2% |
* ... mindre är bättre
MSI Prestige 14 Evo A11M-005 ljudanalys
(±) | högtalarljudstyrkan är genomsnittlig men bra (75 dB)
Bas 100 - 315 Hz
(-) | nästan ingen bas - i genomsnitt 24.3% lägre än medianen
(±) | linjäriteten för basen är genomsnittlig (9.8% delta till föregående frekvens)
Mellan 400 - 2000 Hz
(±) | högre mellan - i genomsnitt 8.5% högre än median
(±) | linjäriteten för mids är genomsnittlig (11% delta till föregående frekvens)
Högsta 2 - 16 kHz
(+) | balanserade toppar - endast 2.8% från medianen
(+) | toppar är linjära (6.5% delta till föregående frekvens)
Totalt 100 - 16 000 Hz
(±) | linjäriteten för det totala ljudet är genomsnittlig (27.2% skillnad mot median)
Jämfört med samma klass
» 84% av alla testade enheter i den här klassen var bättre, 5% liknande, 10% sämre
» Den bästa hade ett delta på 7%, genomsnittet var 21%, sämst var 53%
Jämfört med alla testade enheter
» 83% av alla testade enheter var bättre, 4% liknande, 13% sämre
» Den bästa hade ett delta på 4%, genomsnittet var 23%, sämst var 134%
Asus ZenBook 14 UX425EA ljudanalys
(+) | högtalare kan spela relativt högt (87.5 dB)
Bas 100 - 315 Hz
(-) | nästan ingen bas - i genomsnitt 18.5% lägre än medianen
(±) | linjäriteten för basen är genomsnittlig (12.1% delta till föregående frekvens)
Mellan 400 - 2000 Hz
(±) | högre mellan - i genomsnitt 6.9% högre än median
(+) | mids är linjära (4.5% delta till föregående frekvens)
Högsta 2 - 16 kHz
(+) | balanserade toppar - endast 4.1% från medianen
(±) | linjäriteten för toppar är genomsnittlig (7.3% delta till föregående frekvens)
Totalt 100 - 16 000 Hz
(±) | linjäriteten för det totala ljudet är genomsnittlig (17.3% skillnad mot median)
Jämfört med samma klass
» 49% av alla testade enheter i den här klassen var bättre, 7% liknande, 44% sämre
» Den bästa hade ett delta på 5%, genomsnittet var 17%, sämst var 45%
Jämfört med alla testade enheter
» 32% av alla testade enheter var bättre, 8% liknande, 59% sämre
» Den bästa hade ett delta på 4%, genomsnittet var 23%, sämst var 134%
| Av/Standby | |
| Låg belastning | |
| Hög belastning |
|
Förklaring:
min: | |
| MSI Prestige 14 Evo A11M-005 i7-1185G7, Iris Xe G7 96EUs | Asus ZenBook 14 UX425EA i7-1165G7, Iris Xe G7 96EUs | Lenovo Yoga Slim 7-14ARE R7 4800U, Vega 8 | HP EliteBook 845 G7 Ryzen 7 Pro 4750U R7 PRO 4750U, Vega 7 | Acer Swift 3 SF314-42-R4XJ R7 4700U, Vega 7 | Genomsnitt av klass Office | |
|---|---|---|---|---|---|---|
| Power Consumption | 21% | 9% | 30% | 28% | 10% | |
| Idle Minimum * (Watt) | 5 | 4.8 4% | 4 20% | 2.6 48% | 2.8 44% | 4.3 ? 14% |
| Idle Average * (Watt) | 7 | 6.5 7% | 6.3 10% | 5 29% | 4.8 31% | 7.35 ? -5% |
| Idle Maximum * (Watt) | 11 | 7.7 30% | 7.7 30% | 5.6 49% | 6.7 39% | 8.6 ? 22% |
| Load Average * (Watt) | 54 | 29.6 45% | 48.3 11% | 39.8 26% | 28 48% | 43.9 ? 19% |
| Witcher 3 ultra * (Watt) | 39 | 28.6 27% | 49 -26% | 37.1 5% | 57 -46% | |
| Load Maximum * (Watt) | 65 | 57.8 11% | 57.6 11% | 49.9 23% | 31 52% | 64.5 ? 1% |
* ... mindre är bättre
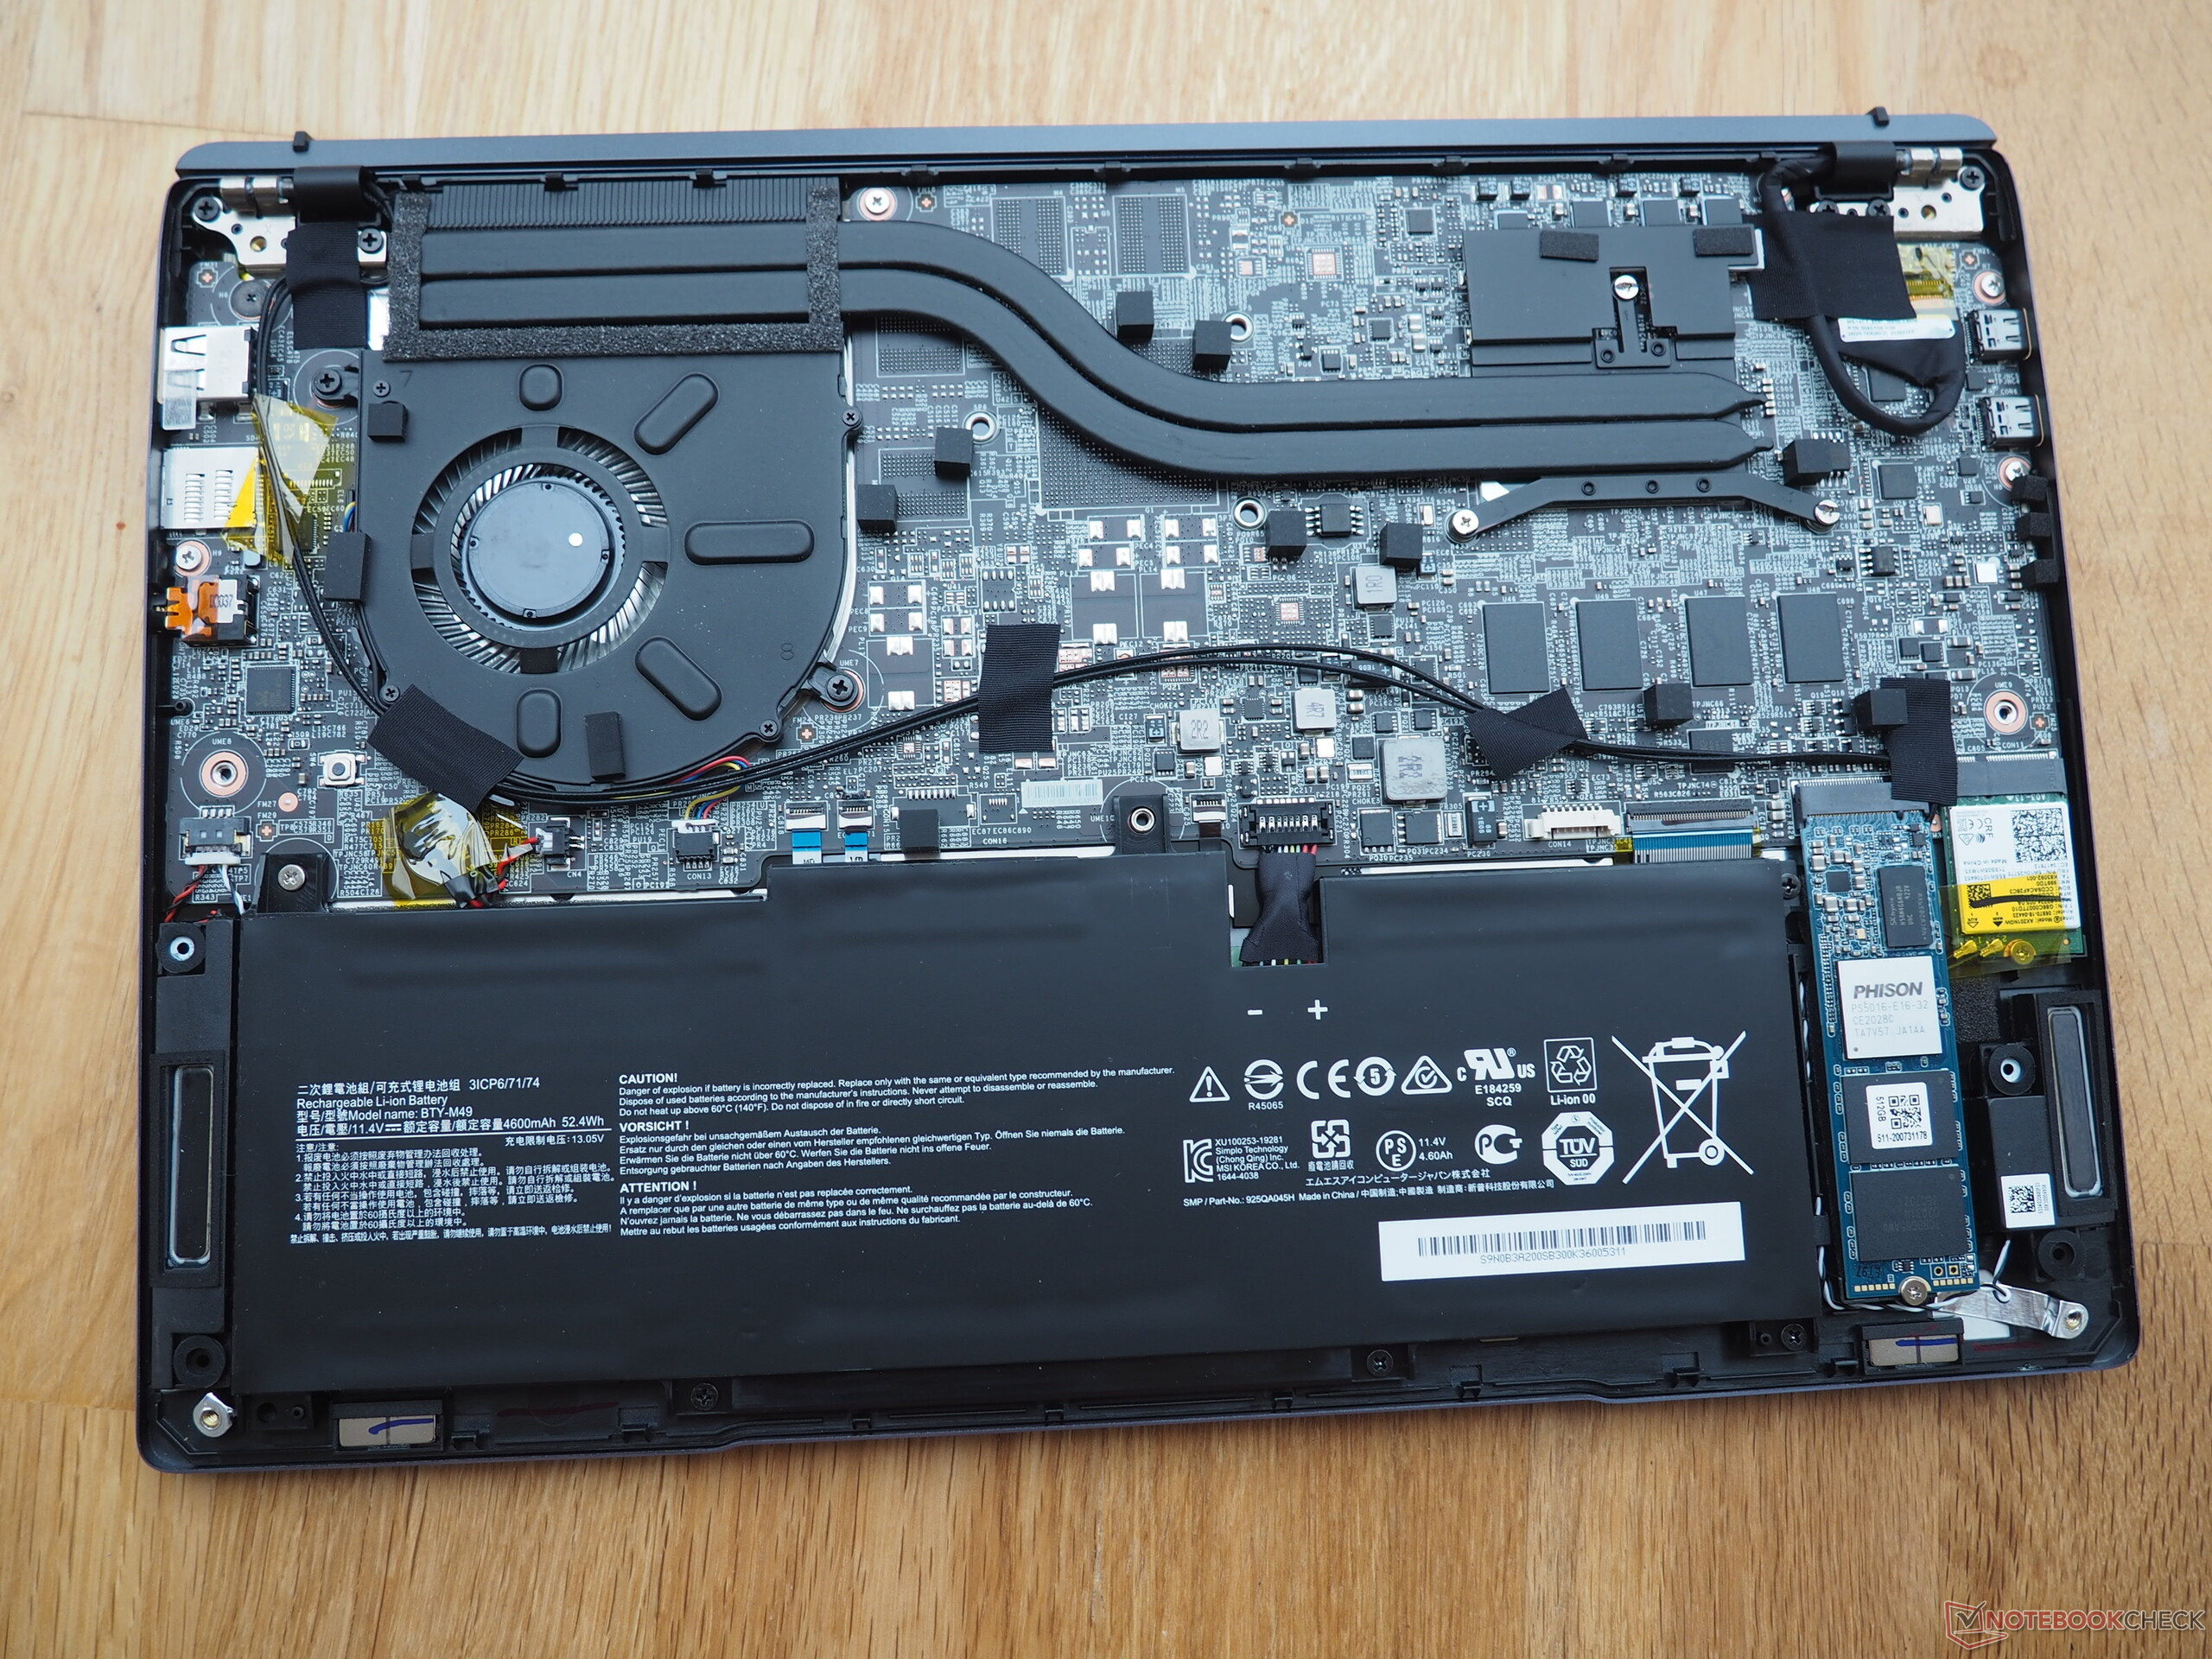
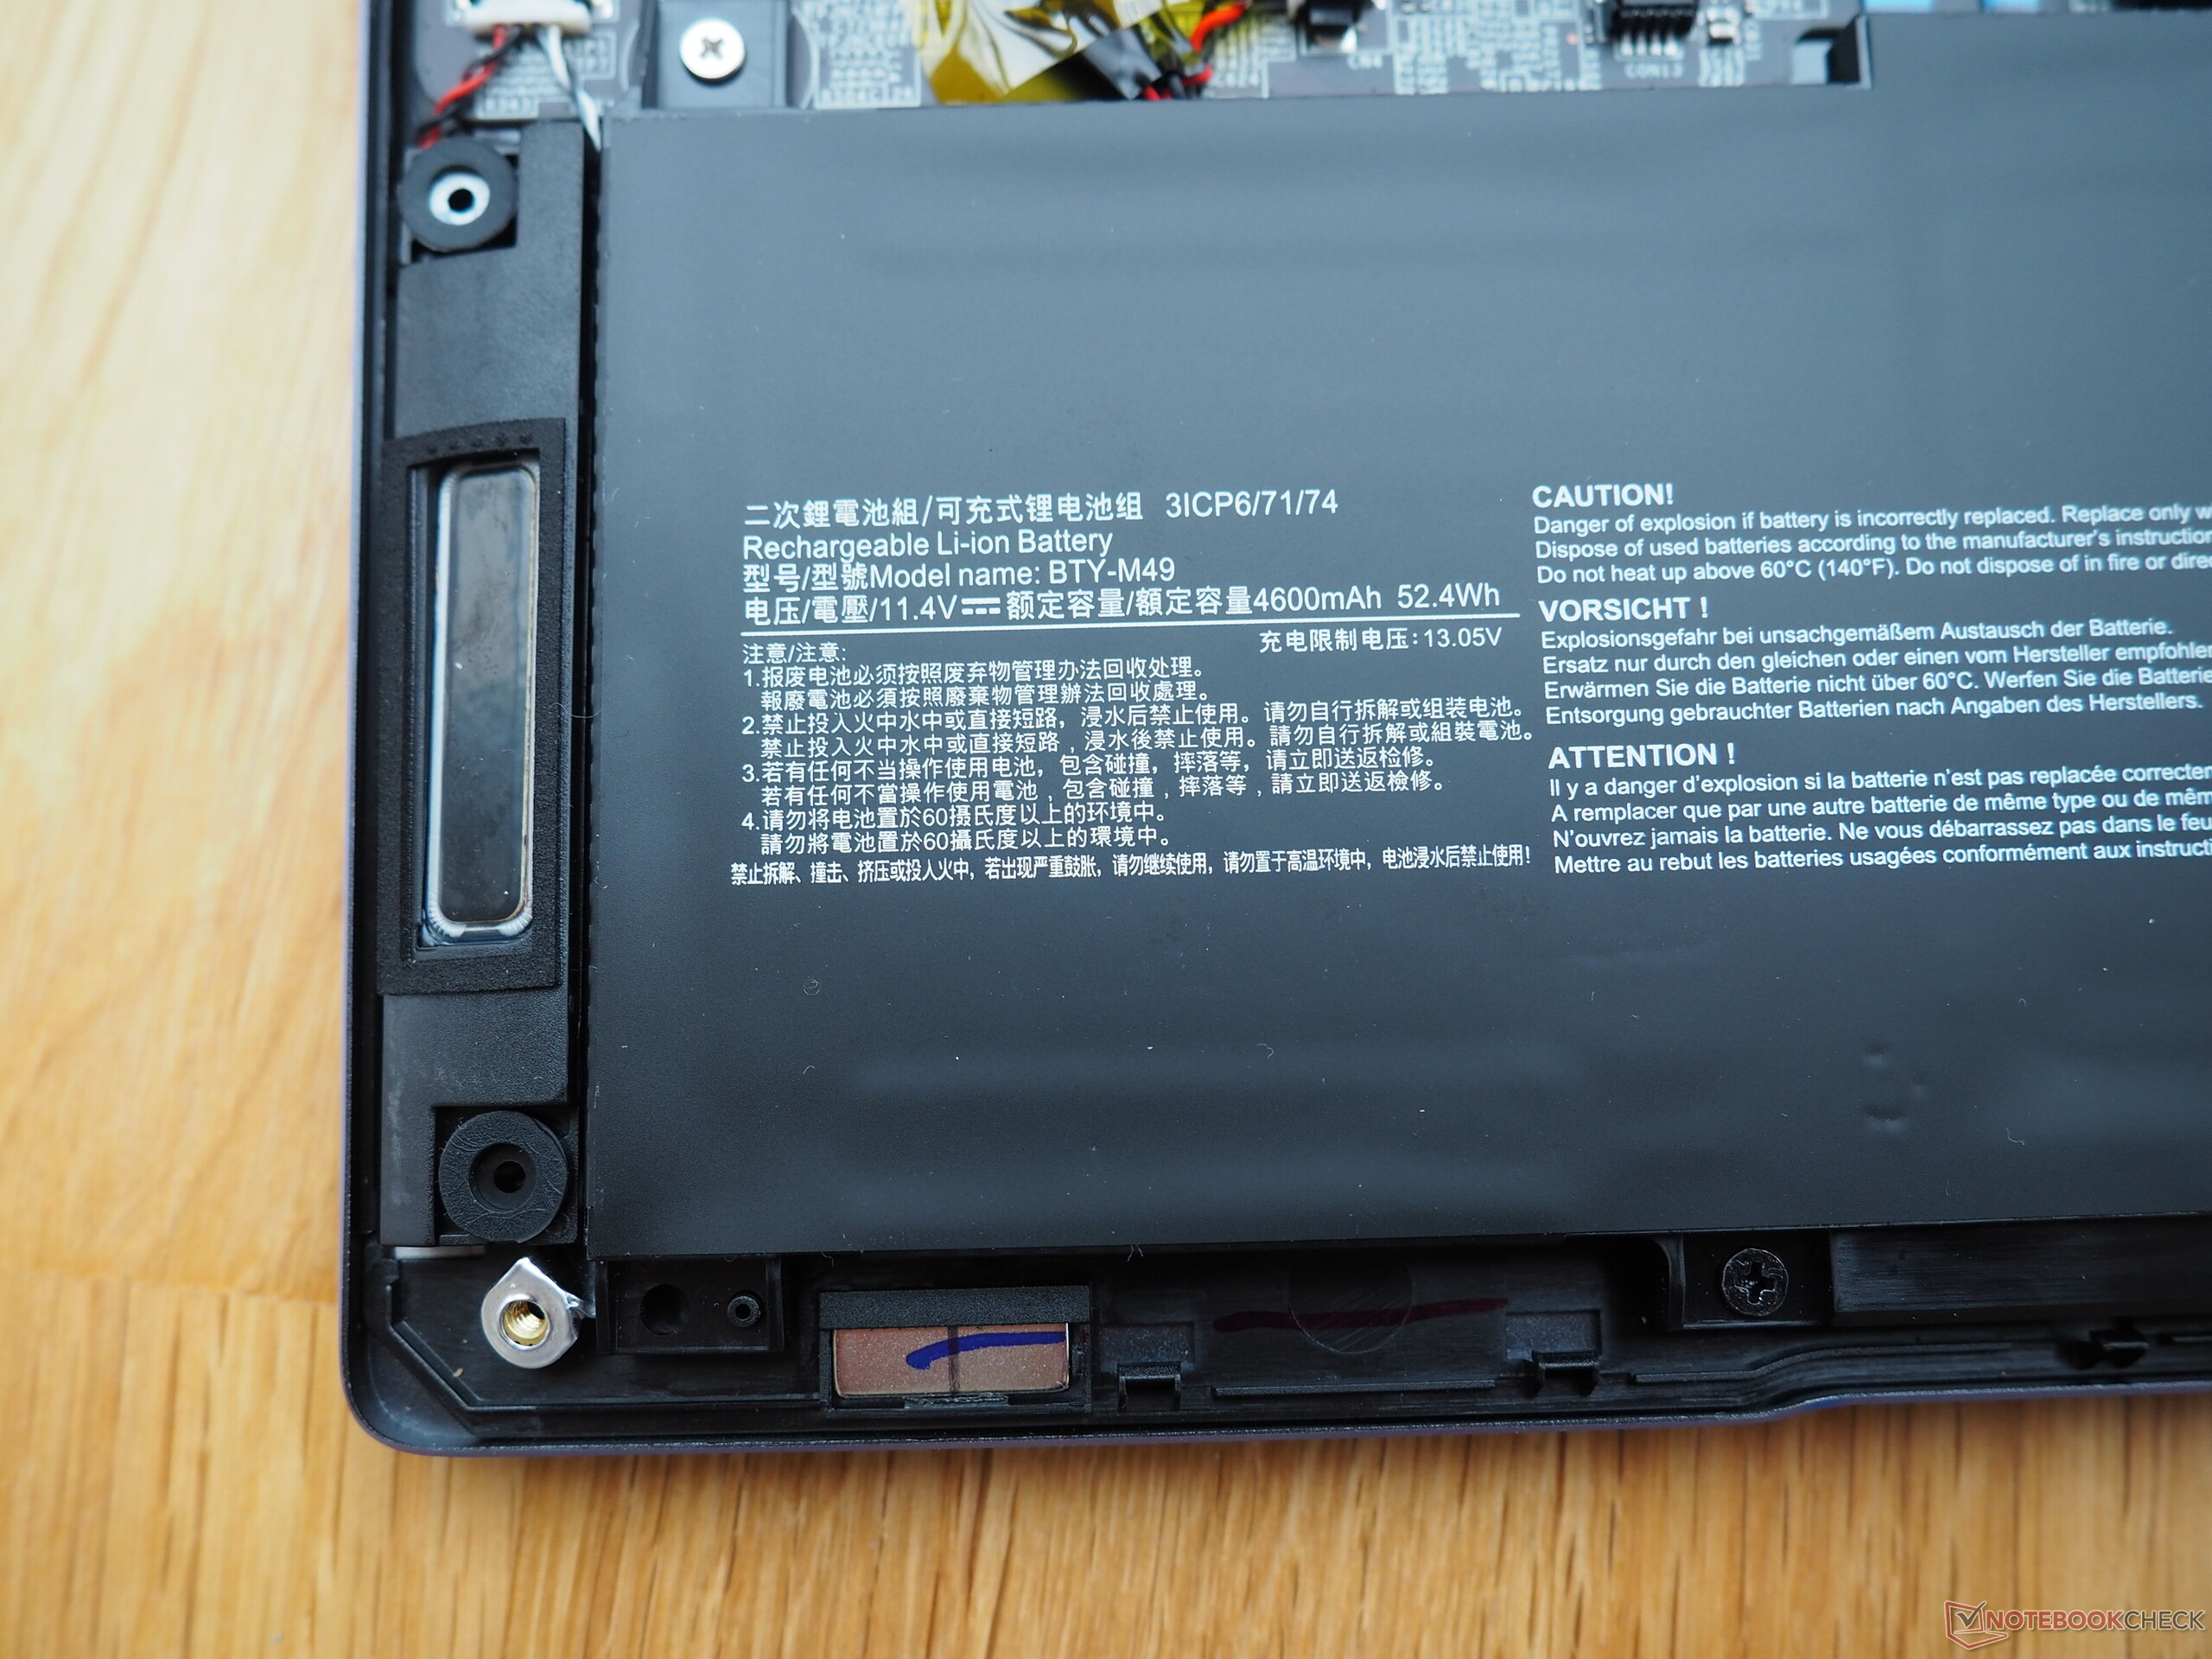
| MSI Prestige 14 Evo A11M-005 i7-1185G7, Iris Xe G7 96EUs, 52.4 Wh | Asus ZenBook 14 UX425EA i7-1165G7, Iris Xe G7 96EUs, 67 Wh | Lenovo Yoga Slim 7-14ARE R7 4800U, Vega 8, 61 Wh | HP EliteBook 845 G7 Ryzen 7 Pro 4750U R7 PRO 4750U, Vega 7, 53 Wh | Acer Swift 3 SF314-42-R4XJ R7 4700U, Vega 7, 48.85 Wh | Genomsnitt av klass Office | |
|---|---|---|---|---|---|---|
| Batteridrifttid | 118% | 50% | 77% | 67% | 72% | |
| Reader / Idle (h) | 13.8 | 25.9 88% | 27.1 96% | 23.2 68% | 24.5 ? 78% | |
| WiFi v1.3 (h) | 7.5 | 13.1 75% | 10.3 37% | 13.3 77% | 11.9 59% | 13 ? 73% |
| Load (h) | 1.1 | 3.2 191% | 1.3 18% | 1.9 73% | 1.808 ? 64% | |
| H.264 (h) | 16.1 | 15.5 ? |
För
Emot
Läs den fullständiga versionen av den här recensionen på engelska här.
Med Tiger Lake-generationen försöker Intel minska avståndet från AMD, vilket verkligen är på tiden.
Men planen har bara lyckats till viss del. Även om grafikprestandan har tagit ett stort steg framåt på Core i7-1185G7 (Iris Xe Graphics G7) så är relationen mellan processorprestanda och pris fortfarande bättre hos AMD. I motsvarande prisskikt erbjuder Intels konkurrent redan åttakärniga processorer med 16 trådar istället för fyrkärniga med åtta trådar, vilket belöner vissa program med betydligt högre prestanda. Dessutom är AMD-modellerna mer energieffektiva (mindre värmeutveckling, längre batteritid).
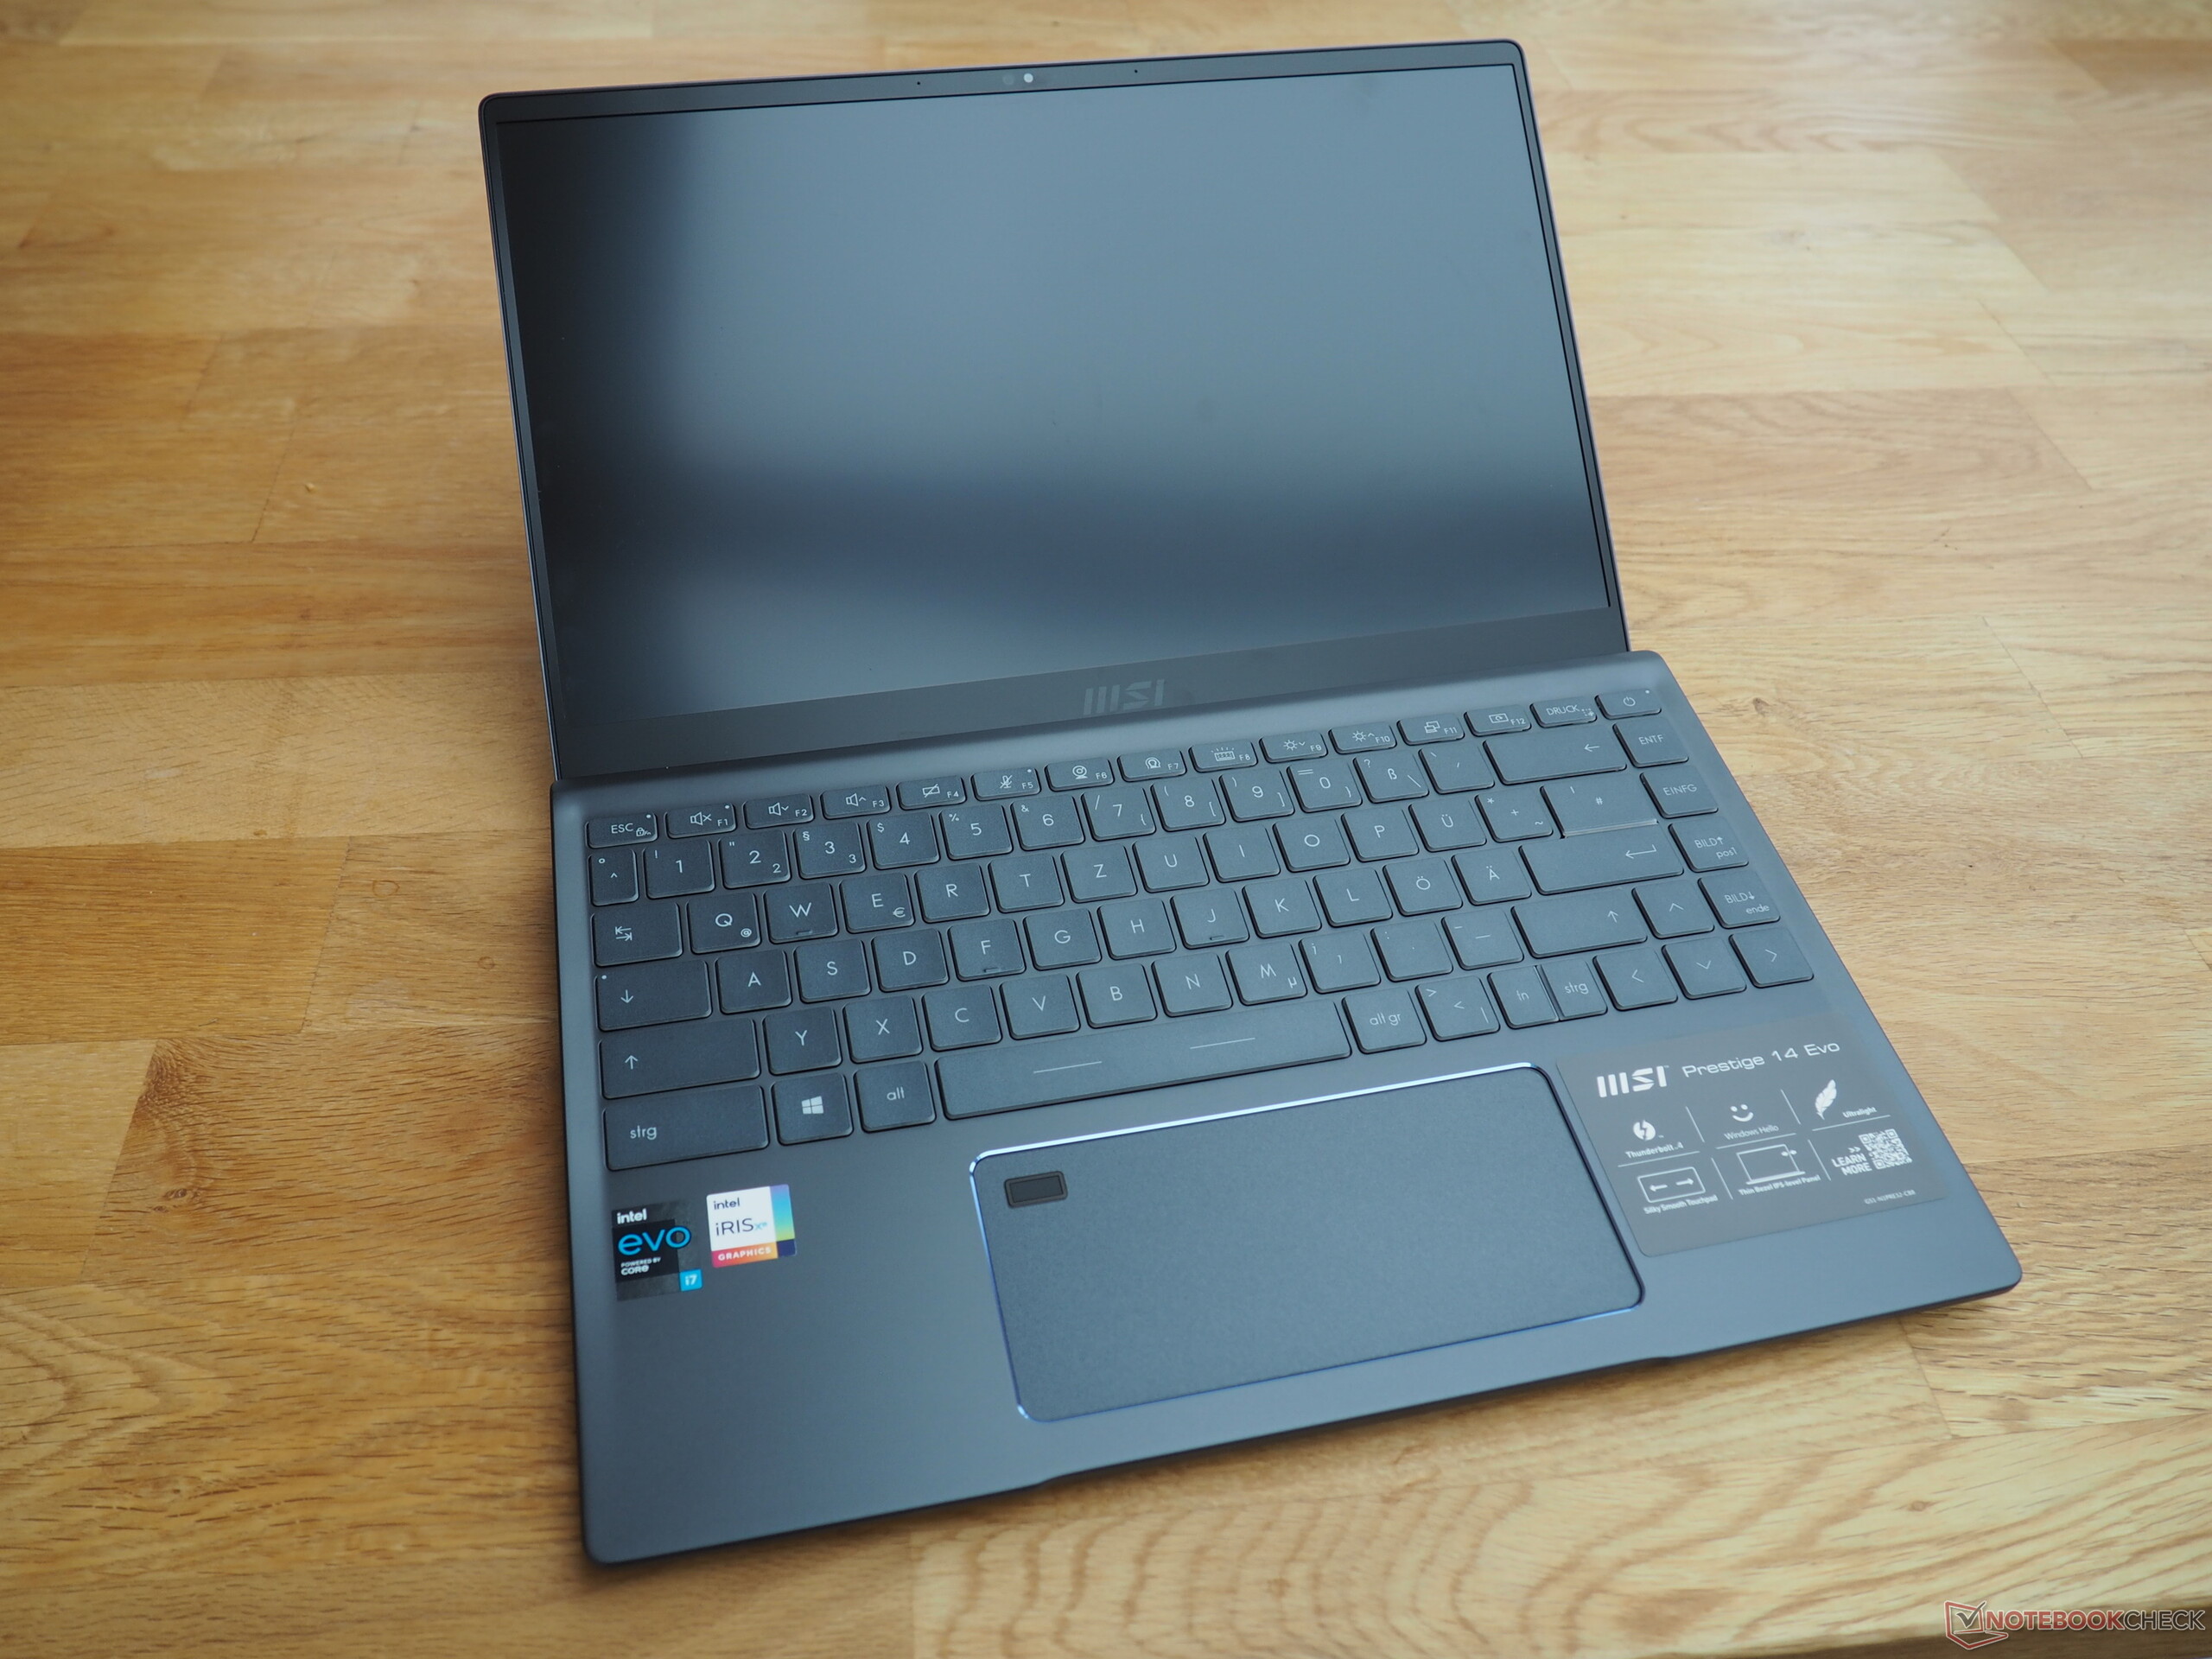
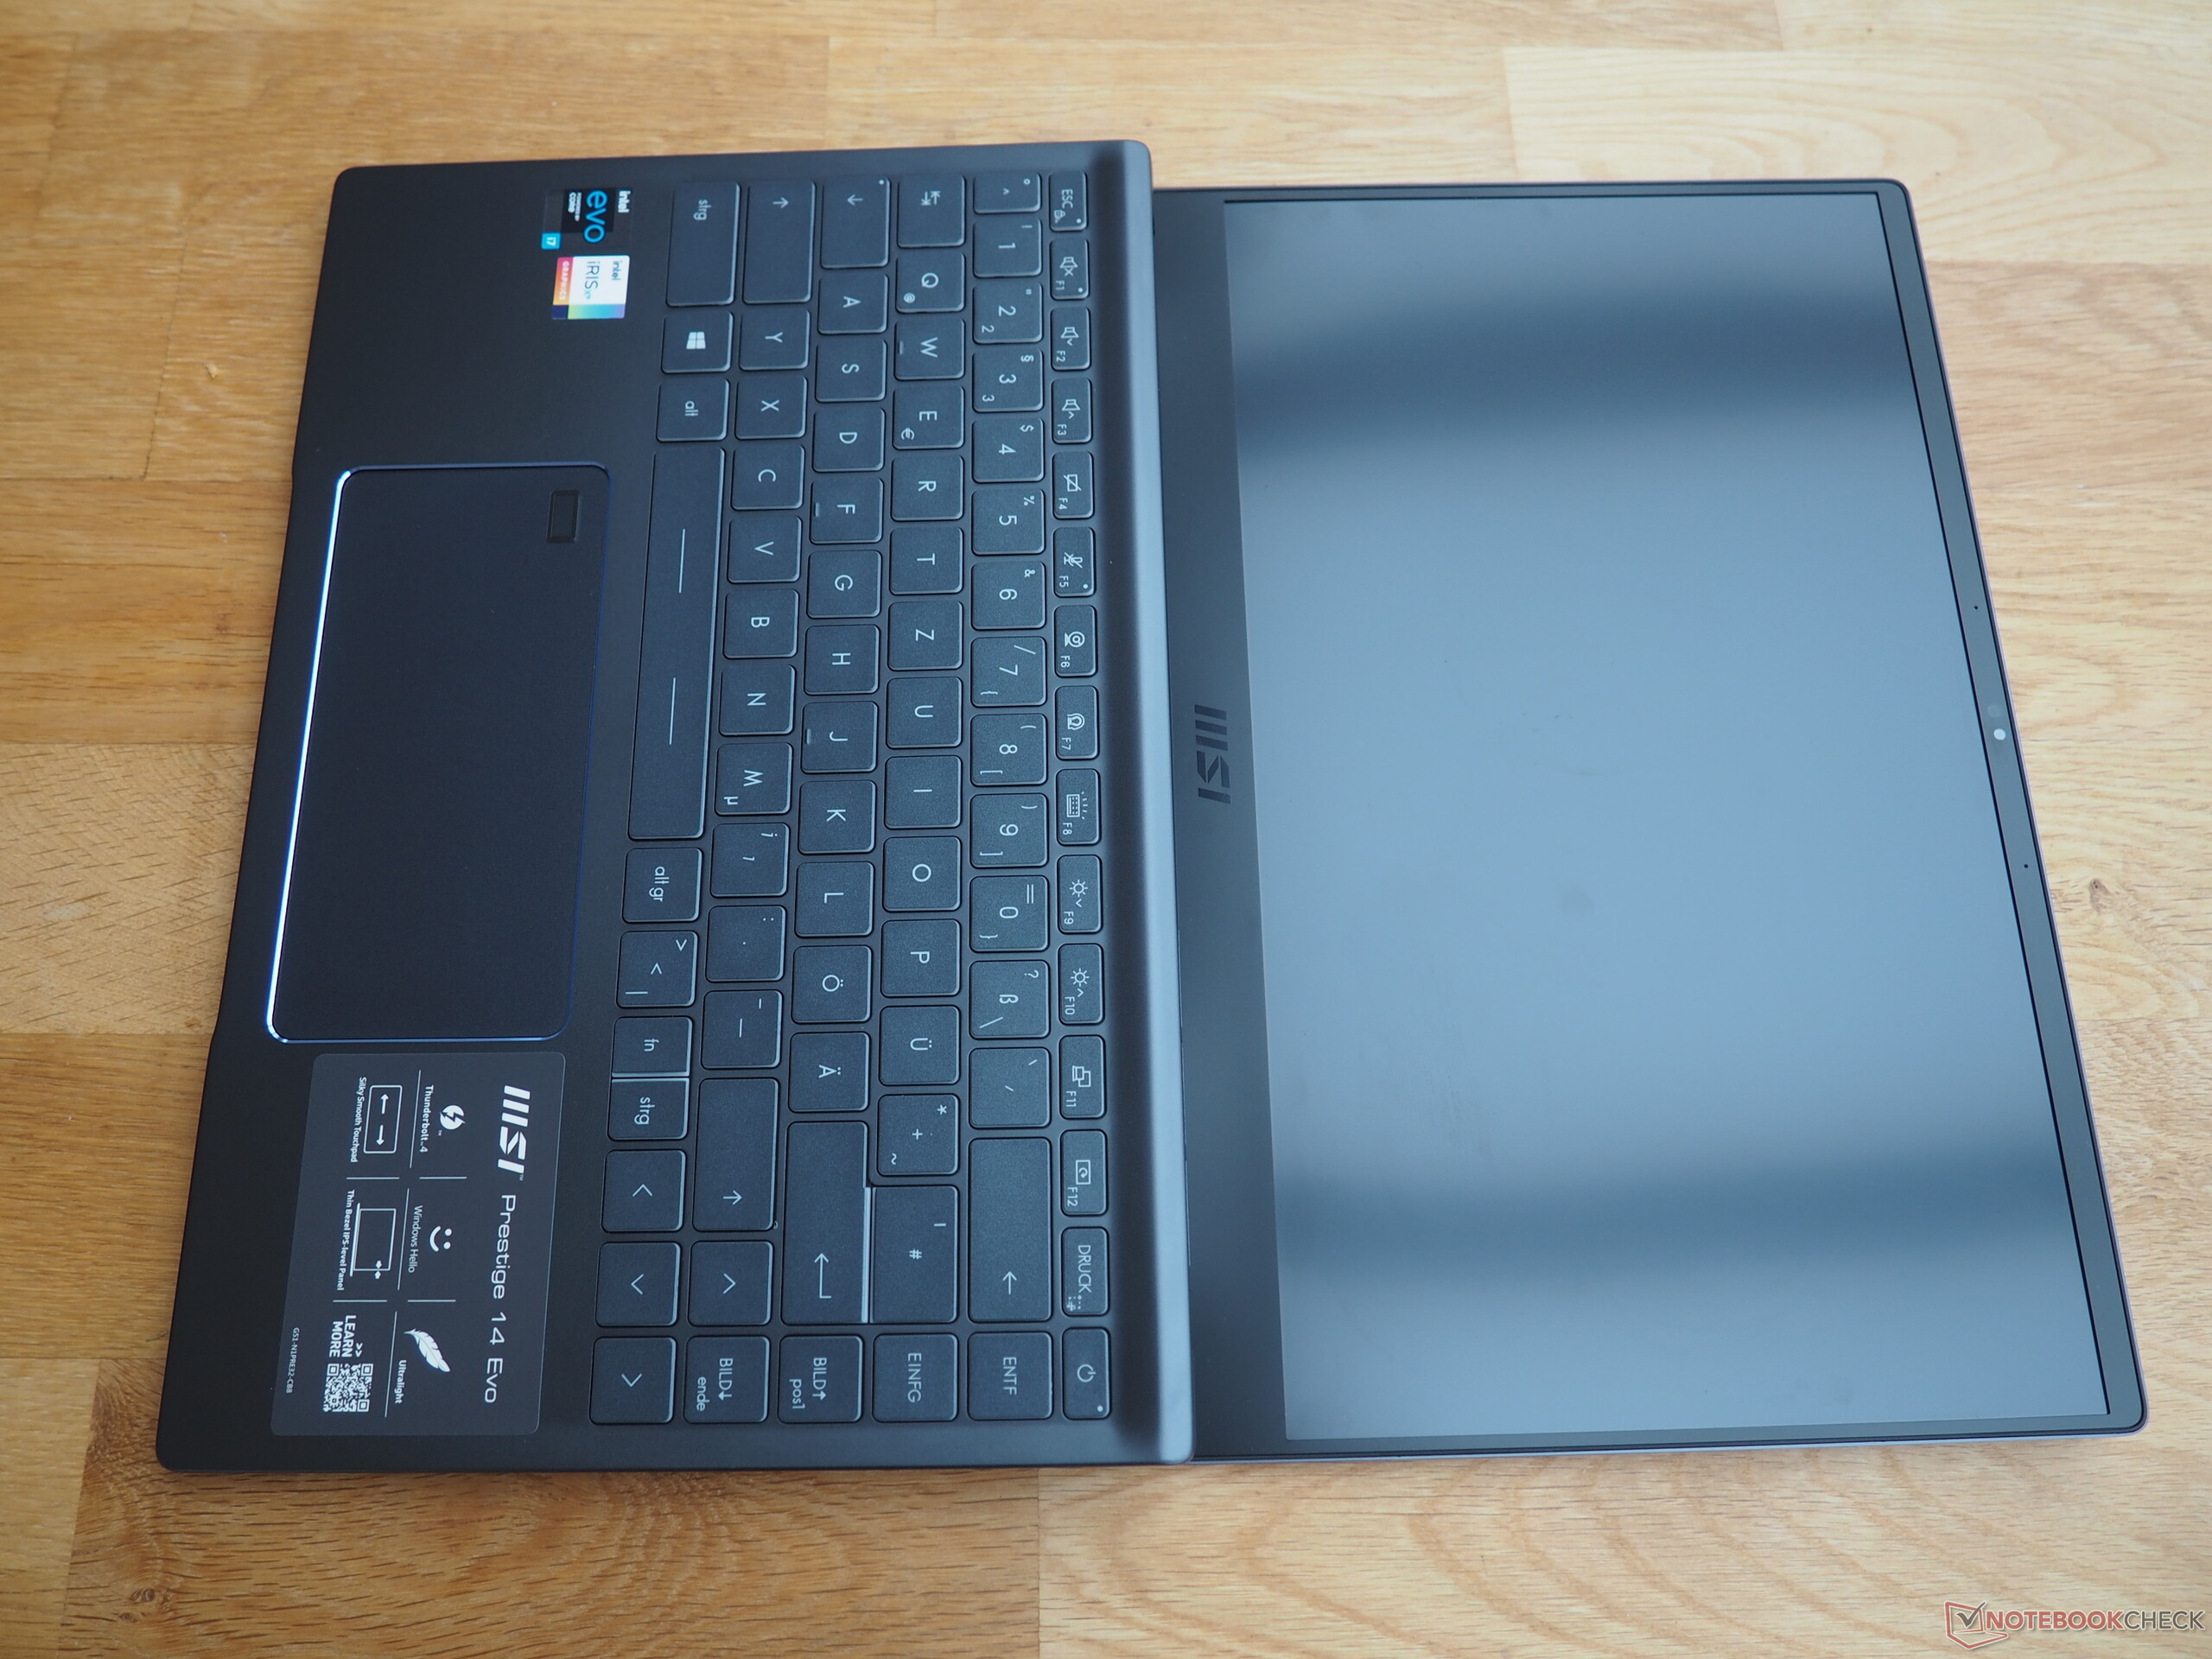
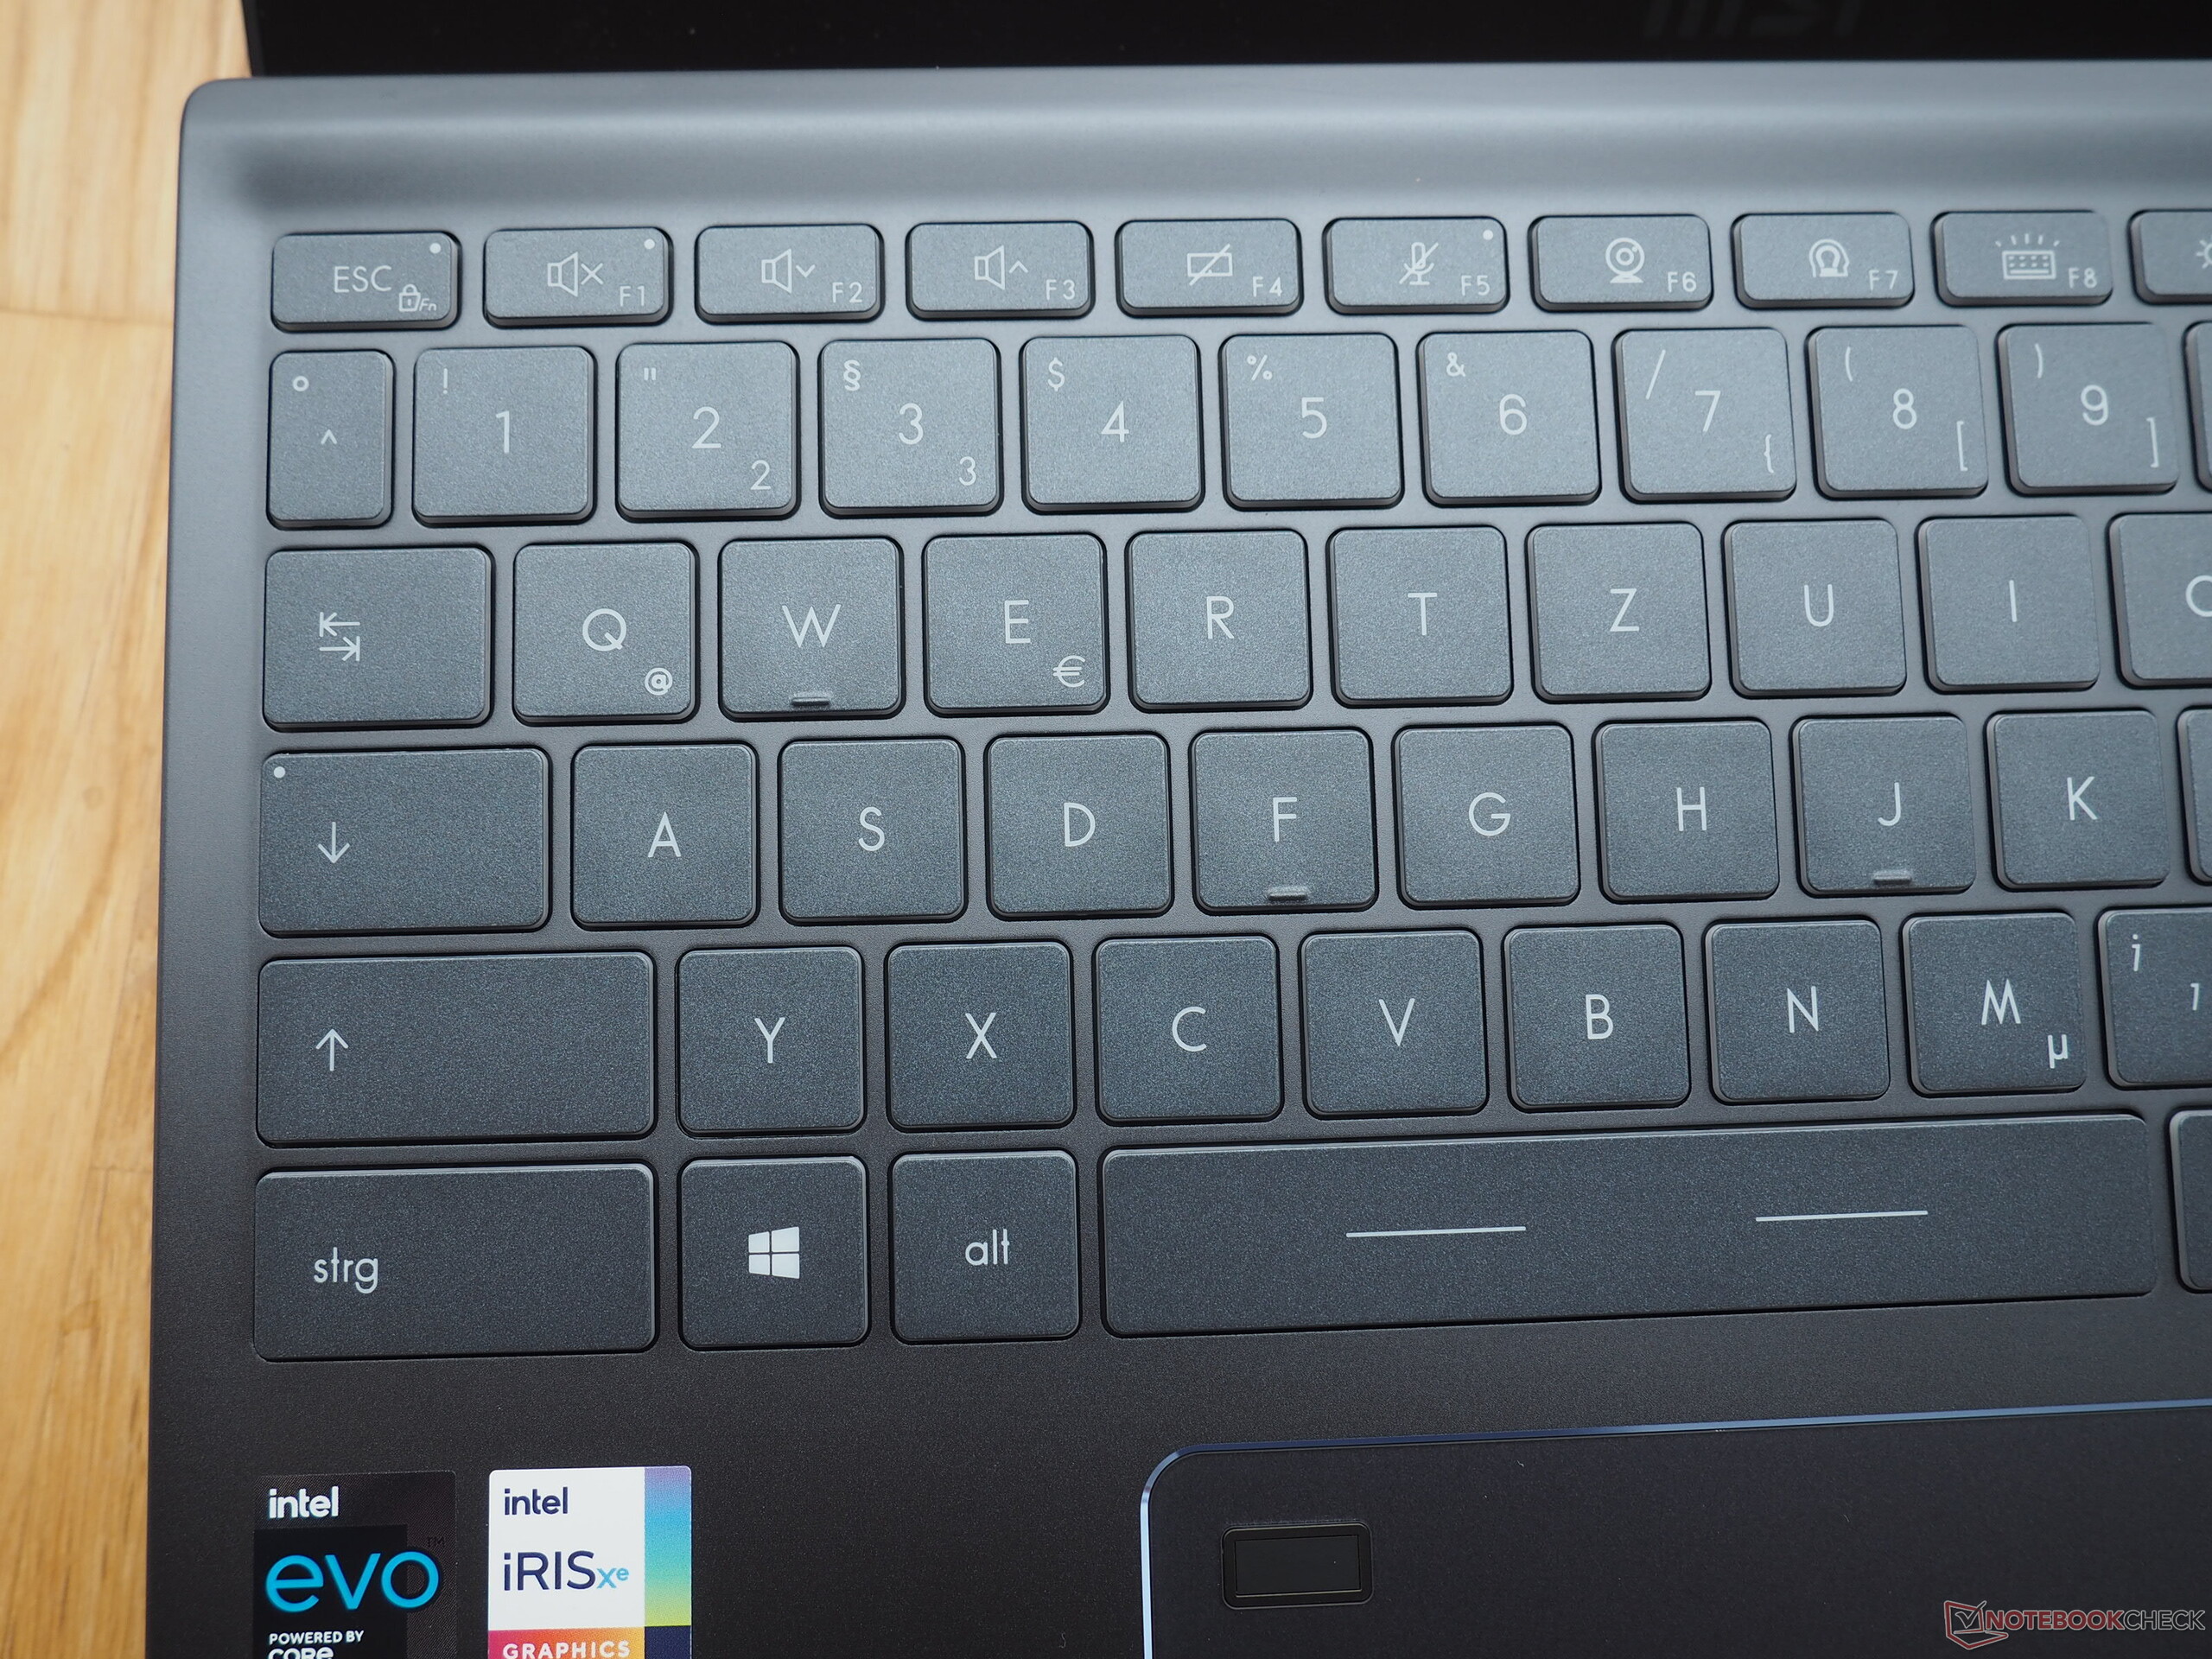
MSI har lyckats skapat en framgångsrik allt-i-allo för användning i farten.
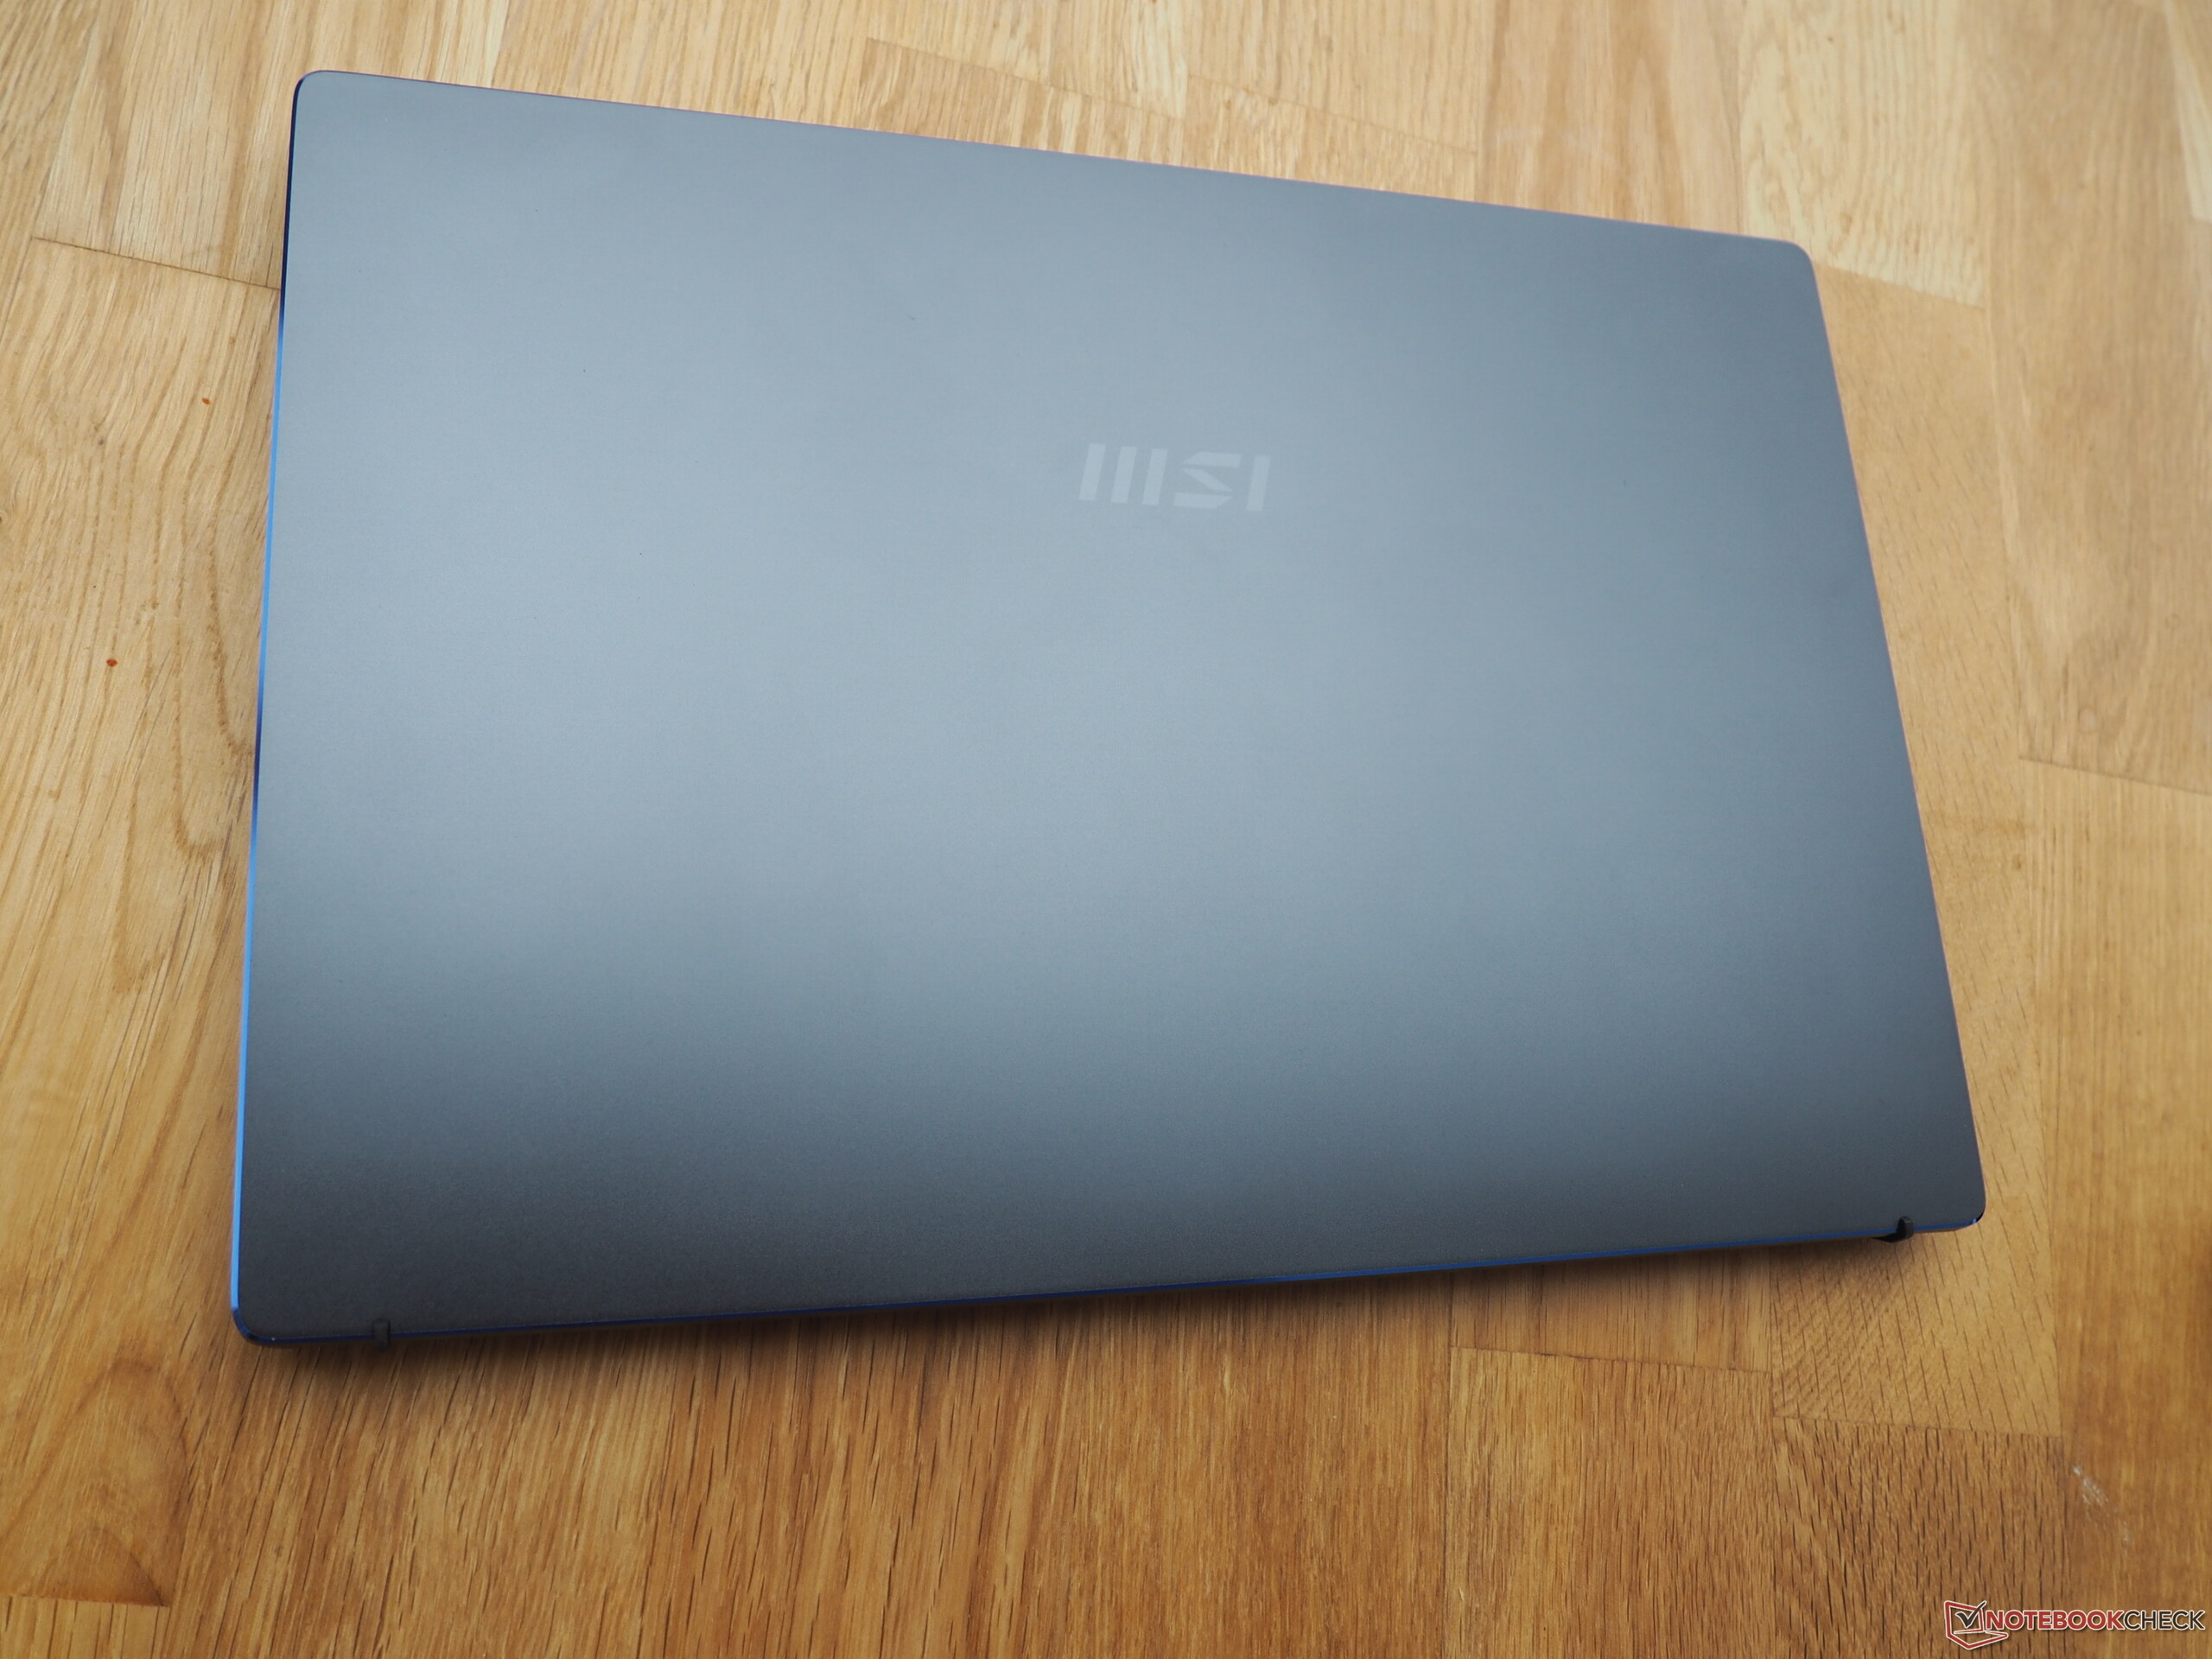
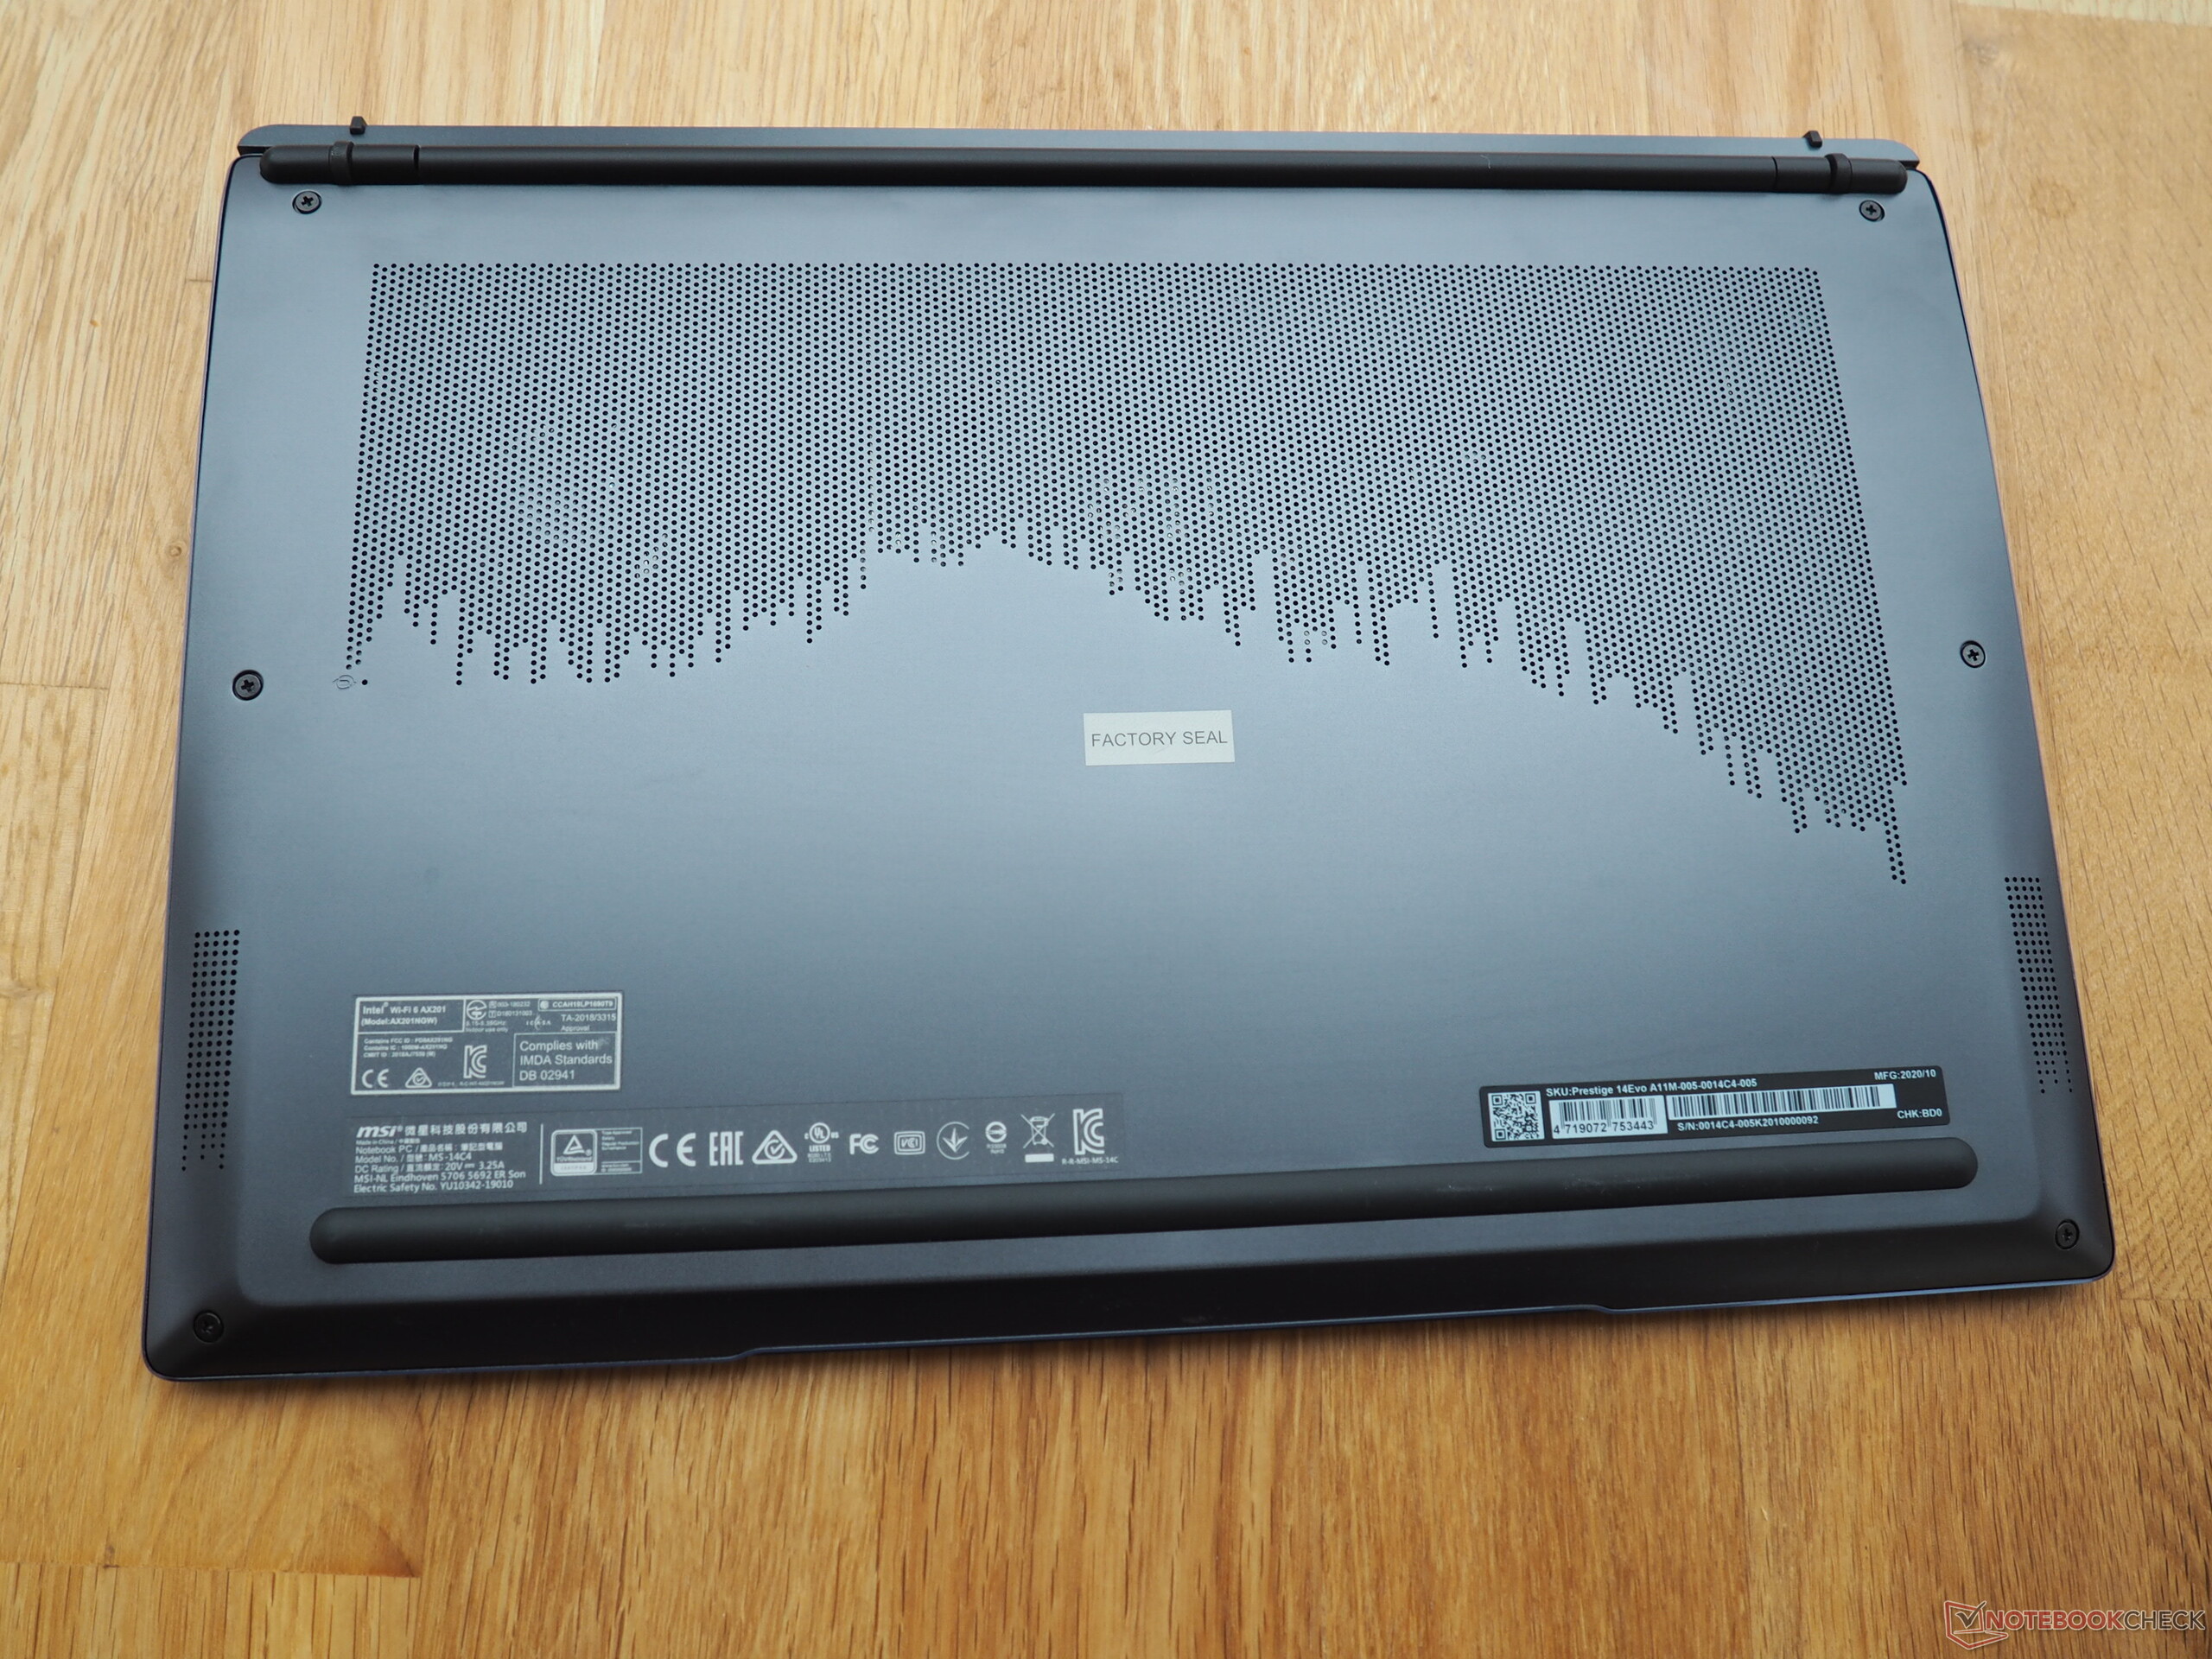
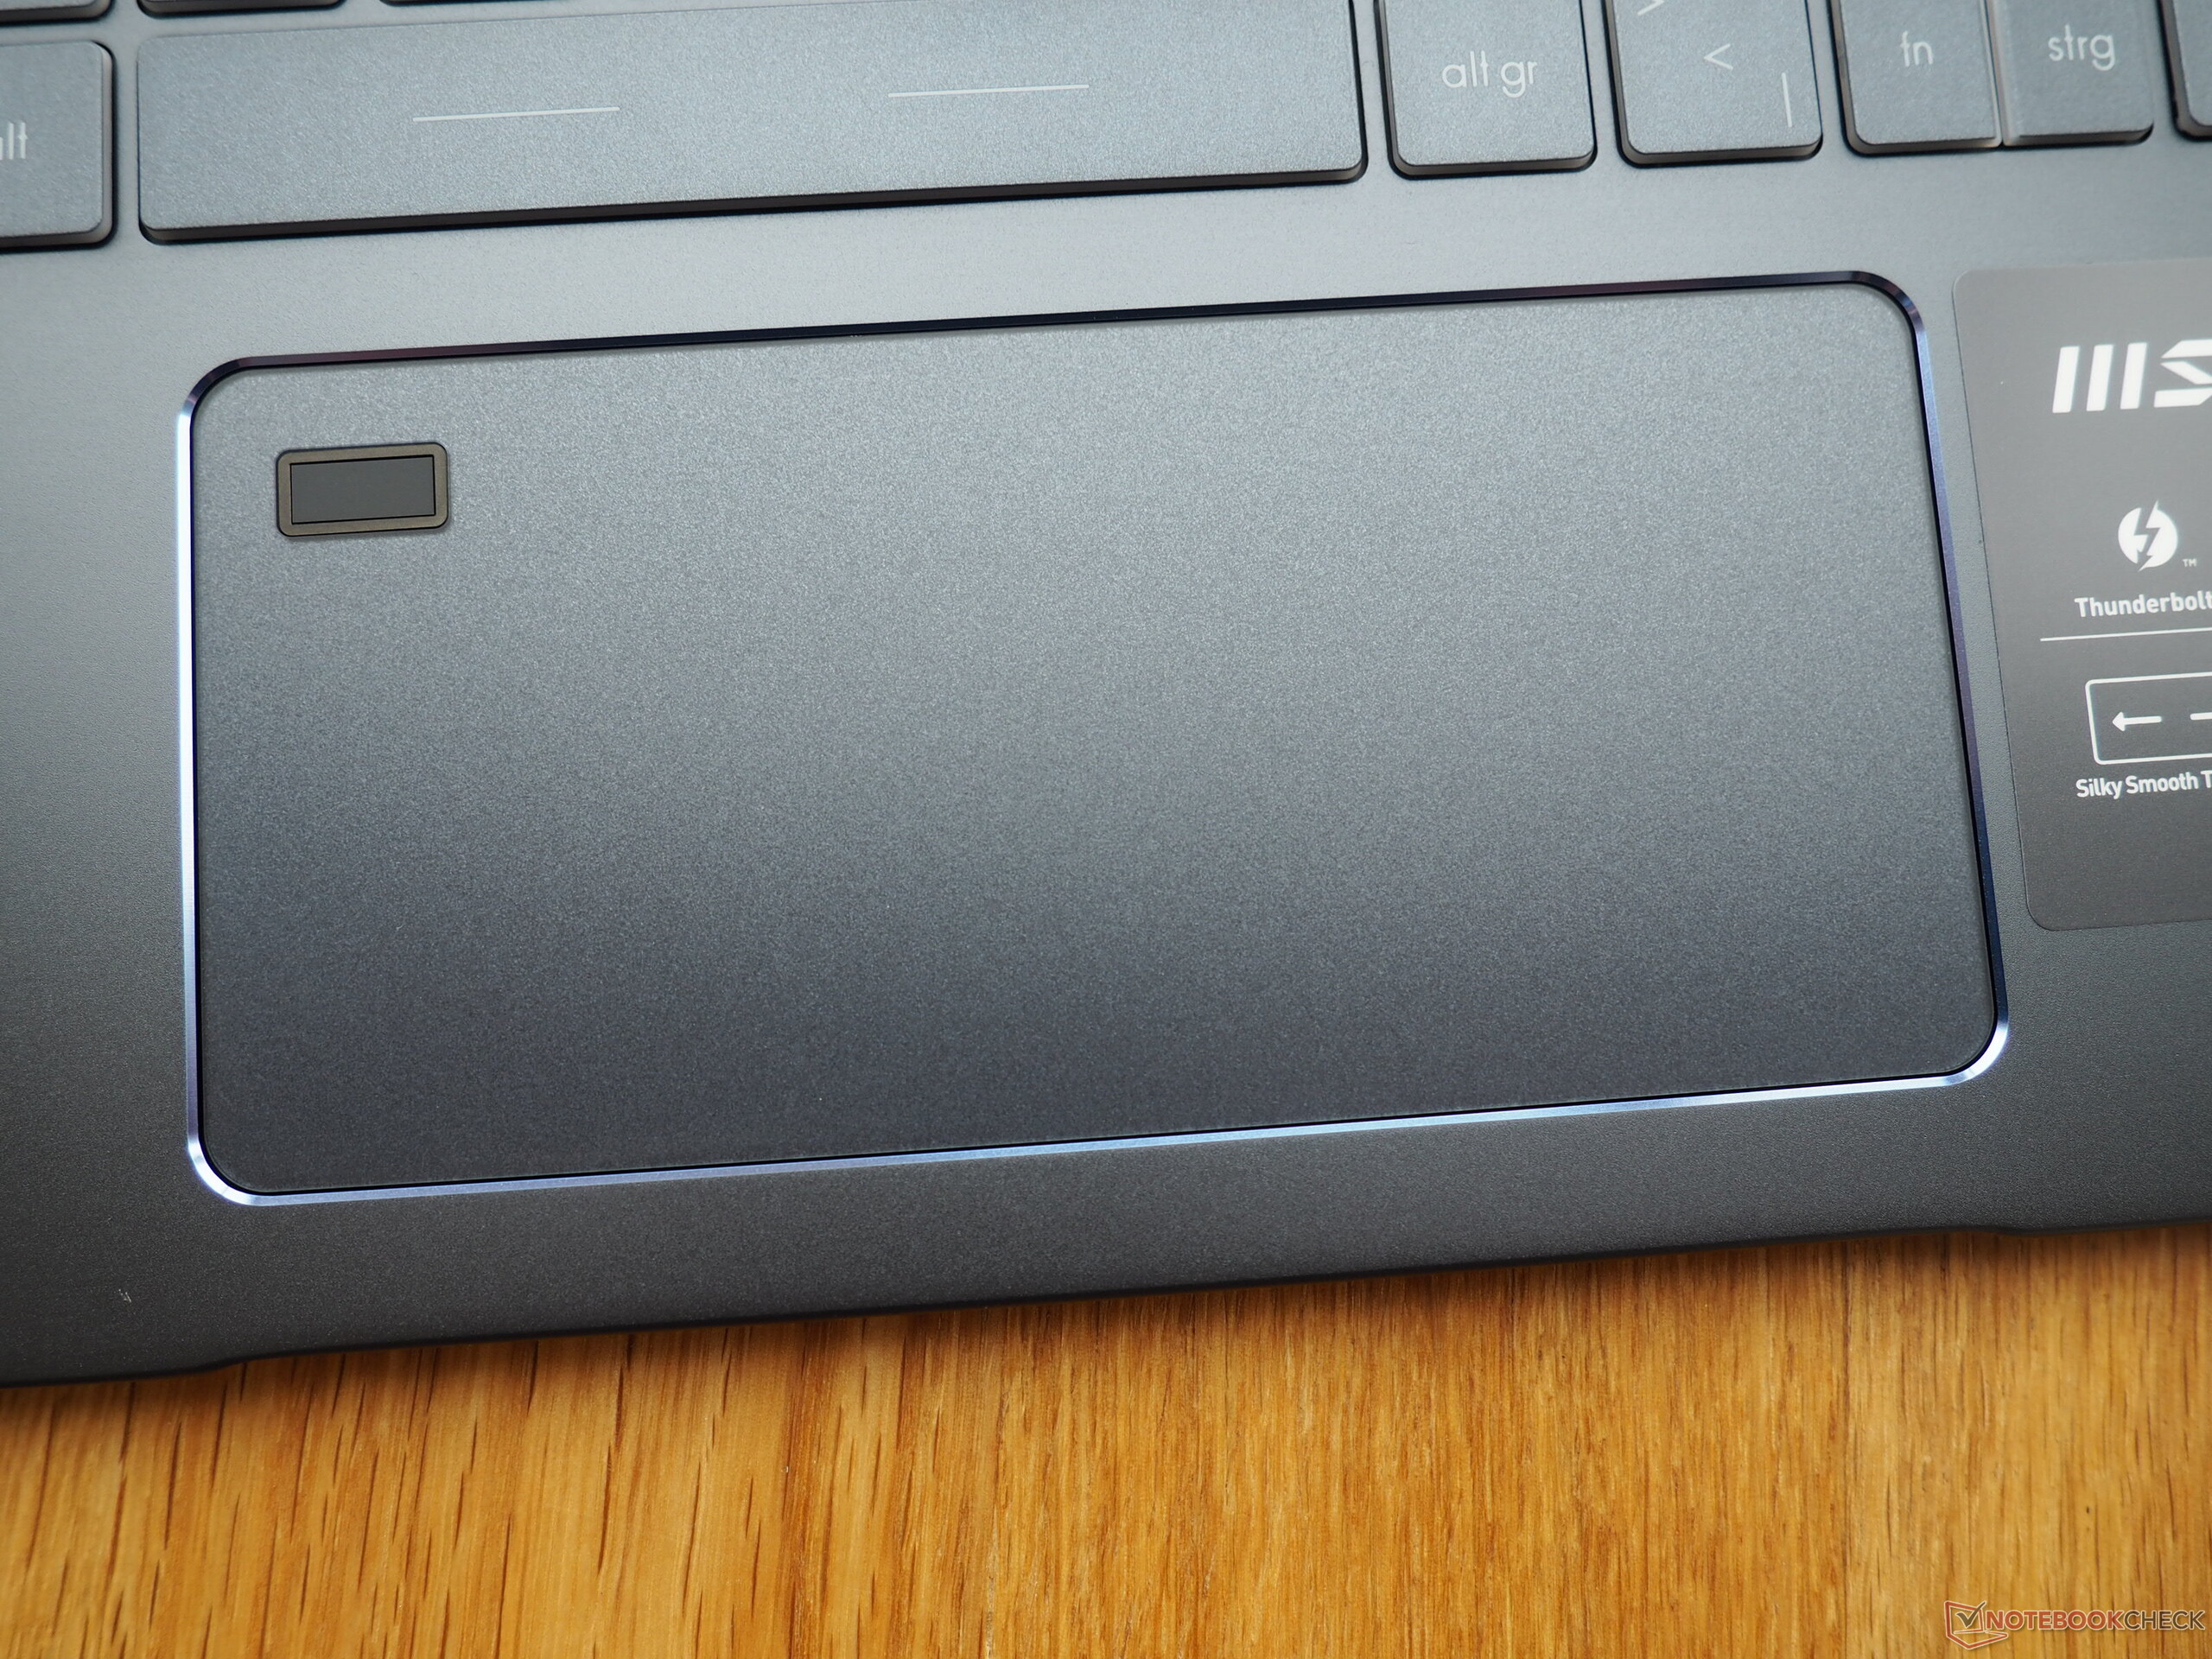
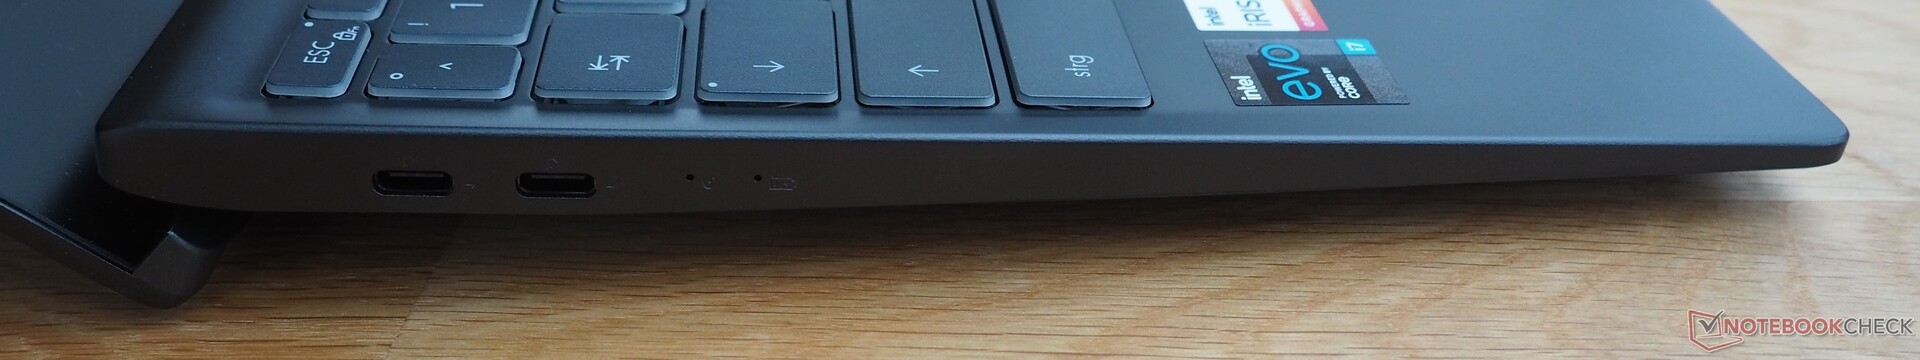
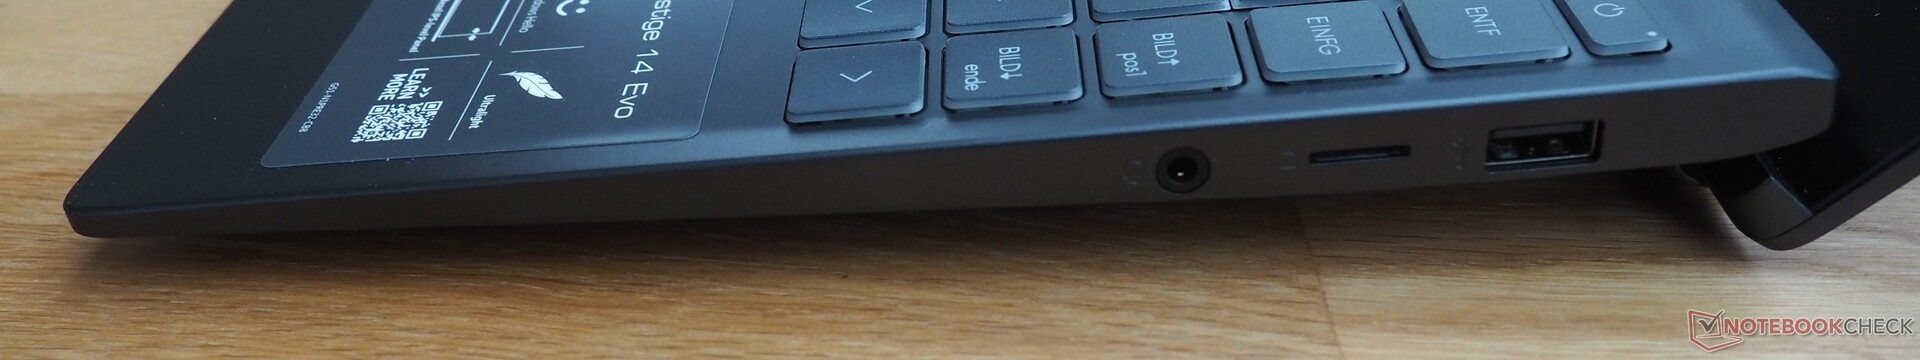
I övrigt har MSI fokuserat mer på den mobila aspekten än den professionella aspekten. Portutbudet och service/uppgraderingsmöjligheterna (fastlött RAM) blir offer för ett kompakt och lätt hölje. Vi får också ge kritik för kvaliteten på webbkameran och högtalarna. Prestige 14 Evo får däremot bland annat poäng för sin tjusiga design och sin stora styrplatta.
Pris och tillgänglighet
MSI Prestige 14 Evo går för tillfället att få tag på för 13.000 kronor i konfigurationen A11M-005 (i7-1185G7, Iris Xe, 16 GB RAM, 512 GB SSD) hos bland annat Notebooksbilliger.de och Amazon.de.
MSI Prestige 14 Evo A11M-005
- 12/09/2020 v7 (old)
Florian Glaser
Price comparison