Recension av Lenovo ThinkBook Plus Gen 3 laptop: 21:10 ultrabred produktivitetsbooster
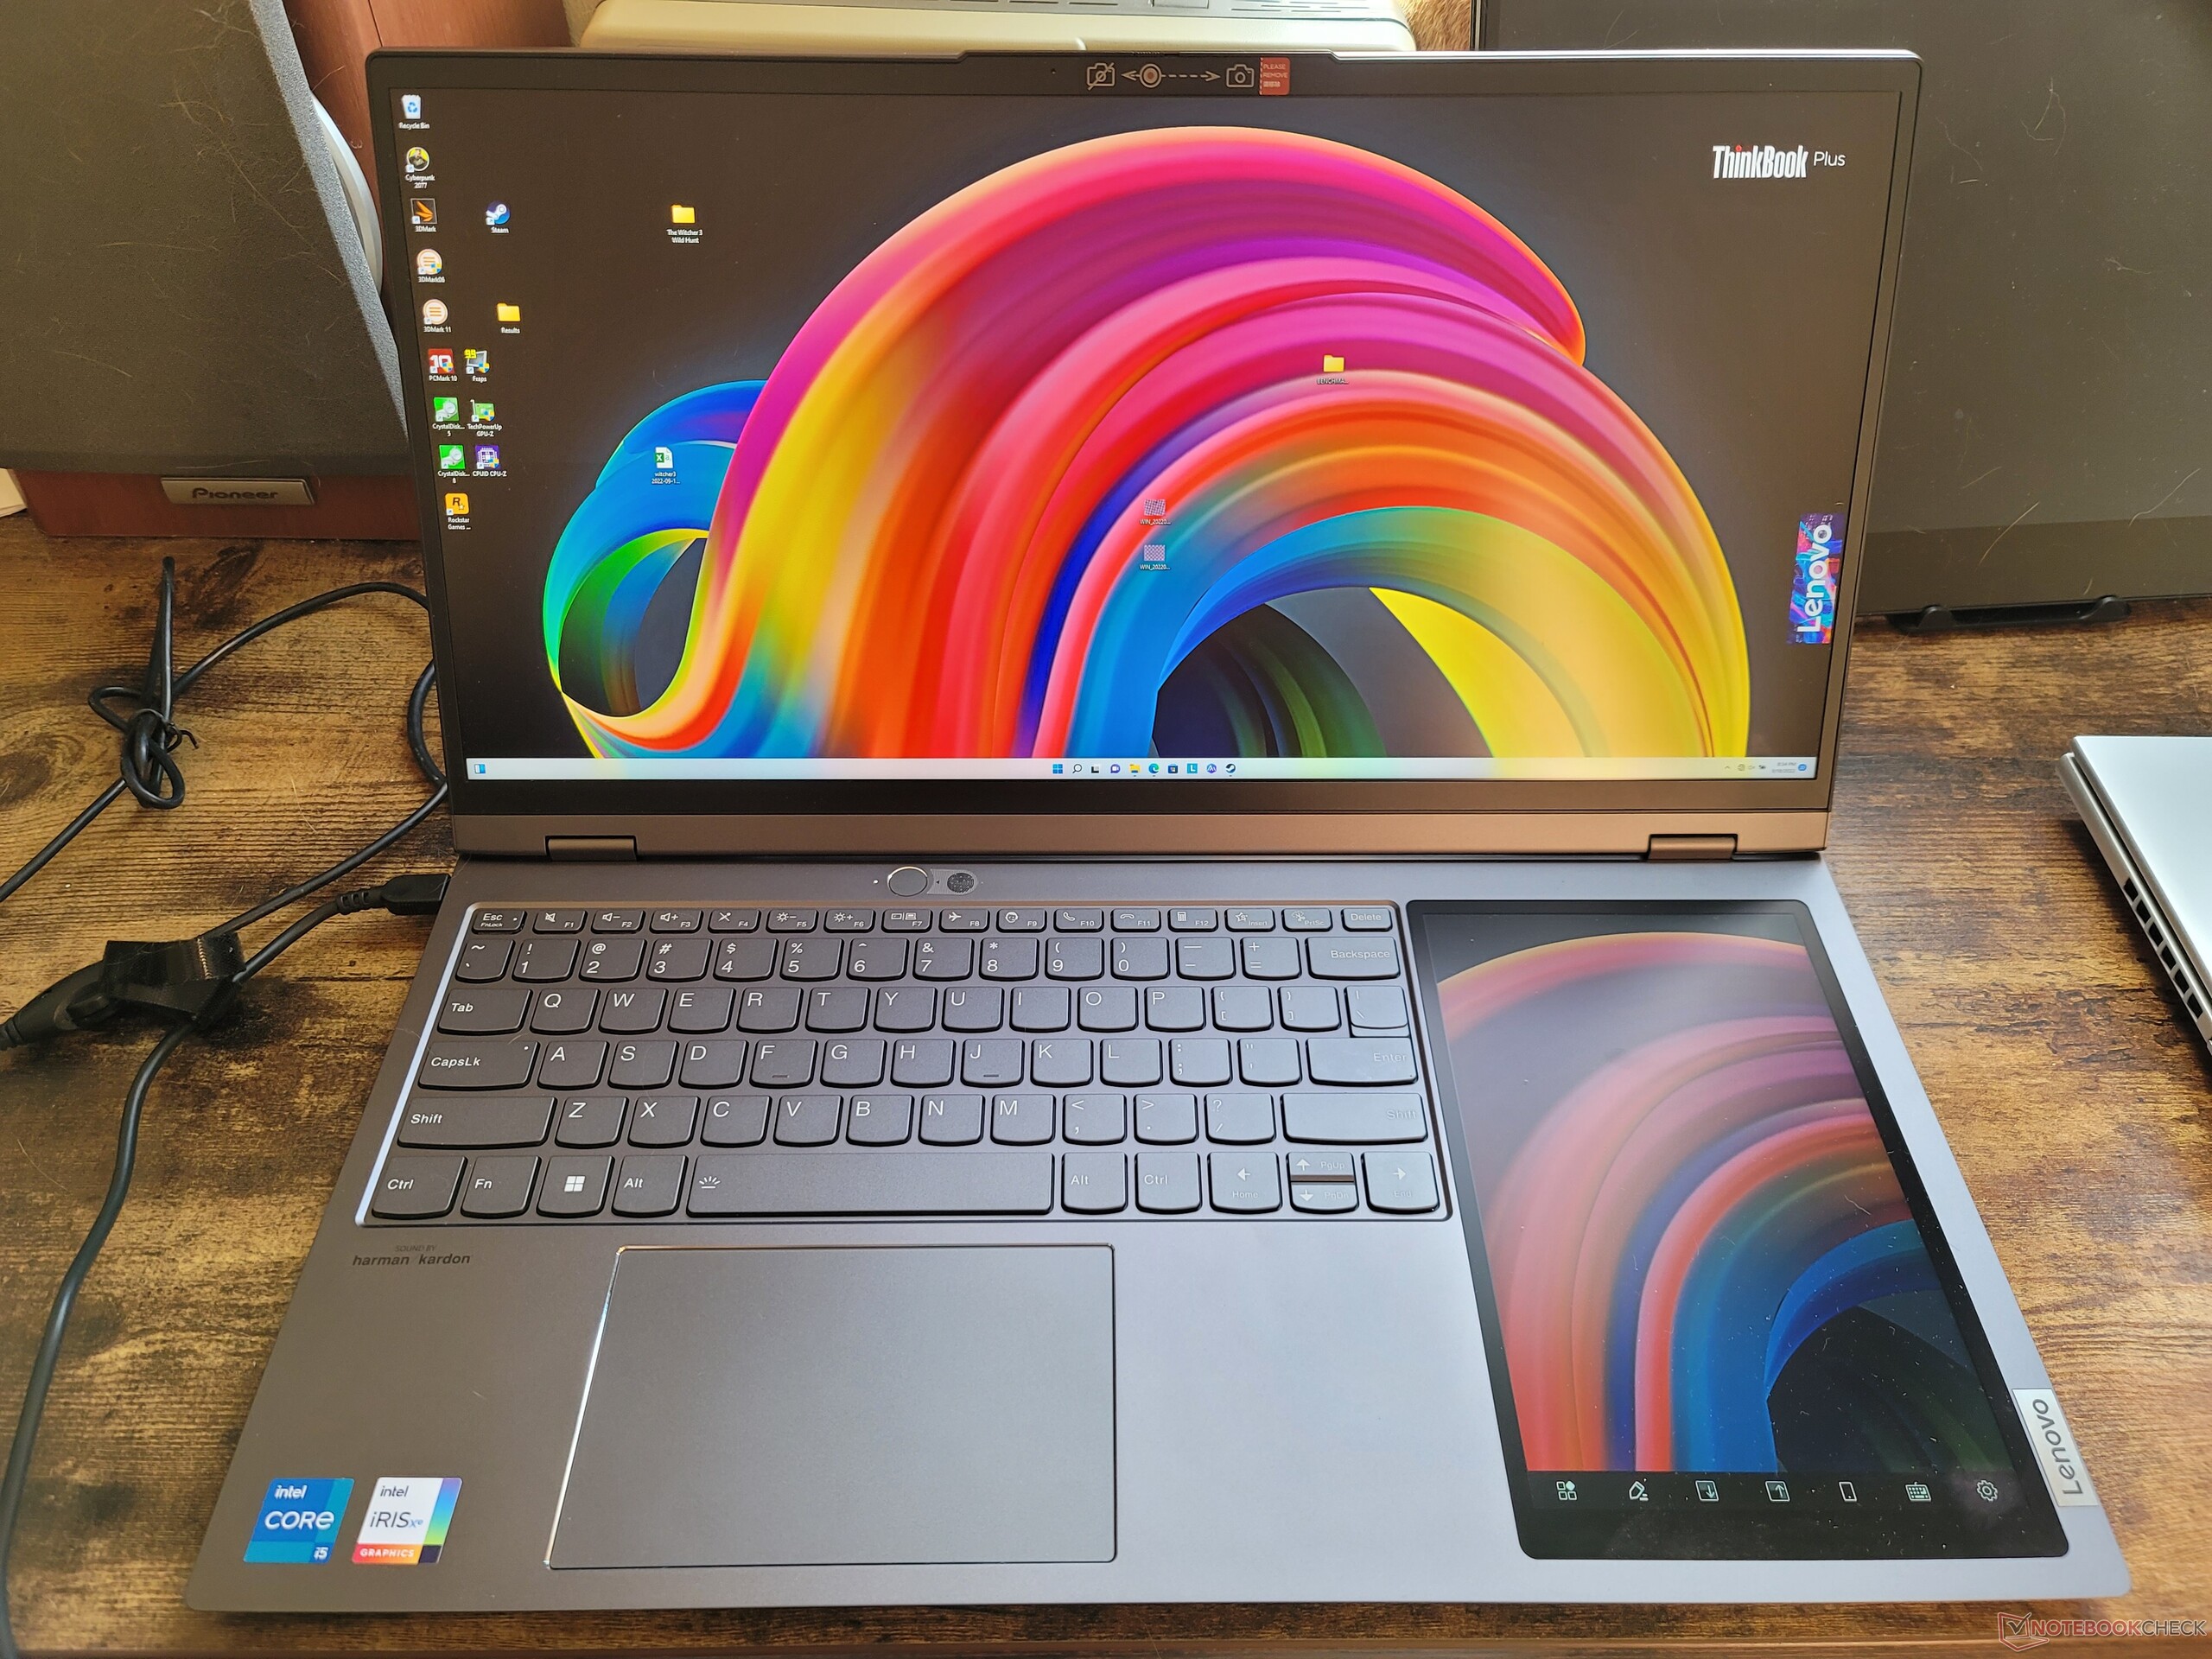
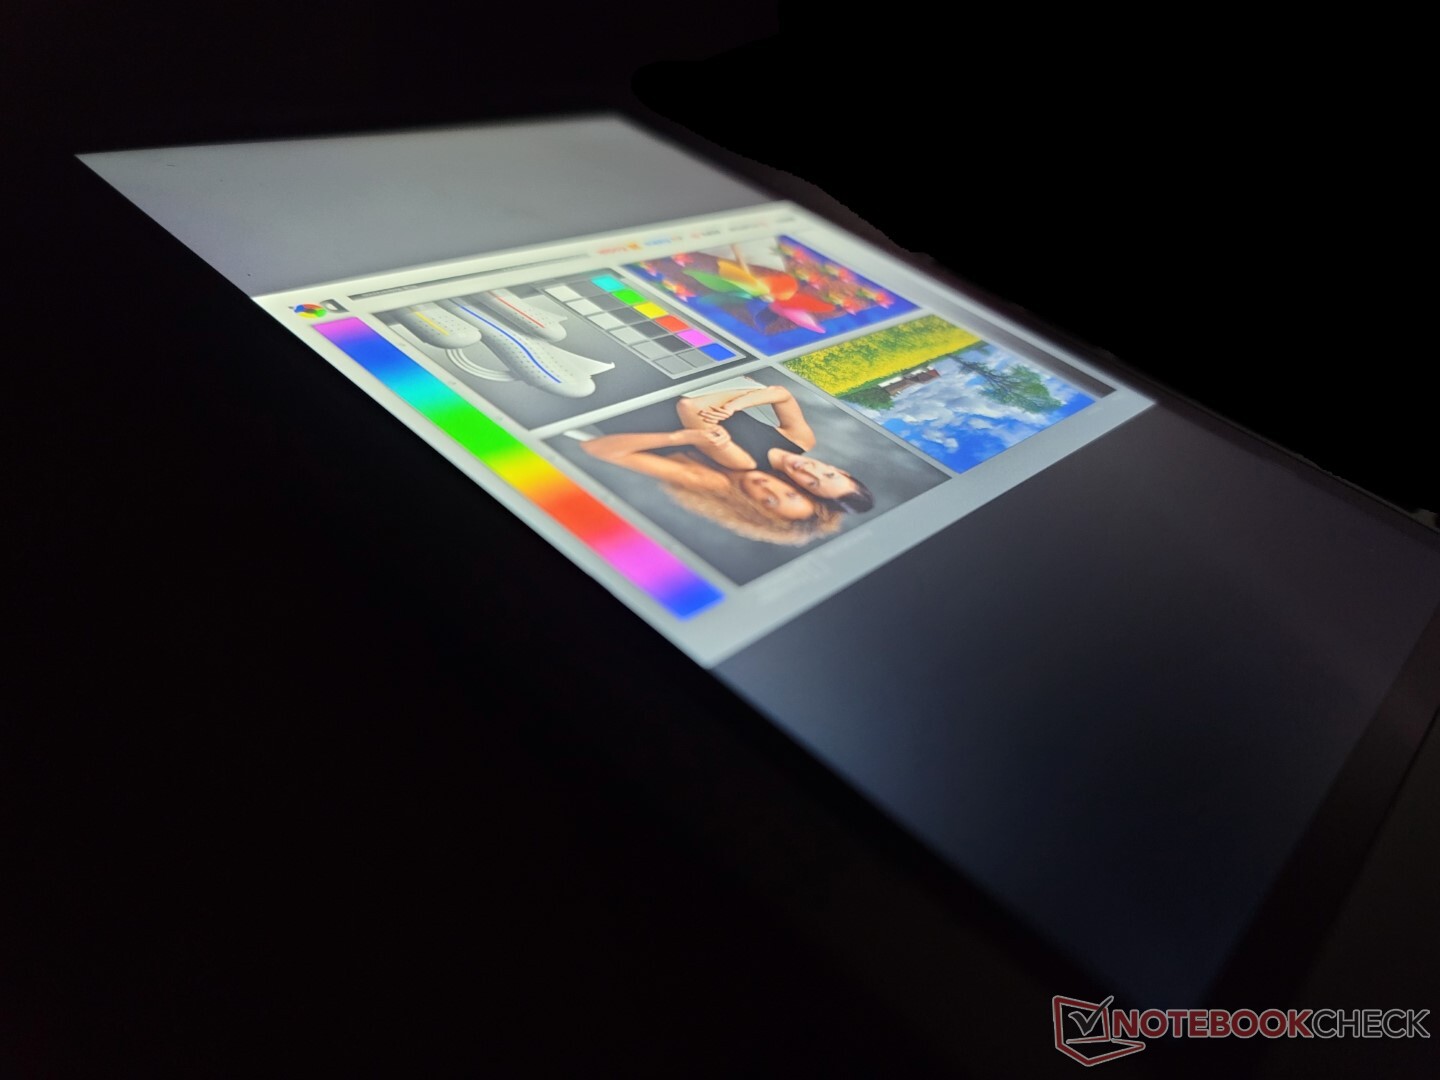
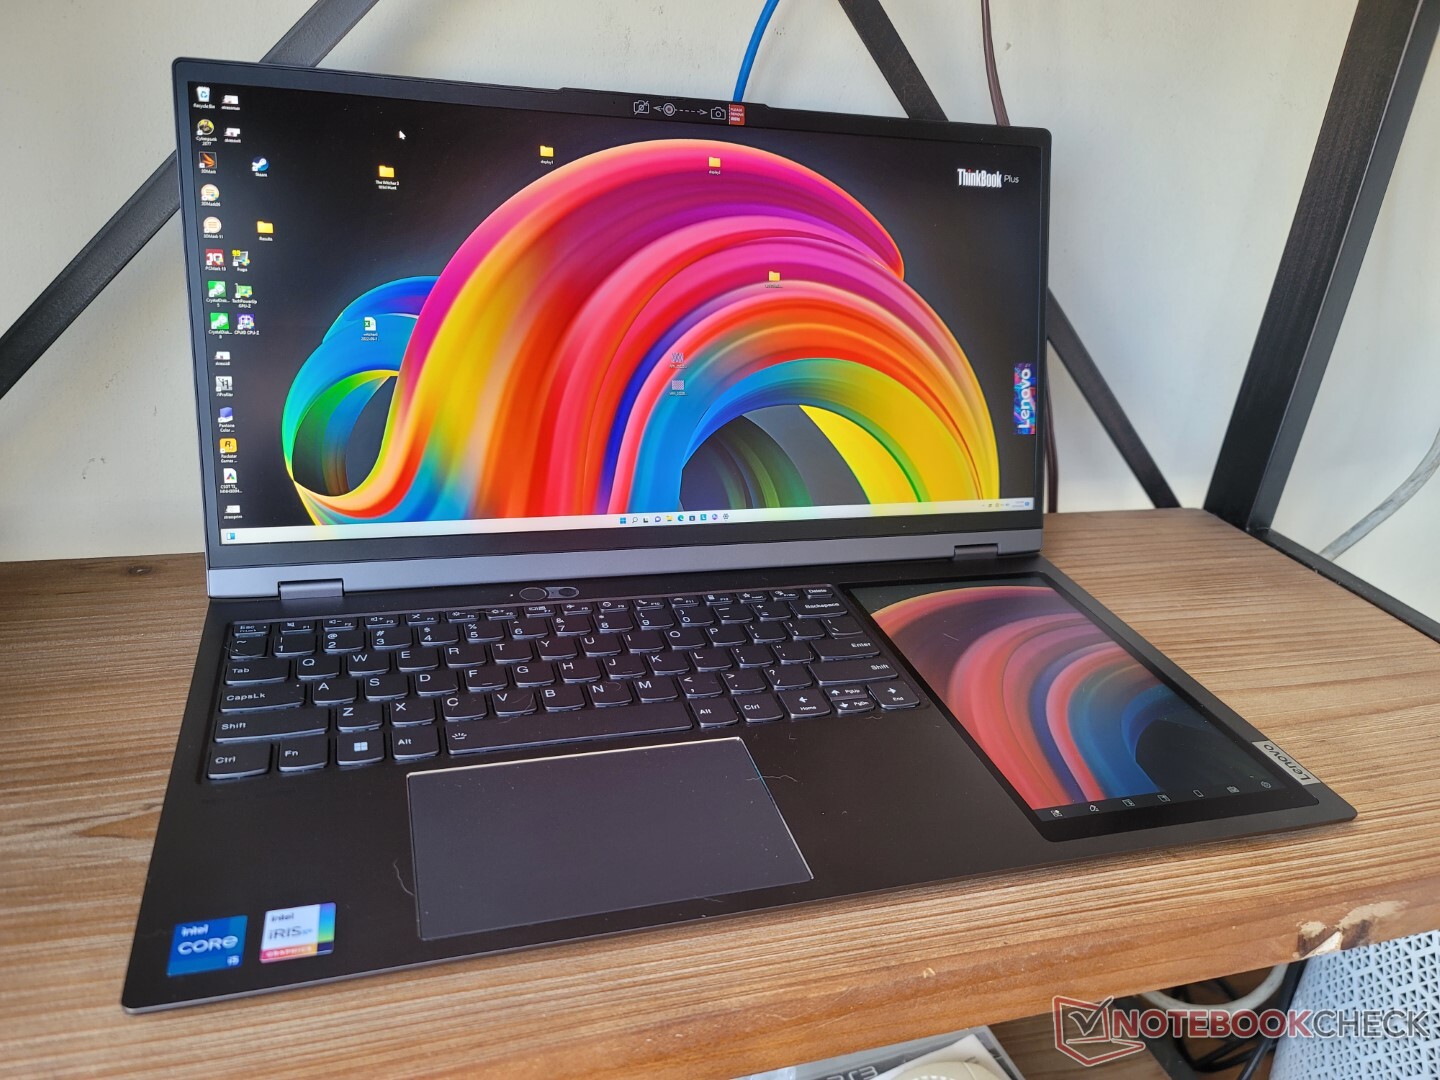
Lenovo ThinkBook Plus Gen 3 är en direkt efterföljare till fjolårets ThinkBook Plus Gen 3 ThinkBook Plus Gen 2. Även om du inte kan se det enbart på namnet är Gen 3-modellen en betydande förändring från sin föregångare på fler sätt än de flesta andra bärbara datorer. Medan Gen 2-modellen är en konvertibel 13,3-tums 16:10-modell med en sekundär 12-tums pekskärm med E-Ink-teknik är Gen 3-modellen en 17,3-tums 21:10-modell med en sekundär 8-tums IPS-pekskärm. De två modellerna är så olika att man skulle kunna argumentera om namngivningen av Gen 3-modellen i förhållande till Gen 2 eftersom de båda har mycket olika syften.
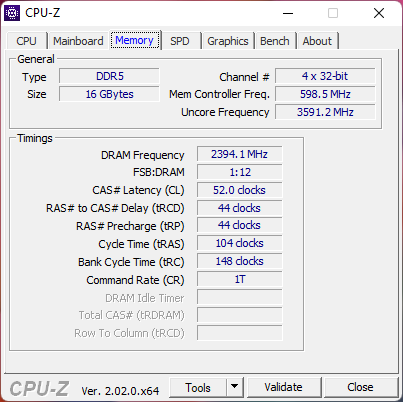
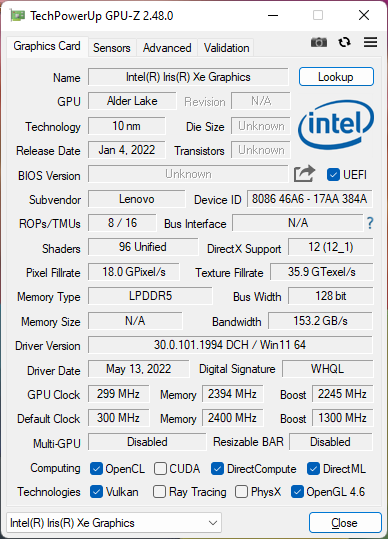
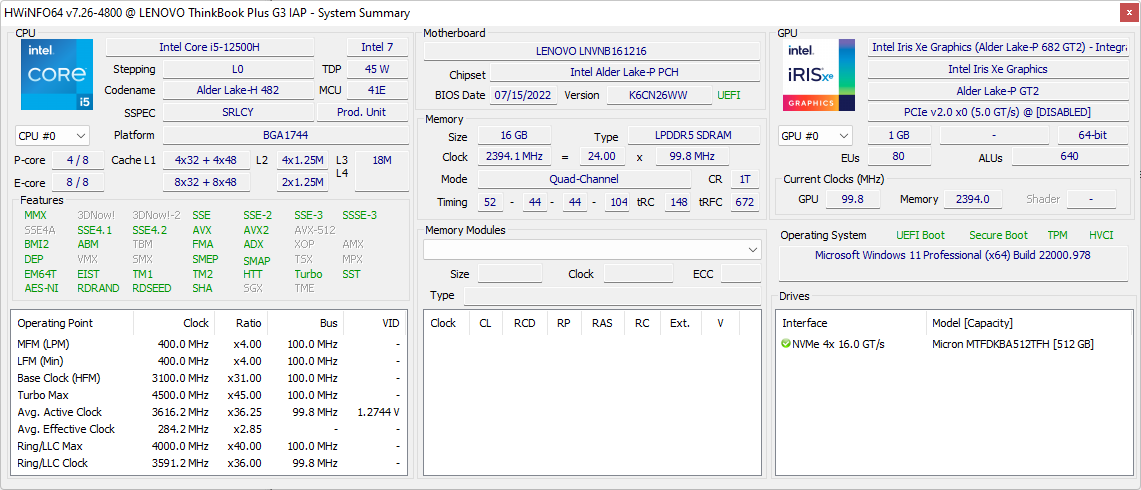
Vår Gen 3-recensionskonfiguration innehåller den 12:e generationens Core i7-12700H CPU med 16 GB lödda RAM och 512 GB PCIe4-lagring för cirka 1 600 USD. En Core i5-12500H SKU finns tillgänglig, men alla alternativ kommer med exakt samma primära 3072 x 1440 matta IPS-pekskärm, sekundär 8-tums 800 x 1280 IPS-pekskärm och integrerad Iris Xe-grafik.
Alternativen till ThinkBook Plus Gen 3 inkluderar 15-tums Asus ZenBook Pro Duo-serien och andra bärbara 17-tumsdatorer avsedda för innehållsskapare eller kontorsproduktivitet som t.ex.LG Gram 17 eller Dell XPS 17.
Fler recensioner av Lenovo:
Potentiella konkurrenter i jämförelse
Gradering | Datum | Modell | Vikt | Höjd | Storlek | Upplösning | Pris |
|---|---|---|---|---|---|---|---|
| 85.6 % v7 (old) | 09/2022 | Lenovo ThinkBook Plus Gen3 i7-12700H, Iris Xe G7 96EUs | 2 kg | 17.9 mm | 17.30" | 3072x1440 | |
| 86.1 % v7 (old) | Lenovo ThinkBook Plus Gen2 Core i5 i5-1130G7, Iris Xe G7 80EUs | 1.2 kg | 13.9 mm | 13.30" | 2560x1600 | ||
| 86.4 % v7 (old) | 03/2020 | Asus ProArt StudioBook Pro 17 W700G3T i7-9750H, Quadro RTX 3000 Max-Q | 2.5 kg | 18.4 mm | 17.00" | 1920x1200 | |
| 87.3 % v7 (old) | 08/2022 | LG Gram 17 (2022) i5-1240P, Iris Xe G7 80EUs | 1.4 kg | 17.7 mm | 17.00" | 2560x1600 | |
| 89.3 % v7 (old) | 06/2022 | Dell XPS 17 9720 i7-12700H, GeForce RTX 3050 4GB Laptop GPU | 2.5 kg | 19.5 mm | 17.00" | 3840x2400 | |
| 88 % v7 (old) | 09/2021 | Gigabyte Aero 17 HDR YD i9-11980HK, GeForce RTX 3080 Laptop GPU | 2.8 kg | 22 mm | 17.30" | 3840x2160 |
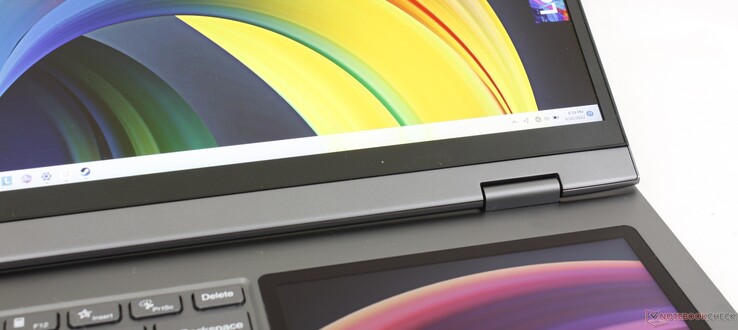
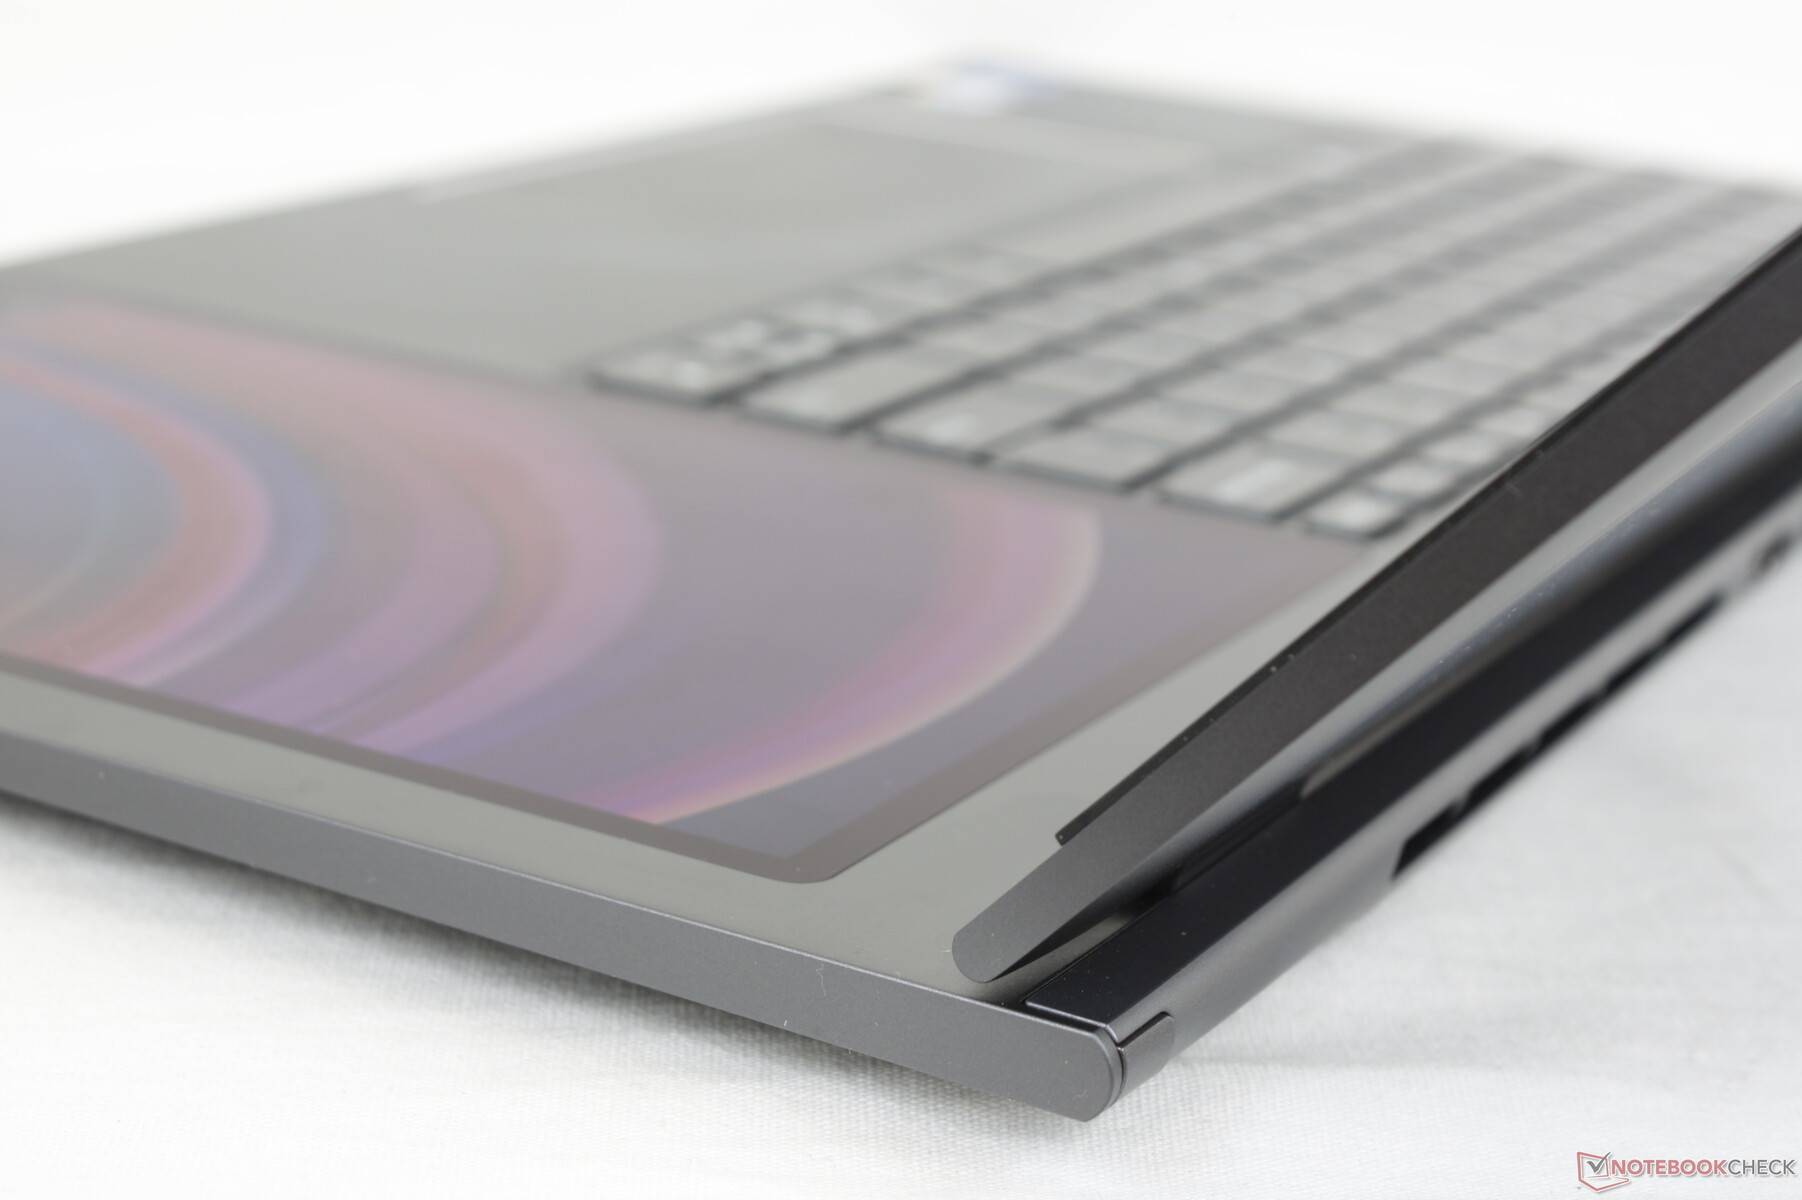
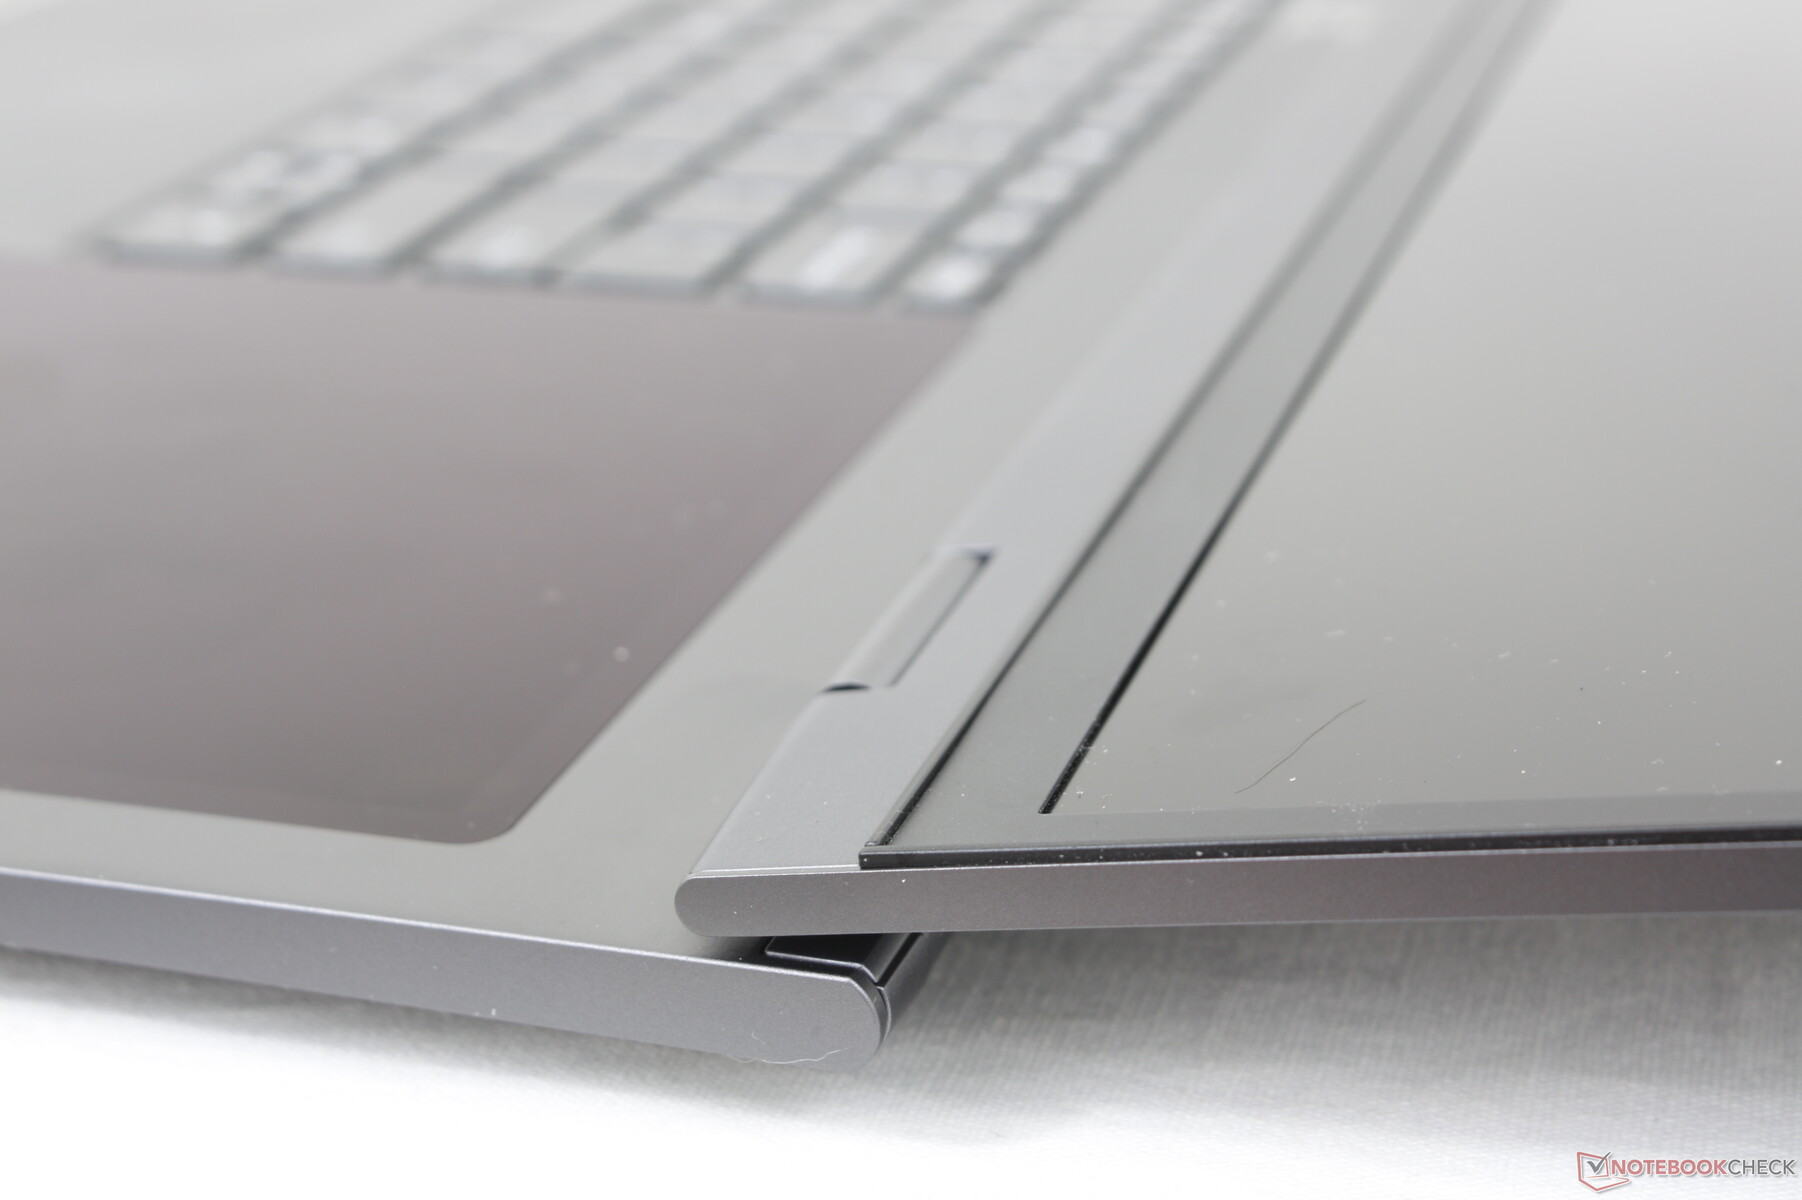
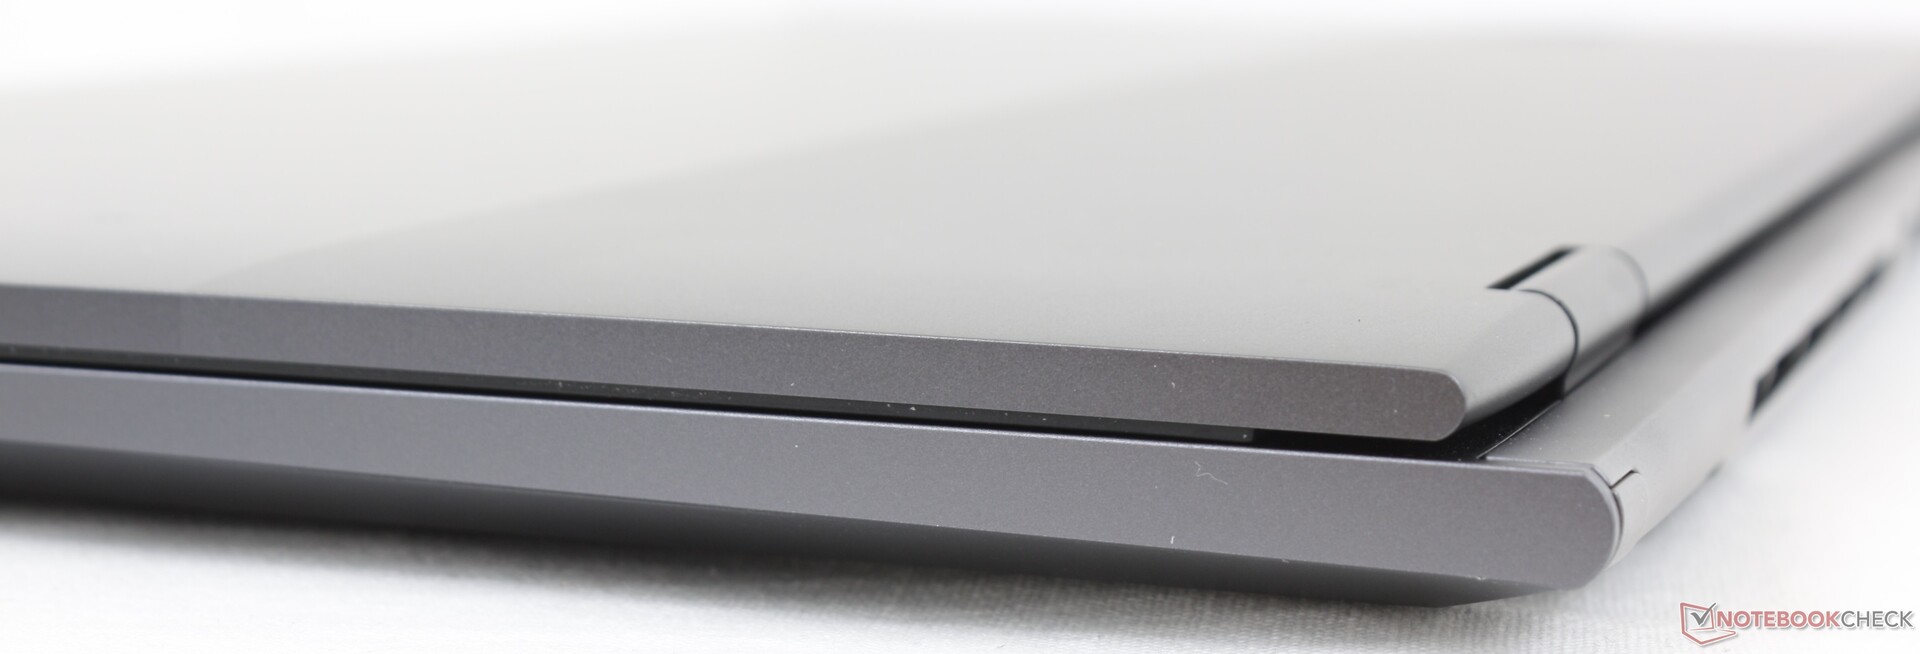
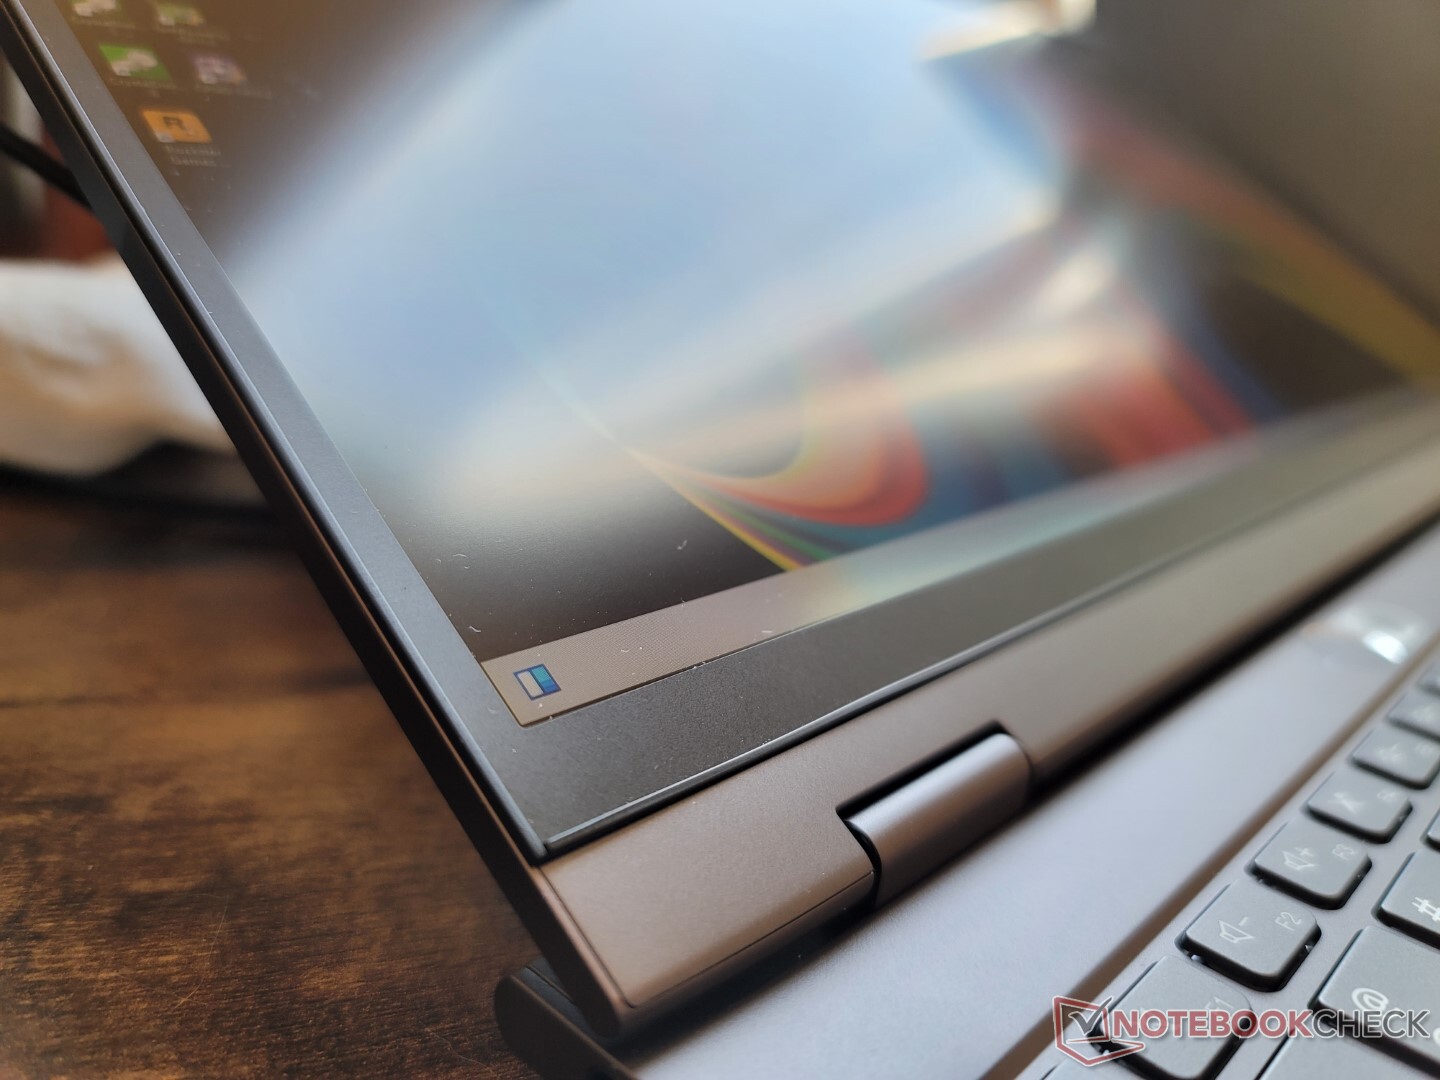
Case - Lång och tunn
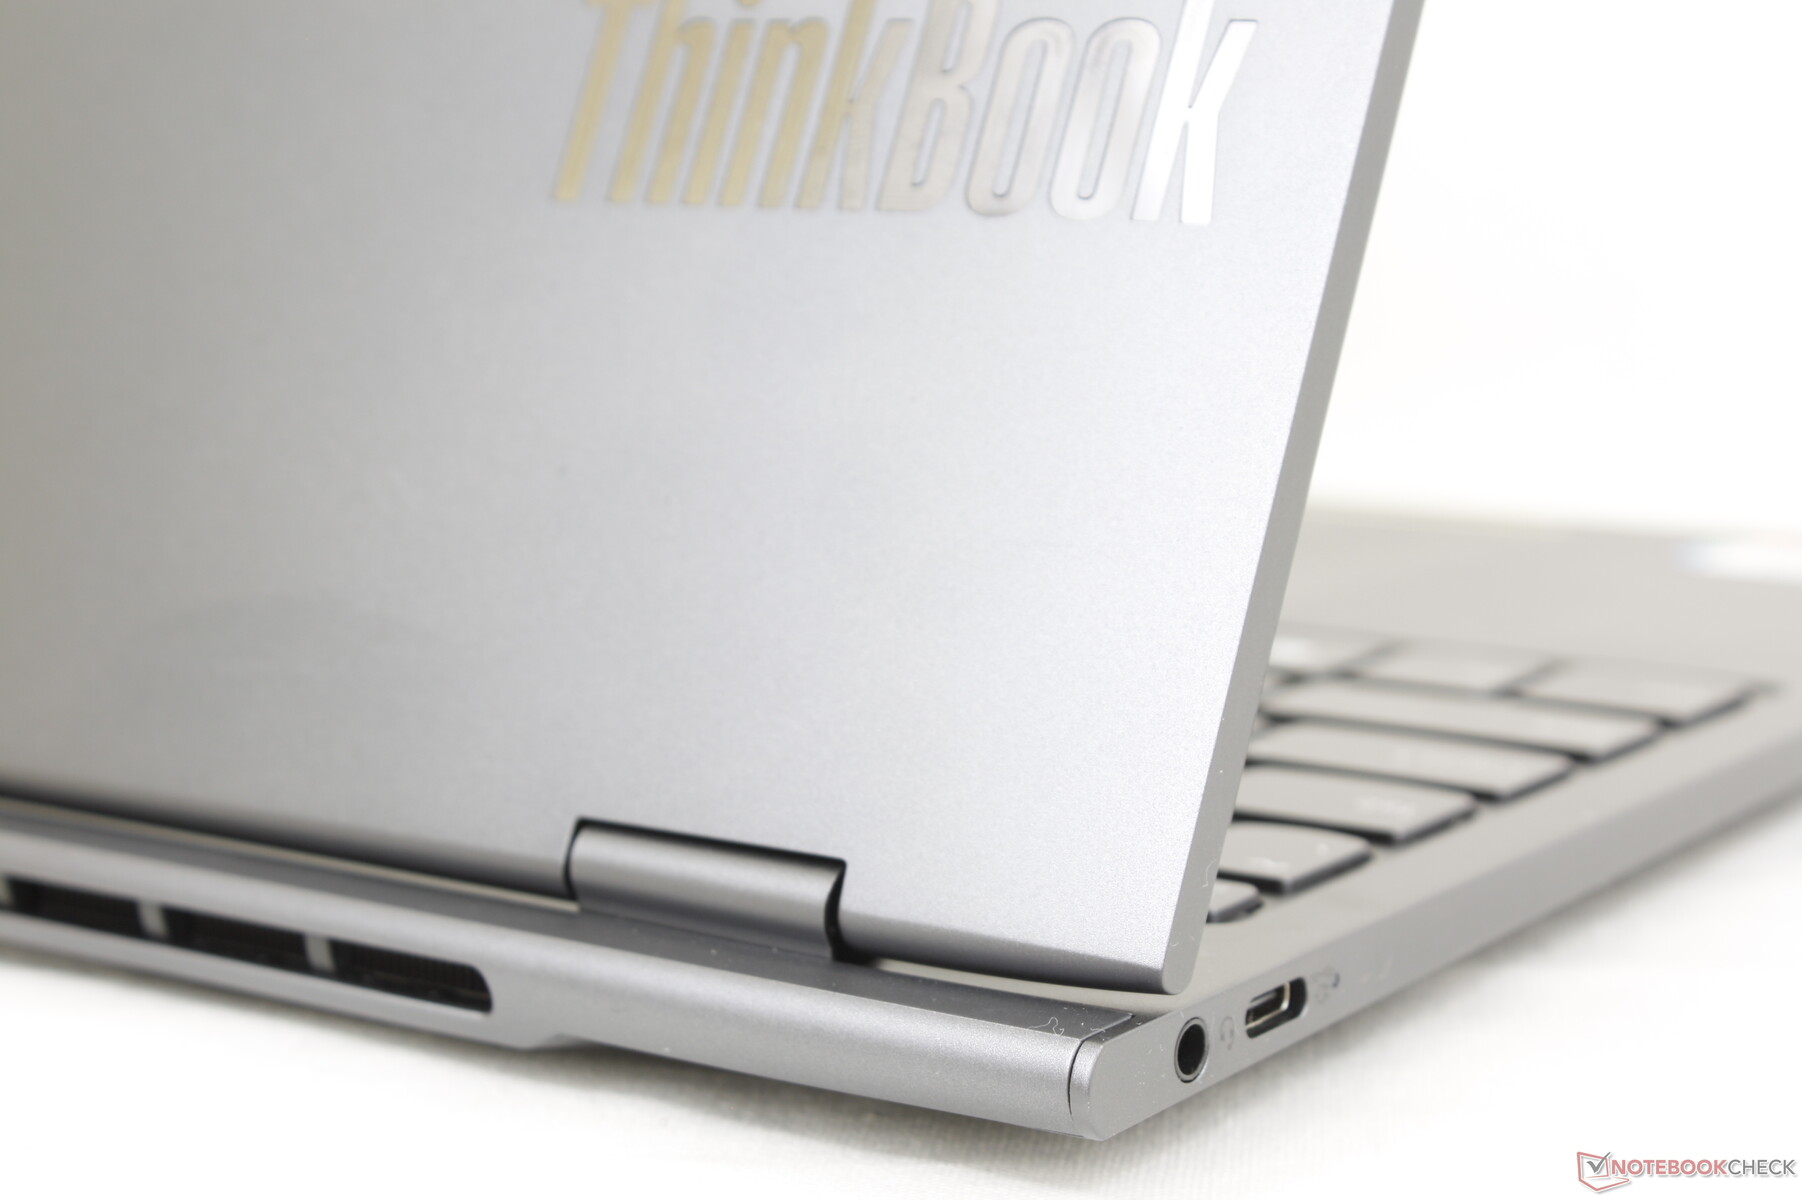
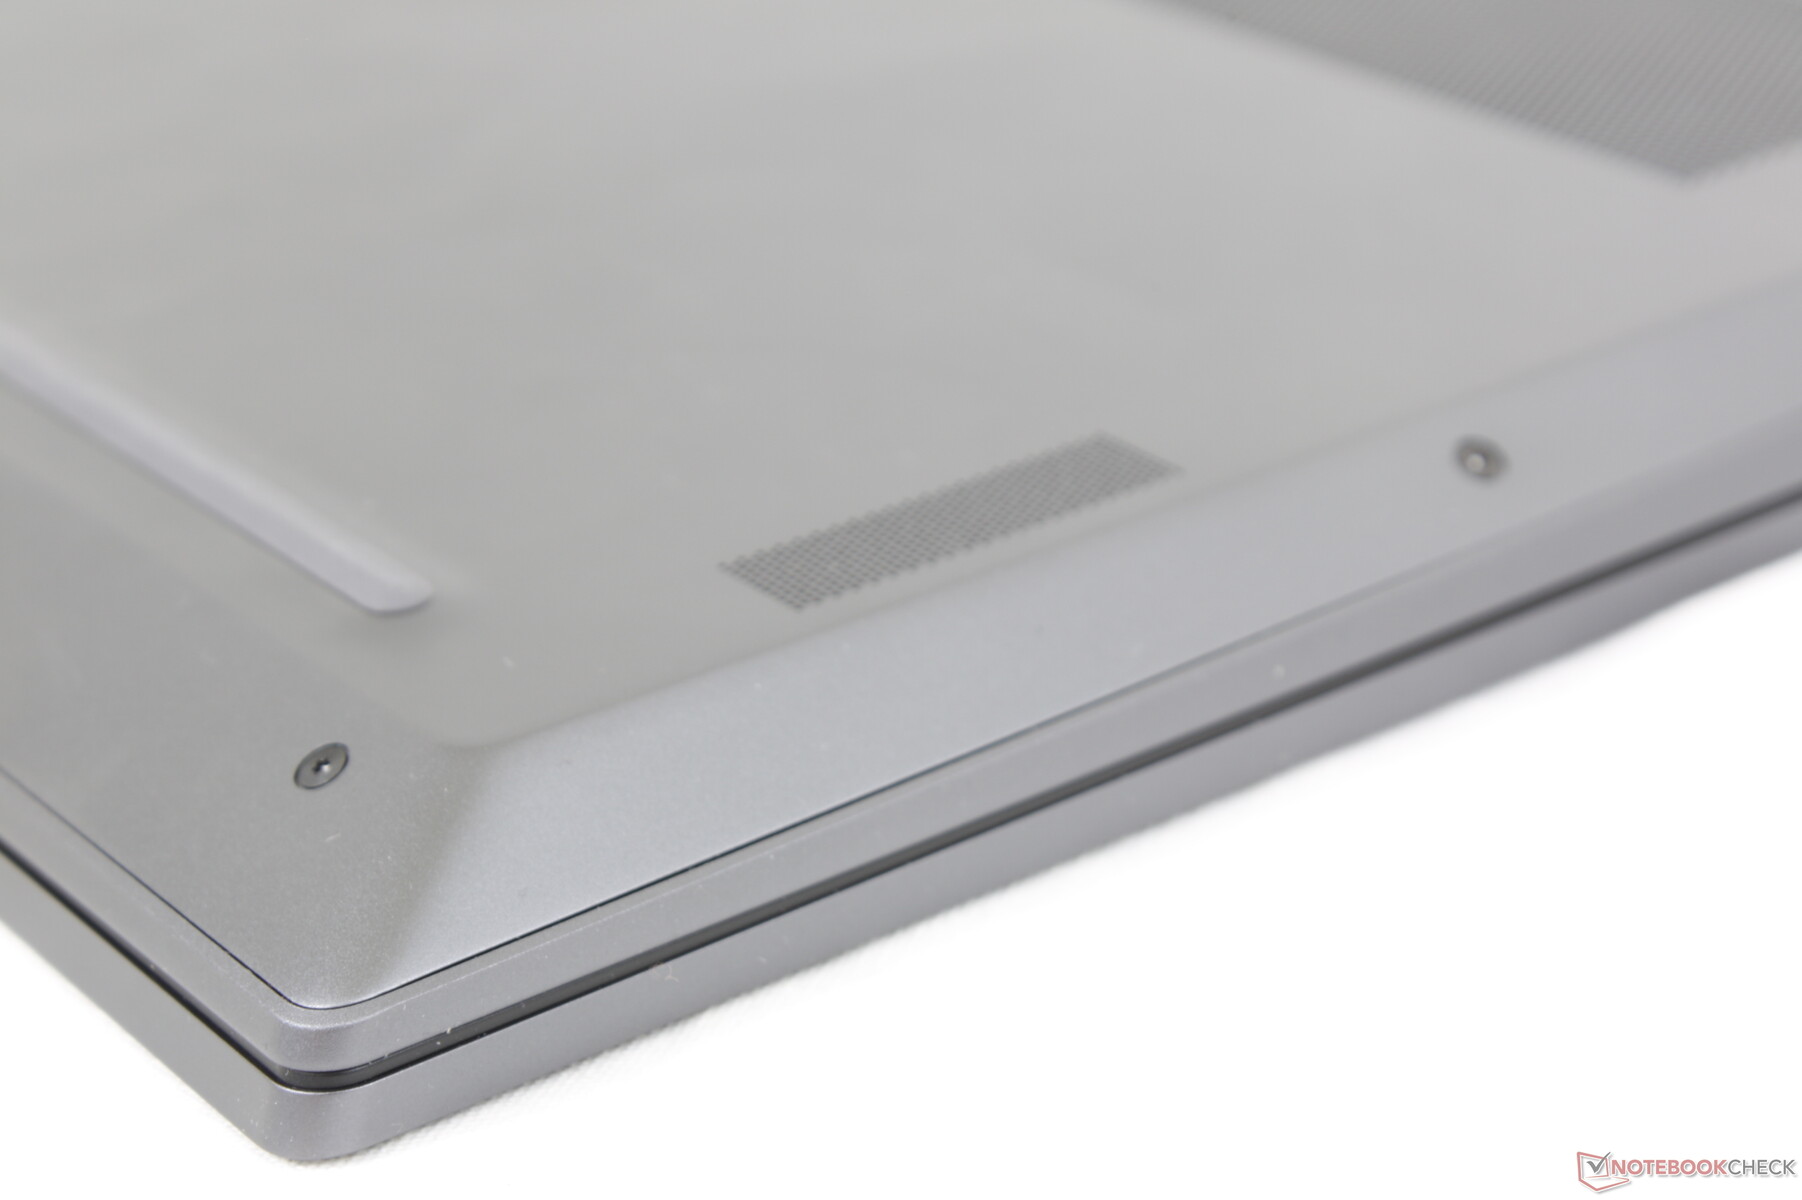
Chassit har samma material i aluminiumlegering som på andra ThinkBook-modeller, till exempel på den senaste ThinkBook-modellen ThinkBook 16 G4 Plus. Om du har haft en ThinkBook-modell tidigare kommer de släta mörkgrå ytorna på ThinkBook Plus Gen 3 att kännas omedelbart bekanta. Designen riktar sig till avslappnade kontor och SMB-miljöer mellan de konsumentinriktade Yoga-modellerna och de mer traditionella ThinkPad-modellerna.
Byggkvaliteten är något lägre än för en Yoga eller ThinkPad X-serien modell. Locket och basen är lite mer mottagliga för vridningar och knakningar, sannolikt på grund av den större 17,3-tumsformfaktorn och det relativt tunna skelettet. Alternativ som den mindre ZenBook Duo eller den tyngre XPS 17 känns fastare och med en mer solid känsla, särskilt när det gäller gångjärnen.
Det förlängda bildförhållandet har resulterat i ett chassi som är både bredare och kortare än andra bärbara 17-tumsdatorer. Den är tack och lov fortfarande tunn och lätt med tanke på storlekskategorin. XPS 17 är till exempel ett halvt kilo tyngre.
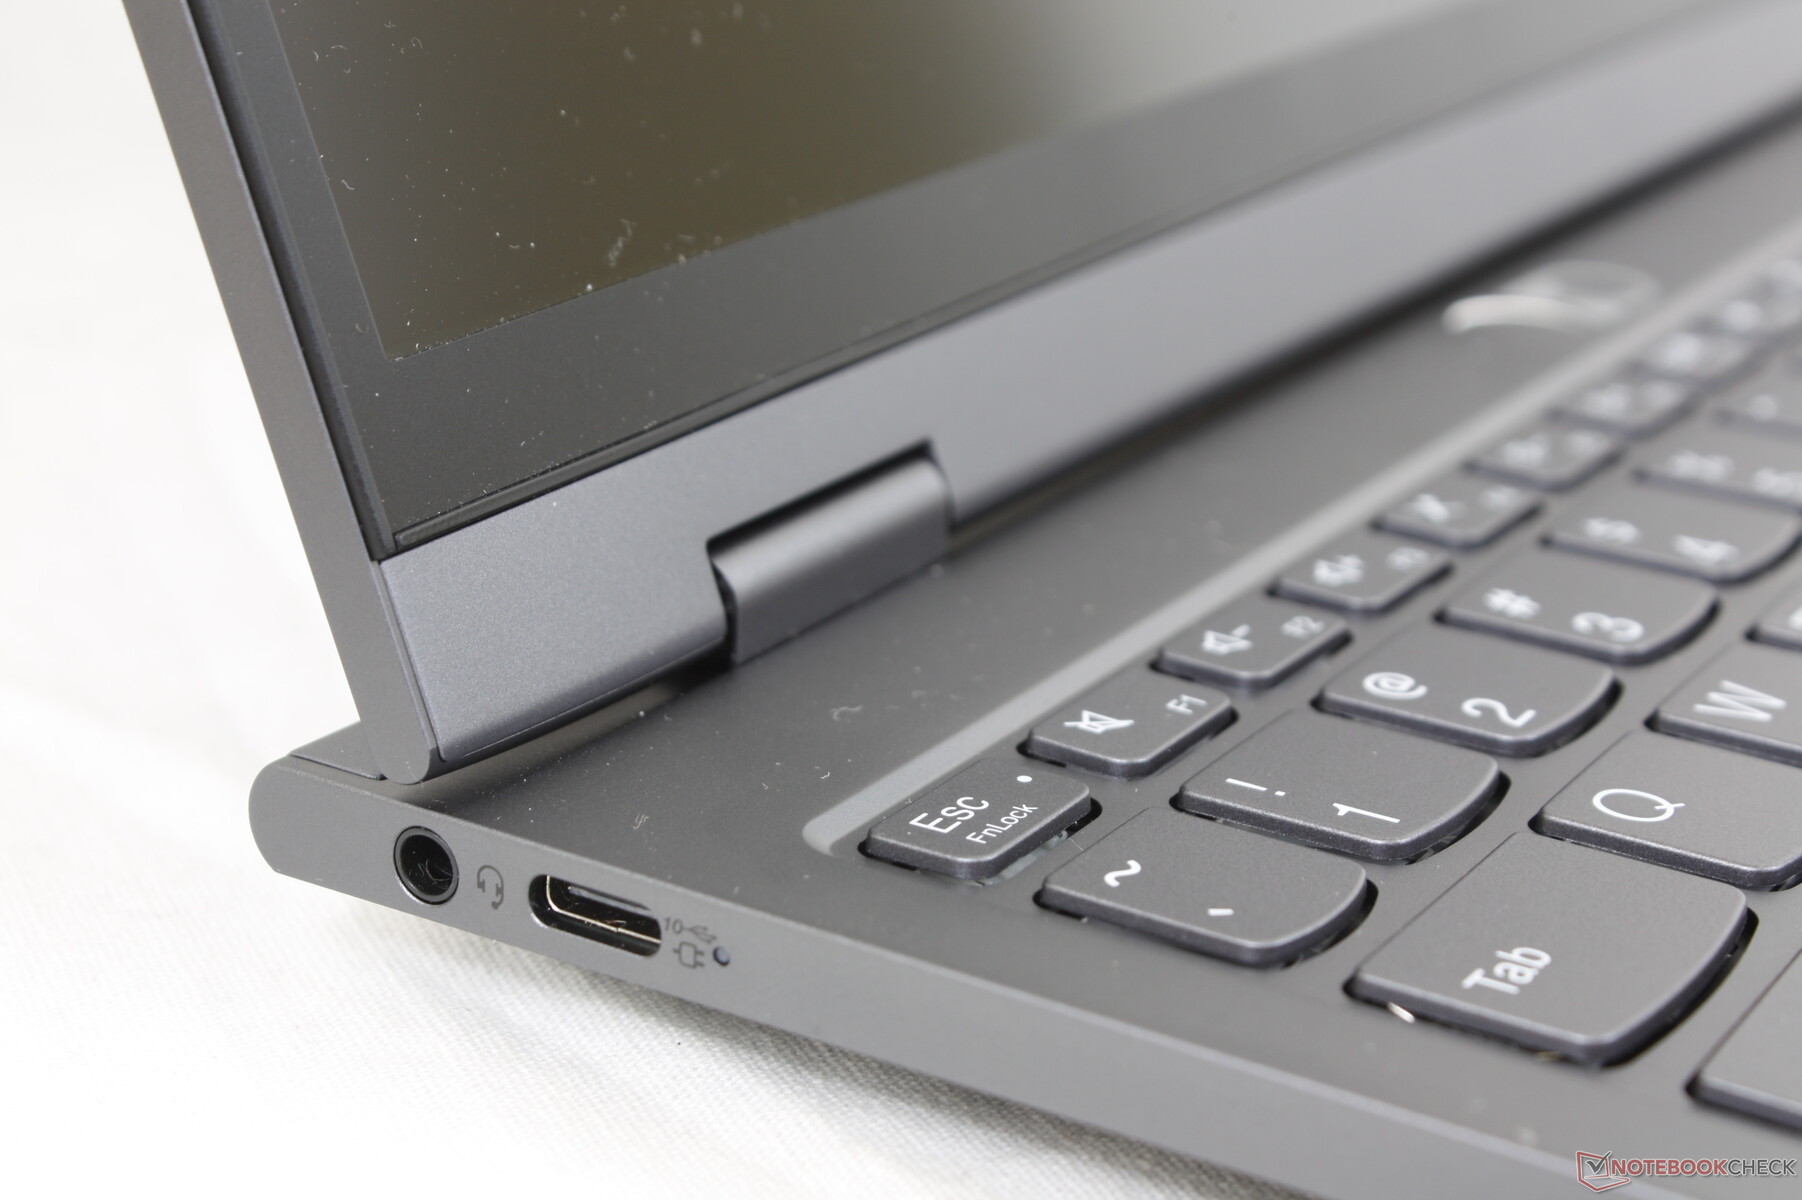
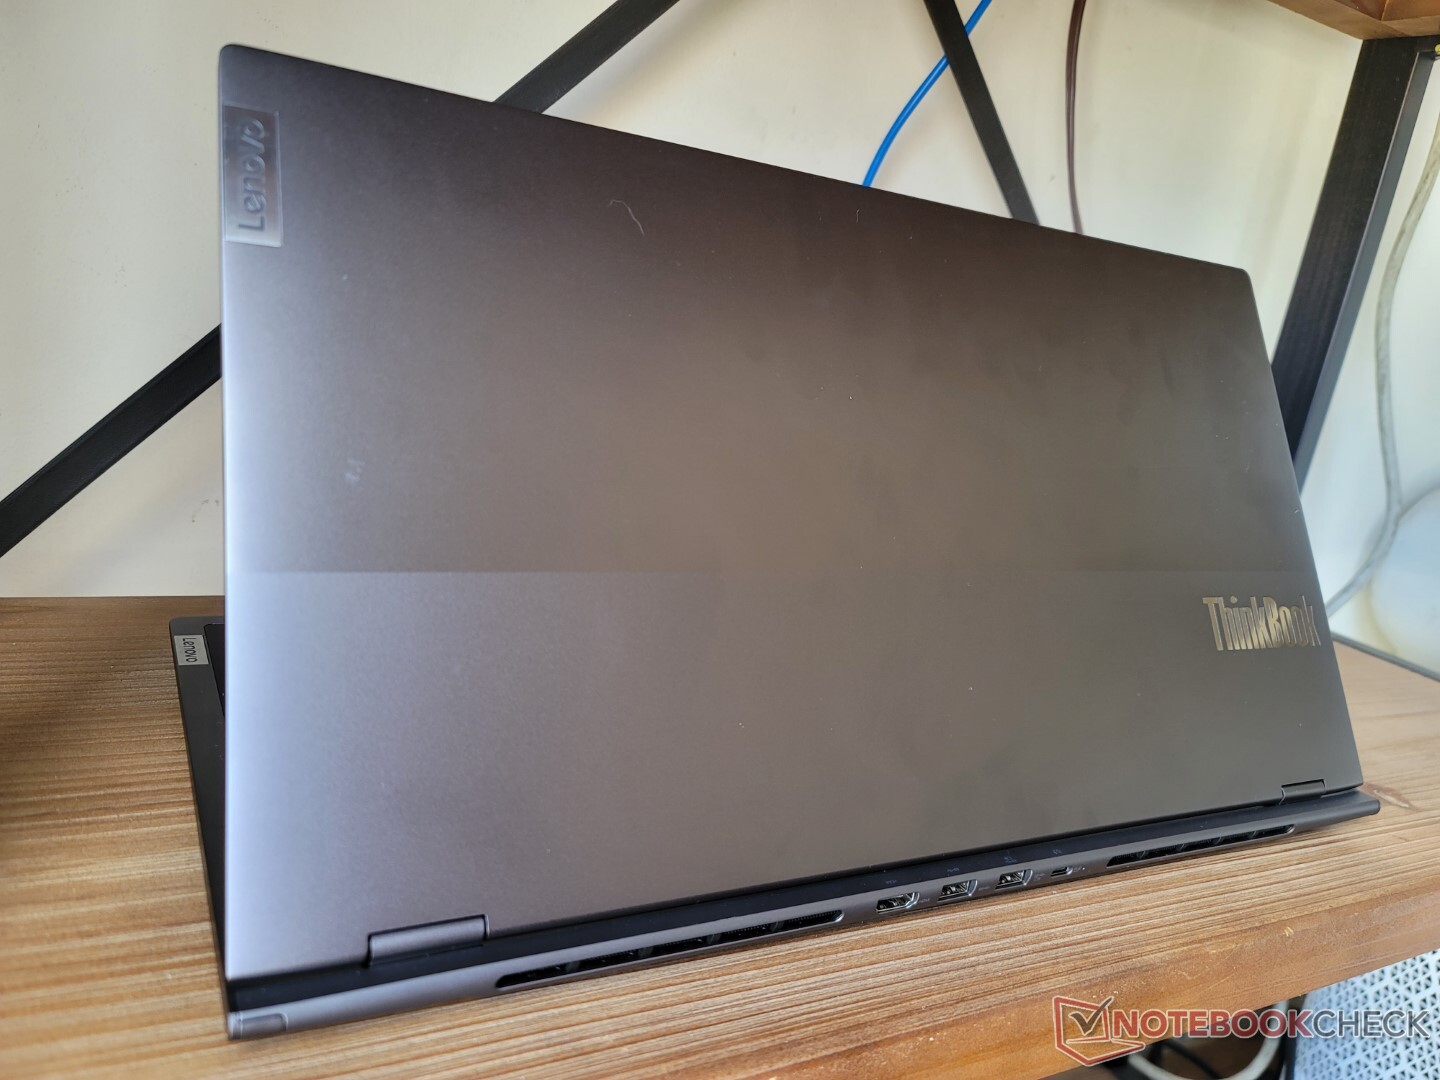
Anslutning - Stöd för Thunderbolt 4
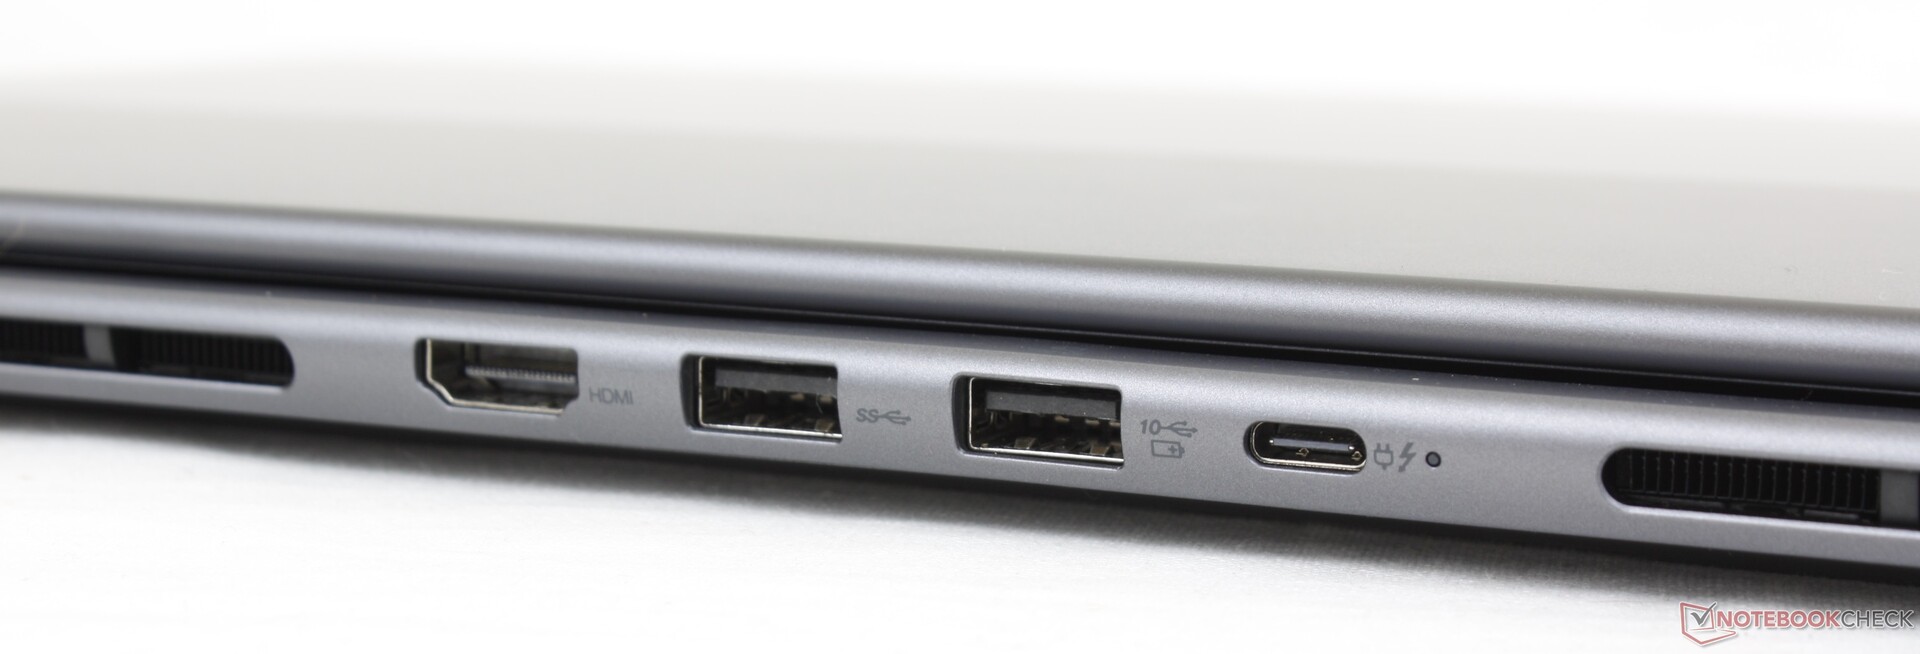
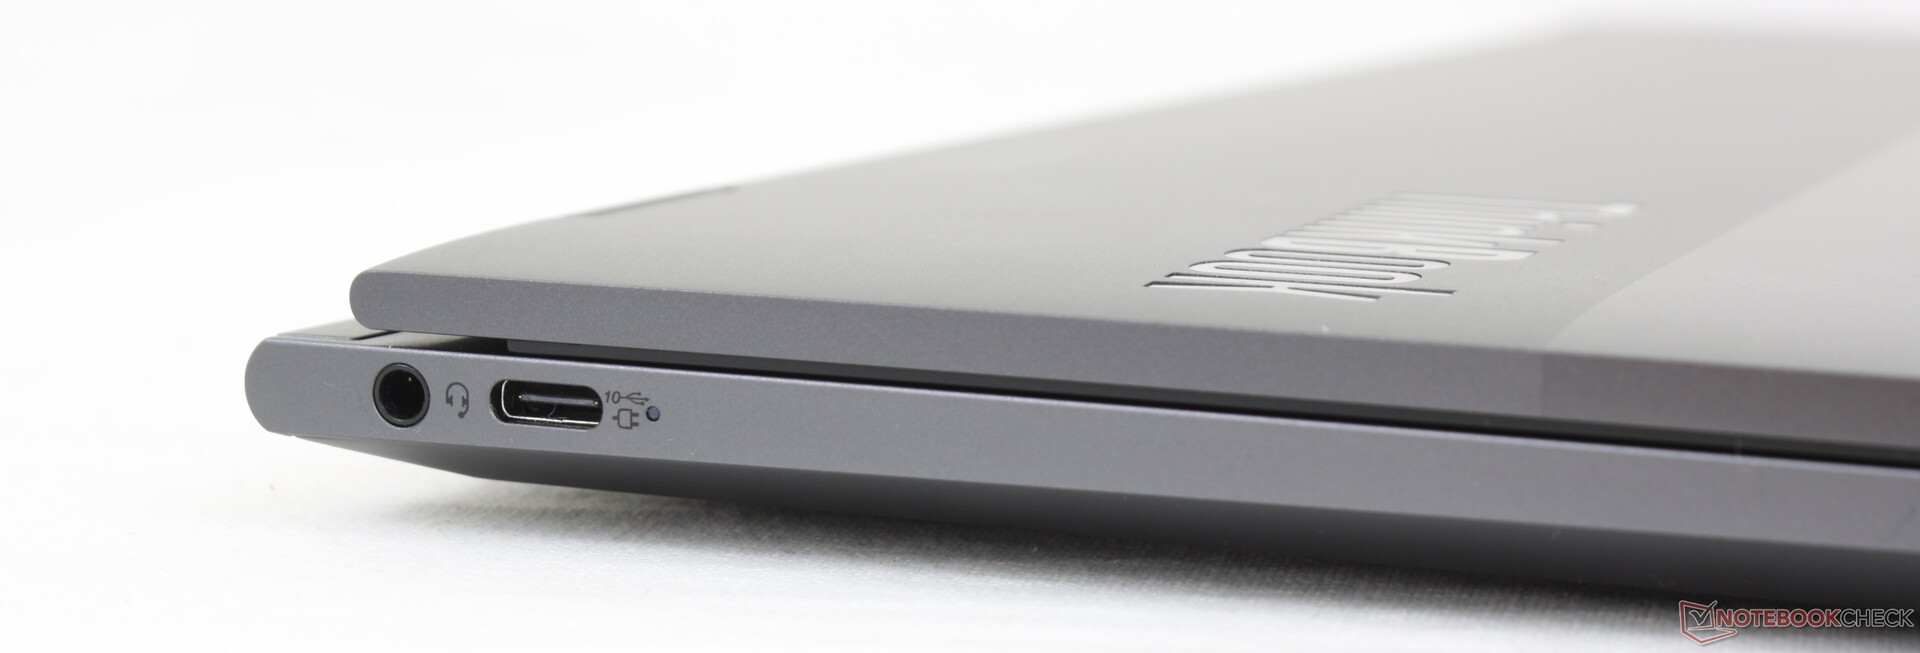
Det skulle vara ett brott om Gen 3-modellen hade färre portar än den mycket mindre modellen från förra generationen. Systemet integrerar två USB-C-portar precis som sin föregångare plus nya USB-A- och HDMI-portar längs baksidan för ett bredare utbud av alternativ. Observera att endast en av de två USB-C-portarna är kompatibel med Thunderbolt, men båda kan användas för laddning eller DisplayPort.
Det finns ingen SD-kortläsare, vilket är en liten besvikelse med tanke på den stora formfaktorn och fokus på kontors- och redigeringsuppgifter.
Kommunikation
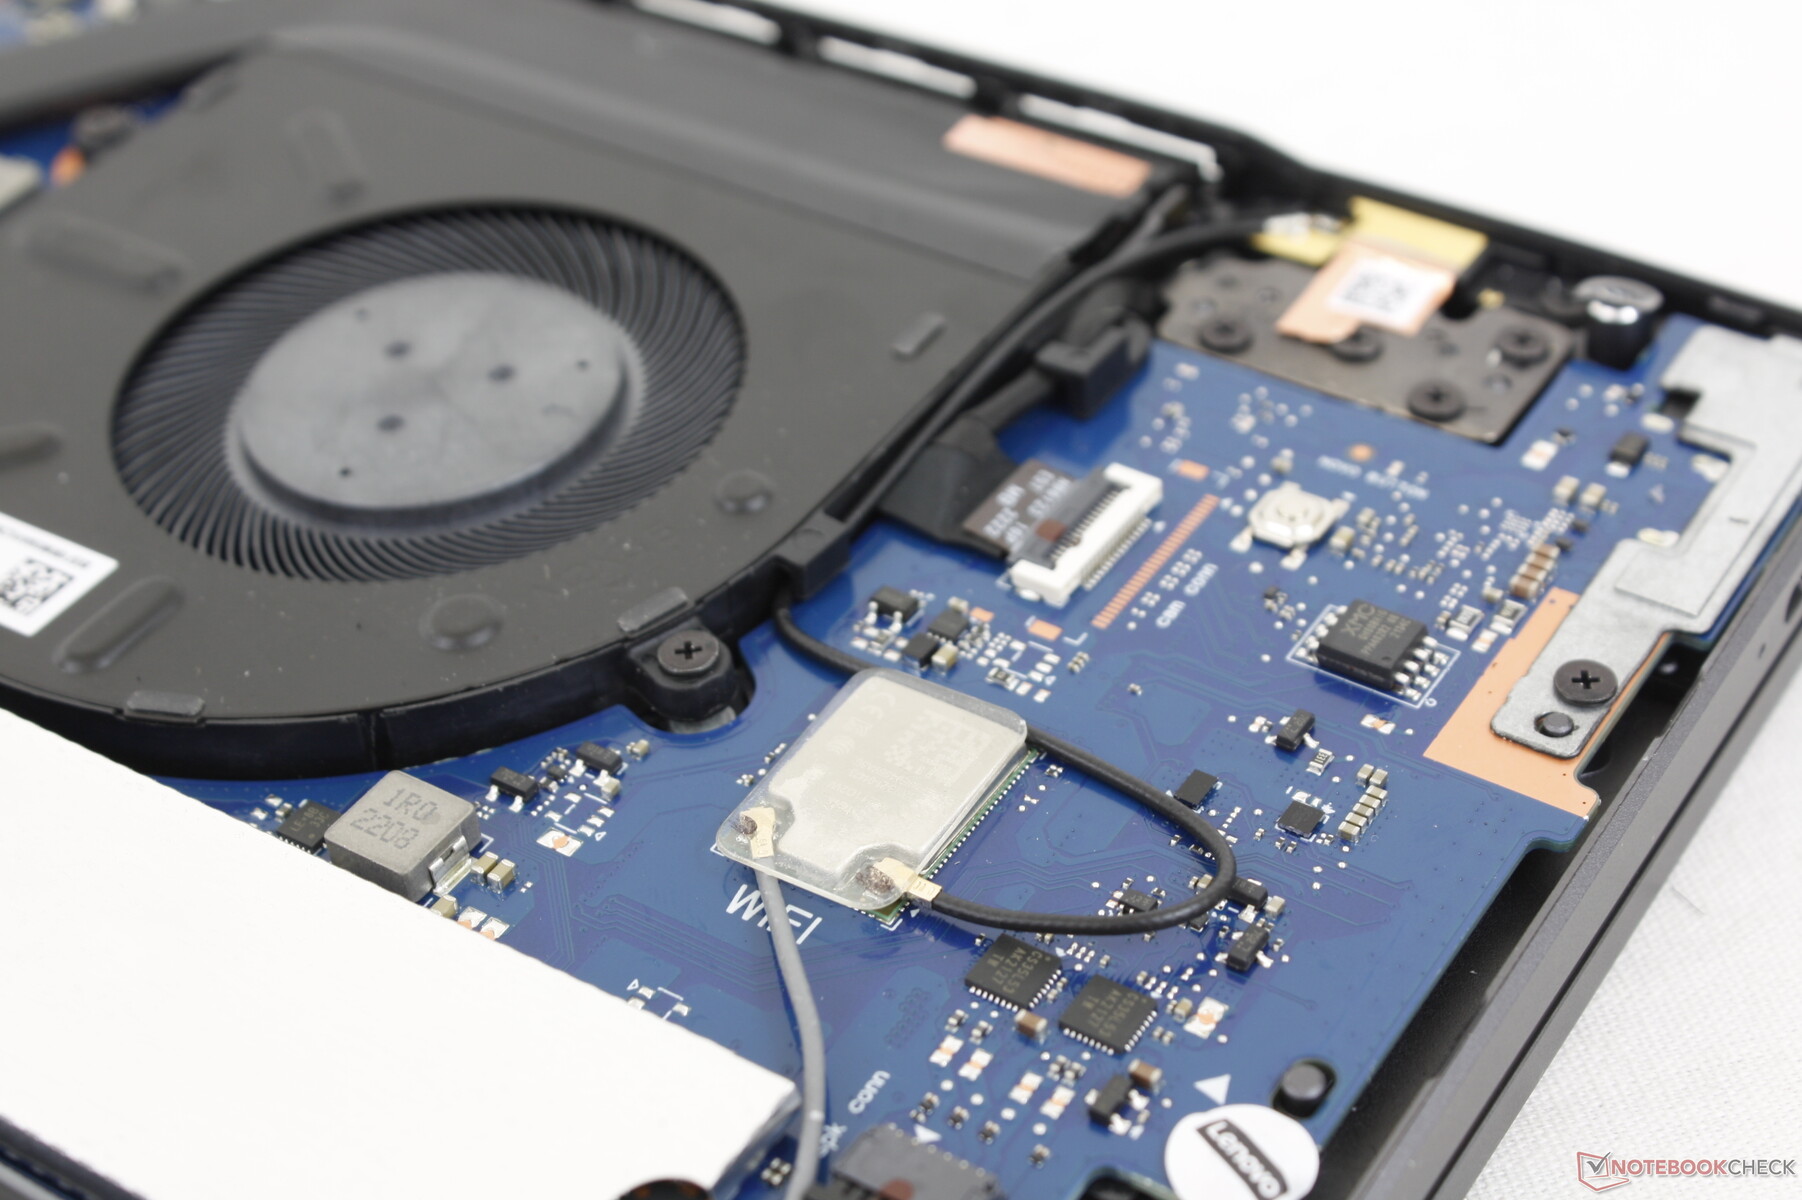
En Intel AX211 är standard för Wi-Fi 6E och Bluetooth 5.2. Vi upplevde stabila överföringshastigheter när vi kopplade till vårt 6 GHz-nätverk.
| Networking | |
| iperf3 transmit AX12 | |
| Gigabyte Aero 17 HDR YD | |
| Asus ProArt StudioBook Pro 17 W700G3T | |
| Lenovo ThinkBook Plus Gen2 Core i5 | |
| iperf3 receive AX12 | |
| Asus ProArt StudioBook Pro 17 W700G3T | |
| Lenovo ThinkBook Plus Gen2 Core i5 | |
| Gigabyte Aero 17 HDR YD | |
| iperf3 receive AXE11000 6GHz | |
| Lenovo ThinkBook Plus Gen3 | |
| iperf3 receive AXE11000 | |
| LG Gram 17 (2022) | |
| Dell XPS 17 9720 | |
| iperf3 transmit AXE11000 6GHz | |
| Lenovo ThinkBook Plus Gen3 | |
| iperf3 transmit AXE11000 | |
| Dell XPS 17 9720 | |
| LG Gram 17 (2022) | |
Webbkamera
2 MP-kameran är skarpare än kamerorna i XPS-serien, men fortfarande inte lika bra som 5 MP-kamerorna i XPS-serien många nyare HP-modeller. Det finns både en IR-sensor och en slutare för att ge stöd för Hello och för att skydda privatlivet.


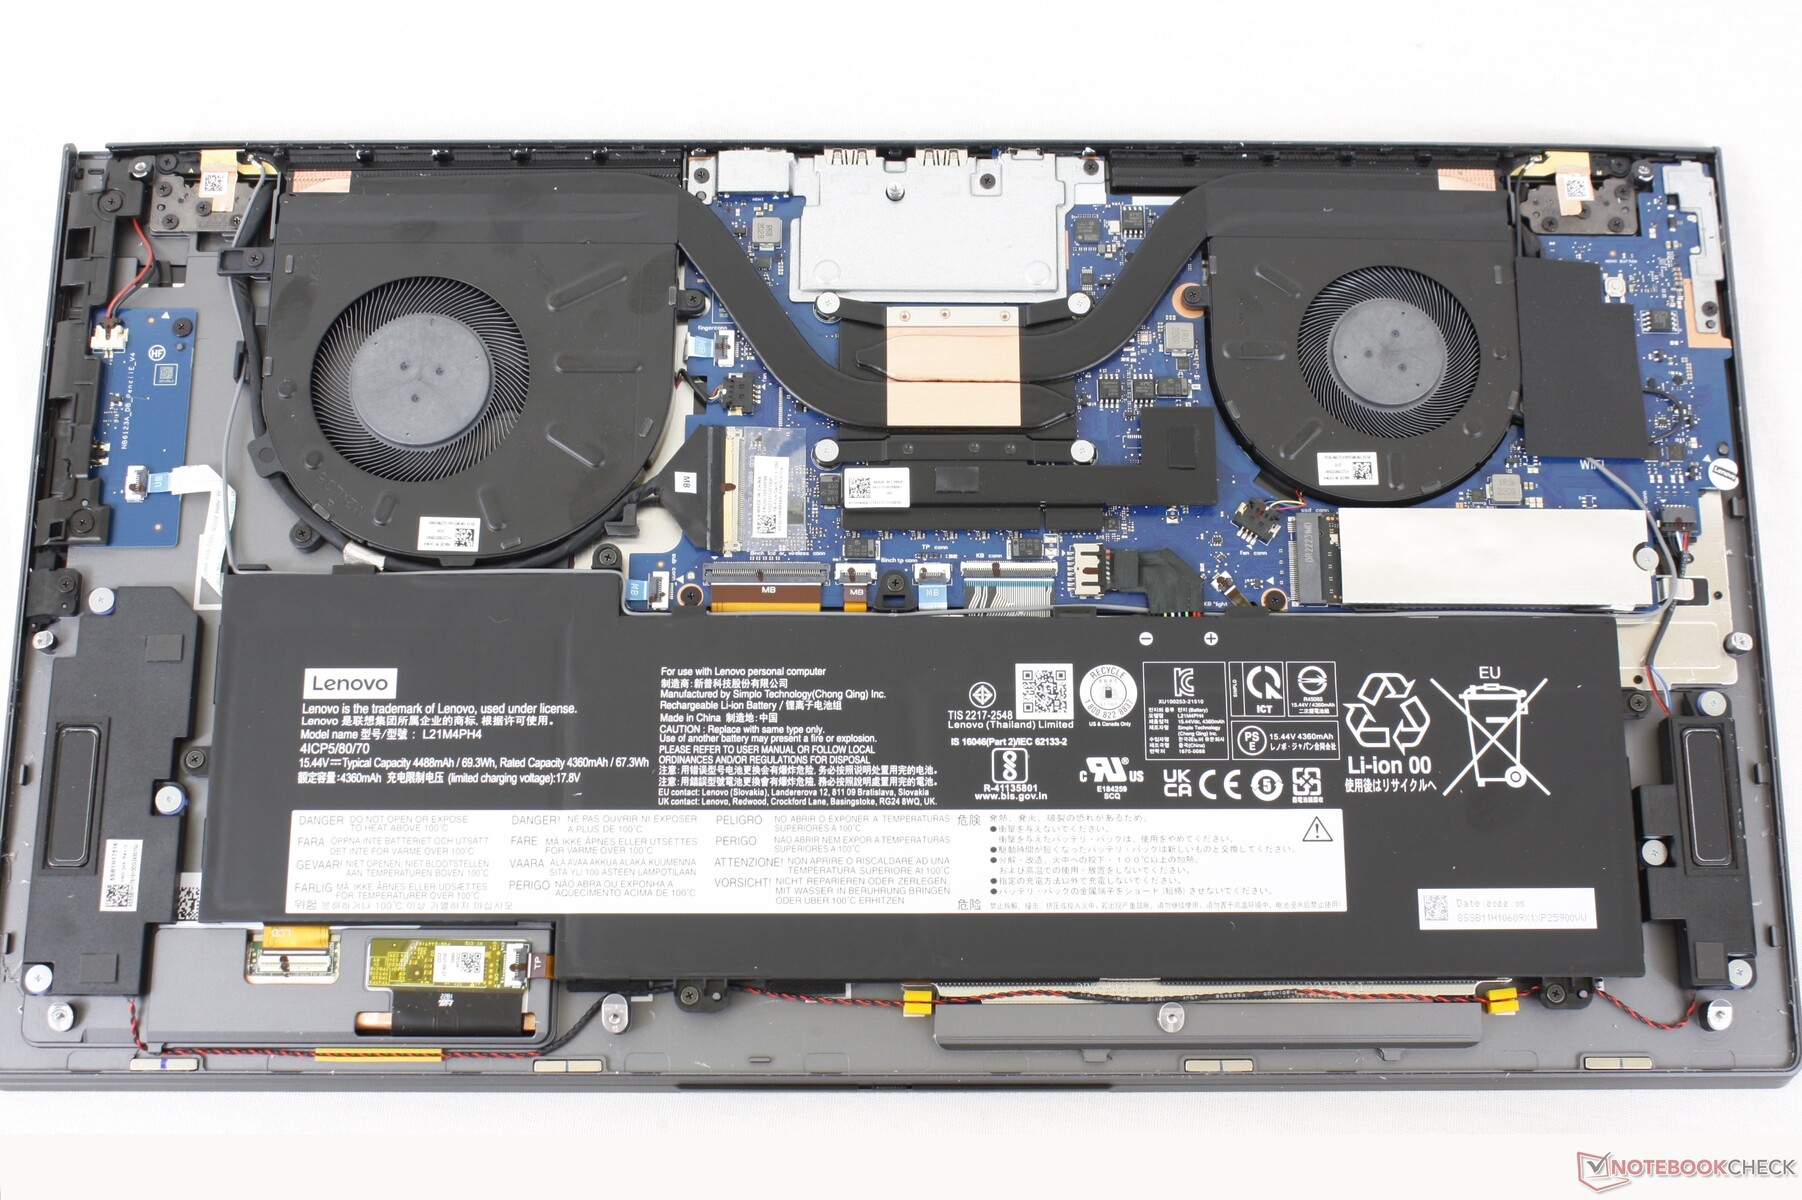
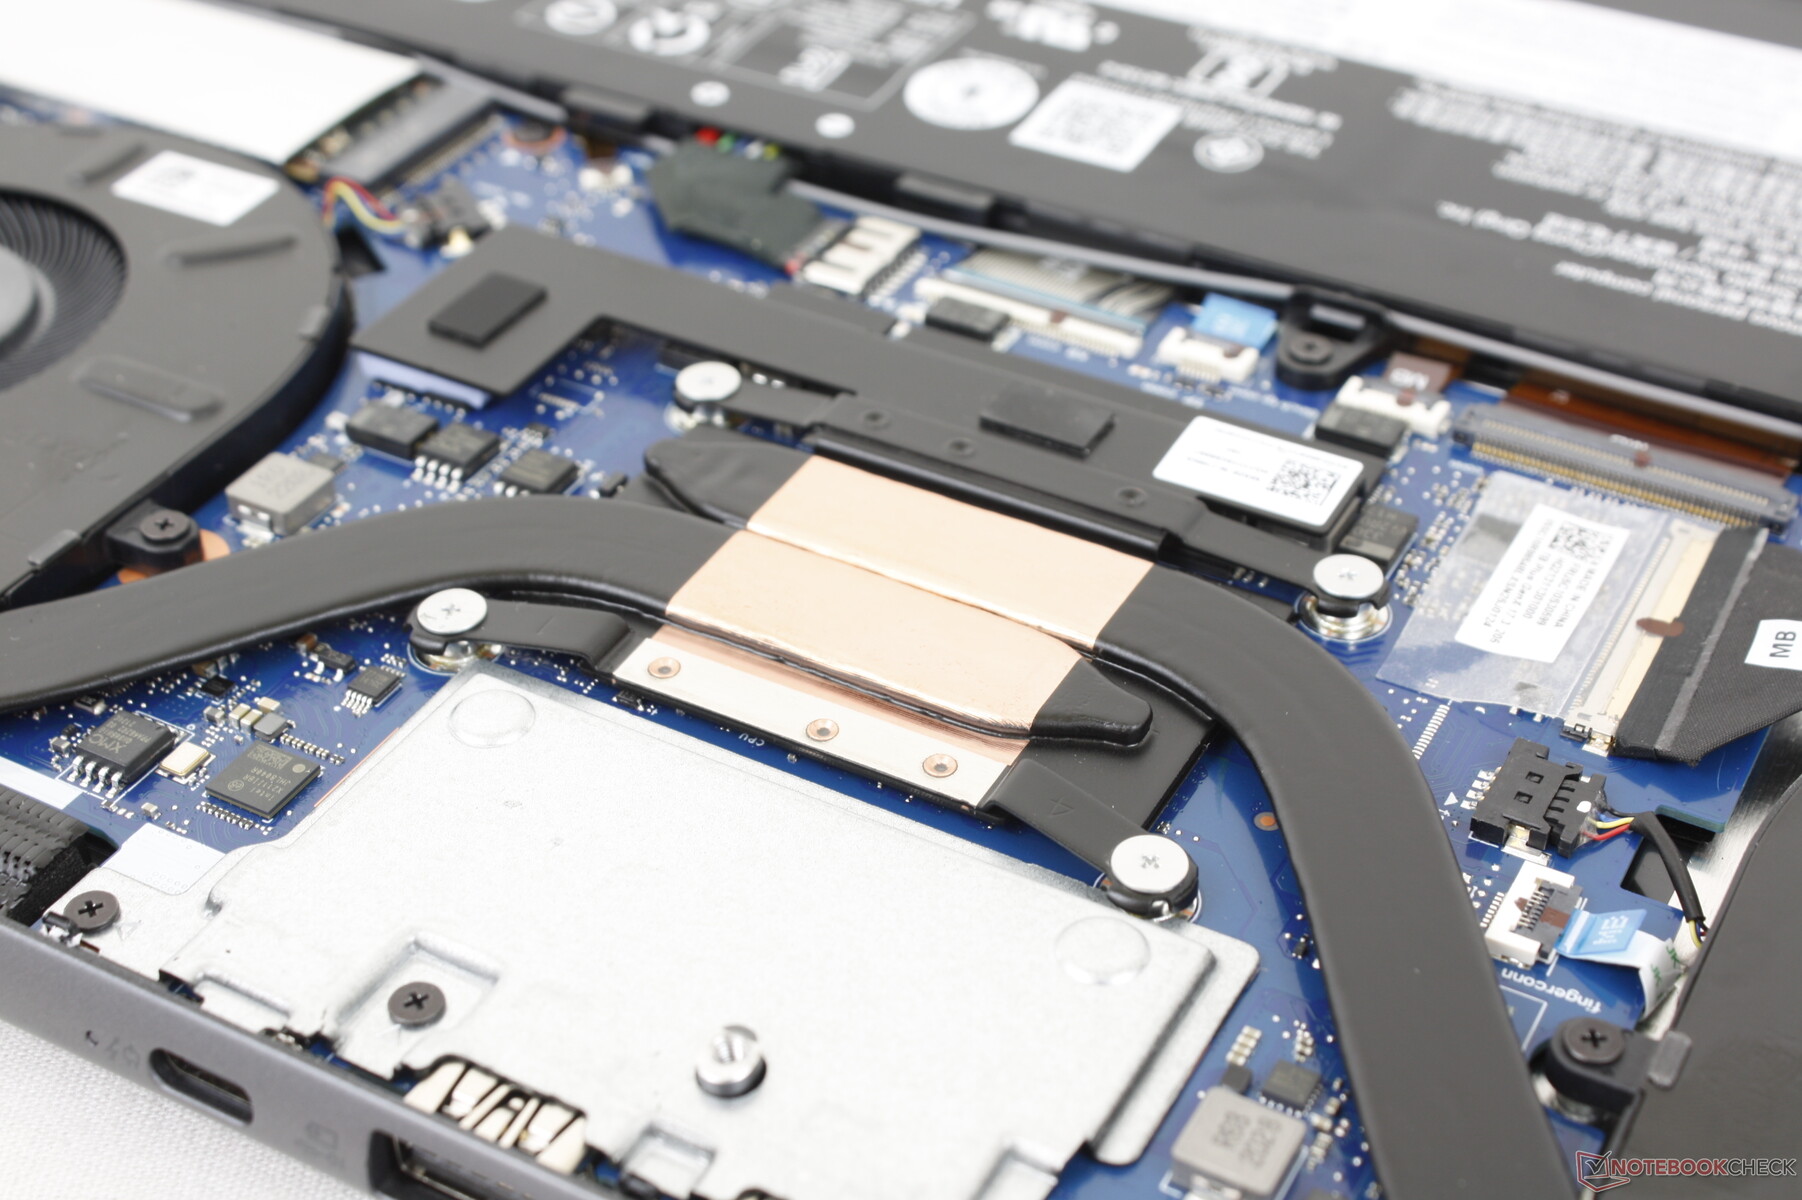
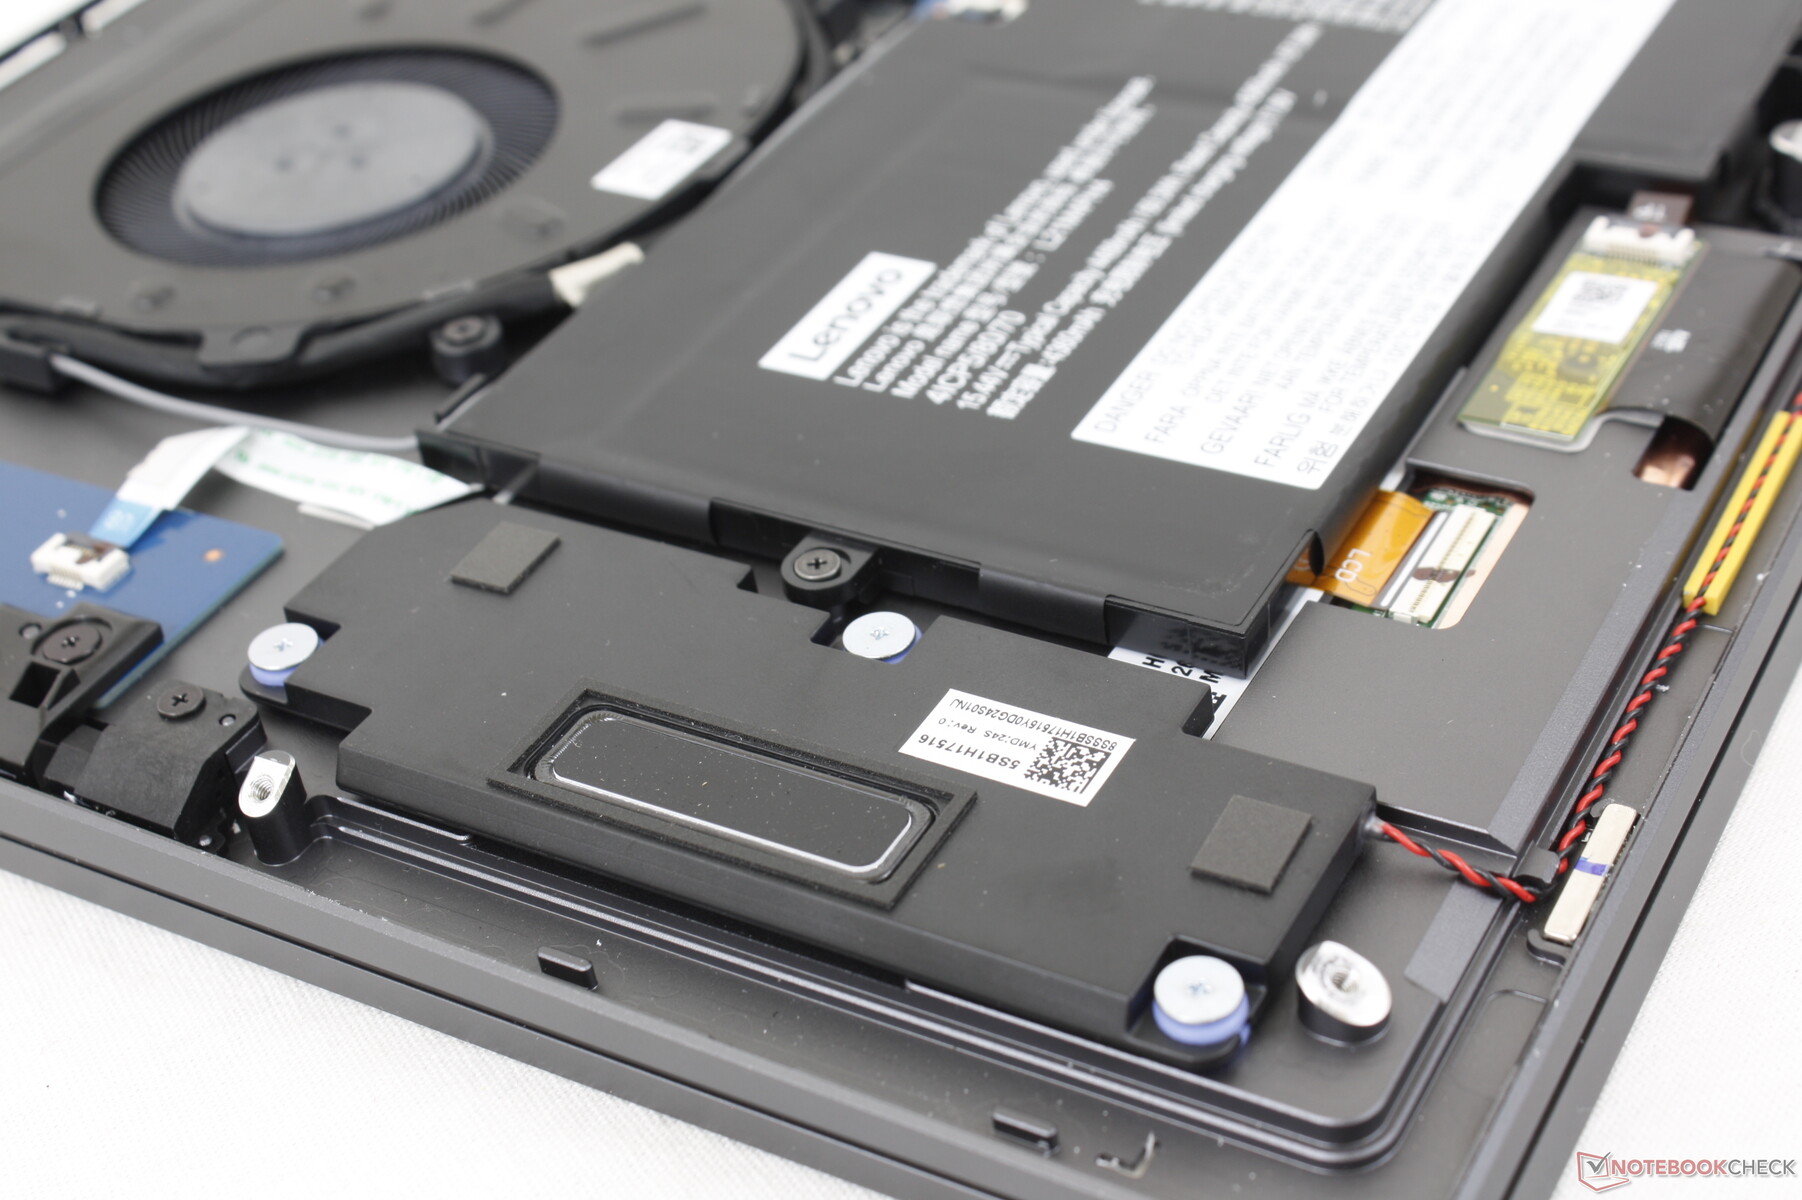
Underhåll
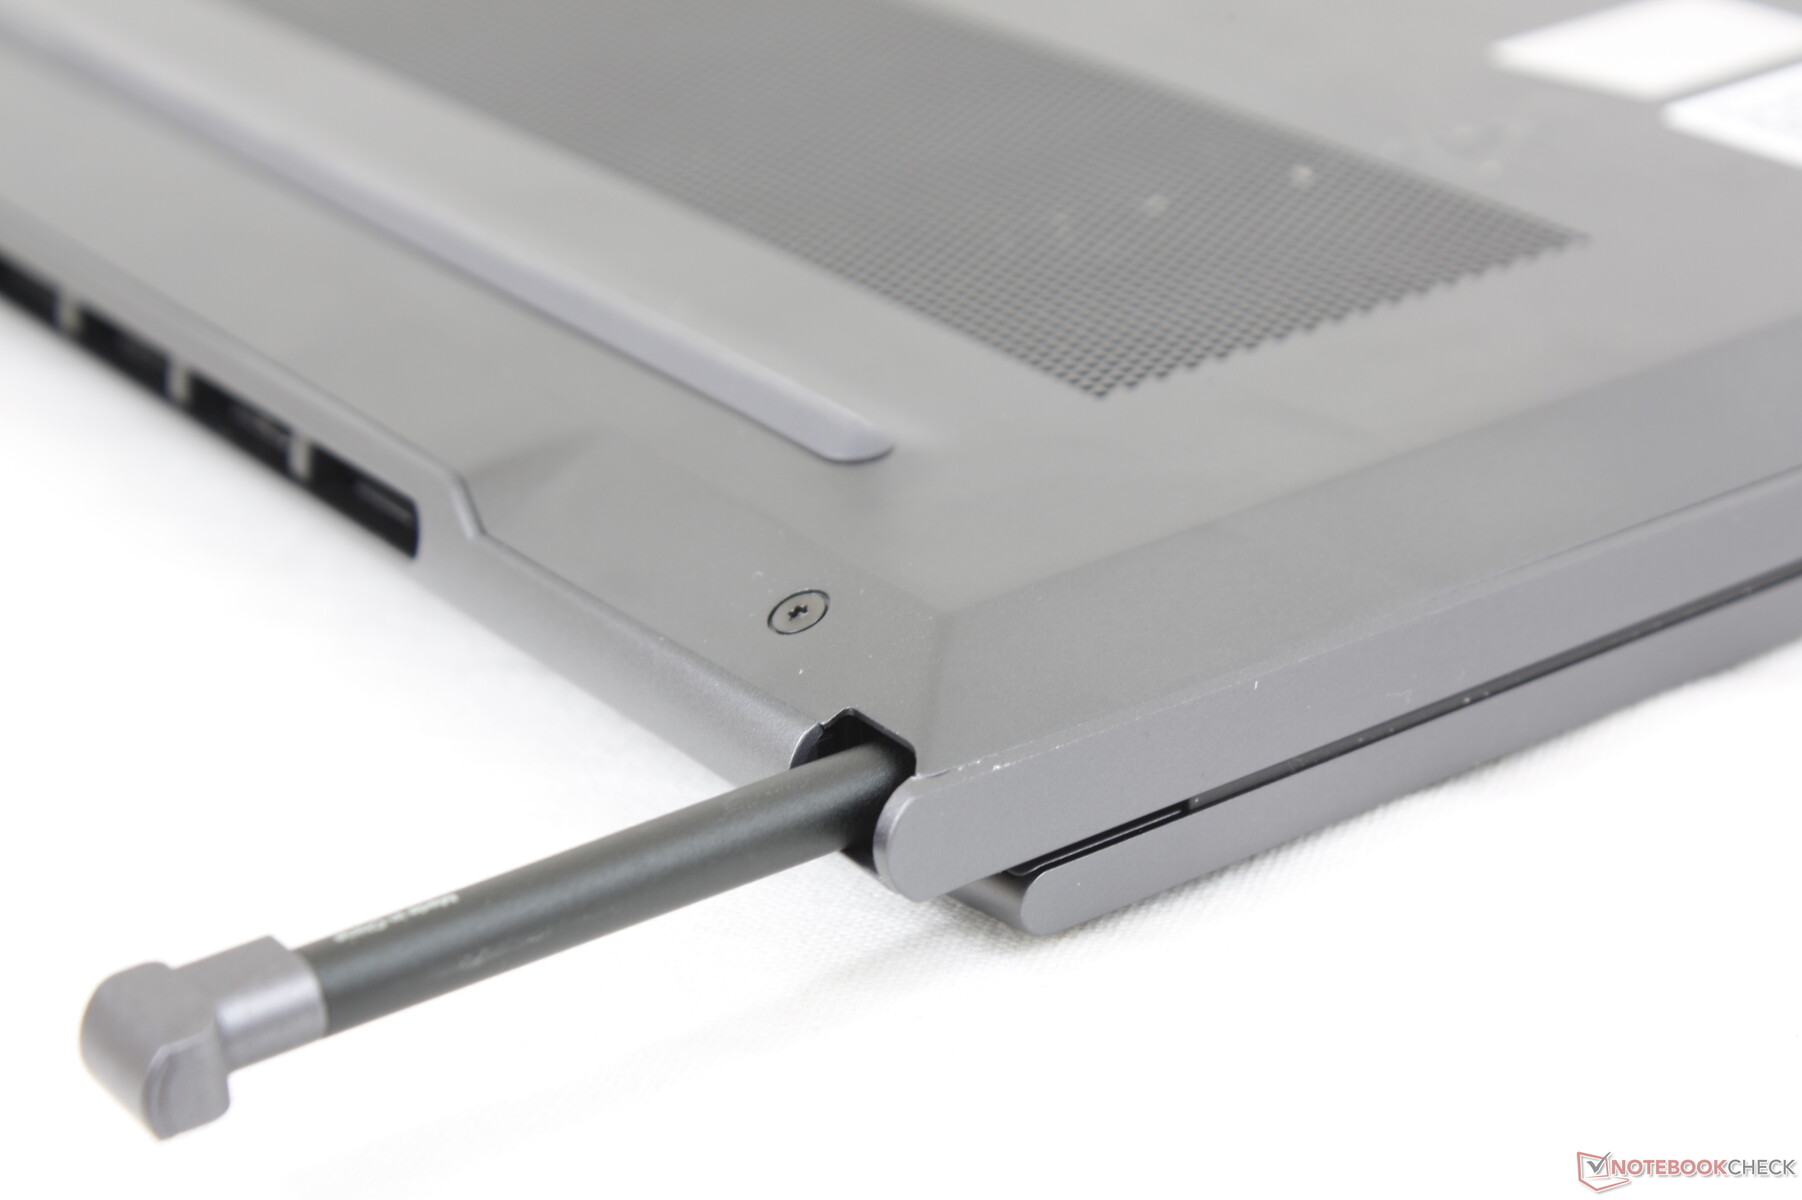
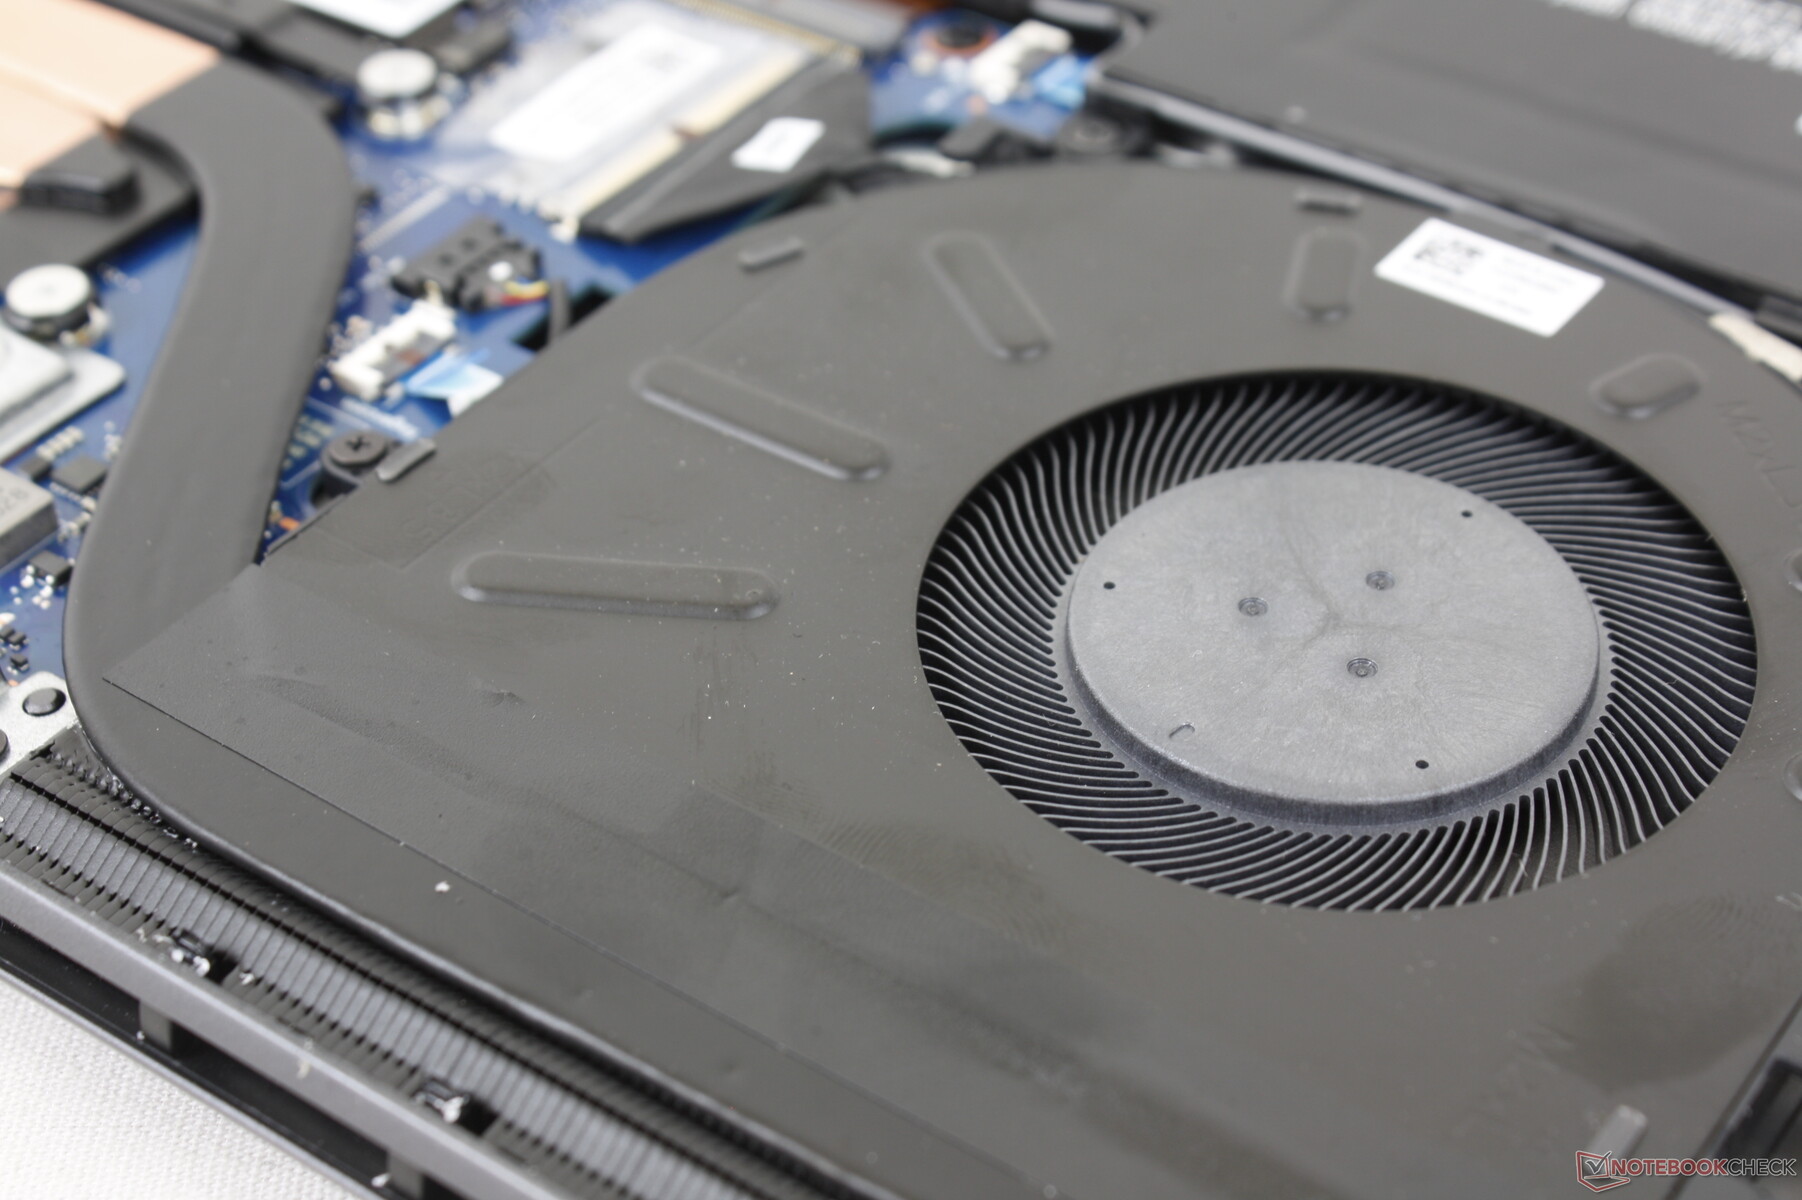
Bottenpanelen fästs med nio T5 Torx-skruvar. Vi rekommenderar att du tar bort pennan bakifrån först och sedan använder den öppningen för att lättare lossa panelen från basen.
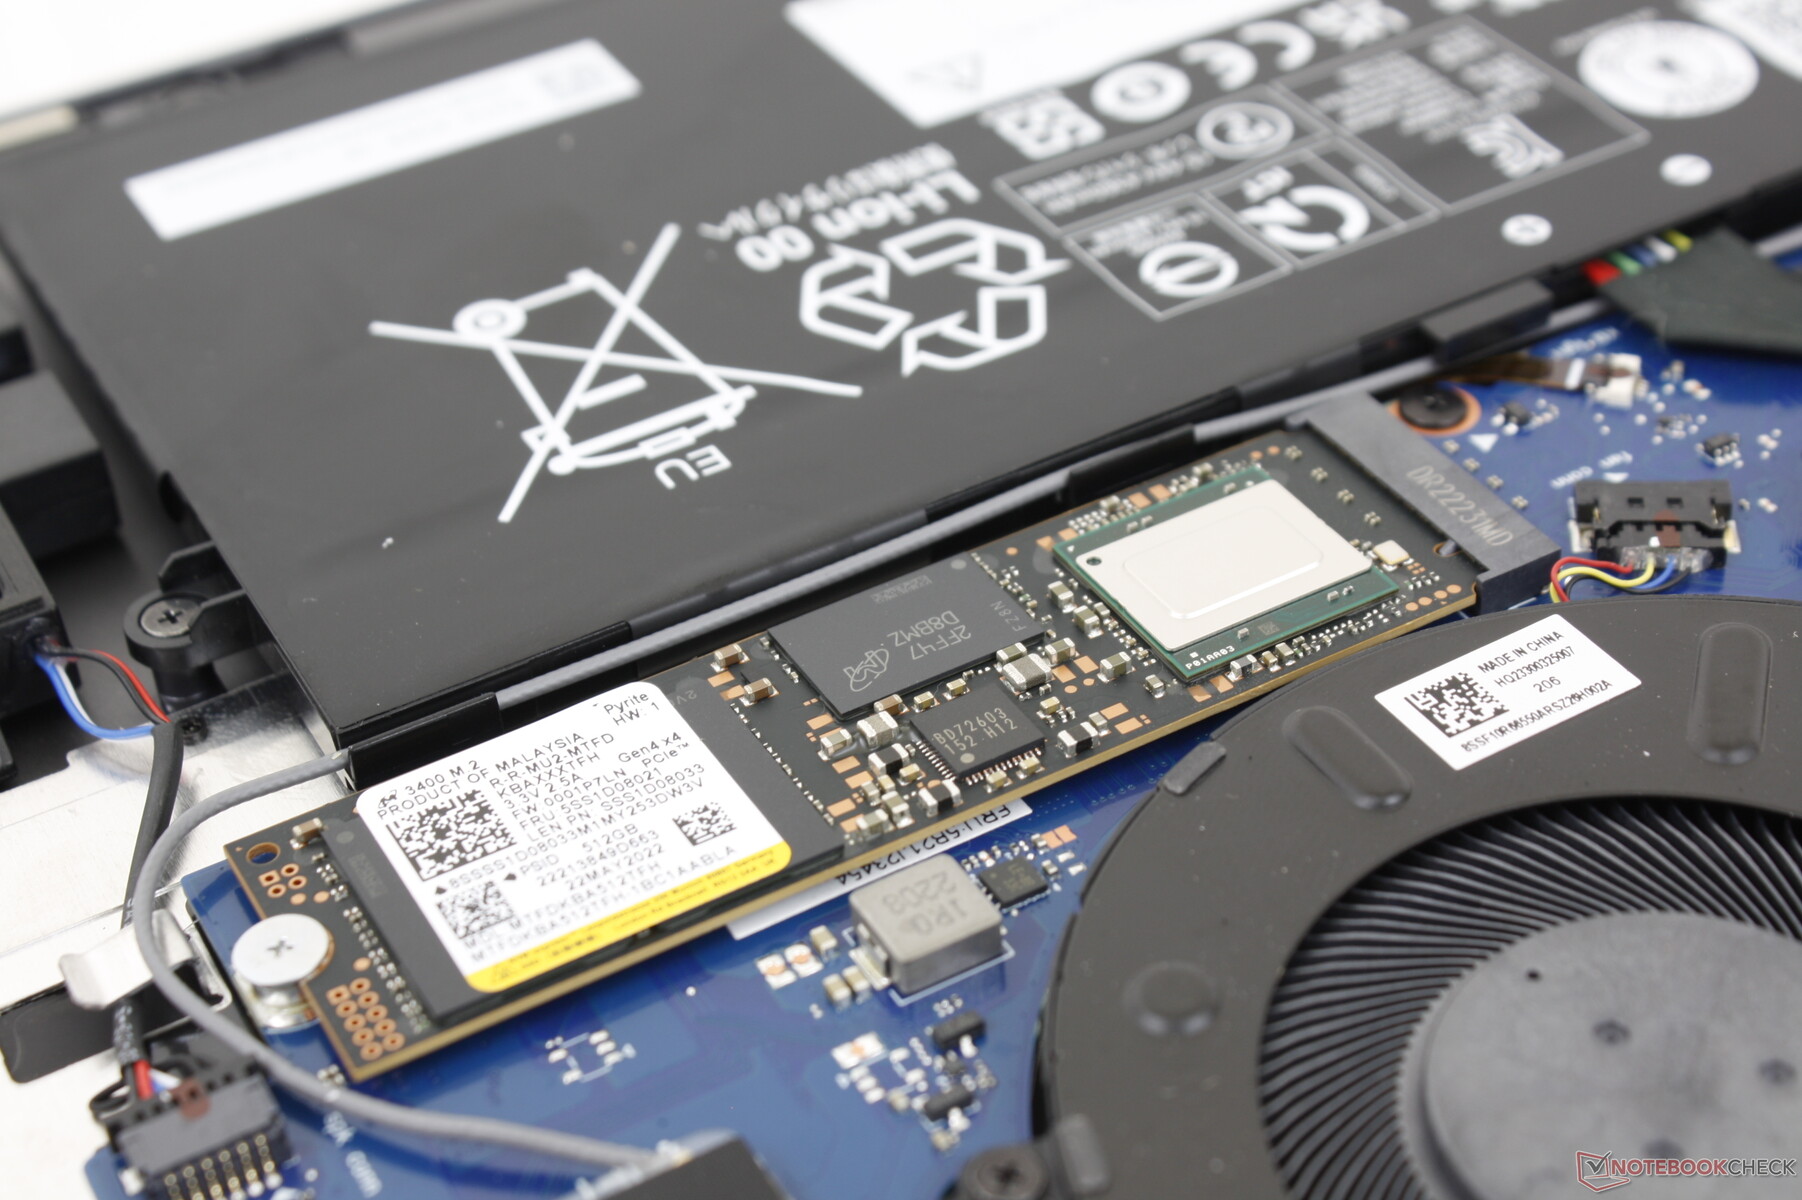
Det finns inte mycket att uppgradera när man väl är inne eftersom både WLAN- och RAM-modulerna är lödda.
Tillbehör och garanti
Systemet har en aktiv penna, precis som förra årets Gen 2-modell. Den vanliga ettåriga begränsade tillverkargarantin gäller om den köps i USA.
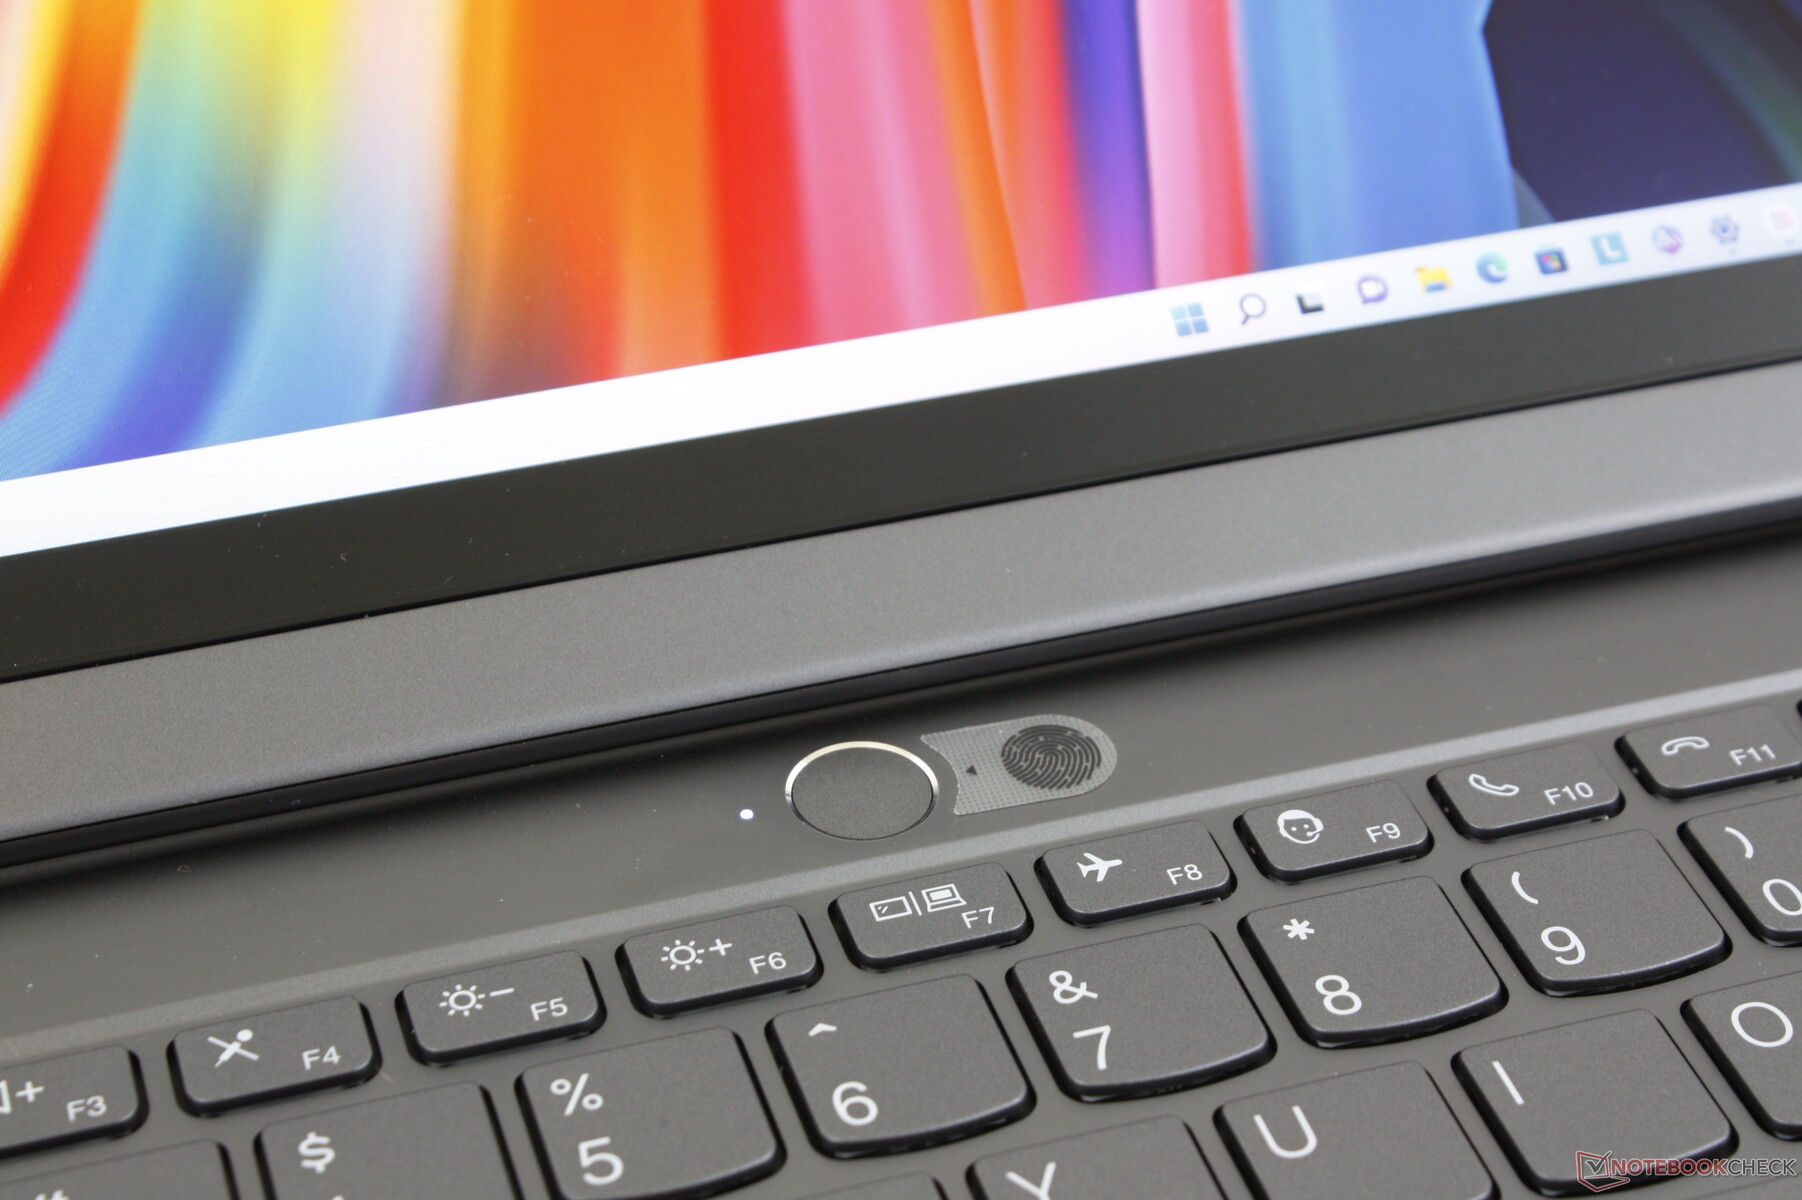
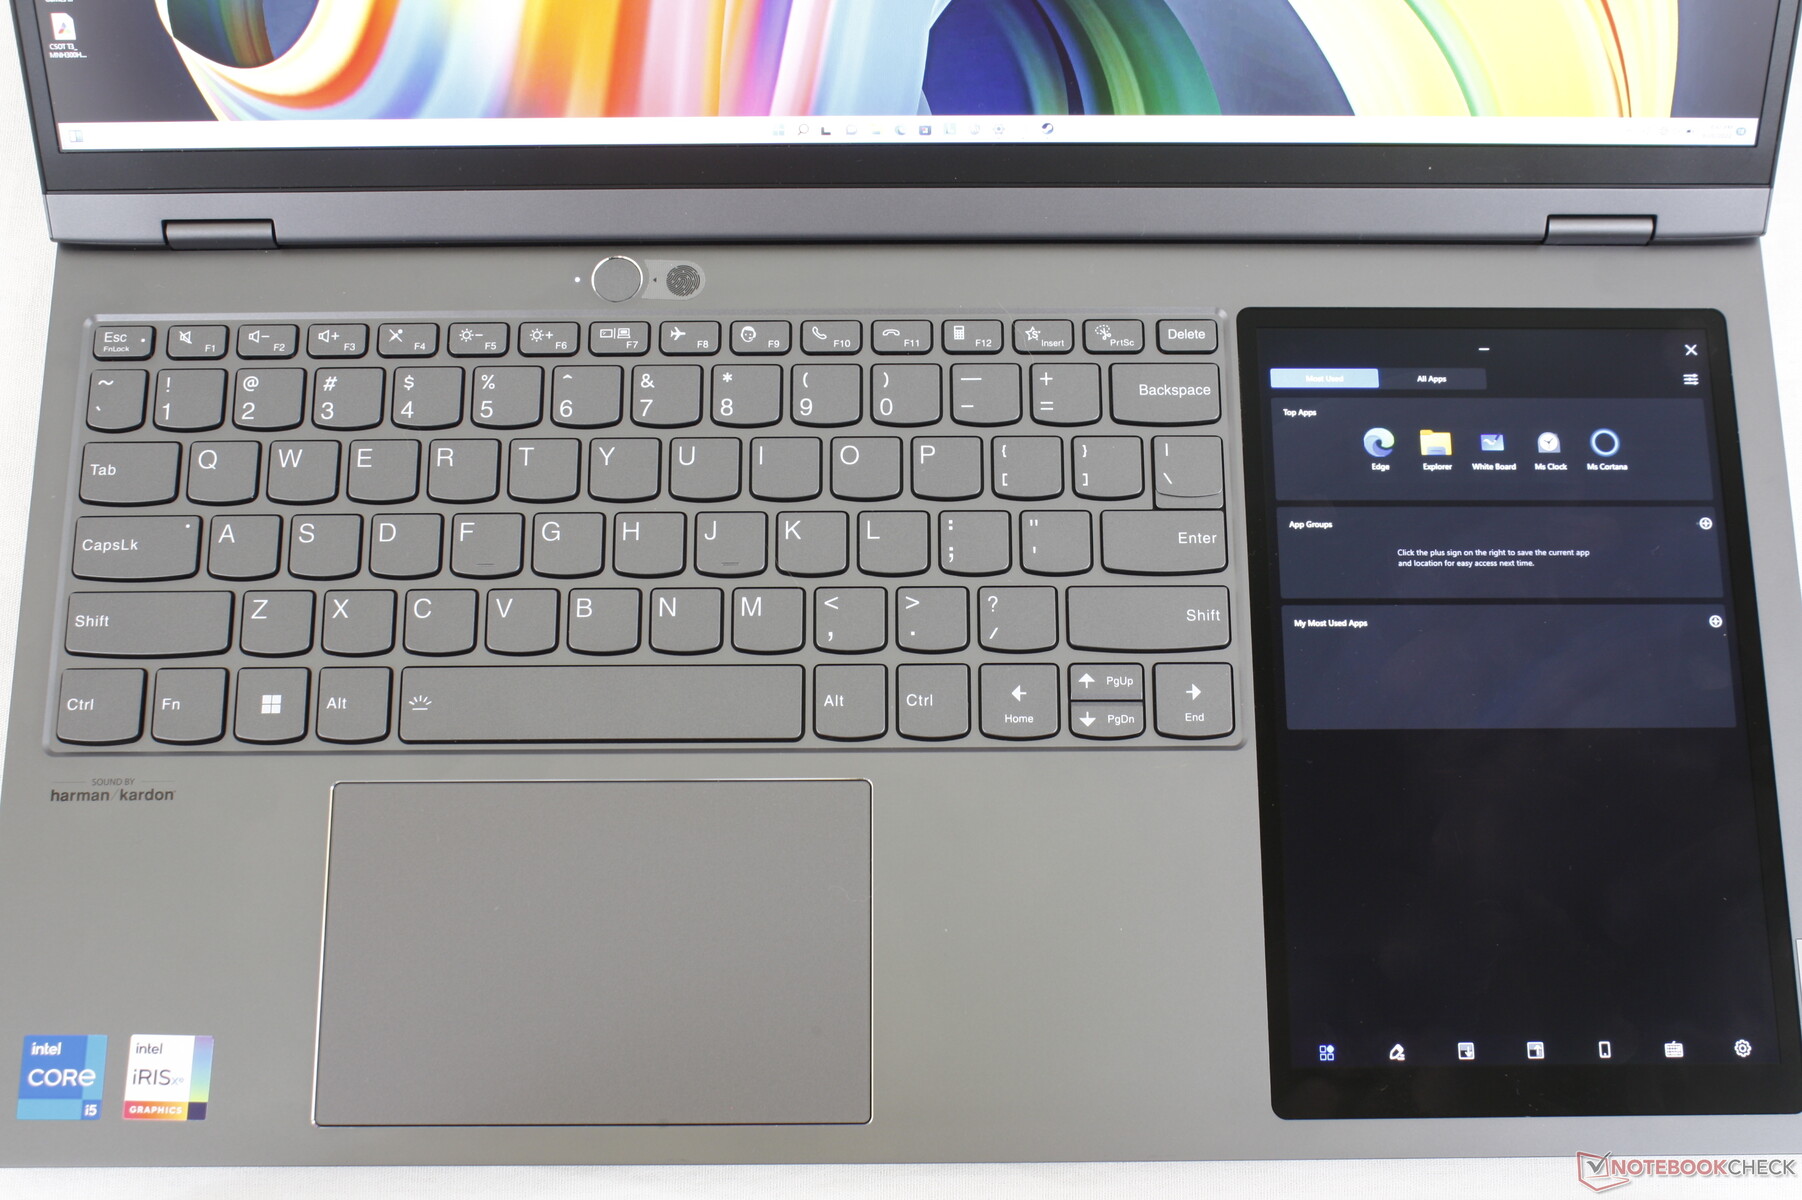
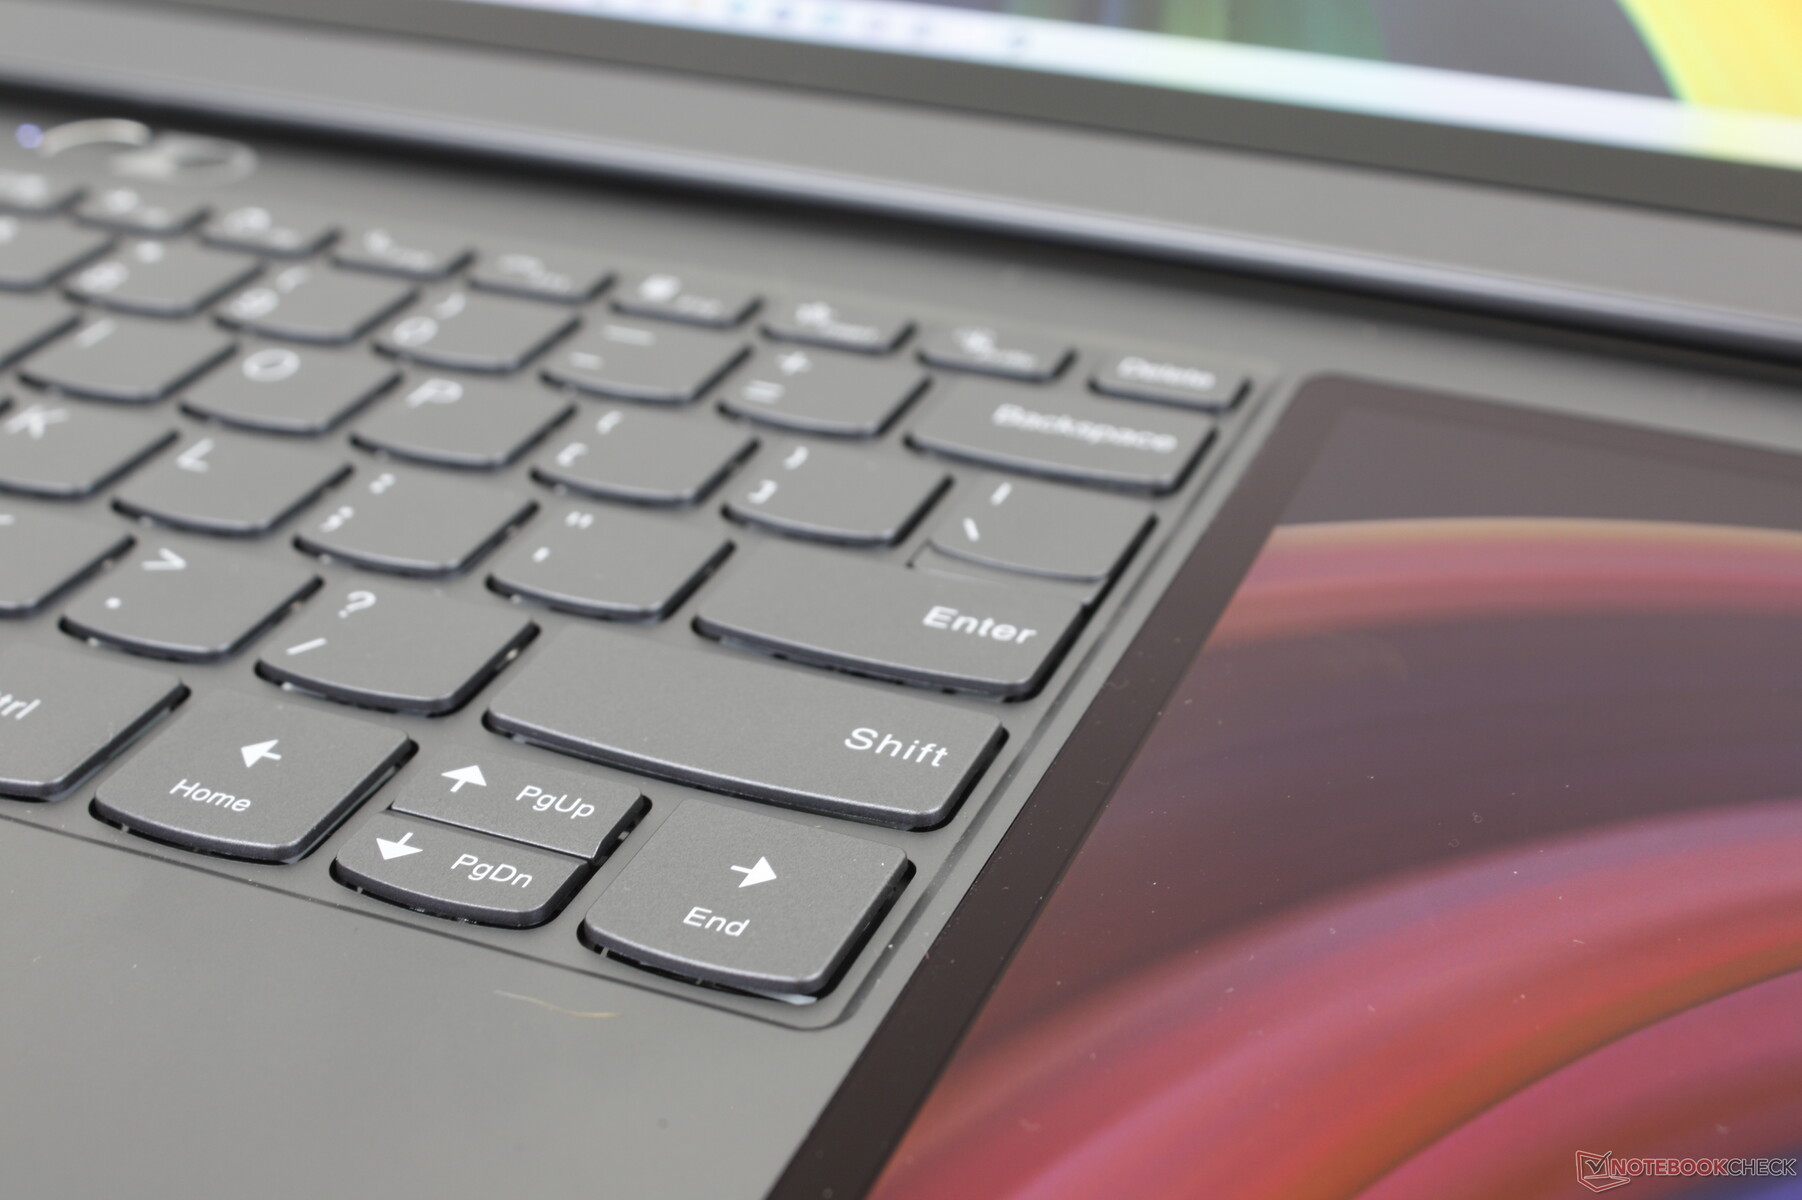
Inmatningsenheter - Rymligt tangentbordsdäck
Tangentbord
Skrivupplevelsen är identisk med andra bärbara ThinkBook-datorer, inklusive ThinkBook 14 G4 trots den sekundära pekskärmen. Det bredare fotavtrycket möjliggör en relativt rymlig klickplatta, pekskärm och tangentbord på en och samma bärbara dator, medan de kan kännas trånga på en mindre 14-tums eller 15-tums ZenBook.
Tangenternas återkoppling är ytlig och lätt, inte olikt tangentborden på många Yoga-, IdeaPad- eller Ultrabook-modeller i mellanklassen. ThinkPad-tangentborden är i allmänhet fastare och med djupare slaglängd i jämförelse.
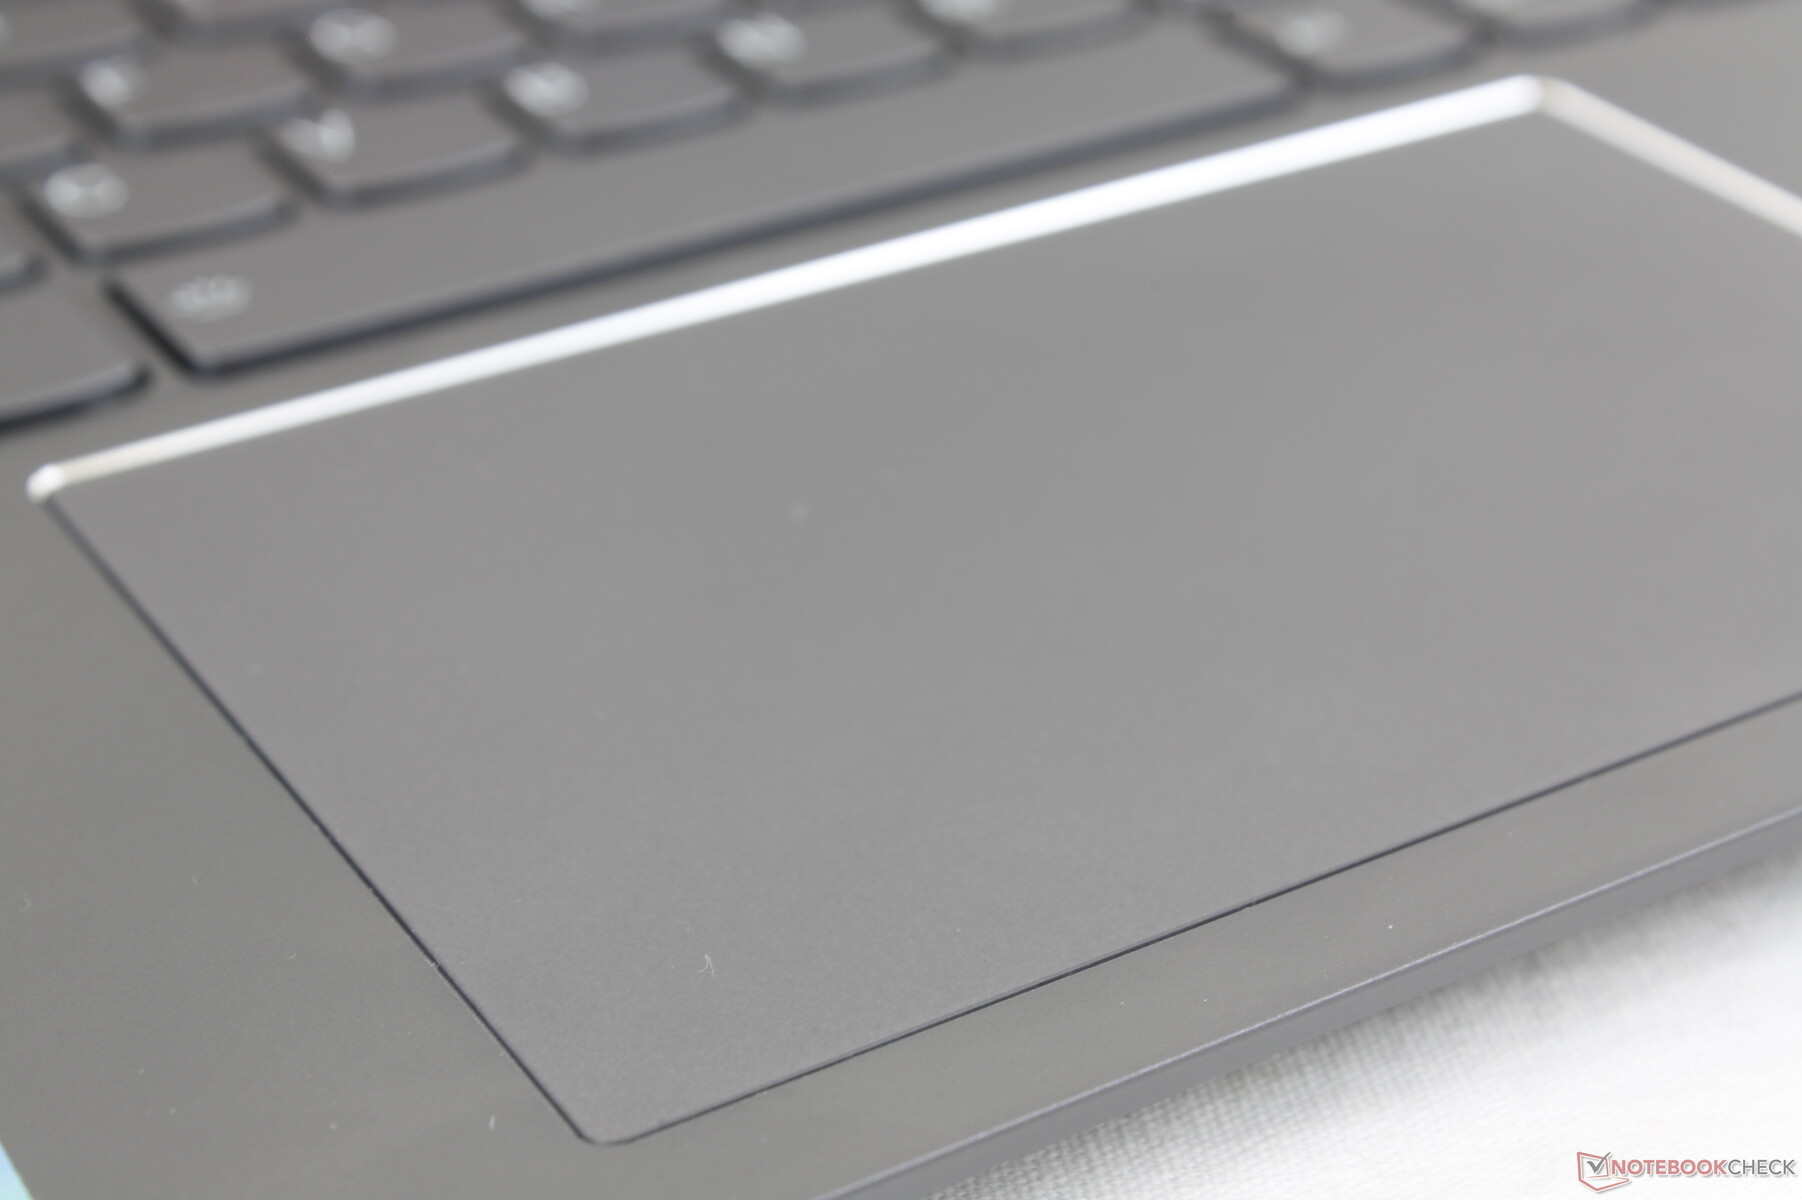
Pekplatta
Klickplattan har en hyfsad storlek till skillnad från den lilla klickplattan på ZenBook Duo UX481 (12 x 7,5 cm jämfört med 5,5 x 7 cm). Glidningen är smidig och responsiv, delvis på grund av den snabbare uppdateringsfrekvensen på 120 Hz native på huvudskärmen. Klickandet på klickplattan är fast och med ett högt auditivt klick för tillfredsställande återkoppling.

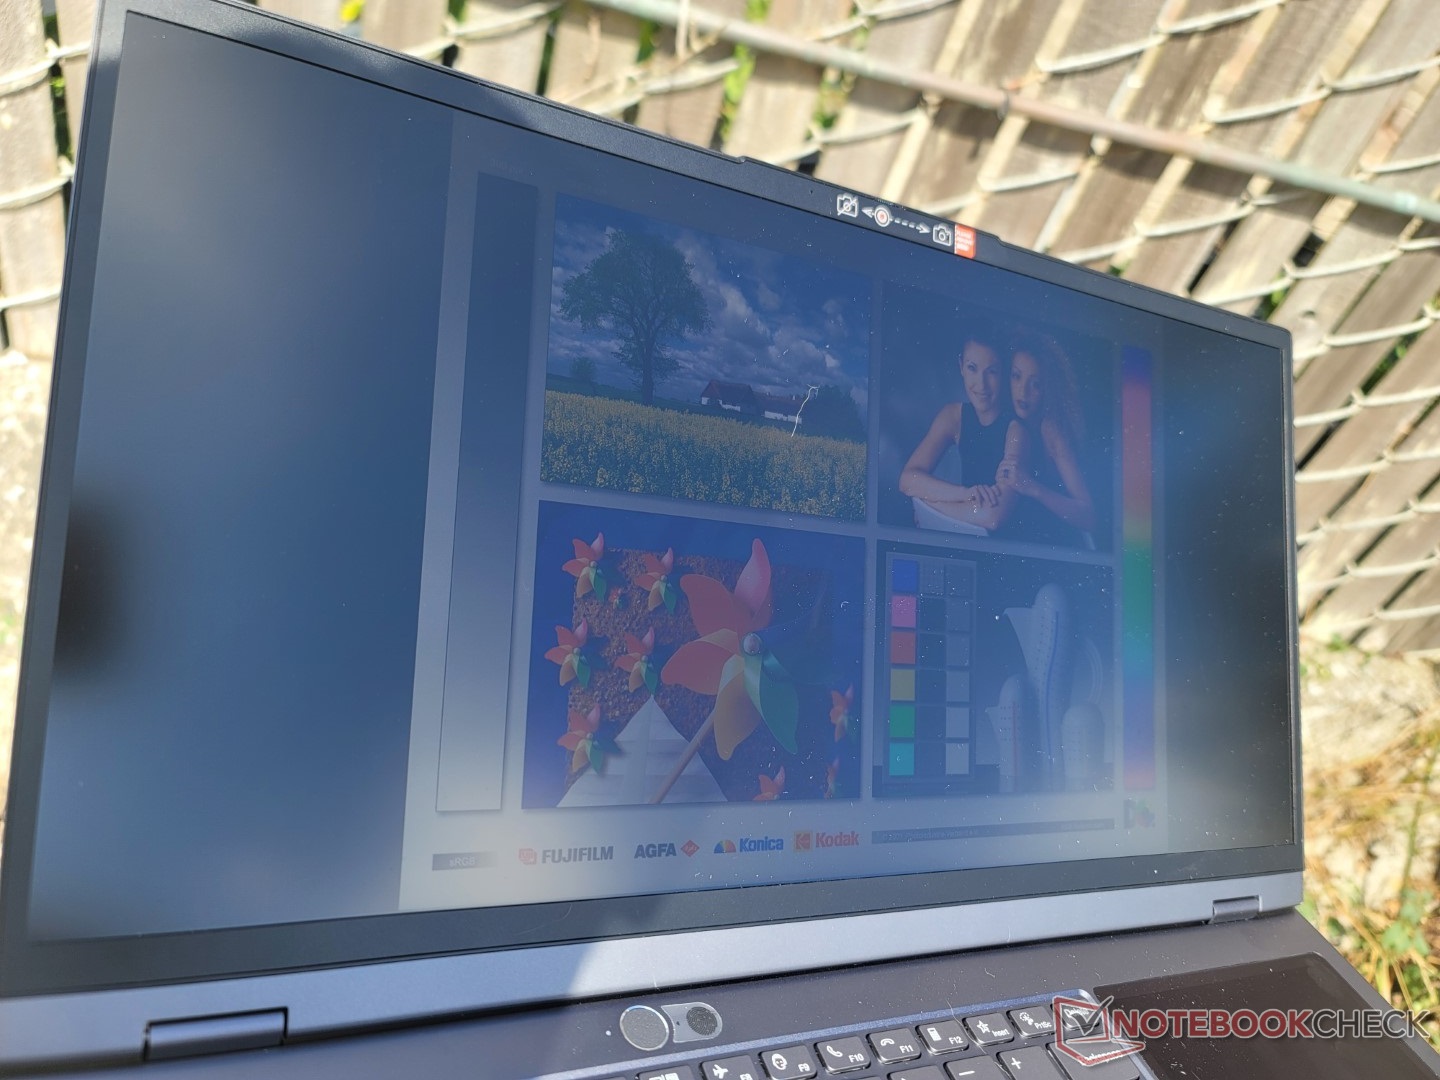
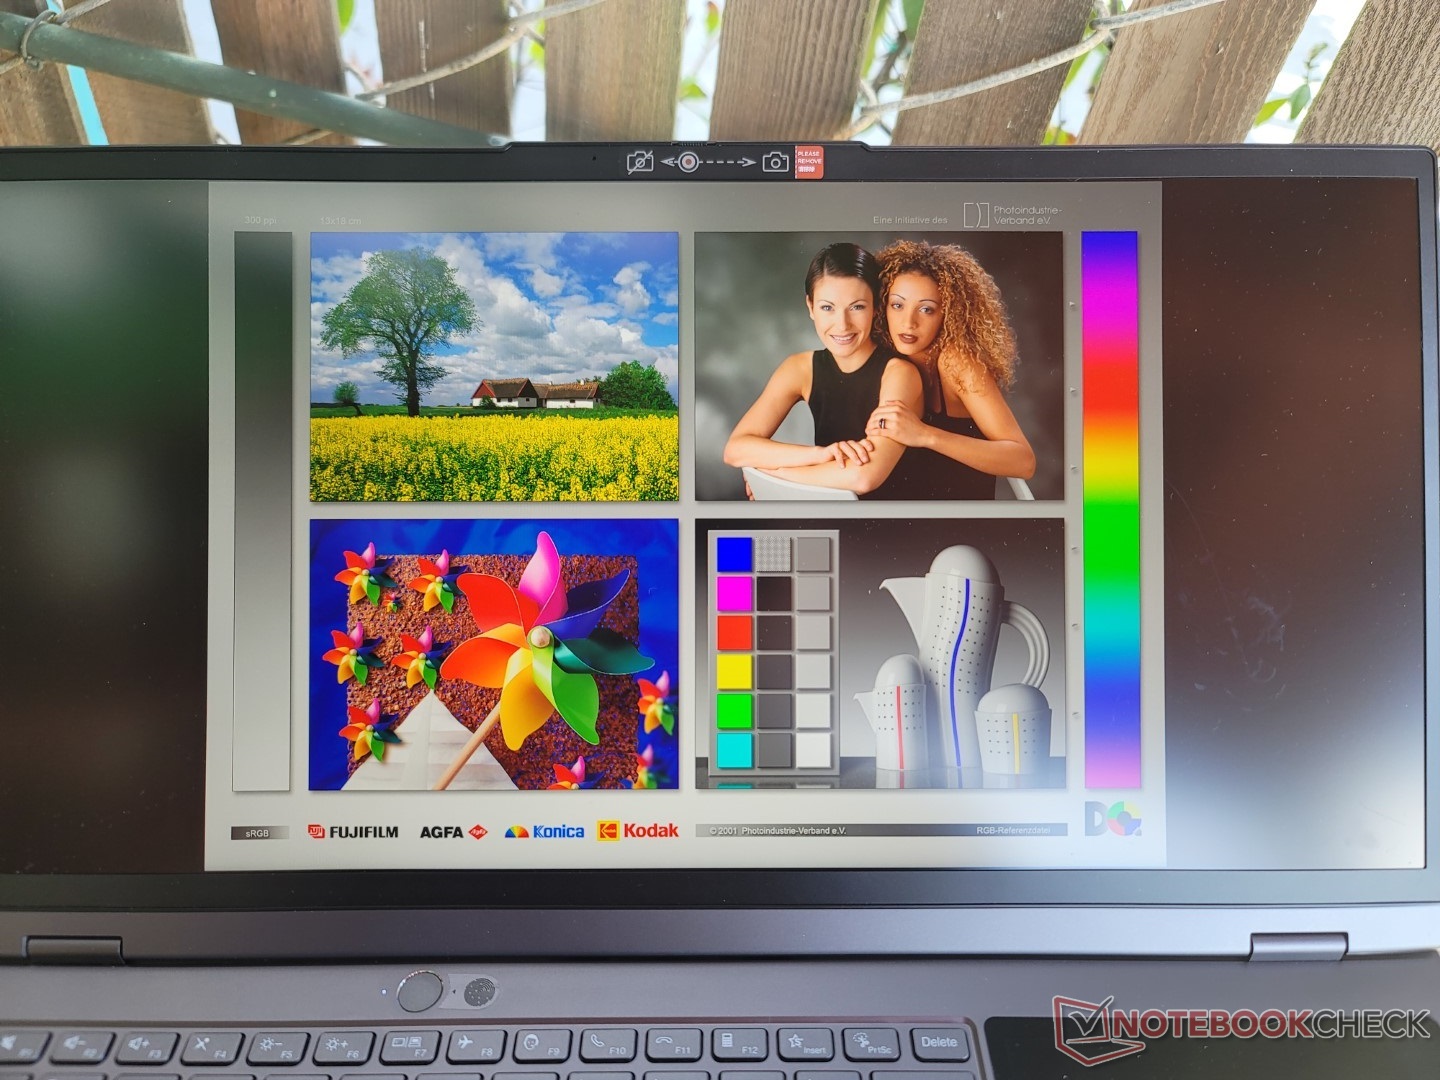
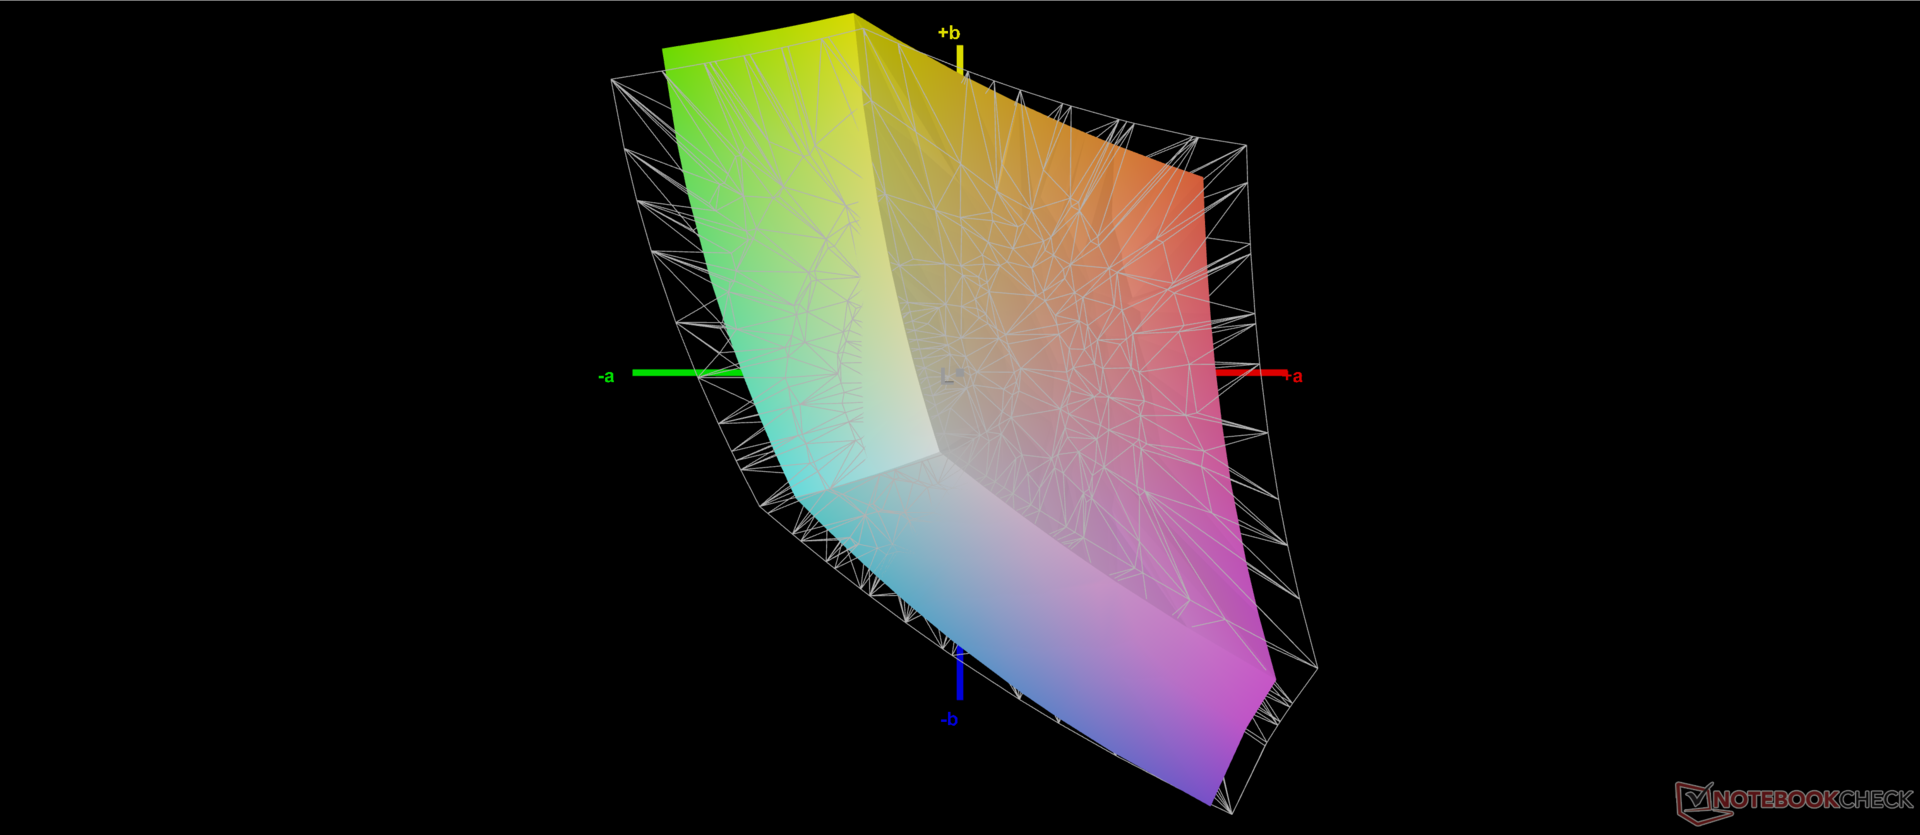
Primär skärm - P3, 120 Hz och IPS 21:10
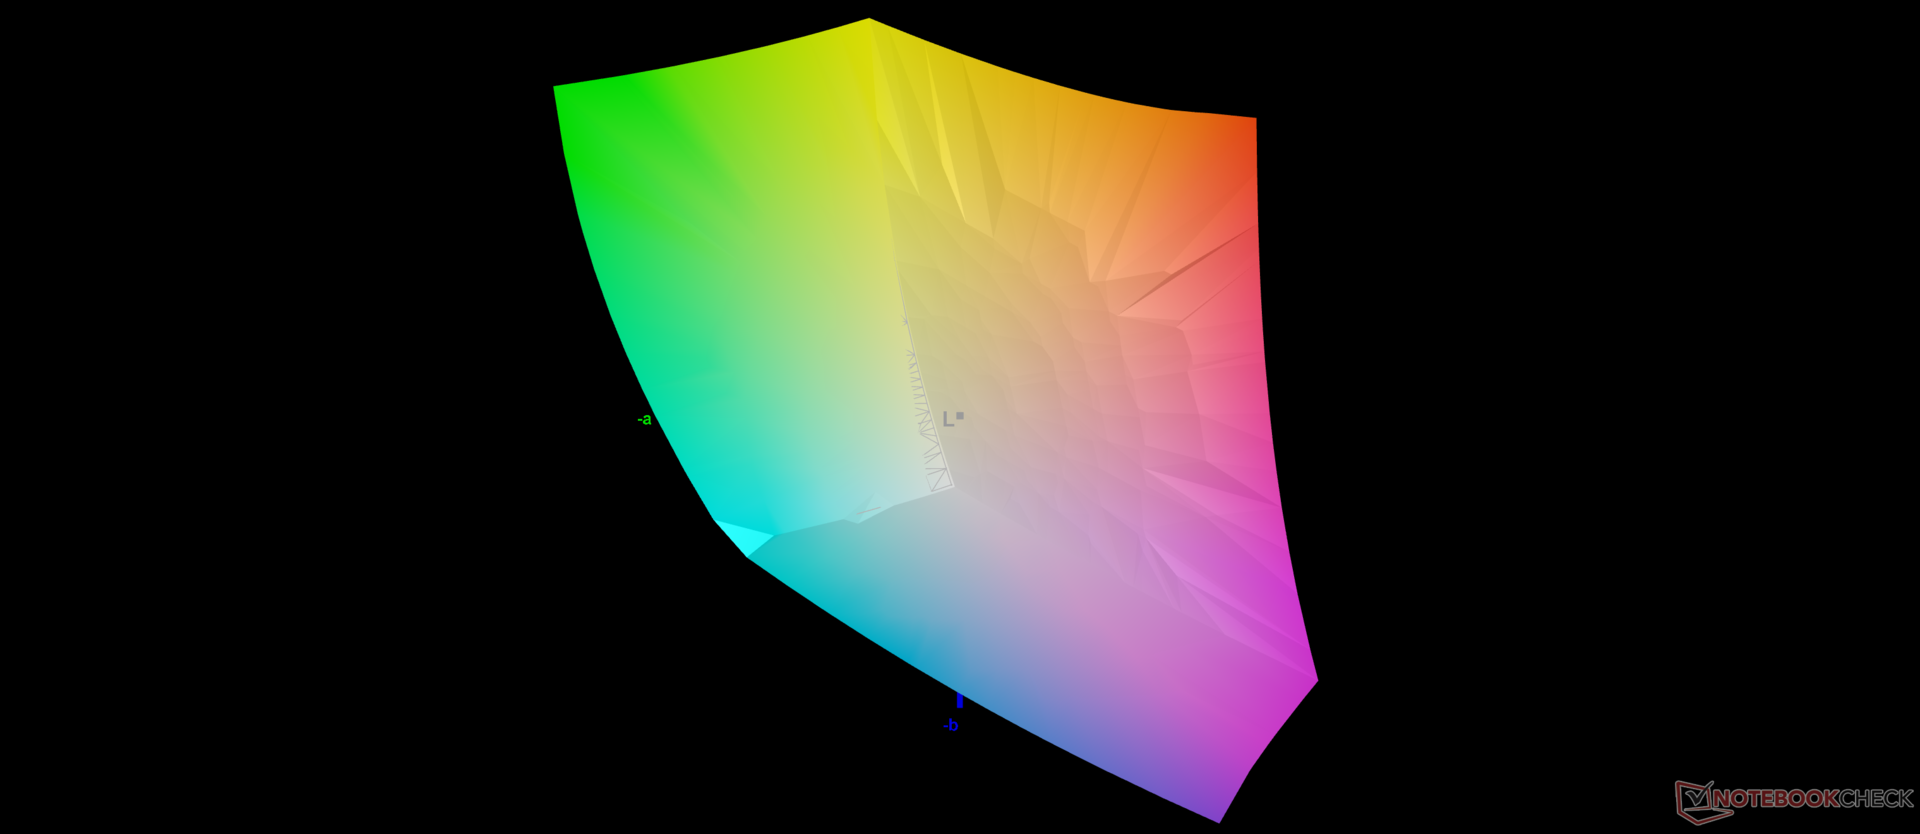
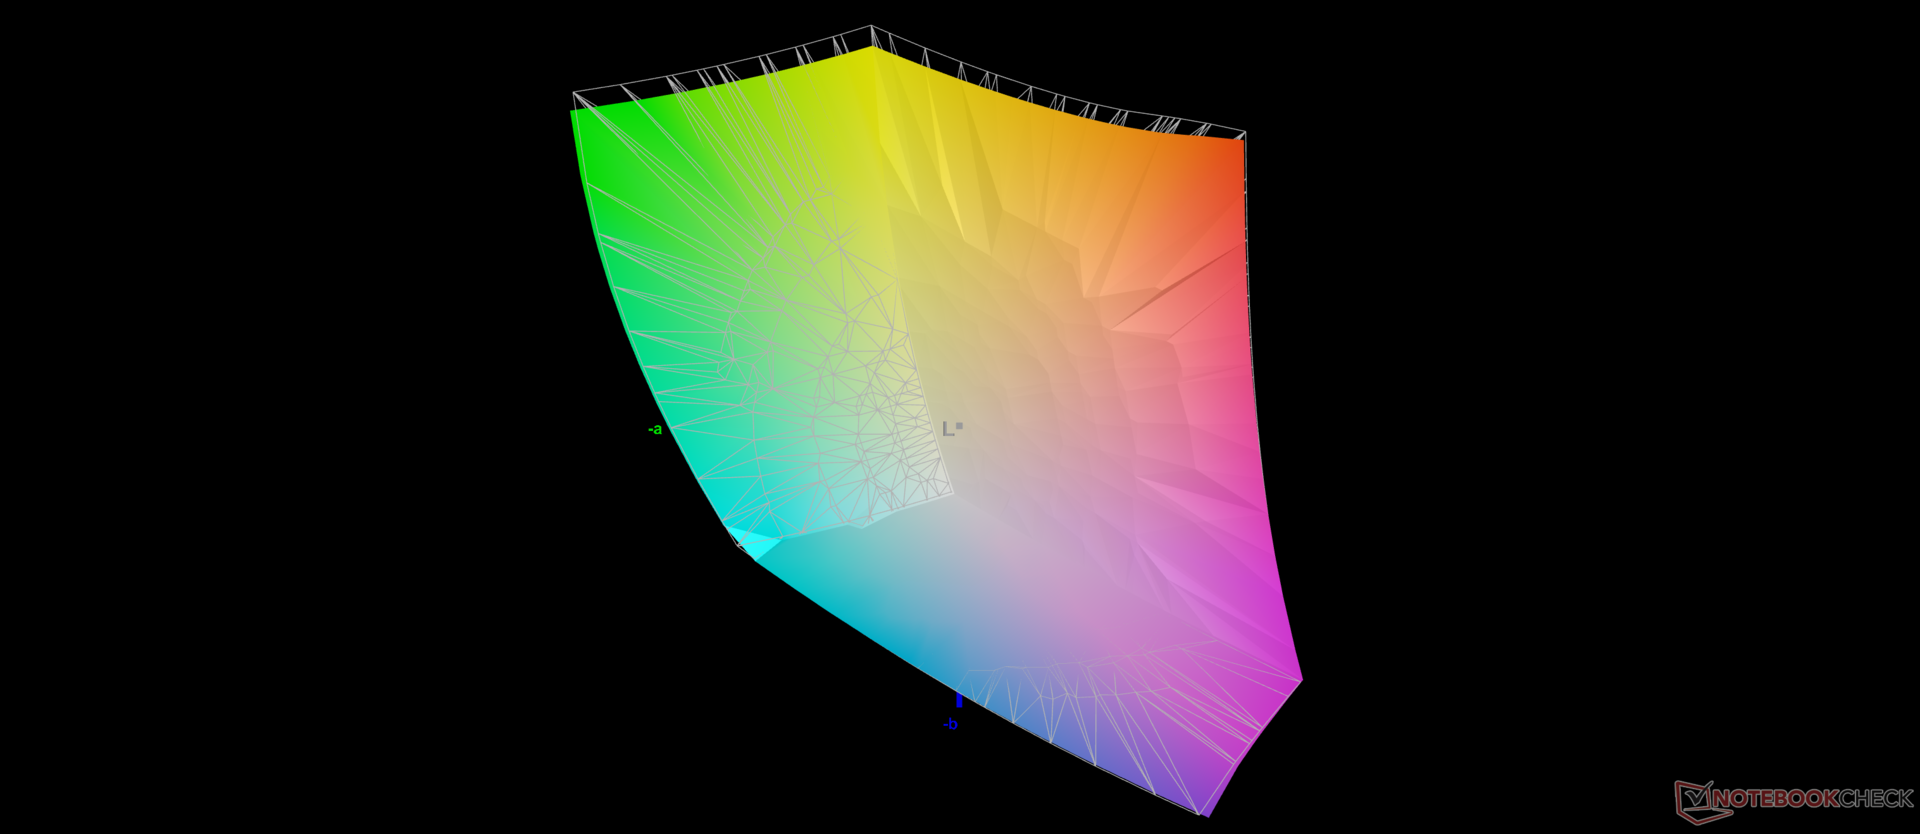
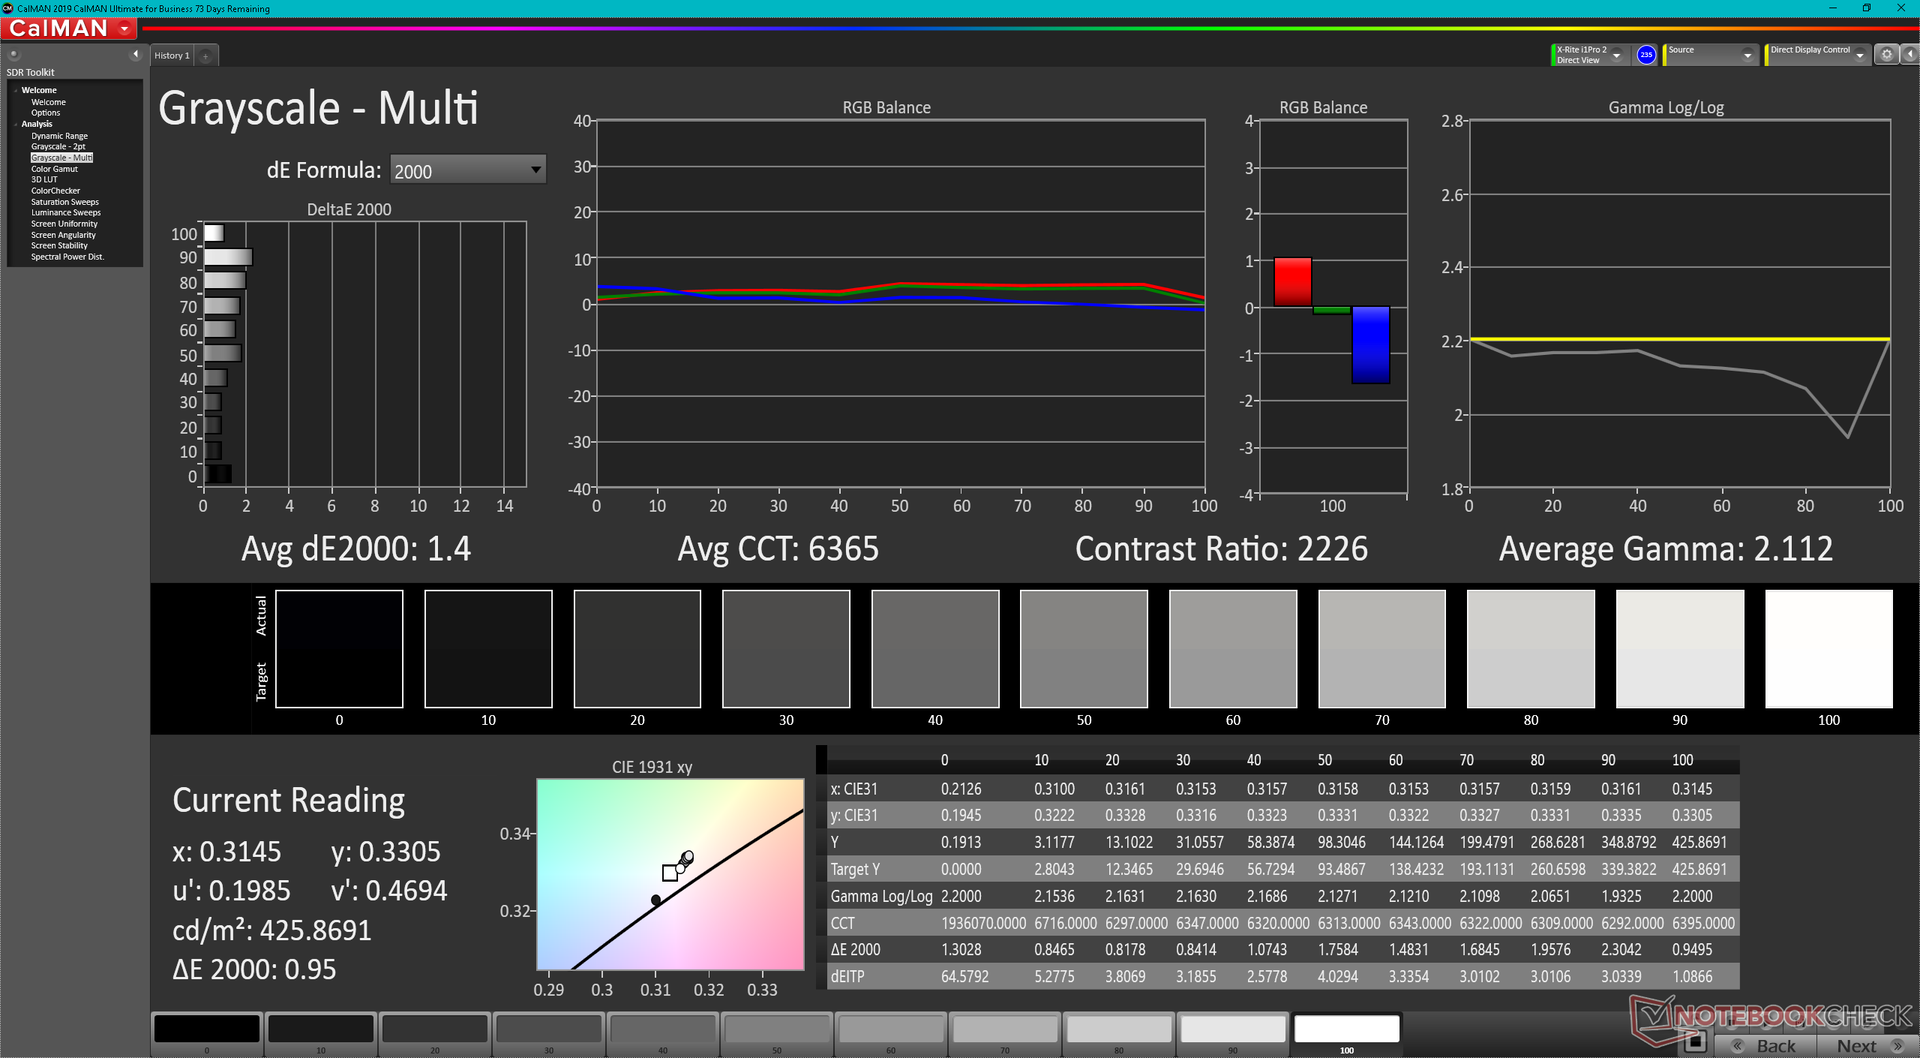
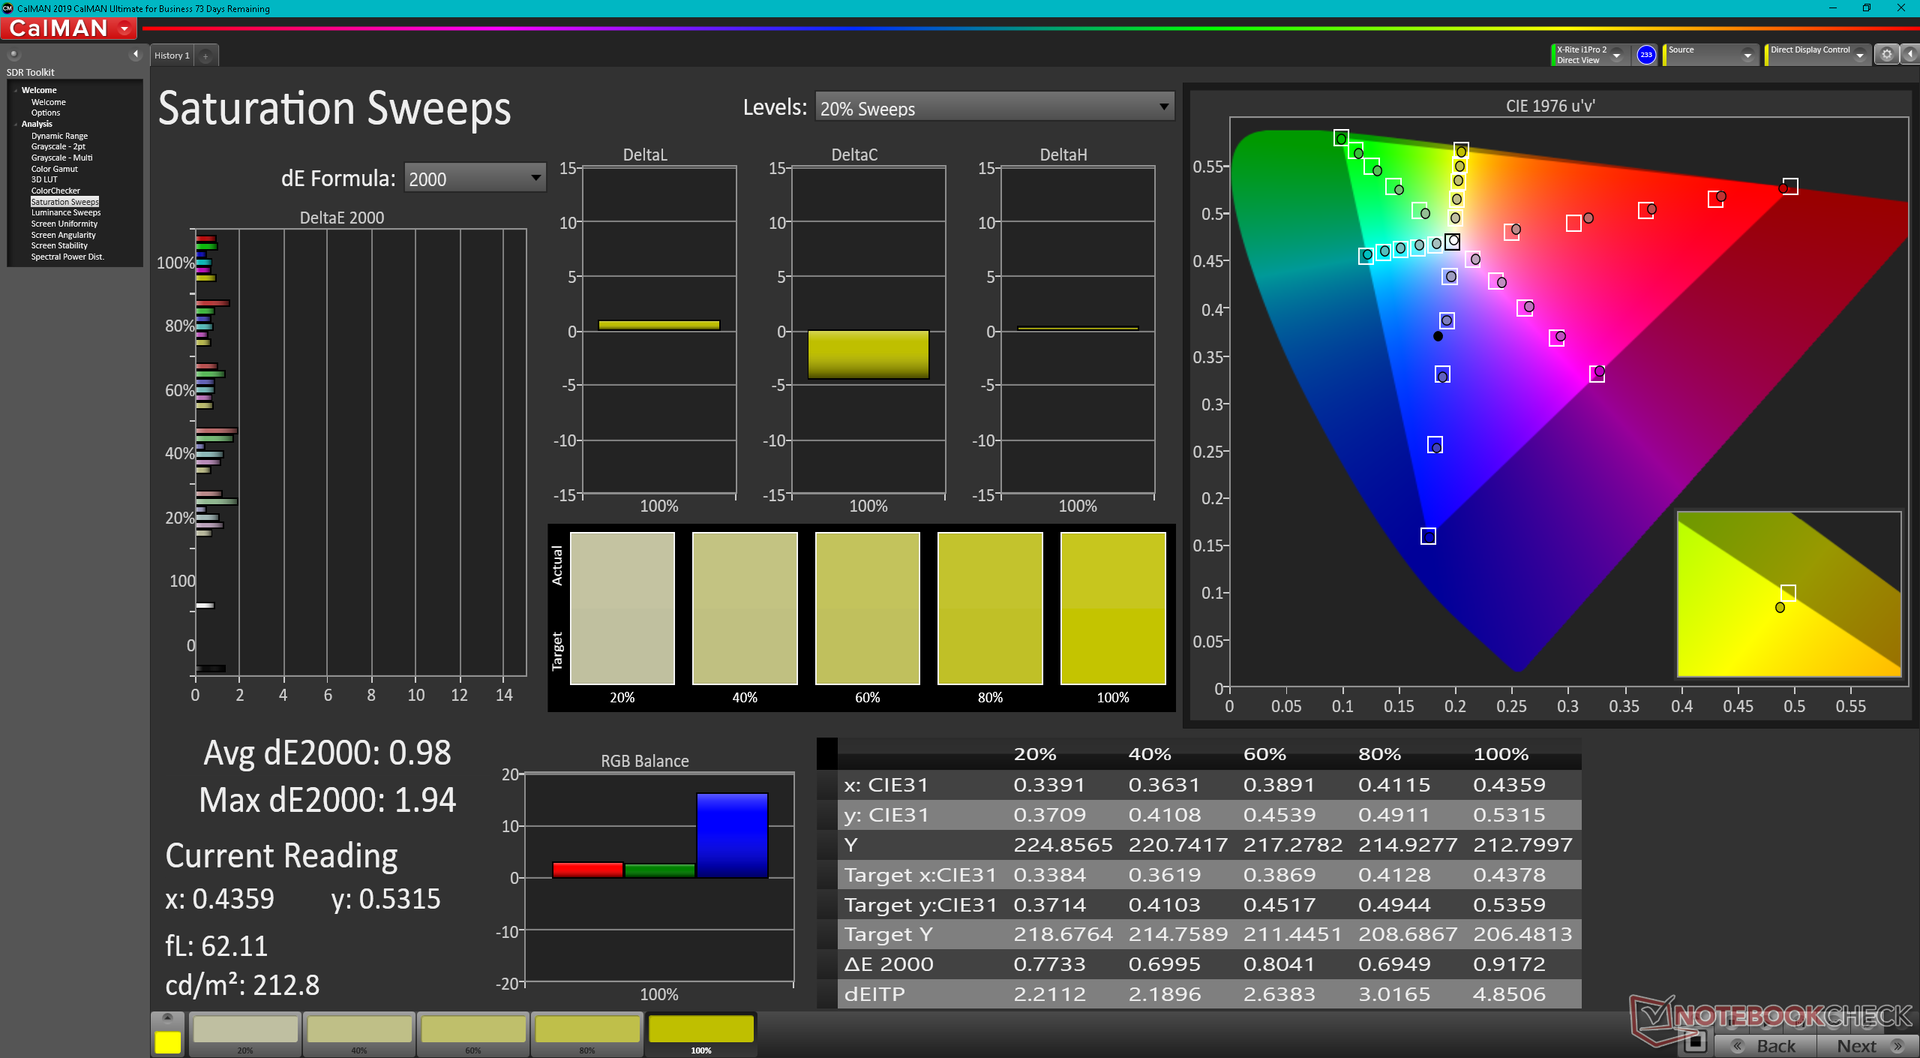
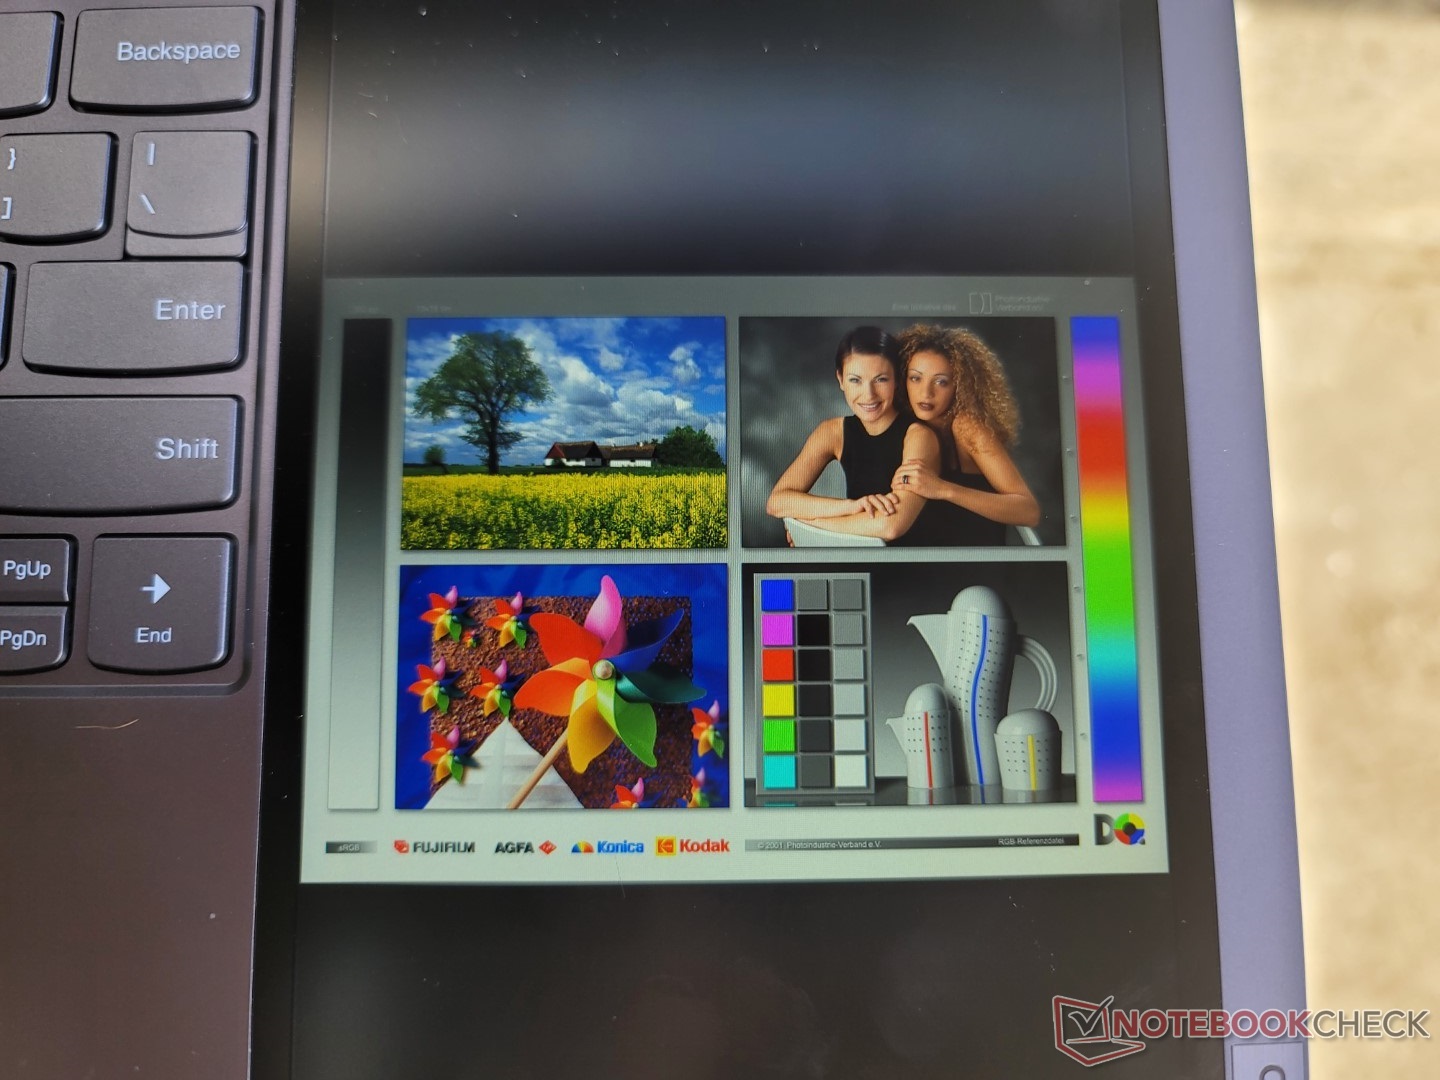
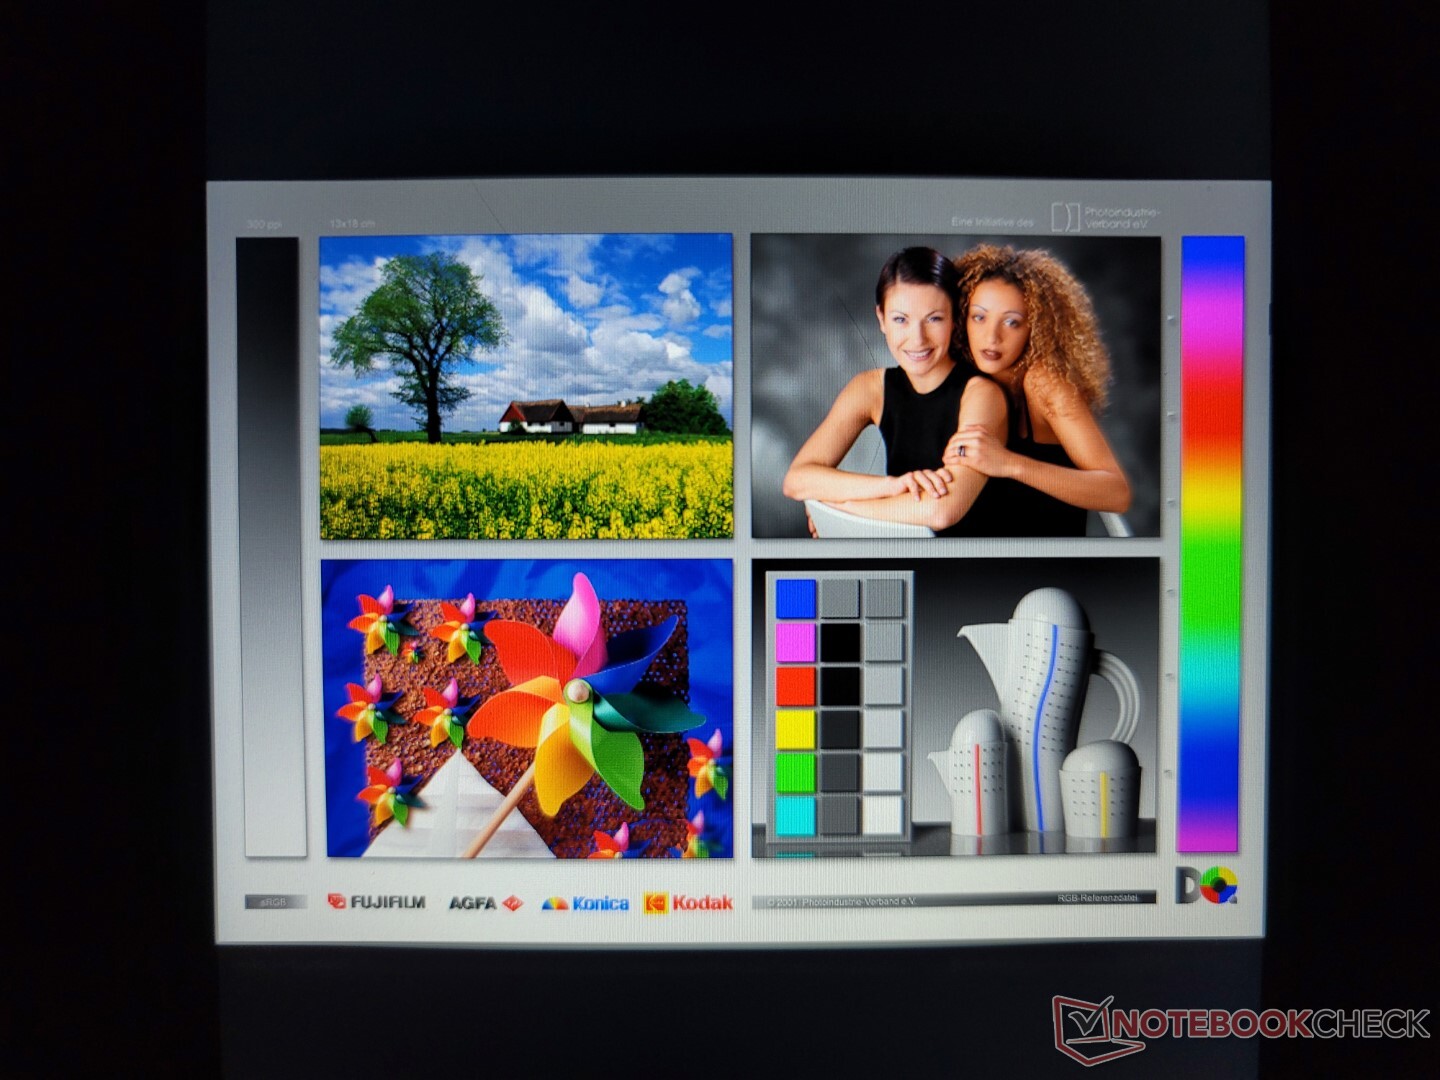
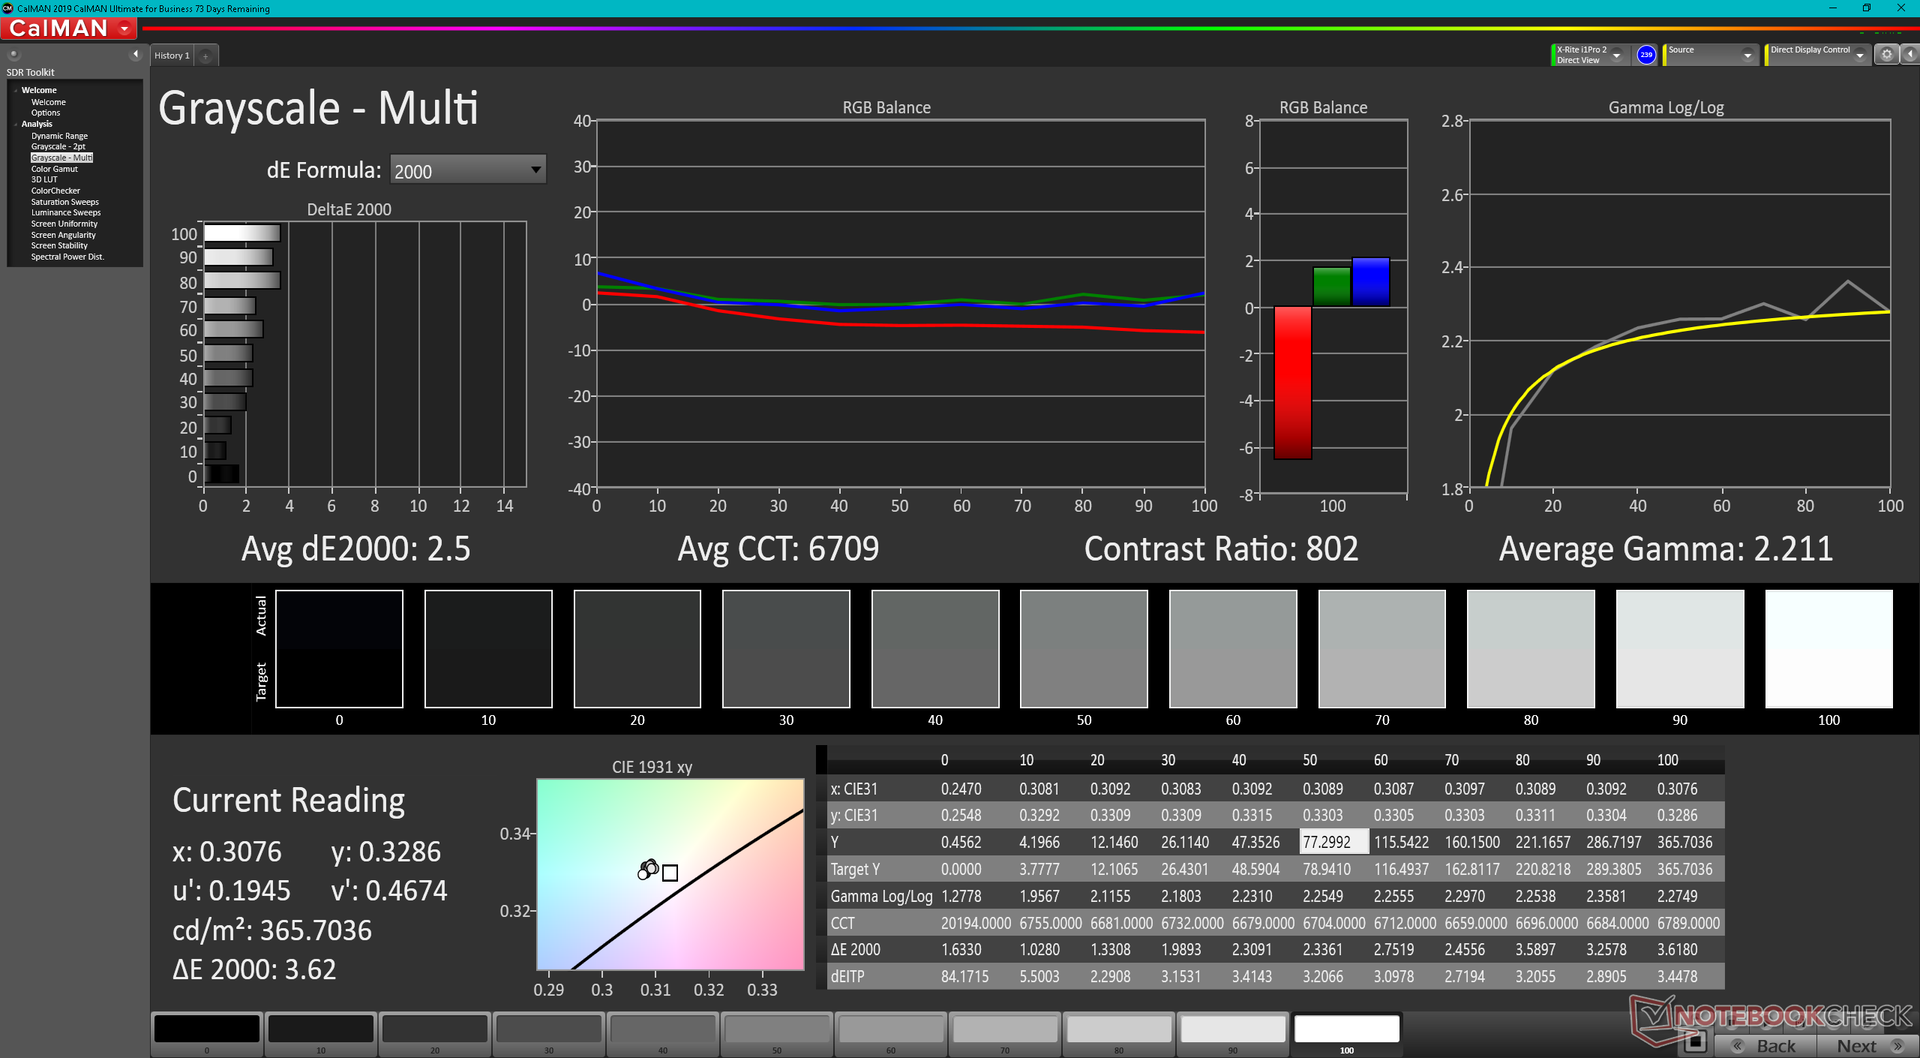
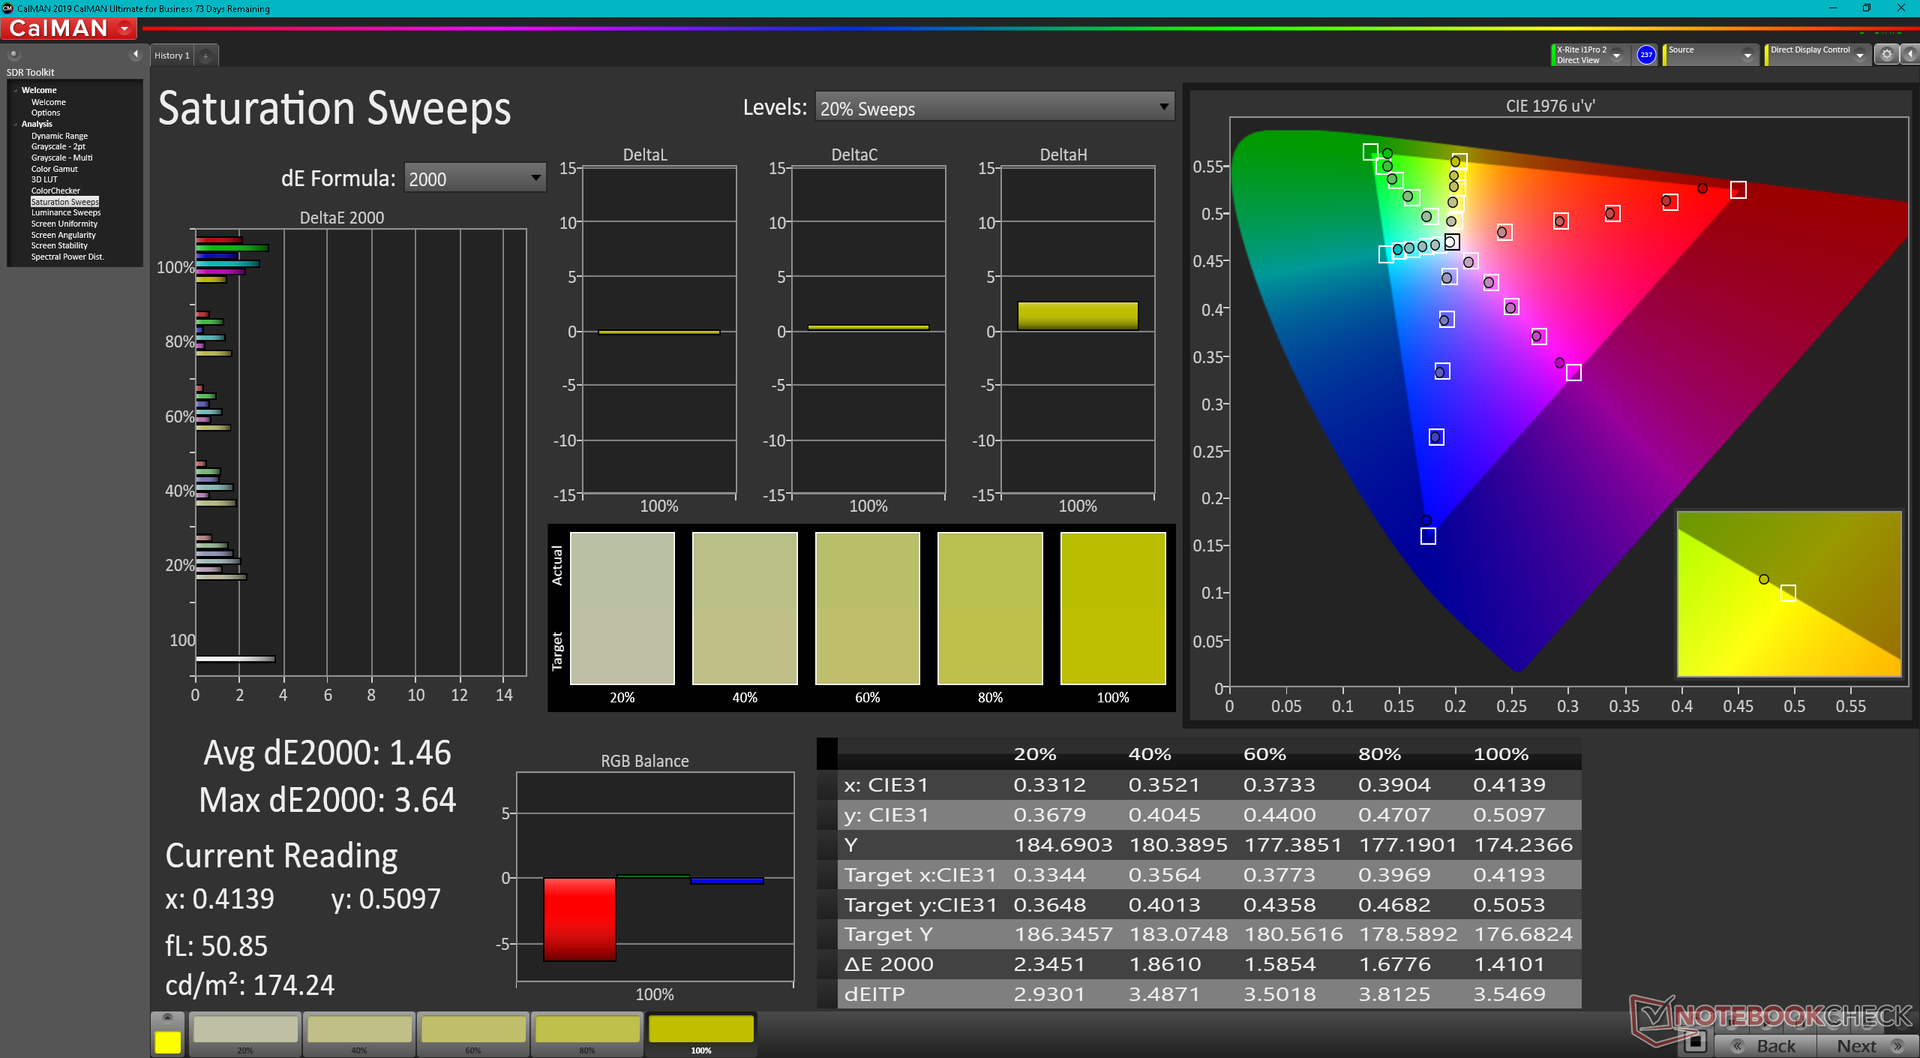
Den huvudsakliga IPS-displayen har visserligen ett atypiskt bildförhållande, men den har samma egenskaper som de flesta andra avancerade IPS-paneler. Kontrastförhållandet på ~1000:1, de ganska snabba svarstiderna för svartvitt, den snabba uppdateringsfrekvensen på 120 Hz och >95 procent P3-färgtäckning gör att skärmen är överraskande bra för både grafik, redigering och allt däremellan. Både färger och svarstider i synnerhet är djupare respektive snabbare än panelen på ThinkBook Plus Gen 2 medan den maximala ljusstyrkan är ungefär densamma.
| |||||||||||||||||||||||||
Distribution av ljusstyrkan: 84 %
Mitt på batteriet: 405 cd/m²
Kontrast: 1191:1 (Svärta: 0.34 cd/m²)
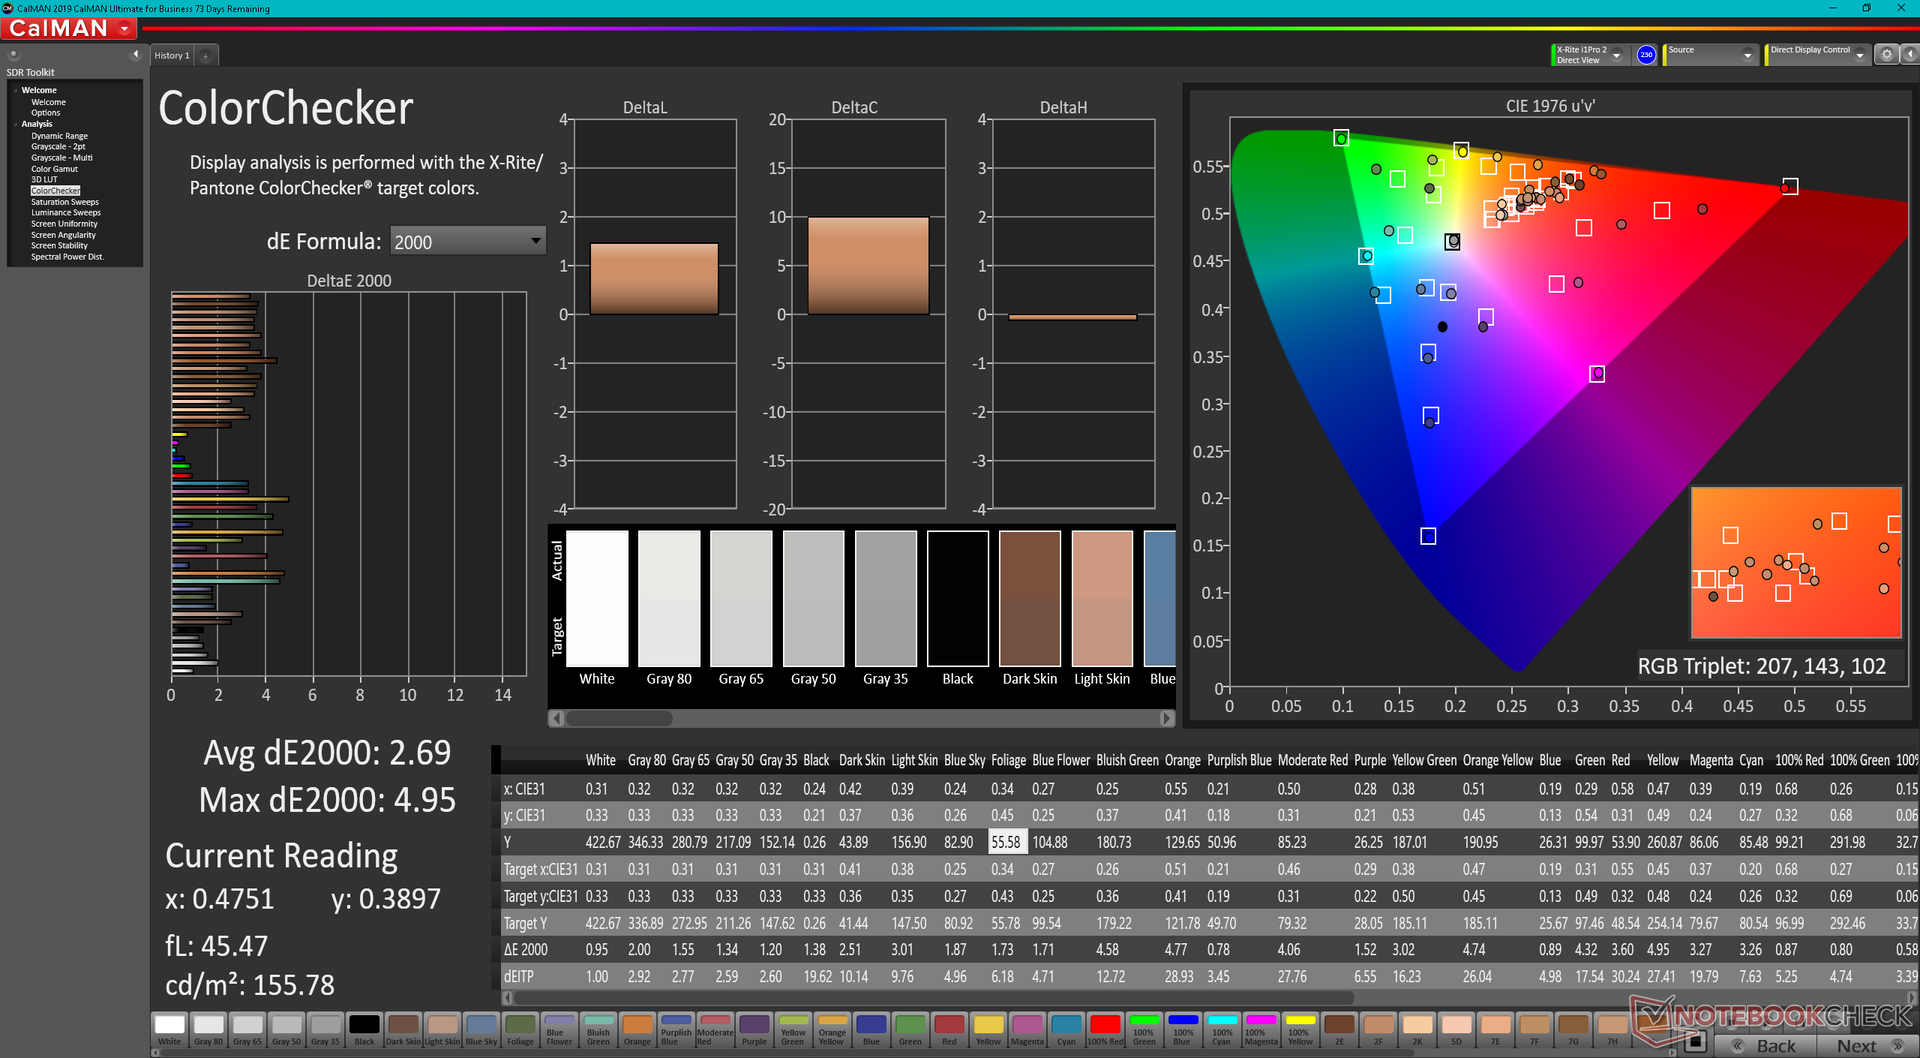
ΔE ColorChecker Calman: 2.69 | ∀{0.5-29.43 Ø4.71}
ΔE Greyscale Calman: 1.4 | ∀{0.09-98 Ø4.96}
87.8% AdobeRGB 1998 (Argyll 3D)
100% sRGB (Argyll 3D)
96.8% Display P3 (Argyll 3D)
Gamma: 2.1
CCT: 6365 K
| Lenovo ThinkBook Plus Gen3 MNH300HB1-1 CSOT T3, IPS, 3072x1440, 17.3" | Lenovo ThinkBook Plus Gen2 Core i5 CSOT T3 MND307DA1-5 (LCD), IPS, E-Ink, 2560x1600, 13.3" | Asus ProArt StudioBook Pro 17 W700G3T 170PUW1-A00, IPS, 1920x1200, 17" | LG Gram 17 (2022) LG Philips LP170WQ1-SPF2, IPS, 2560x1600, 17" | Dell XPS 17 9720 Sharp LQ170R1, IPS, 3840x2400, 17" | Gigabyte Aero 17 HDR YD AU Optronics AUO329B, IPS, 3840x2160, 17.3" | |
|---|---|---|---|---|---|---|
| Display | -16% | -2% | -0% | 4% | 1% | |
| Display P3 Coverage (%) | 96.8 | 70.1 -28% | 96.2 -1% | 98.1 1% | 94.8 -2% | 86.9 -10% |
| sRGB Coverage (%) | 100 | 98 -2% | 99.8 0% | 99.9 0% | 100 0% | 100 0% |
| AdobeRGB 1998 Coverage (%) | 87.8 | 72.2 -18% | 84.7 -4% | 85.9 -2% | 100 14% | 99.6 13% |
| Response Times | -44% | -45% | -28% | -64% | -56% | |
| Response Time Grey 50% / Grey 80% * (ms) | 28 ? | 42.8 ? -53% | 41.2 ? -47% | 46 ? -64% | 53.2 ? -90% | 52 ? -86% |
| Response Time Black / White * (ms) | 20.8 ? | 28 ? -35% | 29.6 ? -42% | 19 ? 9% | 28.4 ? -37% | 26 ? -25% |
| PWM Frequency (Hz) | 17990 ? | |||||
| Screen | -17% | 9% | -28% | -18% | 20% | |
| Brightness middle (cd/m²) | 405 | 404 0% | 323 -20% | 400 -1% | 438 8% | 488 20% |
| Brightness (cd/m²) | 389 | 388 0% | 308 -21% | 353 -9% | 411 6% | 467 20% |
| Brightness Distribution (%) | 84 | 94 12% | 88 5% | 81 -4% | 86 2% | 86 2% |
| Black Level * (cd/m²) | 0.34 | 0.24 29% | 0.36 -6% | 0.3 12% | 0.27 21% | 0.33 3% |
| Contrast (:1) | 1191 | 1683 41% | 897 -25% | 1333 12% | 1622 36% | 1479 24% |
| Colorchecker dE 2000 * | 2.69 | 3.1 -15% | 1.1 59% | 3.15 -17% | 2.5 7% | 1.23 54% |
| Colorchecker dE 2000 max. * | 4.95 | 6.9 -39% | 3.3 33% | 6.54 -32% | 6.3 -27% | 2.94 41% |
| Greyscale dE 2000 * | 1.4 | 3.7 -164% | 0.8 43% | 4 -186% | 4.2 -200% | 1.5 -7% |
| Gamma | 2.1 105% | 2.26 97% | 2.23 99% | 2.14 103% | 2.22 99% | 2.169 101% |
| CCT | 6365 102% | 5936 110% | 6479 100% | 7278 89% | 7034 92% | 6614 98% |
| Colorchecker dE 2000 calibrated * | 1.3 | 0.8 | 1.44 | 0.8 | 0.77 | |
| Color Space (Percent of AdobeRGB 1998) (%) | 75.7 | 99 | ||||
| Color Space (Percent of sRGB) (%) | 99.8 | 99 | ||||
| Totalt genomsnitt (program/inställningar) | -26% /
-21% | -13% /
-2% | -19% /
-22% | -26% /
-20% | -12% /
4% |
* ... mindre är bättre
Skärmen är välkalibrerad mot P3-standarden med genomsnittliga DeltaE-värden för gråskala och färg på bara 1,4 respektive 2,69. En kalibrering av slutanvändaren är inte nödvändig.
Visa svarstider
| ↔ Svarstid svart till vitt | ||
|---|---|---|
| 20.8 ms ... stiga ↗ och falla ↘ kombinerat | ↗ 10.8 ms stiga | 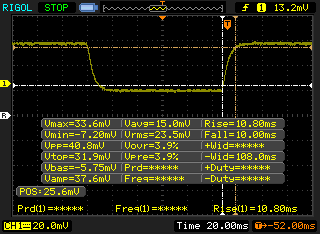 |
| ↘ 10 ms hösten | ||
| Skärmen visar bra svarsfrekvens i våra tester, men kan vara för långsam för konkurrenskraftiga spelare. I jämförelse sträcker sig alla testade enheter från 0.1 (minst) till 240 (maximalt) ms. » 46 % av alla enheter är bättre. Det betyder att den uppmätta svarstiden liknar genomsnittet av alla testade enheter (19.8 ms). | ||
| ↔ Svarstid 50 % grått till 80 % grått | ||
| 28 ms ... stiga ↗ och falla ↘ kombinerat | ↗ 13.2 ms stiga | 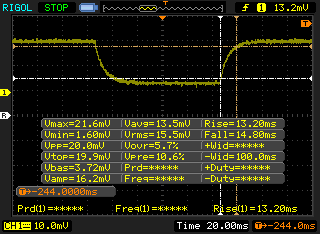 |
| ↘ 14.8 ms hösten | ||
| Skärmen visar relativt långsamma svarsfrekvenser i våra tester och kan vara för långsam för spelare. I jämförelse sträcker sig alla testade enheter från 0.165 (minst) till 636 (maximalt) ms. » 38 % av alla enheter är bättre. Det betyder att den uppmätta svarstiden liknar genomsnittet av alla testade enheter (30.9 ms). | ||
Skärmflimmer / PWM (Puls-Width Modulation)
| Skärmflimmer / PWM upptäcktes inte | 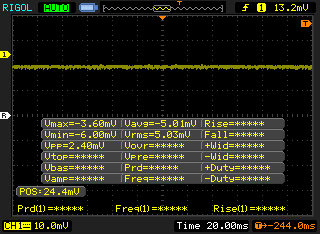 | ||
Som jämförelse: 52 % av alla testade enheter använder inte PWM för att dämpa skärmen. Om PWM upptäcktes mättes ett medelvärde av 7741 (minst: 5 - maximum: 343500) Hz. | |||
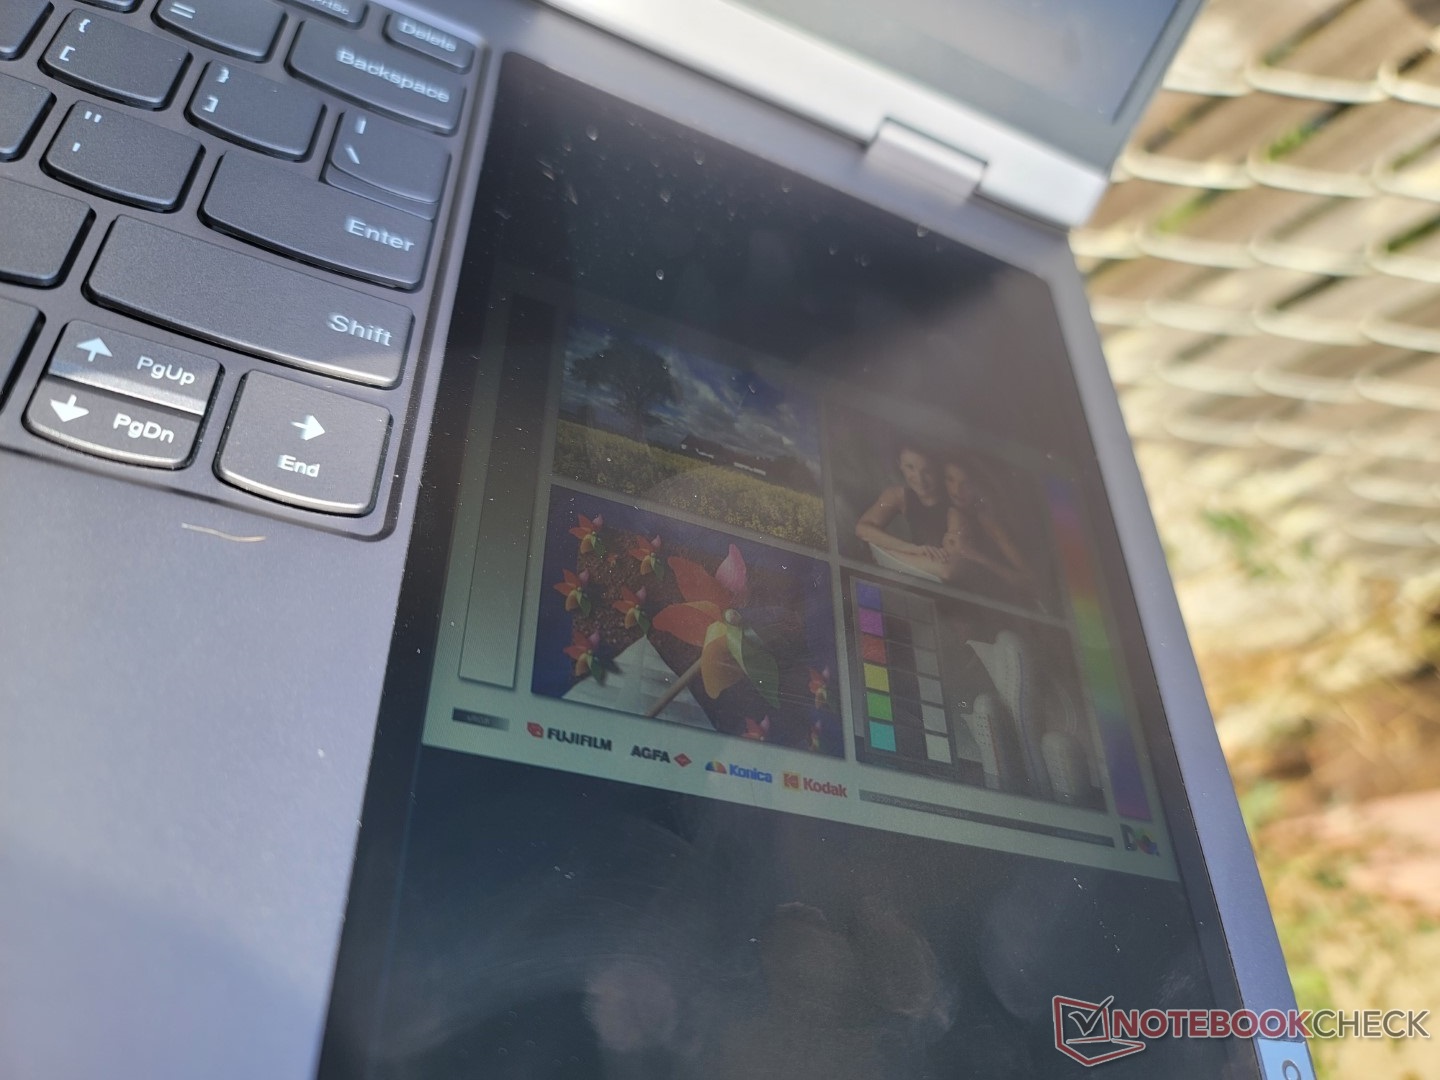
Synligheten utomhus är likadan som för LG Gram 17 eller XPS 17 eftersom de alla har liknande maximala ljusstyrkor. På Lenovo är dock bländningen mer märkbar längs sidorna av skärmen på grund av dess större än normala bildförhållande. Du kommer ändå att vilja arbeta i skugga när det är möjligt för att maximera synligheten.
Sekundär skärm - så mycket extra skärmutrymme
När det gäller användbarhet fungerar den sekundära skärmen smidigt och perfekt för att fästa olika fönster fram och tillbaka på huvudskärmen. Särskilt dess bildförhållande på 10:16 fungerar bättre för ett bredare utbud av applikationer och program jämfört med de smalare sekundära skärmarna på den konkurrerande Asus ZenBook Duo-serien.
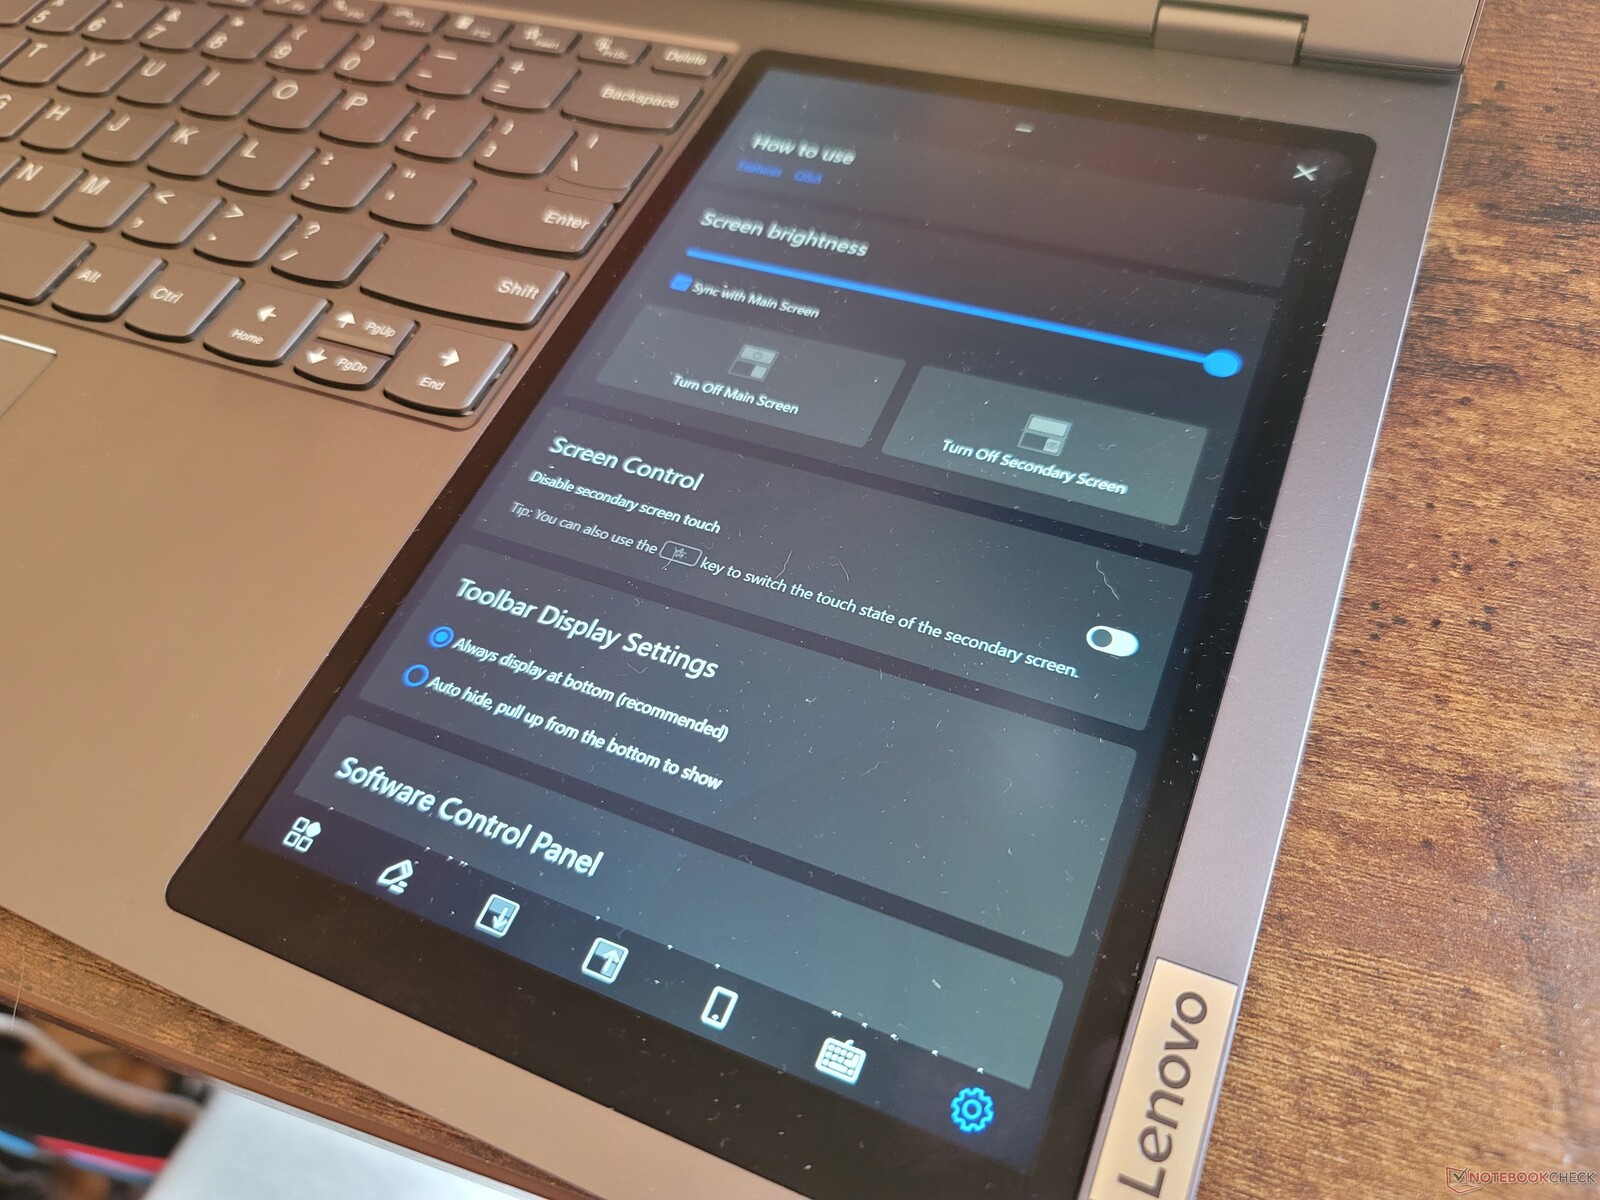
Skärmen har också unika hjälpfunktioner som inte finns på Asus modeller. Det finns till exempel alternativ för att synkronisera ljusstyrkan med huvudskärmen eller för att spegla endast en viss del av huvudskärmen med 800 x 1280 pixlar.
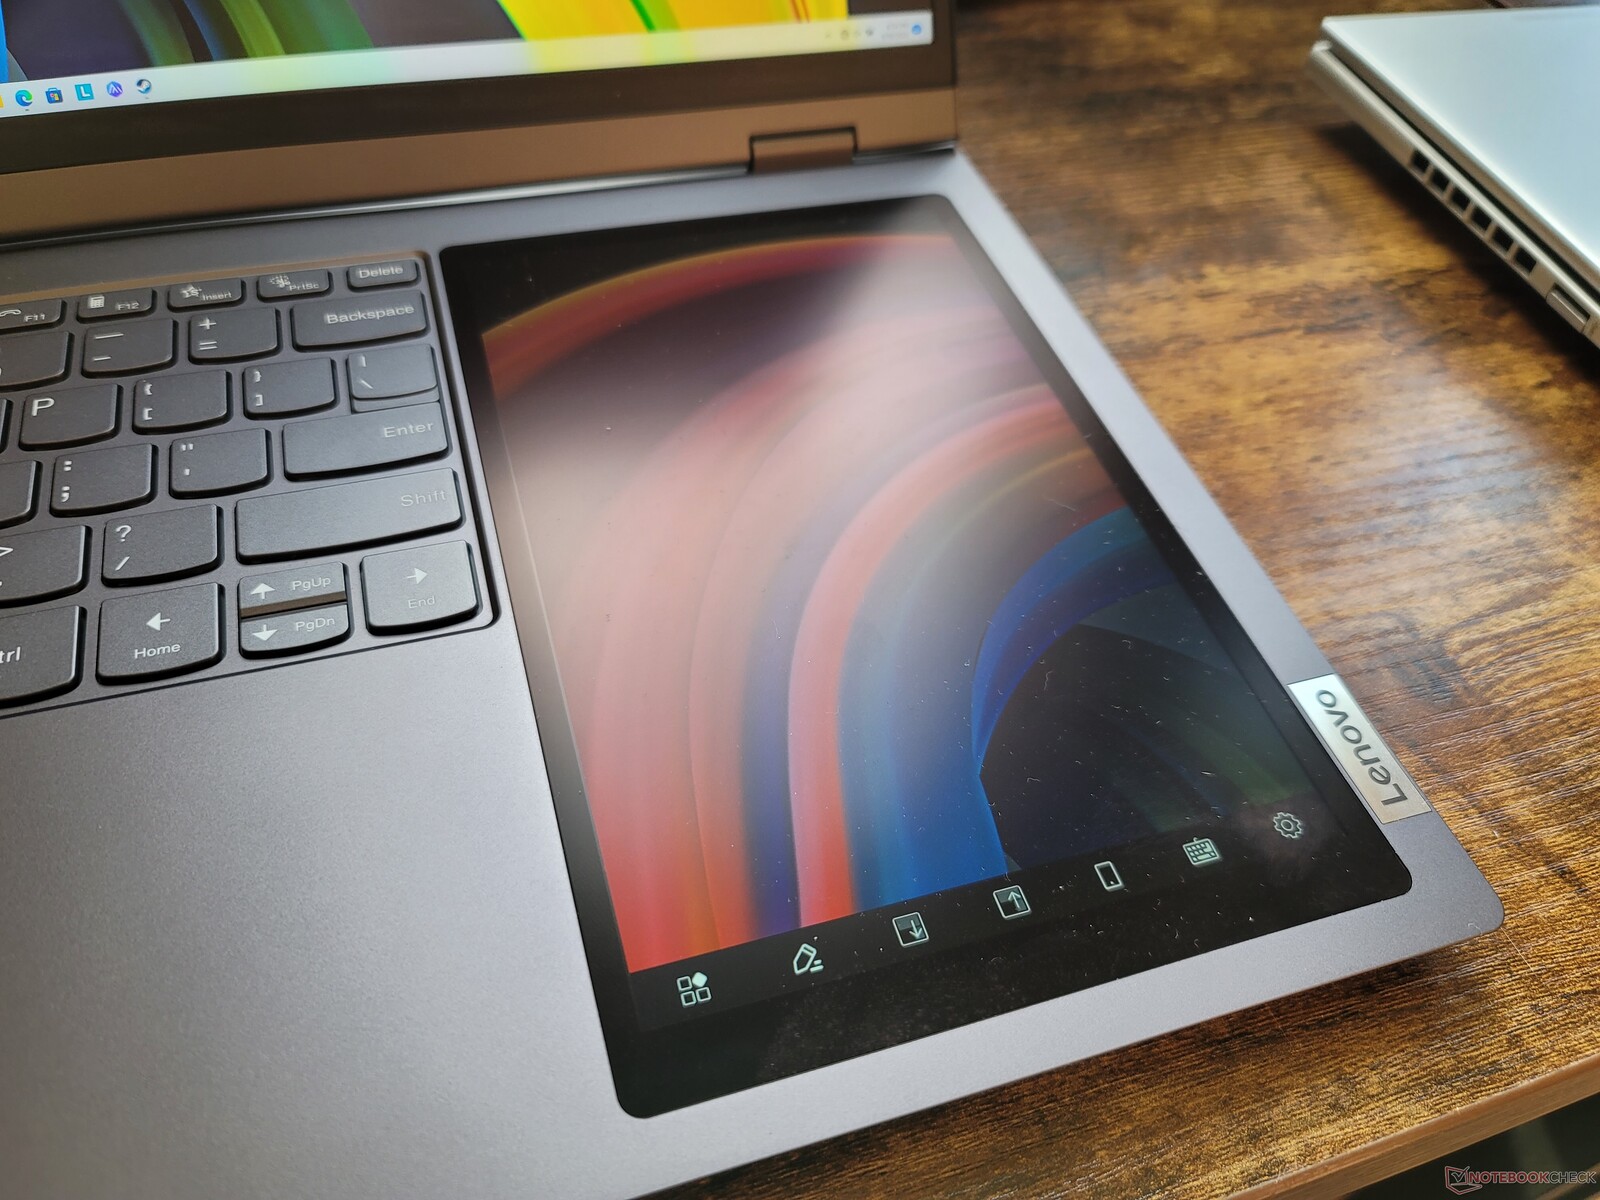
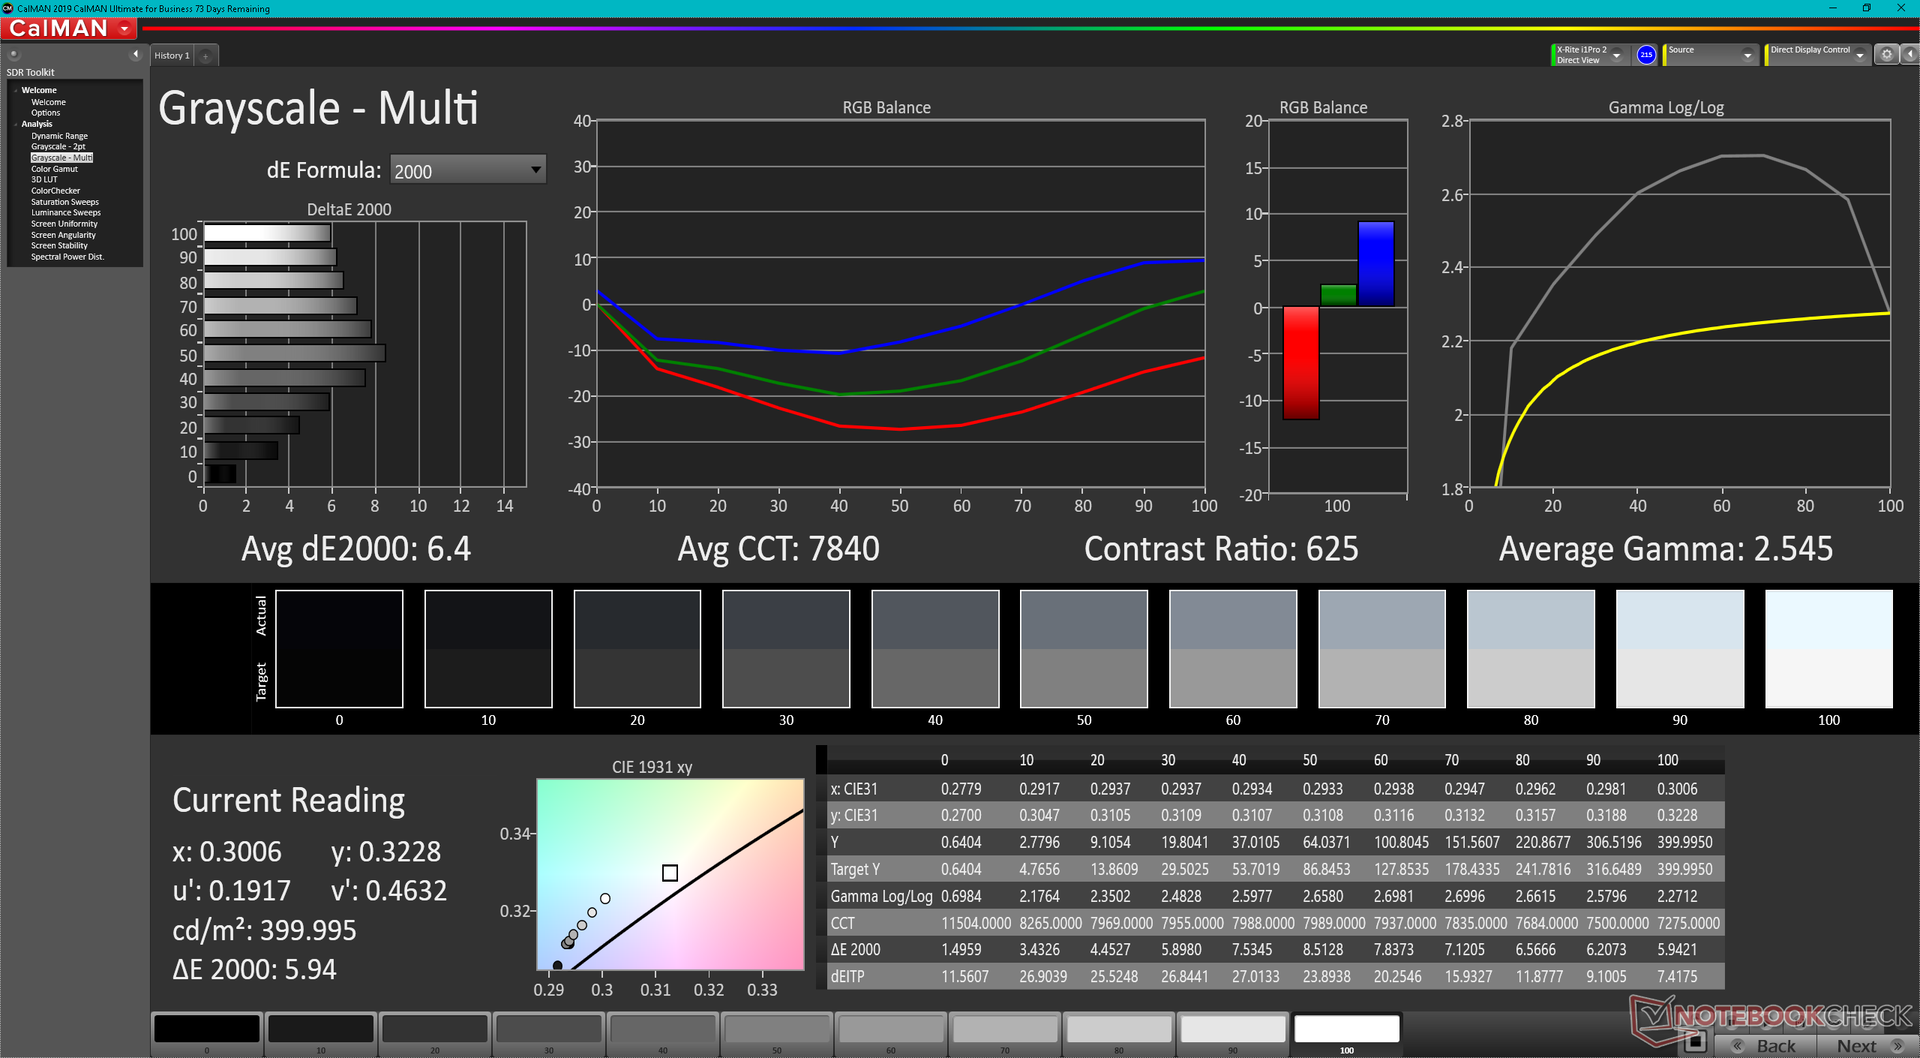
| 8-tums sekundär IPS-touchscreen | 800 x 1280 upplösning |
|---|---|
| Uppdateringsfrekvens | 60 Hz |
| Maximal ljusstyrka | 393,6 nits |
| Svarstider från svart till vitt | 16,8 ms uppgång, 10,4 ms nedgång |
| Svarstider från grått till grått | 18,0 ms uppgång, 18,8 ms nedgång |
| Kontrastförhållande | 579:1 |
| sRGB-täckning | 80,6 procent |
| Gamma | 2,55 |
| CCT | 7840 |
| Gråskala Avg DeltaE2000 | 6,4 |
| Colorchecker dE 2000 | 6,03 |
| Colorchecker dE 2000 Max | 9,45 |
Tyvärr har den sekundära skärmen liknande nackdelar som vissa tidiga ZenBook Duo-modeller. Färgerna, uppdateringsfrekvensen, kontrastförhållandet, kornigheten och särskilt betraktningsvinkelns bländning är alla märkbart sämre än huvudskärmens. Bildkvaliteten liknar mer en billig 8-tums Android -tablett än en iPad eller Samsung Galaxy Tab S. Om det är viktigt att återge bildkvaliteten 1:1 mellan den primära och sekundära skärmen för dina arbetsuppgifter är dubbla externa skärmar fortfarande det bästa alternativet
Vi upplevde också flera buggar på den andra skärmen. För det första synkade dess ljusstyrka ibland inte med huvudskärmen. För det andra stängdes den primära skärmen ofta av när man vaknade från viloläge och bara den andra skärmen var på, även om båda skärmarna var aktiva innan de gick in i viloläget. För det tredje reagerar skärmen på beröring även om den är inaktiverad i Windows, vilket kan leda till många oavsiktliga inmatningar på huvudskärmen. Användarna måste komma ihåg att manuellt trycka på S Star-tangenten (eller Insert-tangenten) på tangentbordet för att växla mellan beröringskänslighet och beröringskänslighet. Och slutligen går många inmatningar oregistrerade på den andra skärmen, vilket kan bli frustrerande vid användning. Många av dessa funktioner är lovande, men de skulle säkert kunna dra nytta av mer utvecklingstid.
Prestanda - Intel 12th Gen Alder Lake-H
Provningsförhållanden
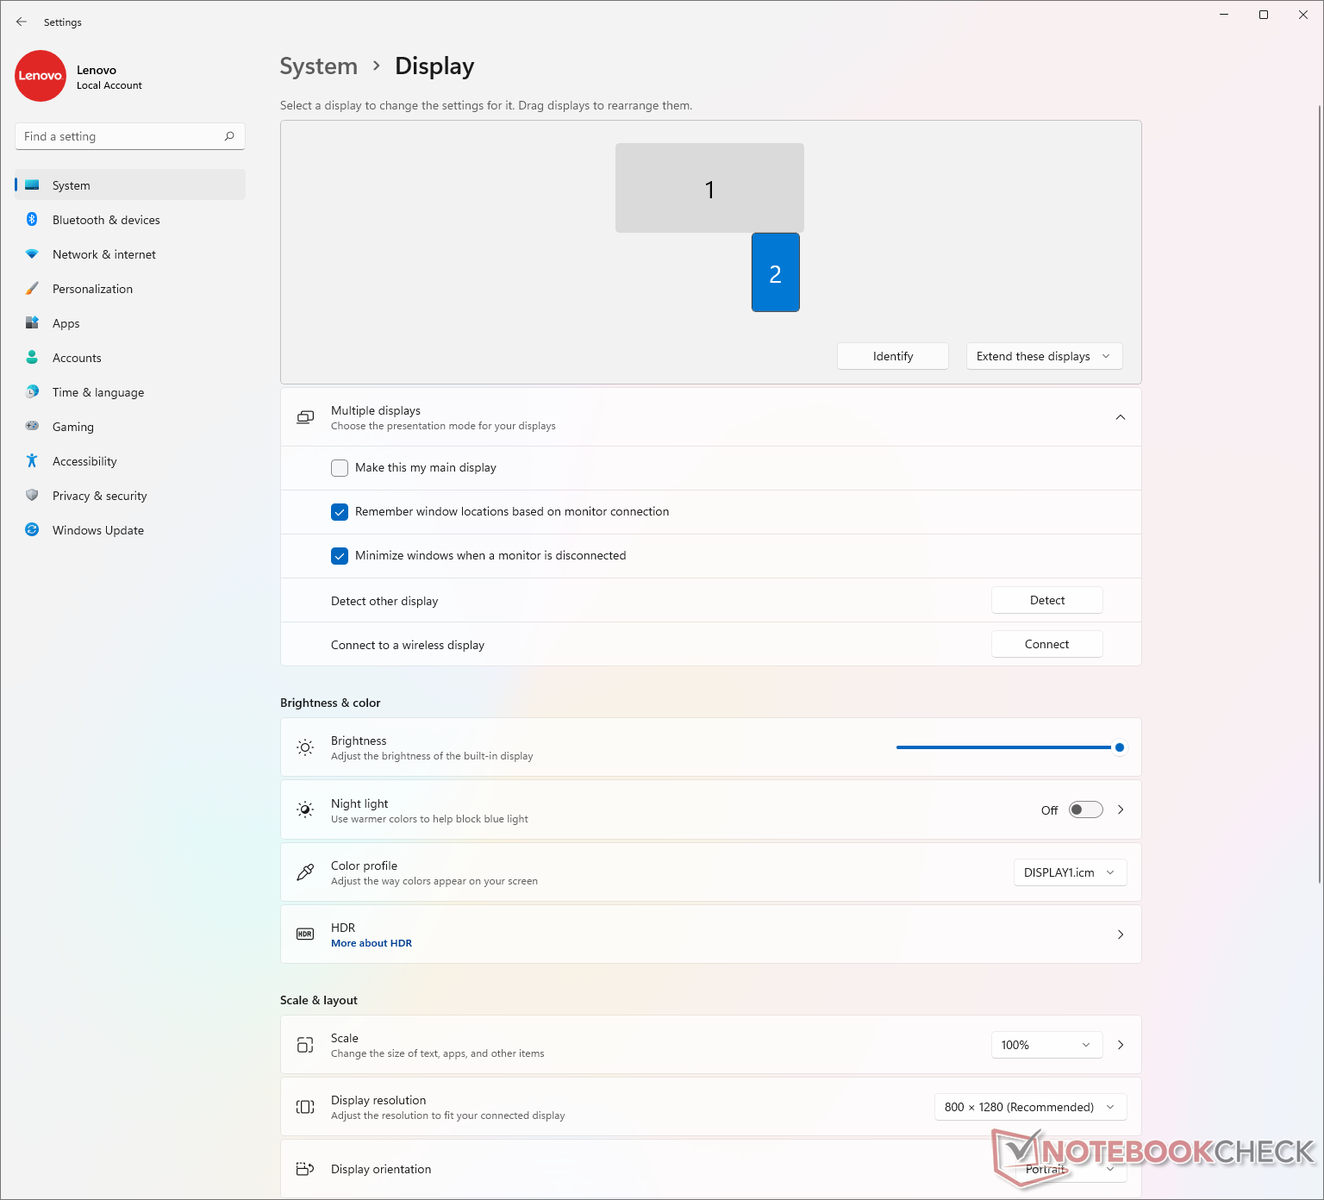
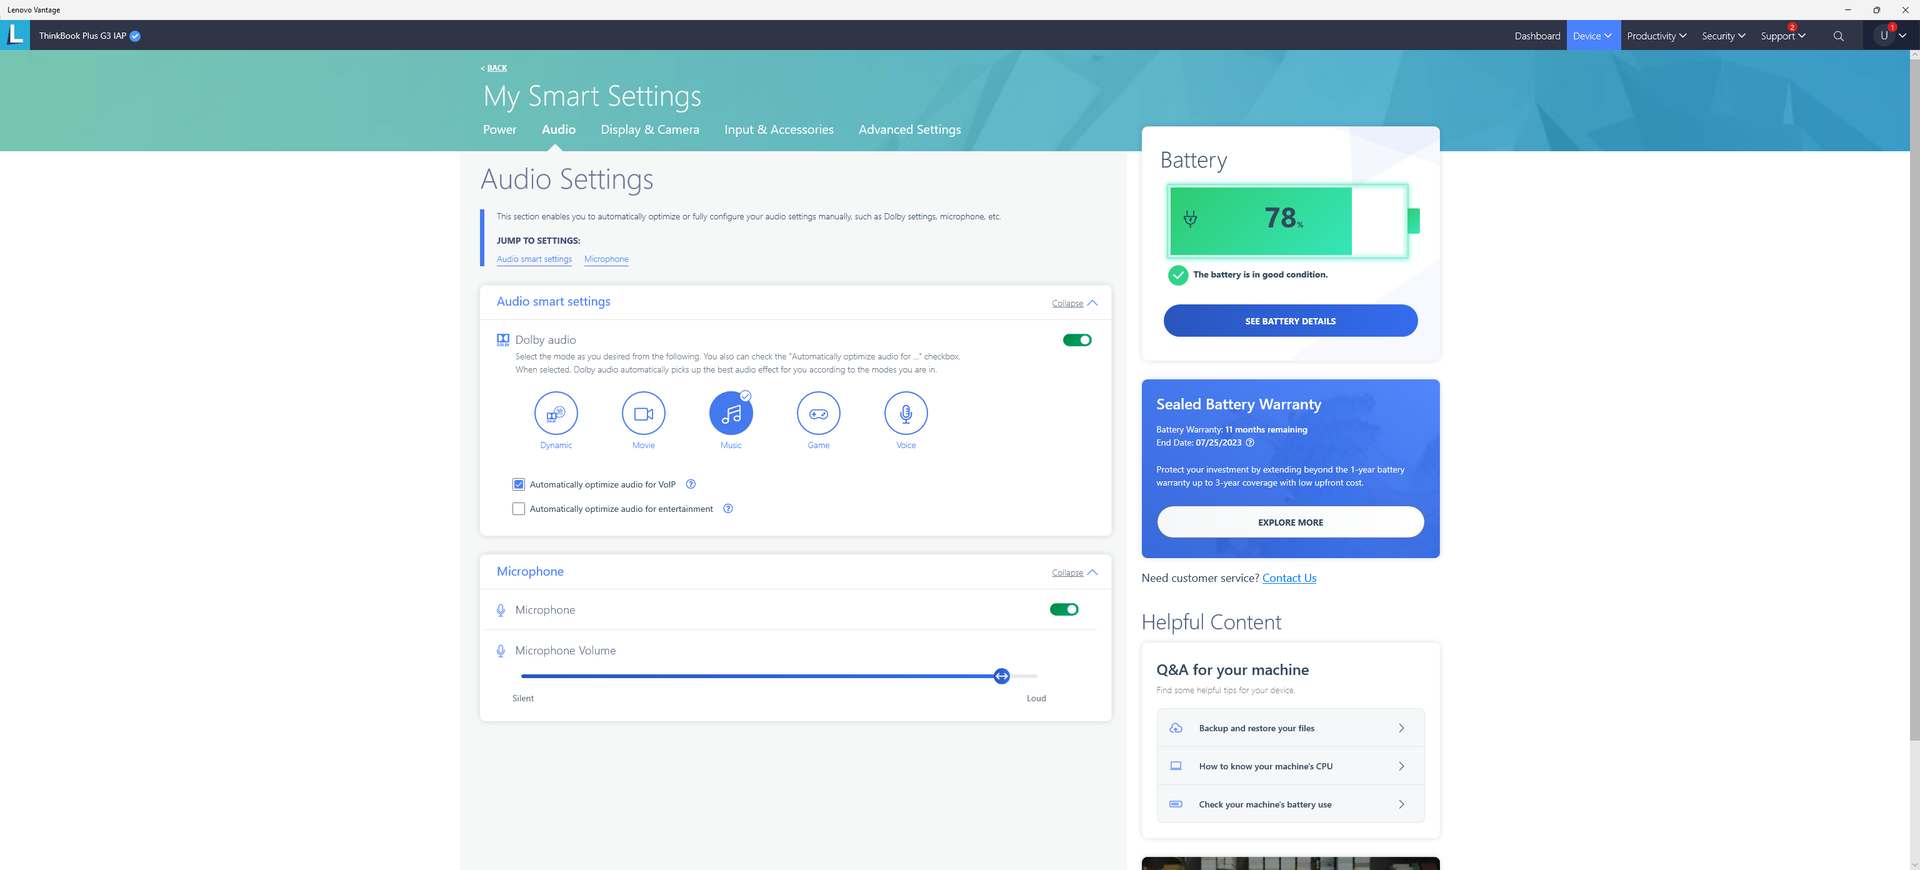
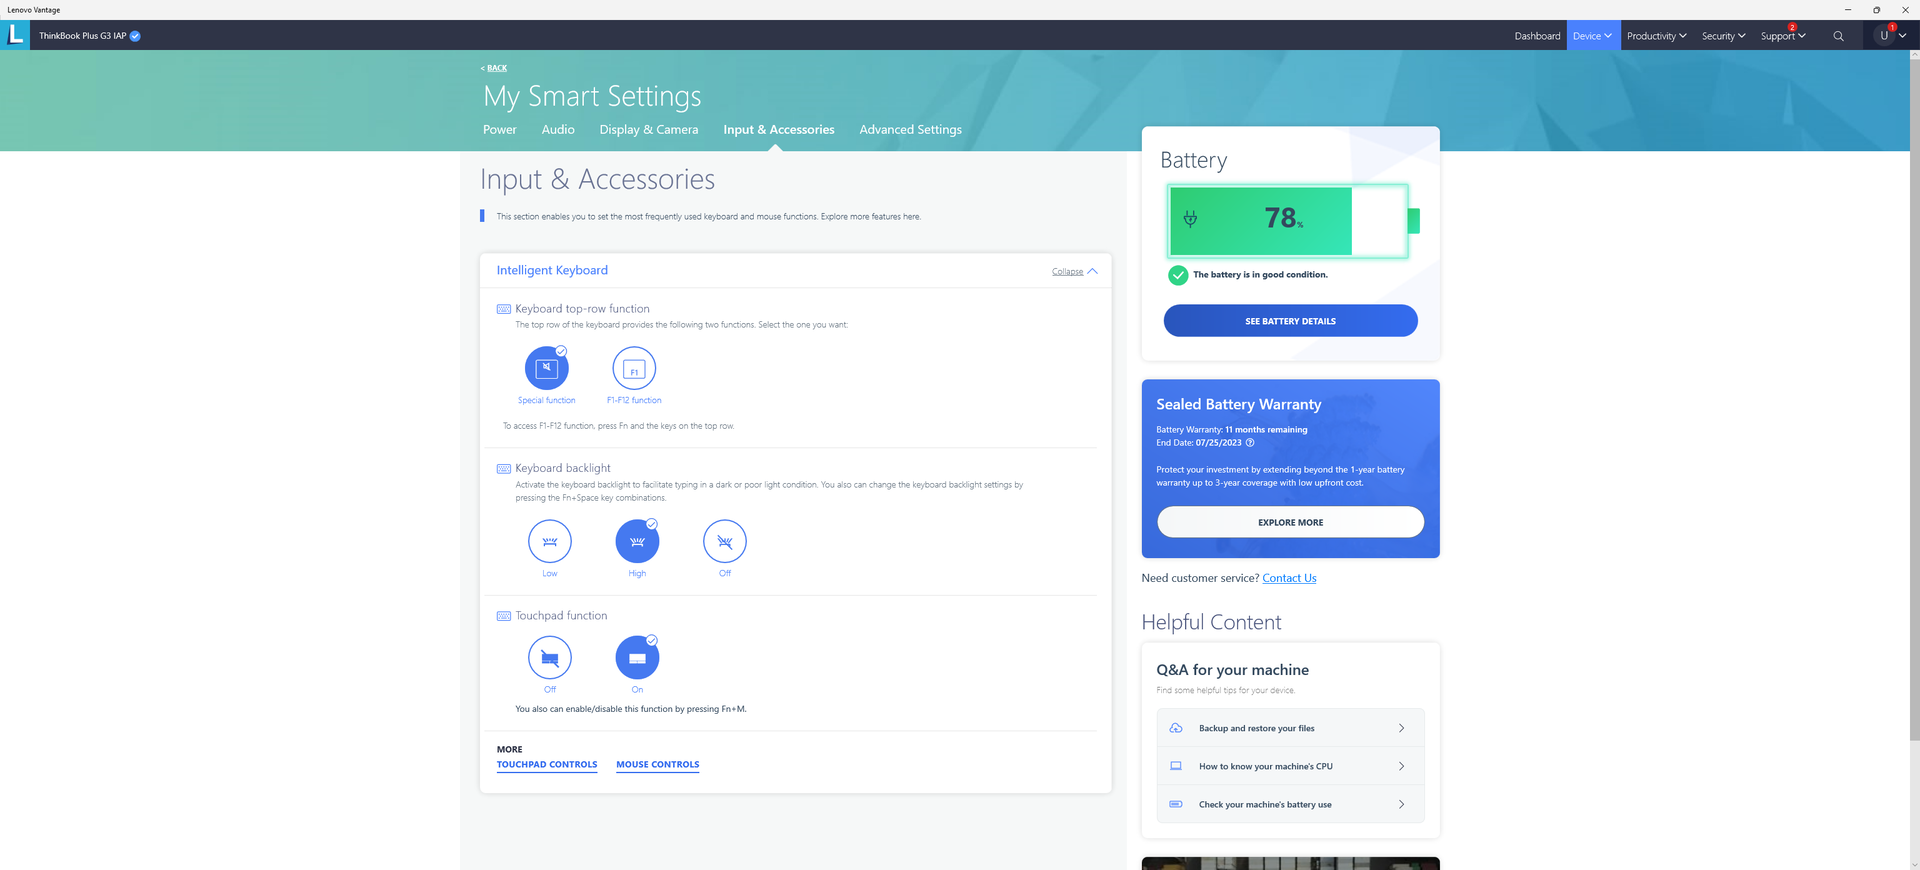
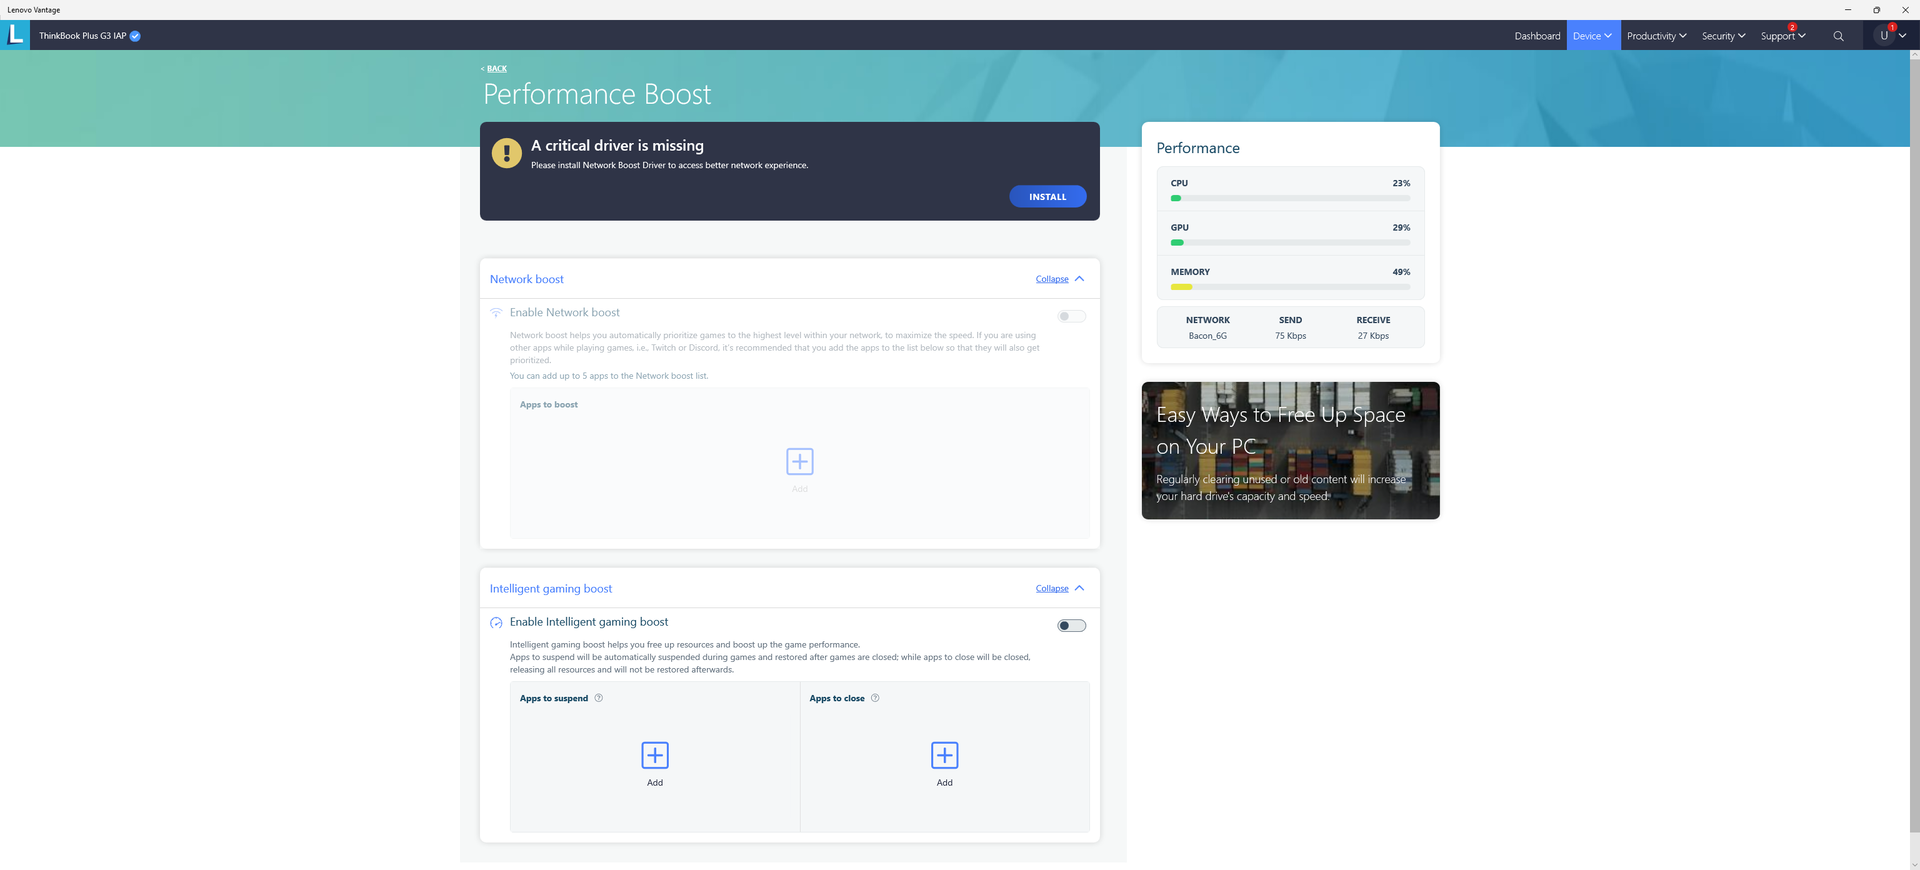
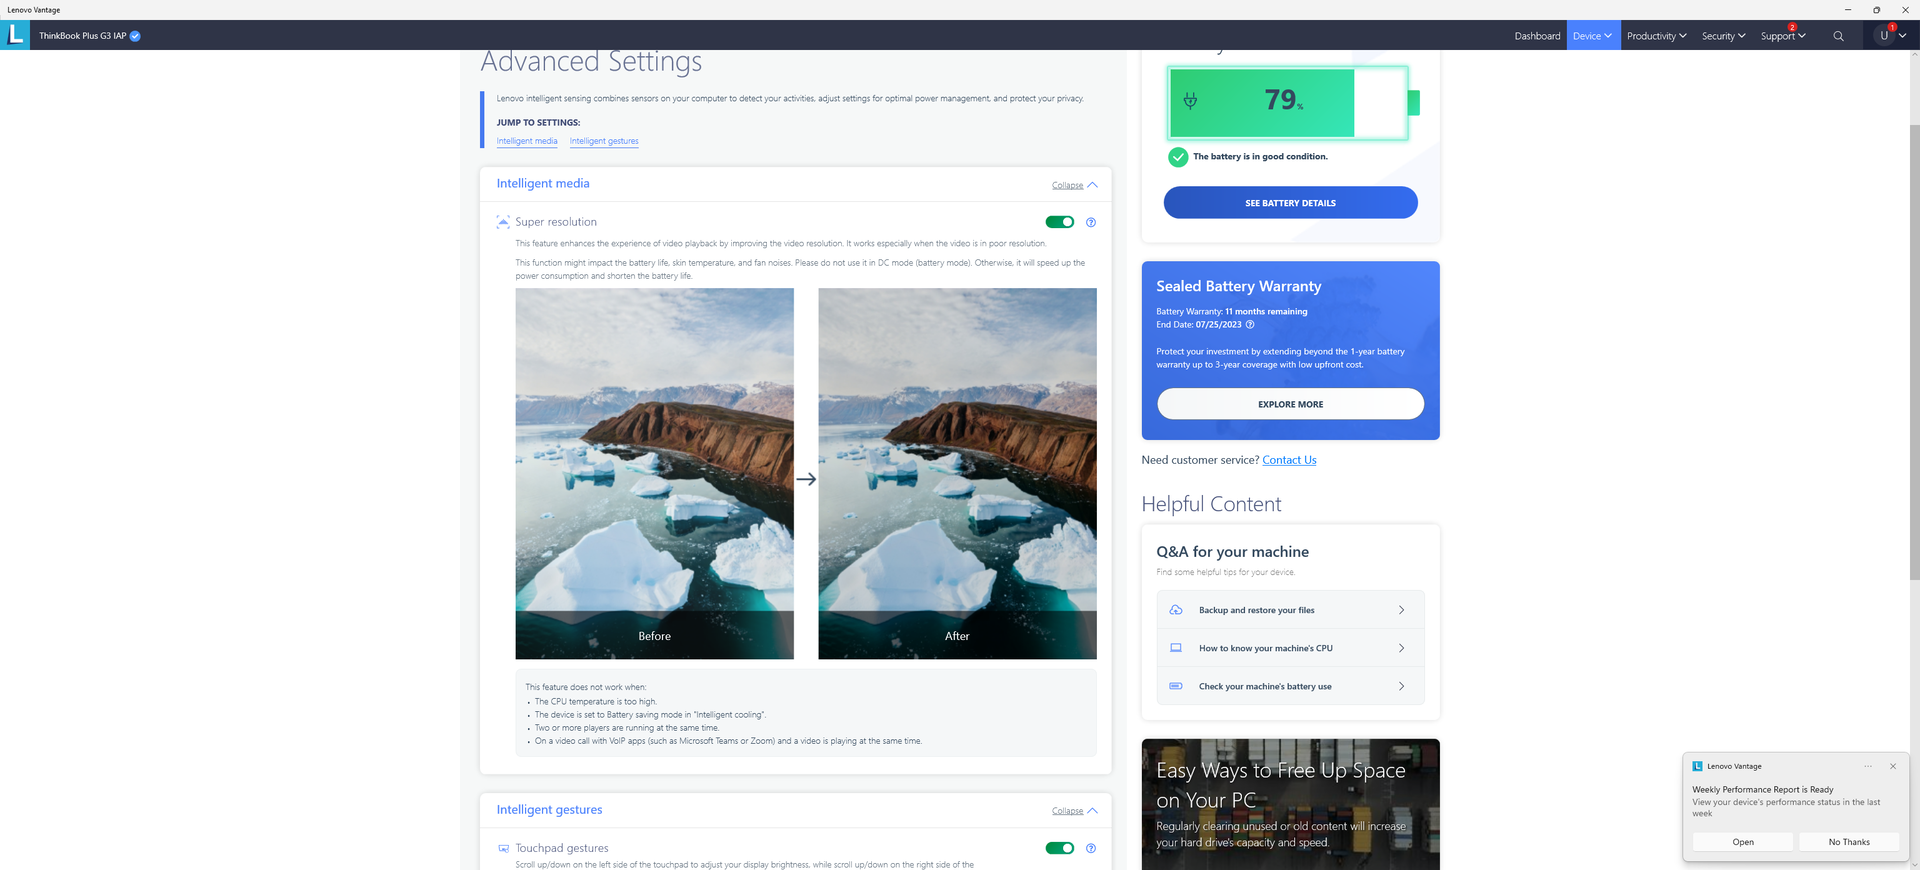
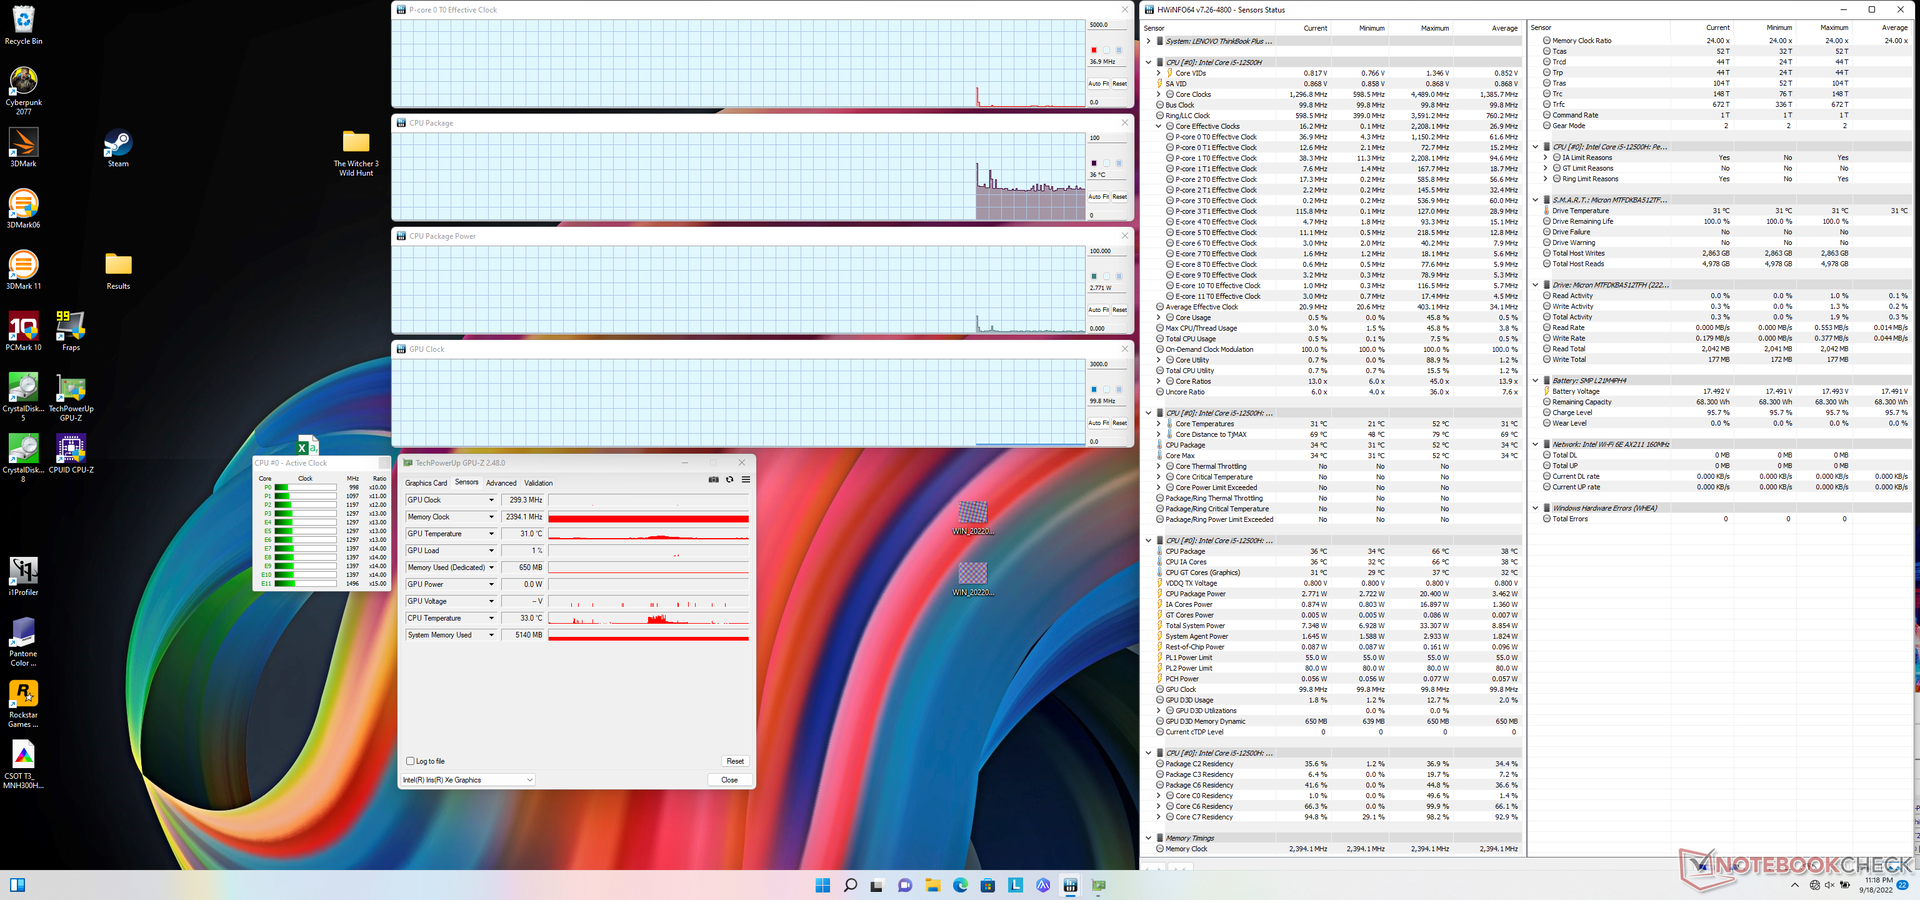
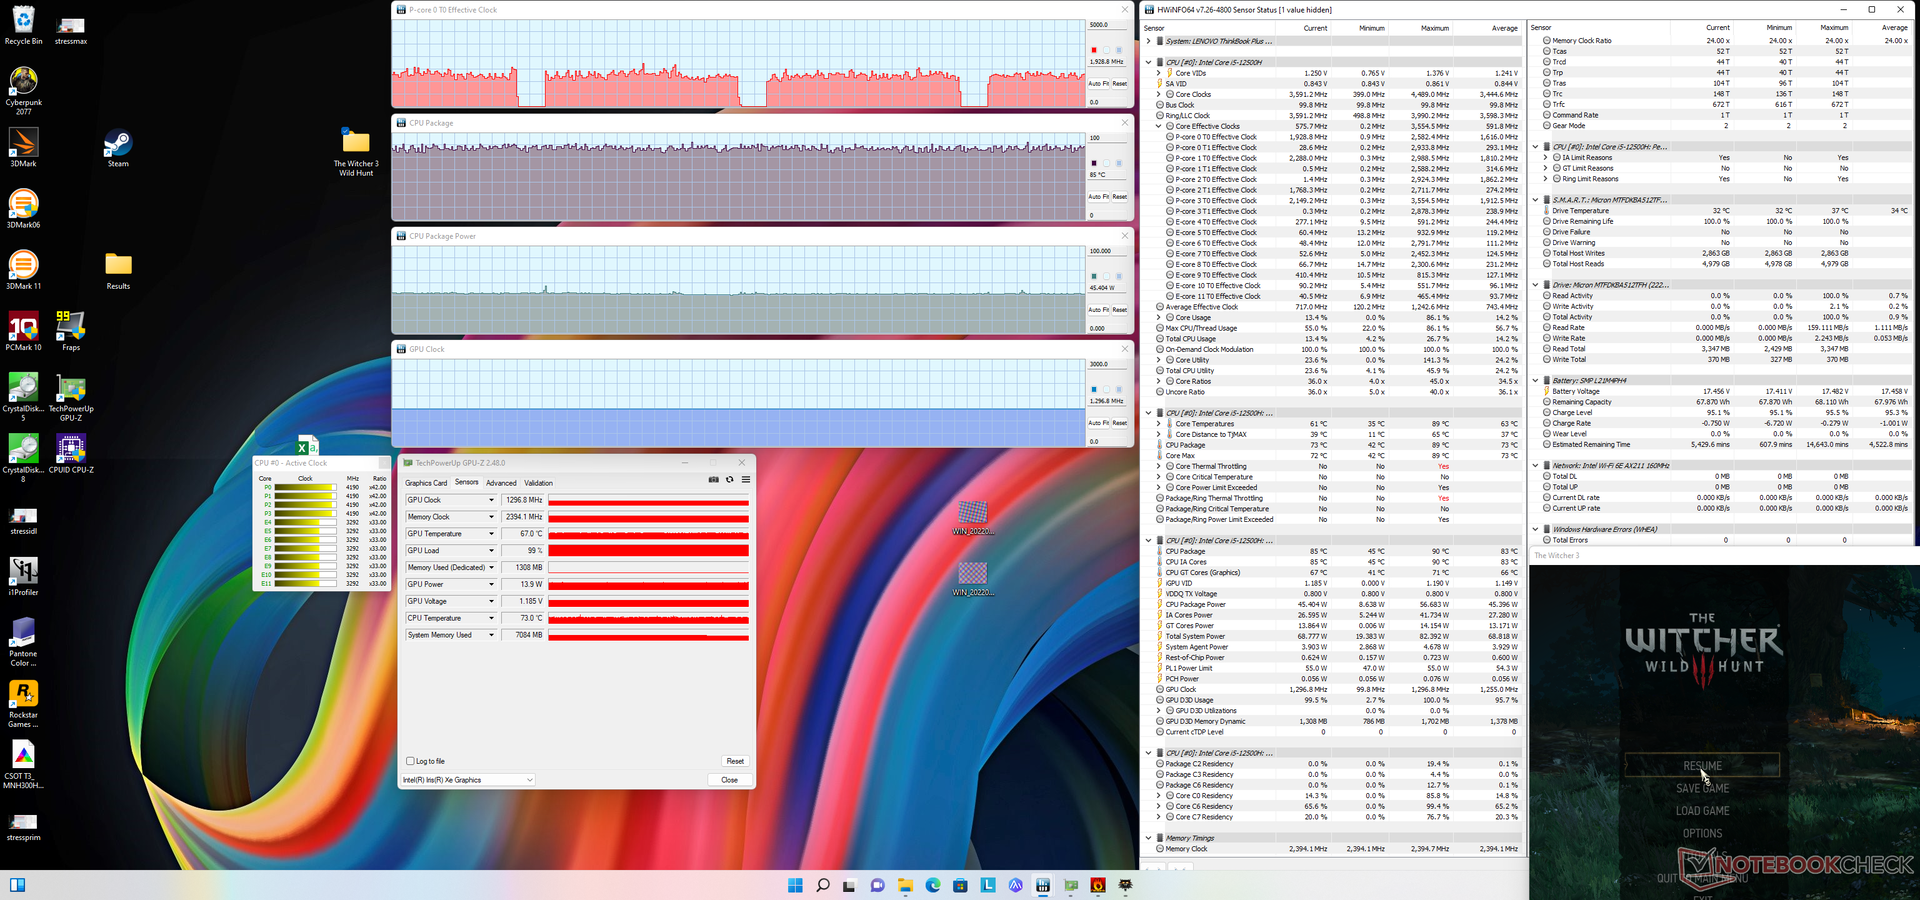
Vi ställde in vår enhet på Extreme Performance-läge via Lenovo Vantage och Performance-läge via Windows innan vi körde något av de nedanstående riktmärkena. Ägare bör bekanta sig med den förinstallerade Vantage-programvaran eftersom den är kontrollcentret för uppdateringar, prestanda och extrafunktioner för den bärbara datorn. Skärmavbilderna nedan visar några av de funktioner som finns tillgängliga i programvaran.

Processor
CPU-prestanda är 20 till 25 procent långsammare än genomsnittet Core i7-12700H i vår databas. Prestandaunderskottet är tillräckligt stort för att även bärbara datorer med den "långsammare" Core i5-12500H som t.ex Honor MagicBook 15 kan matcha eller överträffa vår Lenovo. Processorprestanda är dock fortfarande snabbare än den energisnålare Core i7-1260P eller Core i7-1165G7. Fördelen är särskilt stor jämfört medCore i5-1130G7 som drev förra årets ThinkBook Plus Gen 2-modell.
Cinebench R15 Multi Loop
Cinebench R23: Multi Core | Single Core
Cinebench R15: CPU Multi 64Bit | CPU Single 64Bit
Blender: v2.79 BMW27 CPU
7-Zip 18.03: 7z b 4 | 7z b 4 -mmt1
Geekbench 5.5: Multi-Core | Single-Core
HWBOT x265 Benchmark v2.2: 4k Preset
LibreOffice : 20 Documents To PDF
R Benchmark 2.5: Overall mean
| Cinebench R20 / CPU (Multi Core) | |
| Genomsnitt Intel Core i7-12700H (1576 - 7407, n=64) | |
| Schenker XMG Neo 17 M22 | |
| Gigabyte Aero 17 HDR YD | |
| Dell XPS 17 9720 | |
| Gigabyte A7 X1 | |
| Honor MagicBook 14 2022 | |
| Acer Nitro 5 AN517-41-R9S5 | |
| Lenovo ThinkBook Plus Gen3 | |
| Lenovo Legion 5 17ACH6H-82JY0003GE | |
| Samsung Galaxy Book2 15 | |
| Asus ProArt StudioBook Pro 17 W700G3T | |
| LG Gram 17 (2022) | |
| Acer Aspire 5 A517-52G-79Z5 | |
| Lenovo ThinkBook Plus Gen2 Core i5 | |
| Cinebench R20 / CPU (Single Core) | |
| Samsung Galaxy Book2 15 | |
| Genomsnitt Intel Core i7-12700H (300 - 704, n=64) | |
| Lenovo ThinkBook Plus Gen3 | |
| Dell XPS 17 9720 | |
| Honor MagicBook 14 2022 | |
| Schenker XMG Neo 17 M22 | |
| Gigabyte Aero 17 HDR YD | |
| Gigabyte A7 X1 | |
| Acer Aspire 5 A517-52G-79Z5 | |
| Acer Nitro 5 AN517-41-R9S5 | |
| Lenovo Legion 5 17ACH6H-82JY0003GE | |
| LG Gram 17 (2022) | |
| Lenovo ThinkBook Plus Gen2 Core i5 | |
| Asus ProArt StudioBook Pro 17 W700G3T | |
| Cinebench R23 / Multi Core | |
| Dell XPS 17 9720 | |
| Genomsnitt Intel Core i7-12700H (4032 - 19330, n=64) | |
| Schenker XMG Neo 17 M22 | |
| Gigabyte A7 X1 | |
| Honor MagicBook 14 2022 | |
| Acer Nitro 5 AN517-41-R9S5 | |
| Lenovo ThinkBook Plus Gen3 | |
| Lenovo Legion 5 17ACH6H-82JY0003GE | |
| Samsung Galaxy Book2 15 | |
| LG Gram 17 (2022) | |
| Acer Aspire 5 A517-52G-79Z5 | |
| Lenovo ThinkBook Plus Gen2 Core i5 | |
| Cinebench R23 / Single Core | |
| Samsung Galaxy Book2 15 | |
| Genomsnitt Intel Core i7-12700H (778 - 1826, n=63) | |
| Dell XPS 17 9720 | |
| Lenovo ThinkBook Plus Gen3 | |
| Honor MagicBook 14 2022 | |
| Schenker XMG Neo 17 M22 | |
| Acer Aspire 5 A517-52G-79Z5 | |
| Gigabyte A7 X1 | |
| Acer Nitro 5 AN517-41-R9S5 | |
| LG Gram 17 (2022) | |
| Lenovo Legion 5 17ACH6H-82JY0003GE | |
| Lenovo ThinkBook Plus Gen2 Core i5 | |
| Cinebench R15 / CPU Multi 64Bit | |
| Dell XPS 17 9720 | |
| Dell XPS 17 9720 | |
| Genomsnitt Intel Core i7-12700H (1379 - 2916, n=70) | |
| Schenker XMG Neo 17 M22 | |
| Honor MagicBook 14 2022 | |
| Honor MagicBook 14 2022 | |
| Gigabyte A7 X1 | |
| Gigabyte Aero 17 HDR YD | |
| Acer Nitro 5 AN517-41-R9S5 | |
| Lenovo ThinkBook Plus Gen3 | |
| Lenovo Legion 5 17ACH6H-82JY0003GE | |
| LG Gram 17 (2022) | |
| Samsung Galaxy Book2 15 | |
| Asus ProArt StudioBook Pro 17 W700G3T | |
| Asus ProArt StudioBook Pro 17 W700G3T | |
| Acer Aspire 5 A517-52G-79Z5 | |
| Lenovo ThinkBook Plus Gen2 Core i5 | |
| Lenovo ThinkBook Plus Gen2 Core i5 | |
| Cinebench R15 / CPU Single 64Bit | |
| Dell XPS 17 9720 | |
| Genomsnitt Intel Core i7-12700H (113 - 263, n=65) | |
| Schenker XMG Neo 17 M22 | |
| Lenovo ThinkBook Plus Gen3 | |
| Samsung Galaxy Book2 15 | |
| Gigabyte A7 X1 | |
| Honor MagicBook 14 2022 | |
| Gigabyte Aero 17 HDR YD | |
| Acer Nitro 5 AN517-41-R9S5 | |
| Lenovo Legion 5 17ACH6H-82JY0003GE | |
| Acer Aspire 5 A517-52G-79Z5 | |
| Asus ProArt StudioBook Pro 17 W700G3T | |
| Lenovo ThinkBook Plus Gen2 Core i5 | |
| Lenovo ThinkBook Plus Gen2 Core i5 | |
| LG Gram 17 (2022) | |
| Blender / v2.79 BMW27 CPU | |
| Lenovo ThinkBook Plus Gen2 Core i5 | |
| Acer Aspire 5 A517-52G-79Z5 | |
| LG Gram 17 (2022) | |
| Asus ProArt StudioBook Pro 17 W700G3T | |
| Samsung Galaxy Book2 15 | |
| Lenovo Legion 5 17ACH6H-82JY0003GE | |
| Lenovo ThinkBook Plus Gen3 | |
| Honor MagicBook 14 2022 | |
| Acer Nitro 5 AN517-41-R9S5 | |
| Gigabyte A7 X1 | |
| Dell XPS 17 9720 | |
| Gigabyte Aero 17 HDR YD | |
| Genomsnitt Intel Core i7-12700H (168 - 732, n=63) | |
| Schenker XMG Neo 17 M22 | |
| 7-Zip 18.03 / 7z b 4 | |
| Schenker XMG Neo 17 M22 | |
| Genomsnitt Intel Core i7-12700H (22844 - 73067, n=63) | |
| Dell XPS 17 9720 | |
| Acer Nitro 5 AN517-41-R9S5 | |
| Gigabyte Aero 17 HDR YD | |
| Gigabyte A7 X1 | |
| Honor MagicBook 14 2022 | |
| Lenovo ThinkBook Plus Gen3 | |
| Lenovo Legion 5 17ACH6H-82JY0003GE | |
| Samsung Galaxy Book2 15 | |
| Asus ProArt StudioBook Pro 17 W700G3T | |
| LG Gram 17 (2022) | |
| Acer Aspire 5 A517-52G-79Z5 | |
| Lenovo ThinkBook Plus Gen2 Core i5 | |
| 7-Zip 18.03 / 7z b 4 -mmt1 | |
| Schenker XMG Neo 17 M22 | |
| Dell XPS 17 9720 | |
| Gigabyte A7 X1 | |
| Gigabyte Aero 17 HDR YD | |
| Genomsnitt Intel Core i7-12700H (2743 - 5972, n=63) | |
| Acer Nitro 5 AN517-41-R9S5 | |
| Samsung Galaxy Book2 15 | |
| Acer Aspire 5 A517-52G-79Z5 | |
| Lenovo Legion 5 17ACH6H-82JY0003GE | |
| Honor MagicBook 14 2022 | |
| Lenovo ThinkBook Plus Gen3 | |
| Asus ProArt StudioBook Pro 17 W700G3T | |
| LG Gram 17 (2022) | |
| Lenovo ThinkBook Plus Gen2 Core i5 | |
| Geekbench 5.5 / Multi-Core | |
| Dell XPS 17 9720 | |
| Genomsnitt Intel Core i7-12700H (5144 - 13745, n=64) | |
| Honor MagicBook 14 2022 | |
| Lenovo ThinkBook Plus Gen3 | |
| Schenker XMG Neo 17 M22 | |
| Gigabyte Aero 17 HDR YD | |
| Acer Nitro 5 AN517-41-R9S5 | |
| LG Gram 17 (2022) | |
| Gigabyte A7 X1 | |
| Samsung Galaxy Book2 15 | |
| Lenovo Legion 5 17ACH6H-82JY0003GE | |
| Asus ProArt StudioBook Pro 17 W700G3T | |
| Acer Aspire 5 A517-52G-79Z5 | |
| Lenovo ThinkBook Plus Gen2 Core i5 | |
| Geekbench 5.5 / Single-Core | |
| Dell XPS 17 9720 | |
| Samsung Galaxy Book2 15 | |
| Genomsnitt Intel Core i7-12700H (803 - 1851, n=64) | |
| Honor MagicBook 14 2022 | |
| Lenovo ThinkBook Plus Gen3 | |
| Gigabyte Aero 17 HDR YD | |
| Schenker XMG Neo 17 M22 | |
| LG Gram 17 (2022) | |
| Acer Aspire 5 A517-52G-79Z5 | |
| Gigabyte A7 X1 | |
| Acer Nitro 5 AN517-41-R9S5 | |
| Lenovo Legion 5 17ACH6H-82JY0003GE | |
| Lenovo ThinkBook Plus Gen2 Core i5 | |
| Asus ProArt StudioBook Pro 17 W700G3T | |
| HWBOT x265 Benchmark v2.2 / 4k Preset | |
| Schenker XMG Neo 17 M22 | |
| Genomsnitt Intel Core i7-12700H (4.67 - 21.8, n=64) | |
| Gigabyte Aero 17 HDR YD | |
| Acer Nitro 5 AN517-41-R9S5 | |
| Gigabyte A7 X1 | |
| Dell XPS 17 9720 | |
| Honor MagicBook 14 2022 | |
| Lenovo ThinkBook Plus Gen3 | |
| Lenovo Legion 5 17ACH6H-82JY0003GE | |
| Samsung Galaxy Book2 15 | |
| Asus ProArt StudioBook Pro 17 W700G3T | |
| LG Gram 17 (2022) | |
| Acer Aspire 5 A517-52G-79Z5 | |
| LibreOffice / 20 Documents To PDF | |
| Acer Nitro 5 AN517-41-R9S5 | |
| Asus ProArt StudioBook Pro 17 W700G3T | |
| Lenovo ThinkBook Plus Gen2 Core i5 | |
| Gigabyte A7 X1 | |
| Schenker XMG Neo 17 M22 | |
| LG Gram 17 (2022) | |
| Lenovo Legion 5 17ACH6H-82JY0003GE | |
| Acer Aspire 5 A517-52G-79Z5 | |
| Lenovo ThinkBook Plus Gen3 | |
| Genomsnitt Intel Core i7-12700H (34.2 - 95.3, n=63) | |
| Dell XPS 17 9720 | |
| Samsung Galaxy Book2 15 | |
| Honor MagicBook 14 2022 | |
| Gigabyte Aero 17 HDR YD | |
| R Benchmark 2.5 / Overall mean | |
| Lenovo ThinkBook Plus Gen2 Core i5 | |
| Asus ProArt StudioBook Pro 17 W700G3T | |
| Acer Aspire 5 A517-52G-79Z5 | |
| LG Gram 17 (2022) | |
| Gigabyte Aero 17 HDR YD | |
| Lenovo Legion 5 17ACH6H-82JY0003GE | |
| Gigabyte A7 X1 | |
| Honor MagicBook 14 2022 | |
| Lenovo ThinkBook Plus Gen3 | |
| Schenker XMG Neo 17 M22 | |
| Genomsnitt Intel Core i7-12700H (0.4441 - 1.052, n=63) | |
| Samsung Galaxy Book2 15 | |
| Dell XPS 17 9720 | |
Cinebench R23: Multi Core | Single Core
Cinebench R15: CPU Multi 64Bit | CPU Single 64Bit
Blender: v2.79 BMW27 CPU
7-Zip 18.03: 7z b 4 | 7z b 4 -mmt1
Geekbench 5.5: Multi-Core | Single-Core
HWBOT x265 Benchmark v2.2: 4k Preset
LibreOffice : 20 Documents To PDF
R Benchmark 2.5: Overall mean
* ... mindre är bättre
AIDA64: FP32 Ray-Trace | FPU Julia | CPU SHA3 | CPU Queen | FPU SinJulia | FPU Mandel | CPU AES | CPU ZLib | FP64 Ray-Trace | CPU PhotoWorxx
| Performance rating | |
| Genomsnitt Intel Core i7-12700H | |
| Lenovo ThinkBook Plus Gen3 | |
| Dell XPS 17 9720 | |
| Asus ProArt StudioBook Pro 17 W700G3T | |
| LG Gram 17 (2022) | |
| Lenovo ThinkBook Plus Gen2 Core i5 | |
| Gigabyte Aero 17 HDR YD -9! | |
| AIDA64 / FP32 Ray-Trace | |
| Lenovo ThinkBook Plus Gen3 | |
| Genomsnitt Intel Core i7-12700H (2585 - 17957, n=64) | |
| Asus ProArt StudioBook Pro 17 W700G3T | |
| Dell XPS 17 9720 | |
| LG Gram 17 (2022) | |
| Lenovo ThinkBook Plus Gen2 Core i5 | |
| AIDA64 / FPU Julia | |
| Lenovo ThinkBook Plus Gen3 | |
| Genomsnitt Intel Core i7-12700H (12439 - 90760, n=64) | |
| Asus ProArt StudioBook Pro 17 W700G3T | |
| Dell XPS 17 9720 | |
| LG Gram 17 (2022) | |
| Lenovo ThinkBook Plus Gen2 Core i5 | |
| AIDA64 / CPU SHA3 | |
| Genomsnitt Intel Core i7-12700H (833 - 4242, n=64) | |
| Lenovo ThinkBook Plus Gen3 | |
| Dell XPS 17 9720 | |
| Asus ProArt StudioBook Pro 17 W700G3T | |
| Lenovo ThinkBook Plus Gen2 Core i5 | |
| LG Gram 17 (2022) | |
| AIDA64 / CPU Queen | |
| Dell XPS 17 9720 | |
| Genomsnitt Intel Core i7-12700H (57923 - 103202, n=63) | |
| Lenovo ThinkBook Plus Gen3 | |
| Asus ProArt StudioBook Pro 17 W700G3T | |
| LG Gram 17 (2022) | |
| Lenovo ThinkBook Plus Gen2 Core i5 | |
| AIDA64 / FPU SinJulia | |
| Genomsnitt Intel Core i7-12700H (3249 - 9939, n=64) | |
| Dell XPS 17 9720 | |
| Lenovo ThinkBook Plus Gen3 | |
| Asus ProArt StudioBook Pro 17 W700G3T | |
| LG Gram 17 (2022) | |
| Lenovo ThinkBook Plus Gen2 Core i5 | |
| AIDA64 / FPU Mandel | |
| Lenovo ThinkBook Plus Gen3 | |
| Genomsnitt Intel Core i7-12700H (7135 - 44760, n=64) | |
| Asus ProArt StudioBook Pro 17 W700G3T | |
| Dell XPS 17 9720 | |
| LG Gram 17 (2022) | |
| Lenovo ThinkBook Plus Gen2 Core i5 | |
| AIDA64 / CPU AES | |
| Genomsnitt Intel Core i7-12700H (31839 - 144360, n=64) | |
| Dell XPS 17 9720 | |
| Lenovo ThinkBook Plus Gen3 | |
| Lenovo ThinkBook Plus Gen2 Core i5 | |
| LG Gram 17 (2022) | |
| Asus ProArt StudioBook Pro 17 W700G3T | |
| AIDA64 / CPU ZLib | |
| Genomsnitt Intel Core i7-12700H (305 - 1171, n=64) | |
| Dell XPS 17 9720 | |
| Lenovo ThinkBook Plus Gen3 | |
| Asus ProArt StudioBook Pro 17 W700G3T | |
| LG Gram 17 (2022) | |
| Lenovo ThinkBook Plus Gen2 Core i5 | |
| Gigabyte Aero 17 HDR YD | |
| AIDA64 / FP64 Ray-Trace | |
| Lenovo ThinkBook Plus Gen3 | |
| Genomsnitt Intel Core i7-12700H (1437 - 9692, n=64) | |
| Asus ProArt StudioBook Pro 17 W700G3T | |
| Dell XPS 17 9720 | |
| LG Gram 17 (2022) | |
| Lenovo ThinkBook Plus Gen2 Core i5 | |
| AIDA64 / CPU PhotoWorxx | |
| Dell XPS 17 9720 | |
| Lenovo ThinkBook Plus Gen3 | |
| Lenovo ThinkBook Plus Gen2 Core i5 | |
| LG Gram 17 (2022) | |
| Genomsnitt Intel Core i7-12700H (12863 - 52207, n=64) | |
| Asus ProArt StudioBook Pro 17 W700G3T | |
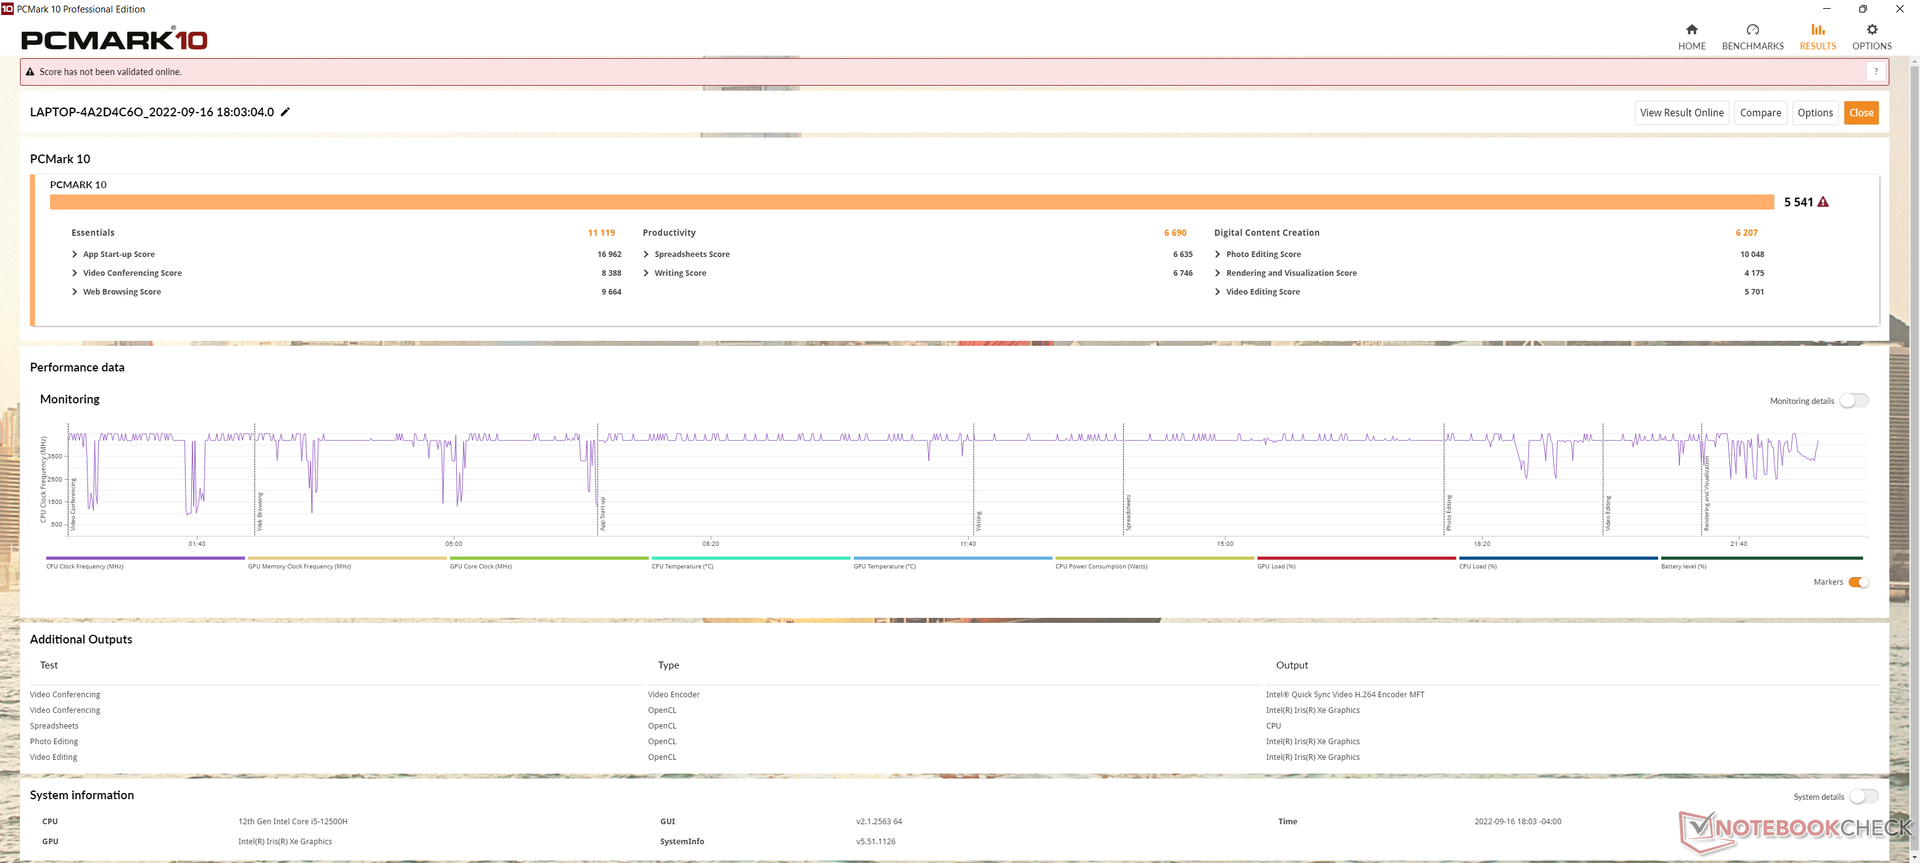
Systemets prestanda
PCMark 10-resultaten är högre än många bärbara datorer som körs med Core U-serien eller äldre CPU:er i H-serien, medan de är lägre än de som har dedikerade GPU:er, t.ex.XPS 17 9720.
CrossMark: Overall | Productivity | Creativity | Responsiveness
| PCMark 10 / Score | |
| Gigabyte Aero 17 HDR YD | |
| Dell XPS 17 9720 | |
| Genomsnitt Intel Core i7-12700H, Intel Iris Xe Graphics G7 96EUs (5541 - 6281, n=8) | |
| Lenovo ThinkBook Plus Gen3 | |
| LG Gram 17 (2022) | |
| Asus ProArt StudioBook Pro 17 W700G3T | |
| Lenovo ThinkBook Plus Gen2 Core i5 | |
| PCMark 10 / Essentials | |
| Lenovo ThinkBook Plus Gen3 | |
| Genomsnitt Intel Core i7-12700H, Intel Iris Xe Graphics G7 96EUs (9991 - 11699, n=8) | |
| Dell XPS 17 9720 | |
| Lenovo ThinkBook Plus Gen2 Core i5 | |
| Gigabyte Aero 17 HDR YD | |
| LG Gram 17 (2022) | |
| Asus ProArt StudioBook Pro 17 W700G3T | |
| PCMark 10 / Productivity | |
| Dell XPS 17 9720 | |
| Gigabyte Aero 17 HDR YD | |
| Asus ProArt StudioBook Pro 17 W700G3T | |
| Genomsnitt Intel Core i7-12700H, Intel Iris Xe Graphics G7 96EUs (6690 - 8038, n=8) | |
| Lenovo ThinkBook Plus Gen3 | |
| LG Gram 17 (2022) | |
| Lenovo ThinkBook Plus Gen2 Core i5 | |
| PCMark 10 / Digital Content Creation | |
| Gigabyte Aero 17 HDR YD | |
| Dell XPS 17 9720 | |
| Genomsnitt Intel Core i7-12700H, Intel Iris Xe Graphics G7 96EUs (6207 - 7401, n=8) | |
| Lenovo ThinkBook Plus Gen3 | |
| LG Gram 17 (2022) | |
| Asus ProArt StudioBook Pro 17 W700G3T | |
| Lenovo ThinkBook Plus Gen2 Core i5 | |
| CrossMark / Overall | |
| Dell XPS 17 9720 | |
| Genomsnitt Intel Core i7-12700H, Intel Iris Xe Graphics G7 96EUs (1492 - 1907, n=8) | |
| Lenovo ThinkBook Plus Gen3 | |
| LG Gram 17 (2022) | |
| CrossMark / Productivity | |
| Dell XPS 17 9720 | |
| Genomsnitt Intel Core i7-12700H, Intel Iris Xe Graphics G7 96EUs (1499 - 1832, n=8) | |
| Lenovo ThinkBook Plus Gen3 | |
| LG Gram 17 (2022) | |
| CrossMark / Creativity | |
| Dell XPS 17 9720 | |
| Lenovo ThinkBook Plus Gen3 | |
| Genomsnitt Intel Core i7-12700H, Intel Iris Xe Graphics G7 96EUs (1507 - 2016, n=8) | |
| LG Gram 17 (2022) | |
| CrossMark / Responsiveness | |
| Dell XPS 17 9720 | |
| Genomsnitt Intel Core i7-12700H, Intel Iris Xe Graphics G7 96EUs (1384 - 1831, n=8) | |
| LG Gram 17 (2022) | |
| Lenovo ThinkBook Plus Gen3 | |
| PCMark 10 Score | 5541 poäng | |
Hjälp | ||
| AIDA64 / Memory Copy | |
| Dell XPS 17 9720 | |
| Lenovo ThinkBook Plus Gen3 | |
| LG Gram 17 (2022) | |
| Lenovo ThinkBook Plus Gen2 Core i5 | |
| Genomsnitt Intel Core i7-12700H (25615 - 80511, n=64) | |
| Asus ProArt StudioBook Pro 17 W700G3T | |
| AIDA64 / Memory Read | |
| Lenovo ThinkBook Plus Gen3 | |
| Dell XPS 17 9720 | |
| LG Gram 17 (2022) | |
| Lenovo ThinkBook Plus Gen2 Core i5 | |
| Genomsnitt Intel Core i7-12700H (25586 - 79442, n=64) | |
| Asus ProArt StudioBook Pro 17 W700G3T | |
| AIDA64 / Memory Write | |
| Dell XPS 17 9720 | |
| Lenovo ThinkBook Plus Gen2 Core i5 | |
| LG Gram 17 (2022) | |
| Lenovo ThinkBook Plus Gen3 | |
| Genomsnitt Intel Core i7-12700H (23679 - 88660, n=64) | |
| Asus ProArt StudioBook Pro 17 W700G3T | |
| AIDA64 / Memory Latency | |
| Lenovo ThinkBook Plus Gen3 | |
| LG Gram 17 (2022) | |
| Lenovo ThinkBook Plus Gen2 Core i5 | |
| Dell XPS 17 9720 | |
| Genomsnitt Intel Core i7-12700H (76.2 - 133.9, n=62) | |
| Asus ProArt StudioBook Pro 17 W700G3T | |
| Gigabyte Aero 17 HDR YD | |
* ... mindre är bättre
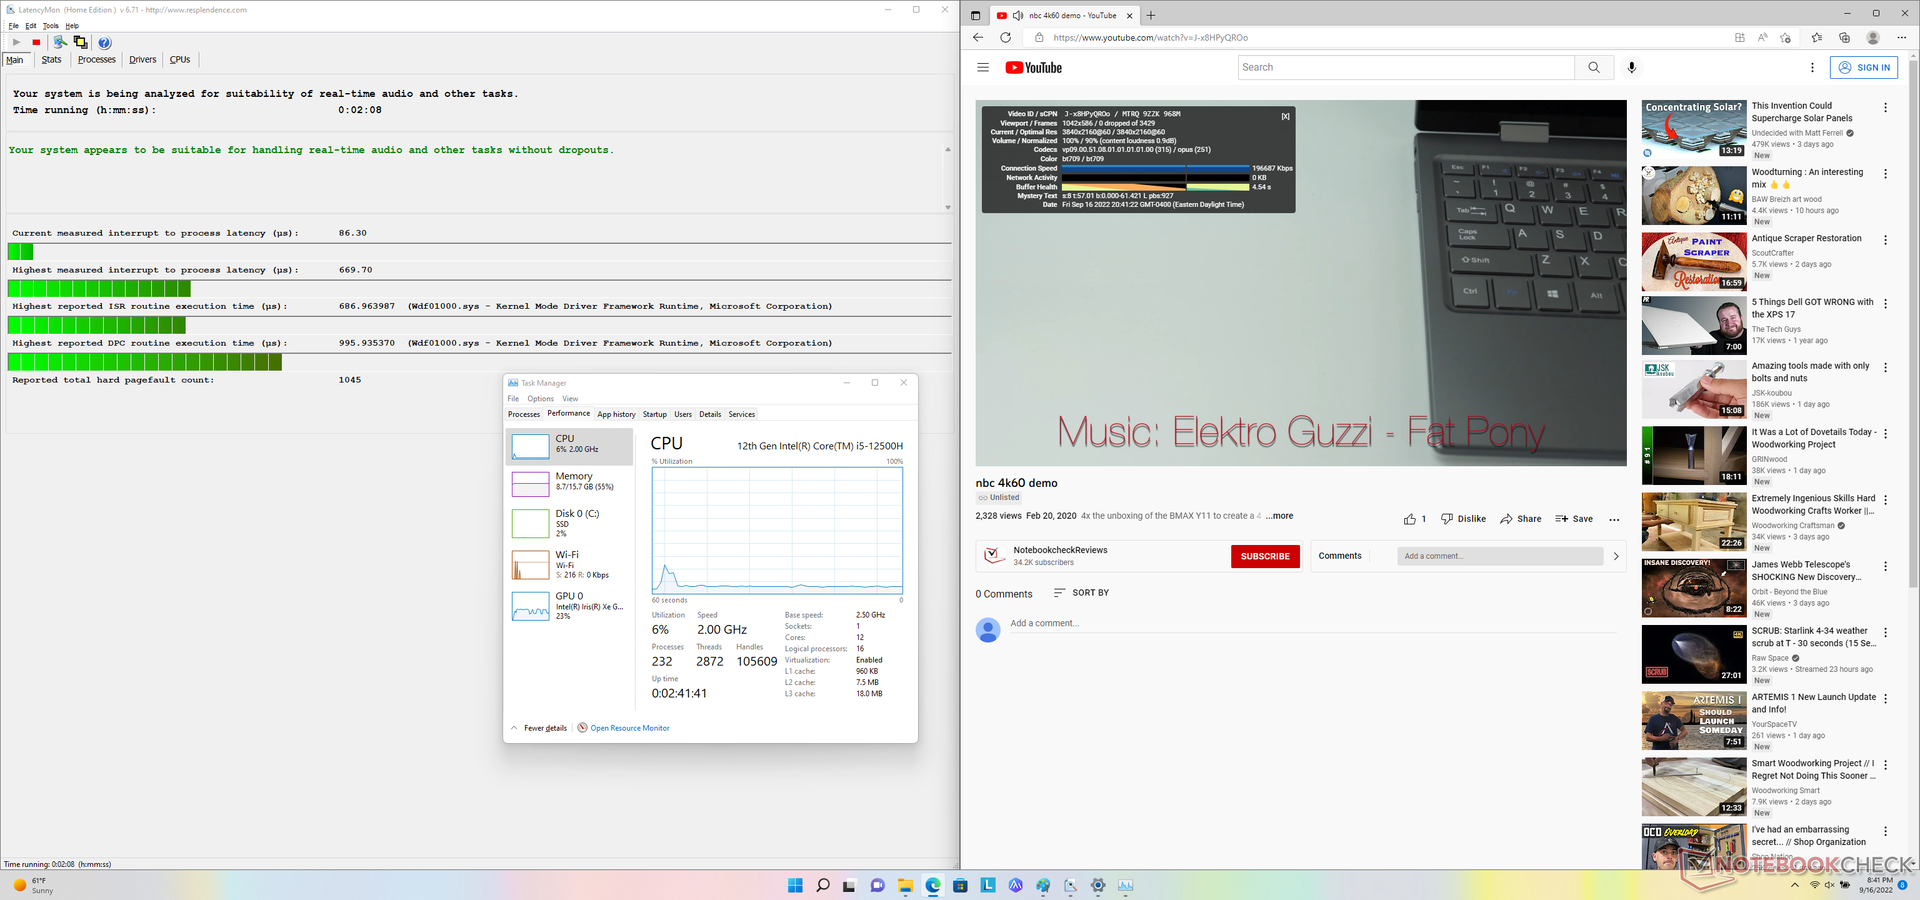
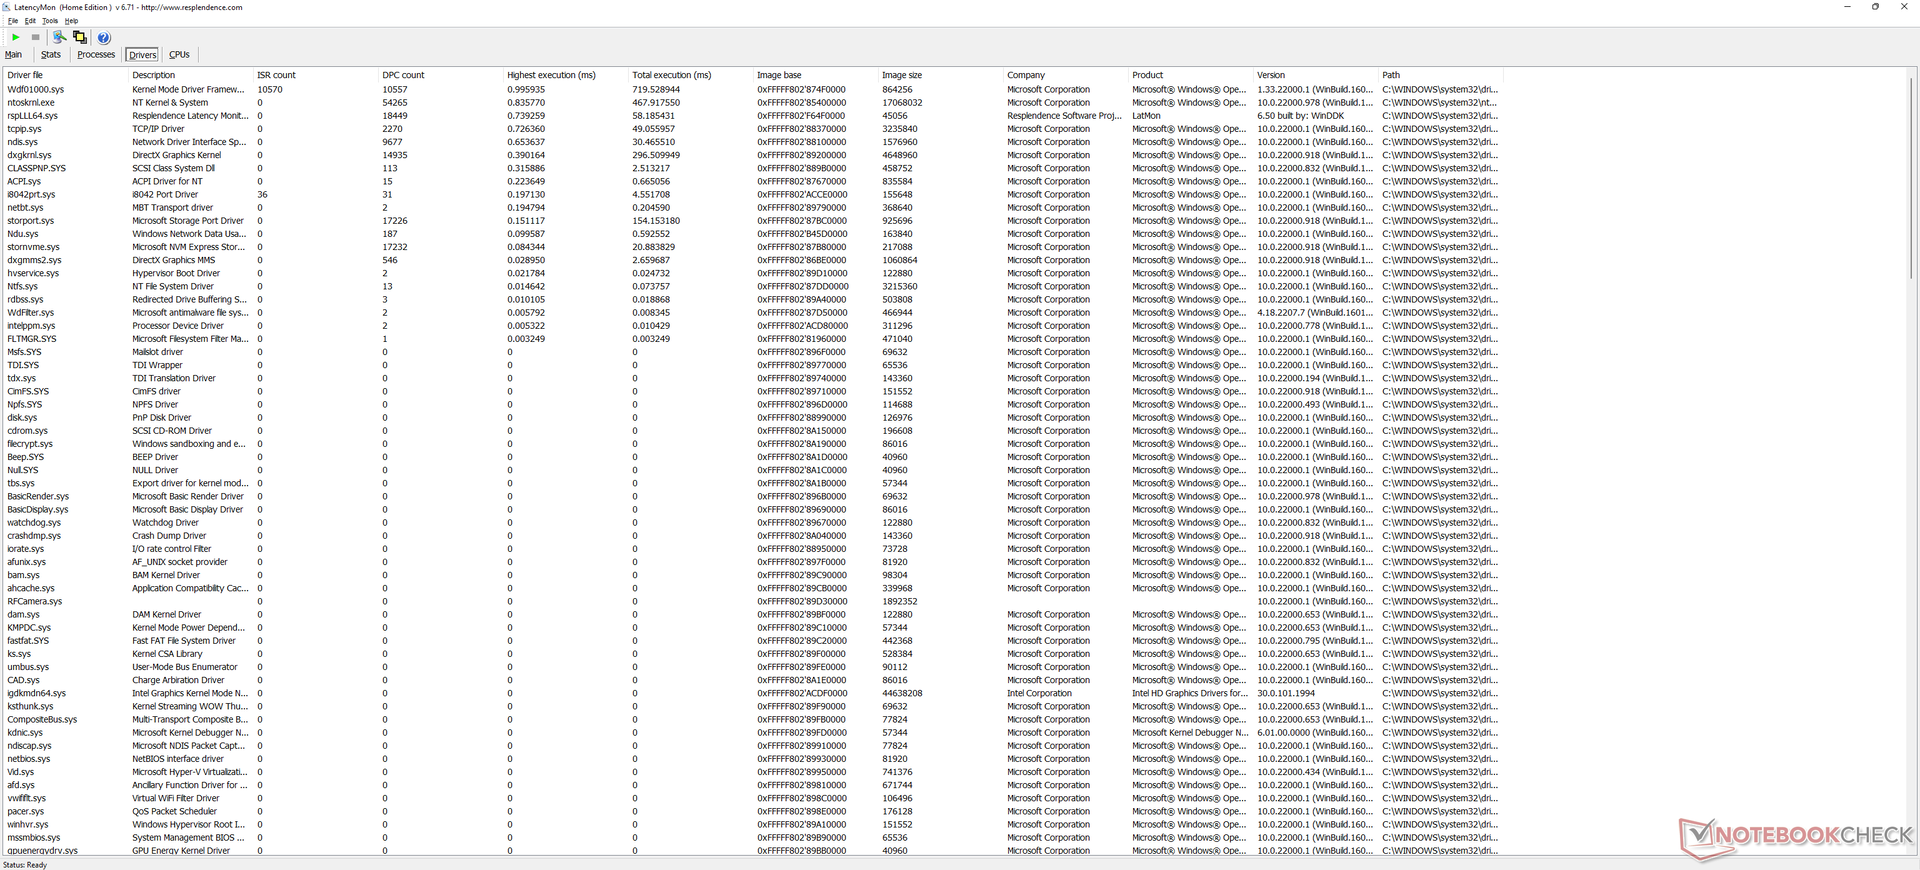
DPC-latenstid
LatencyMon visar inga större DPC-problem när vi öppnar flera webbläsarflikar på vår hemsida eller när vi kör Prime95 stress i 30 sekunder. uppspelning av 4K-video vid 60 FPS är också perfekt utan några tappade bilder.
| DPC Latencies / LatencyMon - interrupt to process latency (max), Web, Youtube, Prime95 | |
| Gigabyte Aero 17 HDR YD | |
| Lenovo ThinkBook Plus Gen2 Core i5 | |
| Dell XPS 17 9720 | |
| Lenovo ThinkBook Plus Gen3 | |
| LG Gram 17 (2022) | |
* ... mindre är bättre
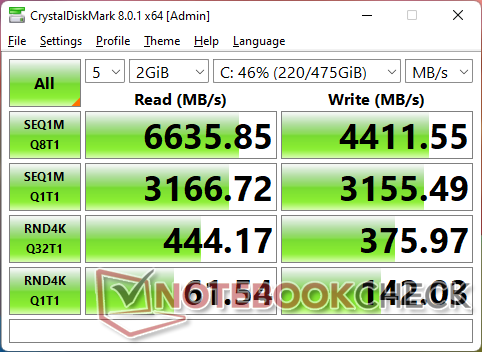
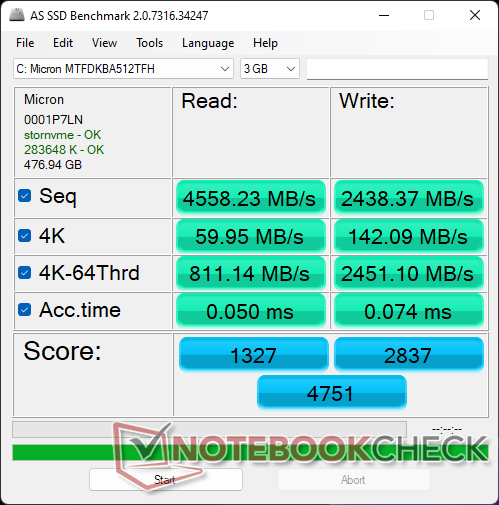
Lagringsenheter
Vår testenhet levereras med samma 512 GBMicron 3400 MTFDKBA512TFH SSD som finns på Dell XPS 17 9720. Även om enheten inte är lika snabb som Samsung PM9A1-serien uppvisar den inga problem med strypning och har en jämn prestandanivå även när den är stressad.

| Drive Performance rating - Percent | |
| Gigabyte Aero 17 HDR YD | |
| LG Gram 17 (2022) | |
| Lenovo ThinkBook Plus Gen2 Core i5 | |
| Dell XPS 17 9720 | |
| Lenovo ThinkBook Plus Gen3 | |
| Asus ProArt StudioBook Pro 17 W700G3T | |
* ... mindre är bättre
Disk Throttling: DiskSpd Read Loop, Queue Depth 8
GPU-prestanda - endast integrerad Iris Xe
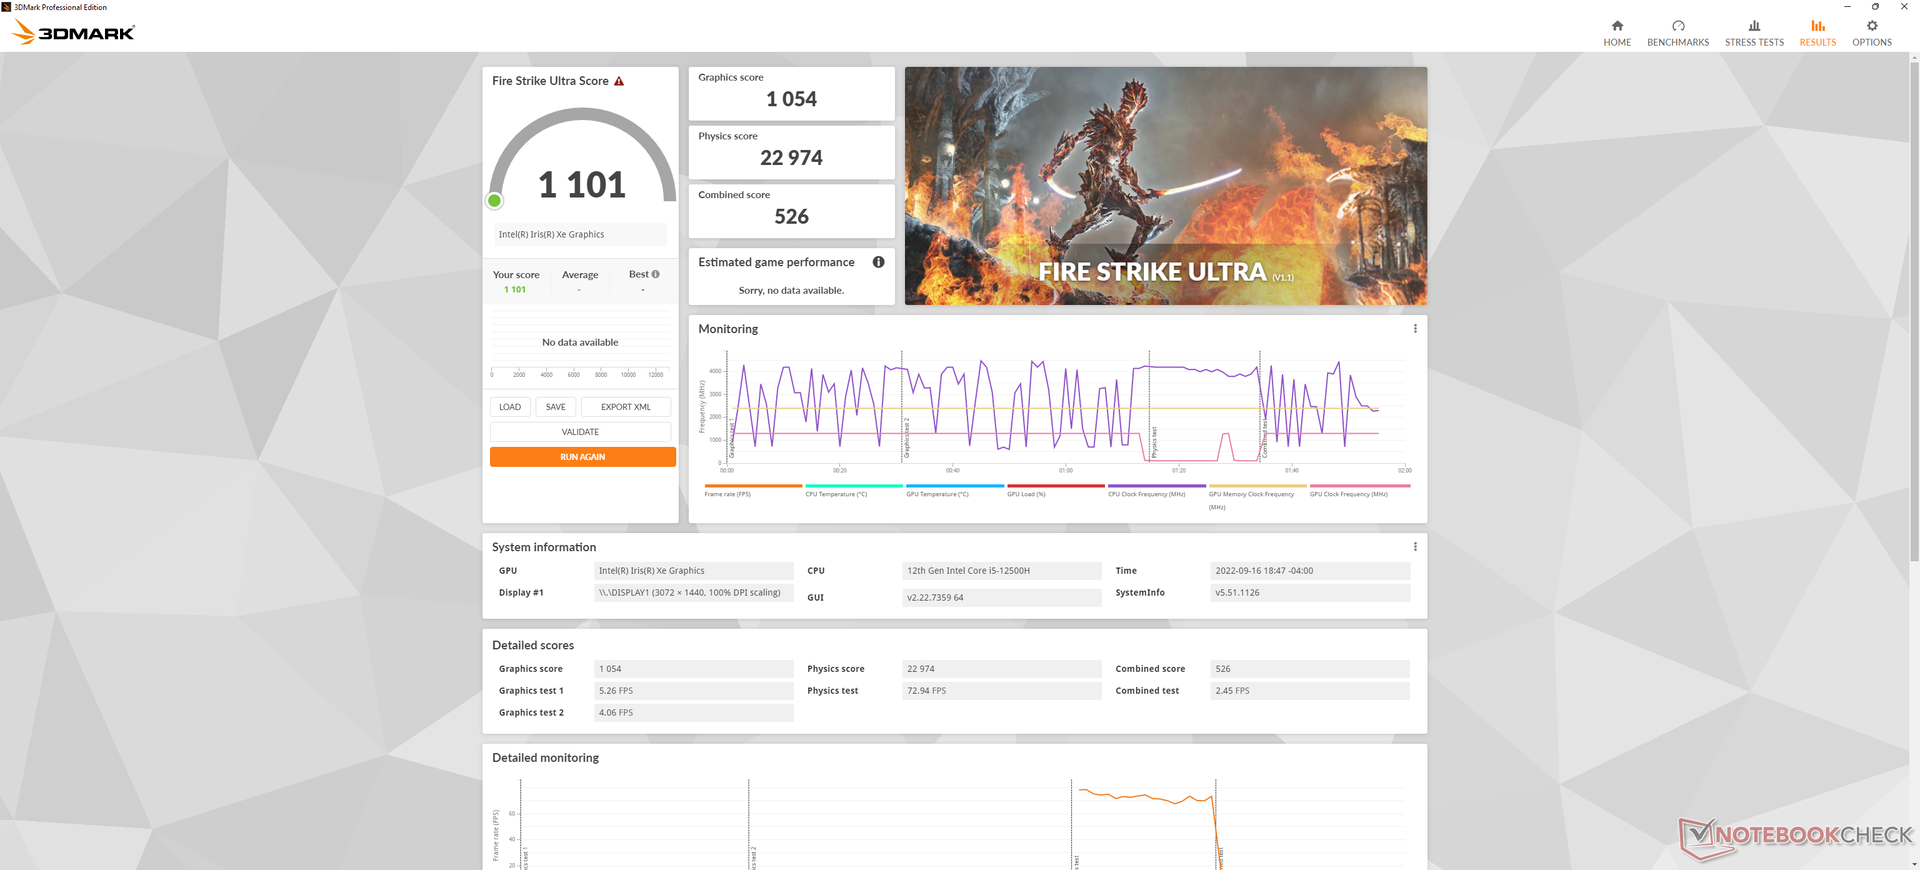
Den råa grafikprestandan är några procentenheter långsammare än den genomsnittliga bärbara datorn i vår databas med samma integrerade Iris Xe 96 EUs GPU. Det är synd att det inte finns några diskreta GeForce GTX/RTX- eller till och med MX-alternativ att välja mellan, vilket hade kunnat öka grafikprestandan avsevärt. Den integrerade Intel-lösningen är på den långsammare sidan om man beaktar den stora 17-tumskategorin.
| 3DMark | |
| 1920x1080 Fire Strike Graphics | |
| Asus ProArt StudioBook Pro 17 W700G3T | |
| Dell XPS 17 9720 | |
| Honor MagicBook 14 2022 | |
| Lenovo IdeaCentre AIO 3 24IAP7 | |
| Lenovo IdeaPad 5 Pro 16IHU6 | |
| Genomsnitt Intel Iris Xe Graphics G7 96EUs (2286 - 6624, n=222) | |
| Lenovo ThinkBook Plus Gen3 | |
| Asus Vivobook 15 K513EQ | |
| LG Gram 17 (2022) | |
| Lenovo ThinkBook Plus Gen2 Core i5 | |
| 2560x1440 Time Spy Graphics | |
| Dell XPS 17 9720 | |
| Asus ProArt StudioBook Pro 17 W700G3T | |
| Honor MagicBook 14 2022 | |
| Lenovo IdeaCentre AIO 3 24IAP7 | |
| Lenovo IdeaPad 5 Pro 16IHU6 | |
| Genomsnitt Intel Iris Xe Graphics G7 96EUs (707 - 1890, n=218) | |
| LG Gram 17 (2022) | |
| Lenovo ThinkBook Plus Gen3 | |
| Asus Vivobook 15 K513EQ | |
| Lenovo ThinkBook Plus Gen2 Core i5 | |
| 2560x1440 Time Spy Score | |
| Dell XPS 17 9720 | |
| Asus ProArt StudioBook Pro 17 W700G3T | |
| Honor MagicBook 14 2022 | |
| Lenovo IdeaCentre AIO 3 24IAP7 | |
| Lenovo IdeaPad 5 Pro 16IHU6 | |
| Genomsnitt Intel Iris Xe Graphics G7 96EUs (789 - 2159, n=215) | |
| Lenovo ThinkBook Plus Gen3 | |
| LG Gram 17 (2022) | |
| Asus Vivobook 15 K513EQ | |
| Lenovo ThinkBook Plus Gen2 Core i5 | |
| 3DMark 11 - 1280x720 Performance GPU | |
| Dell XPS 17 9720 | |
| Asus ProArt StudioBook Pro 17 W700G3T | |
| Honor MagicBook 14 2022 | |
| Lenovo IdeaCentre AIO 3 24IAP7 | |
| Lenovo IdeaPad 5 Pro 16IHU6 | |
| Genomsnitt Intel Iris Xe Graphics G7 96EUs (2867 - 7676, n=209) | |
| Asus Vivobook 15 K513EQ | |
| Lenovo ThinkBook Plus Gen3 | |
| LG Gram 17 (2022) | |
| Lenovo ThinkBook Plus Gen2 Core i5 | |
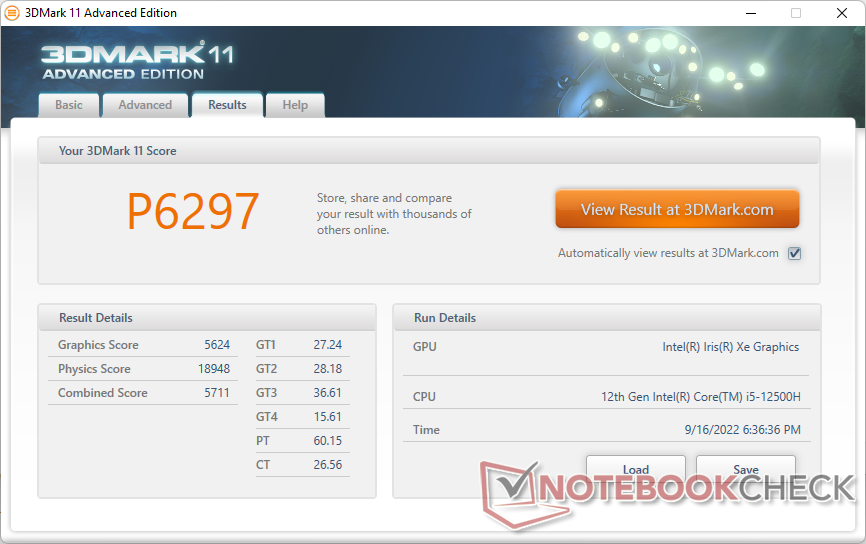
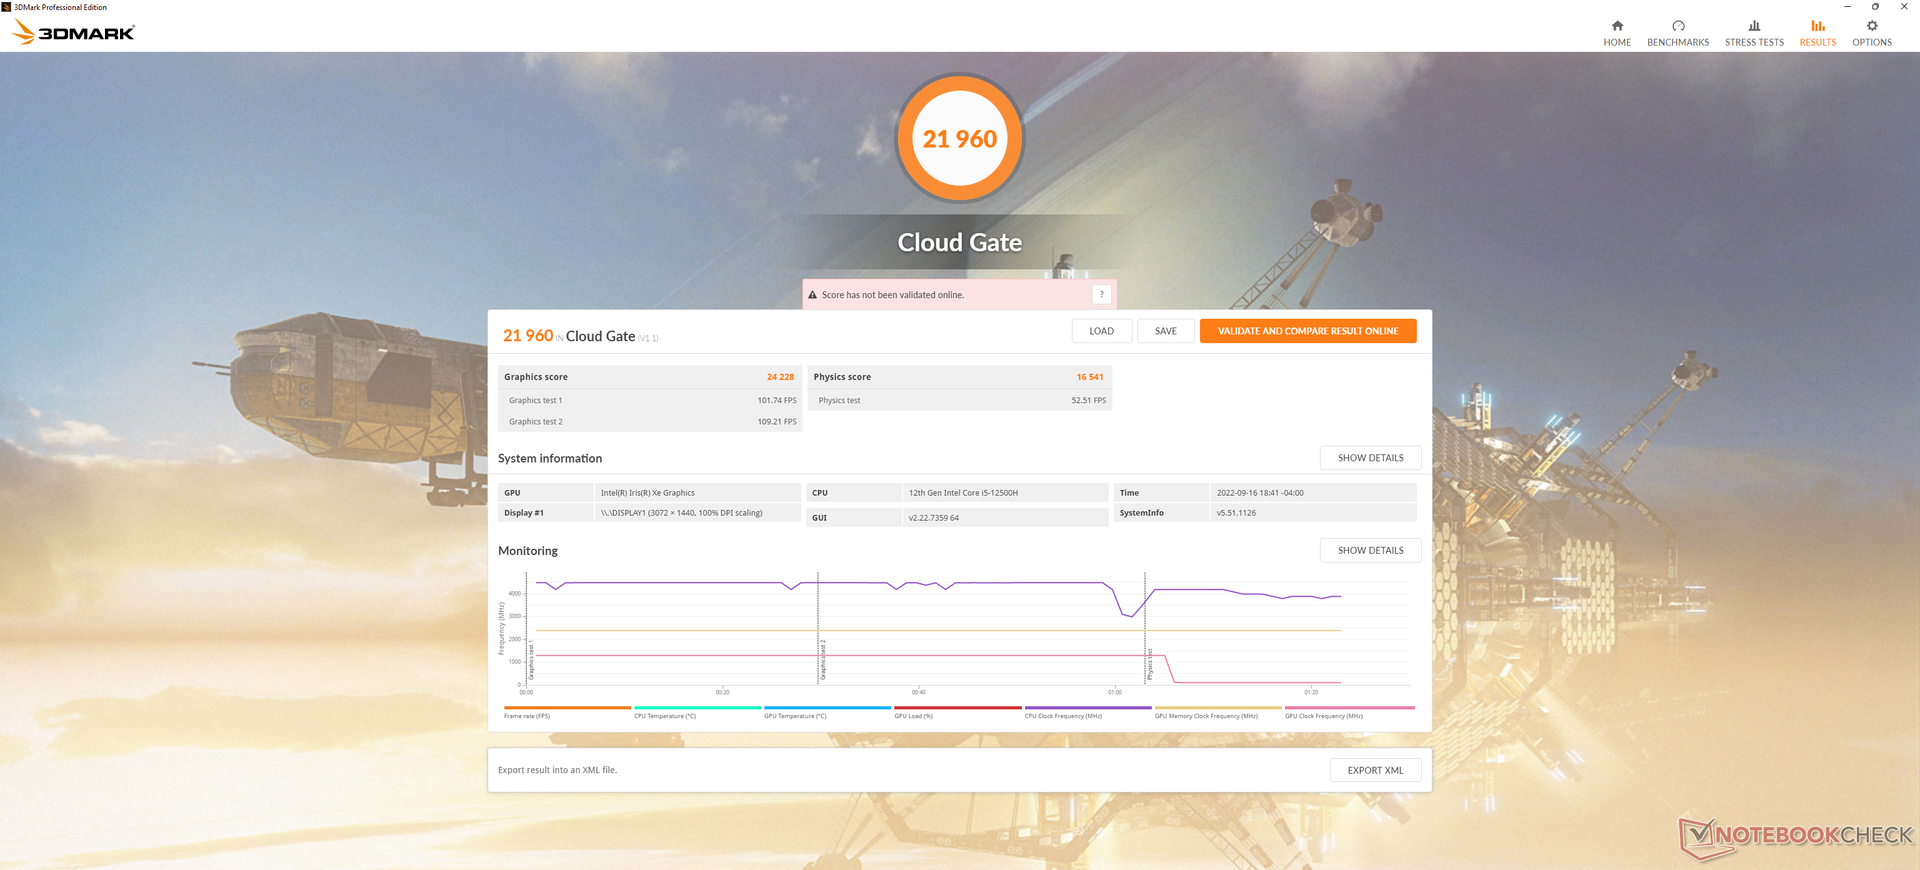
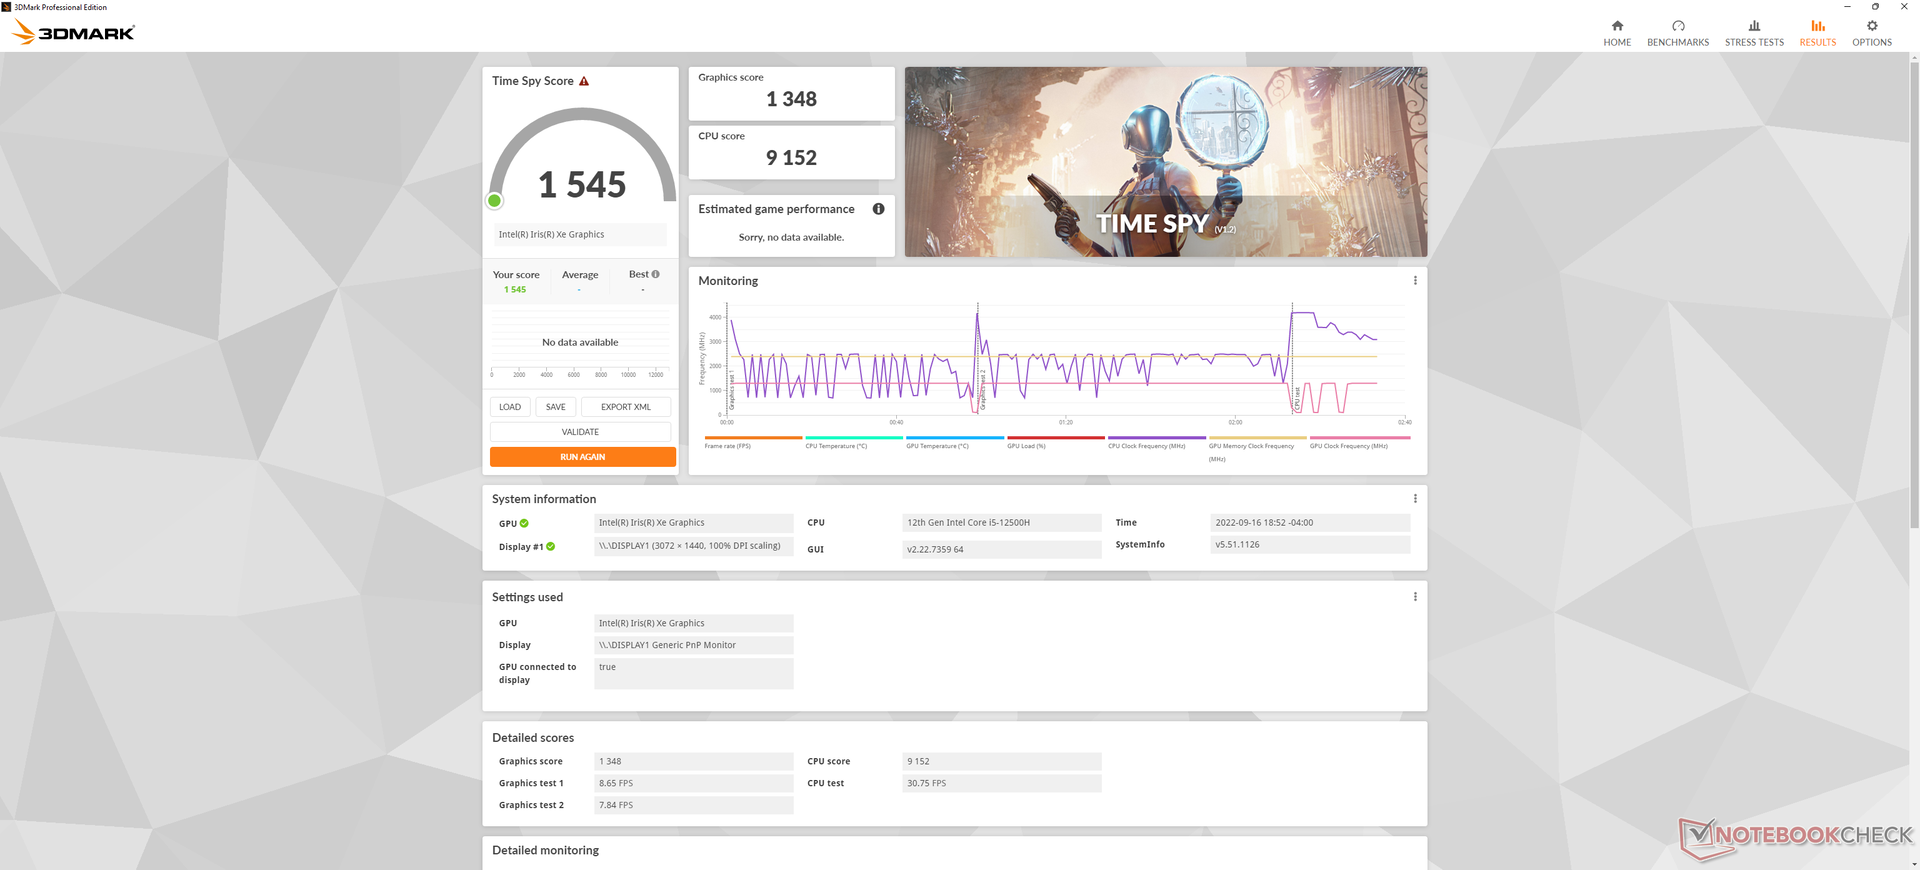
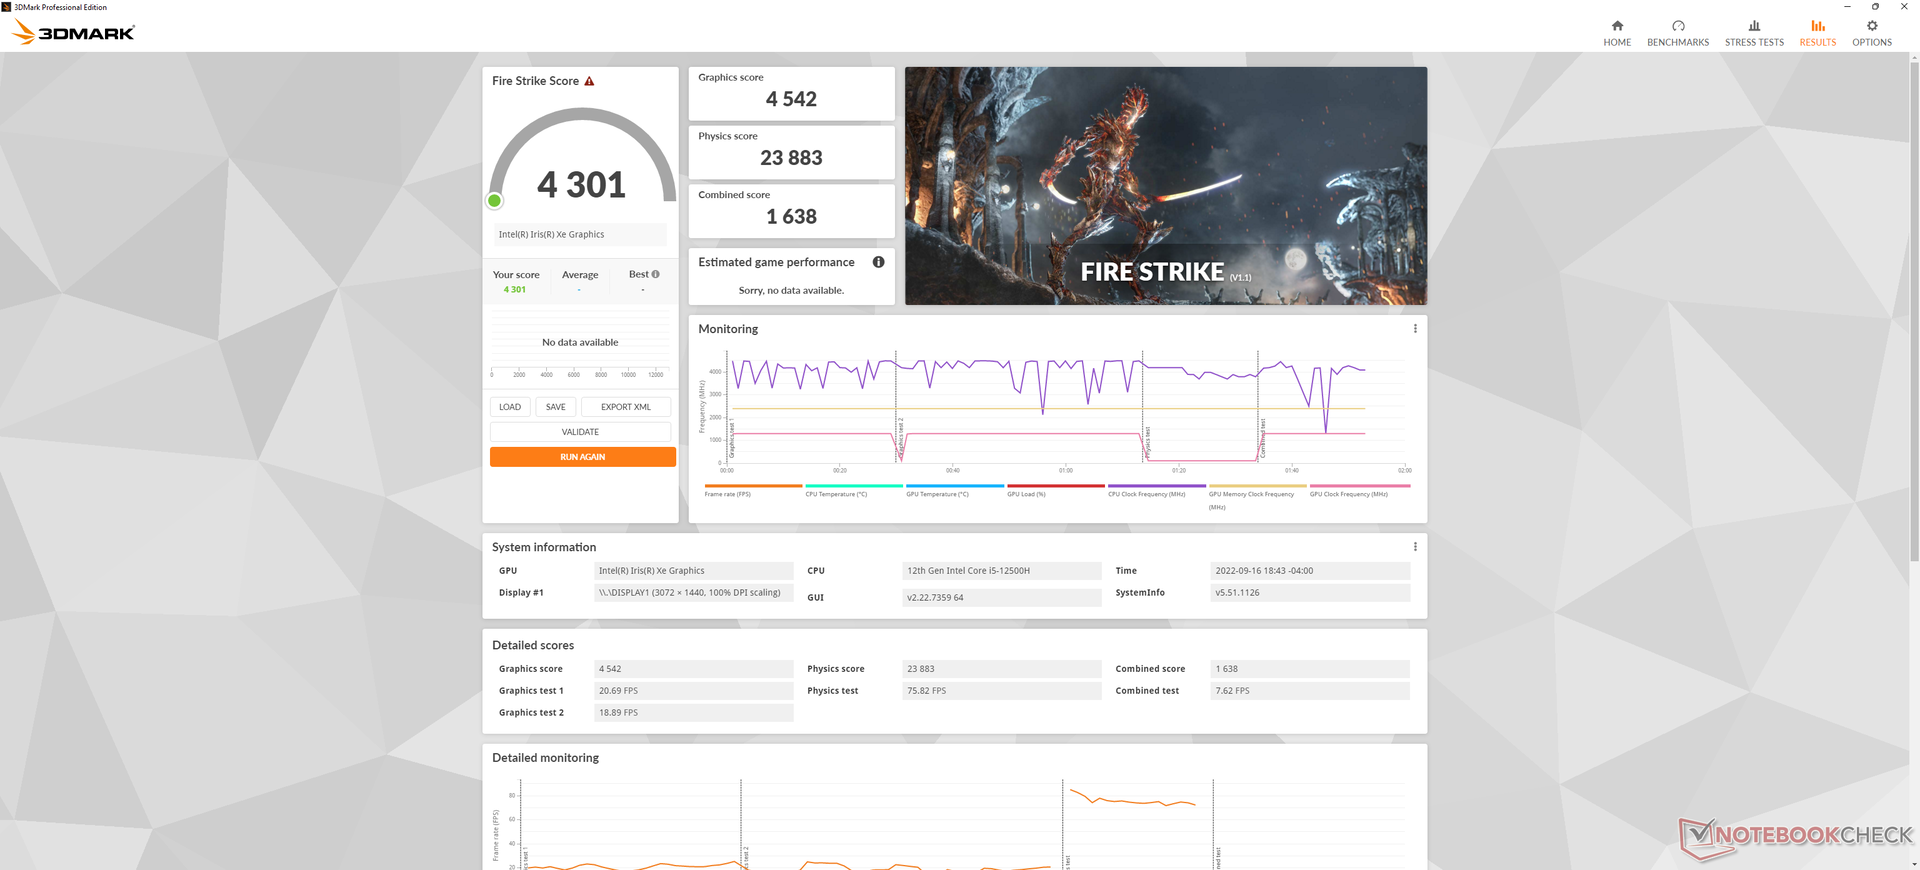
| 3DMark 11 Performance | 6297 poäng | |
| 3DMark Cloud Gate Standard Score | 21960 poäng | |
| 3DMark Fire Strike Score | 4301 poäng | |
| 3DMark Time Spy Score | 1545 poäng | |
Hjälp | ||
| X-Plane 11.11 | |
| 1280x720 low (fps_test=1) | |
| Dell XPS 17 9720 | |
| Honor MagicBook 14 2022 | |
| Asus ProArt StudioBook Pro 17 W700G3T | |
| Lenovo IdeaCentre AIO 3 24IAP7 | |
| Lenovo IdeaPad 5 Pro 16IHU6 | |
| Asus Vivobook 15 K513EQ | |
| Lenovo ThinkBook Plus Gen3 | |
| Genomsnitt Intel Iris Xe Graphics G7 96EUs (13.4 - 88.4, n=213) | |
| LG Gram 17 (2022) | |
| Lenovo ThinkBook Plus Gen2 Core i5 | |
| 1920x1080 med (fps_test=2) | |
| Dell XPS 17 9720 | |
| Honor MagicBook 14 2022 | |
| Asus ProArt StudioBook Pro 17 W700G3T | |
| Lenovo IdeaCentre AIO 3 24IAP7 | |
| Lenovo IdeaPad 5 Pro 16IHU6 | |
| Asus Vivobook 15 K513EQ | |
| Genomsnitt Intel Iris Xe Graphics G7 96EUs (11.6 - 69.5, n=214) | |
| Lenovo ThinkBook Plus Gen3 | |
| LG Gram 17 (2022) | |
| Lenovo ThinkBook Plus Gen2 Core i5 | |
| 1920x1080 high (fps_test=3) | |
| Dell XPS 17 9720 | |
| Honor MagicBook 14 2022 | |
| Asus ProArt StudioBook Pro 17 W700G3T | |
| Lenovo IdeaCentre AIO 3 24IAP7 | |
| Lenovo IdeaPad 5 Pro 16IHU6 | |
| Asus Vivobook 15 K513EQ | |
| Genomsnitt Intel Iris Xe Graphics G7 96EUs (11.1 - 59.8, n=213) | |
| Lenovo ThinkBook Plus Gen3 | |
| LG Gram 17 (2022) | |
| Lenovo ThinkBook Plus Gen2 Core i5 | |
Witcher 3 FPS Chart
| låg | med. | hög | ultra | |
|---|---|---|---|---|
| GTA V (2015) | 100.1 | 60.9 | 20 | 8.96 |
| The Witcher 3 (2015) | 87.1 | 51.2 | 30.4 | 13.4 |
| Dota 2 Reborn (2015) | 126 | 94.1 | 48.6 | 44.9 |
| Final Fantasy XV Benchmark (2018) | 39 | 21.3 | 16.8 | |
| X-Plane 11.11 (2018) | 43.5 | 34 | 30.4 | |
| Strange Brigade (2018) | 74.6 | 32 | 25.5 | 20.2 |
| Cyberpunk 2077 1.6 (2022) | 16 | 13.4 | 10.6 | 8.6 |
Utsläpp
Systemljud - högt ljud vid belastning
Fläktljudet vid tomgång på skrivbordet varierar mellan 26 och 28 dB(A) beroende på effektprofilen mot en tyst bakgrund på 22,7 dB(A). De interna fläktarna är alltså aldrig riktigt tysta i de flesta scenarier, vilket kanske är konsekvensen av att använda en CPU i Core H-serien istället för det långsammare men effektivare Core U-alternativet. Fläktarna tenderar att pulsa upp till 35 dB(A) om man surfar på webben eller ordbehandlar i läget Extreme Performance och därför rekommenderar vi balanserat eller läget "Intelligent Cooling" när man kör kravlösa program.
Om du kör högre belastningar som spel inducerar du ett fläktljud på mellan 39 och 43 dB(A), vilket är mycket högre än på den mindre ThinkBook Plus Gen 2.
Ljudnivå
| Låg belastning |
| 26.3 / 26.3 / 27.9 dB(A) |
| Hög belastning |
| 42.2 / 46.5 dB(A) |
 | ||
30 dB tyst 40 dB(A) hörbar 50 dB(A) högt ljud |
||
min: | ||
| Lenovo ThinkBook Plus Gen3 Iris Xe G7 96EUs, i7-12700H, Micron 3400 MTFDKBA512TFH 512GB | Lenovo ThinkBook Plus Gen2 Core i5 Iris Xe G7 80EUs, i5-1130G7, Samsung PM9A1 MZVL2512HCJQ | Asus ProArt StudioBook Pro 17 W700G3T Quadro RTX 3000 Max-Q, i7-9750H, Samsung SSD PM981 MZVLB1T0HALR | LG Gram 17 (2022) Iris Xe G7 80EUs, i5-1240P, Samsung PM9A1 MZVL2512HCJQ | Dell XPS 17 9720 GeForce RTX 3050 4GB Laptop GPU, i7-12700H, Micron 3400 MTFDKBA512TFH 512GB | Gigabyte Aero 17 HDR YD GeForce RTX 3080 Laptop GPU, i9-11980HK, Samsung PM9A1 MZVL2512HCJQ | |
|---|---|---|---|---|---|---|
| Noise | 6% | 2% | 6% | -1% | -21% | |
| av / miljö * (dB) | 22.7 | 25.4 -12% | 29.4 -30% | 25.1 -11% | 24 -6% | 25 -10% |
| Idle Minimum * (dB) | 26.3 | 25.4 3% | 29.4 -12% | 25.12 4% | 24 9% | 30 -14% |
| Idle Average * (dB) | 26.3 | 27.4 -4% | 29.9 -14% | 25.15 4% | 24 9% | 32 -22% |
| Idle Maximum * (dB) | 27.9 | 32.2 -15% | 29.9 -7% | 26 7% | 24 14% | 41 -47% |
| Load Average * (dB) | 42.2 | 32.2 24% | 31.6 25% | 36.9 13% | 43.9 -4% | 43 -2% |
| Witcher 3 ultra * (dB) | 39.8 | 32.2 19% | 31.6 21% | 48.4 -22% | 51 -28% | |
| Load Maximum * (dB) | 46.5 | 34.5 26% | 31.6 32% | 37.2 20% | 48.4 -4% | 59 -27% |
* ... mindre är bättre
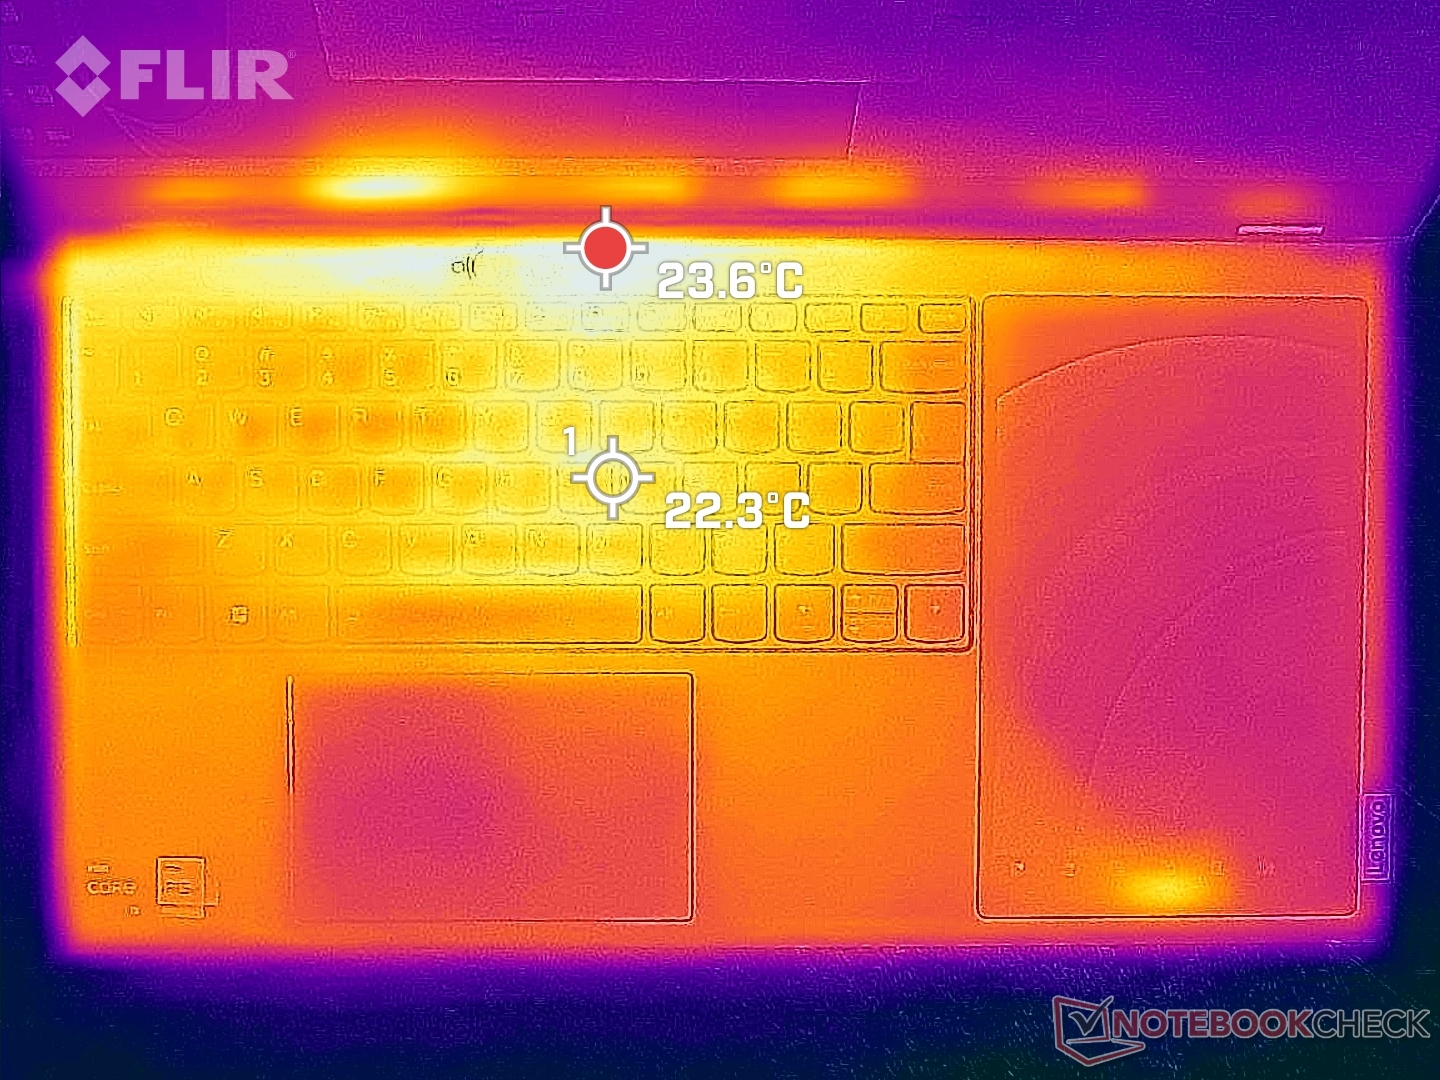
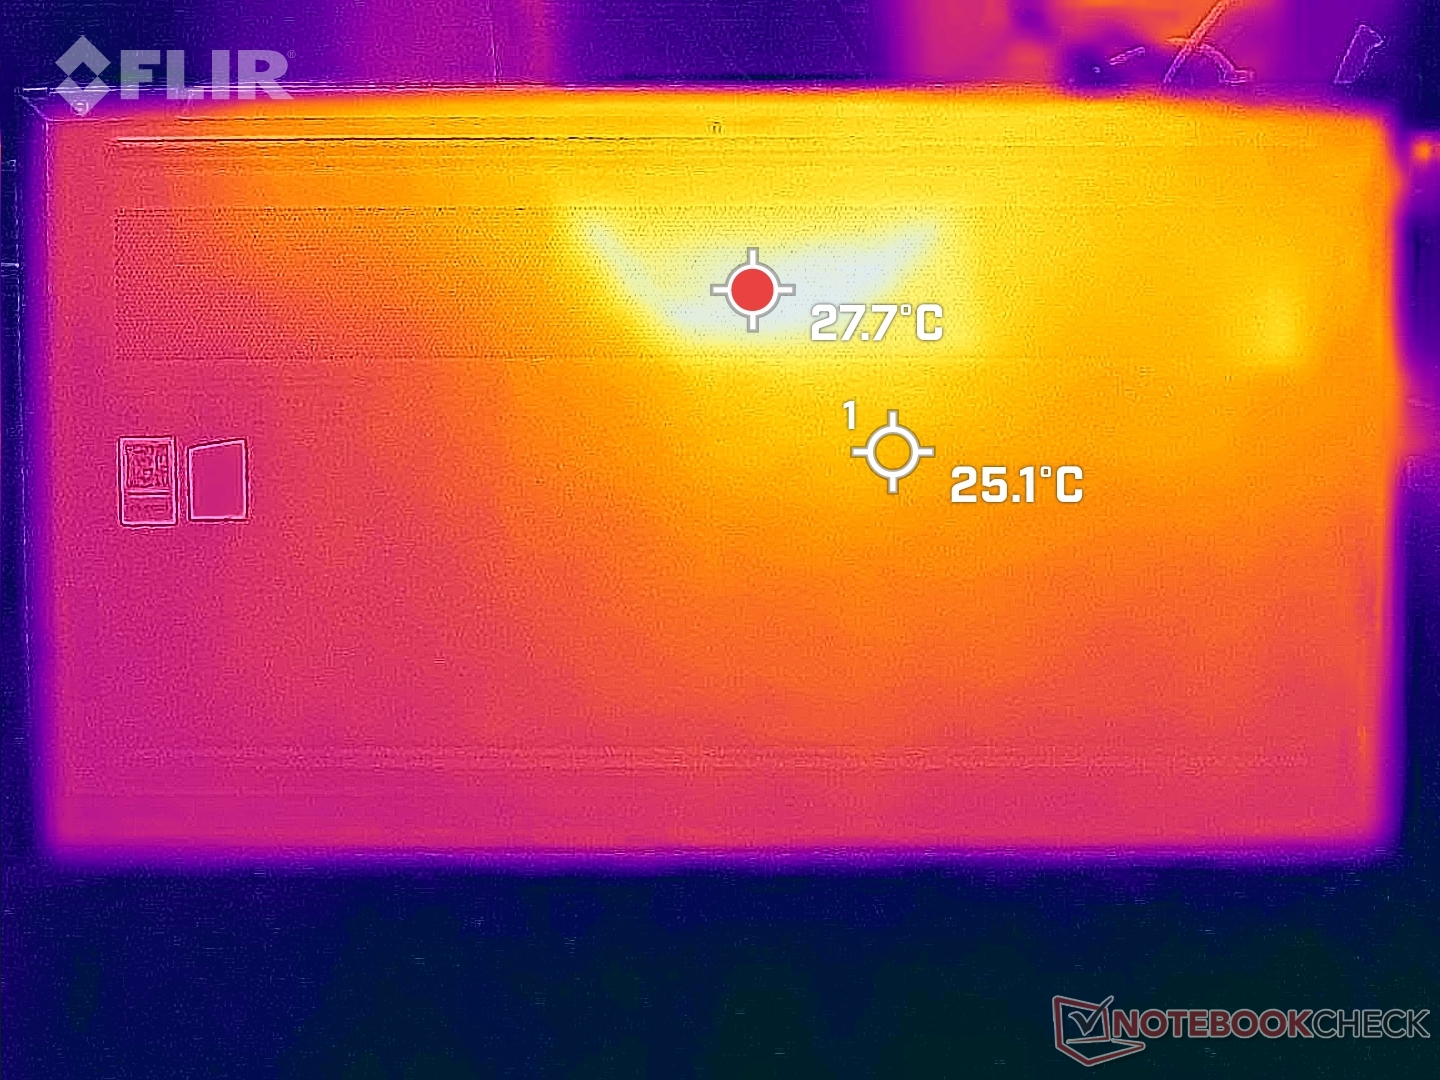
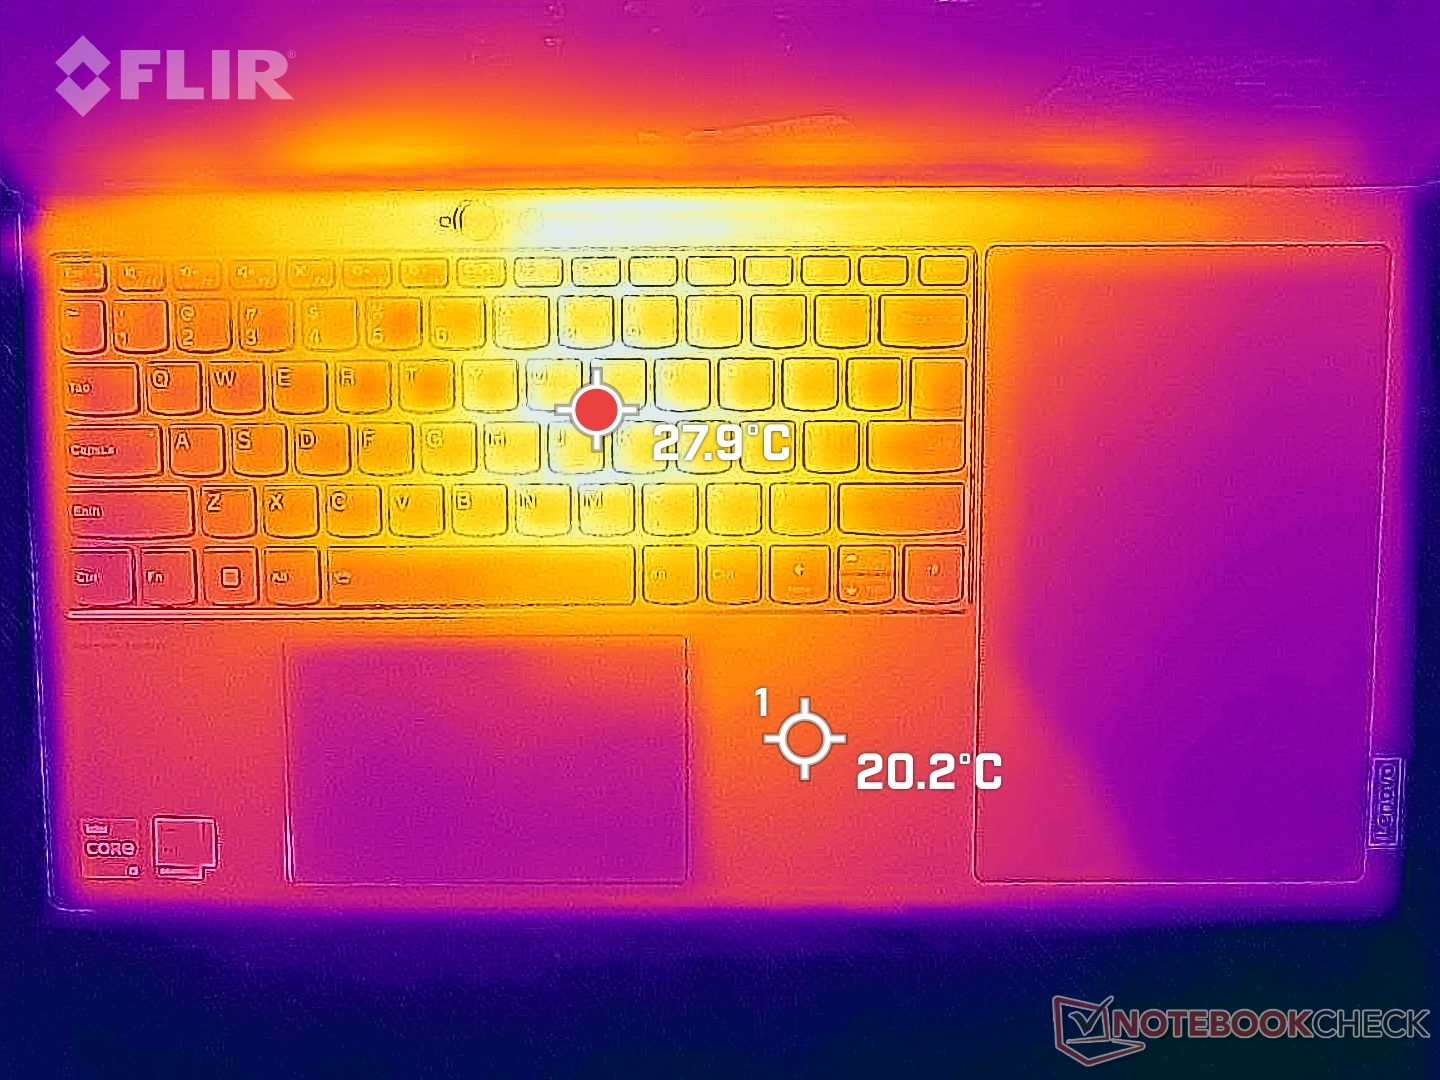
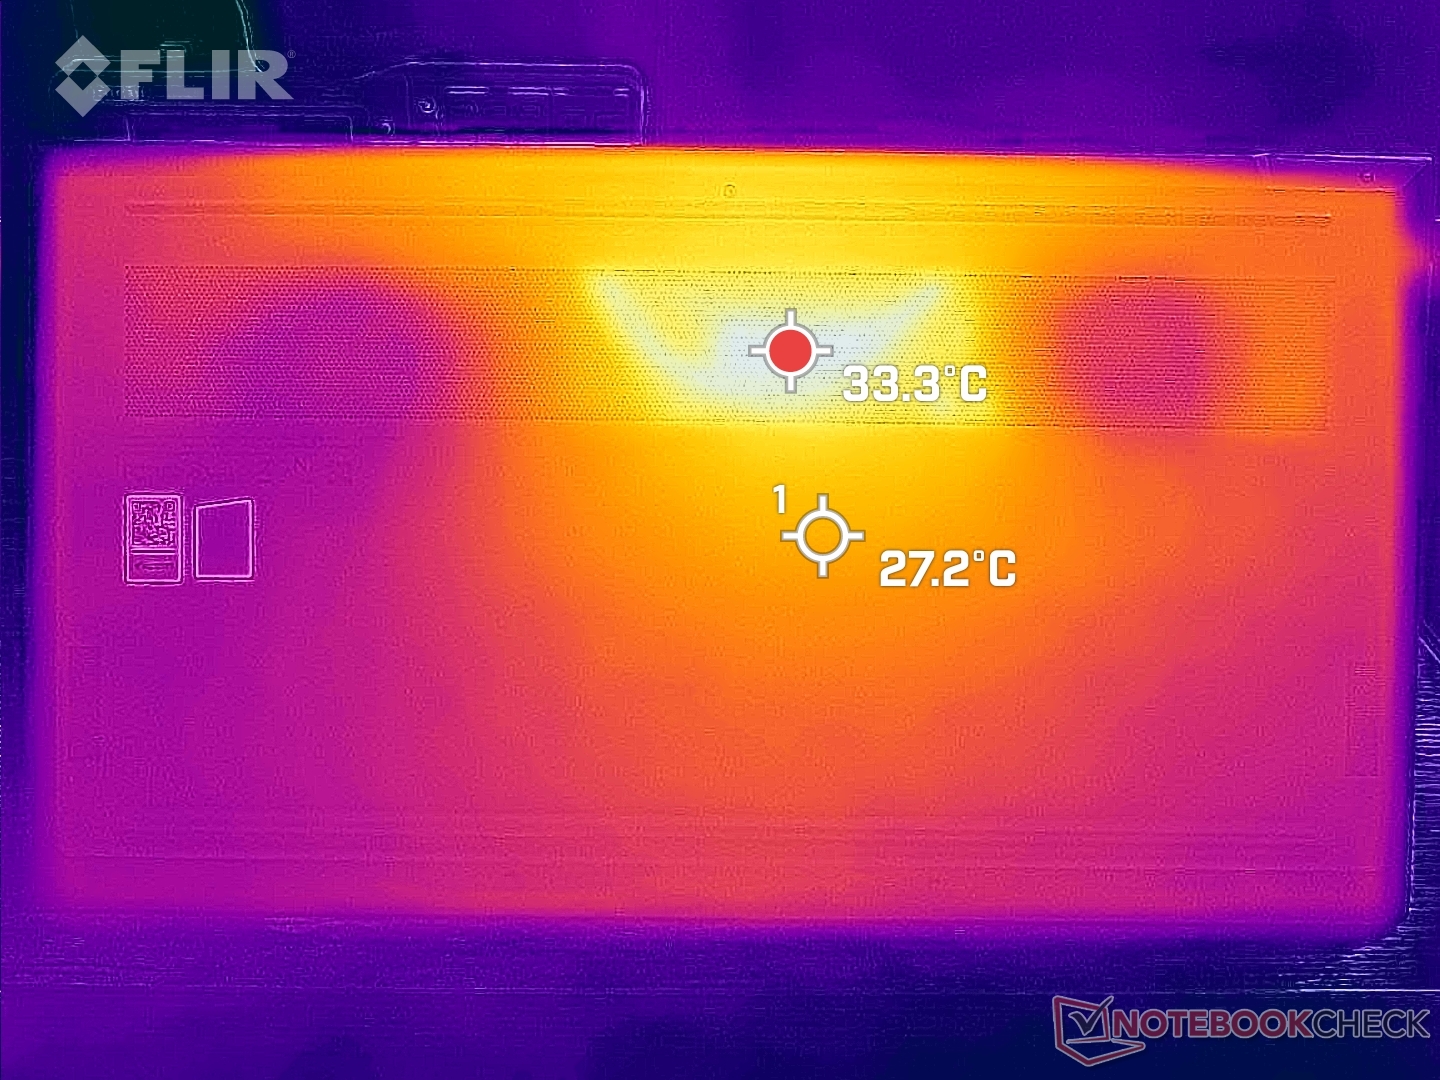
Temperatur - ganska häftigt
Yttemperaturerna är svalare än förväntat även vid krävande belastningar. De heta punkterna är endast cirka 33 C på toppen respektive botten, jämfört med 50 C eller varmare på LG Gram 17 under liknande förhållanden. Den större ytan i det breda bildförhållandet 21:10 har en positiv effekt på den totala temperaturutvecklingen.
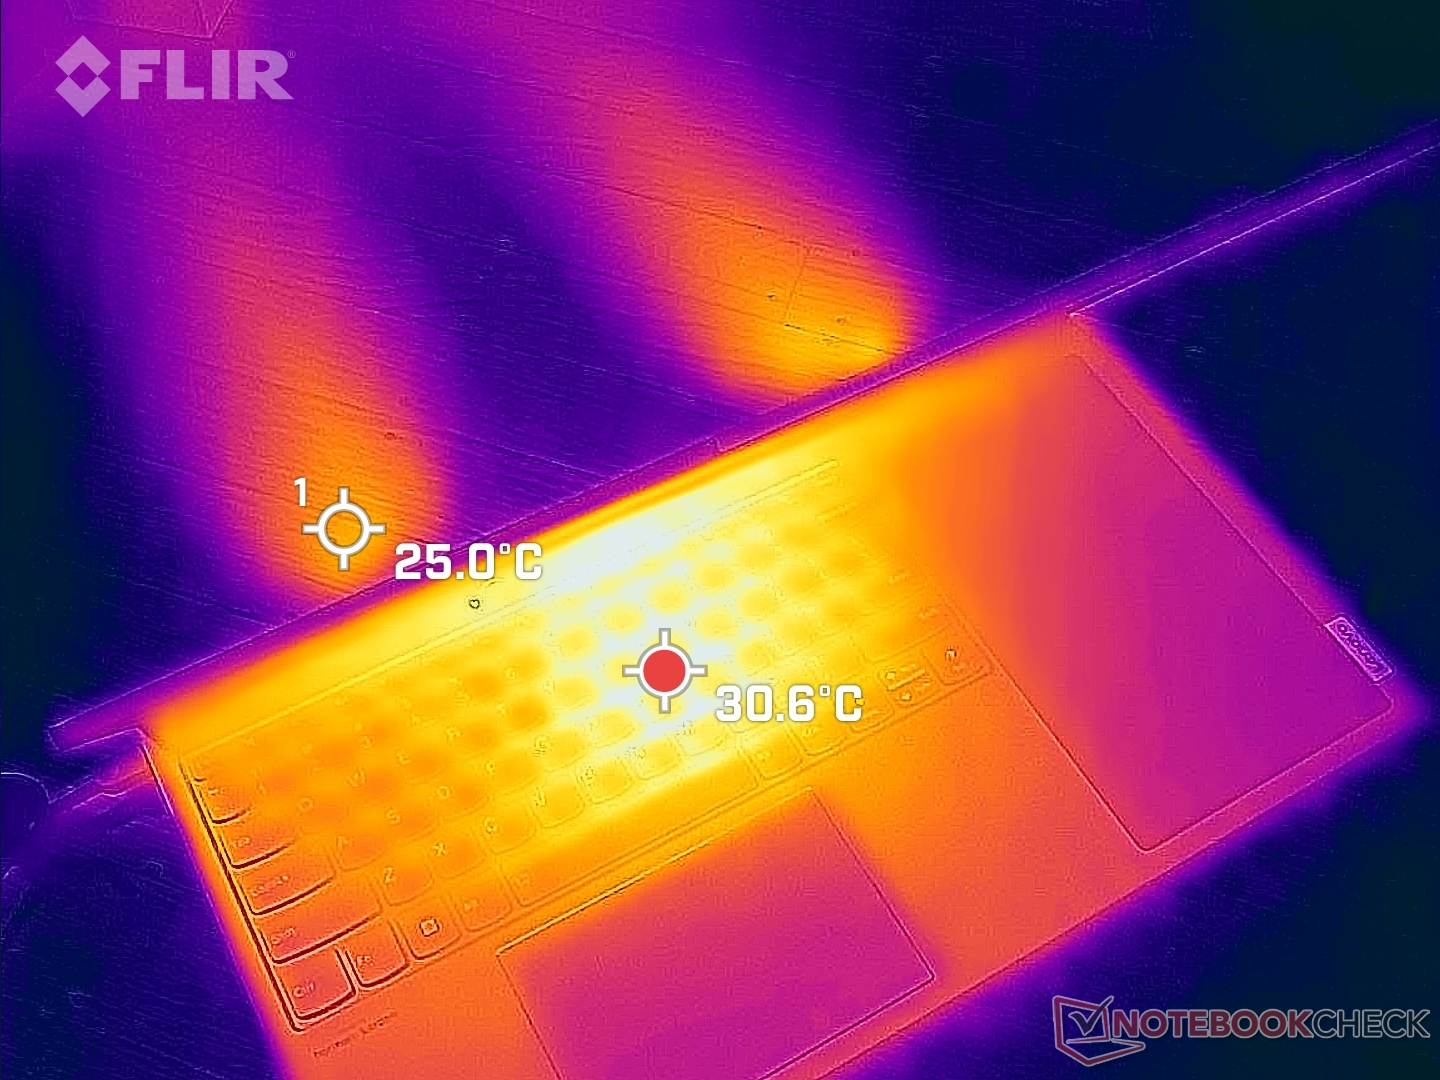
(+) Den maximala temperaturen på ovansidan är 33.2 °C / 92 F, jämfört med genomsnittet av 34.3 °C / 94 F , allt från 21.2 till 62.5 °C för klassen Office.
(+) Botten värms upp till maximalt 32.8 °C / 91 F, jämfört med genomsnittet av 36.8 °C / 98 F
(+) Vid tomgångsbruk är medeltemperaturen för ovansidan 27.2 °C / 81 F, jämfört med enhetsgenomsnittet på 29.5 °C / ### class_avg_f### F.
(+) Handledsstöden och pekplattan är kallare än hudtemperaturen med maximalt 26.4 °C / 79.5 F och är därför svala att ta på.
(±) Medeltemperaturen för handledsstödsområdet på liknande enheter var 27.6 °C / 81.7 F (+1.2 °C / 2.2 F).
| Lenovo ThinkBook Plus Gen3 Intel Core i7-12700H, Intel Iris Xe Graphics G7 96EUs | Lenovo ThinkBook Plus Gen2 Core i5 Intel Core i5-1130G7, Intel Iris Xe Graphics G7 80EUs | Asus ProArt StudioBook Pro 17 W700G3T Intel Core i7-9750H, NVIDIA Quadro RTX 3000 Max-Q | LG Gram 17 (2022) Intel Core i5-1240P, Intel Iris Xe Graphics G7 80EUs | Dell XPS 17 9720 Intel Core i7-12700H, NVIDIA GeForce RTX 3050 4GB Laptop GPU | Gigabyte Aero 17 HDR YD Intel Core i9-11980HK, NVIDIA GeForce RTX 3080 Laptop GPU | |
|---|---|---|---|---|---|---|
| Heat | -17% | -12% | -30% | -13% | -32% | |
| Maximum Upper Side * (°C) | 33.2 | 42 -27% | 45.4 -37% | 50 -51% | 49.5 -49% | 44 -33% |
| Maximum Bottom * (°C) | 32.8 | 44.5 -36% | 53.7 -64% | 50 -52% | 38.4 -17% | 56 -71% |
| Idle Upper Side * (°C) | 29.8 | 29.8 -0% | 22.2 26% | 31.5 -6% | 28 6% | 32 -7% |
| Idle Bottom * (°C) | 30.4 | 31.9 -5% | 21.8 28% | 33.5 -10% | 27.8 9% | 35 -15% |
* ... mindre är bättre
Stresstest
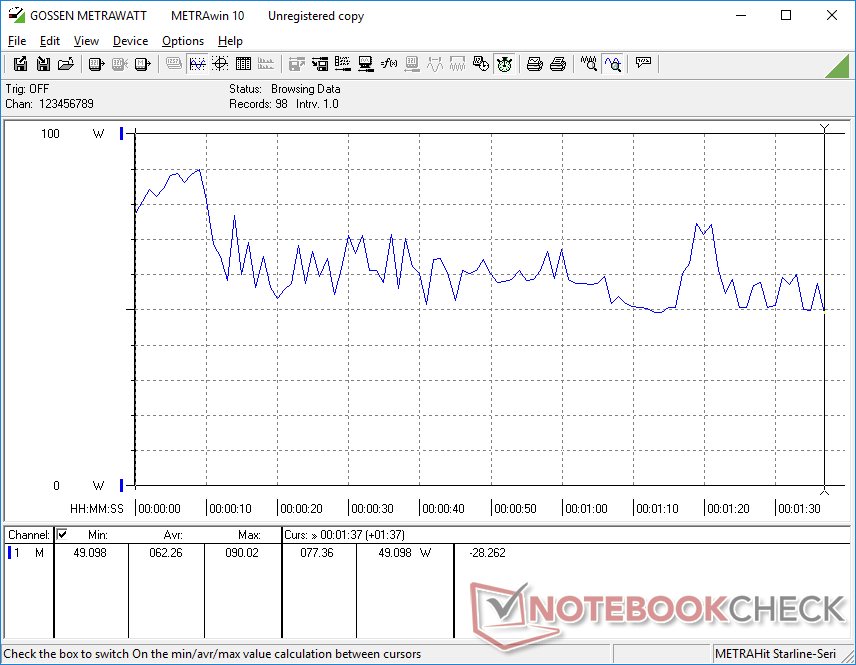
När Prime95 kördes för att stressa CPU:n, steg klockfrekvensen och strömförbrukningen på kortet till 3,6 GHz respektive 80 W, vilket bara varade i några sekunder och nådde en kärntemperatur på 98 C. Klockfrekvensen och strömförbrukningen på kortet sjönk sedan snabbt till 3 GHz och 60 W för att till slut stabiliseras på 2,8 GHz respektive 52 W och hålla kärntemperaturen strax under 90 C. Att upprepa det här testet på XPS 17 med samma Core i7-12700H CPU resulterade i liknande klockfrekvenser, men med en svalare kärntemperatur på 75 C.
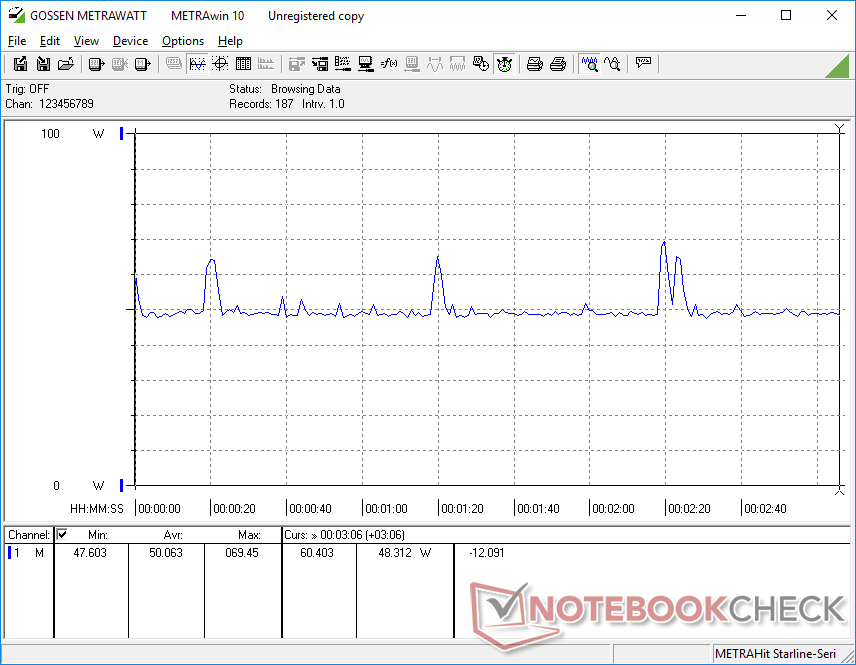
GPU-klockfrekvens och temperatur vid körning Witcher 3 skulle stabiliseras vid 1297 MHz respektive 85 C, vilket är ett vanligt intervall för tunna bärbara multimediadatorer med Core H-drift som t.ex Dell Inspiron 16 Plus 7620.
Att köra på batteri påverkar prestandan. En 3DMark 11-körning på batterier skulle ge fysik- och grafikresultat på 16704 respektive 5421 poäng, jämfört med 18948 respektive 6524 poäng när det är på strömförsörjning.
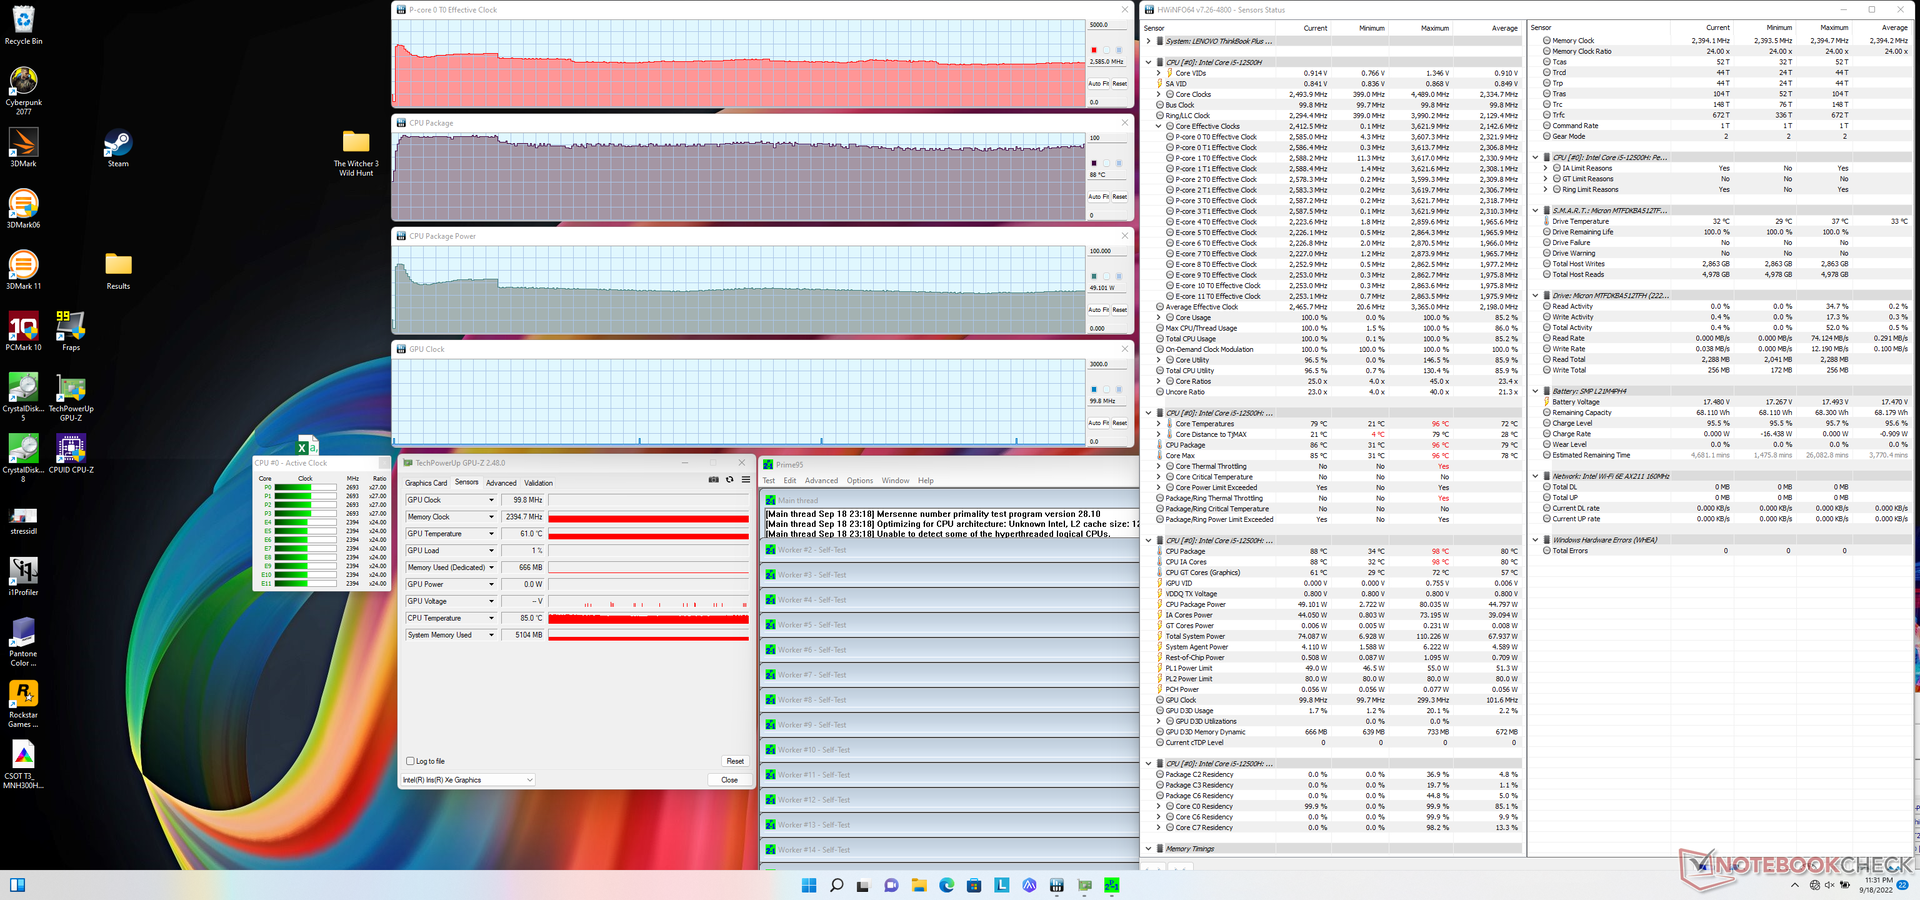
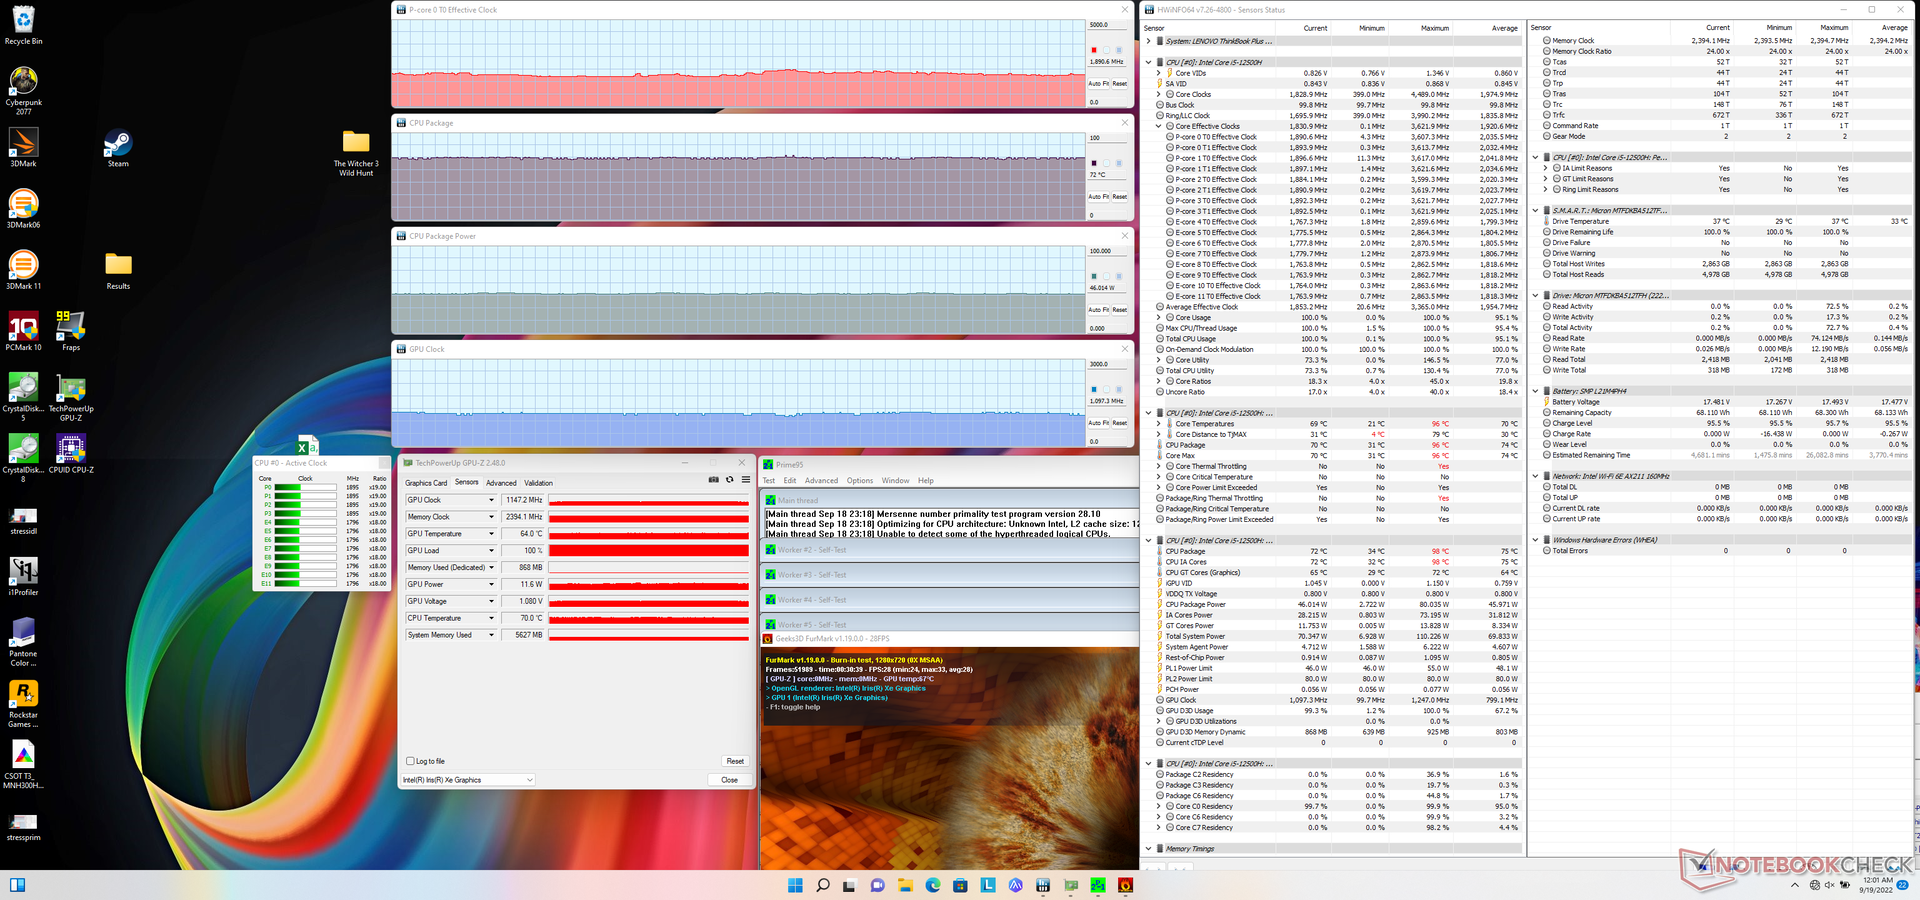
| CPU-klocka (GHz) | GPU-klocka (MHz) | Genomsnittlig CPU-temperatur (°C) | |
| Systemets tomgång | -- | -- | 36 |
| Prime95 Stress | 2.6 | -- | 88 |
| Prime95 + FurMark Stress | 1,9 | 1147 | 72 |
| Witcher 3 Stress | ~1,9 | 1297 | 85 |
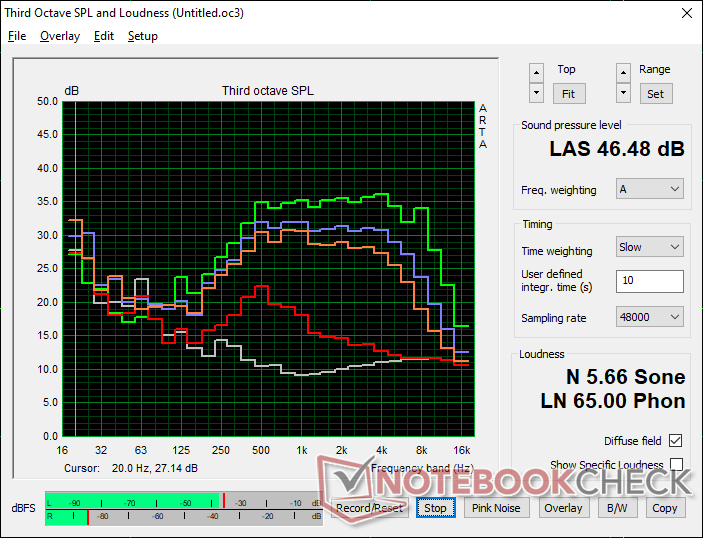
Högtalare
Lenovo ThinkBook Plus Gen3 ljudanalys
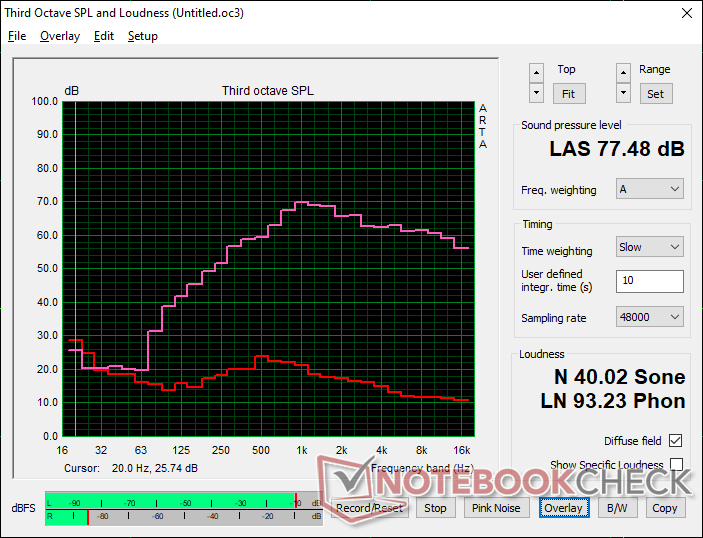
(±) | högtalarljudstyrkan är genomsnittlig men bra (77.5 dB)
Bas 100 - 315 Hz
(±) | reducerad bas - i genomsnitt 14% lägre än medianen
(±) | linjäriteten för basen är genomsnittlig (9.4% delta till föregående frekvens)
Mellan 400 - 2000 Hz
(±) | högre mellan - i genomsnitt 5% högre än median
(+) | mids är linjära (5% delta till föregående frekvens)
Högsta 2 - 16 kHz
(+) | balanserade toppar - endast 1.4% från medianen
(+) | toppar är linjära (2.5% delta till föregående frekvens)
Totalt 100 - 16 000 Hz
(±) | linjäriteten för det totala ljudet är genomsnittlig (16% skillnad mot median)
Jämfört med samma klass
» 19% av alla testade enheter i den här klassen var bättre, 6% liknande, 76% sämre
» Den bästa hade ett delta på 7%, genomsnittet var 21%, sämst var 53%
Jämfört med alla testade enheter
» 25% av alla testade enheter var bättre, 5% liknande, 69% sämre
» Den bästa hade ett delta på 4%, genomsnittet var 23%, sämst var 134%
Apple MacBook Pro 16 2021 M1 Pro ljudanalys
(+) | högtalare kan spela relativt högt (84.7 dB)
Bas 100 - 315 Hz
(+) | bra bas - bara 3.8% från medianen
(+) | basen är linjär (5.2% delta till föregående frekvens)
Mellan 400 - 2000 Hz
(+) | balanserad mellan - endast 1.3% från medianen
(+) | mids är linjära (2.1% delta till föregående frekvens)
Högsta 2 - 16 kHz
(+) | balanserade toppar - endast 1.9% från medianen
(+) | toppar är linjära (2.7% delta till föregående frekvens)
Totalt 100 - 16 000 Hz
(+) | det totala ljudet är linjärt (4.6% skillnad mot median)
Jämfört med samma klass
» 0% av alla testade enheter i den här klassen var bättre, 0% liknande, 100% sämre
» Den bästa hade ett delta på 5%, genomsnittet var 17%, sämst var 45%
Jämfört med alla testade enheter
» 0% av alla testade enheter var bättre, 0% liknande, 100% sämre
» Den bästa hade ett delta på 4%, genomsnittet var 23%, sämst var 134%
Energiförvaltning
Effektförbrukning
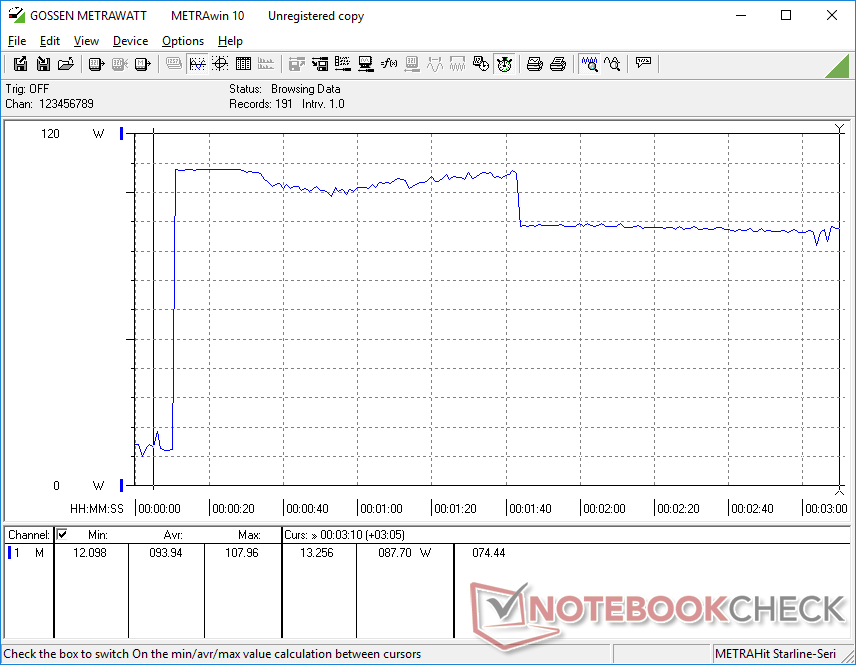
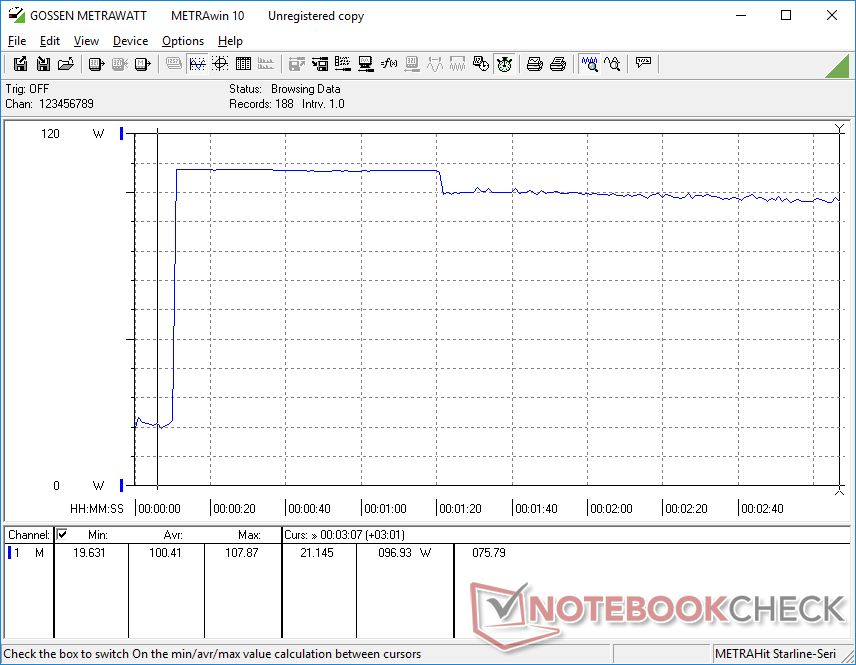
När datorn går på tomgång på skrivbordet i energisparläge drar den så lite som 7 W vid lägsta ljusstyrka och när den sekundära skärmen är avstängd. Om den sekundära skärmen är aktiverad och inställd på maximal ljusstyrka är förbrukningen cirka 2,8 W högre. Idling på skrivbordet med båda skärmarna inställda på maximal ljusstyrka och i läget Extreme Performance kräver strax under 17 W för att vara lika mycket som snabbare bärbara 17-tumsdatorer med diskreta GPU:er.
Högre belastningar som spel kräver mellan 50 och 65 W jämfört med endast ~40 W på de flesta bärbara datorer i Core U- eller P-serien med samma integrerade Iris Xe 96 EUs GPU som t.ex LG Gram 17.
Den totala strömförbrukningen är ungefär 2 gånger högre än den tidigare generationen ThinkBook Plus Gen 2 i de flesta fall på grund av den ökade storleken och prestandan och den extra nyttan från den sekundära skärmen.
| Av/Standby | |
| Låg belastning | |
| Hög belastning |
|
Förklaring:
min: | |
| Lenovo ThinkBook Plus Gen3 i7-12700H, Iris Xe G7 96EUs, Micron 3400 MTFDKBA512TFH 512GB, IPS, 3072x1440, 17.3" | Lenovo ThinkBook Plus Gen2 Core i5 i5-1130G7, Iris Xe G7 80EUs, Samsung PM9A1 MZVL2512HCJQ, IPS, E-Ink, 2560x1600, 13.3" | Asus ProArt StudioBook Pro 17 W700G3T i7-9750H, Quadro RTX 3000 Max-Q, Samsung SSD PM981 MZVLB1T0HALR, IPS, 1920x1200, 17" | LG Gram 17 (2022) i5-1240P, Iris Xe G7 80EUs, Samsung PM9A1 MZVL2512HCJQ, IPS, 2560x1600, 17" | Dell XPS 17 9720 i7-12700H, GeForce RTX 3050 4GB Laptop GPU, Micron 3400 MTFDKBA512TFH 512GB, IPS, 3840x2400, 17" | Gigabyte Aero 17 HDR YD i9-11980HK, GeForce RTX 3080 Laptop GPU, Samsung PM9A1 MZVL2512HCJQ, IPS, 3840x2160, 17.3" | |
|---|---|---|---|---|---|---|
| Power Consumption | 46% | -48% | 33% | -40% | -150% | |
| Idle Minimum * (Watt) | 7.4 | 5 32% | 11.3 -53% | 4 46% | 7.8 -5% | 25 -238% |
| Idle Average * (Watt) | 16.4 | 7.9 52% | 16 2% | 12.2 26% | 15.1 8% | 28 -71% |
| Idle Maximum * (Watt) | 16.8 | 8.3 51% | 16.8 -0% | 13.2 21% | 17 -1% | 40 -138% |
| Load Average * (Watt) | 62.3 | 30.9 50% | 93.6 -50% | 34 45% | 114 -83% | 114 -83% |
| Witcher 3 ultra * (Watt) | 50 | 25.2 50% | 106 -112% | 39.4 21% | 115.2 -130% | 176 -252% |
| Load Maximum * (Watt) | 107.9 | 66.8 38% | 186.6 -73% | 65.9 39% | 135.6 -26% | 236 -119% |
* ... mindre är bättre
Power Consumption Witcher 3 / Stresstest
Power Consumption external Monitor
Batteritid - inte så lång
Körtiderna är i bästa fall genomsnittliga för en 17-tums bärbar dator. Batterikapaciteten är mindre än på LG Gram 17 eller Dell XPS 17, vilket innebär att WLAN-tiden är flera timmar kortare. Vi kan klockan knappt 5,5 timmars verklig WLAN-användning med den sekundära skärmen aktiv jämfört med 9+ timmar vardera på de tidigare nämnda Asus och Dell.
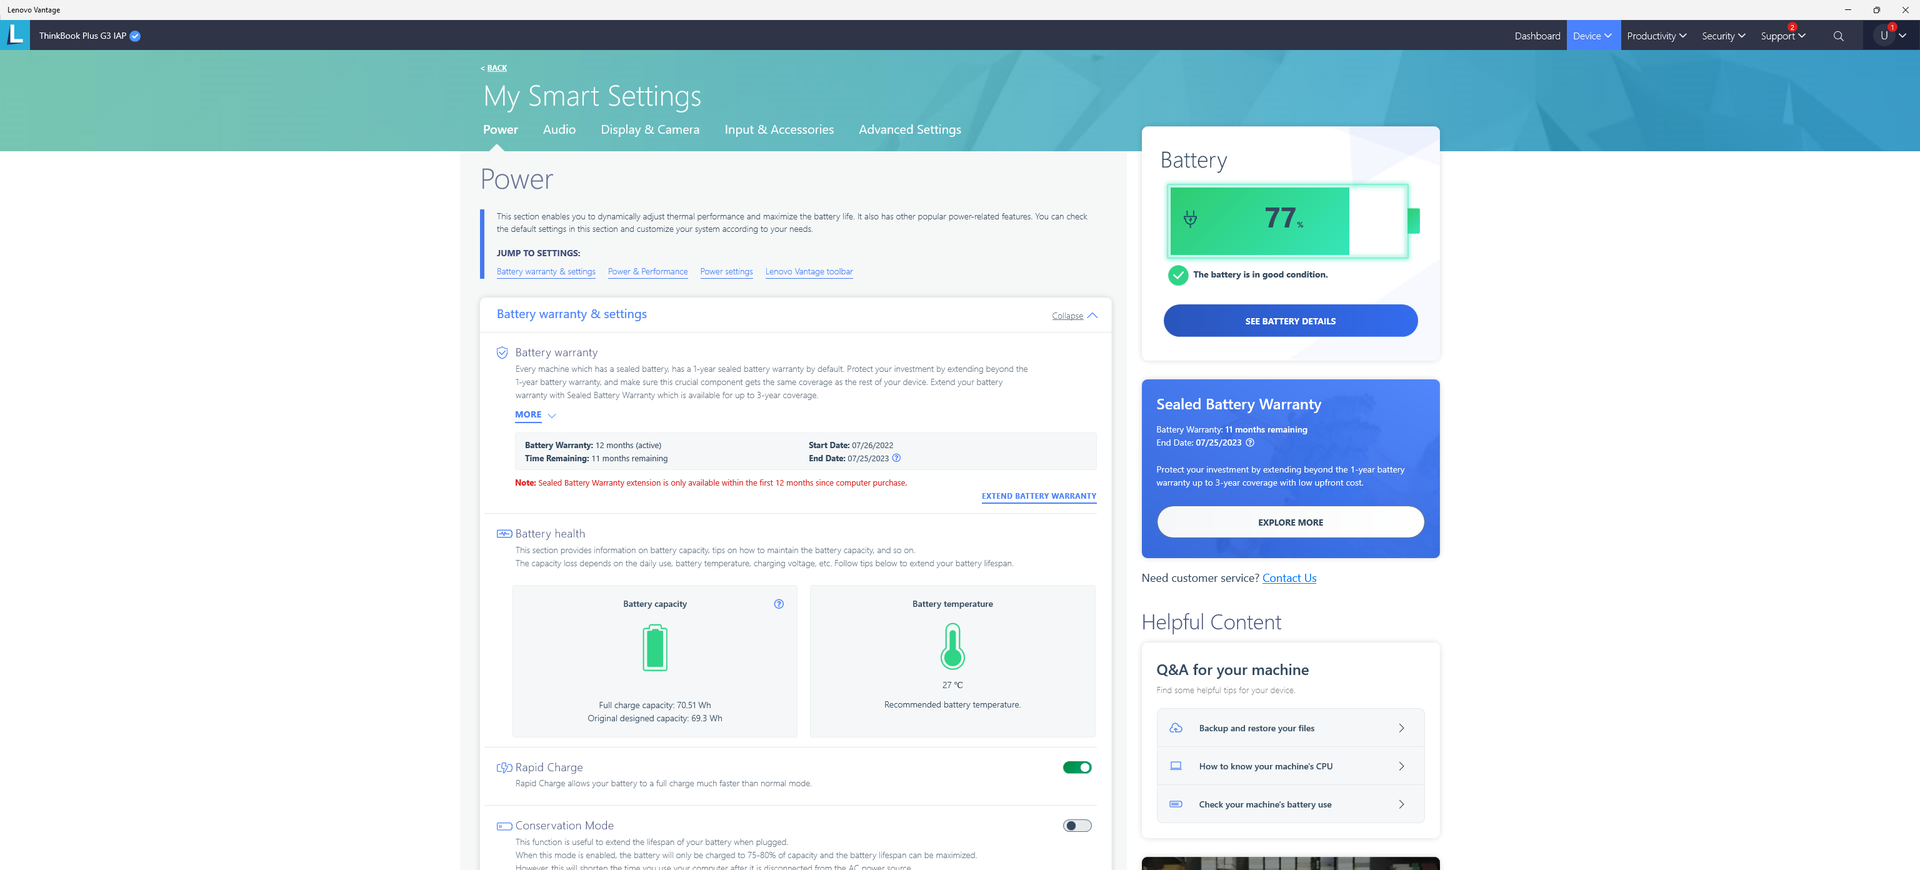
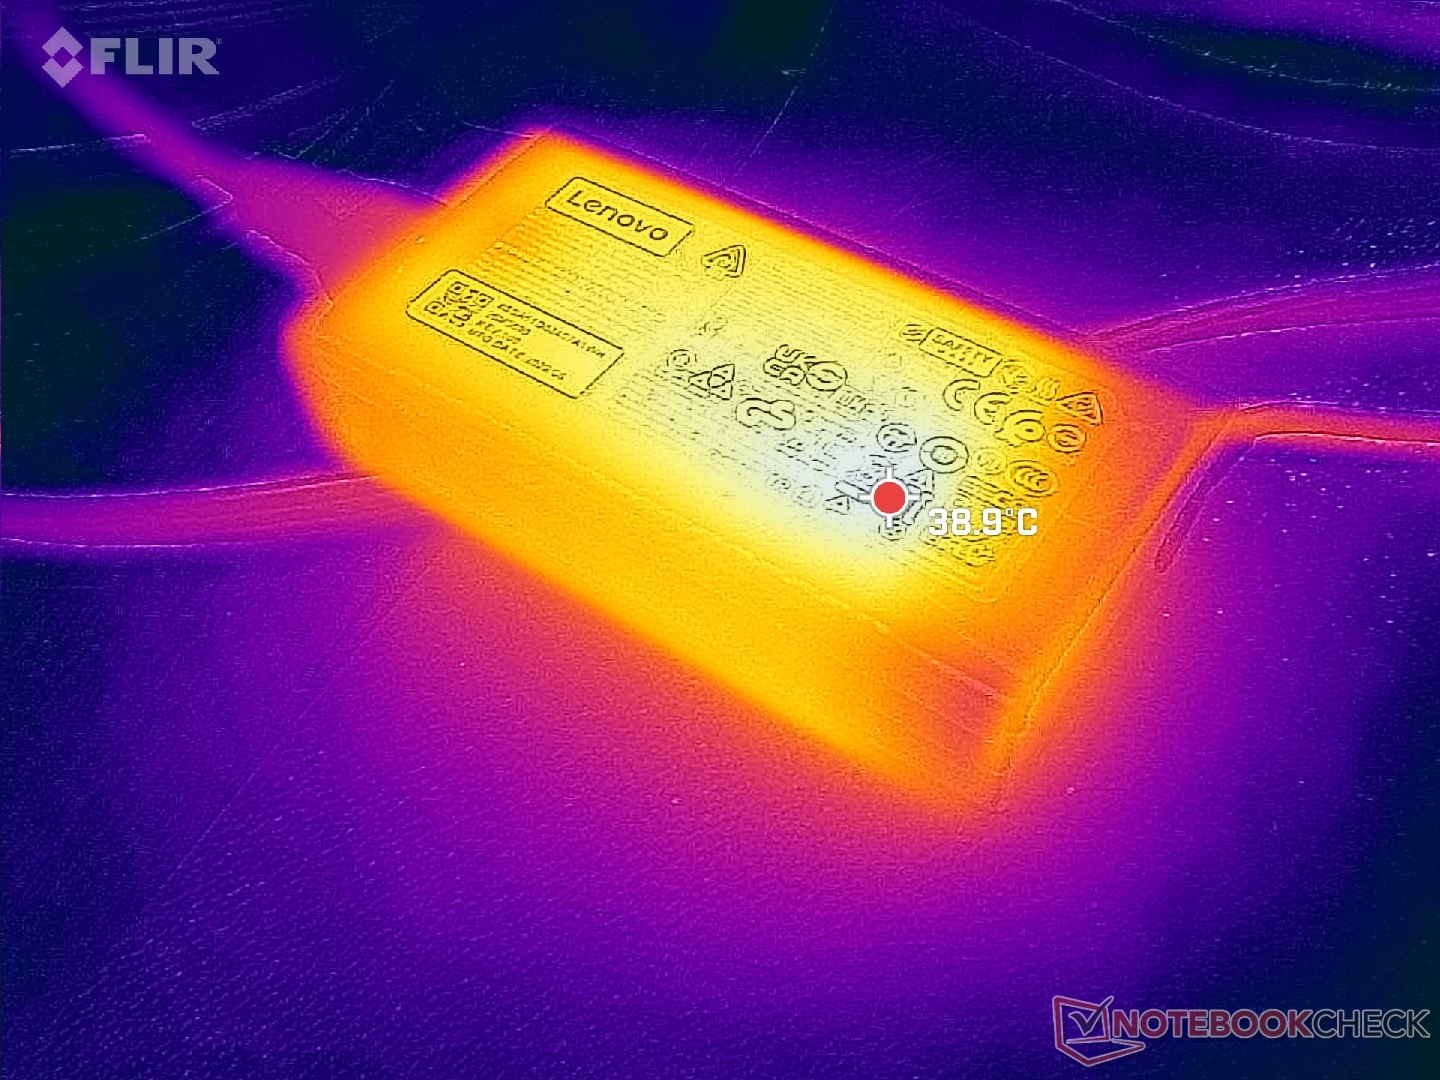
Laddning från tom till full kapacitet tar mellan 1 och 1,5 timme när Rapid Charge är aktiverat.
| Lenovo ThinkBook Plus Gen3 i7-12700H, Iris Xe G7 96EUs, 70 Wh | Lenovo ThinkBook Plus Gen2 Core i5 i5-1130G7, Iris Xe G7 80EUs, 53 Wh | Asus ProArt StudioBook Pro 17 W700G3T i7-9750H, Quadro RTX 3000 Max-Q, 57 Wh | LG Gram 17 (2022) i5-1240P, Iris Xe G7 80EUs, 80 Wh | Dell XPS 17 9720 i7-12700H, GeForce RTX 3050 4GB Laptop GPU, 97 Wh | Gigabyte Aero 17 HDR YD i9-11980HK, GeForce RTX 3080 Laptop GPU, 99 Wh | |
|---|---|---|---|---|---|---|
| Batteridrifttid | 43% | 41% | 186% | 47% | 13% | |
| Reader / Idle (h) | 8.1 | 28.2 248% | ||||
| WiFi v1.3 (h) | 5.3 | 7.6 43% | 5.9 11% | 11.2 111% | 9.2 74% | 5.6 6% |
| Load (h) | 1 | 1.7 70% | 3 200% | 1.2 20% | 1.2 20% | |
| H.264 (h) | 6.9 | 14.1 | 11.2 | |||
| Witcher 3 ultra (h) | 1.7 |
För
Emot
Bedömning - Perfekt för trånga arbetsutrymmen
ThinkBook Plus Gen 3 är unik i sin storlekskategori och inte bara på grund av den sekundära 8-tumsskärmen eller formfaktorn 21:10. Mer specifikt är den en av de få bärbara 17-tumsdatorer som levereras med en Intel 12th gen Core H-processor och absolut inga diskreta grafikalternativ alls. Detta tillvägagångssätt har möjliggjort en relativt smal och lätt chassidesign trots den andra skärmen och de längre chassidimensionerna.
En viktig nackdel med modellen är att den kan vara underkraftig för vissa användare. CPU-prestanda är långsammare än många andra bärbara 17-tumsdatorer med samma Core i7-12700H-processor och avsaknaden av en dGPU kommer troligen att avskräcka de flesta kraftfulla användare. Det sistnämnda är synd eftersom den primära skärmen har färgerna och funktionerna för grafikredigering medan den sekundära skärmen kan vara inneboende användbar för tung multitasking. Så länge dina arbetsbelastningar inte är särskilt GPU-tunga bör denna nackdel inte vara något större problem.
ThinkBook Plus Gen 3 optimerar produktiviteten genom att ge användarna mer skärmyta än de flesta andra bärbara datorer på marknaden. Du måste dock ge upp lite grafikprestanda på vägen dit.
När det gäller den integrerade sekundära skärmen är funktionen mest användbar för fönstren i filutforskaren, texter, kommandorader och andra program där färgprecisionen inte är ett stort problem. Dess pekskärmsfunktionalitet är dock inte lika tillförlitlig som på en smartphone eller surfplatta, och därför tycker vi att skärmen är lättast att använda med en mus istället
Om du har skrivbordsutrymme för en extern sekundär bildskärm som t.ex Lepow C2, då blir ThinkBook Plus Gen 3 mycket mindre övertygande. Användare som ständigt är på resande fot eller inte har plats för externa skärmar är de som kommer att tycka att den här Lenovo är förvånansvärt rymlig jämfört med andra 17-tumsmodeller.
Pris och tillgänglighet
ThinkBook Plus Gen 3 finns ännu inte tillgänglig hos stora återförsäljare som Amazon, Best Buy och Newegg. Användare kan köpa direkt från Lenovo från och med 1 500 USD för Core i5-alternativet eller 1 600 USD för vår Core i7-konfiguration.
Lenovo ThinkBook Plus Gen3
- 09/21/2022 v7 (old)
Allen Ngo
Price comparison

