Recension av Beelink GTR5 2022: En Intel NUC med AMD Ryzen 9

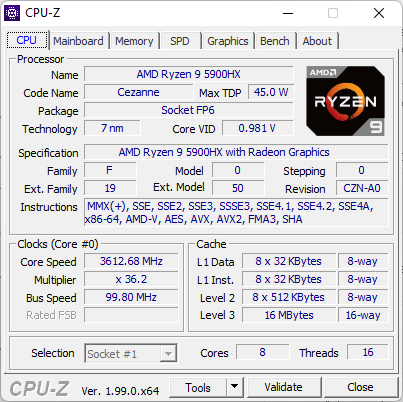
I början av mini-datorer i NUC-storlek sågs sådana produkter vanligtvis som extremt energisnåla alternativ till den typiska stationära eller bärbara datorn. Numera har minidatorer utvecklats till att omfatta specifikationer på spelnivå och andra kraftfulla funktioner. Beelink GTR5 är den senaste högpresterande minidatorn från tillverkaren som är utrustad med en AMD Zen 3 Ryzen 9 5900HX-processor som vanligtvis är reserverad för kraftfulla bärbara speldatorer som t.ex Asus ROG Zephyrus Duo 15 SE, Lenovo Legion 7 16, eller Gigabyte A7 X1. Att se ett sådant alternativ för en dator med 0,8 l formfaktor borde automatiskt göra GTR5 till en av de snabbaste i sin kategori om allt fungerar som det är sagt.
GTR5 finns för närvarande på på Indiegogo och varierar från 620 USD för ett barebones-kit upp till 950 USD om det är fullt konfigurerat. Alla SKU:er kommer med samma Ryzen 9 5900HX-processor. GTR5 ska inte förväxlas med GTR7 som faktiskt är en äldre Beelink-modell som körs på den mycket långsammare Ryzen 7 3750H.
Fler recensioner av Beelink:
Testgrupp
Gradering | Datum | Modell | Vikt | Höjd | Storlek | Upplösning | Pris |
|---|---|---|---|---|---|---|---|
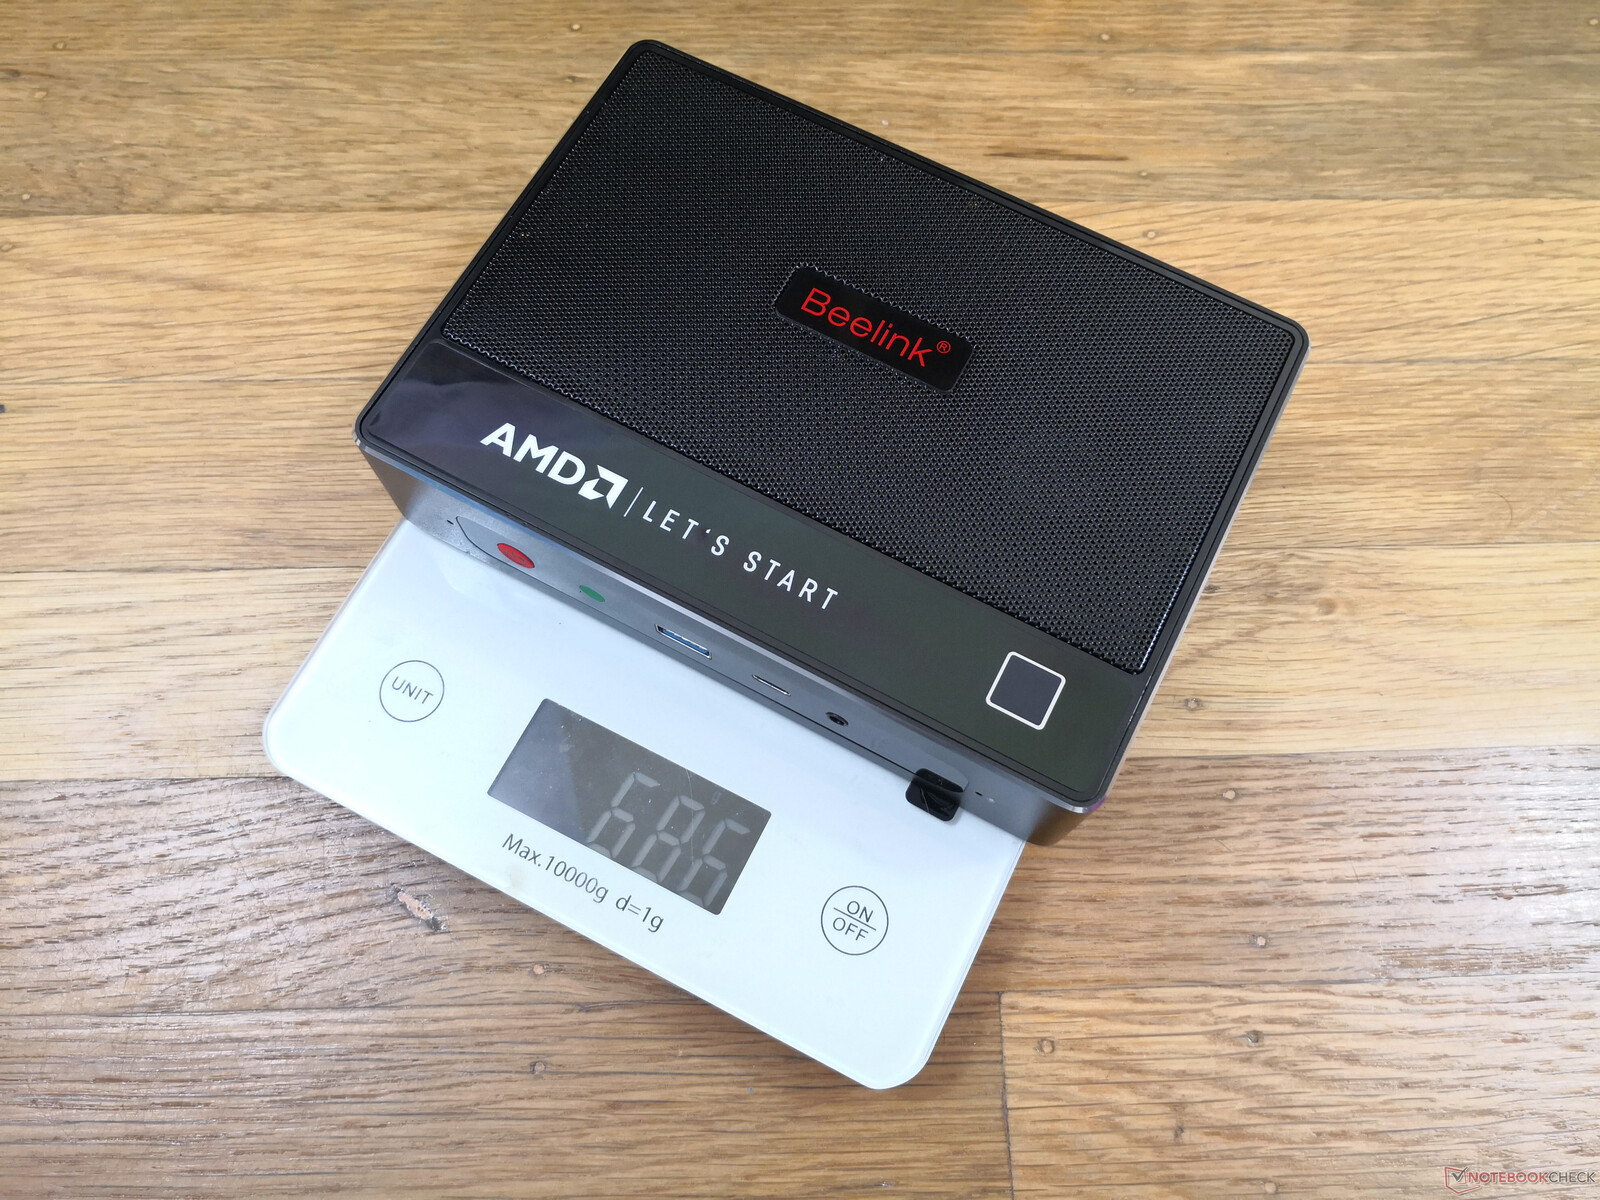
v (old) | 01/2022 | Beelink GTR5 R9 5900HX, Vega 8 | 686 g | 39 mm | x | ||
v (old) | 12/2021 | Beelink GTI 11 i5-1135G7, Iris Xe G7 80EUs | 638 g | 39 mm | x | ||
v (old) | GMK NucBox 2 i5-8259U, Iris Plus Graphics 655 | 430 g | 50 mm | x | |||
v (old) | Intel NUC11PHKi7C i7-1165G7, GeForce RTX 2060 Mobile | 1.4 kg | 42 mm | x | |||
v (old) | Intel NUC11PAQi7 i7-1165G7, Iris Xe G7 96EUs | 647 g | 56 mm | x | |||
v (old) | Beelink GK Mini Celeron J4125, UHD Graphics 600 | 269 g | 43 mm | x |
Hölje
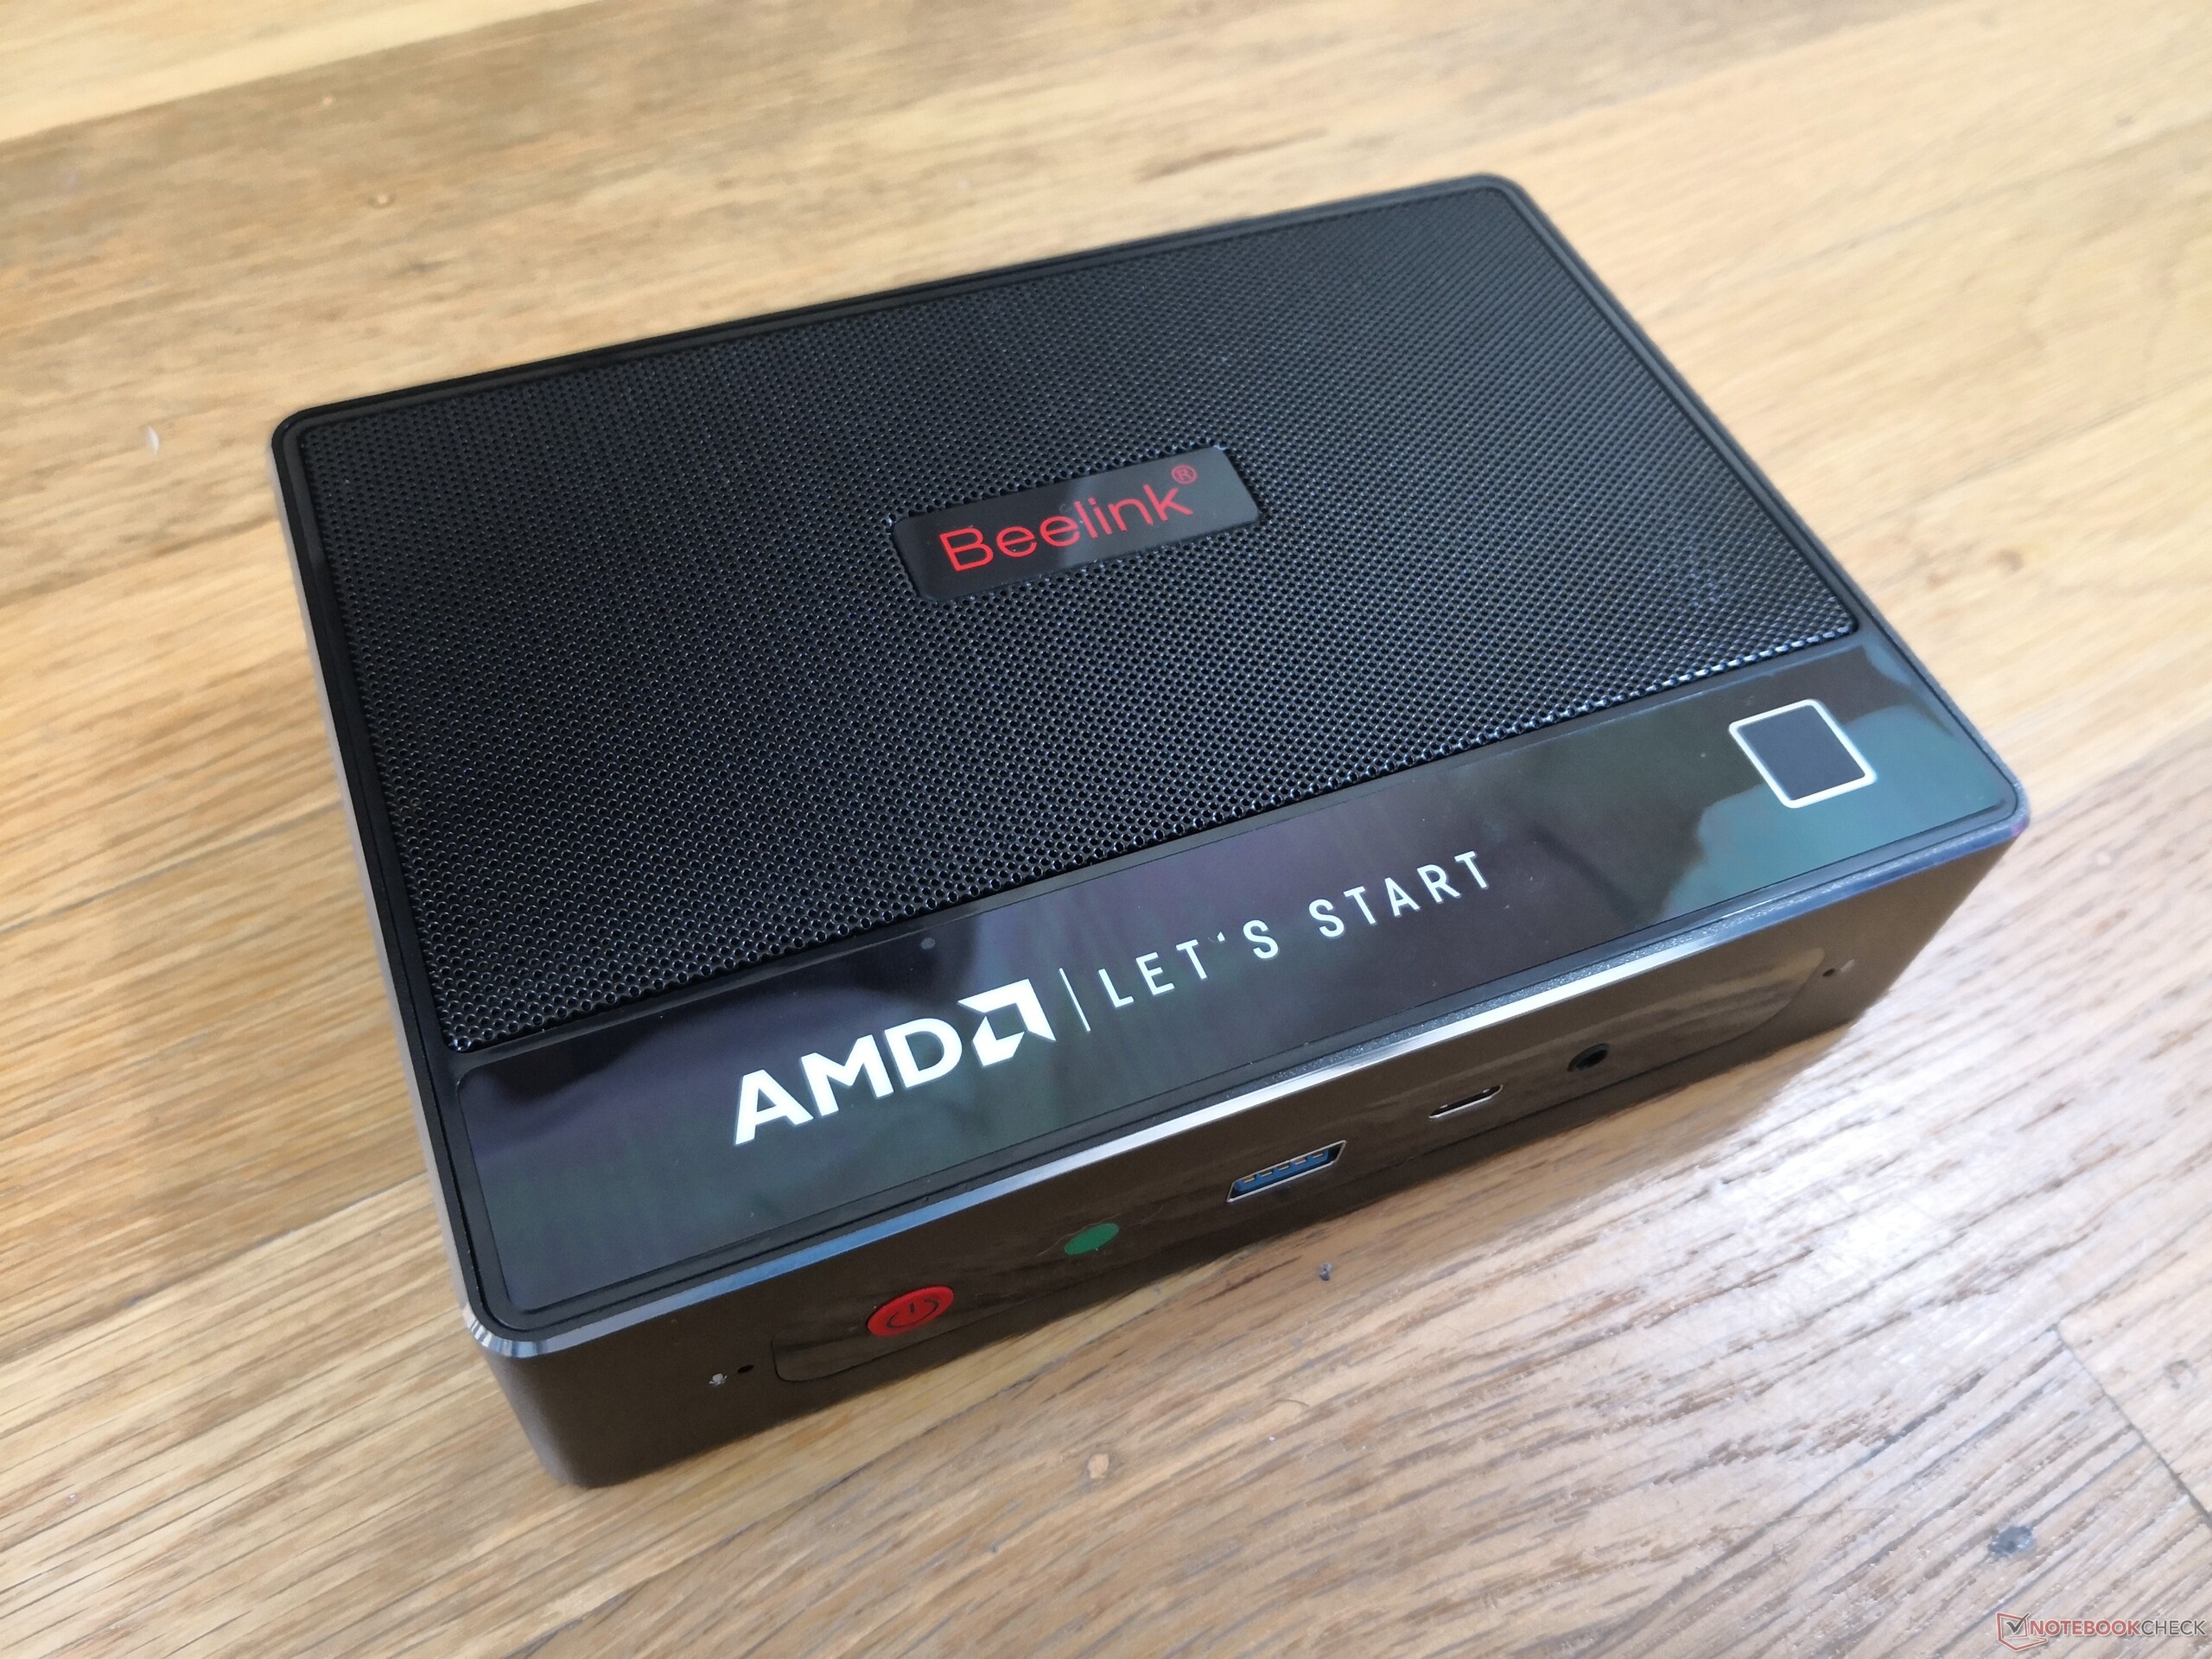
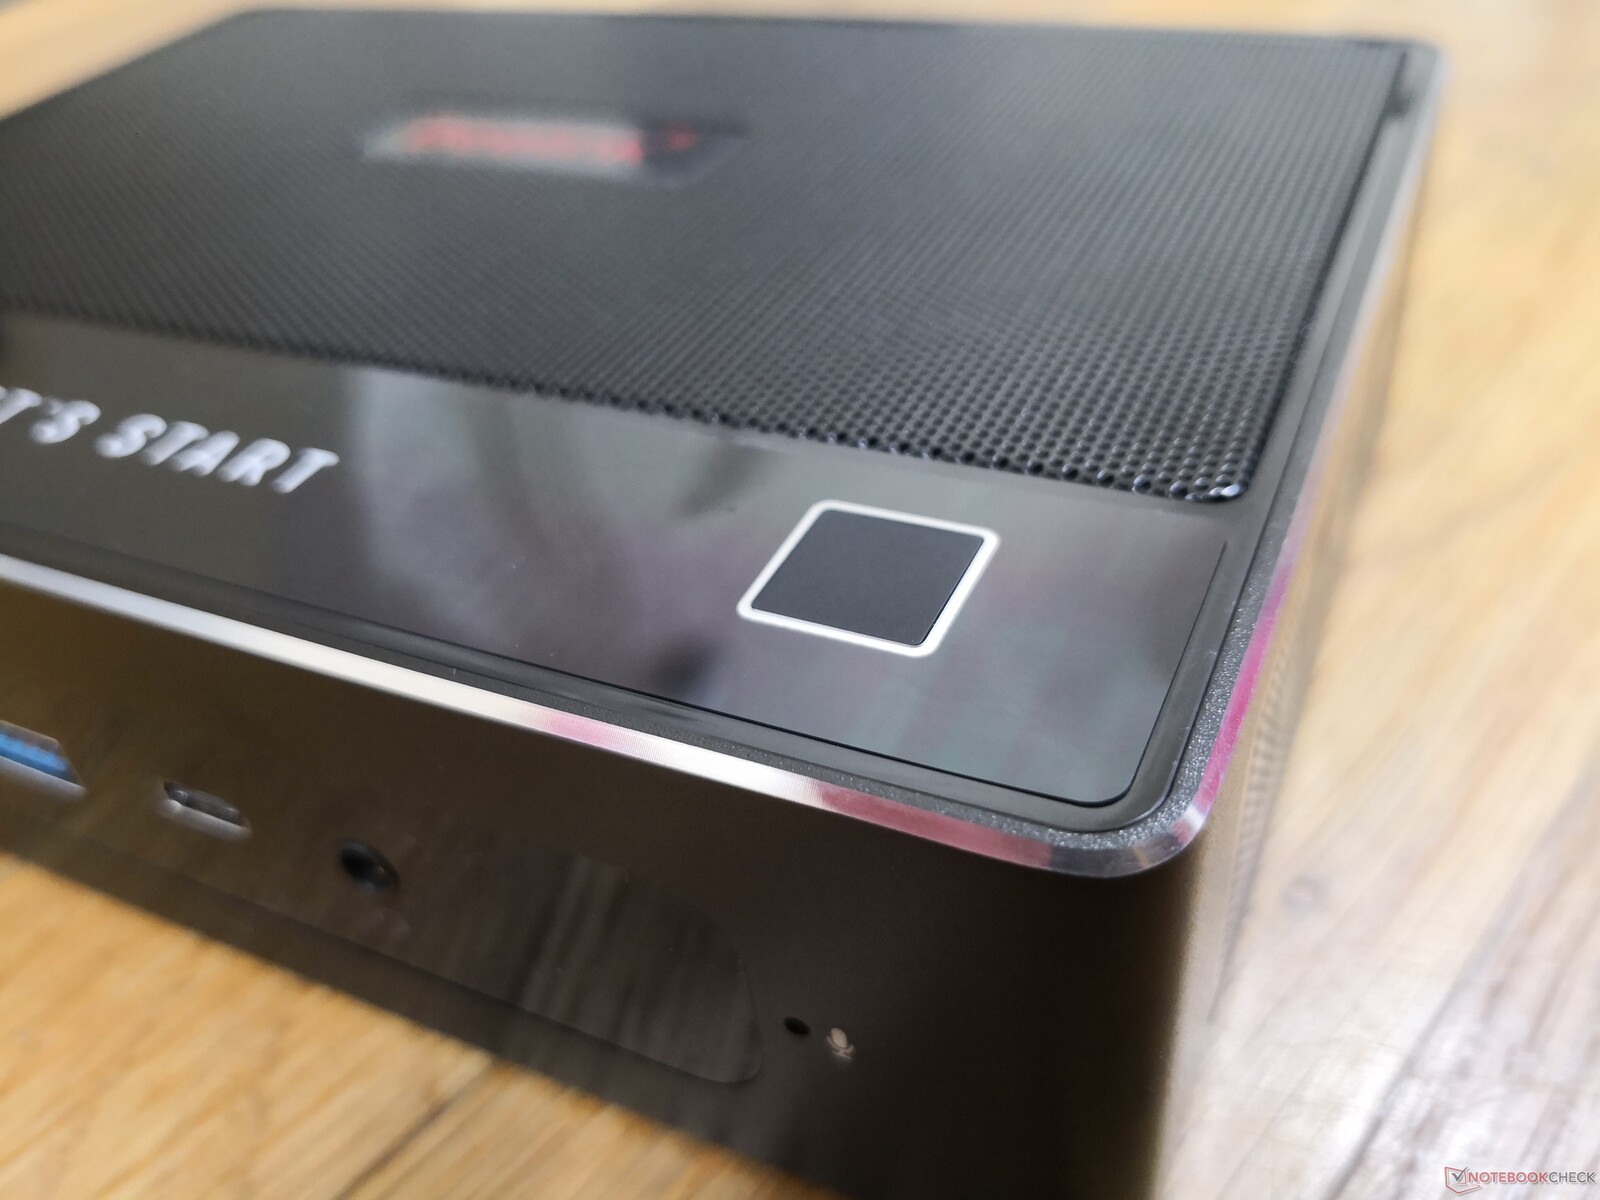
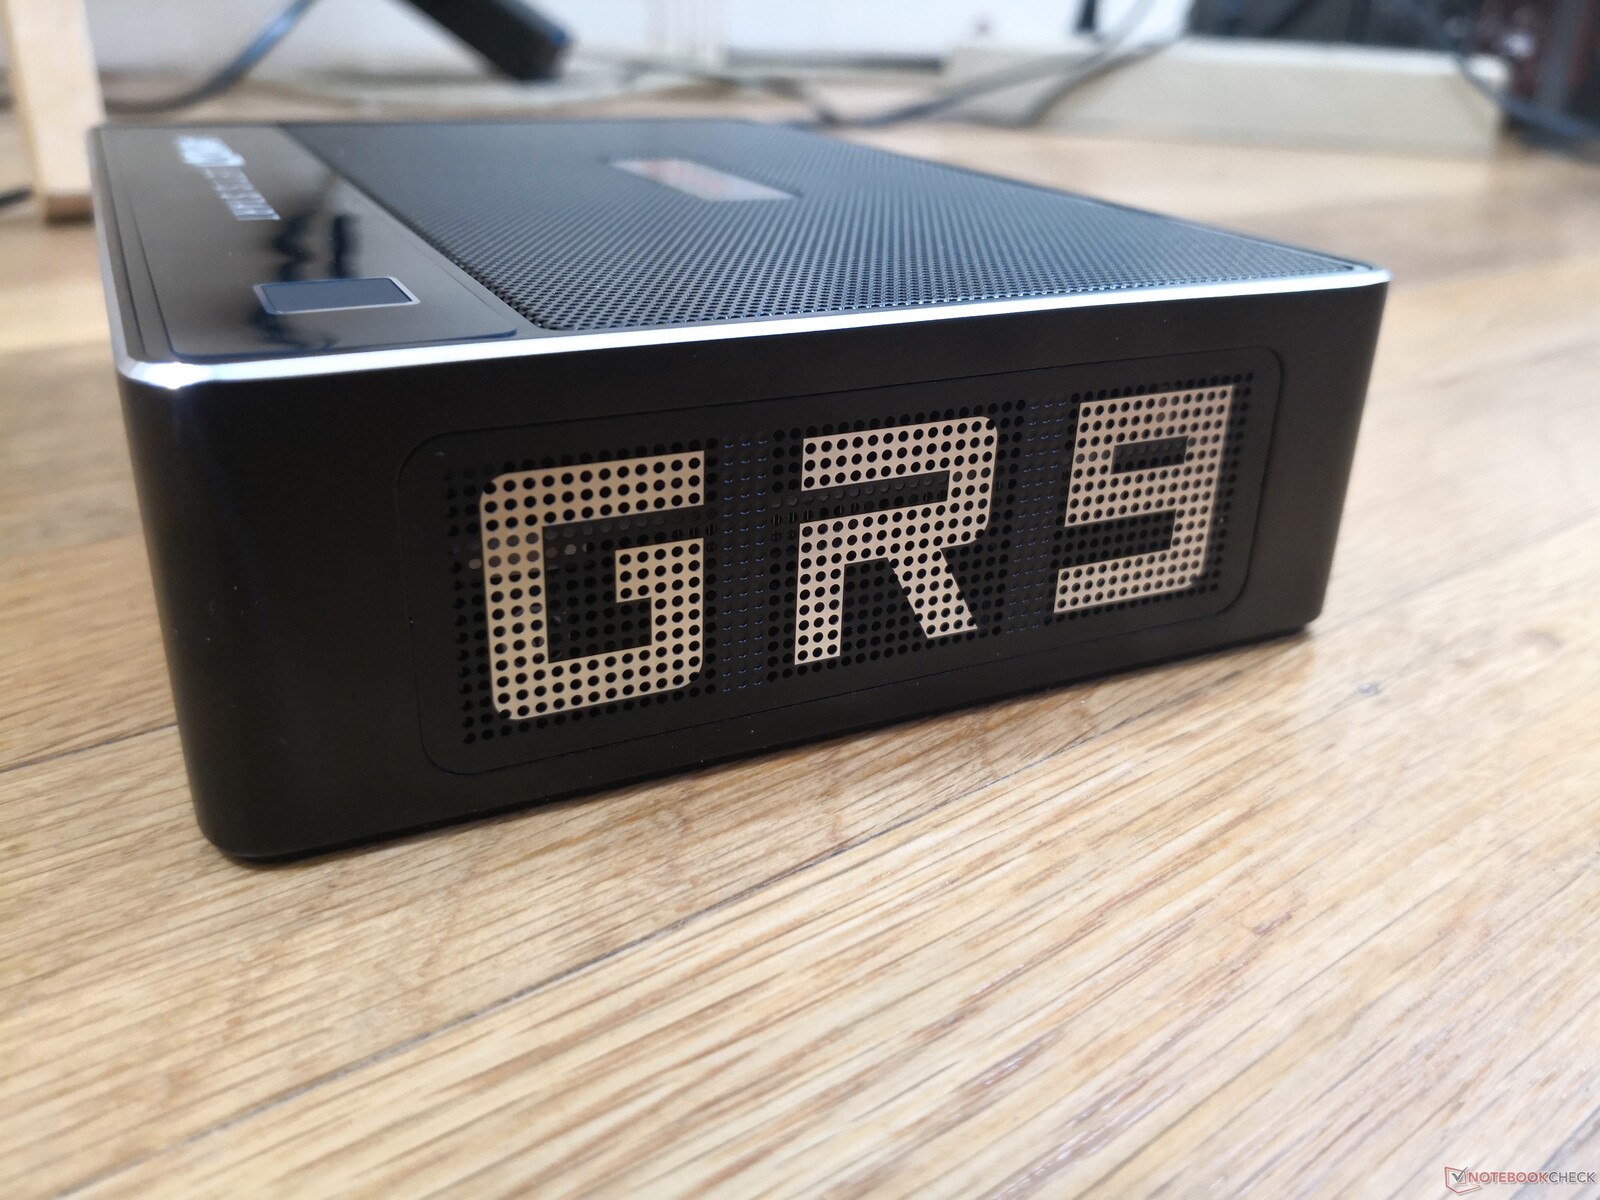
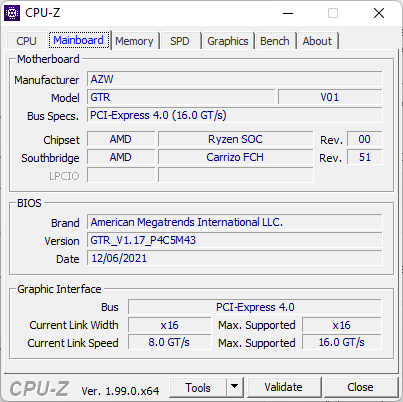
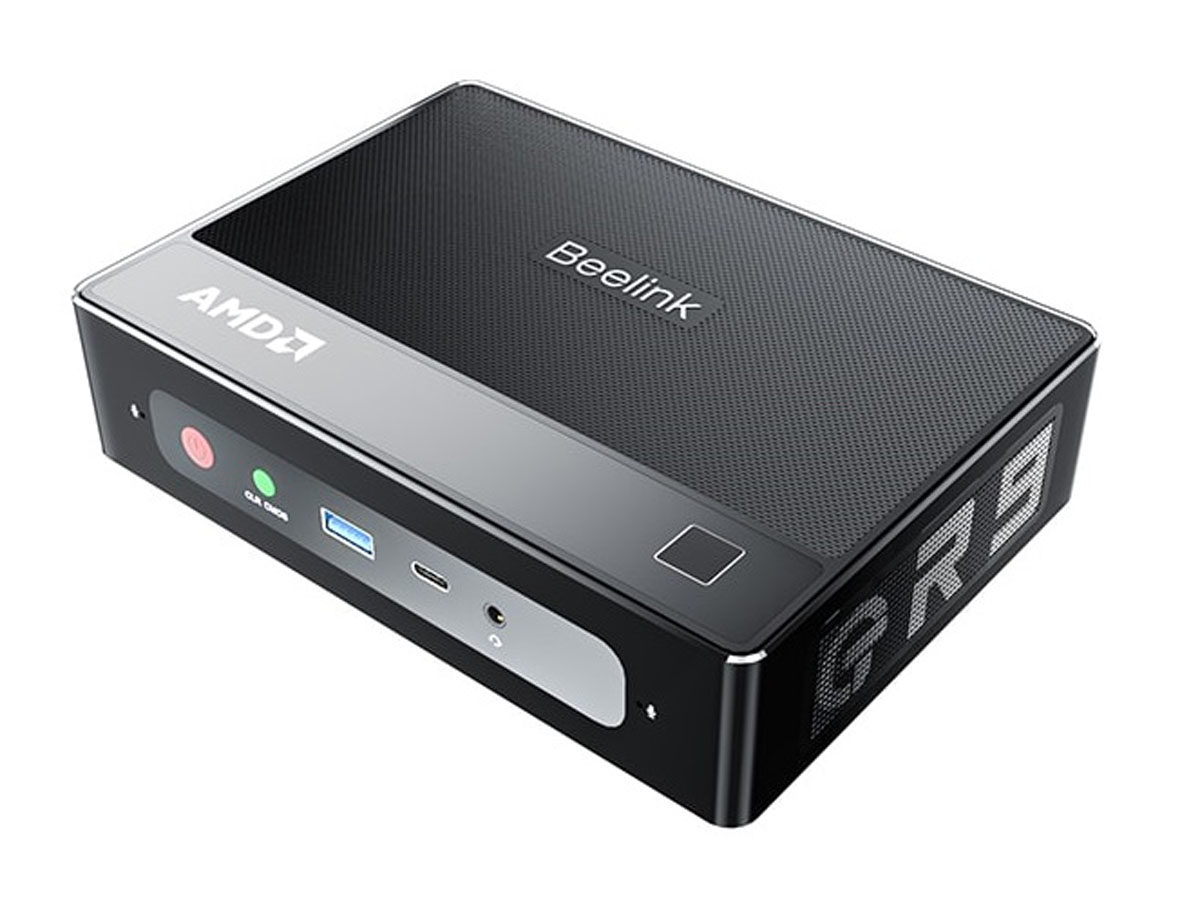
Beelink har återanvänt sitt Intel GTI11-chassi för AMD GTR5, eftersom GTR5:s mått och övergripande uppbyggnad i stort sett är identiska med sin Intel-motsvarighet. Den mest anmärkningsvärda förändringen är på toppen av enheten för att bättre rymma den mer krävande AMD-processorn i H-serien. Denna yta är nu perforerad istället för slät blank plast för bättre luftflöde.
Anslutningsmöjligheter
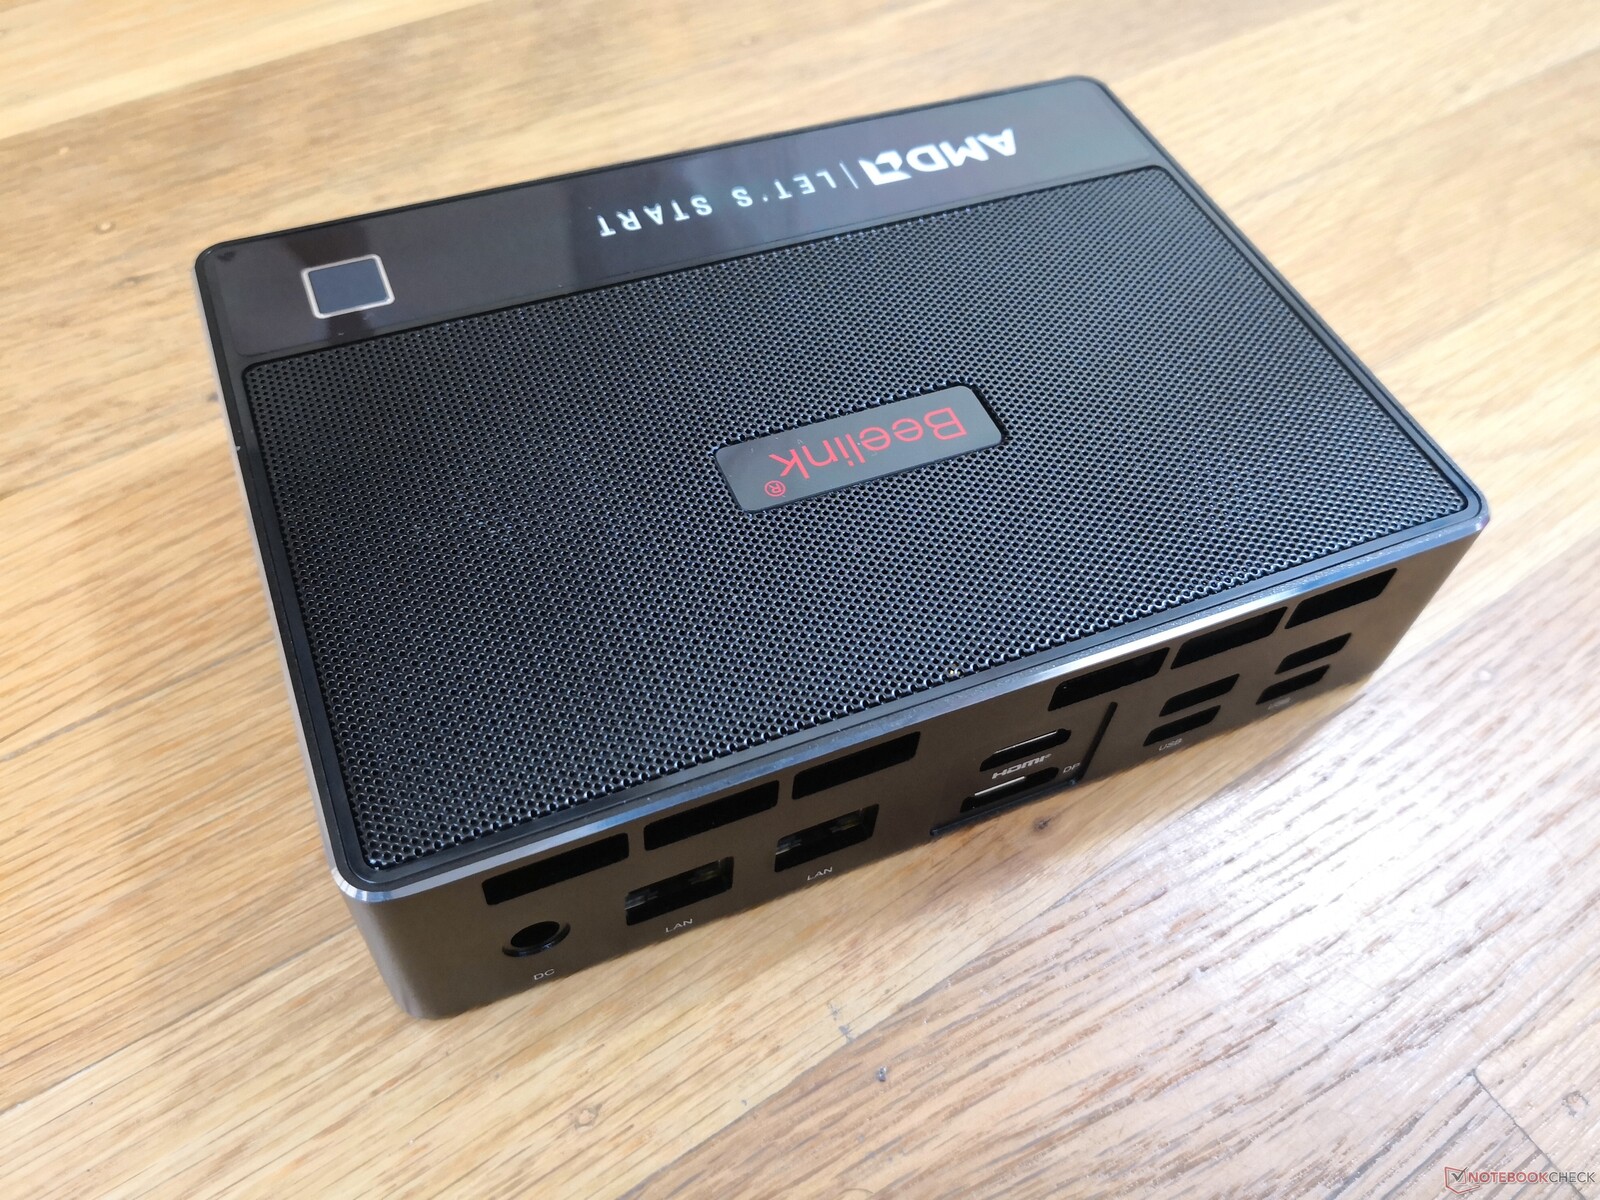
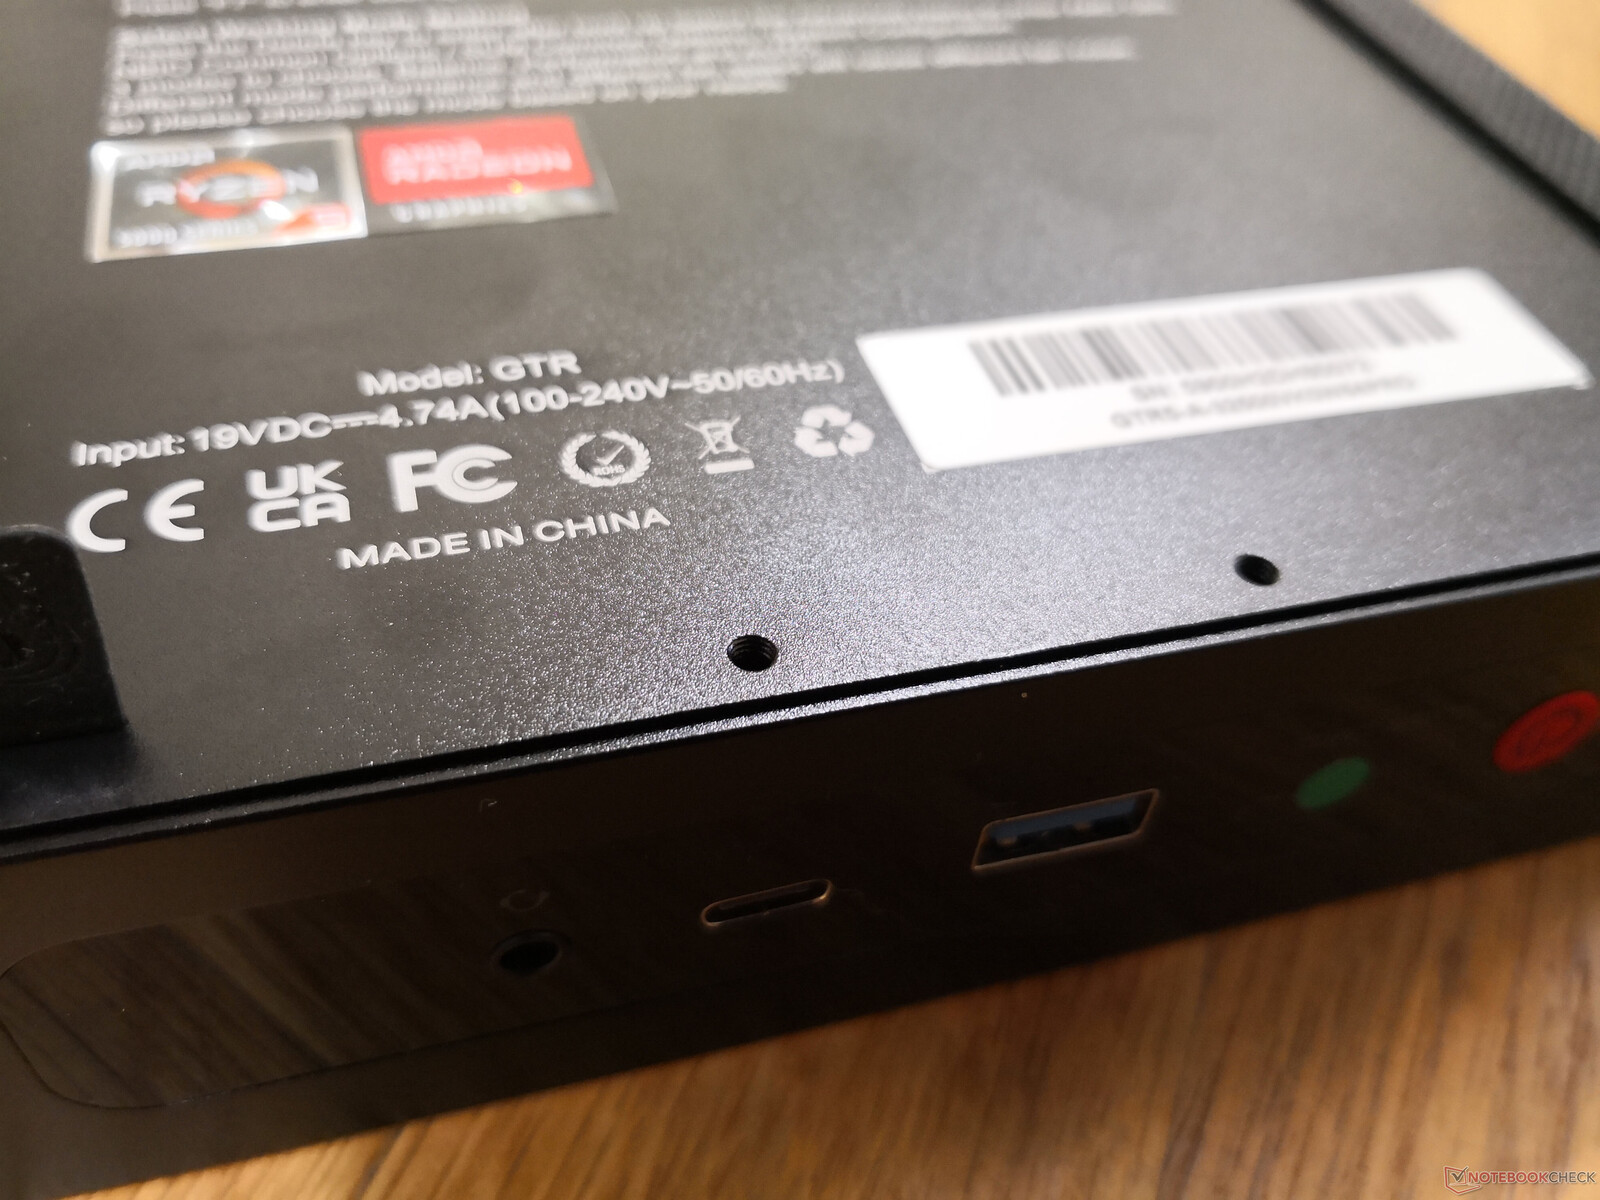
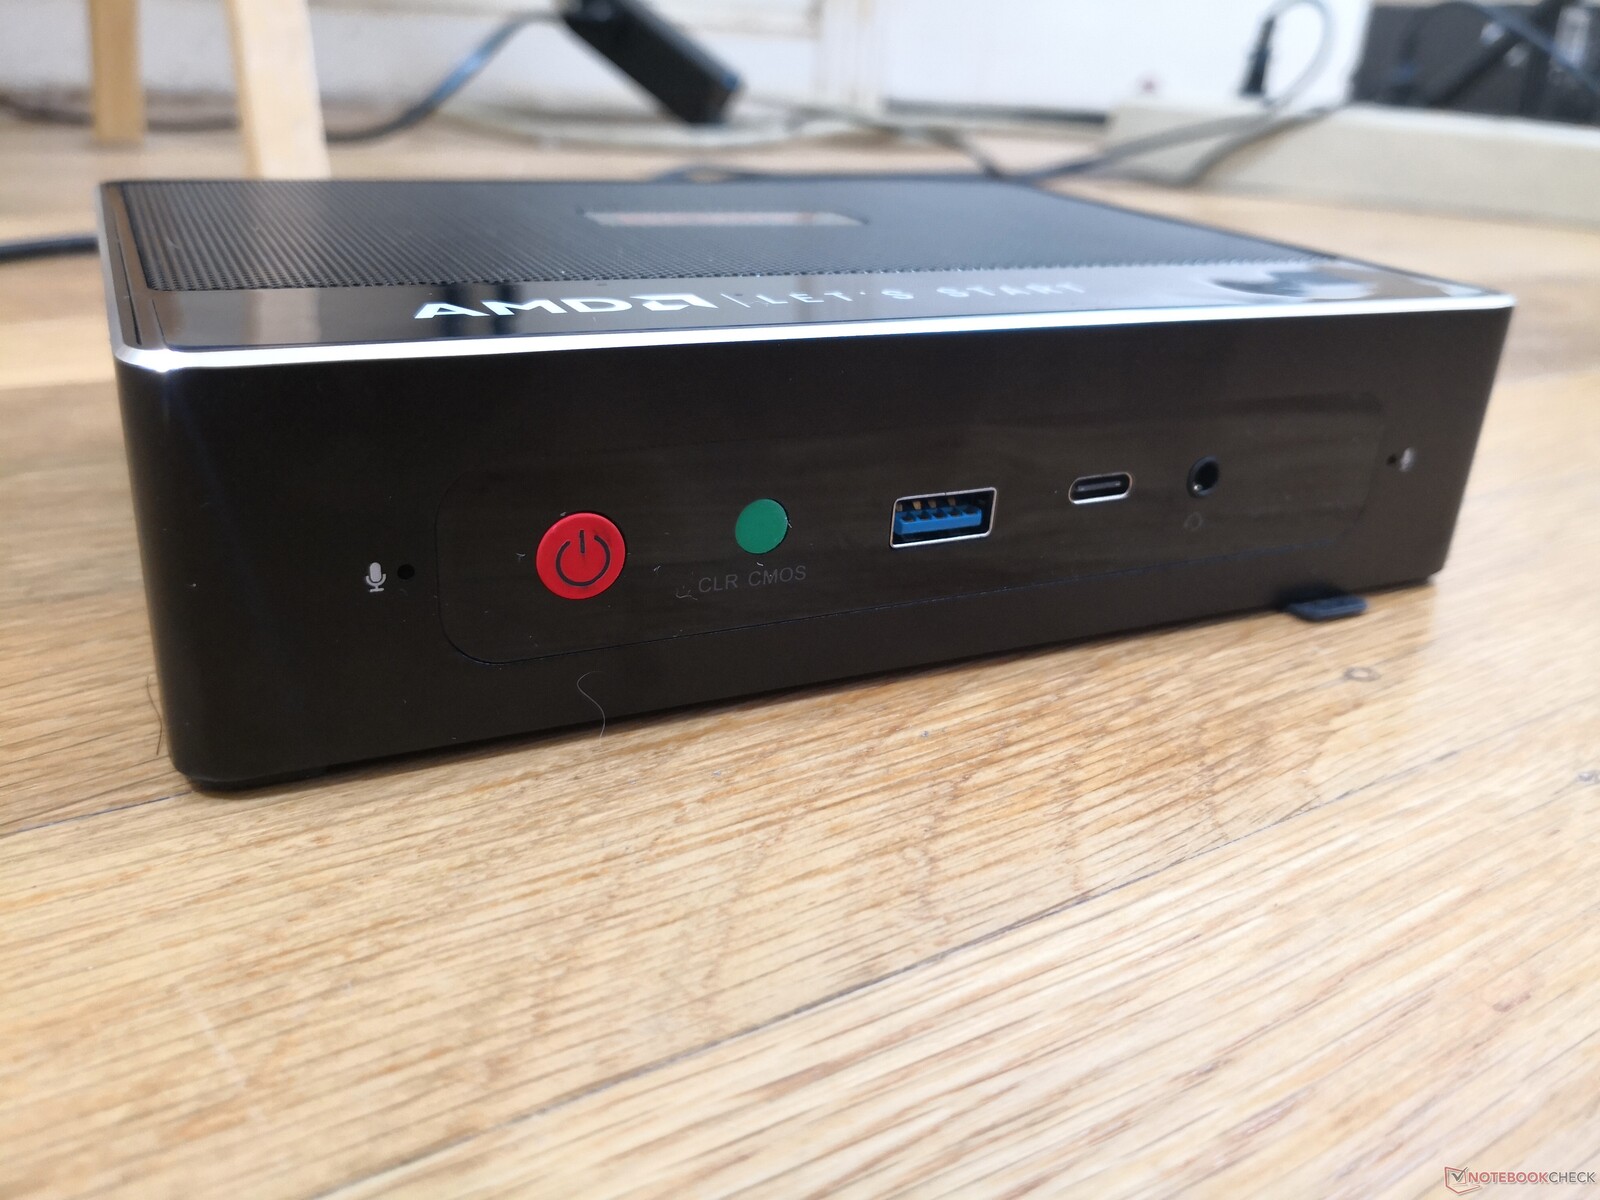
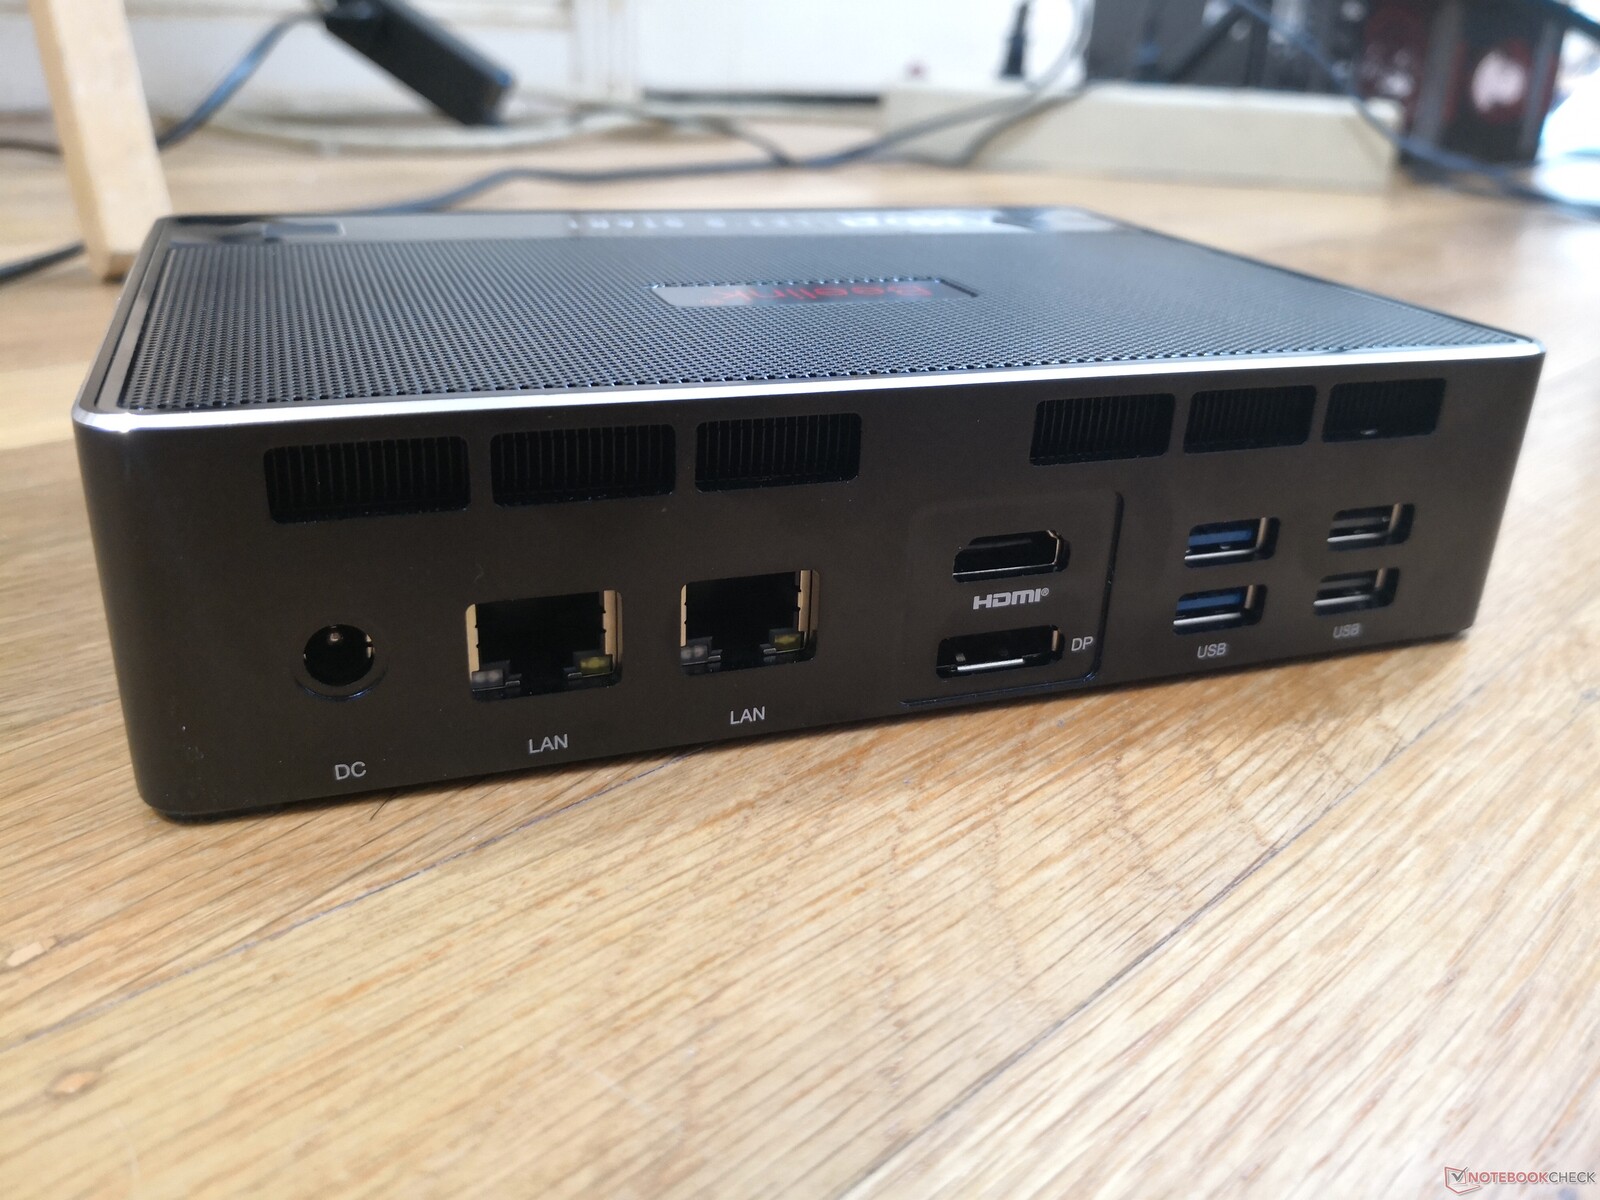
Portalternativen är identiska med Beelink GTI 11 med undantag för två viktiga skillnader: vår AMD-drivna GTR5 saknar Thunderbolt-stöd och en extra USB-A-port. Vi skulle ha föredragit fler USB-C-portar som på Intel Phantom Canyon NUC11PHKi7C eller åtminstone en integrerad SD-kortläsare
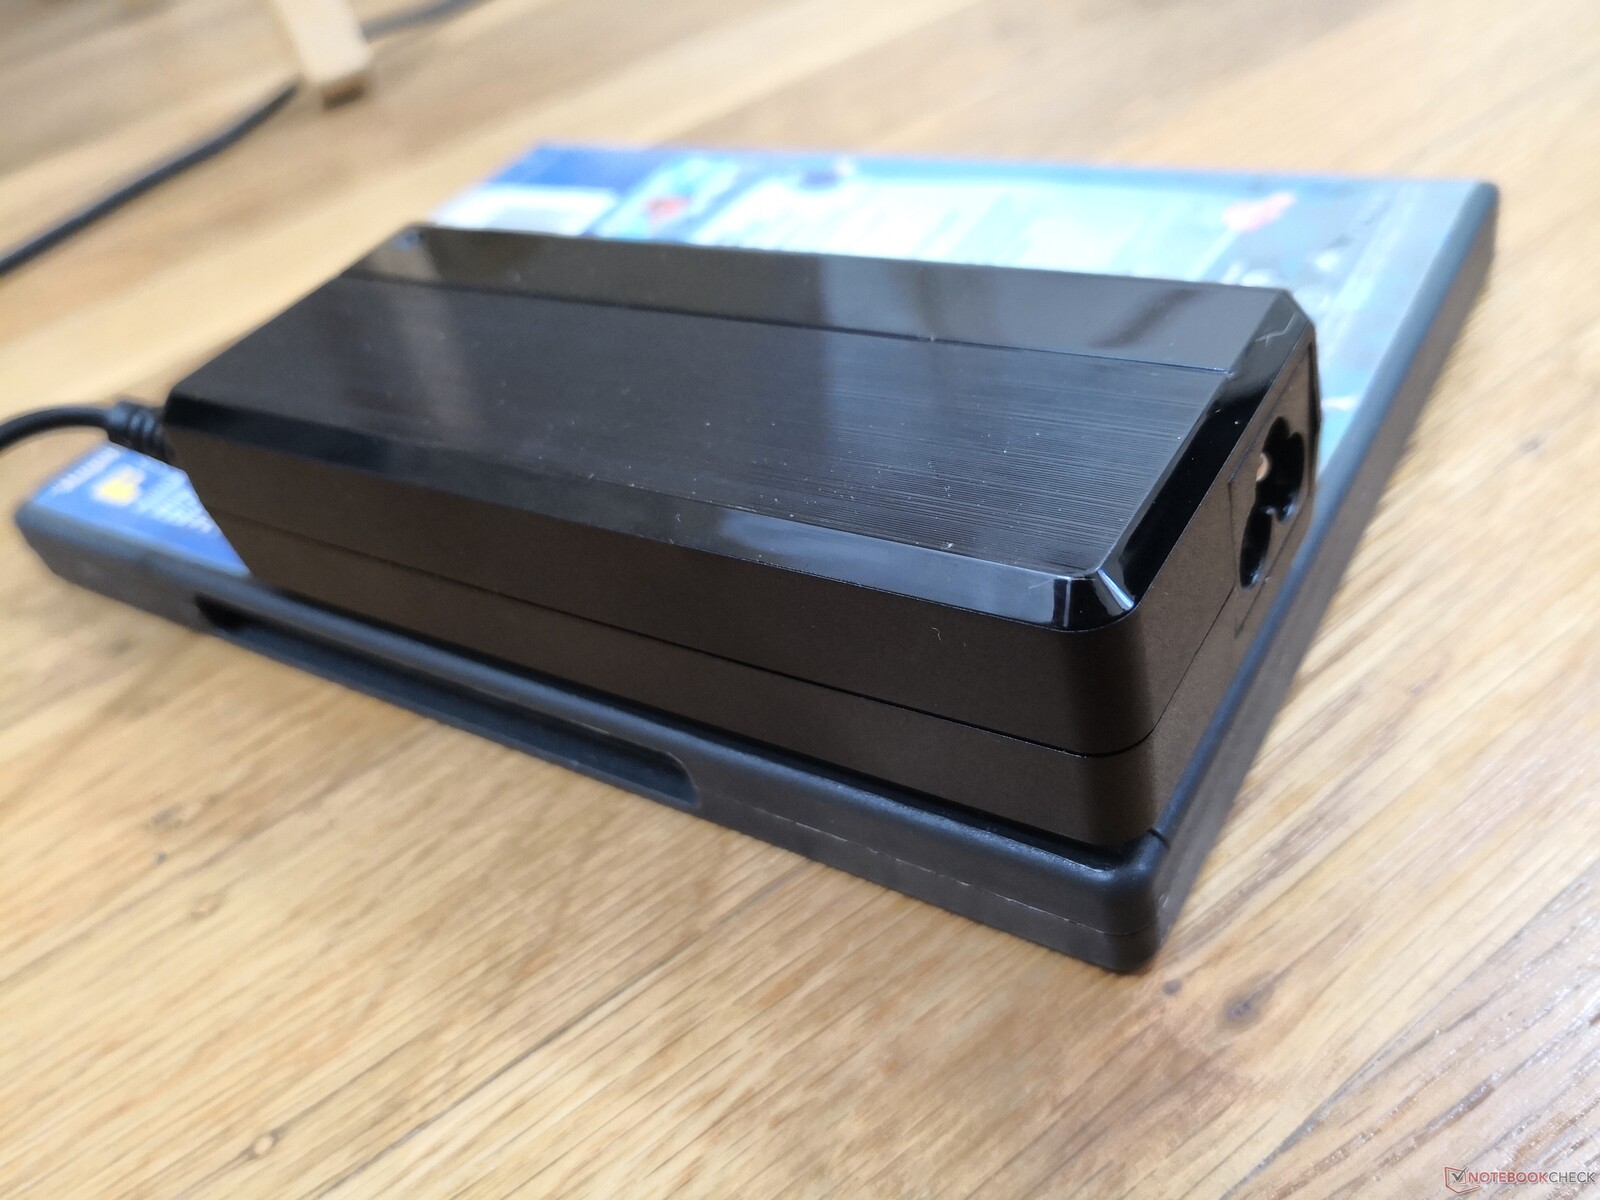
Intressant nog kan systemet strömförsörjas av USB-C om du någonsin skulle förlora den proprietära 90 W AC-adaptern. Vi anslöt vår Dell XPS 15 9575 130 W USB-C-adapter till GTR5 och den gick igång utan problem. Vi rekommenderar ändå att du använder den egenutvecklade 90 W AC-adaptern när det är möjligt eftersom de flesta USB-C-adaptrar från tredje part har mycket lägre effektutgångar.

Kommunikation
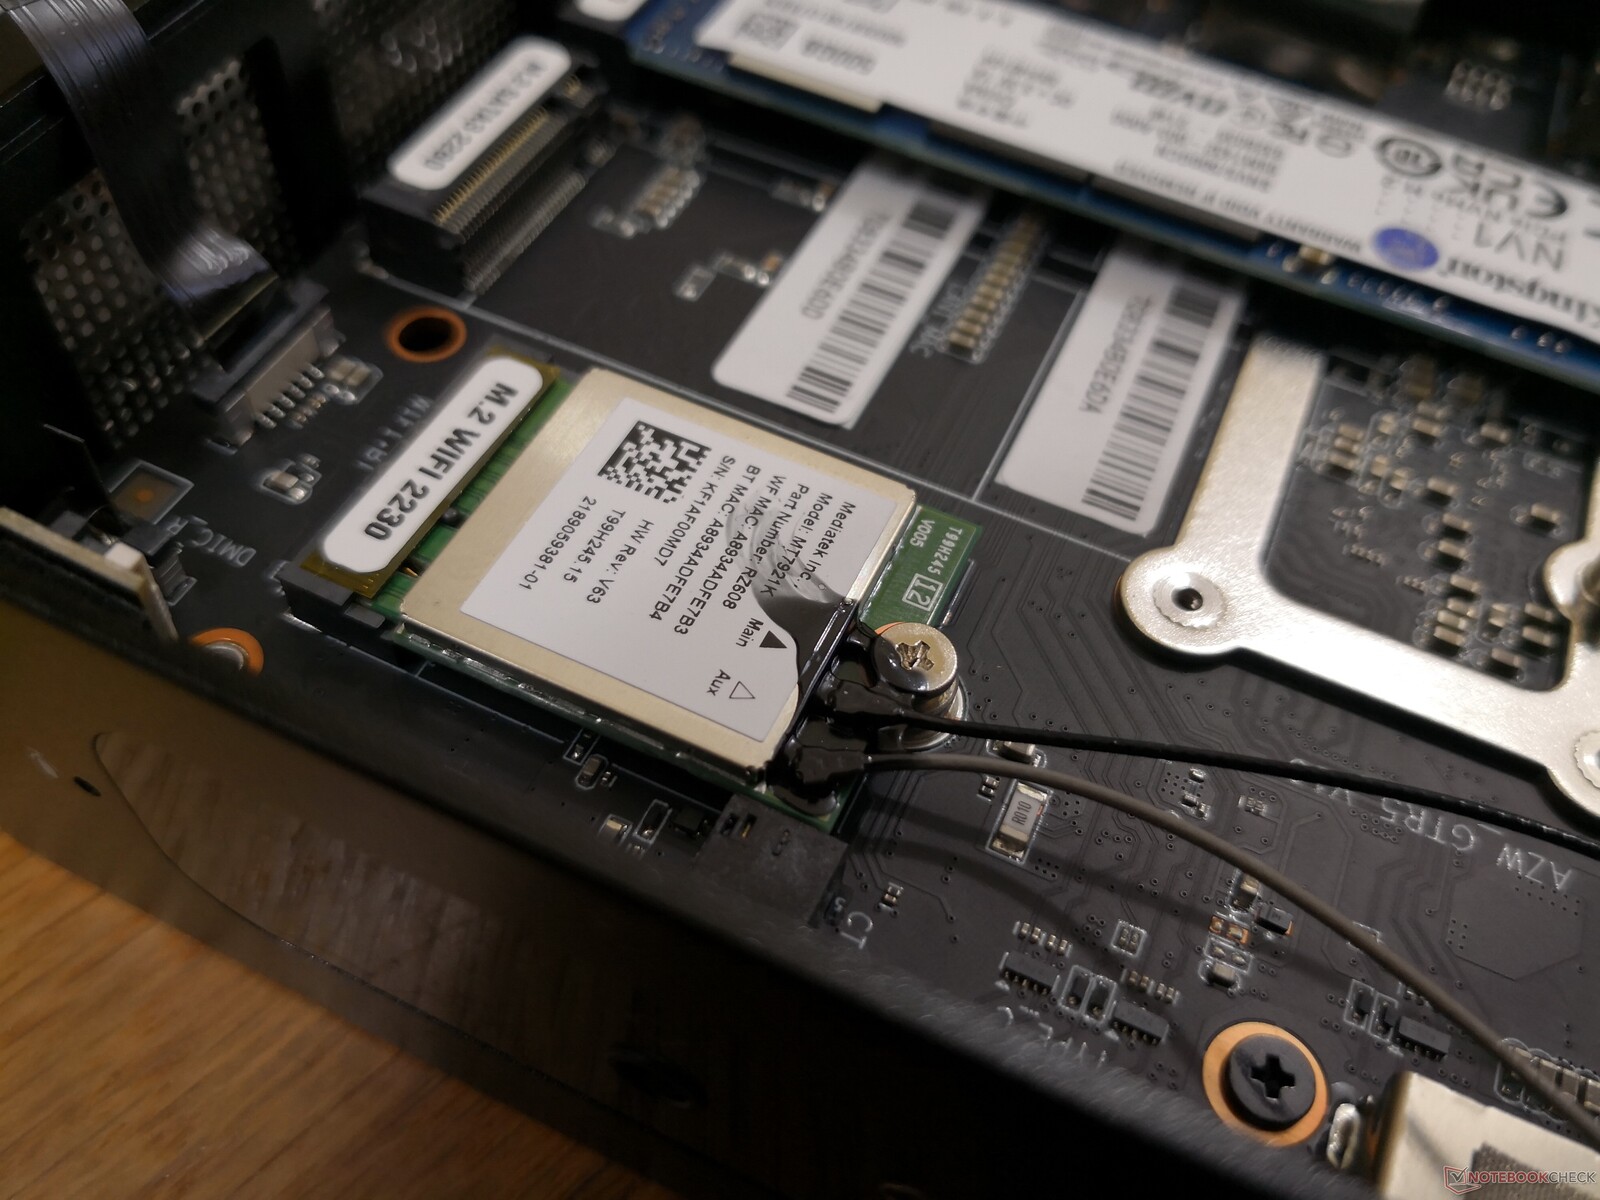
GTR5 är en av de första minidatorer som använder MediaTek RZ608 i stället för de mer typiska Intel AX200-serien eller Qualcomm Atheros. Modulen klarar Wi-Fi 6E-hastigheter, men vi är begränsade till vår Netgear RAX200 med Wi-Fi 6 för tillfället. Överföringshastigheterna är ändå tillförlitliga.
| Networking | |
| iperf3 transmit AX12 | |
| Beelink GTI 11 | |
| Intel NUC11PHKi7C | |
| Beelink GTR5 | |
| Intel NUC11PAQi7 | |
| GMK NucBox 2 | |
| Beelink GK Mini | |
| iperf3 receive AX12 | |
| Beelink GTI 11 | |
| Intel NUC11PHKi7C | |
| Intel NUC11PAQi7 | |
| Beelink GTR5 | |
| GMK NucBox 2 | |
| Beelink GK Mini | |
Underhåll
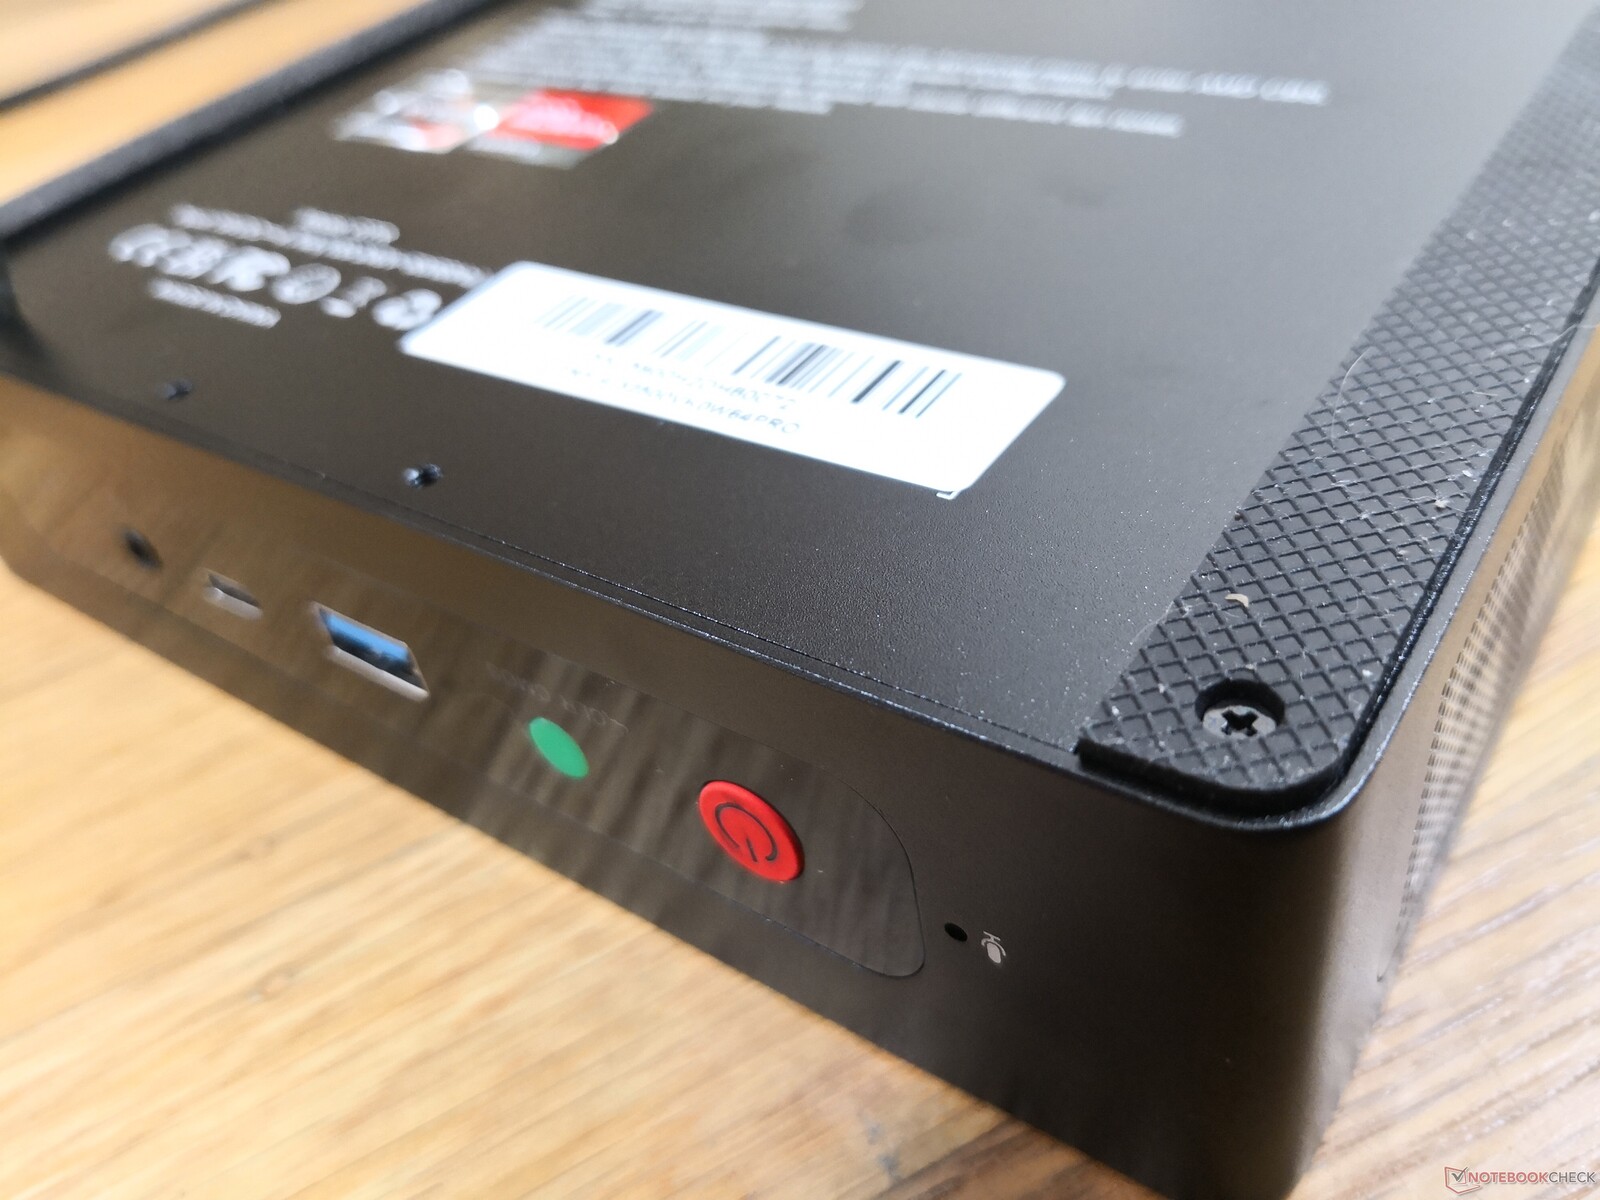
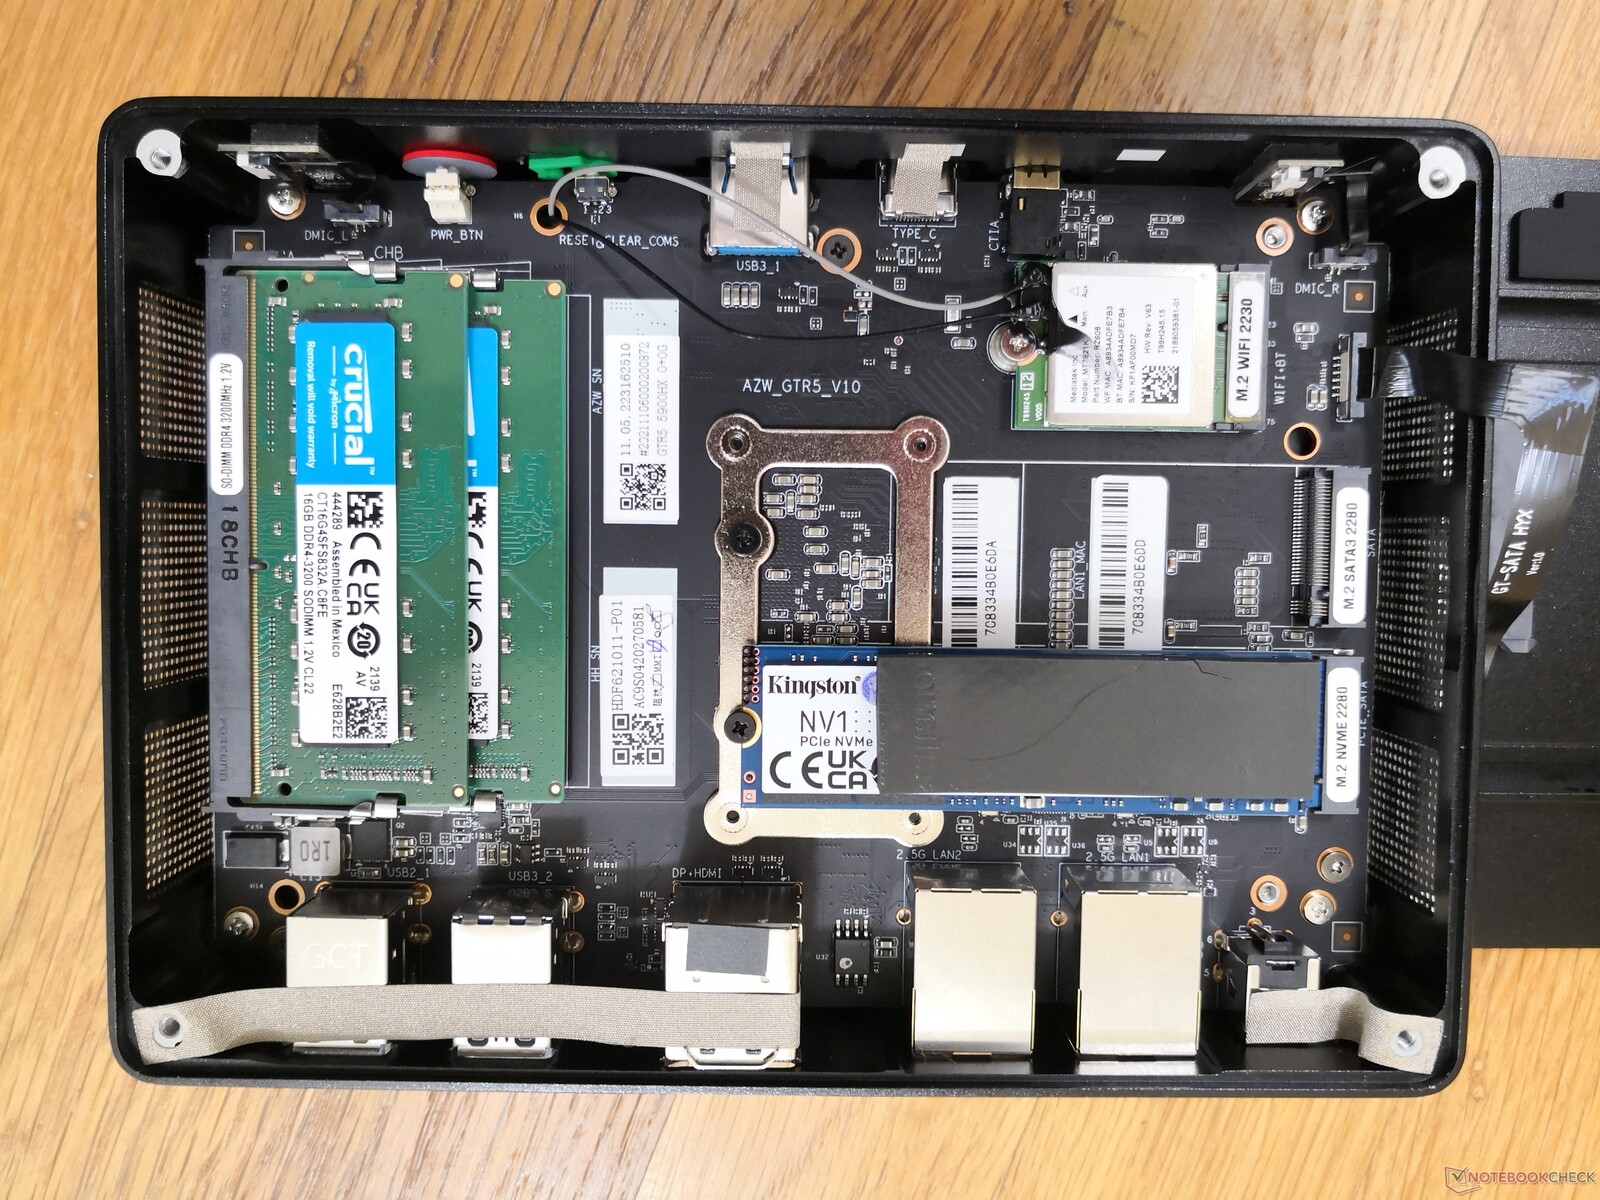
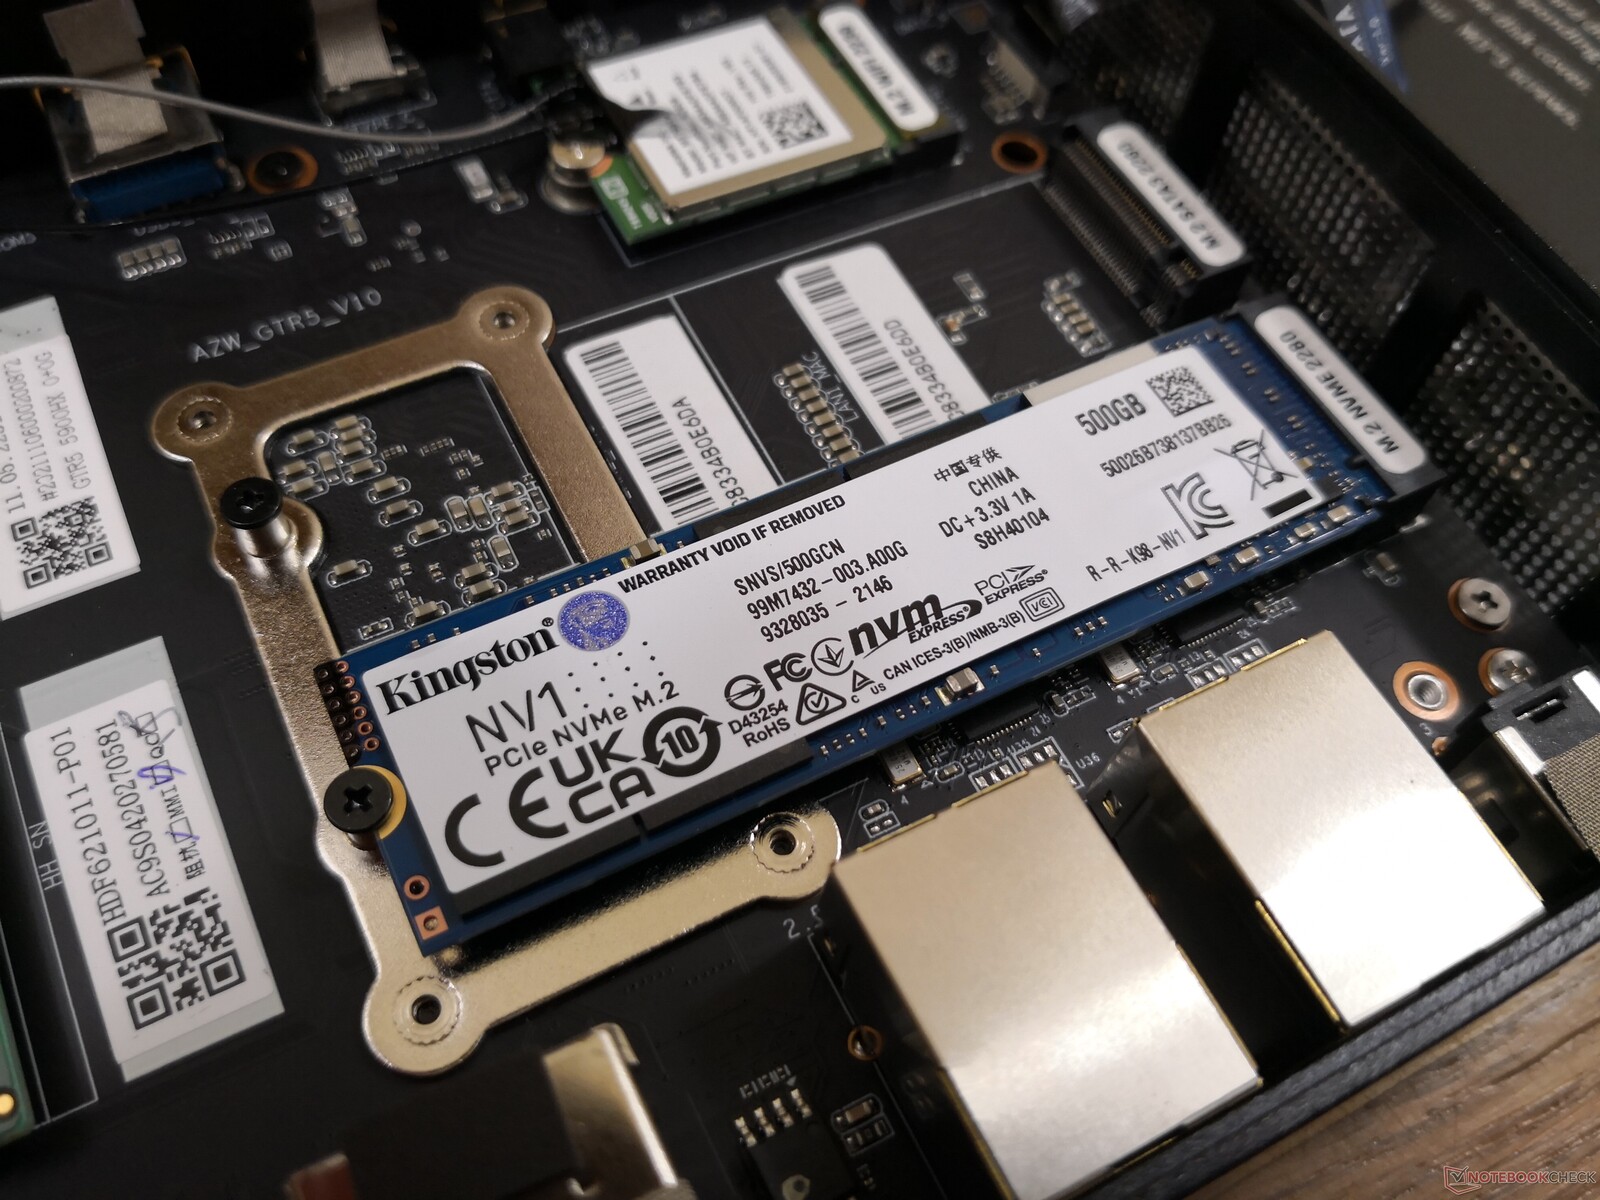
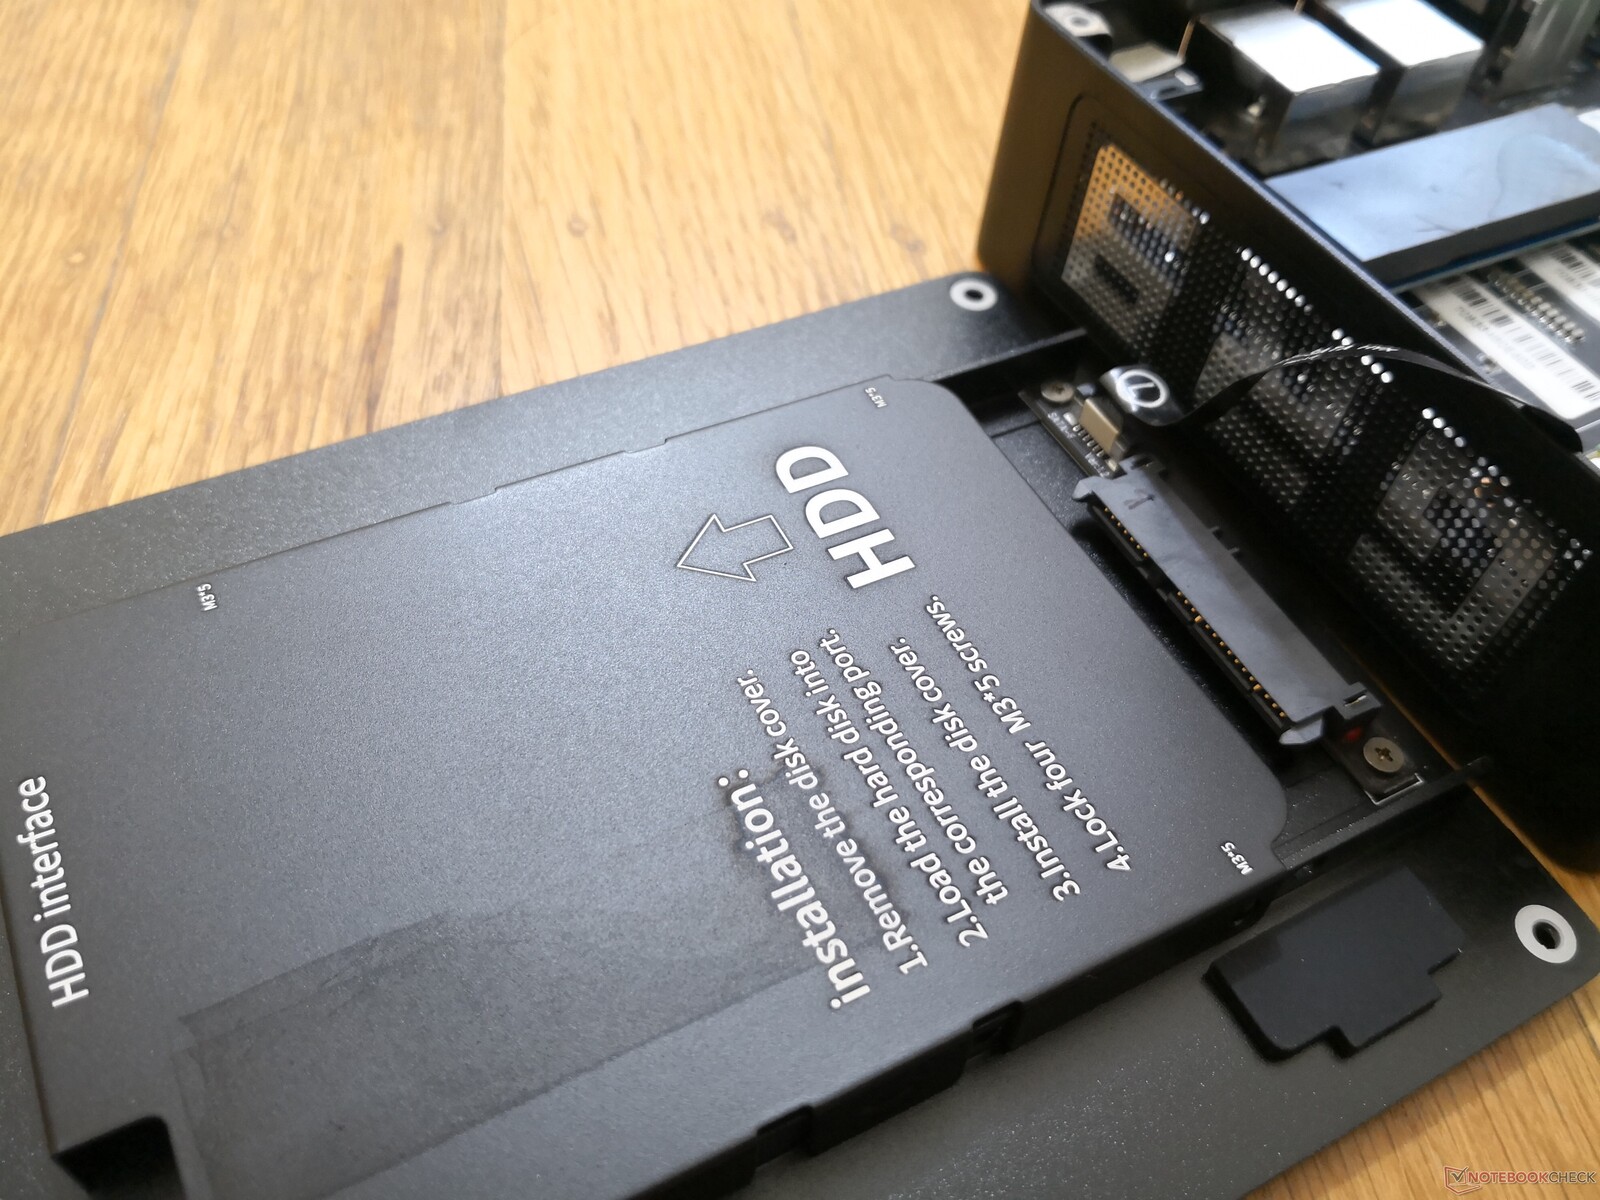
Bottenpanelen är fäst med bara fyra Philips-skruvar för enkel service. Till skillnad från tumskruvarna på en Intel NUC är skruvarna här dock mycket mindre och kräver en skruvmejsel för att tas bort. Väl inne har användarna direkt tillgång till 2x SODIMM, 3x lagringsfack och sedan WLAN-modulen. Ytterligare demontering krävs tyvärr om du vill rengöra de dubbla fläktarna som finns på andra sidan av moderkortet.
Tillbehör och garanti
I förpackningen ingår växelströmsadapter, pappersarbete, en HDMI-kabel och ett VESA-monteringsfäste med skruvar. Den vanliga ettåriga begränsade tillverkargarantin gäller
Prestanda
Provningsförhållanden
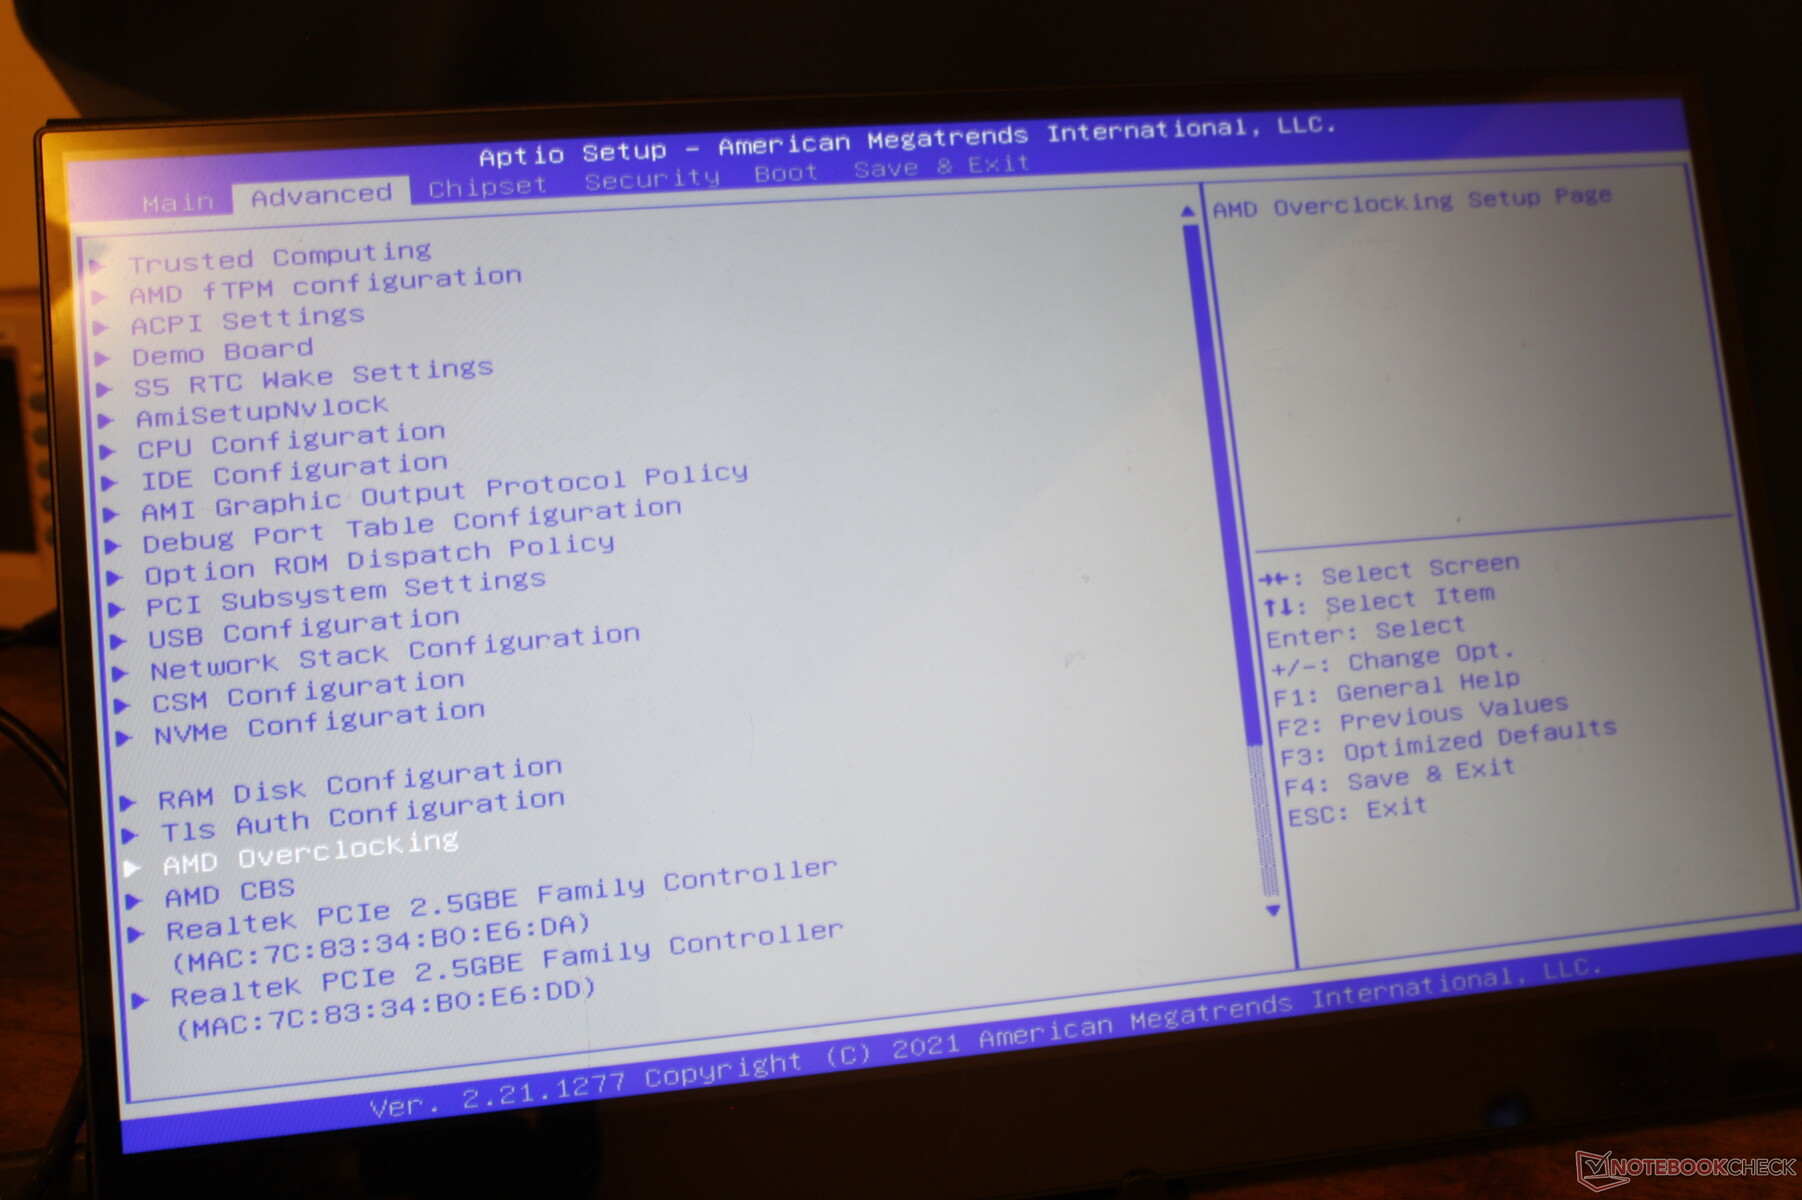
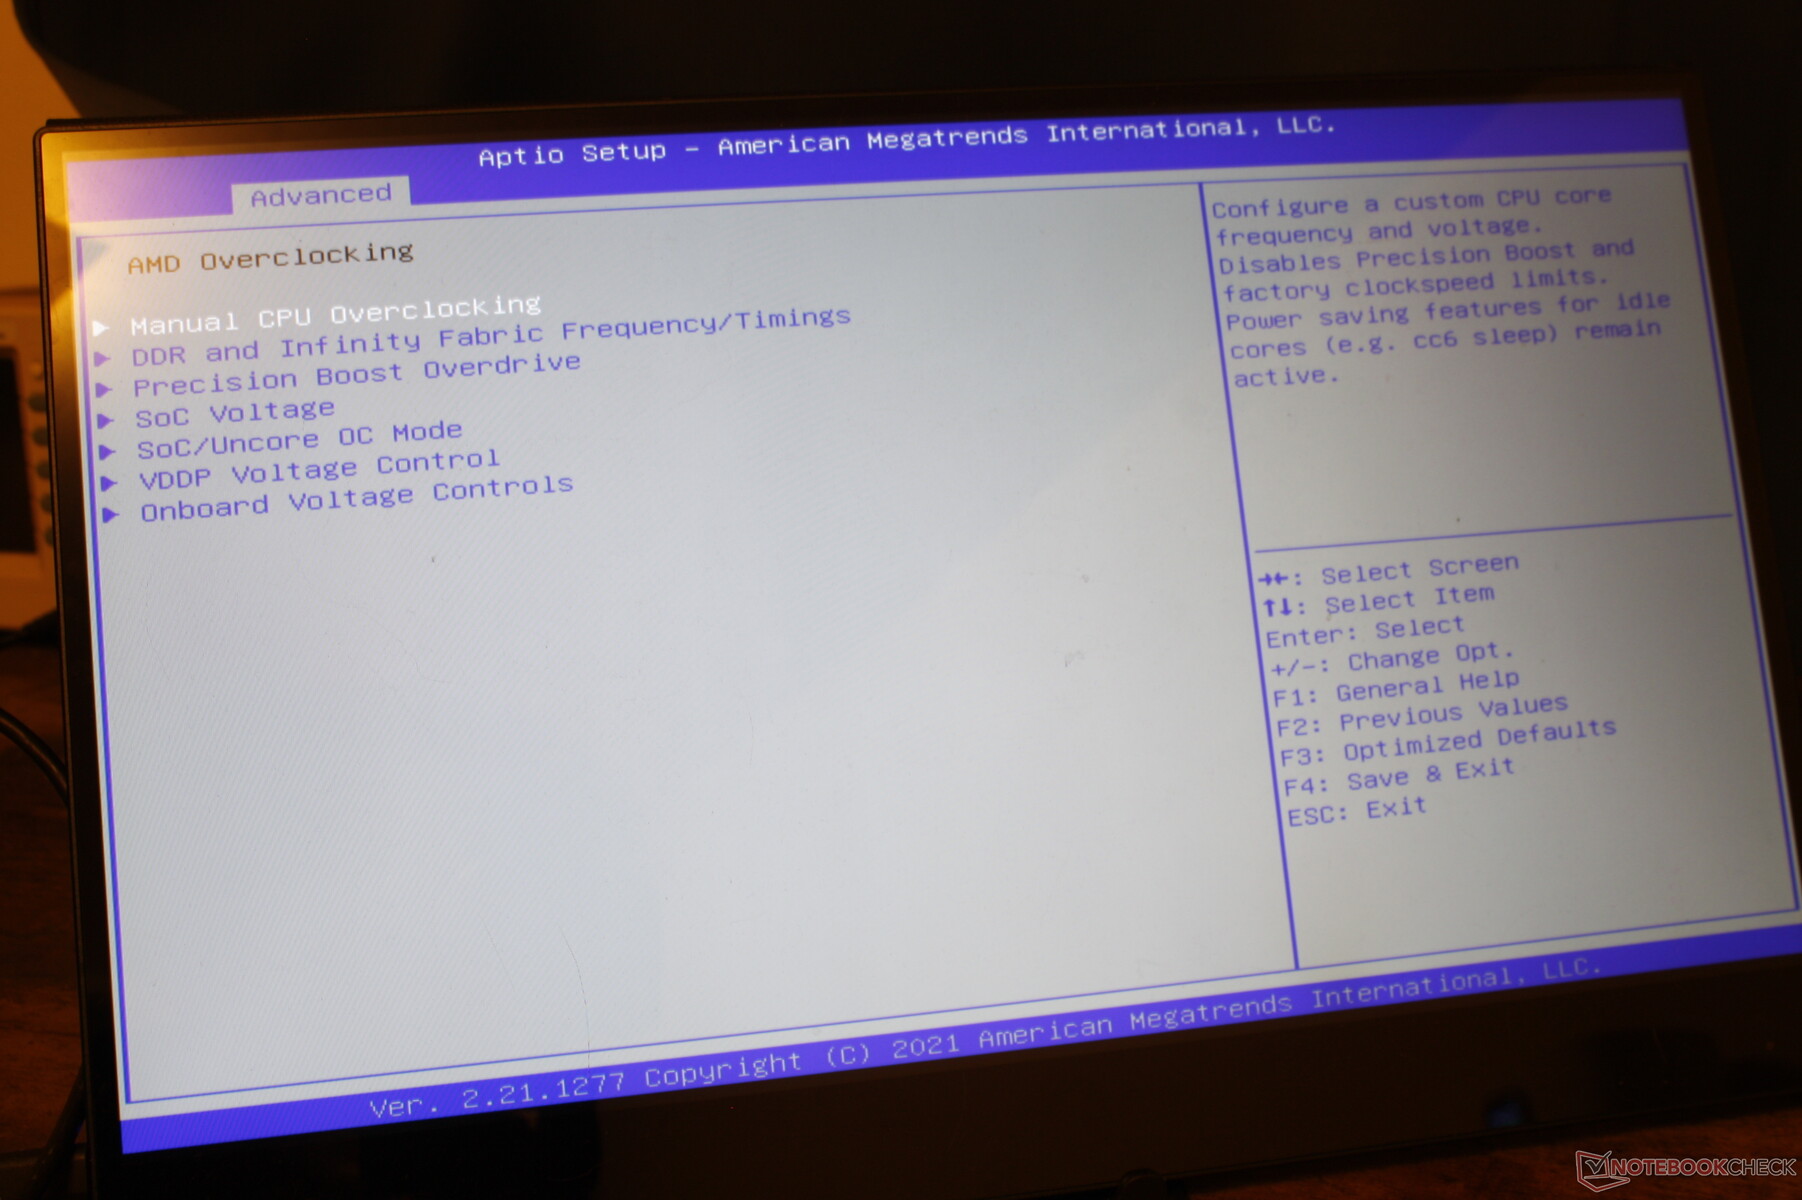
Vi använde BIOS-inställningar och Windows Performance power profile innan vi körde något av våra benchmarks nedan. Användare kan valfritt överklocka processorn via BIOS för att få ut mer prestanda om de så önskar.
Processor
Den råa CPU-prestandan med flera trådar är snabbare än på de flesta bärbara speldatorer som körs med 11:e generationens Core i7-CPU:er, samtidigt som den är jämförbar med dem på 11:e generationens Core i9. När man jämför med andra bärbara datorer med samma Ryzen 9 5900HX, kommer vår Beelink dock på efterkälken med cirka 5 procent. Prestandan är ändå mycket nära den Ryzen 9 5900X som finns på Eurocom Nightsky ARX15 även före någon överklockning.
Cinebench R15 Multi Loop
Cinebench R20: CPU (Multi Core) | CPU (Single Core)
Cinebench R15: CPU Multi 64Bit | CPU Single 64Bit
Blender: v2.79 BMW27 CPU
7-Zip 18.03: 7z b 4 | 7z b 4 -mmt1
Geekbench 5.5: Multi-Core | Single-Core
HWBOT x265 Benchmark v2.2: 4k Preset
LibreOffice : 20 Documents To PDF
R Benchmark 2.5: Overall mean
| Cinebench R23 / Multi Core | |
| MSI GE76 Raider | |
| Intel Core i9-10900K | |
| MSI GS76 Stealth 11UH | |
| Genomsnitt AMD Ryzen 9 5900HX (6622 - 14363, n=30) | |
| Minisforum HM90 | |
| Beelink GTR5 | |
| Huawei MateBook 16 R7 5800H | |
| Lenovo Legion C7 15IMH05 82EH0030GE | |
| Acer Aspire 5 A515-45-R4R1 | |
| Intel NUC11PAQi7 | |
| Asus Vivobook 15 K513EQ | |
| Beelink GTI 11 | |
| Lenovo IdeaPad 3 15ALC6 | |
| Beelink SER3 | |
| GMK NucBox 2 | |
| Beelink GK Mini | |
| Cinebench R23 / Single Core | |
| MSI GE76 Raider | |
| MSI GS76 Stealth 11UH | |
| Beelink GTR5 | |
| Asus Vivobook 15 K513EQ | |
| Genomsnitt AMD Ryzen 9 5900HX (1218 - 1499, n=29) | |
| Intel Core i9-10900K | |
| Beelink GTI 11 | |
| Huawei MateBook 16 R7 5800H | |
| Minisforum HM90 | |
| Acer Aspire 5 A515-45-R4R1 | |
| Lenovo Legion C7 15IMH05 82EH0030GE | |
| Lenovo IdeaPad 3 15ALC6 | |
| GMK NucBox 2 | |
| Beelink SER3 | |
| Beelink GK Mini | |
| Cinebench R20 / CPU (Multi Core) | |
| MSI GE76 Raider | |
| Intel Core i9-10900K | |
| MSI GS76 Stealth 11UH | |
| Genomsnitt AMD Ryzen 9 5900HX (2242 - 5476, n=30) | |
| Beelink GTR5 | |
| Minisforum HM90 | |
| Huawei MateBook 16 R7 5800H | |
| Lenovo Legion C7 15IMH05 82EH0030GE | |
| Acer Aspire 5 A515-45-R4R1 | |
| Intel NUC11PAQi7 | |
| Asus Vivobook 15 K513EQ | |
| Beelink GTI 11 | |
| Lenovo IdeaPad 3 15ALC6 | |
| Intel Hades Canyon NUC8i7HVK | |
| Beelink SER3 | |
| GMK NucBox 2 | |
| Beelink GK Mini | |
| Cinebench R20 / CPU (Single Core) | |
| MSI GE76 Raider | |
| MSI GS76 Stealth 11UH | |
| Intel NUC11PAQi7 | |
| Beelink GTR5 | |
| Genomsnitt AMD Ryzen 9 5900HX (471 - 584, n=29) | |
| Asus Vivobook 15 K513EQ | |
| Intel Core i9-10900K | |
| Beelink GTI 11 | |
| Huawei MateBook 16 R7 5800H | |
| Minisforum HM90 | |
| Acer Aspire 5 A515-45-R4R1 | |
| Lenovo Legion C7 15IMH05 82EH0030GE | |
| Lenovo IdeaPad 3 15ALC6 | |
| Intel Hades Canyon NUC8i7HVK | |
| GMK NucBox 2 | |
| Beelink SER3 | |
| Beelink GK Mini | |
| Cinebench R15 / CPU Multi 64Bit | |
| MSI GE76 Raider | |
| Intel Core i9-10900K | |
| MSI GS76 Stealth 11UH | |
| Genomsnitt AMD Ryzen 9 5900HX (1076 - 2267, n=29) | |
| Huawei MateBook 16 R7 5800H | |
| Minisforum HM90 | |
| Beelink GTR5 | |
| Lenovo Legion C7 15IMH05 82EH0030GE | |
| Acer Aspire 5 A515-45-R4R1 | |
| Intel NUC11PAQi7 | |
| Beelink GTI 11 | |
| Lenovo IdeaPad 3 15ALC6 | |
| Asus Vivobook 15 K513EQ | |
| Intel Hades Canyon NUC8i7HVK | |
| Beelink SER3 | |
| GMK NucBox 2 | |
| Beelink GK Mini | |
| Cinebench R15 / CPU Single 64Bit | |
| MSI GE76 Raider | |
| Beelink GTR5 | |
| MSI GS76 Stealth 11UH | |
| Genomsnitt AMD Ryzen 9 5900HX (197 - 243, n=25) | |
| Huawei MateBook 16 R7 5800H | |
| Intel NUC11PAQi7 | |
| Asus Vivobook 15 K513EQ | |
| Intel Core i9-10900K | |
| Lenovo Legion C7 15IMH05 82EH0030GE | |
| Beelink GTI 11 | |
| Minisforum HM90 | |
| Acer Aspire 5 A515-45-R4R1 | |
| Intel Hades Canyon NUC8i7HVK | |
| Lenovo IdeaPad 3 15ALC6 | |
| GMK NucBox 2 | |
| Beelink SER3 | |
| Beelink GK Mini | |
| Blender / v2.79 BMW27 CPU | |
| Beelink GK Mini | |
| GMK NucBox 2 | |
| Beelink SER3 | |
| Beelink GTI 11 | |
| Asus Vivobook 15 K513EQ | |
| Intel Hades Canyon NUC8i7HVK | |
| Lenovo IdeaPad 3 15ALC6 | |
| Intel NUC11PAQi7 | |
| Acer Aspire 5 A515-45-R4R1 | |
| Lenovo Legion C7 15IMH05 82EH0030GE | |
| Beelink GTR5 | |
| Huawei MateBook 16 R7 5800H | |
| Genomsnitt AMD Ryzen 9 5900HX (219 - 442, n=29) | |
| MSI GS76 Stealth 11UH | |
| Minisforum HM90 | |
| MSI GE76 Raider | |
| Intel Core i9-10900K | |
| 7-Zip 18.03 / 7z b 4 | |
| MSI GE76 Raider | |
| Intel Core i9-10900K | |
| Genomsnitt AMD Ryzen 9 5900HX (36011 - 62503, n=29) | |
| Beelink GTR5 | |
| Huawei MateBook 16 R7 5800H | |
| MSI GS76 Stealth 11UH | |
| Minisforum HM90 | |
| Lenovo Legion C7 15IMH05 82EH0030GE | |
| Acer Aspire 5 A515-45-R4R1 | |
| Intel NUC11PAQi7 | |
| Asus Vivobook 15 K513EQ | |
| Beelink GTI 11 | |
| Lenovo IdeaPad 3 15ALC6 | |
| Intel Hades Canyon NUC8i7HVK | |
| GMK NucBox 2 | |
| Beelink SER3 | |
| Beelink GK Mini | |
| 7-Zip 18.03 / 7z b 4 -mmt1 | |
| MSI GE76 Raider | |
| Intel Core i9-10900K | |
| Beelink GTR5 | |
| Genomsnitt AMD Ryzen 9 5900HX (4791 - 5905, n=29) | |
| MSI GS76 Stealth 11UH | |
| Huawei MateBook 16 R7 5800H | |
| Lenovo Legion C7 15IMH05 82EH0030GE | |
| Intel NUC11PAQi7 | |
| Asus Vivobook 15 K513EQ | |
| Beelink GTI 11 | |
| Minisforum HM90 | |
| Acer Aspire 5 A515-45-R4R1 | |
| Lenovo IdeaPad 3 15ALC6 | |
| Intel Hades Canyon NUC8i7HVK | |
| GMK NucBox 2 | |
| Beelink SER3 | |
| Beelink GK Mini | |
| Geekbench 5.5 / Multi-Core | |
| MSI GE76 Raider | |
| Intel Core i9-10900K | |
| MSI GS76 Stealth 11UH | |
| Genomsnitt AMD Ryzen 9 5900HX (5057 - 9294, n=27) | |
| Lenovo Legion C7 15IMH05 82EH0030GE | |
| Beelink GTR5 | |
| Huawei MateBook 16 R7 5800H | |
| Minisforum HM90 | |
| Beelink GTI 11 | |
| Acer Aspire 5 A515-45-R4R1 | |
| Intel NUC11PAQi7 | |
| Lenovo IdeaPad 3 15ALC6 | |
| GMK NucBox 2 | |
| Beelink GK Mini | |
| Geekbench 5.5 / Single-Core | |
| MSI GE76 Raider | |
| MSI GS76 Stealth 11UH | |
| Beelink GTR5 | |
| Intel NUC11PAQi7 | |
| Genomsnitt AMD Ryzen 9 5900HX (1271 - 1574, n=27) | |
| Huawei MateBook 16 R7 5800H | |
| Intel Core i9-10900K | |
| Beelink GTI 11 | |
| Lenovo Legion C7 15IMH05 82EH0030GE | |
| Minisforum HM90 | |
| Acer Aspire 5 A515-45-R4R1 | |
| Lenovo IdeaPad 3 15ALC6 | |
| GMK NucBox 2 | |
| Beelink GK Mini | |
| HWBOT x265 Benchmark v2.2 / 4k Preset | |
| Intel Core i9-10900K | |
| MSI GE76 Raider | |
| Genomsnitt AMD Ryzen 9 5900HX (8.26 - 17.1, n=29) | |
| MSI GS76 Stealth 11UH | |
| Beelink GTR5 | |
| Huawei MateBook 16 R7 5800H | |
| Minisforum HM90 | |
| Lenovo Legion C7 15IMH05 82EH0030GE | |
| Acer Aspire 5 A515-45-R4R1 | |
| Intel NUC11PAQi7 | |
| Asus Vivobook 15 K513EQ | |
| Intel Hades Canyon NUC8i7HVK | |
| Beelink GTI 11 | |
| Lenovo IdeaPad 3 15ALC6 | |
| GMK NucBox 2 | |
| Beelink SER3 | |
| Beelink GK Mini | |
| LibreOffice / 20 Documents To PDF | |
| Beelink GK Mini | |
| Beelink SER3 | |
| Intel Core i9-10900K | |
| Minisforum HM90 | |
| GMK NucBox 2 | |
| Lenovo IdeaPad 3 15ALC6 | |
| Acer Aspire 5 A515-45-R4R1 | |
| Lenovo Legion C7 15IMH05 82EH0030GE | |
| Beelink GTI 11 | |
| Genomsnitt AMD Ryzen 9 5900HX (44.1 - 87.4, n=29) | |
| Beelink GTR5 | |
| Huawei MateBook 16 R7 5800H | |
| MSI GS76 Stealth 11UH | |
| Asus Vivobook 15 K513EQ | |
| Intel NUC11PAQi7 | |
| MSI GE76 Raider | |
| R Benchmark 2.5 / Overall mean | |
| Beelink GK Mini | |
| GMK NucBox 2 | |
| Beelink SER3 | |
| Lenovo IdeaPad 3 15ALC6 | |
| Beelink GTI 11 | |
| Acer Aspire 5 A515-45-R4R1 | |
| Lenovo Legion C7 15IMH05 82EH0030GE | |
| Minisforum HM90 | |
| Asus Vivobook 15 K513EQ | |
| Intel NUC11PAQi7 | |
| MSI GS76 Stealth 11UH | |
| Intel Core i9-10900K | |
| Huawei MateBook 16 R7 5800H | |
| Genomsnitt AMD Ryzen 9 5900HX (0.48 - 0.599, n=29) | |
| Beelink GTR5 | |
| MSI GE76 Raider | |
Cinebench R20: CPU (Multi Core) | CPU (Single Core)
Cinebench R15: CPU Multi 64Bit | CPU Single 64Bit
Blender: v2.79 BMW27 CPU
7-Zip 18.03: 7z b 4 | 7z b 4 -mmt1
Geekbench 5.5: Multi-Core | Single-Core
HWBOT x265 Benchmark v2.2: 4k Preset
LibreOffice : 20 Documents To PDF
R Benchmark 2.5: Overall mean
* ... mindre är bättre
AIDA64: FP32 Ray-Trace | FPU Julia | CPU SHA3 | CPU Queen | FPU SinJulia | FPU Mandel | CPU AES | CPU ZLib | FP64 Ray-Trace | CPU PhotoWorxx
| Performance rating | |
| Genomsnitt AMD Ryzen 9 5900HX | |
| Beelink GTR5 | |
| Beelink GTI 11 | |
| Intel NUC11PHKi7C | |
| GMK NucBox 2 | |
| Beelink GK Mini | |
| AIDA64 / FP32 Ray-Trace | |
| Genomsnitt AMD Ryzen 9 5900HX (12470 - 16014, n=26) | |
| Beelink GTR5 | |
| Beelink GTI 11 | |
| Intel NUC11PHKi7C | |
| GMK NucBox 2 | |
| Beelink GK Mini | |
| AIDA64 / FPU Julia | |
| Genomsnitt AMD Ryzen 9 5900HX (79554 - 101008, n=26) | |
| Beelink GTR5 | |
| Beelink GTI 11 | |
| Intel NUC11PHKi7C | |
| GMK NucBox 2 | |
| Beelink GK Mini | |
| AIDA64 / CPU SHA3 | |
| Genomsnitt AMD Ryzen 9 5900HX (2754 - 3444, n=26) | |
| Beelink GTR5 | |
| Beelink GTI 11 | |
| Intel NUC11PHKi7C | |
| GMK NucBox 2 | |
| Beelink GK Mini | |
| AIDA64 / CPU Queen | |
| Genomsnitt AMD Ryzen 9 5900HX (87865 - 105123, n=26) | |
| Beelink GTR5 | |
| Intel NUC11PHKi7C | |
| Beelink GTI 11 | |
| GMK NucBox 2 | |
| Beelink GK Mini | |
| AIDA64 / FPU SinJulia | |
| Beelink GTR5 | |
| Genomsnitt AMD Ryzen 9 5900HX (10899 - 12806, n=26) | |
| Intel NUC11PHKi7C | |
| Beelink GTI 11 | |
| GMK NucBox 2 | |
| Beelink GK Mini | |
| AIDA64 / FPU Mandel | |
| Genomsnitt AMD Ryzen 9 5900HX (43685 - 55702, n=26) | |
| Beelink GTR5 | |
| Intel NUC11PHKi7C | |
| Beelink GTI 11 | |
| GMK NucBox 2 | |
| Beelink GK Mini | |
| AIDA64 / CPU AES | |
| Genomsnitt AMD Ryzen 9 5900HX (109927 - 137901, n=26) | |
| Beelink GTR5 | |
| Intel NUC11PHKi7C | |
| Beelink GTI 11 | |
| GMK NucBox 2 | |
| Beelink GK Mini | |
| AIDA64 / CPU ZLib | |
| Genomsnitt AMD Ryzen 9 5900HX (706 - 878, n=26) | |
| Beelink GTR5 | |
| Intel NUC11PHKi7C | |
| Beelink GTI 11 | |
| GMK NucBox 2 | |
| Beelink GK Mini | |
| AIDA64 / FP64 Ray-Trace | |
| Genomsnitt AMD Ryzen 9 5900HX (6664 - 8644, n=26) | |
| Beelink GTR5 | |
| Beelink GTI 11 | |
| Intel NUC11PHKi7C | |
| GMK NucBox 2 | |
| Beelink GK Mini | |
| AIDA64 / CPU PhotoWorxx | |
| Beelink GTI 11 | |
| Intel NUC11PHKi7C | |
| Beelink GTR5 | |
| Genomsnitt AMD Ryzen 9 5900HX (14344 - 25533, n=26) | |
| GMK NucBox 2 | |
| Beelink GK Mini | |
Systemets prestanda
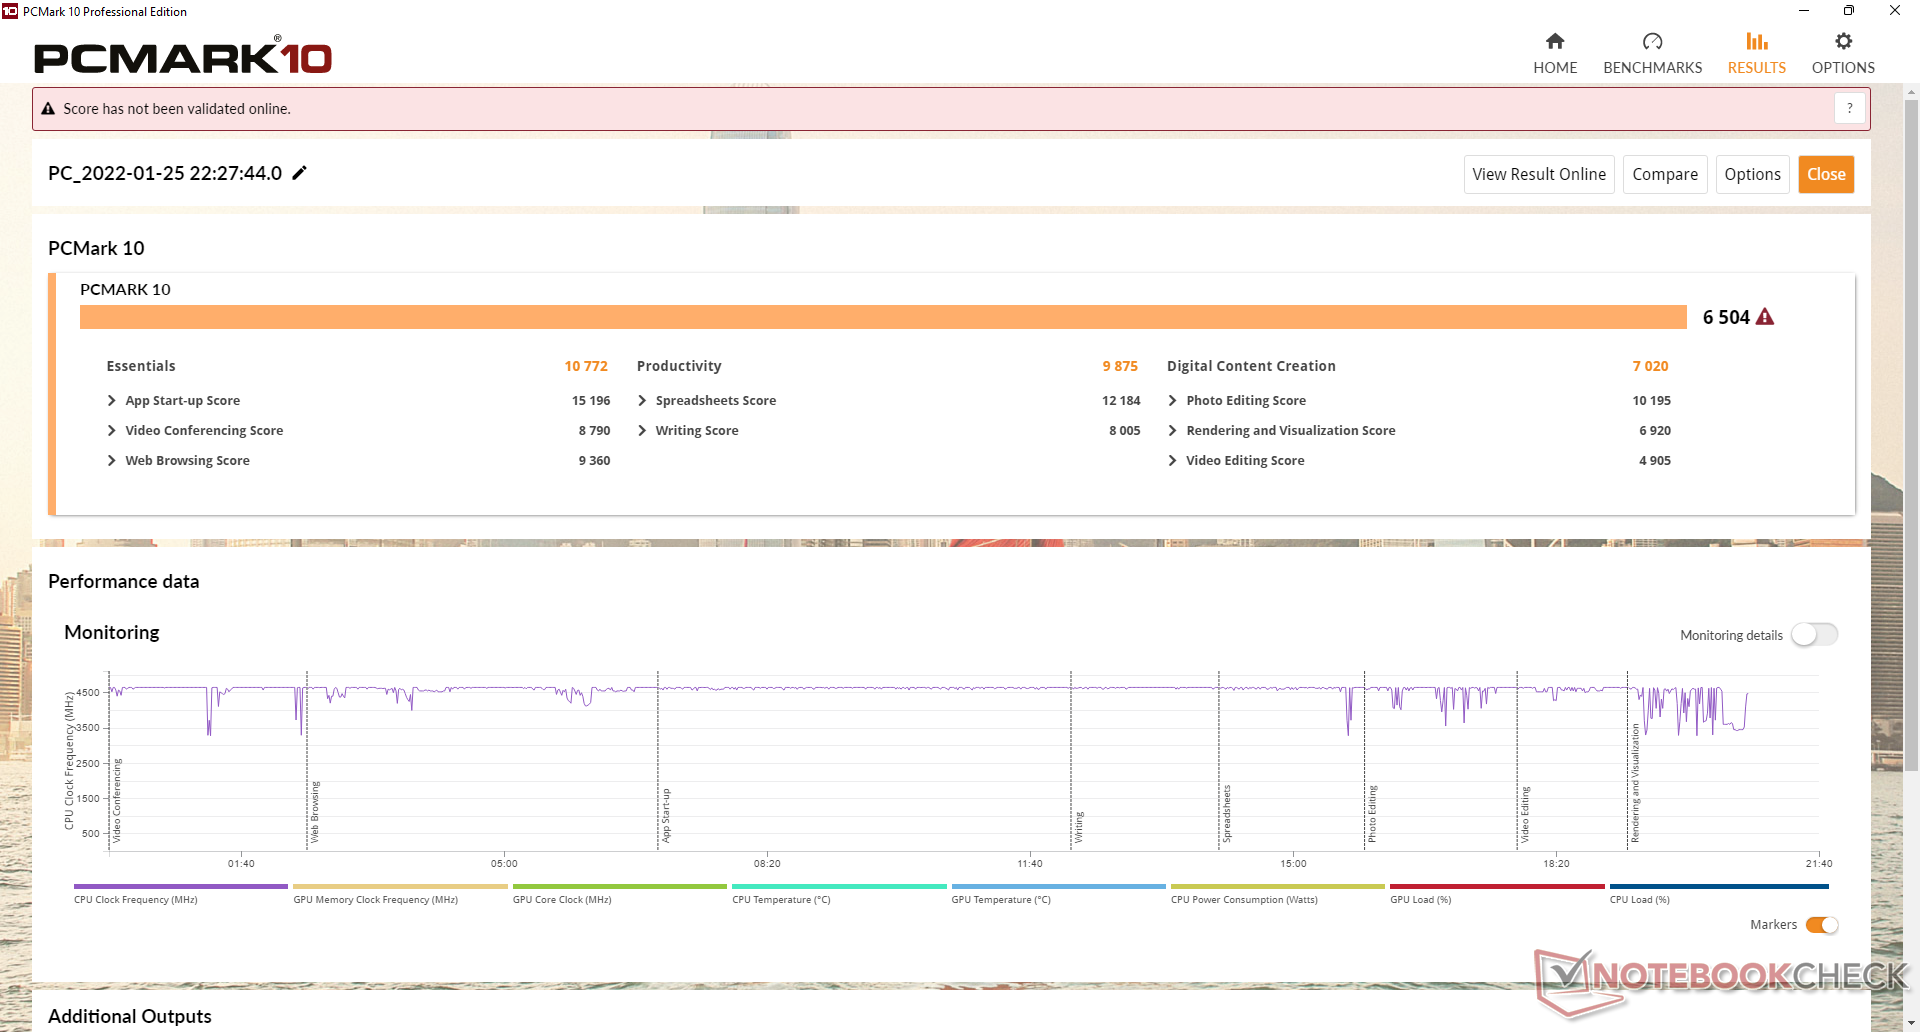
PCMark-resultaten är utmärkta och ligger långt över de flesta andra minidatorer och NUC:er. Vi stötte dock på två krascher under våra tester där enheten automatiskt stängdes av utan anledning. Vi kunde inte på ett tillförlitligt sätt upprepa krascherna på gott och ont.
CrossMark: Overall | Productivity | Creativity | Responsiveness
| PCMark 10 / Score | |
| Beelink GTR5 | |
| Genomsnitt AMD Ryzen 9 5900HX, AMD Radeon RX Vega 8 (Ryzen 4000/5000) (6290 - 6507, n=5) | |
| Intel NUC11PHKi7C | |
| Intel NUC11PAQi7 | |
| Beelink GTI 11 | |
| GMK NucBox 2 | |
| Beelink GK Mini | |
| PCMark 10 / Essentials | |
| Beelink GTR5 | |
| Genomsnitt AMD Ryzen 9 5900HX, AMD Radeon RX Vega 8 (Ryzen 4000/5000) (10087 - 10836, n=5) | |
| Intel NUC11PAQi7 | |
| Beelink GTI 11 | |
| Intel NUC11PHKi7C | |
| GMK NucBox 2 | |
| Beelink GK Mini | |
| PCMark 10 / Productivity | |
| Genomsnitt AMD Ryzen 9 5900HX, AMD Radeon RX Vega 8 (Ryzen 4000/5000) (9852 - 10196, n=5) | |
| Beelink GTR5 | |
| Intel NUC11PHKi7C | |
| Intel NUC11PAQi7 | |
| Beelink GTI 11 | |
| GMK NucBox 2 | |
| Beelink GK Mini | |
| PCMark 10 / Digital Content Creation | |
| Beelink GTR5 | |
| Intel NUC11PHKi7C | |
| Genomsnitt AMD Ryzen 9 5900HX, AMD Radeon RX Vega 8 (Ryzen 4000/5000) (6660 - 7105, n=5) | |
| Beelink GTI 11 | |
| Intel NUC11PAQi7 | |
| GMK NucBox 2 | |
| Beelink GK Mini | |
| CrossMark / Overall | |
| Beelink GTR5 | |
| Genomsnitt AMD Ryzen 9 5900HX, AMD Radeon RX Vega 8 (Ryzen 4000/5000) (1402 - 1501, n=2) | |
| CrossMark / Productivity | |
| Beelink GTR5 | |
| Genomsnitt AMD Ryzen 9 5900HX, AMD Radeon RX Vega 8 (Ryzen 4000/5000) (1387 - 1495, n=2) | |
| CrossMark / Creativity | |
| Beelink GTR5 | |
| Genomsnitt AMD Ryzen 9 5900HX, AMD Radeon RX Vega 8 (Ryzen 4000/5000) (1553 - 1589, n=2) | |
| CrossMark / Responsiveness | |
| Beelink GTR5 | |
| Genomsnitt AMD Ryzen 9 5900HX, AMD Radeon RX Vega 8 (Ryzen 4000/5000) (1068 - 1281, n=2) | |
| PCMark 10 Score | 6504 poäng | |
Hjälp | ||
| AIDA64 / Memory Copy | |
| GMK NucBox 2 | |
| Beelink GTR5 | |
| Beelink GTI 11 | |
| Genomsnitt AMD Ryzen 9 5900HX (36725 - 43318, n=26) | |
| Intel NUC11PHKi7C | |
| Beelink GK Mini | |
| AIDA64 / Memory Read | |
| Beelink GTR5 | |
| Beelink GTI 11 | |
| Genomsnitt AMD Ryzen 9 5900HX (41378 - 47593, n=26) | |
| Intel NUC11PHKi7C | |
| GMK NucBox 2 | |
| Beelink GK Mini | |
| AIDA64 / Memory Write | |
| GMK NucBox 2 | |
| Beelink GTI 11 | |
| Beelink GTR5 | |
| Genomsnitt AMD Ryzen 9 5900HX (32536 - 46718, n=26) | |
| Intel NUC11PHKi7C | |
| Beelink GK Mini | |
| AIDA64 / Memory Latency | |
| Intel NUC11PHKi7C | |
| Beelink GTR5 | |
| Genomsnitt AMD Ryzen 9 5900HX (73.5 - 97.1, n=26) | |
| Beelink GK Mini | |
| Beelink GTI 11 | |
| GMK NucBox 2 | |
* ... mindre är bättre
DPC-latenstid
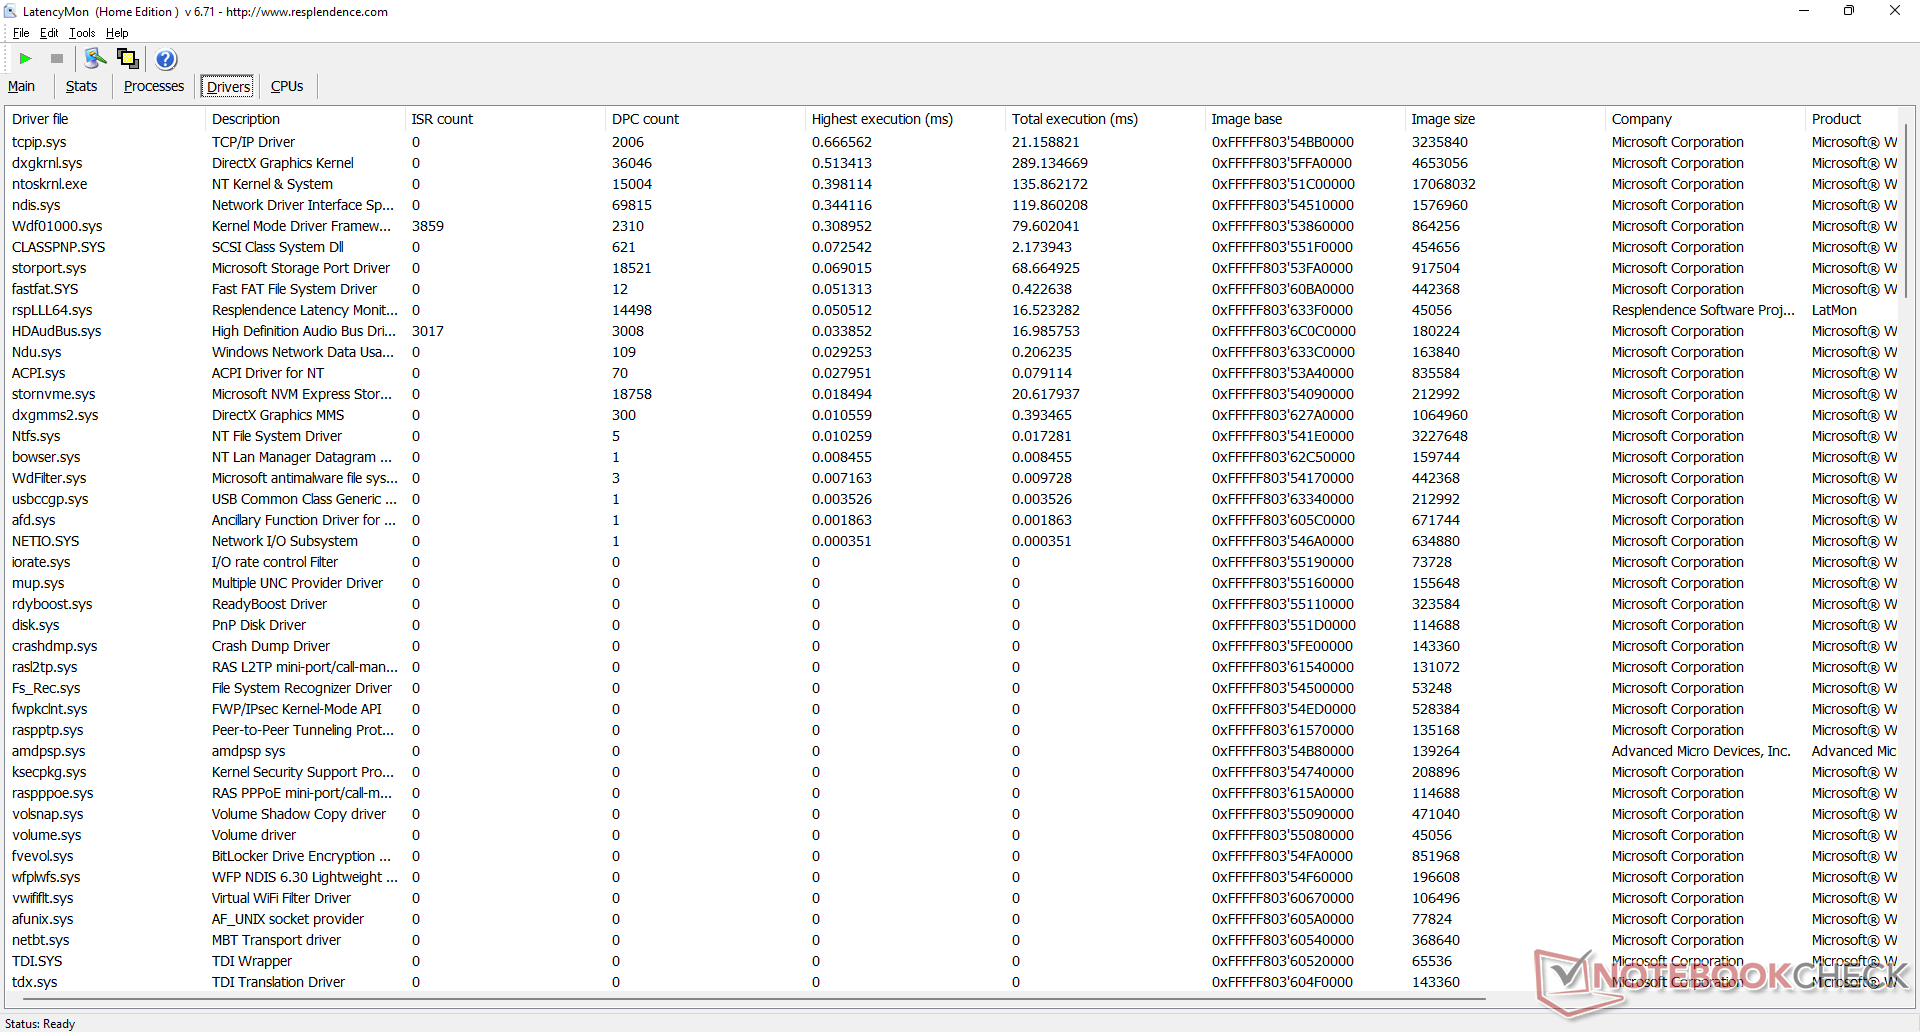
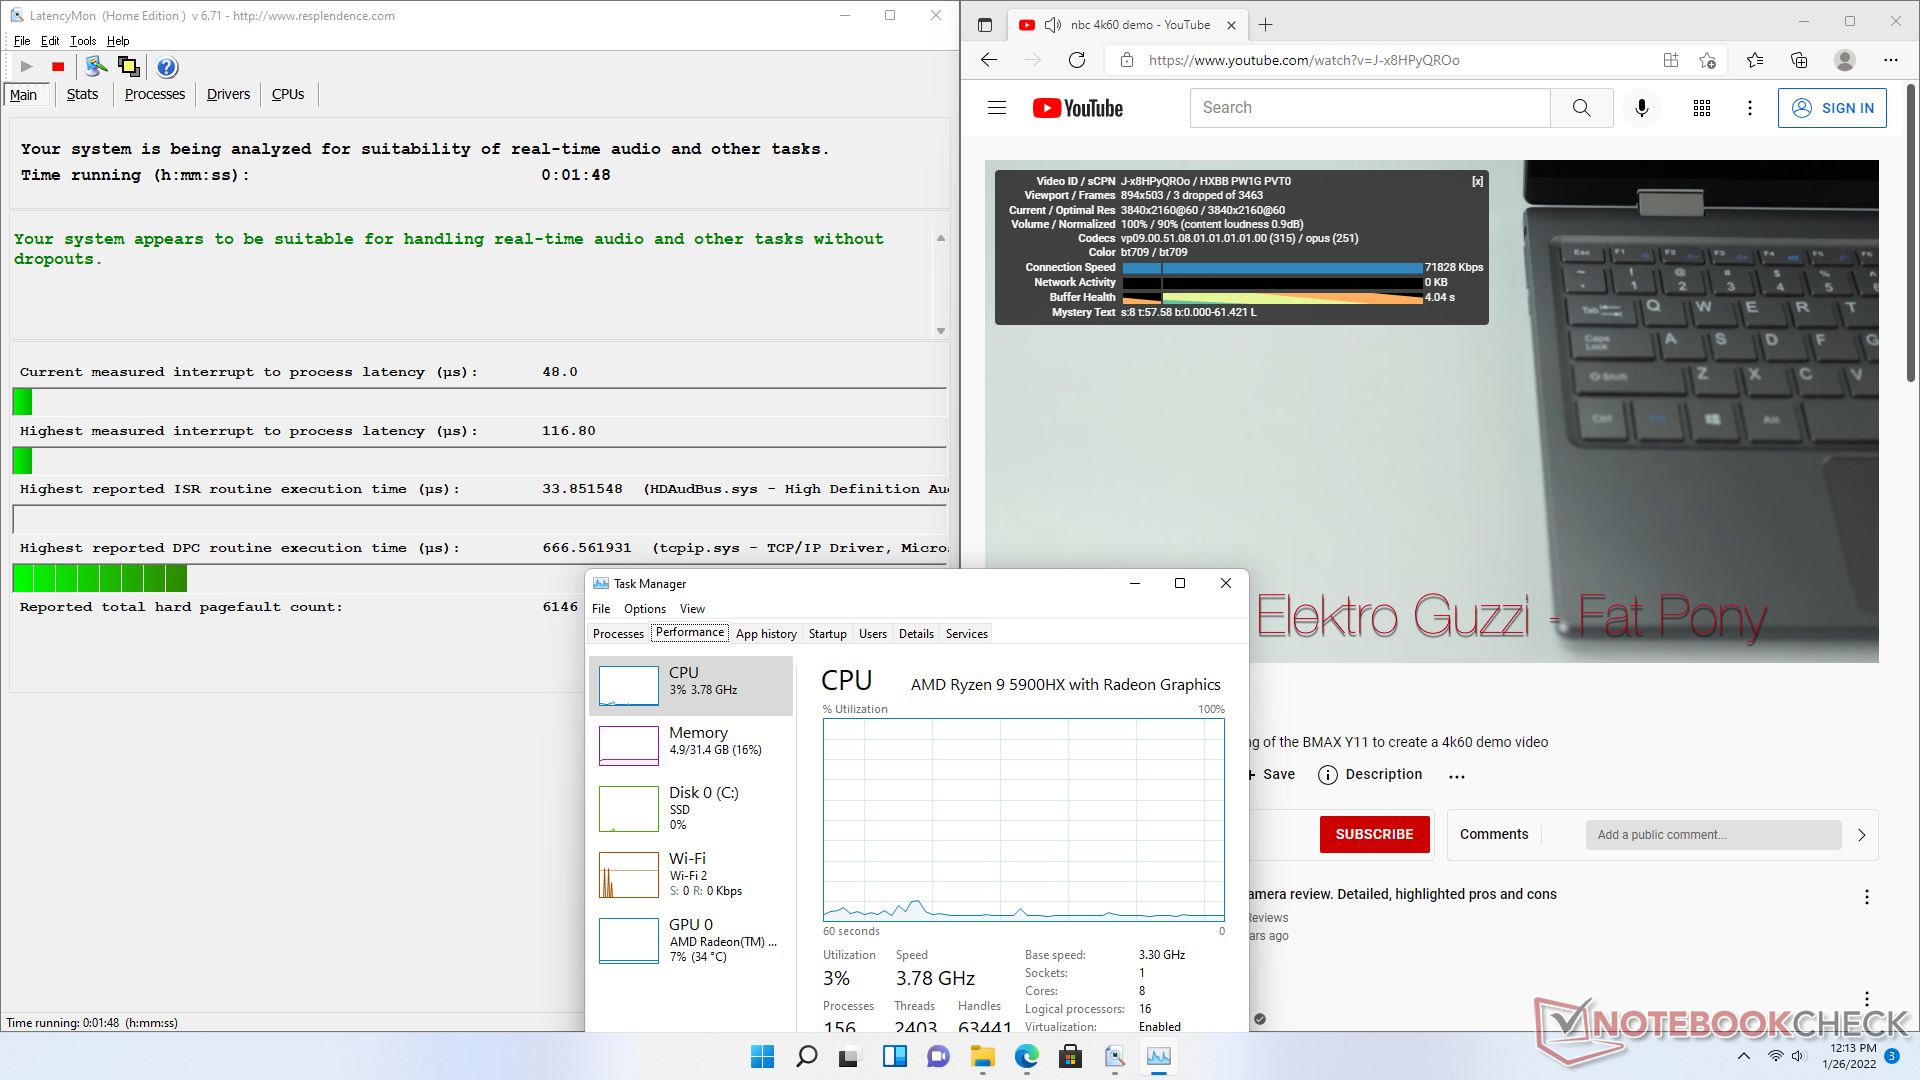
LatencyMon visar inga DPC-problem när vi öppnar flera webbläsarflikar på vår hemsida. uppspelning av 4K-video vid 60 FPS är smidig med endast 3 tappade bilder under vårt minutlånga YouTube-test.
| DPC Latencies / LatencyMon - interrupt to process latency (max), Web, Youtube, Prime95 | |
| Beelink GK Mini | |
| Intel NUC11PHKi7C | |
| GMK NucBox 2 | |
| Intel NUC11PAQi7 | |
| Beelink GTI 11 | |
| Beelink GTR5 | |
* ... mindre är bättre
Lagringsenheter
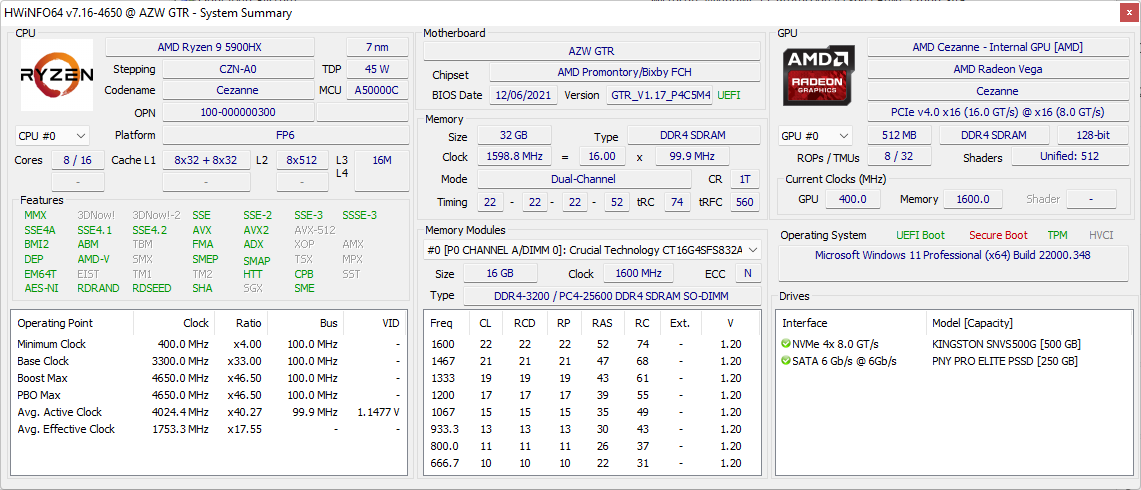
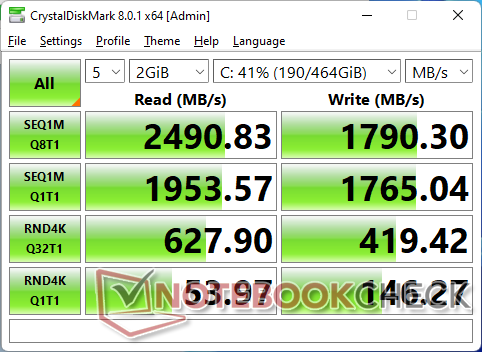
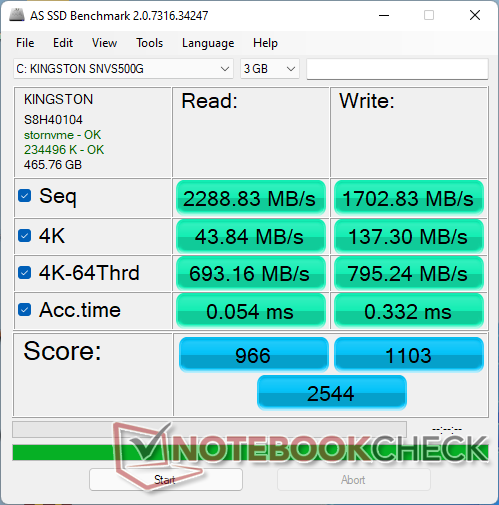
Vår testenhet har en mellanklassig 500 GB Kingston NV1 PCIe3 x4 SSD. PCIe4-hastigheter stöds inte till skillnad från de senaste Intel NUC:erna som körs med 11:e generationens Core CPU:er. Kingston-enheten visar annars inga problem med att upprätthålla sin maximala överföringshastighet på ~2300 MB/s under längre perioder.

| Drive Performance rating - Percent | |
| Intel NUC11PAQi7 | |
| Beelink GTI 11 | |
| Intel NUC11PHKi7C | |
| Beelink GTR5 | |
| GMK NucBox 2 | |
| Beelink GK Mini | |
| DiskSpd | |
| seq read | |
| Intel NUC11PAQi7 | |
| Intel NUC11PHKi7C | |
| Beelink GTR5 | |
| GMK NucBox 2 | |
| Beelink GTI 11 | |
| Beelink GK Mini | |
| seq write | |
| Intel NUC11PAQi7 | |
| Intel NUC11PHKi7C | |
| Beelink GTI 11 | |
| Beelink GTR5 | |
| GMK NucBox 2 | |
| Beelink GK Mini | |
| seq q8 t1 read | |
| Intel NUC11PAQi7 | |
| Intel NUC11PHKi7C | |
| Beelink GTR5 | |
| GMK NucBox 2 | |
| Beelink GTI 11 | |
| Beelink GK Mini | |
| seq q8 t1 write | |
| Intel NUC11PAQi7 | |
| Intel NUC11PHKi7C | |
| Beelink GTI 11 | |
| Beelink GTR5 | |
| GMK NucBox 2 | |
| Beelink GK Mini | |
| 4k q1 t1 read | |
| Beelink GTI 11 | |
| Intel NUC11PAQi7 | |
| Beelink GTR5 | |
| Intel NUC11PHKi7C | |
| GMK NucBox 2 | |
| Beelink GK Mini | |
| 4k q1 t1 write | |
| Beelink GTI 11 | |
| Beelink GTR5 | |
| GMK NucBox 2 | |
| Intel NUC11PAQi7 | |
| Beelink GK Mini | |
| Intel NUC11PHKi7C | |
| 4k q32 t16 read | |
| Intel NUC11PAQi7 | |
| Intel NUC11PHKi7C | |
| Beelink GTI 11 | |
| Beelink GTR5 | |
| GMK NucBox 2 | |
| Beelink GK Mini | |
| 4k q32 t16 write | |
| Intel NUC11PAQi7 | |
| Beelink GTI 11 | |
| Beelink GTR5 | |
| GMK NucBox 2 | |
| Intel NUC11PHKi7C | |
| Beelink GK Mini | |
| AS SSD | |
| Score Total | |
| Intel NUC11PAQi7 | |
| Intel NUC11PHKi7C | |
| Beelink GTI 11 | |
| Beelink GTR5 | |
| GMK NucBox 2 | |
| Beelink GK Mini | |
| Score Read | |
| Intel NUC11PAQi7 | |
| Intel NUC11PHKi7C | |
| Beelink GTI 11 | |
| Beelink GTR5 | |
| GMK NucBox 2 | |
| Beelink GK Mini | |
| Score Write | |
| Intel NUC11PAQi7 | |
| Intel NUC11PHKi7C | |
| Beelink GTI 11 | |
| Beelink GTR5 | |
| GMK NucBox 2 | |
| Beelink GK Mini | |
| Seq Read | |
| Intel NUC11PAQi7 | |
| Intel NUC11PHKi7C | |
| Beelink GTR5 | |
| GMK NucBox 2 | |
| Beelink GTI 11 | |
| Beelink GK Mini | |
| Seq Write | |
| Intel NUC11PAQi7 | |
| Beelink GTI 11 | |
| Beelink GTR5 | |
| Intel NUC11PHKi7C | |
| GMK NucBox 2 | |
| Beelink GK Mini | |
| 4K Read | |
| Beelink GTI 11 | |
| Intel NUC11PAQi7 | |
| Beelink GTR5 | |
| GMK NucBox 2 | |
| Intel NUC11PHKi7C | |
| Beelink GK Mini | |
| 4K Write | |
| Beelink GTI 11 | |
| Beelink GTR5 | |
| GMK NucBox 2 | |
| Intel NUC11PAQi7 | |
| Intel NUC11PHKi7C | |
| Beelink GK Mini | |
| 4K-64 Read | |
| Intel NUC11PAQi7 | |
| Intel NUC11PHKi7C | |
| Beelink GTI 11 | |
| Beelink GTR5 | |
| GMK NucBox 2 | |
| Beelink GK Mini | |
| 4K-64 Write | |
| Intel NUC11PAQi7 | |
| Intel NUC11PHKi7C | |
| Beelink GTI 11 | |
| Beelink GTR5 | |
| GMK NucBox 2 | |
| Beelink GK Mini | |
| Access Time Read | |
| Beelink GK Mini | |
| Intel NUC11PHKi7C | |
| GMK NucBox 2 | |
| Intel NUC11PAQi7 | |
| Beelink GTR5 | |
| Beelink GTI 11 | |
| Access Time Write | |
| GMK NucBox 2 | |
| Beelink GTR5 | |
| Beelink GK Mini | |
| Intel NUC11PHKi7C | |
| Intel NUC11PAQi7 | |
| Beelink GTI 11 | |
* ... mindre är bättre
Disk Throttling: DiskSpd Read Loop, Queue Depth 8
GPU-prestanda
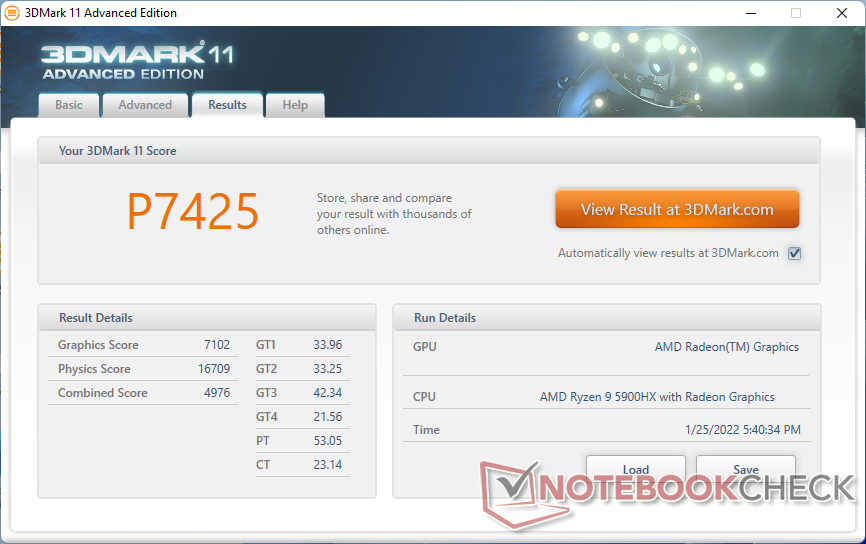
Den integreradeRadeon RX Vega 8 här är cirka 20 procent snabbare än den genomsnittliga bärbara datorn i vår databas som är utrustad med samma integrerade GPU. Intels Iris Xe 96 EUs lösning som finns på de flesta bärbara datorer med 11:e generationens Core i7 är fortfarande överlägsen vår AMD-lösning i de flesta titlar, men deltat mellan dem är mycket smalare den här gången. De flesta moderna och krävande titlar körs rimligt bra vid 1080p låga inställningar.
| 3DMark Performance rating - Percent | |
| Intel NUC11PHKi7C | |
| Intel Hades Canyon NUC8i7HVK | |
| Asus Zenbook 14X UX5400E -1! | |
| Samsung Galaxy Book Pro 15 NP950XDB-KC5US | |
| Beelink GTR5 | |
| Asus Vivobook 15 K513EQ | |
| Beelink GTI 11 | |
| Huawei MateBook 16 R7 5800H | |
| Intel NUC11PAQi7 | |
| Genomsnitt AMD Radeon RX Vega 8 (Ryzen 4000/5000) | |
| Minisforum HM90 | |
| Lenovo IdeaPad 3 15ALC6 | |
| Acer Aspire 5 A515-45-R4R1 | |
| Beelink SER3 | |
| GMK NucBox 2 | |
| Beelink GK Mini | |
| 3DMark 11 - 1280x720 Performance GPU | |
| Intel NUC11PHKi7C | |
| Intel Hades Canyon NUC8i7HVK | |
| Beelink GTR5 | |
| Samsung Galaxy Book Pro 15 NP950XDB-KC5US | |
| Asus Vivobook 15 K513EQ | |
| Huawei MateBook 16 R7 5800H | |
| Intel NUC11PAQi7 | |
| Genomsnitt AMD Radeon RX Vega 8 (Ryzen 4000/5000) (3459 - 7591, n=57) | |
| Minisforum HM90 | |
| Beelink GTI 11 | |
| Acer Aspire 5 A515-45-R4R1 | |
| Lenovo IdeaPad 3 15ALC6 | |
| Beelink SER3 | |
| GMK NucBox 2 | |
| Beelink GK Mini | |
| 3DMark 11 Performance | 7425 poäng | |
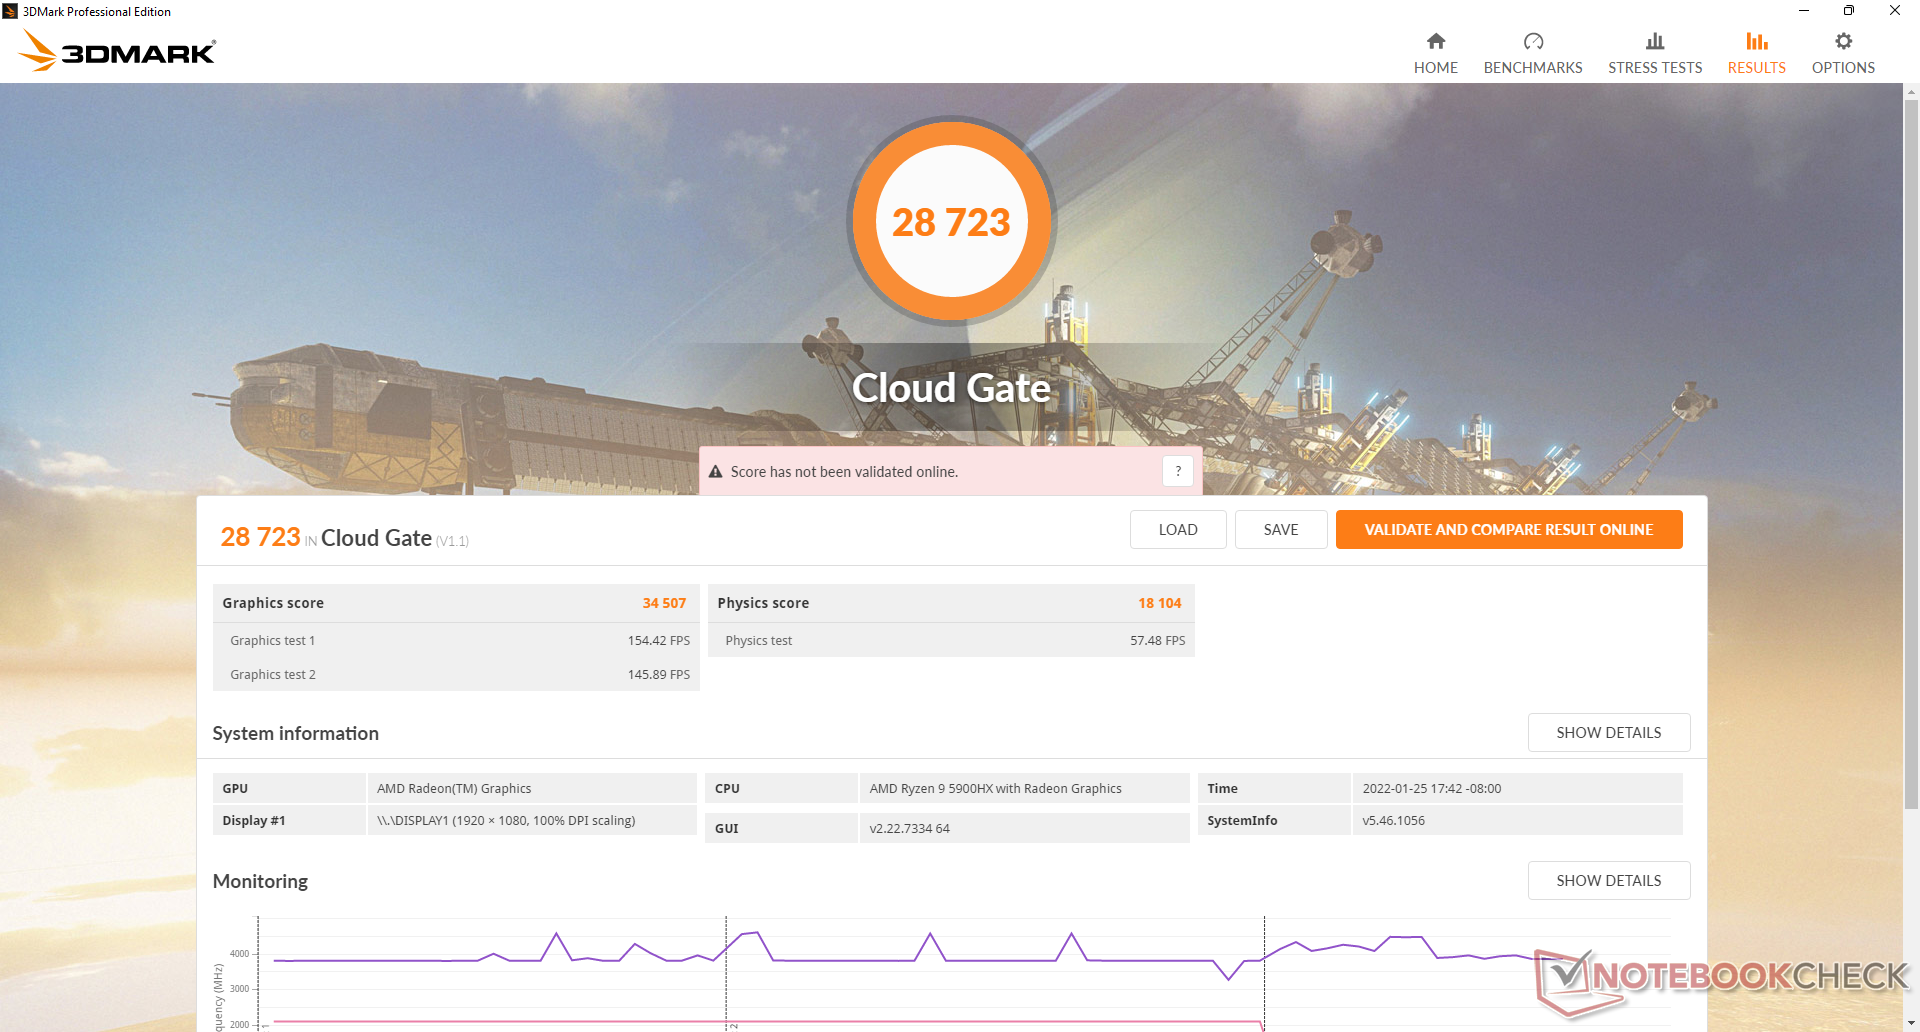
| 3DMark Cloud Gate Standard Score | 28723 poäng | |
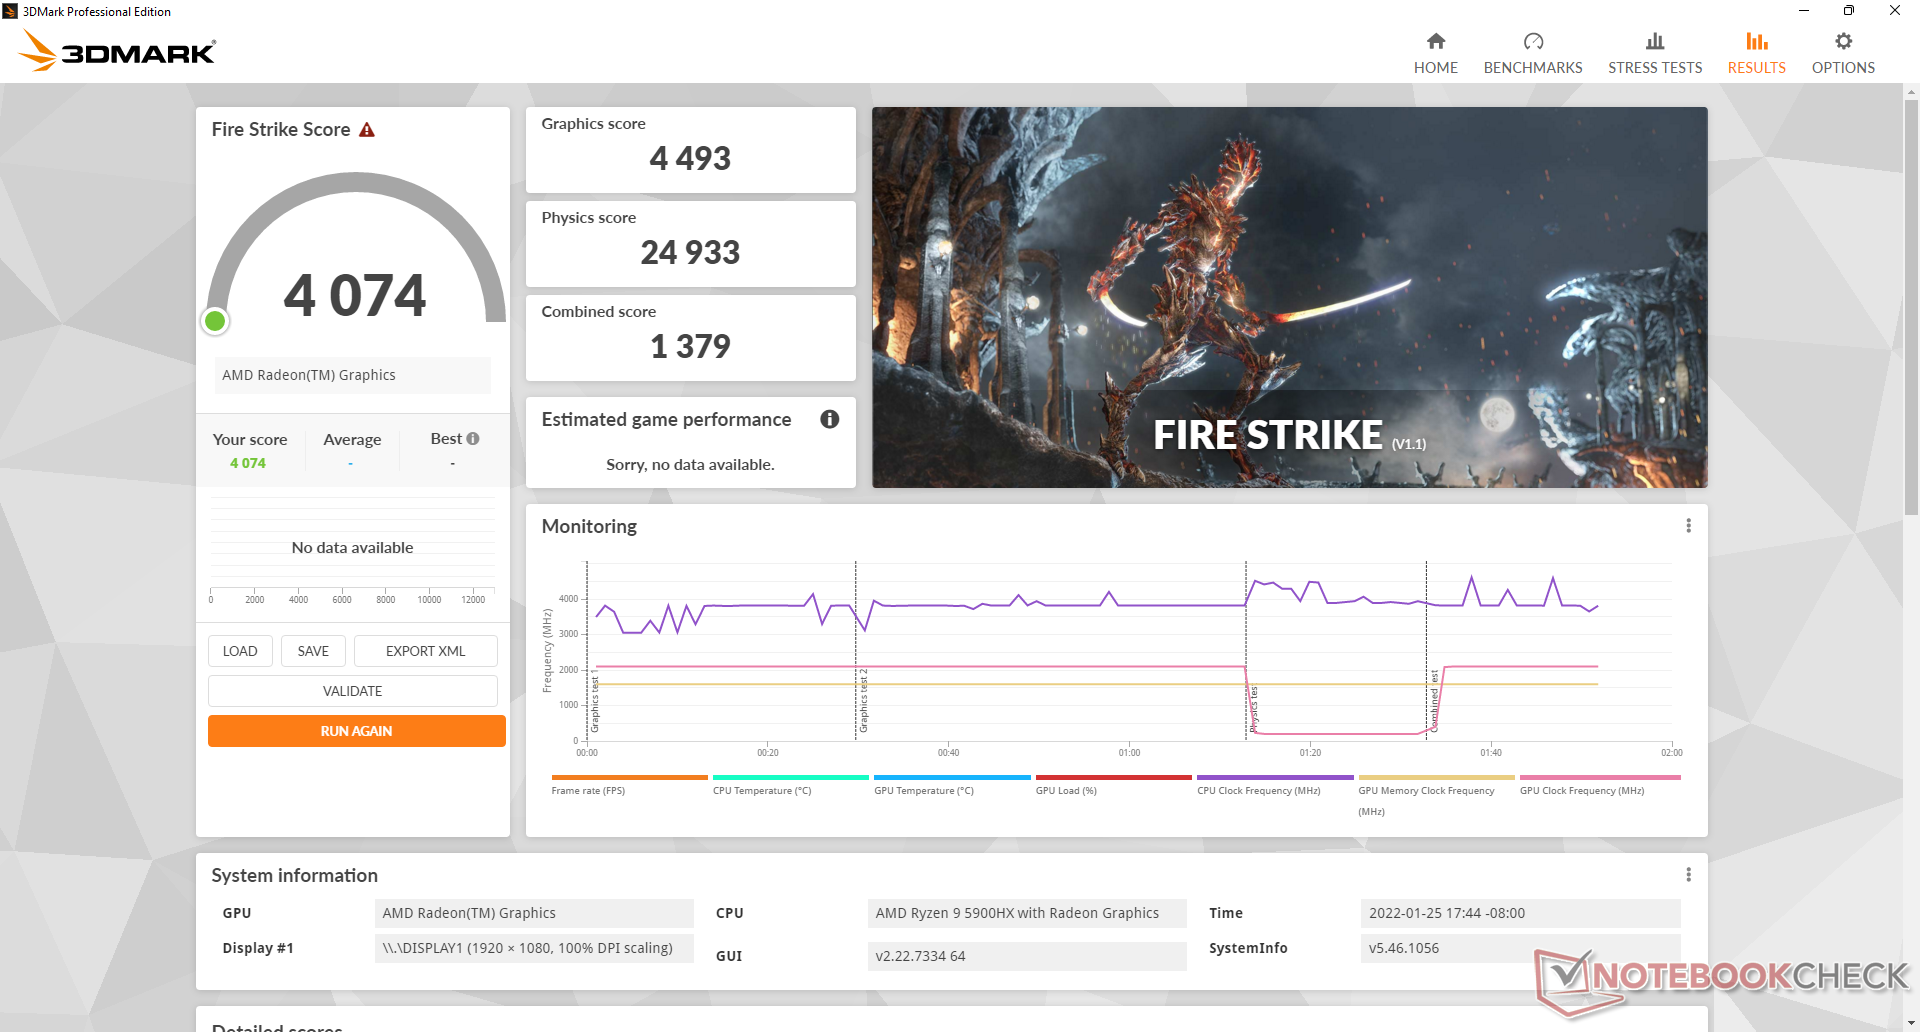
| 3DMark Fire Strike Score | 4074 poäng | |
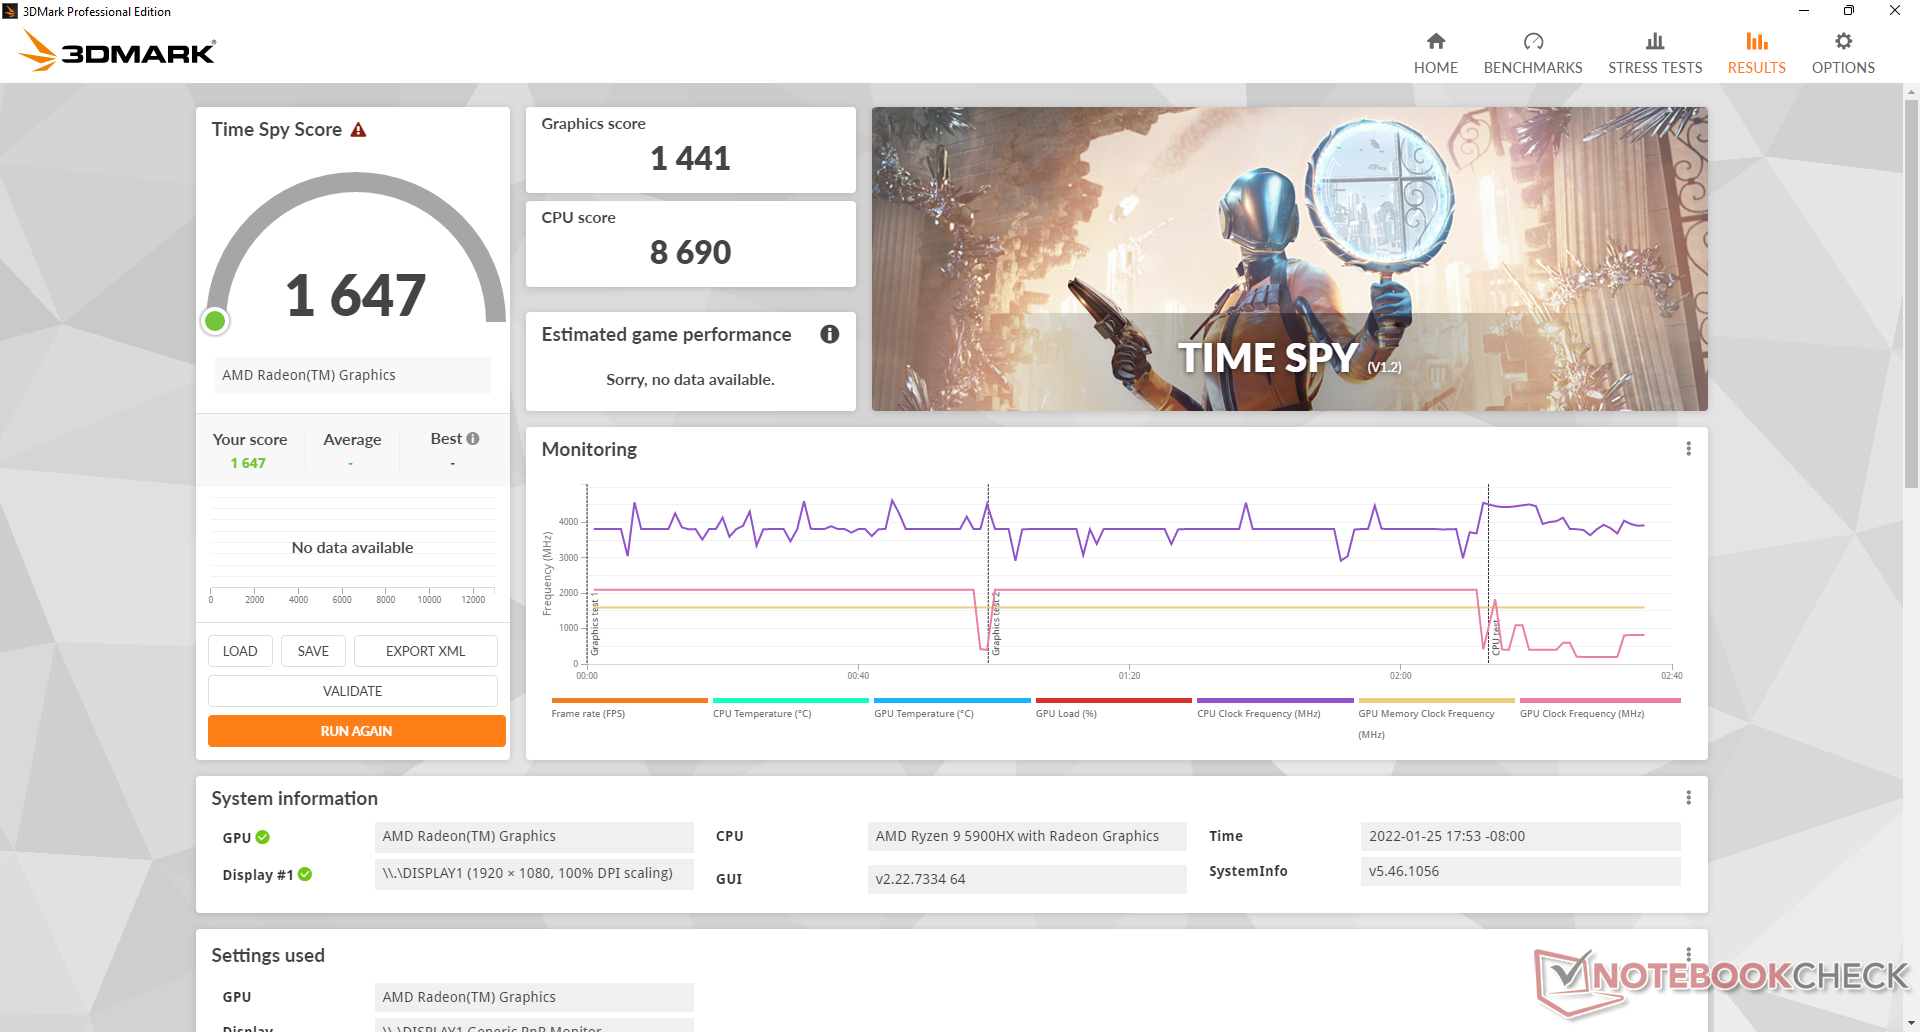
| 3DMark Time Spy Score | 1647 poäng | |
Hjälp | ||
Witcher 3 FPS Chart
| låg | med. | hög | ultra | |
|---|---|---|---|---|
| GTA V (2015) | 140 | 124 | 33.4 | 15.1 |
| The Witcher 3 (2015) | 86.9 | 55.2 | 26.8 | 17.1 |
| Dota 2 Reborn (2015) | 135 | 107 | 63.8 | 59.9 |
| Final Fantasy XV Benchmark (2018) | 44.8 | 22.3 | 15.7 | |
| X-Plane 11.11 (2018) | 58.2 | 45.7 | 40.5 | |
| Far Cry 5 (2018) | 62 | 29 | 27 | 25 |
| Strange Brigade (2018) | 99.1 | 37.8 | 31.9 | 27.5 |
Utsläpp
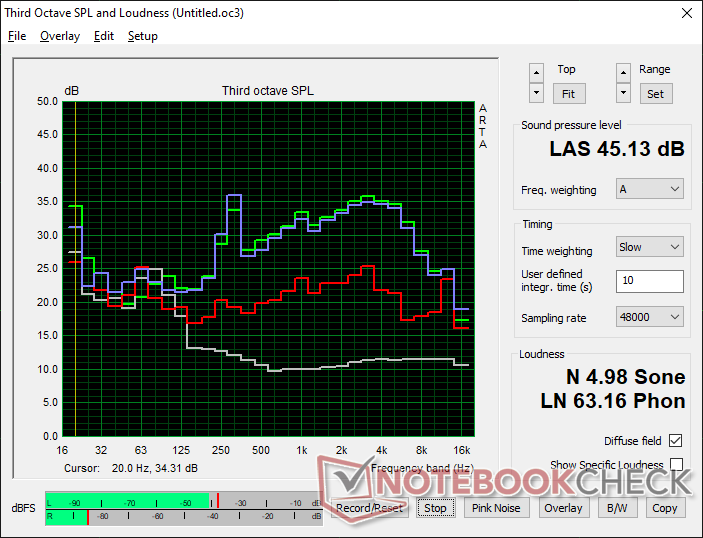
Systembrus
GTR5 är en av de minidatorer med högre ljudnivå som vi har testat eftersom de två interna fläktarna i princip alltid är aktiva. När vi till exempel bara sitter på Windows skrivbordsskärm kan vi redan registrera ett fläktljud på 34,2 dB(A) jämfört med ~25 dB(A) på GMK NucBox 2 eller Intel NUC11PAQi7, båda med mindre kraftfulla CPU:er.
Om man kör högre belastningar som spel kan fläktljudet på 41-45 dB(A) vara ännu högre än på Intel NUC11PHKi7C som är utrustad med den betydligt snabbare GeForce RTX 2060. Oavsett hur man ser på det kommer GTR5 att vara högljudd under de flesta förhållanden. Den goda nyheten är att fläktarna inte pulserar eller cyklar särskilt ofta, vilket skulle ha gjort ljudet ännu mer irriterande.
Ljudnivå
| Låg belastning |
| 34.2 / 34.2 / 34.2 dB(A) |
| Hög belastning |
| 44.6 / 45.1 dB(A) |
 | ||
30 dB tyst 40 dB(A) hörbar 50 dB(A) högt ljud |
||
min: | ||
| Beelink GTR5 Vega 8, R9 5900HX, Kingston NV1 SNVS/500GCN | Beelink GTI 11 Iris Xe G7 80EUs, i5-1135G7, Kingston SA2000M8500G | GMK NucBox 2 Iris Plus Graphics 655, i5-8259U, Netac S930E8/256GPN | Intel NUC11PHKi7C GeForce RTX 2060 Mobile, i7-1165G7, Samsung SSD 980 Pro 500GB MZ-V8P500BW | Intel NUC11PAQi7 Iris Xe G7 96EUs, i7-1165G7, Samsung SSD 980 Pro 500GB MZ-V8P500BW | Beelink GK Mini UHD Graphics 600, Celeron J4125, Silicon Motion SM2258XT 256GB | |
|---|---|---|---|---|---|---|
| Noise | -4% | 18% | 13% | 12% | 1% | |
| av / miljö * (dB) | 23.1 | 25.7 -11% | 25.6 -11% | 24.5 -6% | 25.6 -11% | 24.6 -6% |
| Idle Minimum * (dB) | 34.2 | 28.4 17% | 25.7 25% | 25.3 26% | 25.6 25% | 36.9 -8% |
| Idle Average * (dB) | 34.2 | 32 6% | 25.7 25% | 25.3 26% | 25.6 25% | 36.9 -8% |
| Idle Maximum * (dB) | 34.2 | 37.7 -10% | 25.7 25% | 25.3 26% | 25.6 25% | 36.9 -8% |
| Load Average * (dB) | 44.6 | 44.2 1% | 35.3 21% | 36.4 18% | 33.6 25% | 37 17% |
| Witcher 3 ultra * (dB) | 41.4 | 44.5 -7% | 39.7 4% | 33.6 19% | ||
| Load Maximum * (dB) | 45.1 | 56 -24% | 35.1 22% | 47.9 -6% | 54.5 -21% | 37 18% |
* ... mindre är bättre
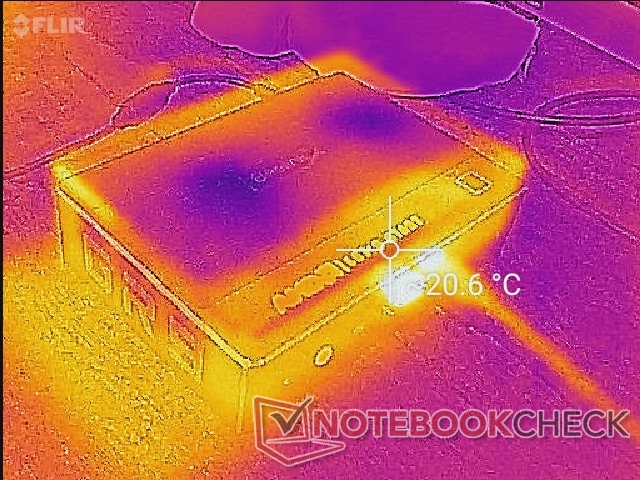
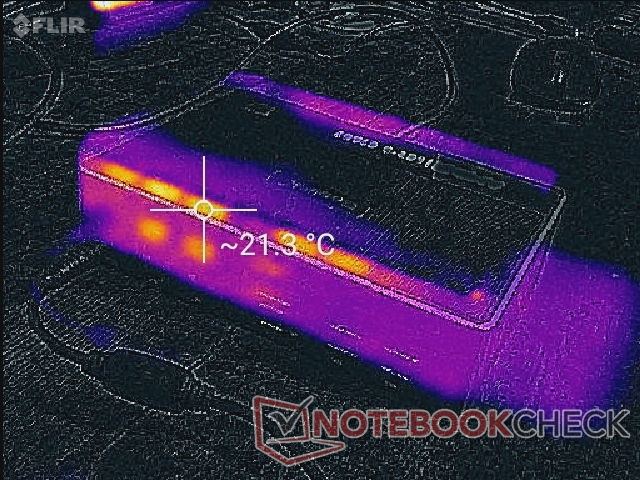
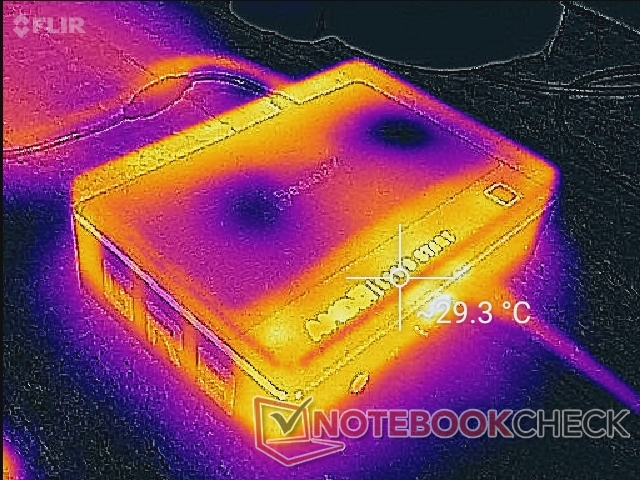
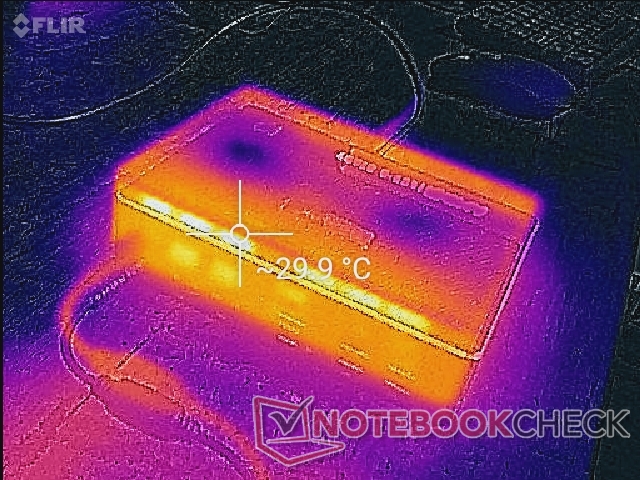
Temperatur
Yttemperaturer är inget problem, särskilt inte eftersom hela toppen av enheten är en ventilation för luftintag. Därför rekommenderas det inte att placera papper eller böcker ovanpå minidatorn. Om du placerar enheten vertikalt, se till att inte trycka minidatorns ovansida mot några väggar eller hyllor för att bevara luftflödet.
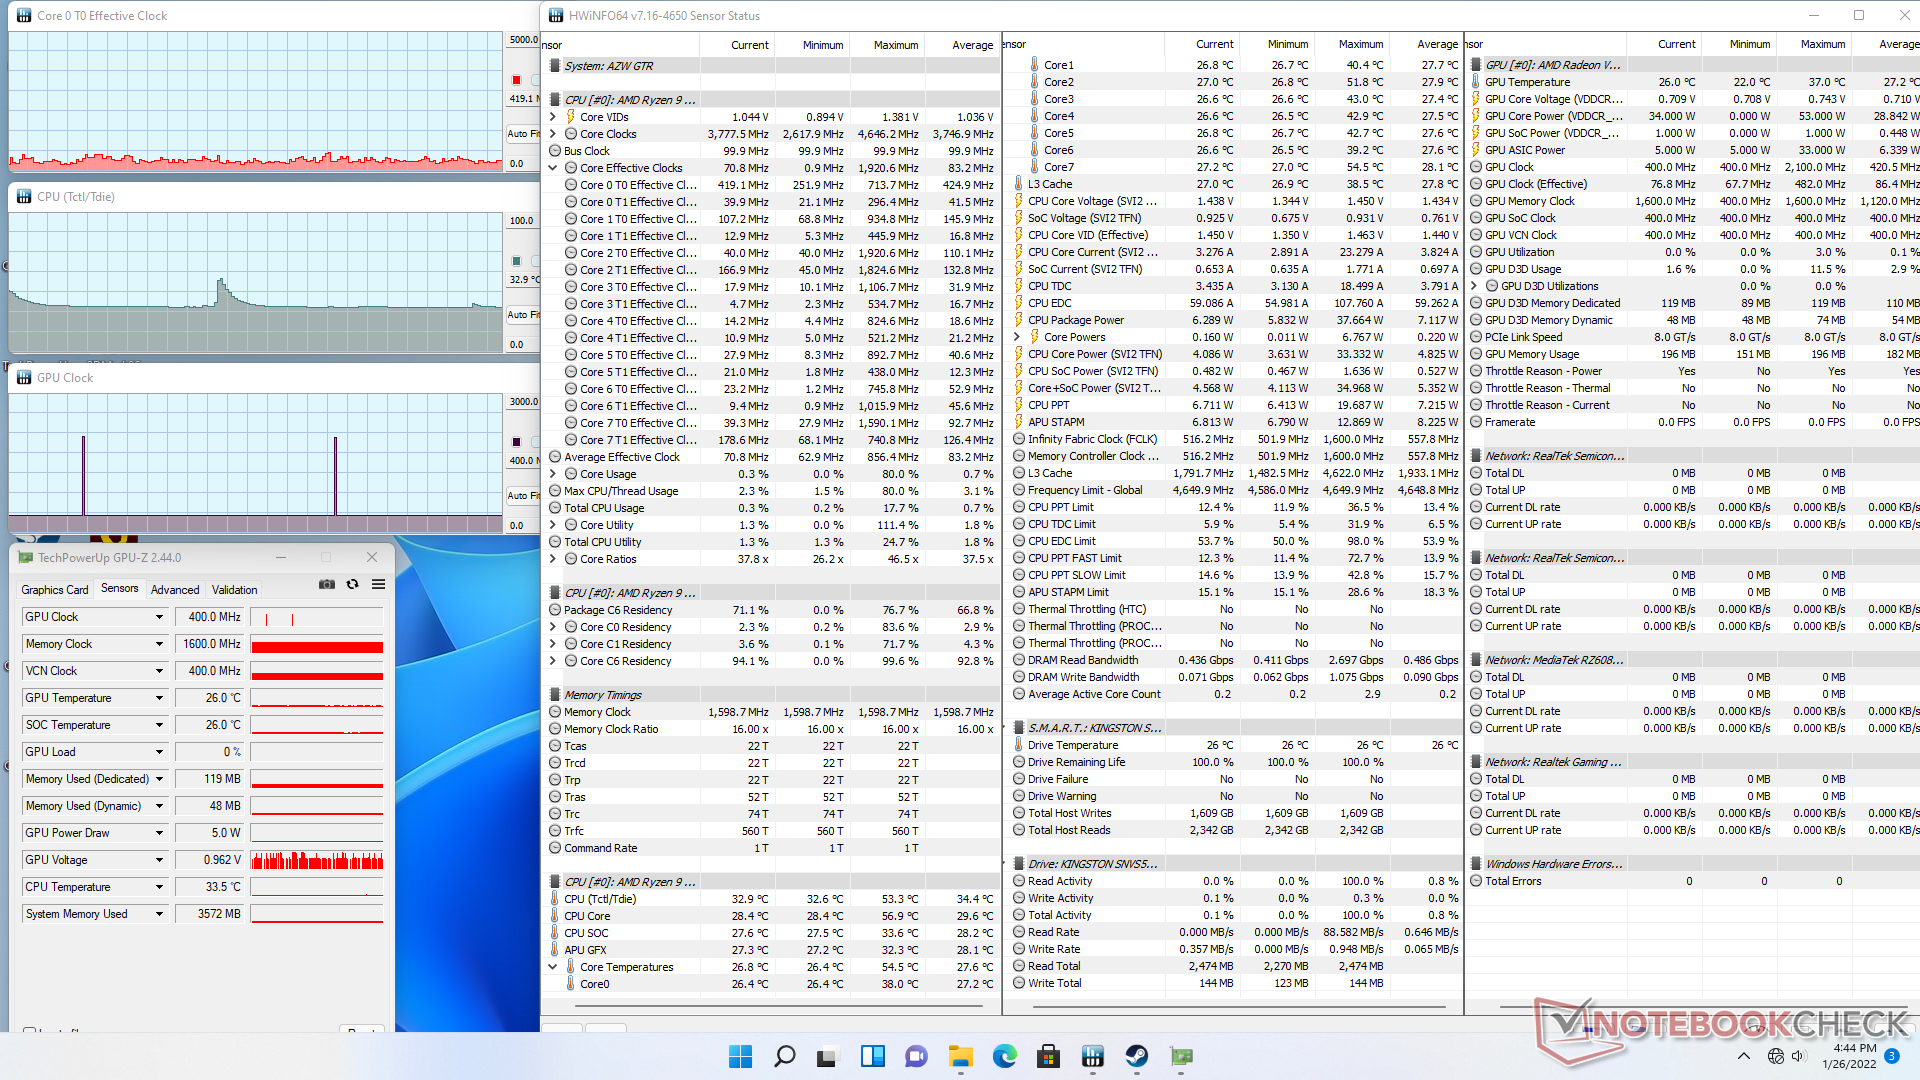
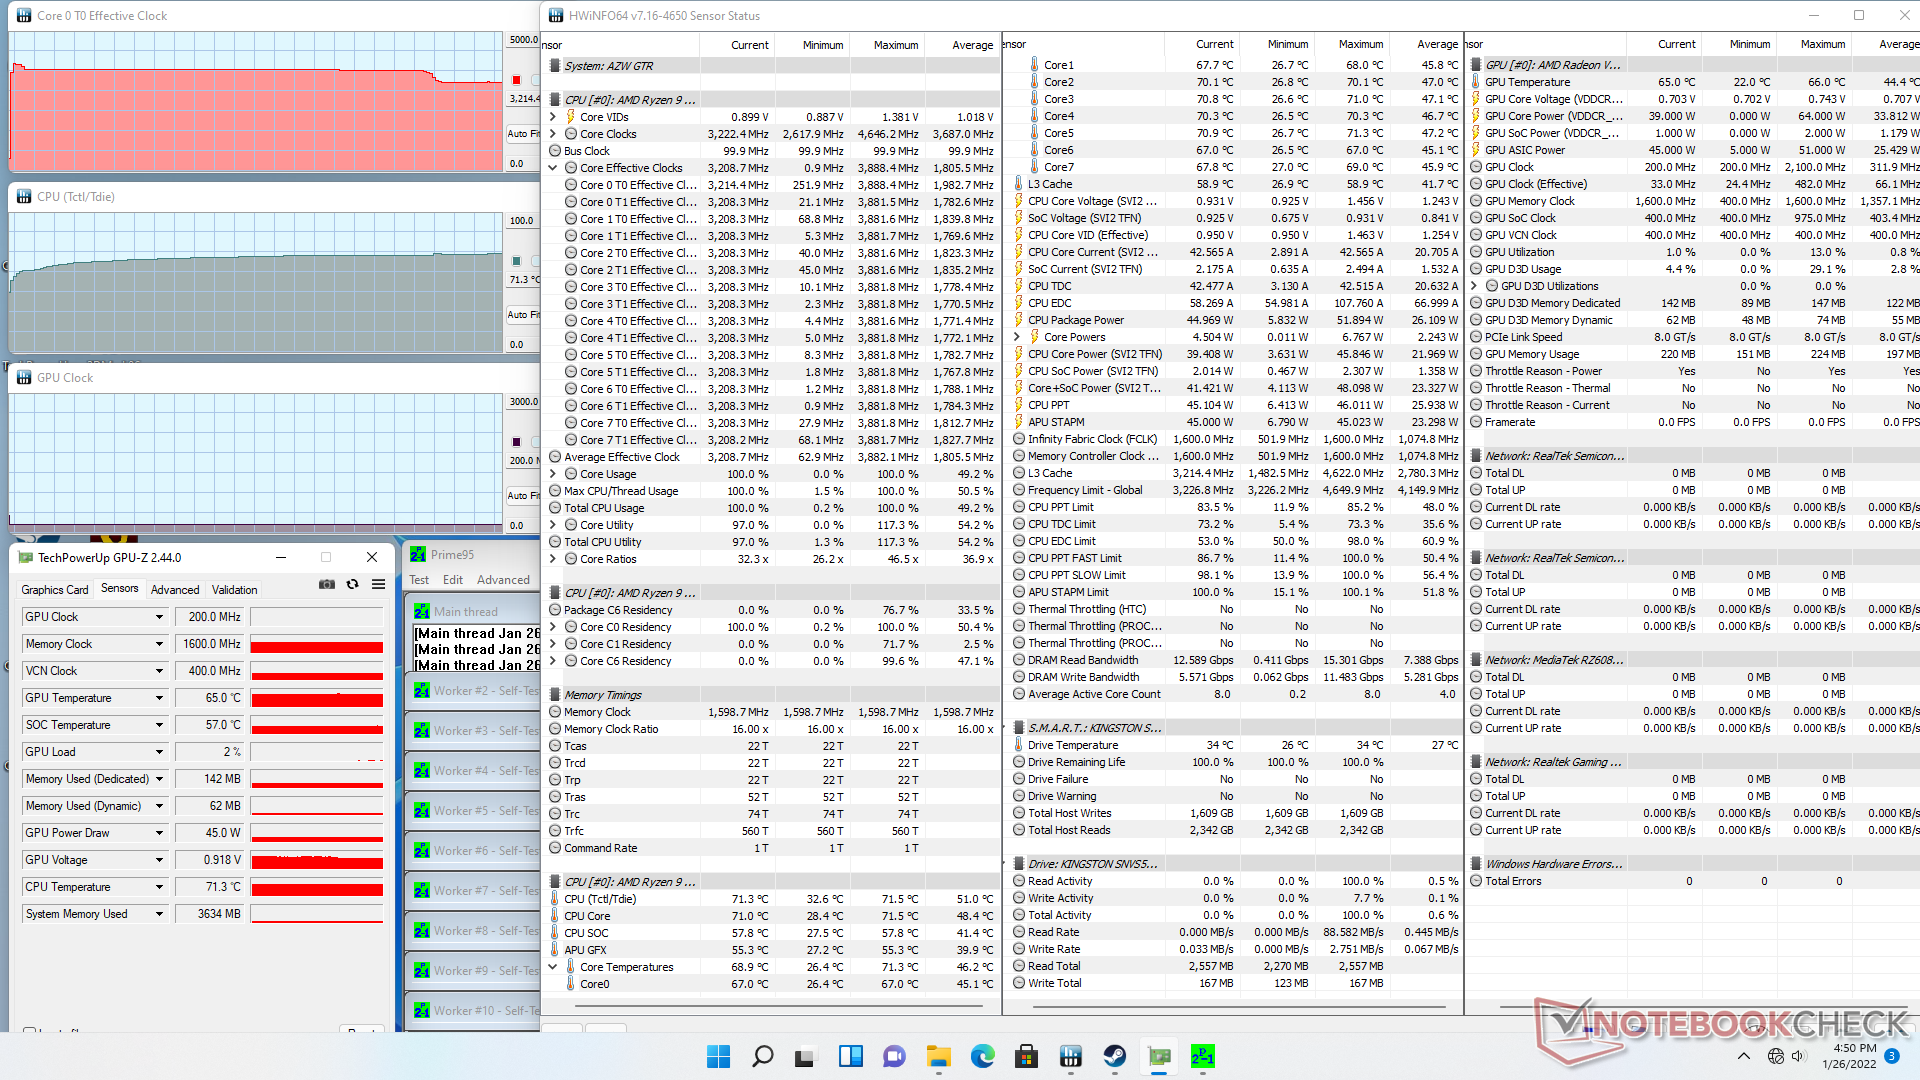
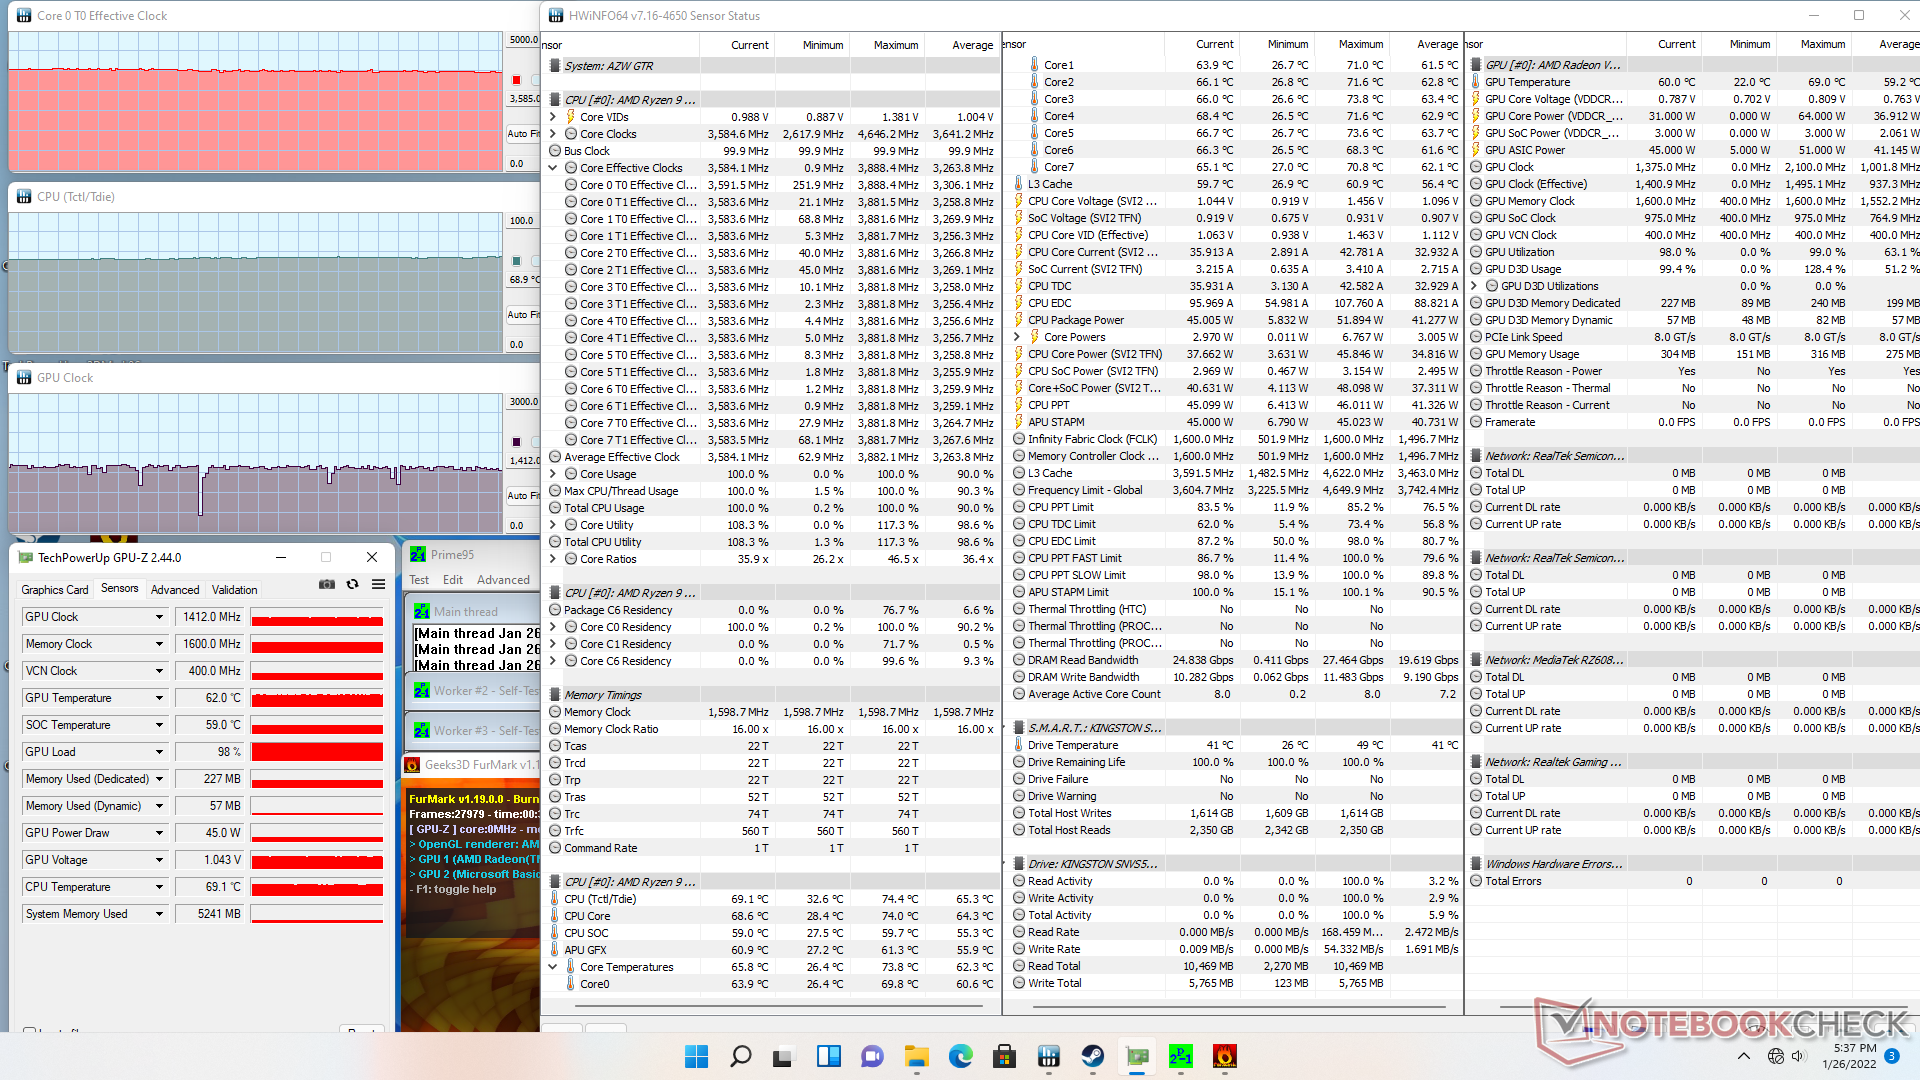
Stresstest
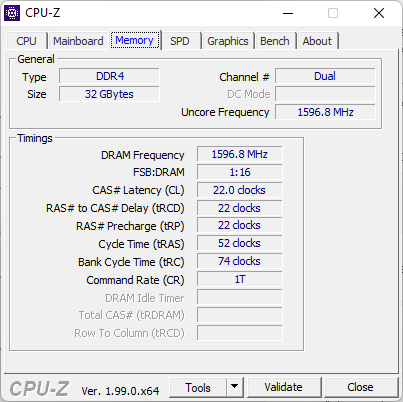
När vi körde Prime95 för att stressa processorn med standard BIOS-inställningar ökade klockfrekvensen till 3,9 GHz under de första sekunderna innan den sjönk något till mer stabila 3,8 GHz. Kärnans temperatur (Tctl/Tdie) stabiliserades vid 74 C för att lämna tillräckligt med utrymme för överklockning. CPU TDP verkar nå en topp på 55 W i början av testet innan den stabiliserades på 45 W enligt HWiNFO.
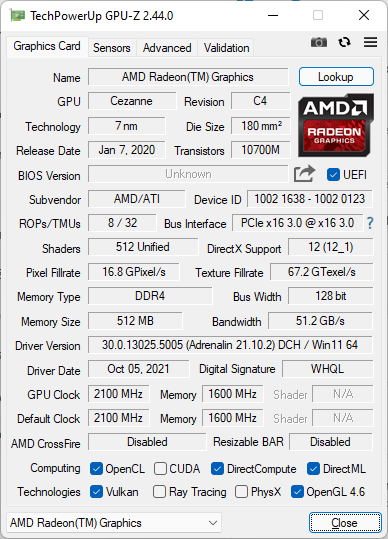
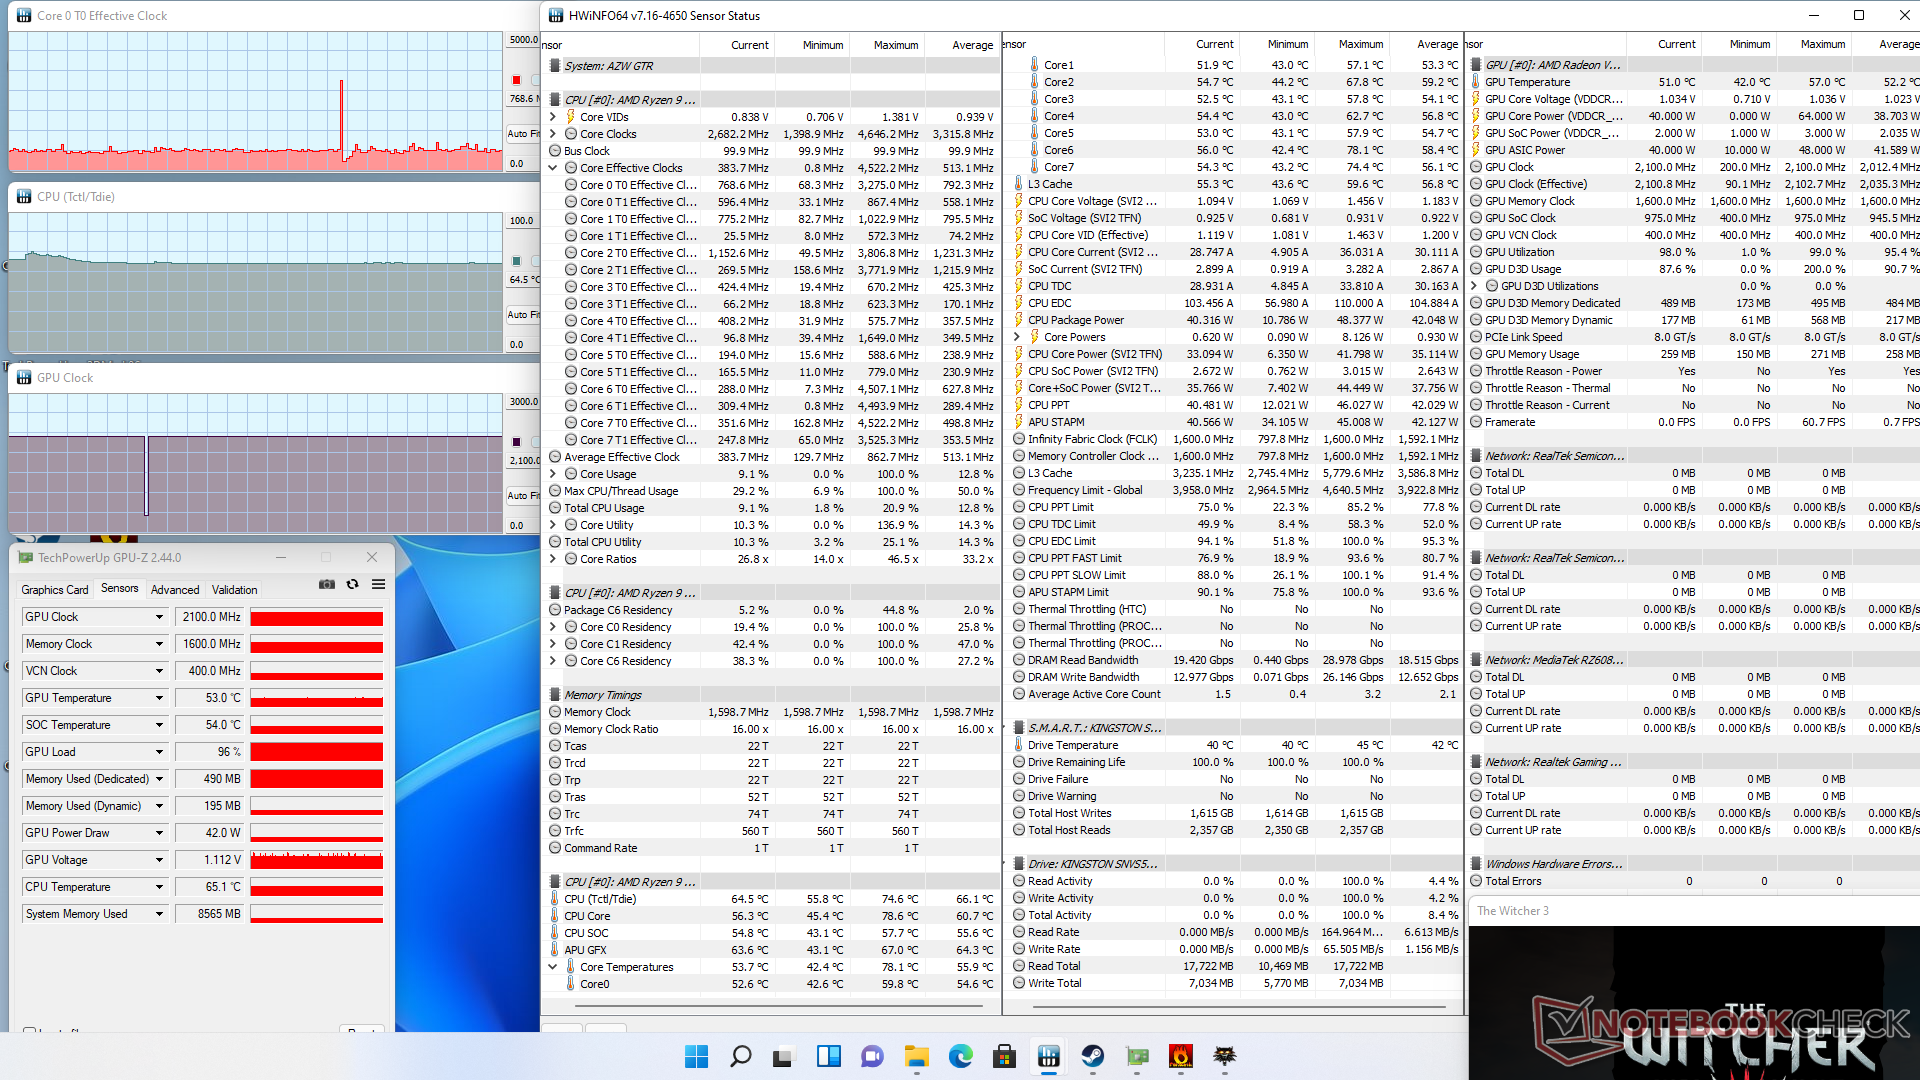
När man kör Witcher 3 för att representera spelstress skulle den integrerade GPU:n stabiliseras vid 2100 MHz och en CPU-kärntemperatur (Tctl/Tdie) på 65 C. Om man kör samma test med Beelink GTI11 utrustad med den mindre krävande Core i5-1135G7 skulle ge liknande temperaturresultat.
| CPU-klocka (GHz) | GPU-klocka (MHz) | Genomsnittlig CPU-temperatur Tctl/Tdie (°C) | |
| Systemets tomgång | -- | -- | 33 |
| Prime95 Stress | 3.8 | -- | 74 |
| Prime95 + FurMark Stress | 3.6 | 1412 | 69 |
| Witcher 3 Stress | ~0,8 | 2100 | 65 |
Energiförvaltning
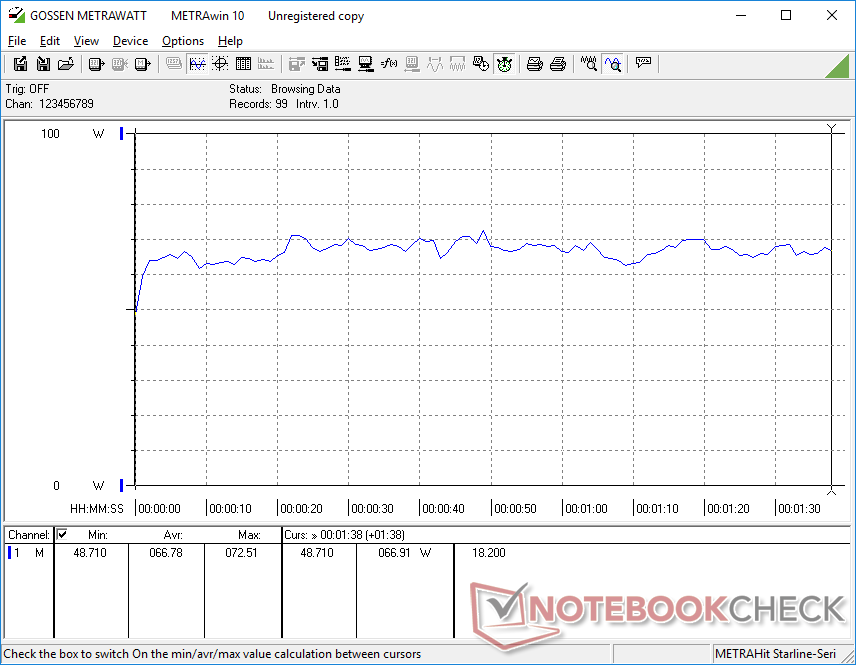
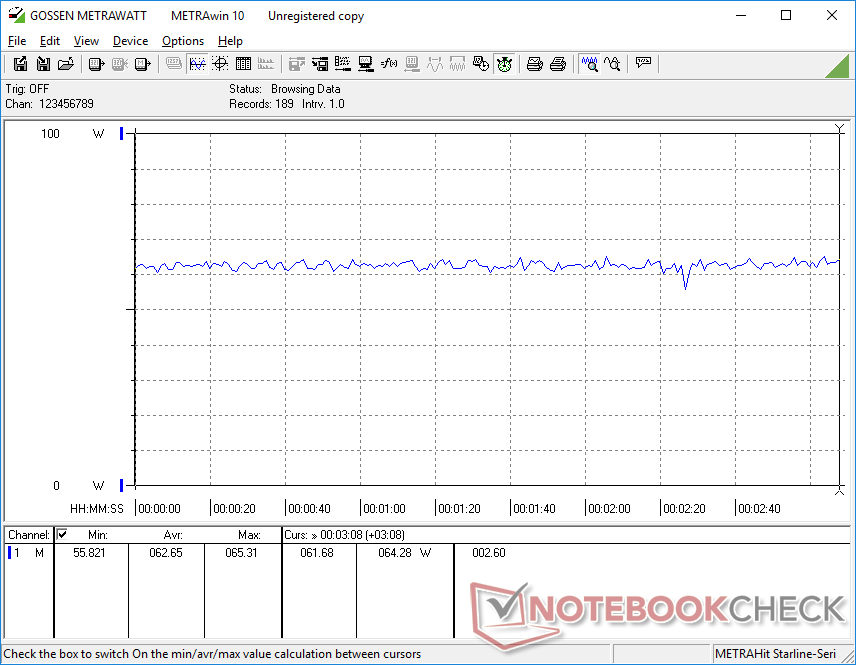
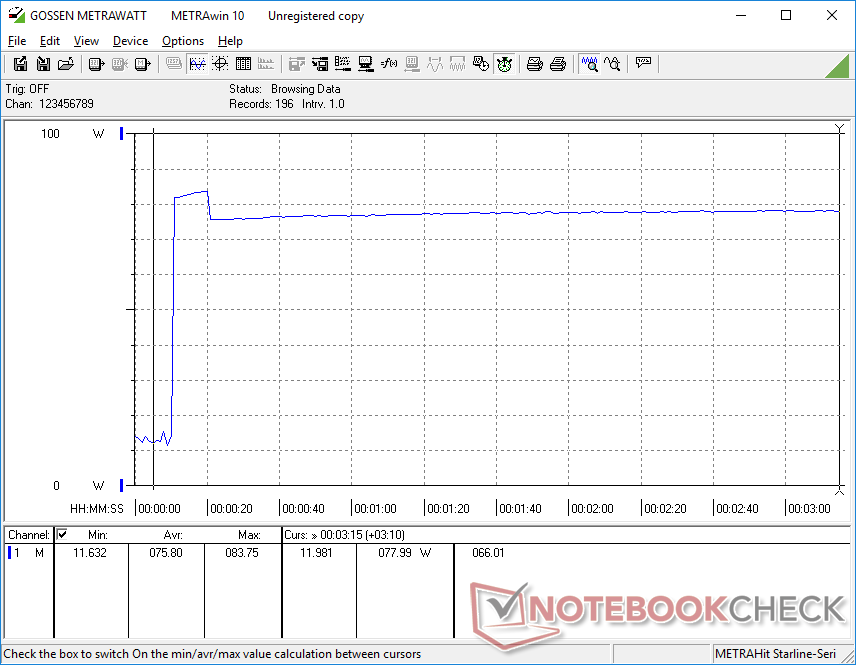
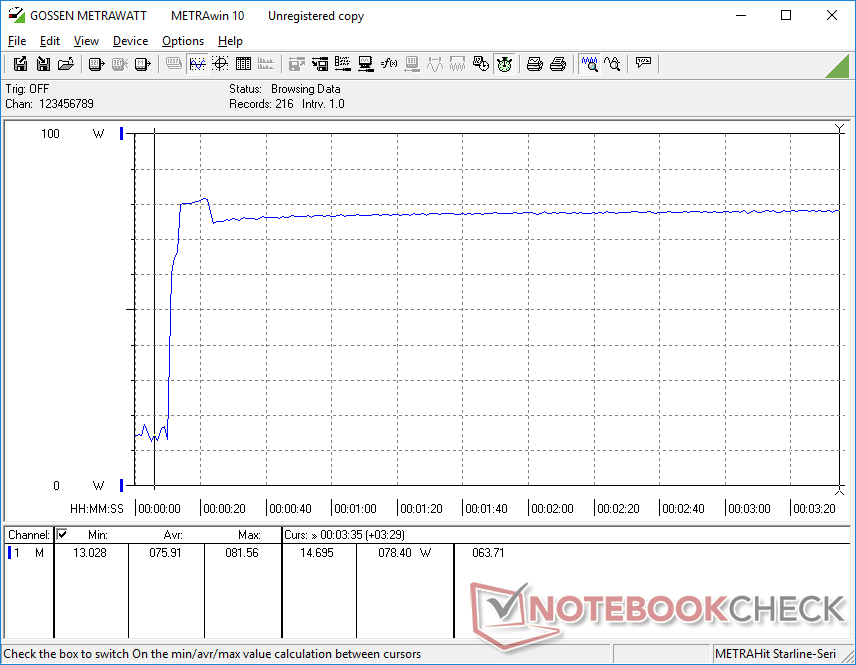
Effektförbrukning
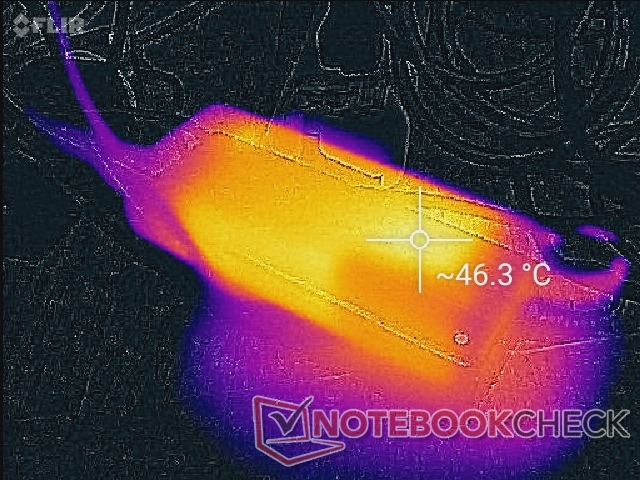
Högre belastningar som spel förbrukar ungefär 2 gånger mer ström än den Core i7-drivna Intel NUC11PAQi7 trots den något lägre grafikprestandan hos vår Radeon RX Vega 8. GTR5-ägare skulle dock fortfarande få cirka 70 procent snabbare CPU-prestanda med flera trådar, vilket kan uppväga den jämförelsevis högre strömförbrukningen
Vi kan registrera ett maximalt uttag på 82 W från den lilla (12,5 x 5 x 3 cm) 90 W AC-adaptern när vi kör extrema Prime95- och FurMark-belastningar.
| Av/Standby | |
| Låg belastning | |
| Hög belastning |
|
Förklaring:
min: | |
| Beelink GTR5 R9 5900HX, Vega 8, Kingston NV1 SNVS/500GCN, , x, | Beelink GTI 11 i5-1135G7, Iris Xe G7 80EUs, Kingston SA2000M8500G, , x, | GMK NucBox 2 i5-8259U, Iris Plus Graphics 655, Netac S930E8/256GPN, , x, | Intel NUC11PHKi7C i7-1165G7, GeForce RTX 2060 Mobile, Samsung SSD 980 Pro 500GB MZ-V8P500BW, , x, | Intel NUC11PAQi7 i7-1165G7, Iris Xe G7 96EUs, Samsung SSD 980 Pro 500GB MZ-V8P500BW, , x, | Beelink GK Mini Celeron J4125, UHD Graphics 600, Silicon Motion SM2258XT 256GB, , x, | |
|---|---|---|---|---|---|---|
| Power Consumption | -48% | 23% | -85% | 29% | 66% | |
| Idle Minimum * (Watt) | 6.2 | 15.2 -145% | 6.1 2% | 5.8 6% | 5.6 10% | 3.2 48% |
| Idle Average * (Watt) | 8.9 | 16 -80% | 6.8 24% | 5.9 34% | 5.6 37% | 3.3 63% |
| Idle Maximum * (Watt) | 9 | 16 -78% | 7.3 19% | 20.7 -130% | 6 33% | 3.7 59% |
| Load Average * (Watt) | 66.8 | 48.6 27% | 46.3 31% | 130.8 -96% | 31.4 53% | 13.6 80% |
| Witcher 3 ultra * (Watt) | 62.6 | 53.8 14% | 154.4 -147% | 39 38% | ||
| Load Maximum * (Watt) | 81.6 | 104.3 -28% | 50.7 38% | 225.2 -176% | 80.5 1% | 17.8 78% |
* ... mindre är bättre
Power Consumption Witcher 3 / Stresstest
Power Consumption external Monitor
För
Emot
Omdöme - Handlar helt om processorn
Alla datorer med Ryzen 9 5900HX kommer att vara vansinnigt snabba för priset och Beelink GTR5 är inget undantag. AMD-processorn konkurrerar med alla mobila 11:e generationens Intel-lösningar när det gäller rå CPU-prestanda, inklusive den dyrare Core i9-11900H. Om du vill maximera processorprestanda och samtidigt hålla systemet så litet som möjligt kommer GTR5 att vara ditt bästa val
Om du vill ha maximal processorprestanda till minimal kostnad och storlek hittar du det i form av Beelink GTR5.
Det finns två huvudsakliga nackdelar att tänka på. För det första är grafiken begränsad av den integrerade Radeon Vega 8 GPU:n medan de flesta bärbara datorer med samma CPU vanligtvis skulle komma med snabbare diskret grafik. Användare kommer nästan säkert att bli GPU-bundna när de kör mer intensiva program som grafisk redigering eller spelande. Det är synd att Thunderbolt inte stöds, vilket skulle ha åtgärdat denna begränsning via eGPU:er. För det andra är fläktljudet högre än de flesta andra minidatorer som ett direkt resultat av att man stoppar in en så snabb processor i ett så litet chassi. Därför är GTR5 kanske inte det bästa valet för HTPC- eller konferensrumsuppställningar där omgivande ljud bör hållas till ett minimum. Kanske kan en övergång till ångkammarkylning i framtiden minska det totala fläktljudet. Processorprestandajägare med en snävare budget kommer ändå att bli imponerade av vad GTR5 har att erbjuda.
Pris och tillgänglighet
Beelink GTR5 är ännu inte allmänt tillgänglig. Dess Indiegogosida finns på här.
Price comparison

