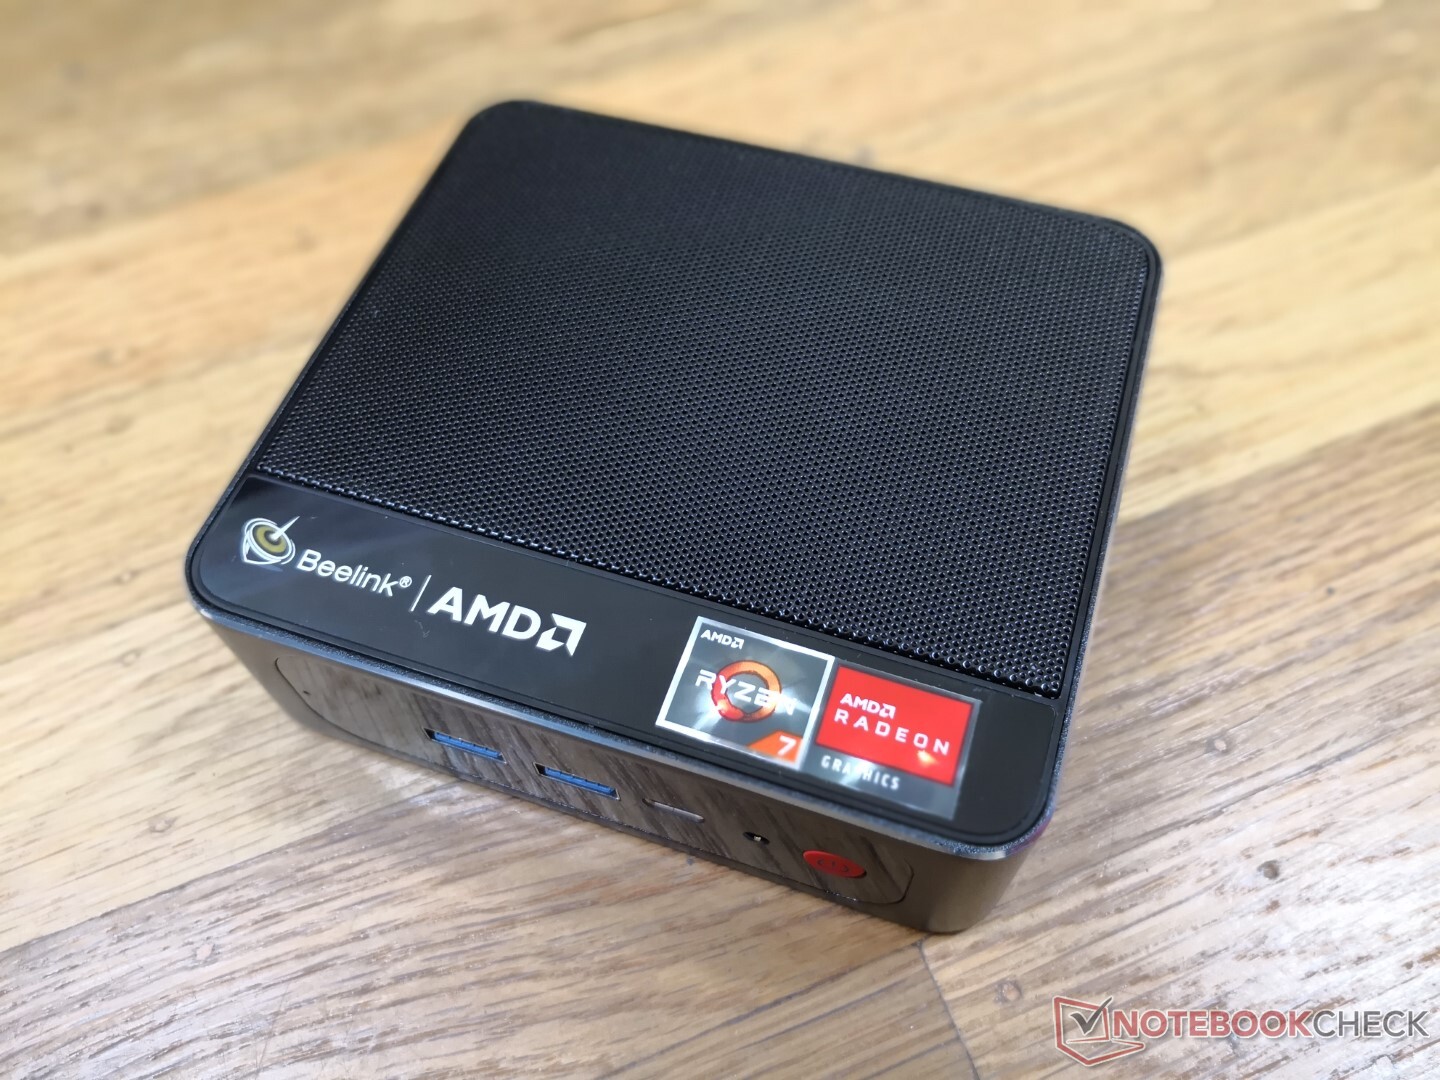
Beelink SER3 mini PC recension: Den äldre Ryzen 7 3750H har sina användningsområden

Beelink har flera minidatorer som drivs av äldre Intel- och AMD-processorer som billigare alternativ till de nyaste Intel NUC:erna som drivs av den senaste generationens processorer. Nästan alla HTPC-tillämpningar, från webbsurfning till 4K-videoströmning, kräver inte de snabbaste och bästa processorerna, vilket innebär att de flesta användare kan klara sig med billigare hårdvara.
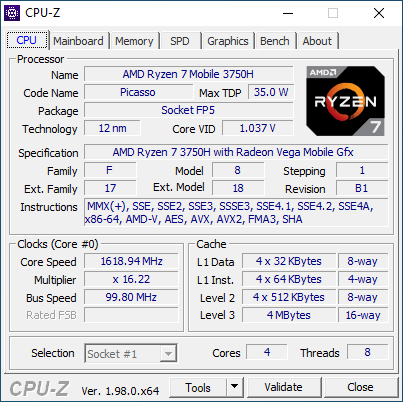
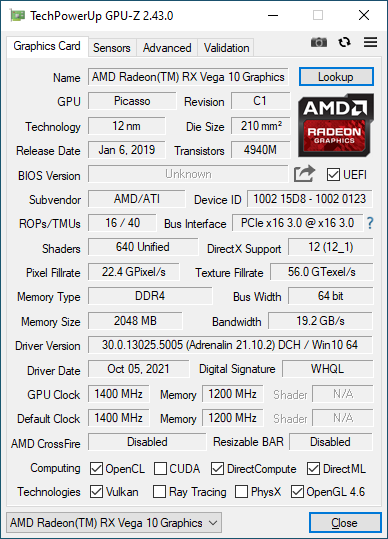
Vår Beelink SER3-testenhet är utrustad med den två år gamla AMD Zen+ Ryzen 7 3750H CPU som sedan dess har ersatts av de nyare Zen 2 4000H- och Zen 3 5000H-serierna.
Fler recensioner av Beelink
No, or more than one (0) Rating for the given SpecsID 326081 found
Potential Competitors in Comparison
Gradering | Datum | Modell | Vikt | Höjd | Storlek | Upplösning | Pris |
|---|---|---|---|---|---|---|---|
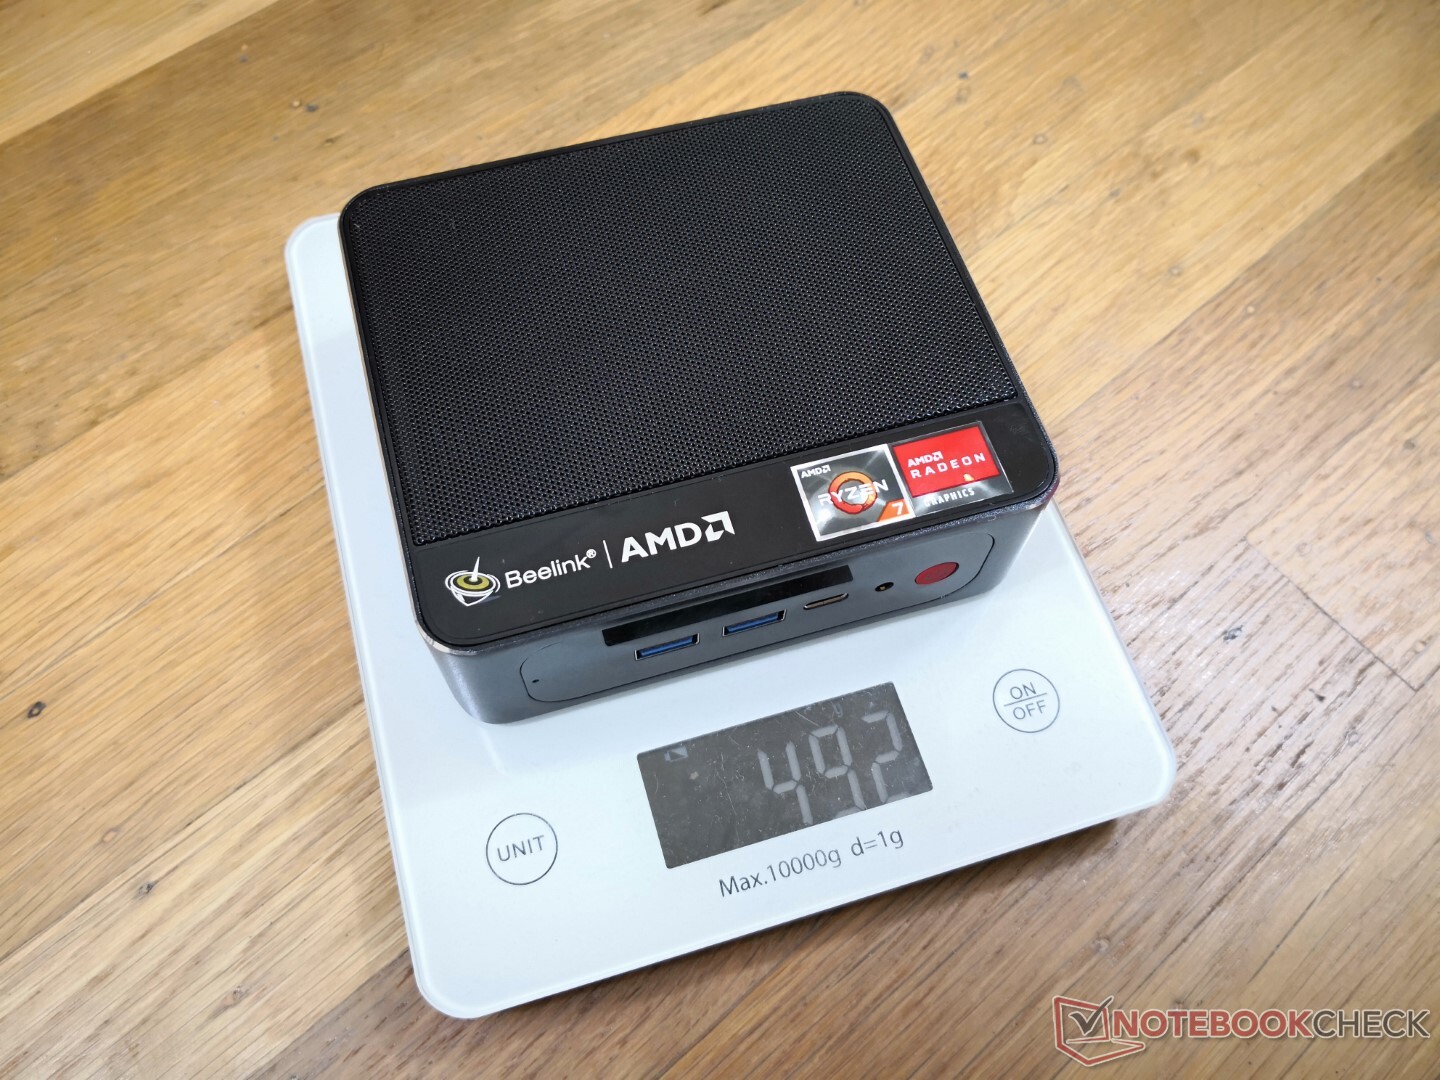
v (old) | 11/2021 | Beelink SER3 R7 3750H, Vega 10 | 492 g | 40 mm | x | ||
v (old) | 12/2020 | Beelink SEi10 i3-1005G1, UHD Graphics G1 (Ice Lake 32 EU) | 350 g | 41 mm | x | ||
v (old) | 11/2018 | Intel NUC8i7BE i7-8559U, Iris Plus Graphics 655 | 683 g | 51 mm | x | ||
v (old) | GMK NucBox 2 i5-8259U, Iris Plus Graphics 655 | 430 g | 50 mm | x | |||
v (old) | Zotac ZBox MI643 i5-10210U, UHD Graphics 620 | 550 g | 28.5 mm | x | |||
v (old) | Intel NUC11TNKi5 i5-1135G7, Iris Xe G7 80EUs | 504 g | 37 mm | x |
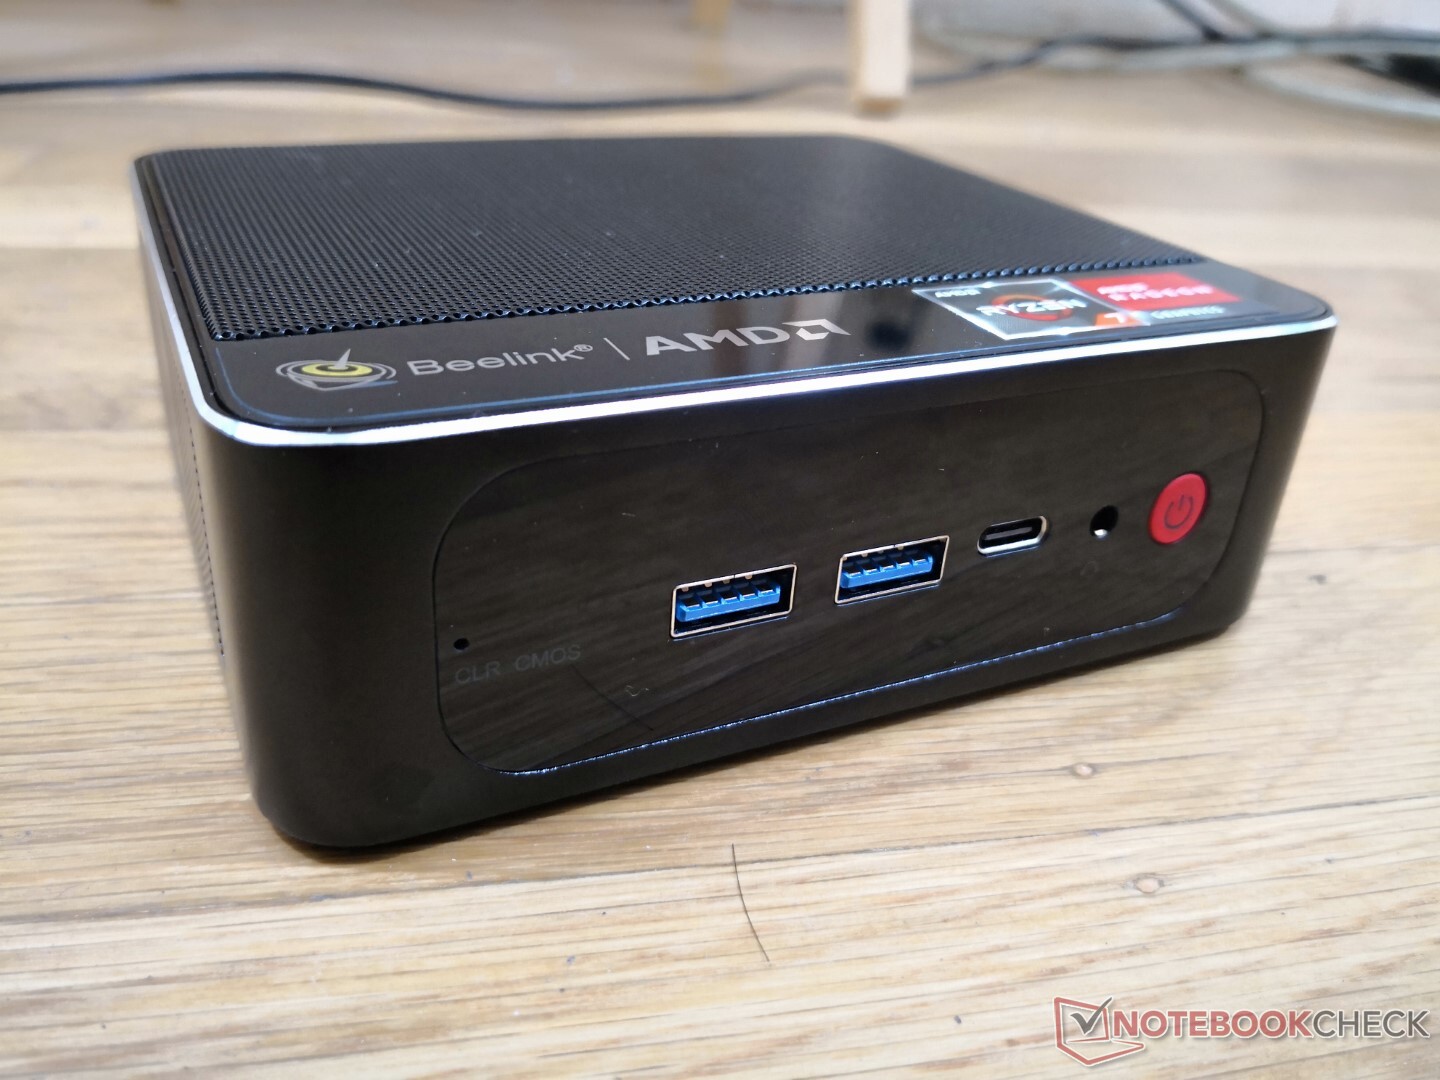
Fall
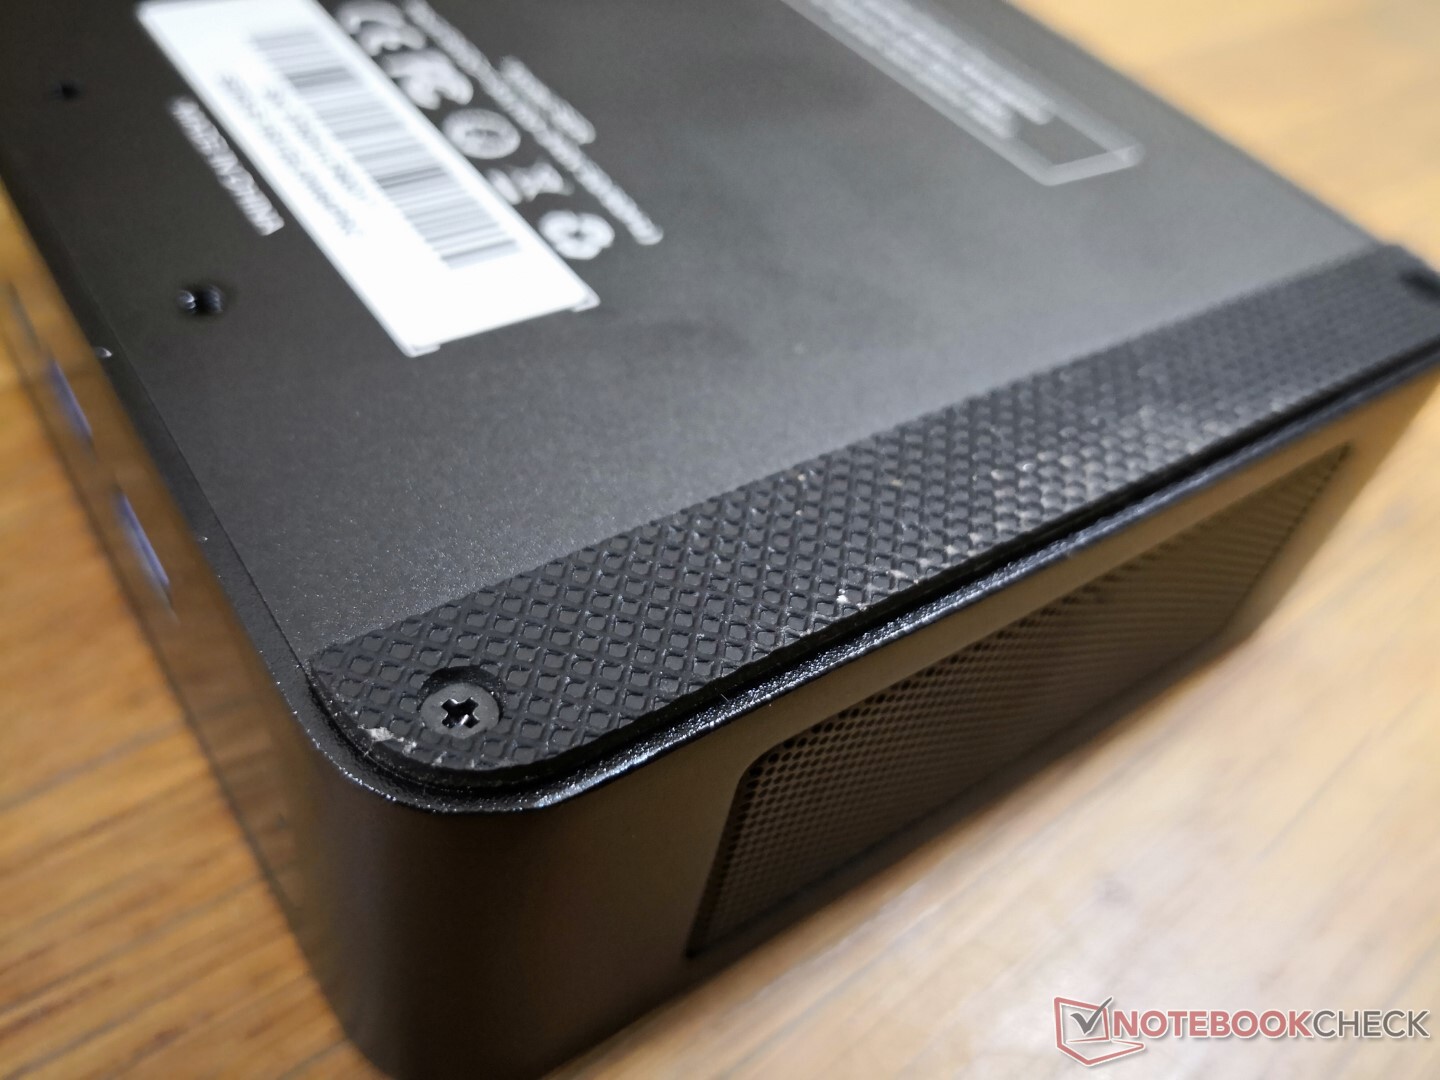
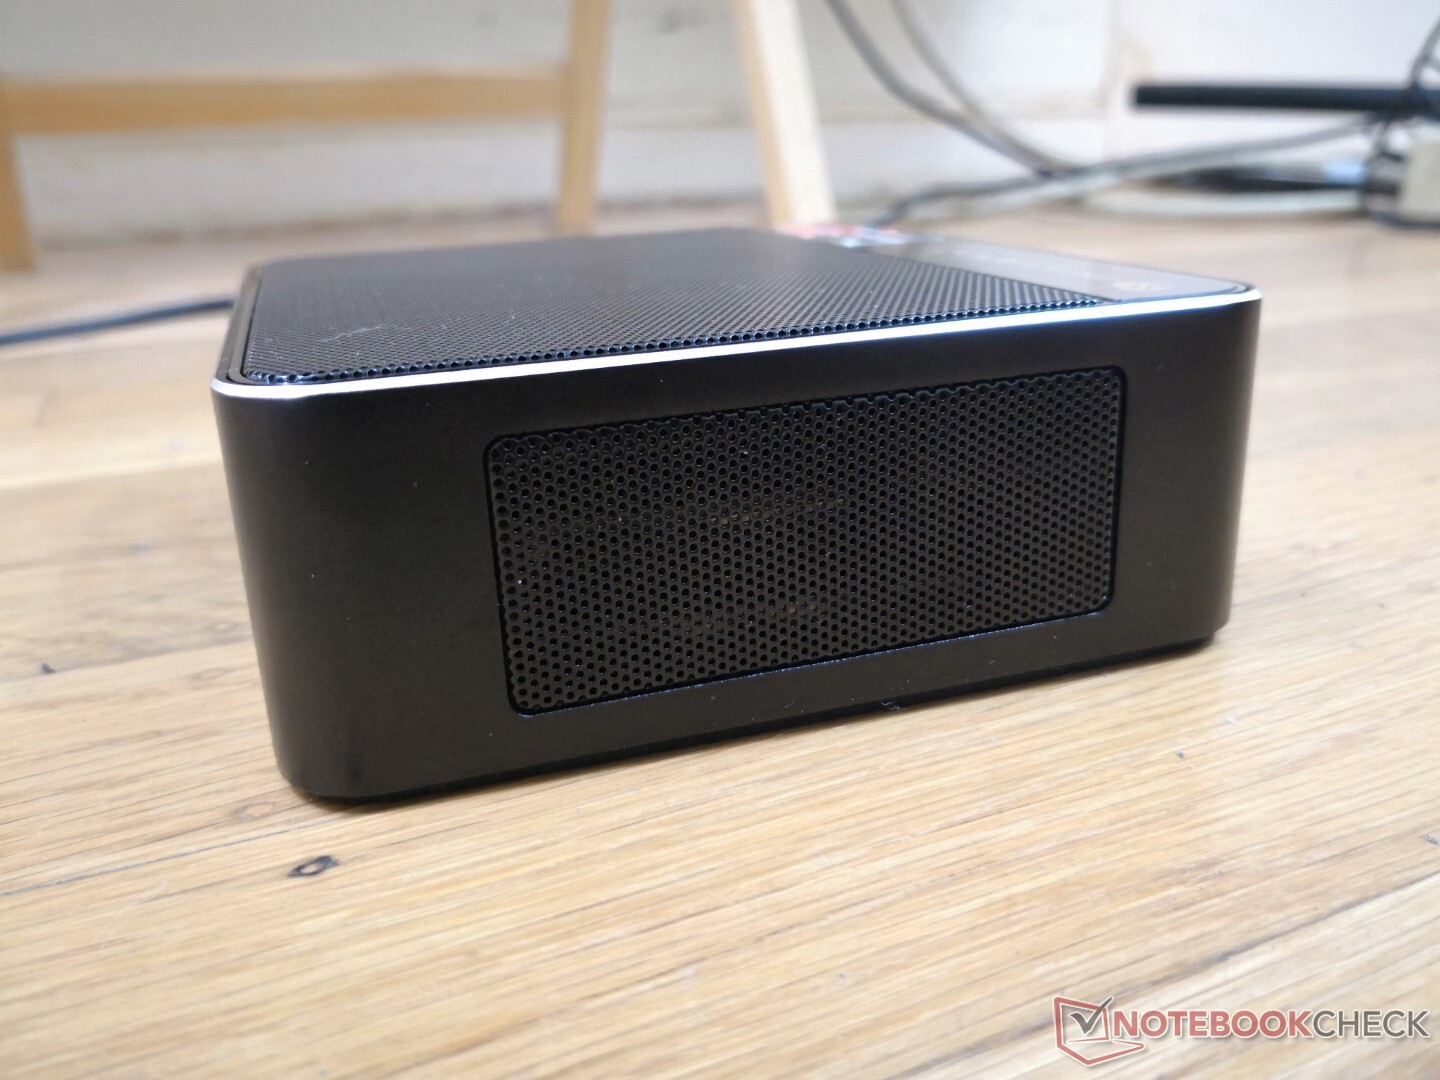
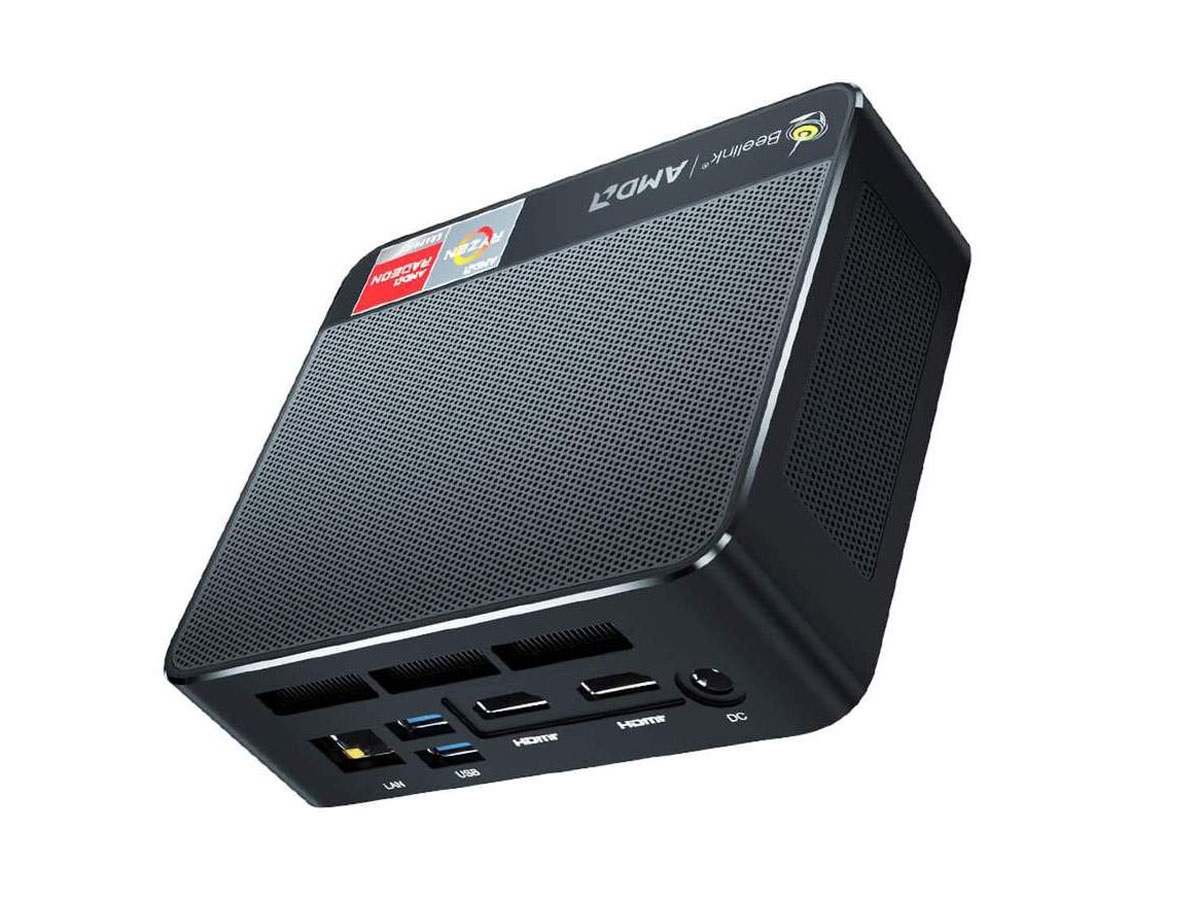
Chassit är mestadels av matt metall med lite blank plast på framsidan och en del av toppen. Första intrycket är starkt om än inte lika styvt som en Intel NUC som använder tjockare och tyngre metallmaterial.
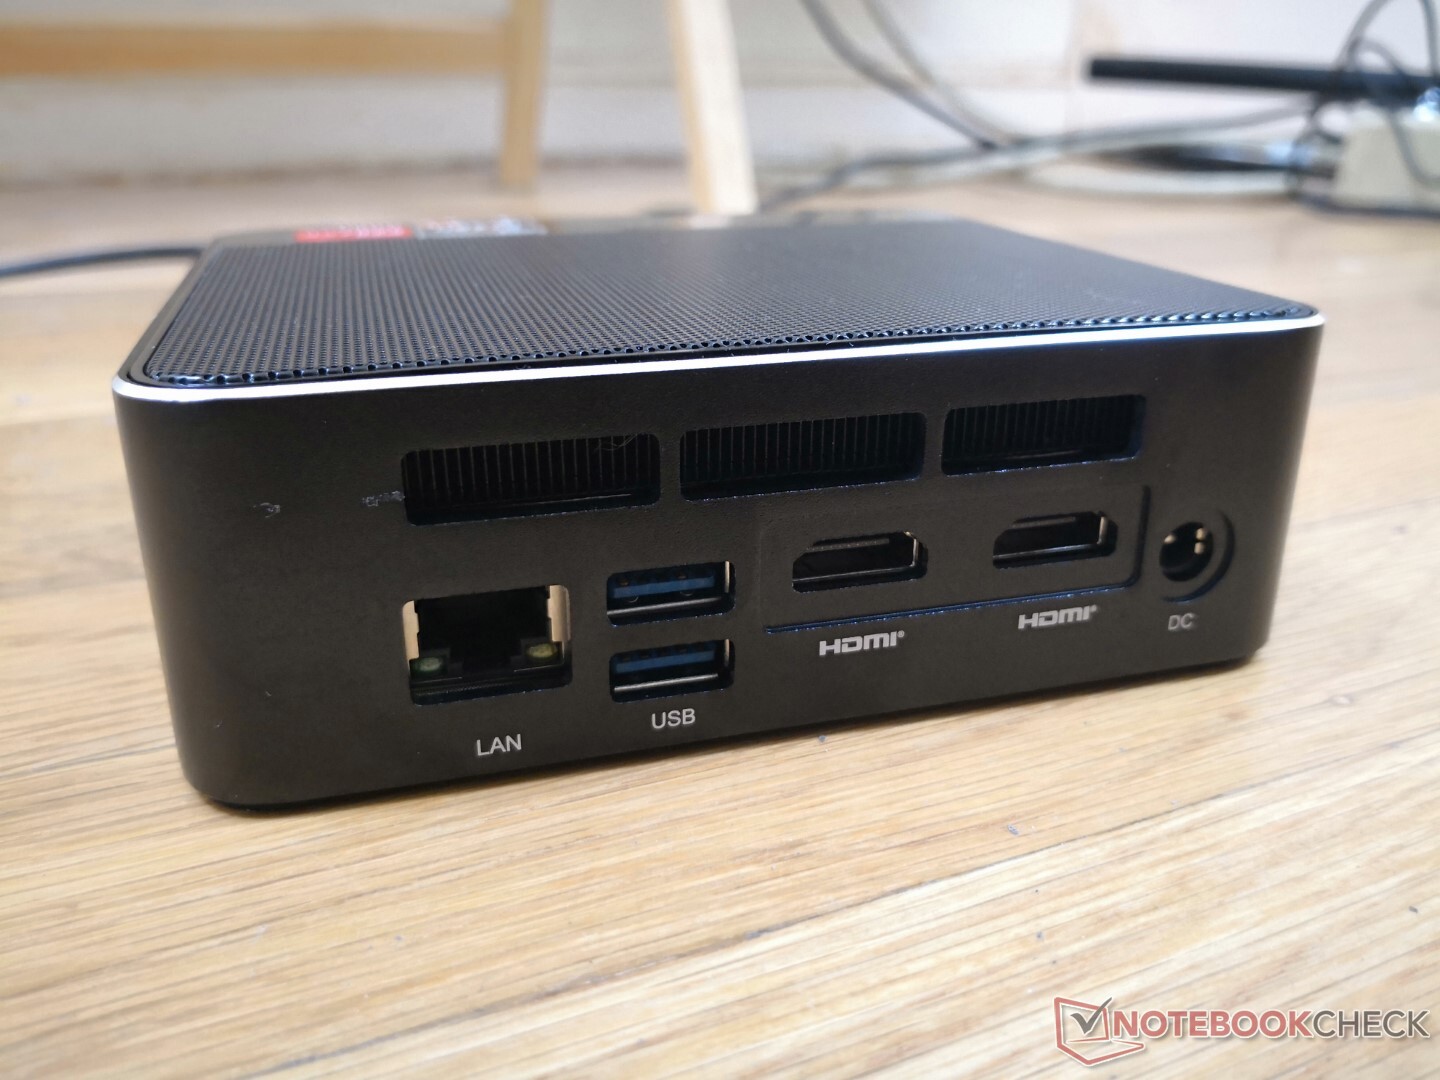
Anslutningsmöjligheter
Portalternativen är exakt desamma som på Beelink SEi10. Tänk dock på att det inte finns något Thunderbolt på SER3 eftersom dess AMD-processor inte har nativt stöd för gränssnittet
USB-C-porten stöder DisplayPort-out, men det skulle konstigt nog bara fungera med vissa och inte alla våra externa bildskärmar.
Kommunikation
| Networking | |
| iperf3 transmit AX12 | |
| Intel NUC11TNKi5 | |
| Beelink SEi10 | |
| Intel NUC8i7BE | |
| GMK NucBox 2 | |
| Beelink SER3 | |
| Zotac ZBox MI643 | |
| iperf3 receive AX12 | |
| Intel NUC11TNKi5 | |
| Beelink SEi10 | |
| Beelink SER3 | |
| GMK NucBox 2 | |
| Intel NUC8i7BE | |
| Zotac ZBox MI643 | |
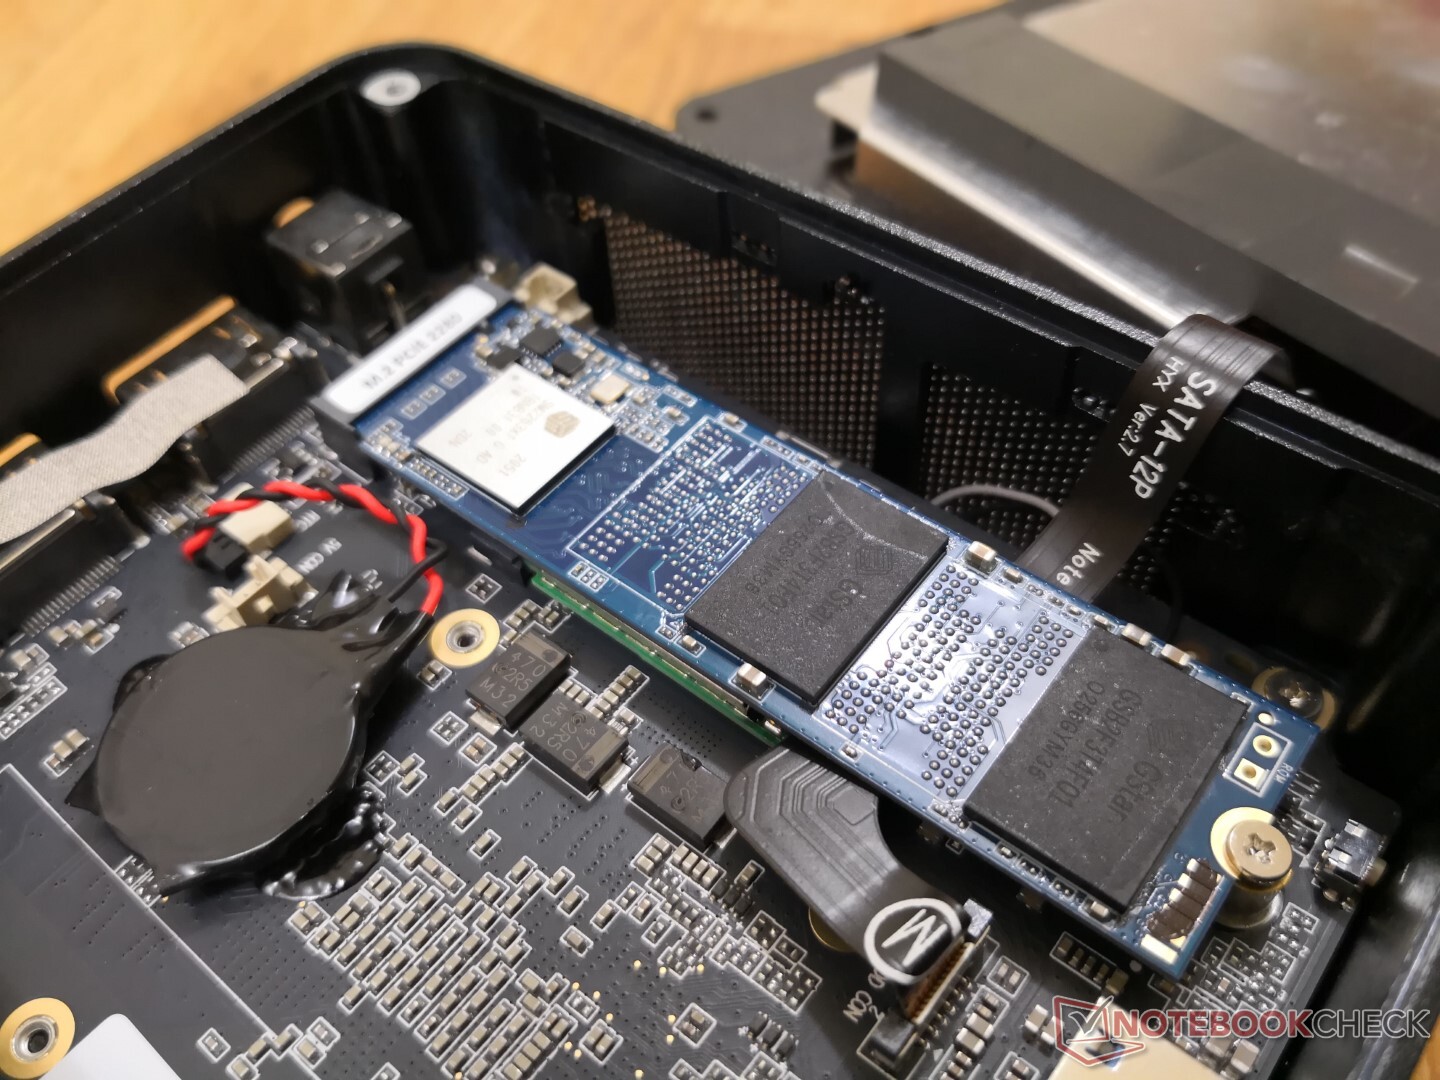
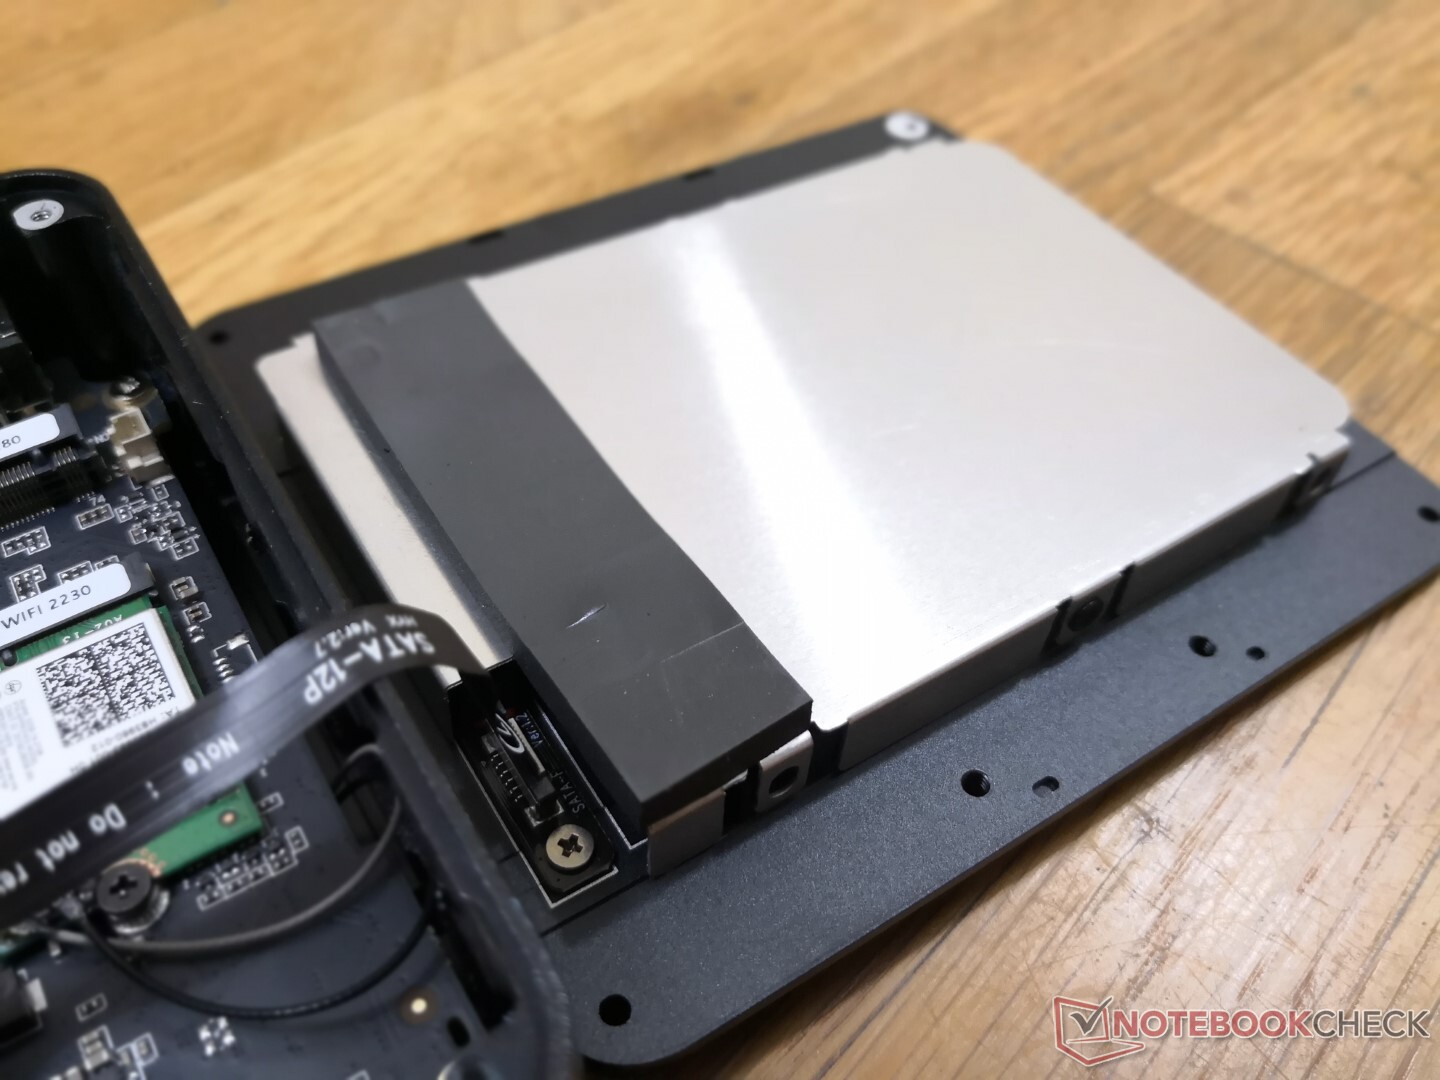
Underhåll
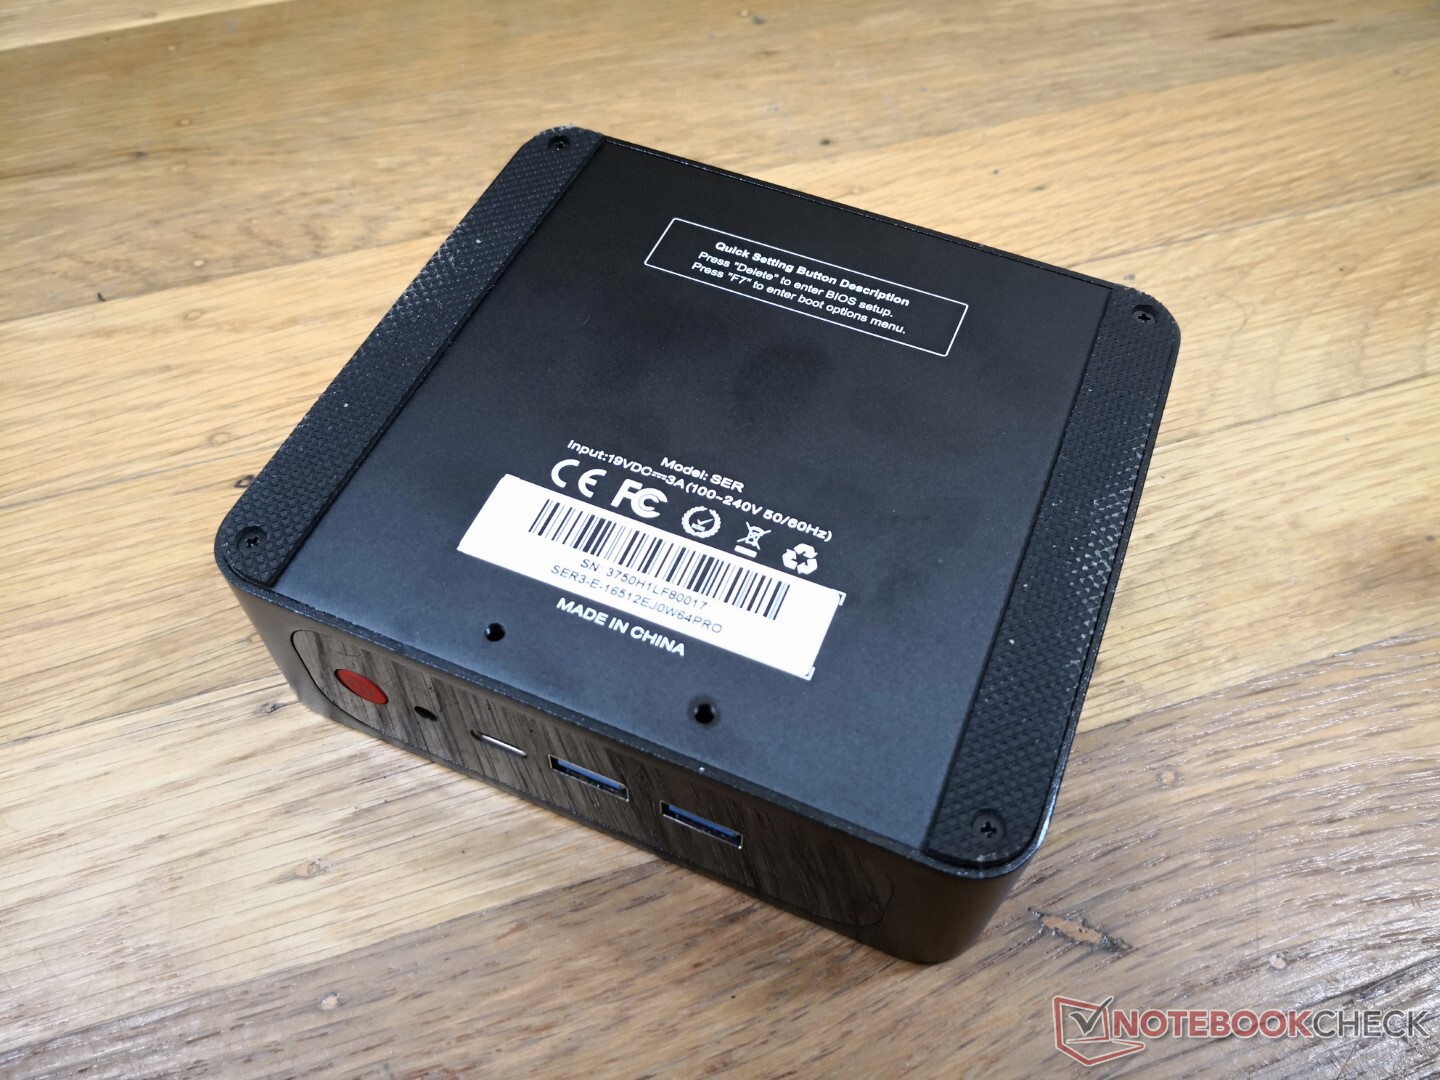
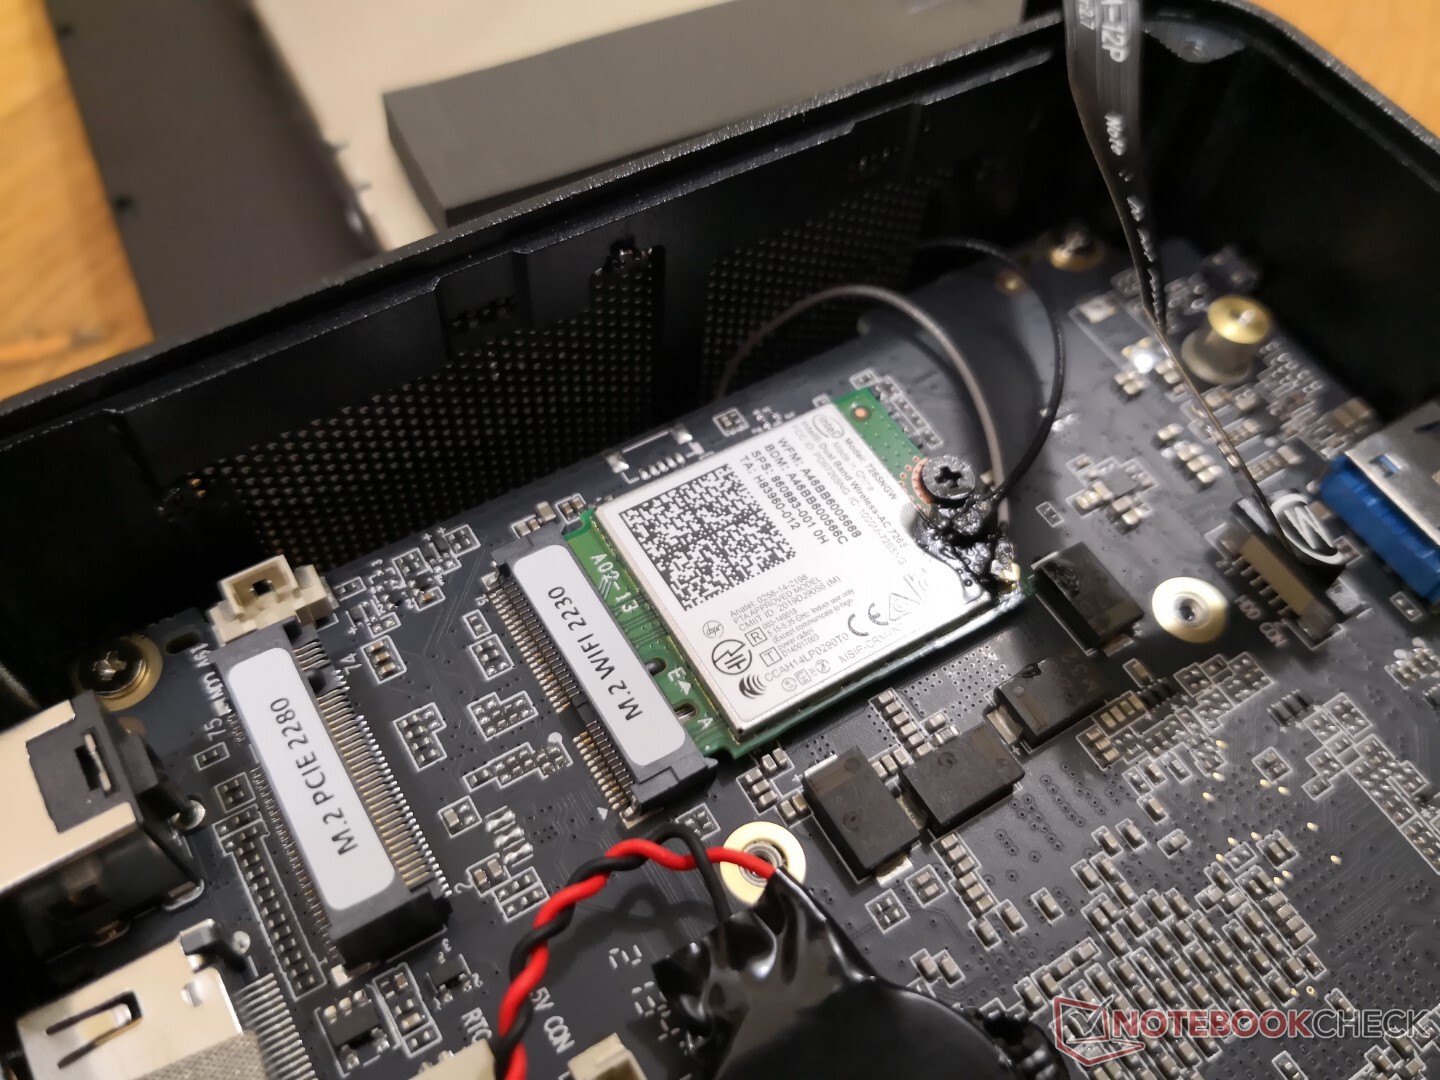
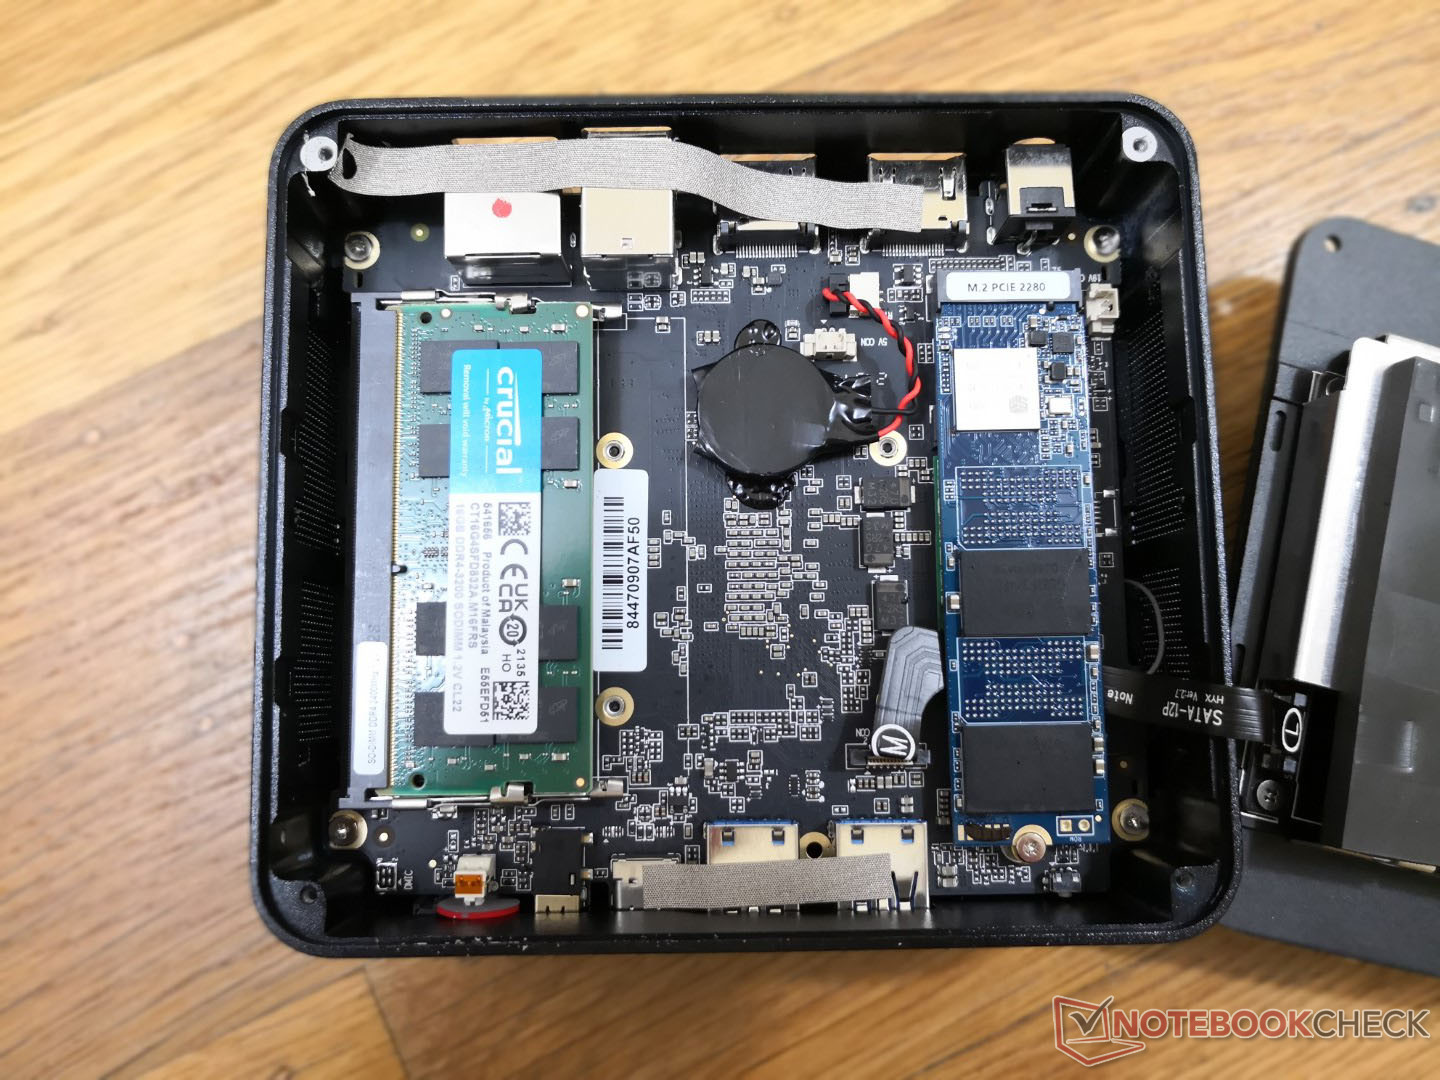
Bottenpanelen kan enkelt tas bort med en Philips-skruvmejsel för att avslöja en avtagbar WLAN-modul, en avtagbar M.2 2280 NVMe SSD och två SODIMM-fack.
Tillbehör och garanti
I detaljhandelsförpackningen ingår två korta HDMI-kablar, ett 50 mm eller 100 mm monteringsfäste och extra skruvar utöver den vanliga manualen och nätadaptern. Ett års tillverkargaranti gäller
Prestanda
Provningsförhållanden
Vår enhet ställdes in i prestandaläge innan vi körde de nedanstående benchmarks för att få högsta möjliga poäng.
Processor
Den råa CPU-prestandan är jämförbar medCore i5-8259U i den konkurrerande GMK NucBox 2. Den når inte riktigt upp till prestandan hos nyare CPU:er i Zen 2 eller Tiger Lake U-serien, som t.ex Ryzen 7 5700U eller Core i5-1135G7 som ofta finns i de senaste ultrabooks. Prestandan vid hög belastning under långa perioder är ändå konsekvent utan några större strypningsproblem.
Cinebench R15 Multi Loop
Cinebench R23: Multi Core | Single Core
Cinebench R20: CPU (Multi Core) | CPU (Single Core)
Cinebench R15: CPU Multi 64Bit | CPU Single 64Bit
Blender: v2.79 BMW27 CPU
7-Zip 18.03: 7z b 4 | 7z b 4 -mmt1
Geekbench 5.5: Multi-Core | Single-Core
HWBOT x265 Benchmark v2.2: 4k Preset
LibreOffice : 20 Documents To PDF
R Benchmark 2.5: Overall mean
| CPU Performance rating | |
| Intel NUC11TNKi5 | |
| Intel NUC8i7BE -3! | |
| GMK NucBox 2 | |
| Genomsnitt AMD Ryzen 7 3750H | |
| Zotac ZBox MI643 -2! | |
| Beelink SER3 -2! | |
| Beelink SEi10 -2! | |
| Cinebench R23 / Multi Core | |
| Intel NUC11TNKi5 | |
| Beelink SER3 | |
| Genomsnitt AMD Ryzen 7 3750H (n=1) | |
| GMK NucBox 2 | |
| Cinebench R23 / Single Core | |
| Intel NUC11TNKi5 | |
| GMK NucBox 2 | |
| Beelink SER3 | |
| Genomsnitt AMD Ryzen 7 3750H (n=1) | |
| Cinebench R20 / CPU (Multi Core) | |
| Intel NUC11TNKi5 | |
| Intel NUC8i7BE | |
| Genomsnitt AMD Ryzen 7 3750H (1514 - 1825, n=4) | |
| Beelink SER3 | |
| GMK NucBox 2 | |
| Zotac ZBox MI643 | |
| Beelink SEi10 | |
| Cinebench R20 / CPU (Single Core) | |
| Intel NUC11TNKi5 | |
| Intel NUC8i7BE | |
| Zotac ZBox MI643 | |
| Beelink SEi10 | |
| GMK NucBox 2 | |
| Beelink SER3 | |
| Genomsnitt AMD Ryzen 7 3750H (340 - 386, n=4) | |
| Cinebench R15 / CPU Multi 64Bit | |
| Intel NUC8i7BE | |
| Intel NUC11TNKi5 | |
| Genomsnitt AMD Ryzen 7 3750H (672 - 805, n=7) | |
| Beelink SER3 | |
| GMK NucBox 2 | |
| Zotac ZBox MI643 | |
| Beelink SEi10 | |
| Cinebench R15 / CPU Single 64Bit | |
| Intel NUC11TNKi5 | |
| Intel NUC8i7BE | |
| Zotac ZBox MI643 | |
| Beelink SEi10 | |
| GMK NucBox 2 | |
| Beelink SER3 | |
| Genomsnitt AMD Ryzen 7 3750H (135 - 157, n=7) | |
| Blender / v2.79 BMW27 CPU | |
| Beelink SEi10 | |
| Zotac ZBox MI643 | |
| GMK NucBox 2 | |
| Intel NUC8i7BE | |
| Intel NUC8i7BE | |
| Beelink SER3 | |
| Genomsnitt AMD Ryzen 7 3750H (584 - 672, n=3) | |
| Intel NUC11TNKi5 | |
| 7-Zip 18.03 / 7z b 4 | |
| Intel NUC8i7BE | |
| Intel NUC8i7BE | |
| Intel NUC11TNKi5 | |
| GMK NucBox 2 | |
| Genomsnitt AMD Ryzen 7 3750H (17077 - 19187, n=3) | |
| Beelink SER3 | |
| Zotac ZBox MI643 | |
| Beelink SEi10 | |
| 7-Zip 18.03 / 7z b 4 -mmt1 | |
| Intel NUC8i7BE | |
| Intel NUC8i7BE | |
| Intel NUC11TNKi5 | |
| Zotac ZBox MI643 | |
| Beelink SEi10 | |
| GMK NucBox 2 | |
| Beelink SER3 | |
| Genomsnitt AMD Ryzen 7 3750H (3511 - 3752, n=3) | |
| Geekbench 5.5 / Multi-Core | |
| Intel NUC11TNKi5 | |
| Zotac ZBox MI643 | |
| Intel NUC8i7BE | |
| Genomsnitt AMD Ryzen 7 3750H (n=1) | |
| GMK NucBox 2 | |
| Beelink SEi10 | |
| Geekbench 5.5 / Single-Core | |
| Intel NUC11TNKi5 | |
| Zotac ZBox MI643 | |
| Beelink SEi10 | |
| GMK NucBox 2 | |
| Genomsnitt AMD Ryzen 7 3750H (n=1) | |
| Intel NUC8i7BE | |
| HWBOT x265 Benchmark v2.2 / 4k Preset | |
| Intel NUC11TNKi5 | |
| Intel NUC8i7BE | |
| Intel NUC8i7BE | |
| GMK NucBox 2 | |
| Genomsnitt AMD Ryzen 7 3750H (4.14 - 4.4, n=3) | |
| Zotac ZBox MI643 | |
| Beelink SER3 | |
| Beelink SEi10 | |
| LibreOffice / 20 Documents To PDF | |
| Beelink SER3 | |
| Genomsnitt AMD Ryzen 7 3750H (n=1) | |
| GMK NucBox 2 | |
| Zotac ZBox MI643 | |
| Beelink SEi10 | |
| Intel NUC11TNKi5 | |
| R Benchmark 2.5 / Overall mean | |
| GMK NucBox 2 | |
| Beelink SEi10 | |
| Beelink SER3 | |
| Genomsnitt AMD Ryzen 7 3750H (0.69 - 0.723, n=2) | |
| Zotac ZBox MI643 | |
| Intel NUC8i7BE | |
| Intel NUC11TNKi5 | |
* ... mindre är bättre
AIDA64: FP32 Ray-Trace | FPU Julia | CPU SHA3 | CPU Queen | FPU SinJulia | FPU Mandel | CPU AES | CPU ZLib | FP64 Ray-Trace | CPU PhotoWorxx
| Performance rating | |
| Intel NUC11TNKi5 | |
| Intel NUC8i7BE -1! | |
| GMK NucBox 2 | |
| Genomsnitt AMD Ryzen 7 3750H | |
| Zotac ZBox MI643 | |
| Beelink SER3 | |
| AIDA64 / FP32 Ray-Trace | |
| Intel NUC11TNKi5 | |
| Intel NUC8i7BE | |
| GMK NucBox 2 | |
| Zotac ZBox MI643 | |
| Genomsnitt AMD Ryzen 7 3750H (3338 - 3668, n=2) | |
| Beelink SER3 | |
| AIDA64 / FPU Julia | |
| Intel NUC11TNKi5 | |
| Intel NUC8i7BE | |
| GMK NucBox 2 | |
| Zotac ZBox MI643 | |
| Genomsnitt AMD Ryzen 7 3750H (16912 - 19132, n=2) | |
| Beelink SER3 | |
| AIDA64 / CPU SHA3 | |
| Intel NUC11TNKi5 | |
| GMK NucBox 2 | |
| Genomsnitt AMD Ryzen 7 3750H (897 - 1001, n=2) | |
| Zotac ZBox MI643 | |
| Beelink SER3 | |
| AIDA64 / CPU Queen | |
| Intel NUC8i7BE | |
| Zotac ZBox MI643 | |
| Genomsnitt AMD Ryzen 7 3750H (43632 - 50328, n=2) | |
| Intel NUC11TNKi5 | |
| Beelink SER3 | |
| GMK NucBox 2 | |
| AIDA64 / FPU SinJulia | |
| Genomsnitt AMD Ryzen 7 3750H (5639 - 6478, n=2) | |
| Beelink SER3 | |
| Intel NUC8i7BE | |
| Intel NUC11TNKi5 | |
| GMK NucBox 2 | |
| Zotac ZBox MI643 | |
| AIDA64 / FPU Mandel | |
| Intel NUC11TNKi5 | |
| Intel NUC8i7BE | |
| GMK NucBox 2 | |
| Zotac ZBox MI643 | |
| Genomsnitt AMD Ryzen 7 3750H (8846 - 9928, n=2) | |
| Beelink SER3 | |
| AIDA64 / CPU AES | |
| Intel NUC11TNKi5 | |
| Genomsnitt AMD Ryzen 7 3750H (28977 - 32668, n=2) | |
| Beelink SER3 | |
| Intel NUC8i7BE | |
| GMK NucBox 2 | |
| Zotac ZBox MI643 | |
| AIDA64 / CPU ZLib | |
| Intel NUC11TNKi5 | |
| Intel NUC8i7BE | |
| Genomsnitt AMD Ryzen 7 3750H (313 - 350, n=2) | |
| Beelink SER3 | |
| GMK NucBox 2 | |
| Zotac ZBox MI643 | |
| AIDA64 / FP64 Ray-Trace | |
| Intel NUC11TNKi5 | |
| Intel NUC8i7BE | |
| GMK NucBox 2 | |
| Zotac ZBox MI643 | |
| Genomsnitt AMD Ryzen 7 3750H (1758 - 1935, n=2) | |
| Beelink SER3 | |
| AIDA64 / CPU PhotoWorxx | |
| Zotac ZBox MI643 | |
| Intel NUC8i7BE | |
| Intel NUC11TNKi5 | |
| Genomsnitt AMD Ryzen 7 3750H (10338 - 18898, n=2) | |
| Beelink SER3 | |
| GMK NucBox 2 | |
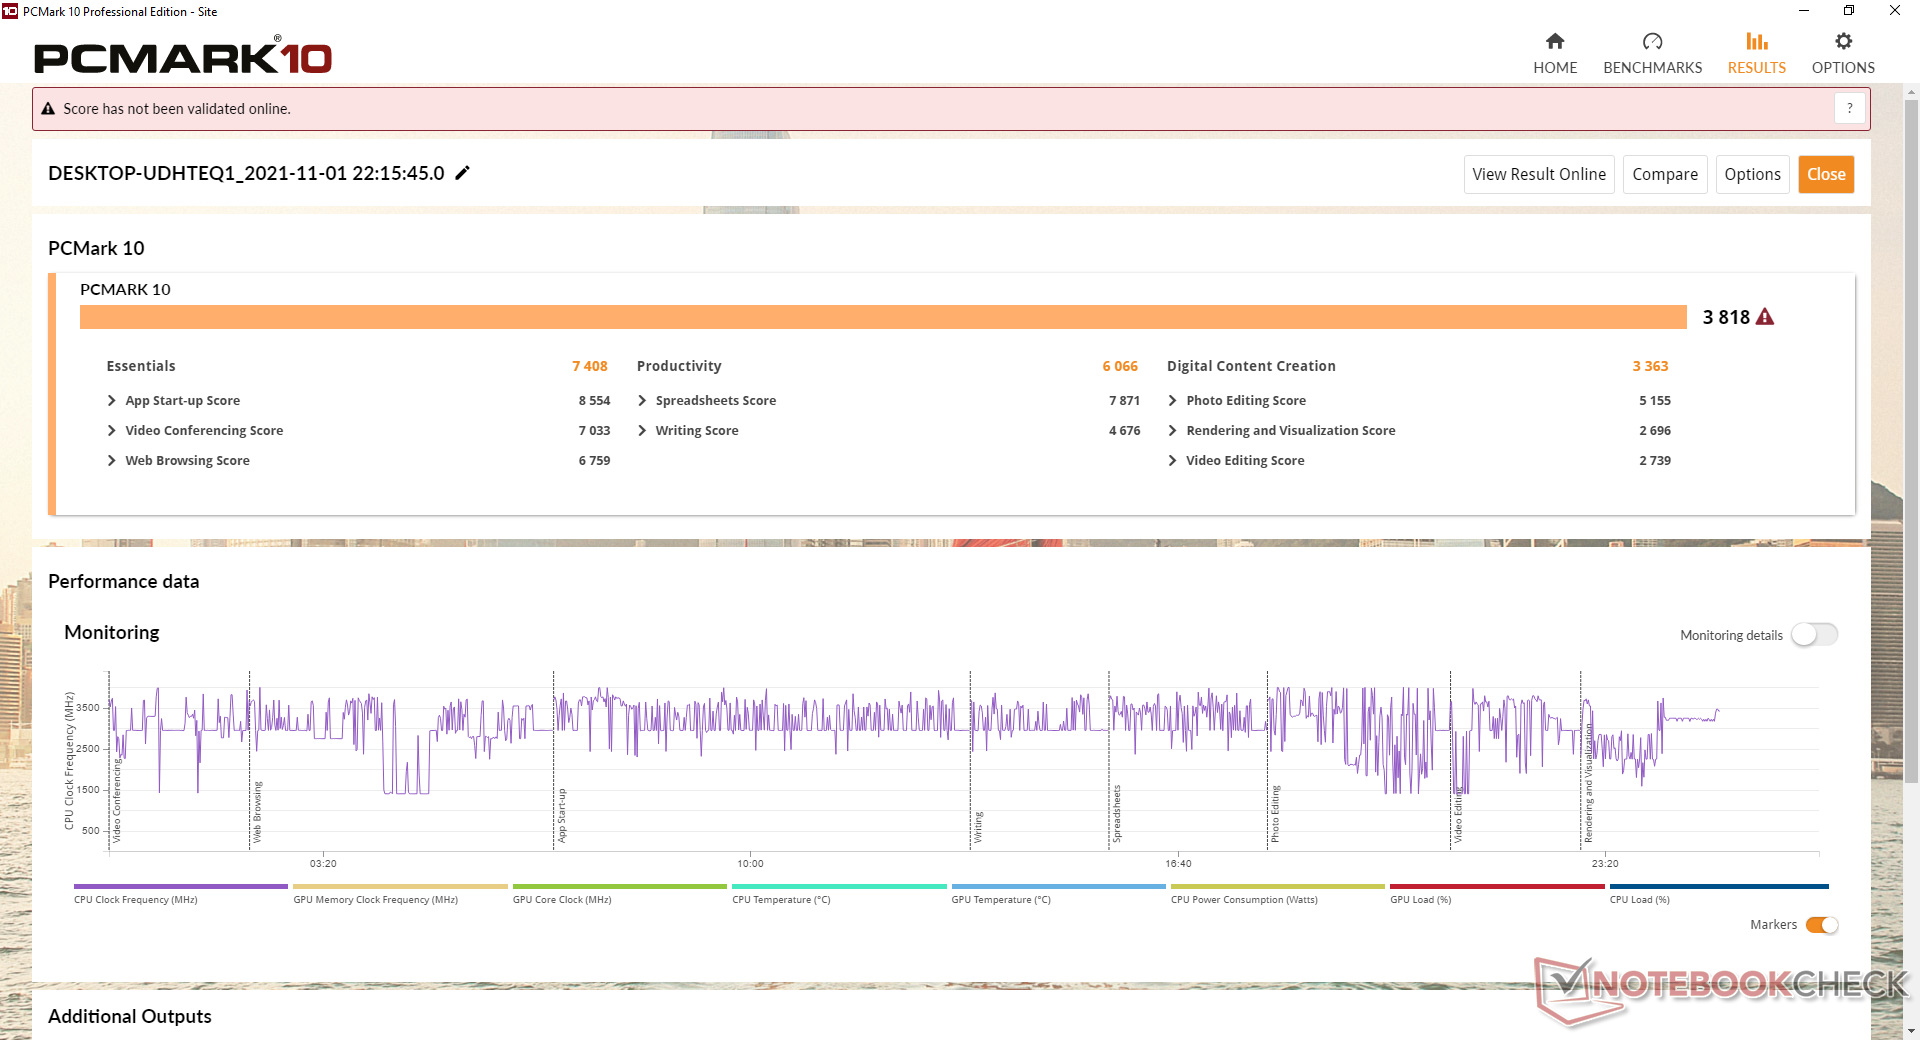
Systemets prestanda
| PCMark 10 / Score | |
| Intel NUC8i7BE | |
| Intel NUC11TNKi5 | |
| Zotac ZBox MI643 | |
| GMK NucBox 2 | |
| Beelink SER3 | |
| Genomsnitt AMD Ryzen 7 3750H, AMD Radeon RX Vega 10 (n=1) | |
| Beelink SEi10 | |
| PCMark 10 / Essentials | |
| Zotac ZBox MI643 | |
| Intel NUC11TNKi5 | |
| Intel NUC8i7BE | |
| GMK NucBox 2 | |
| Beelink SEi10 | |
| Beelink SER3 | |
| Genomsnitt AMD Ryzen 7 3750H, AMD Radeon RX Vega 10 (n=1) | |
| PCMark 10 / Productivity | |
| Intel NUC8i7BE | |
| Zotac ZBox MI643 | |
| GMK NucBox 2 | |
| Intel NUC11TNKi5 | |
| Beelink SER3 | |
| Genomsnitt AMD Ryzen 7 3750H, AMD Radeon RX Vega 10 (n=1) | |
| Beelink SEi10 | |
| PCMark 10 / Digital Content Creation | |
| Intel NUC11TNKi5 | |
| Intel NUC8i7BE | |
| GMK NucBox 2 | |
| Beelink SER3 | |
| Genomsnitt AMD Ryzen 7 3750H, AMD Radeon RX Vega 10 (n=1) | |
| Zotac ZBox MI643 | |
| Beelink SEi10 | |
| PCMark 10 Score | 3818 poäng | |
Hjälp | ||
| AIDA64 / Memory Copy | |
| Intel NUC8i7BE | |
| GMK NucBox 2 | |
| Zotac ZBox MI643 | |
| Genomsnitt AMD Ryzen 7 3750H (16249 - 30963, n=2) | |
| Intel NUC11TNKi5 | |
| Beelink SER3 | |
| AIDA64 / Memory Read | |
| Intel NUC8i7BE | |
| GMK NucBox 2 | |
| Zotac ZBox MI643 | |
| Genomsnitt AMD Ryzen 7 3750H (18268 - 35218, n=2) | |
| Intel NUC11TNKi5 | |
| Beelink SER3 | |
| AIDA64 / Memory Write | |
| Intel NUC8i7BE | |
| GMK NucBox 2 | |
| Zotac ZBox MI643 | |
| Genomsnitt AMD Ryzen 7 3750H (18455 - 35988, n=2) | |
| Intel NUC11TNKi5 | |
| Beelink SER3 | |
| AIDA64 / Memory Latency | |
| Genomsnitt AMD Ryzen 7 3750H (95.8 - 118, n=2) | |
| Beelink SER3 | |
| Intel NUC11TNKi5 | |
| Zotac ZBox MI643 | |
| GMK NucBox 2 | |
| Intel NUC8i7BE | |
* ... mindre är bättre
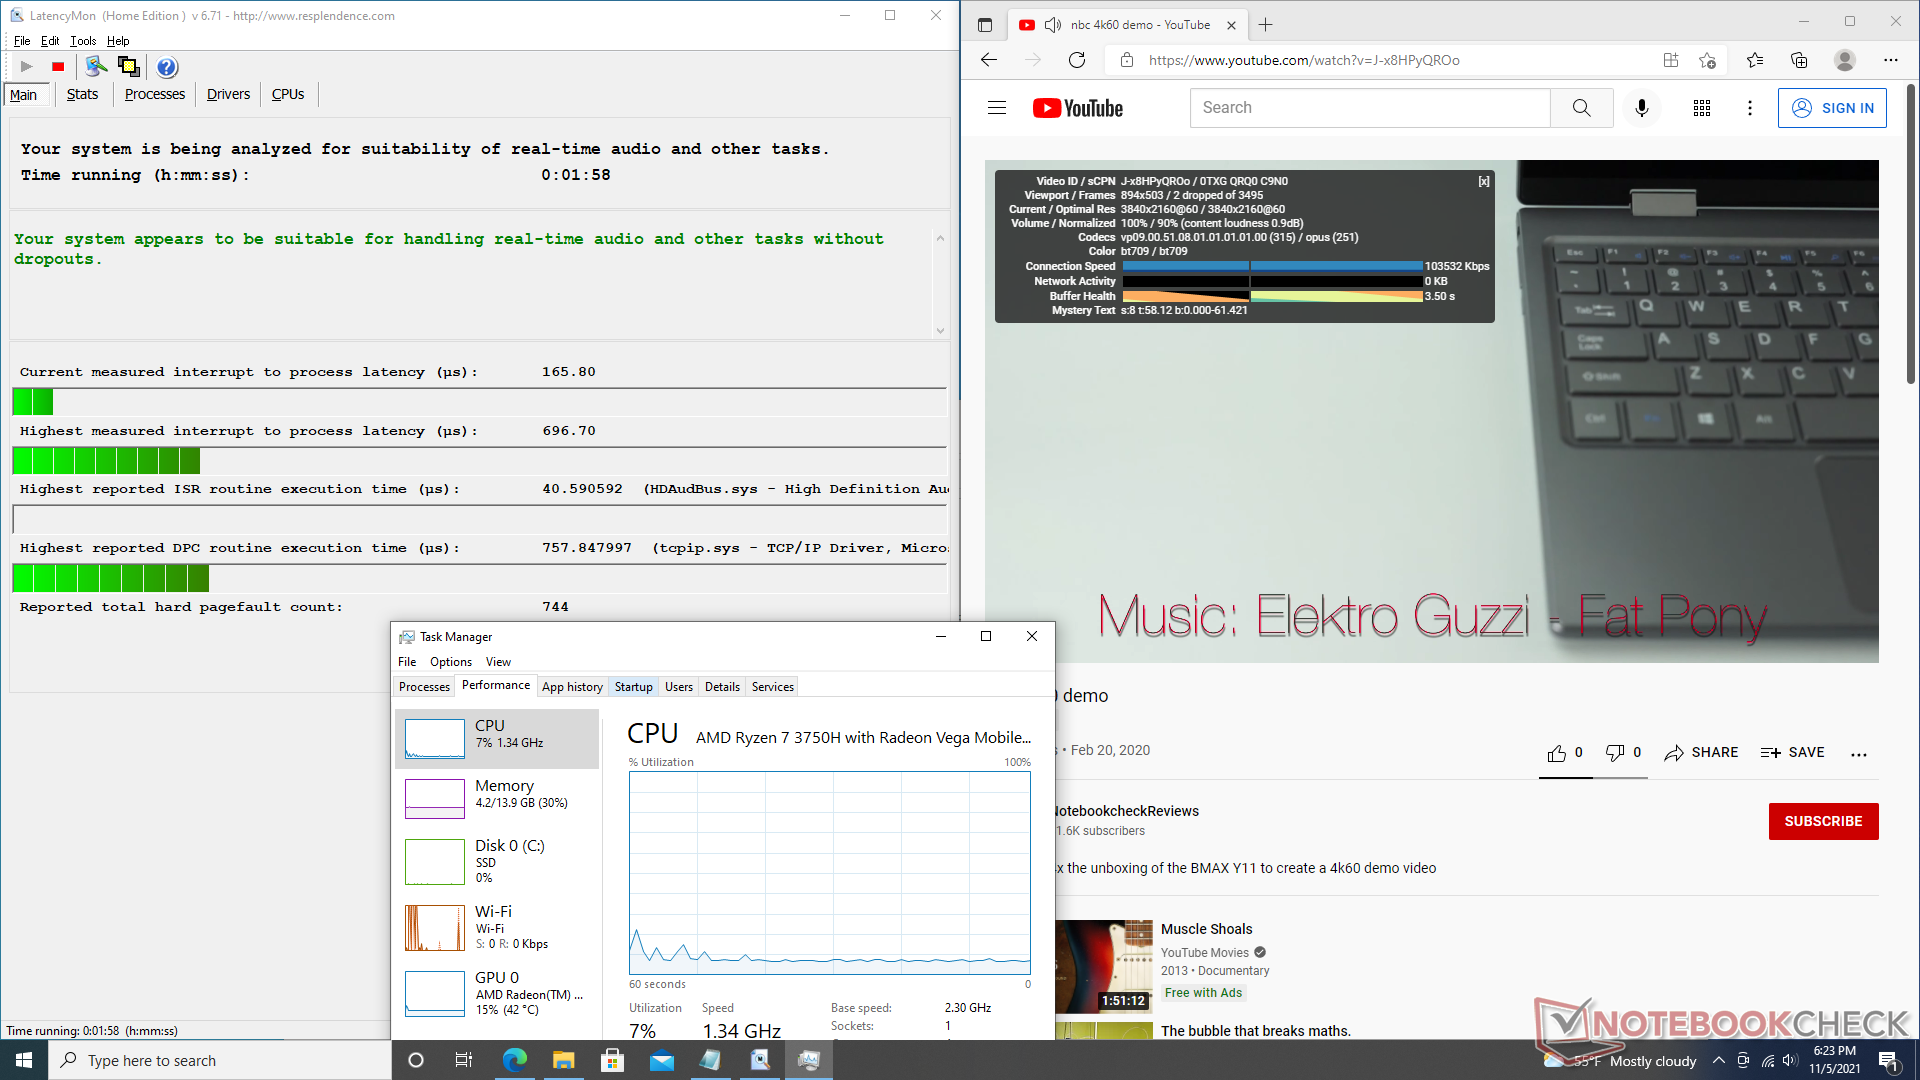
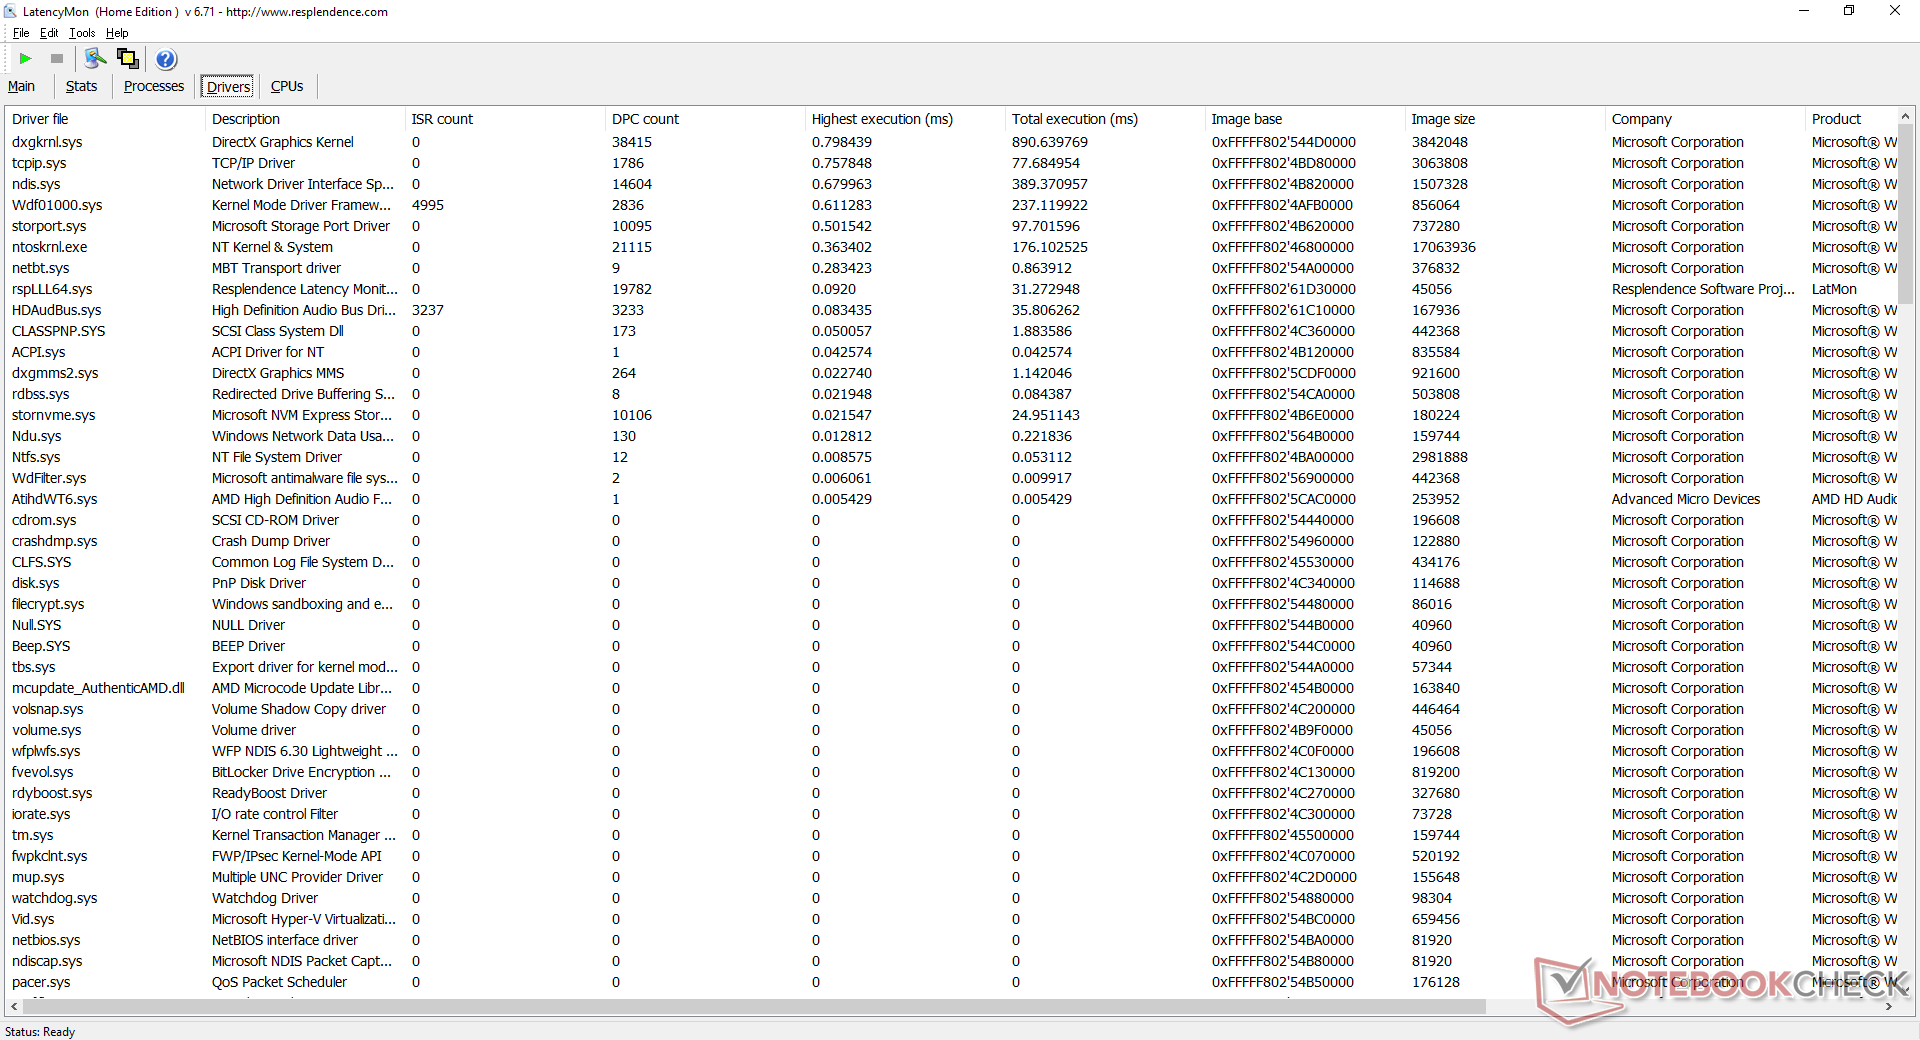
DPC-latenstid
LatencyMon visar inga DPC-problem när vi öppnar flera webbläsarflikar på vår hemsida eller när vi kör Prime95 stress. Uppspelning av 4K-video vid 60 FPS går smidigt och nästan utan att ramar tappas bort.
| DPC Latencies / LatencyMon - interrupt to process latency (max), Web, Youtube, Prime95 | |
| Beelink SEi10 | |
| GMK NucBox 2 | |
| Zotac ZBox MI643 | |
| Beelink SER3 | |
| Intel NUC11TNKi5 | |
* ... mindre är bättre
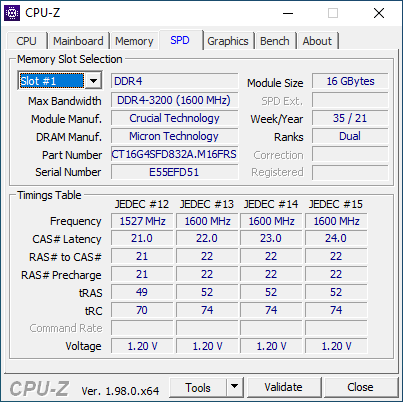
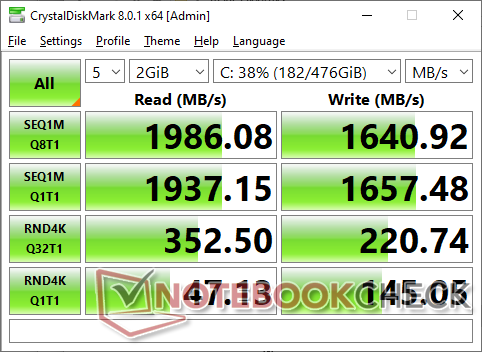
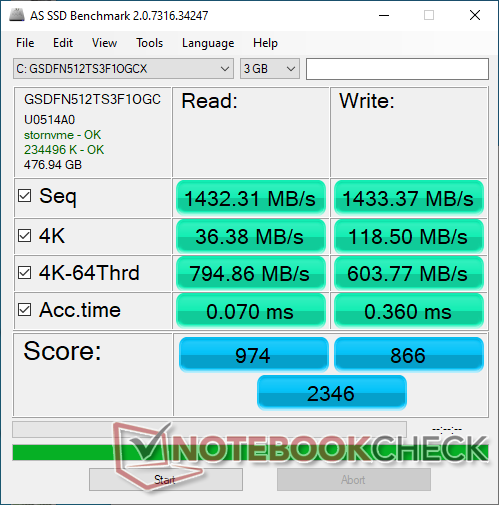
Lagringsenheter
Medan vår SEi10 levereras med en 256 GB Silicon Motion AZW NVMe SSD har vår SER3 istället en 512 GB version. Sekventiell läs- och skrivhastighet avslöjar att enheten är en NVMe-enhet i mellanklassen. Överföringshastigheterna kommer att sjunka med tiden när de stressas från 1900 MB/s till 1400 MB/s eller långsammare på grund av termiska begränsningar. Många Intel NUC:s integrerar en värmespridare ovanpå NVMe SSD:n för kylning för att förhindra eller fördröja prestandasänkningen.

| Drive Performance rating - Percent | |
| Zotac ZBox MI643 | |
| Beelink SER3 | |
| GMK NucBox 2 | |
| Beelink SEi10 | |
| Intel NUC11TNKi5 | |
| DiskSpd | |
| seq read | |
| Zotac ZBox MI643 | |
| GMK NucBox 2 | |
| Beelink SER3 | |
| Beelink SEi10 | |
| Intel NUC11TNKi5 | |
| seq write | |
| Zotac ZBox MI643 | |
| Beelink SER3 | |
| GMK NucBox 2 | |
| Beelink SEi10 | |
| Intel NUC11TNKi5 | |
| seq q8 t1 read | |
| GMK NucBox 2 | |
| Zotac ZBox MI643 | |
| Beelink SER3 | |
| Beelink SEi10 | |
| Intel NUC11TNKi5 | |
| seq q8 t1 write | |
| Zotac ZBox MI643 | |
| Beelink SER3 | |
| GMK NucBox 2 | |
| Beelink SEi10 | |
| Intel NUC11TNKi5 | |
| 4k q1 t1 read | |
| Zotac ZBox MI643 | |
| Beelink SEi10 | |
| Beelink SER3 | |
| GMK NucBox 2 | |
| Intel NUC11TNKi5 | |
| 4k q1 t1 write | |
| Zotac ZBox MI643 | |
| Beelink SEi10 | |
| GMK NucBox 2 | |
| Beelink SER3 | |
| Intel NUC11TNKi5 | |
| 4k q32 t16 read | |
| Beelink SER3 | |
| Zotac ZBox MI643 | |
| Beelink SEi10 | |
| GMK NucBox 2 | |
| Intel NUC11TNKi5 | |
| 4k q32 t16 write | |
| Zotac ZBox MI643 | |
| GMK NucBox 2 | |
| Beelink SEi10 | |
| Beelink SER3 | |
| Intel NUC11TNKi5 | |
| AS SSD | |
| Score Total | |
| Zotac ZBox MI643 | |
| Beelink SER3 | |
| GMK NucBox 2 | |
| Beelink SEi10 | |
| Intel NUC11TNKi5 | |
| Score Read | |
| Zotac ZBox MI643 | |
| Beelink SER3 | |
| GMK NucBox 2 | |
| Beelink SEi10 | |
| Intel NUC11TNKi5 | |
| Score Write | |
| Zotac ZBox MI643 | |
| Beelink SER3 | |
| GMK NucBox 2 | |
| Intel NUC11TNKi5 | |
| Beelink SEi10 | |
| Seq Read | |
| GMK NucBox 2 | |
| Zotac ZBox MI643 | |
| Beelink SER3 | |
| Beelink SEi10 | |
| Intel NUC11TNKi5 | |
| Seq Write | |
| Zotac ZBox MI643 | |
| Beelink SER3 | |
| GMK NucBox 2 | |
| Intel NUC11TNKi5 | |
| Beelink SEi10 | |
| 4K Read | |
| Zotac ZBox MI643 | |
| GMK NucBox 2 | |
| Beelink SER3 | |
| Beelink SEi10 | |
| Intel NUC11TNKi5 | |
| 4K Write | |
| GMK NucBox 2 | |
| Zotac ZBox MI643 | |
| Beelink SER3 | |
| Beelink SEi10 | |
| Intel NUC11TNKi5 | |
| 4K-64 Read | |
| Zotac ZBox MI643 | |
| Beelink SER3 | |
| GMK NucBox 2 | |
| Beelink SEi10 | |
| Intel NUC11TNKi5 | |
| 4K-64 Write | |
| Zotac ZBox MI643 | |
| Beelink SER3 | |
| GMK NucBox 2 | |
| Intel NUC11TNKi5 | |
| Beelink SEi10 | |
| Access Time Read | |
| Intel NUC11TNKi5 | |
| Beelink SER3 | |
| Beelink SEi10 | |
| GMK NucBox 2 | |
| Zotac ZBox MI643 | |
| Access Time Write | |
| Beelink SEi10 | |
| Beelink SER3 | |
| GMK NucBox 2 | |
| Intel NUC11TNKi5 | |
| Zotac ZBox MI643 | |
* ... mindre är bättre
Disk Throttling: DiskSpd Read Loop, Queue Depth 8
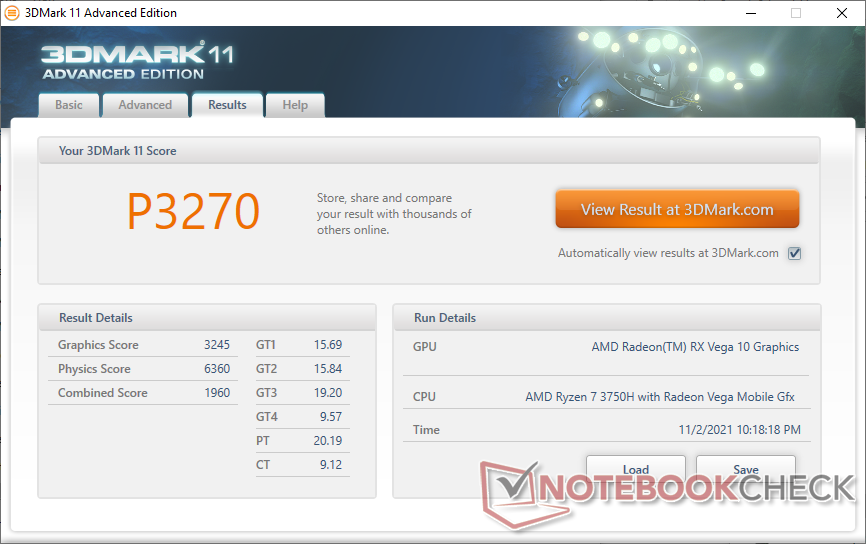
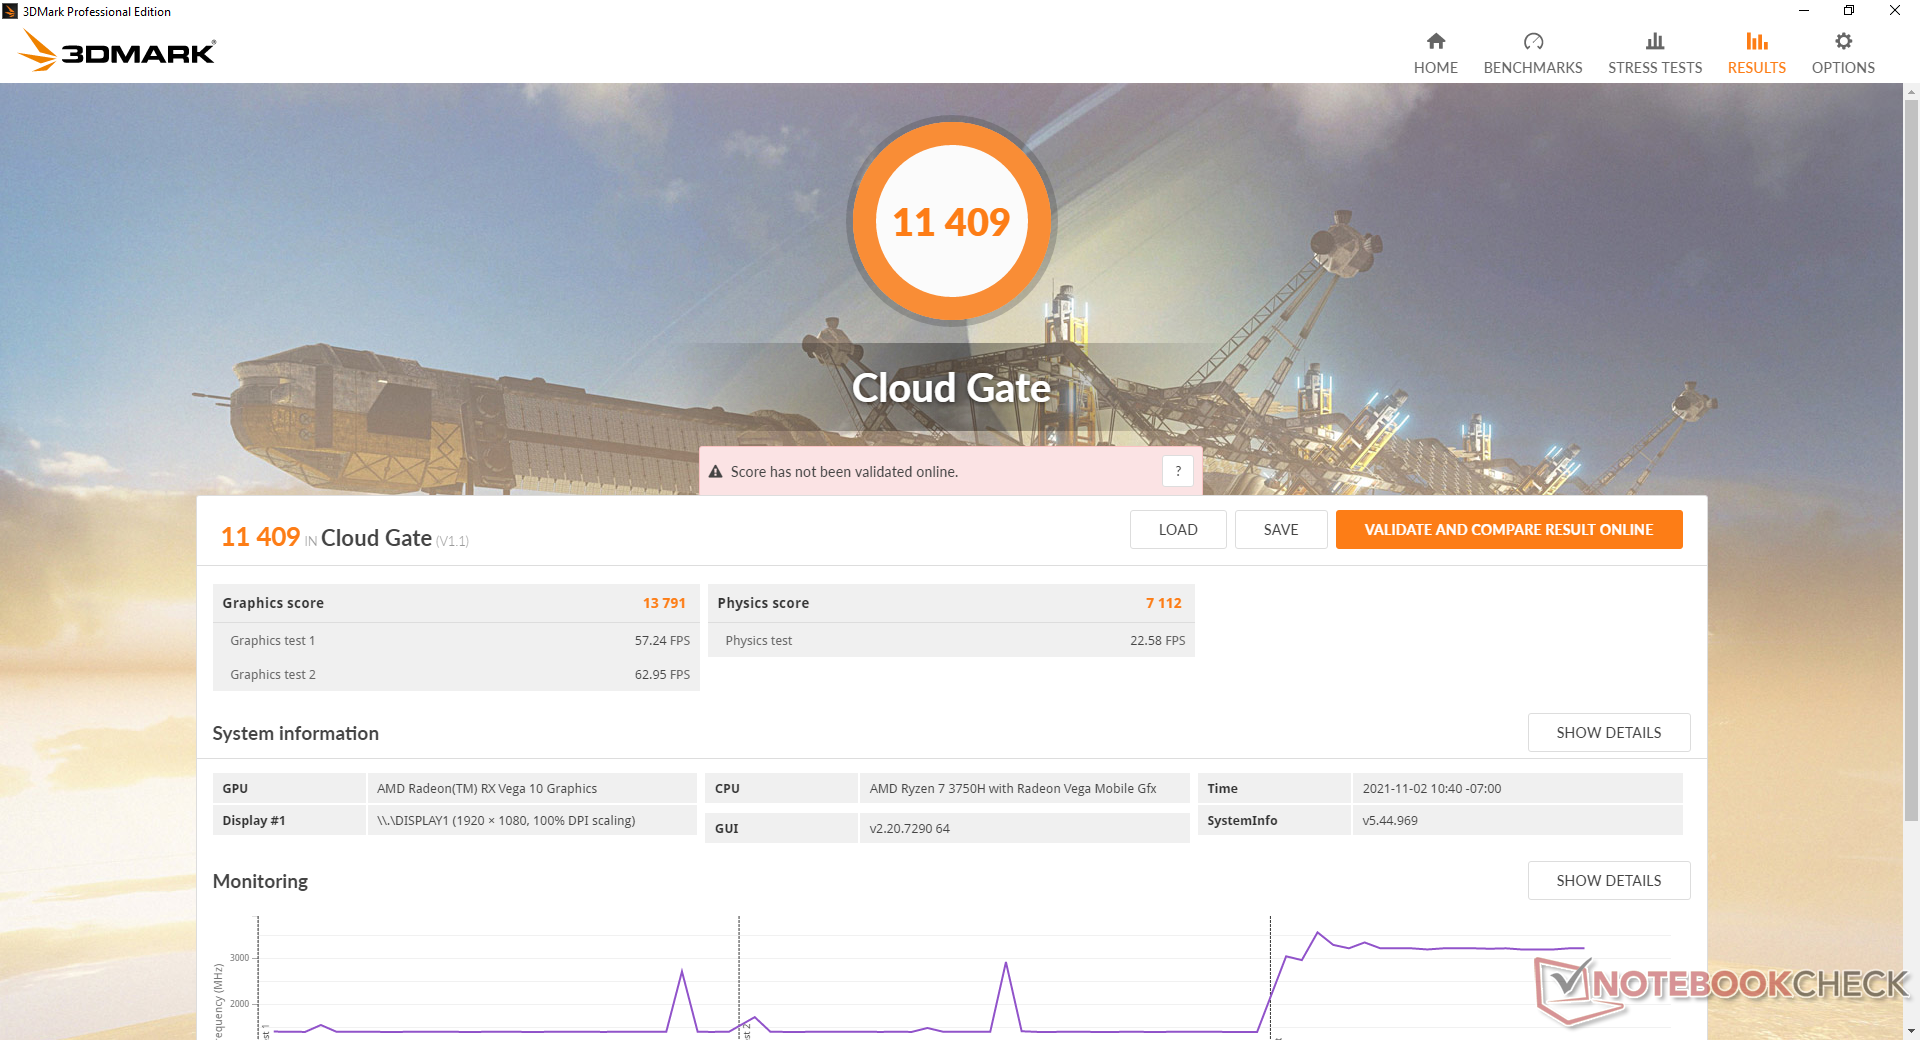
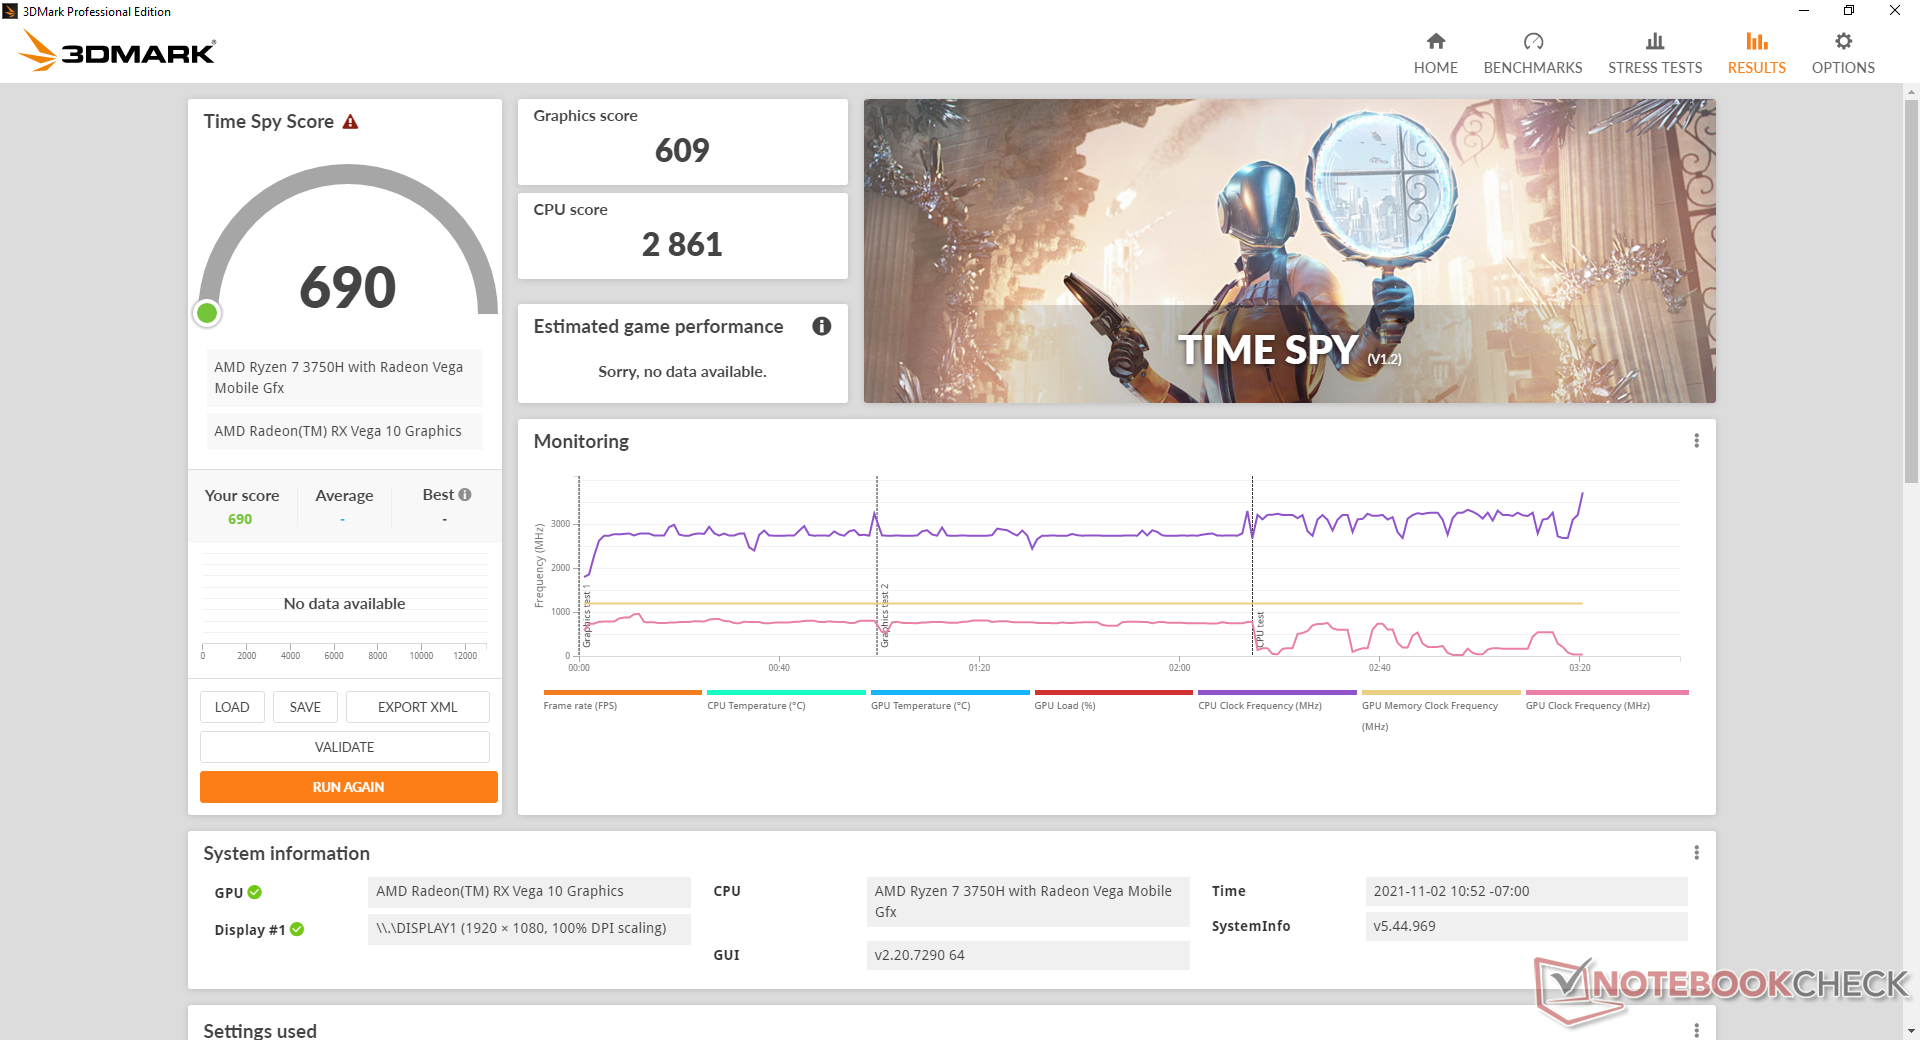
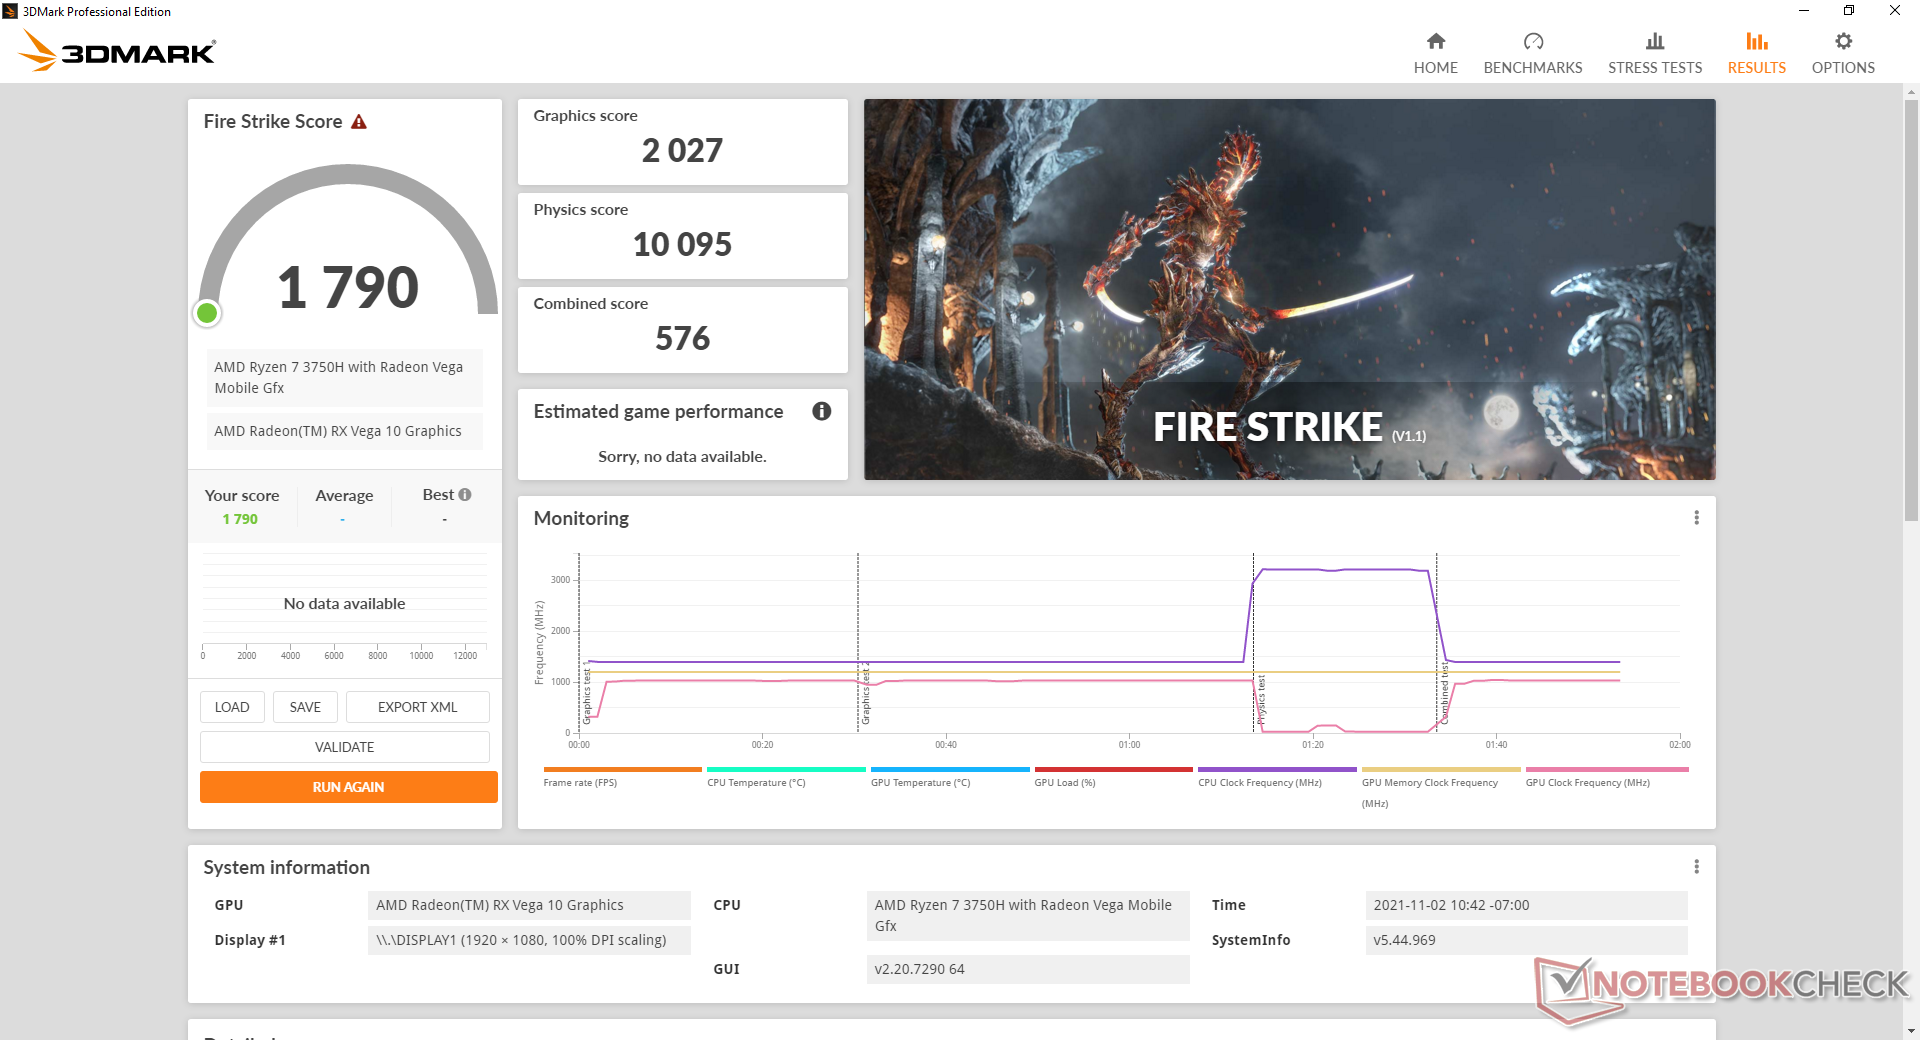
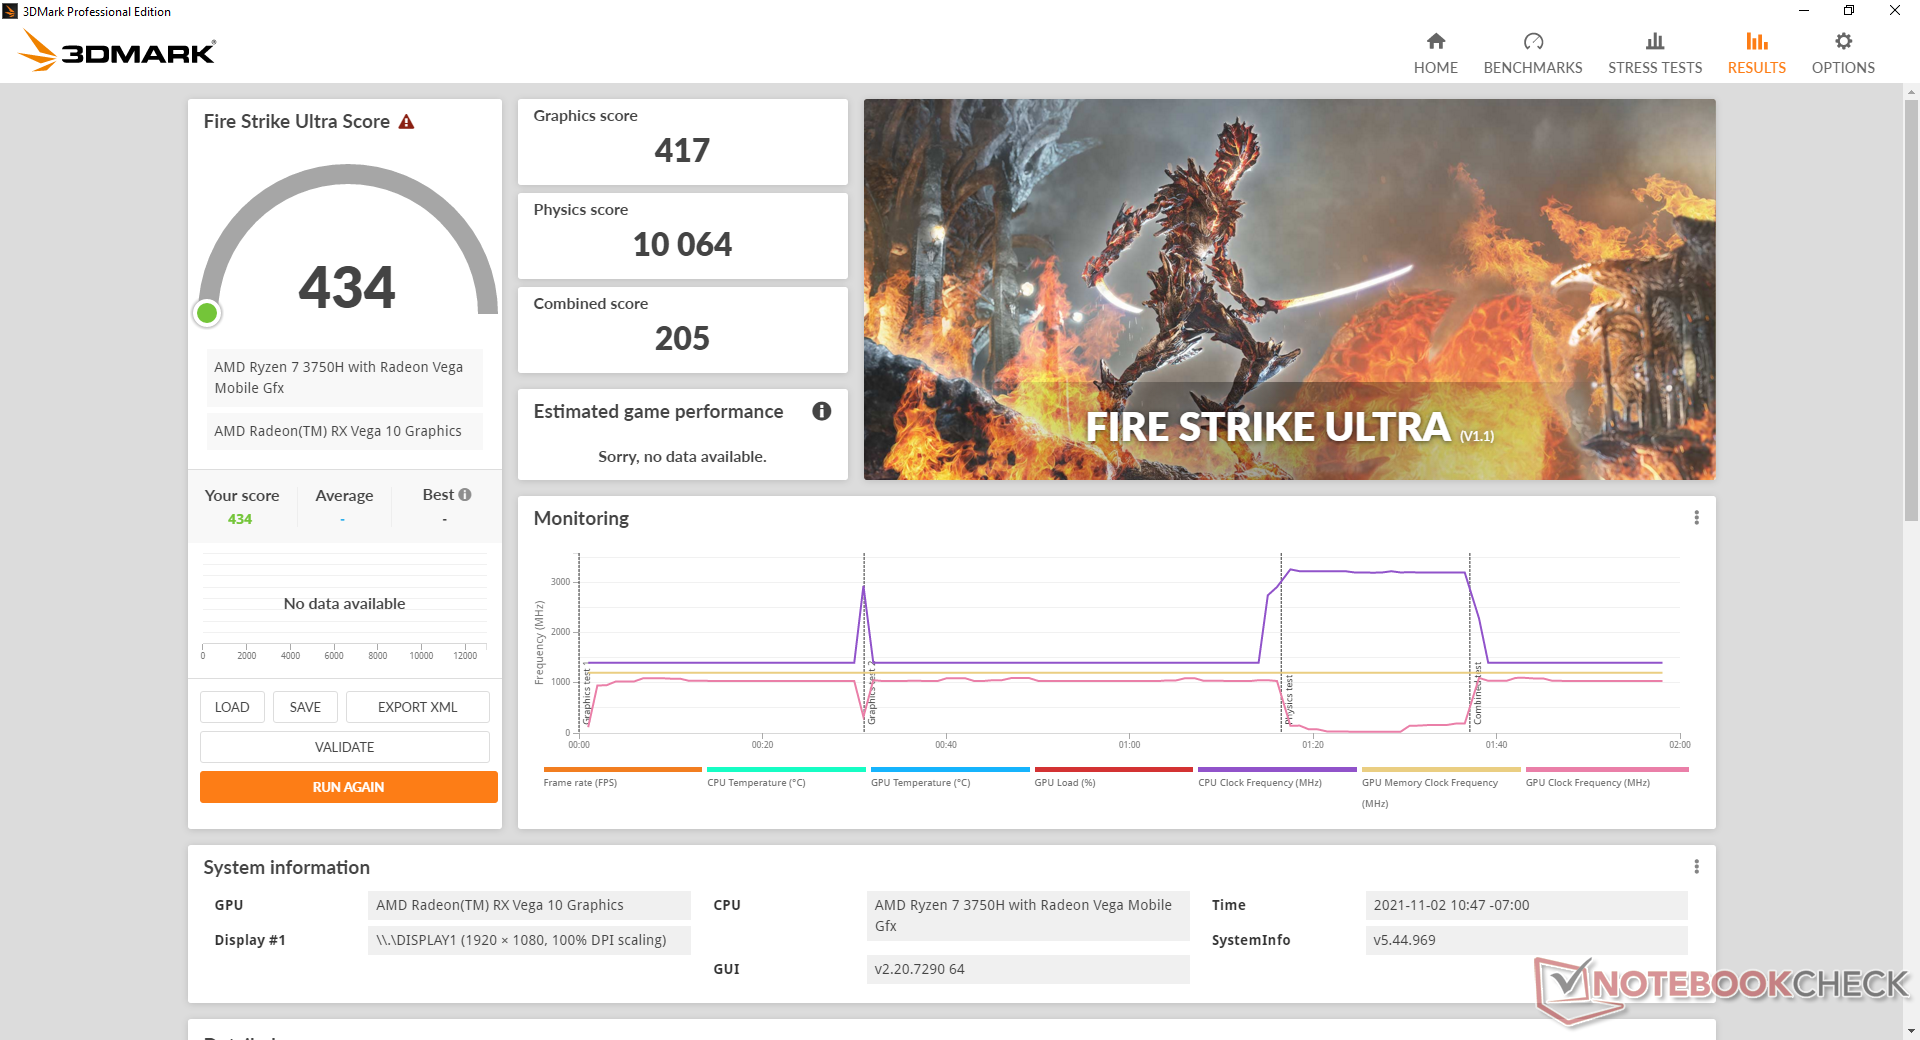
GPU-prestanda
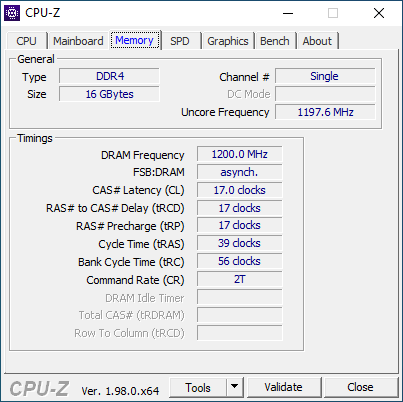
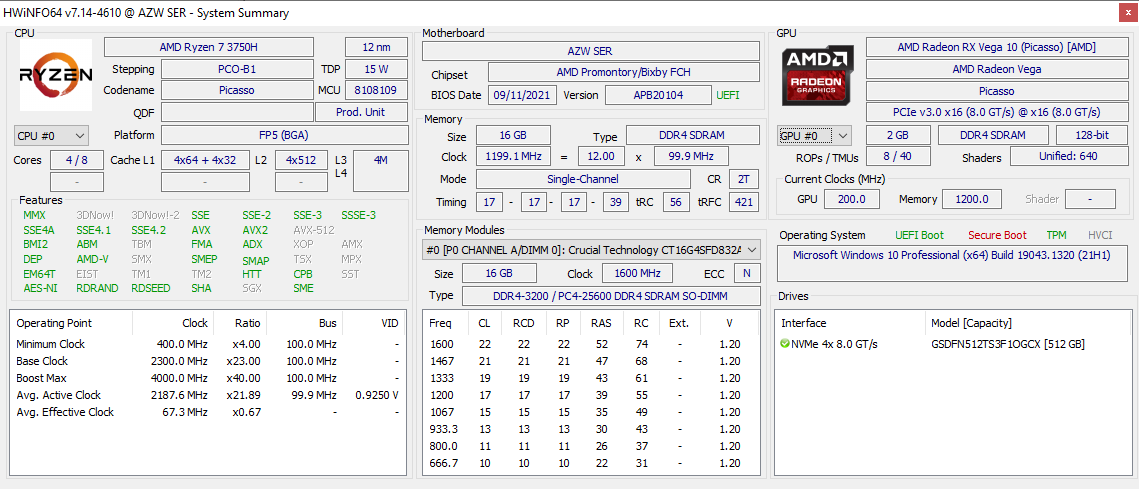
Grafikprestanda är mest lik den som liknar Iris Plus Graphics 655. Medan vår Radeon RX Vega 10 är en hygglig uppgradering jämfört med UHD Graphics 620är den fortfarande betydligt långsammare än den senaste Iris Xe NUC-alternativ från Intel. Den totala prestandan är något långsammare än den genomsnittliga RX Vega 10 i vår databas eftersom vår SER3-testenhet endast levereras med RAM-minne med en kanal. Användare kan pressa ut mer prestanda ur GPU:n om den konfigureras med dubbelkanals RAM-minne.
| 3DMark Performance rating - Percent | |
| VAIO SX14 VJS144X0111K | |
| Asus Zenbook 14X UX5400E -1! | |
| Huawei MateBook 16 R7 5800H | |
| Lenovo Yoga 6 13ALC6 | |
| Dell Latitude 14 5411-WJ40N | |
| Intel NUC11TNKi5 | |
| Genomsnitt AMD Radeon RX Vega 10 | |
| Intel NUC8i7BE | |
| Beelink SER3 | |
| GMK NucBox 2 | |
| Zotac ZBox MI643 | |
| Beelink SEi10 | |
| 3DMark | |
| 1920x1080 Fire Strike Graphics | |
| VAIO SX14 VJS144X0111K | |
| Asus Zenbook 14X UX5400E | |
| Dell Latitude 14 5411-WJ40N | |
| Huawei MateBook 16 R7 5800H | |
| Lenovo Yoga 6 13ALC6 | |
| Intel NUC11TNKi5 | |
| Intel NUC8i7BE | |
| Genomsnitt AMD Radeon RX Vega 10 (1567 - 2999, n=17) | |
| Beelink SER3 | |
| GMK NucBox 2 | |
| Zotac ZBox MI643 | |
| Beelink SEi10 | |
| 2560x1440 Time Spy Graphics | |
| VAIO SX14 VJS144X0111K | |
| Asus Zenbook 14X UX5400E | |
| Huawei MateBook 16 R7 5800H | |
| Dell Latitude 14 5411-WJ40N | |
| Lenovo Yoga 6 13ALC6 | |
| Intel NUC11TNKi5 | |
| Genomsnitt AMD Radeon RX Vega 10 (578 - 852, n=7) | |
| Intel NUC8i7BE | |
| Beelink SER3 | |
| GMK NucBox 2 | |
| Zotac ZBox MI643 | |
| Beelink SEi10 | |
| 2560x1440 Time Spy Score | |
| VAIO SX14 VJS144X0111K | |
| Asus Zenbook 14X UX5400E | |
| Huawei MateBook 16 R7 5800H | |
| Dell Latitude 14 5411-WJ40N | |
| Lenovo Yoga 6 13ALC6 | |
| Intel NUC11TNKi5 | |
| Genomsnitt AMD Radeon RX Vega 10 (647 - 955, n=8) | |
| Intel NUC8i7BE | |
| Beelink SER3 | |
| GMK NucBox 2 | |
| Zotac ZBox MI643 | |
| Beelink SEi10 | |
| 3DMark 11 - 1280x720 Performance GPU | |
| VAIO SX14 VJS144X0111K | |
| Huawei MateBook 16 R7 5800H | |
| Lenovo Yoga 6 13ALC6 | |
| Intel NUC11TNKi5 | |
| Dell Latitude 14 5411-WJ40N | |
| Genomsnitt AMD Radeon RX Vega 10 (2688 - 4165, n=17) | |
| Beelink SER3 | |
| Intel NUC8i7BE | |
| GMK NucBox 2 | |
| Zotac ZBox MI643 | |
| Beelink SEi10 | |
| 3DMark 11 Performance | 3270 poäng | |
| 3DMark Cloud Gate Standard Score | 11409 poäng | |
| 3DMark Fire Strike Score | 1790 poäng | |
| 3DMark Time Spy Score | 690 poäng | |
Hjälp | ||
| Final Fantasy XV Benchmark | |
| 1280x720 Lite Quality | |
| MSI Alpha 15 A3DDK-034 | |
| Dell Inspiron 15 5518-2X3JR | |
| VAIO SX14 VJS144X0111K | |
| Dell Latitude 14 5411-WJ40N | |
| Huawei MateBook 16 R7 5800H | |
| Lenovo Yoga 6 13ALC6 | |
| Intel NUC11TNKi5 | |
| Beelink SER3 | |
| GMK NucBox 2 | |
| Genomsnitt AMD Radeon RX Vega 10 (16.1 - 19, n=3) | |
| Intel NUC8i7BE | |
| 1920x1080 Standard Quality | |
| MSI Alpha 15 A3DDK-034 | |
| Dell Inspiron 15 5518-2X3JR | |
| VAIO SX14 VJS144X0111K | |
| Dell Latitude 14 5411-WJ40N | |
| Huawei MateBook 16 R7 5800H | |
| Lenovo Yoga 6 13ALC6 | |
| Intel NUC11TNKi5 | |
| Beelink SER3 | |
| GMK NucBox 2 | |
| Genomsnitt AMD Radeon RX Vega 10 (8.1 - 9.98, n=3) | |
| 1920x1080 High Quality | |
| MSI Alpha 15 A3DDK-034 | |
| VAIO SX14 VJS144X0111K | |
| Dell Inspiron 15 5518-2X3JR | |
| Huawei MateBook 16 R7 5800H | |
| Lenovo Yoga 6 13ALC6 | |
| Intel NUC11TNKi5 | |
| Beelink SER3 | |
| Genomsnitt AMD Radeon RX Vega 10 (n=1) | |
| GMK NucBox 2 | |
| Strange Brigade | |
| 1280x720 lowest AF:1 | |
| Dell Inspiron 15 5518-2X3JR | |
| Huawei MateBook 16 R7 5800H | |
| Lenovo Yoga 6 13ALC6 | |
| Genomsnitt AMD Radeon RX Vega 10 (37.9 - 48.9, n=2) | |
| Beelink SER3 | |
| 1920x1080 medium AA:medium AF:4 | |
| Dell Inspiron 15 5518-2X3JR | |
| Huawei MateBook 16 R7 5800H | |
| Lenovo Yoga 6 13ALC6 | |
| Genomsnitt AMD Radeon RX Vega 10 (15.1 - 19.6, n=2) | |
| Beelink SER3 | |
| 1920x1080 high AA:high AF:8 | |
| Asus Zenbook 14X UX5400E | |
| Dell Inspiron 15 5518-2X3JR | |
| Huawei MateBook 16 R7 5800H | |
| Lenovo Yoga 6 13ALC6 | |
| Genomsnitt AMD Radeon RX Vega 10 (12.6 - 16.2, n=2) | |
| Beelink SER3 | |
| 1920x1080 ultra AA:ultra AF:16 | |
| Asus Zenbook 14X UX5400E | |
| Dell Inspiron 15 5518-2X3JR | |
| Huawei MateBook 16 R7 5800H | |
| Lenovo Yoga 6 13ALC6 | |
| Genomsnitt AMD Radeon RX Vega 10 (10.9 - 13.8, n=2) | |
| Beelink SER3 | |
| X-Plane 11.11 | |
| 1280x720 low (fps_test=1) | |
| Dell Latitude 14 5411-WJ40N | |
| Dell Inspiron 15 5518-2X3JR | |
| Asus Zenbook 14X UX5400E | |
| Huawei MateBook 16 R7 5800H | |
| VAIO SX14 VJS144X0111K | |
| Lenovo Yoga 6 13ALC6 | |
| Intel NUC11TNKi5 | |
| Intel NUC8i7BE | |
| GMK NucBox 2 | |
| Genomsnitt AMD Radeon RX Vega 10 (23 - 28.4, n=7) | |
| Beelink SER3 | |
| Zotac ZBox MI643 | |
| 1920x1080 med (fps_test=2) | |
| Dell Latitude 14 5411-WJ40N | |
| Dell Inspiron 15 5518-2X3JR | |
| Asus Zenbook 14X UX5400E | |
| Huawei MateBook 16 R7 5800H | |
| VAIO SX14 VJS144X0111K | |
| Lenovo Yoga 6 13ALC6 | |
| Intel NUC11TNKi5 | |
| Intel NUC8i7BE | |
| Genomsnitt AMD Radeon RX Vega 10 (15.6 - 22, n=7) | |
| Beelink SER3 | |
| GMK NucBox 2 | |
| Zotac ZBox MI643 | |
| 1920x1080 high (fps_test=3) | |
| Dell Latitude 14 5411-WJ40N | |
| Dell Inspiron 15 5518-2X3JR | |
| Asus Zenbook 14X UX5400E | |
| Huawei MateBook 16 R7 5800H | |
| VAIO SX14 VJS144X0111K | |
| Intel NUC11TNKi5 | |
| Lenovo Yoga 6 13ALC6 | |
| Intel NUC8i7BE | |
| Beelink SER3 | |
| Genomsnitt AMD Radeon RX Vega 10 (14.2 - 19.7, n=7) | |
| GMK NucBox 2 | |
| Zotac ZBox MI643 | |
Witcher 3 FPS Chart
| låg | med. | hög | ultra | |
|---|---|---|---|---|
| GTA V (2015) | 51.8 | 46.3 | 13.2 | 6.76 |
| The Witcher 3 (2015) | 35.7 | 22.9 | 12.2 | 8 |
| Dota 2 Reborn (2015) | 67.4 | 52 | 30.1 | 28.3 |
| Final Fantasy XV Benchmark (2018) | 19 | 9.98 | 6.8 | |
| X-Plane 11.11 (2018) | 23.8 | 18.5 | 16.7 | |
| Far Cry 5 (2018) | 23 | 12 | 11 | 10 |
| Strange Brigade (2018) | 37.9 | 15.1 | 12.6 | 10.9 |
Utsläpp
Systembrus
Fläkten pulserar ofta när du kör typiska HTPC-belastningar som surfning eller videostreaming. Pulseringen är inte extrem med endast 29,4 dB(A) mot en tyst bakgrund på 23,4 dB(A), men den är märkbar i en tyst kontorsmiljö. Den är tack och lov inte tillräckligt högljudd för att vara störande vid högre musik- eller videouppspelning.
Om du kör högre belastningar som spel kan fläktljudet uppgå till 37-43 dB(A), vilket inte skiljer sig från många Ultrabook-drivna datorer i U-serien eller den äldreIntel NUC8i7BE.
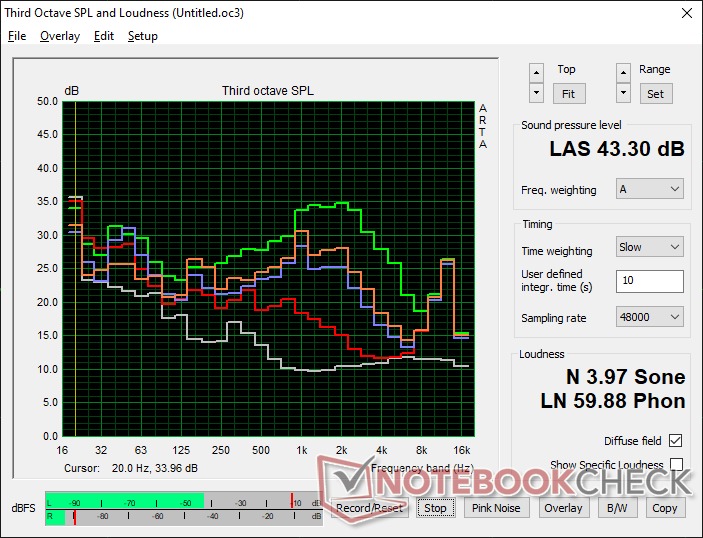
Ljudnivå
| Låg belastning |
| 23.4 / 23.4 / 29.4 dB(A) |
| Hög belastning |
| 35.2 / 43.3 dB(A) |
 | ||
30 dB tyst 40 dB(A) hörbar 50 dB(A) högt ljud |
||
min: | ||
| Beelink SER3 Vega 10, R7 3750H, GSemi AZW GSDFN512TS3F1OGCX | Beelink SEi10 UHD Graphics G1 (Ice Lake 32 EU), i3-1005G1, Silicon Motion AZW 256G M.2280 NVMe 4X 200725 D | Intel NUC8i7BE Iris Plus Graphics 655, i7-8559U | GMK NucBox 2 Iris Plus Graphics 655, i5-8259U, Netac S930E8/256GPN | Zotac ZBox MI643 UHD Graphics 620, i5-10210U, Lexar NM610 1TB | Intel NUC11TNKi5 Iris Xe G7 80EUs, i5-1135G7, Transcend M.2 SSD 430S TS512GMTS430S | |
|---|---|---|---|---|---|---|
| Noise | -23% | -13% | 1% | -4% | -21% | |
| av / miljö * (dB) | 23.4 | 27.5 -18% | 28.7 -23% | 25.6 -9% | 26.1 -12% | 24.8 -6% |
| Idle Minimum * (dB) | 23.4 | 30.9 -32% | 28.7 -23% | 25.7 -10% | 27.5 -18% | 35.6 -52% |
| Idle Average * (dB) | 23.4 | 33.5 -43% | 29.3 -25% | 25.7 -10% | 27.5 -18% | 35.6 -52% |
| Idle Maximum * (dB) | 29.4 | 33.5 -14% | 31.8 -8% | 25.7 13% | 27.5 6% | 35.6 -21% |
| Load Average * (dB) | 35.2 | 38.5 -9% | 39 -11% | 35.3 -0% | 28.9 18% | 36.2 -3% |
| Witcher 3 ultra * (dB) | 37.2 | 39 -5% | 38 -2% | |||
| Load Maximum * (dB) | 43.3 | 51.6 -19% | 41.4 4% | 35.1 19% | 42 3% | 47.6 -10% |
* ... mindre är bättre
Temperatur
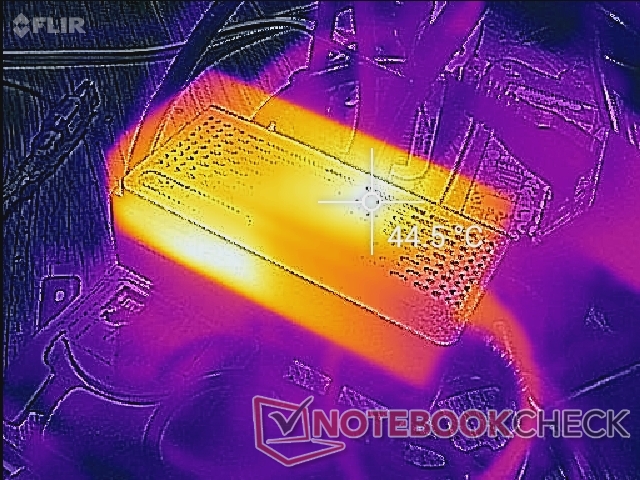
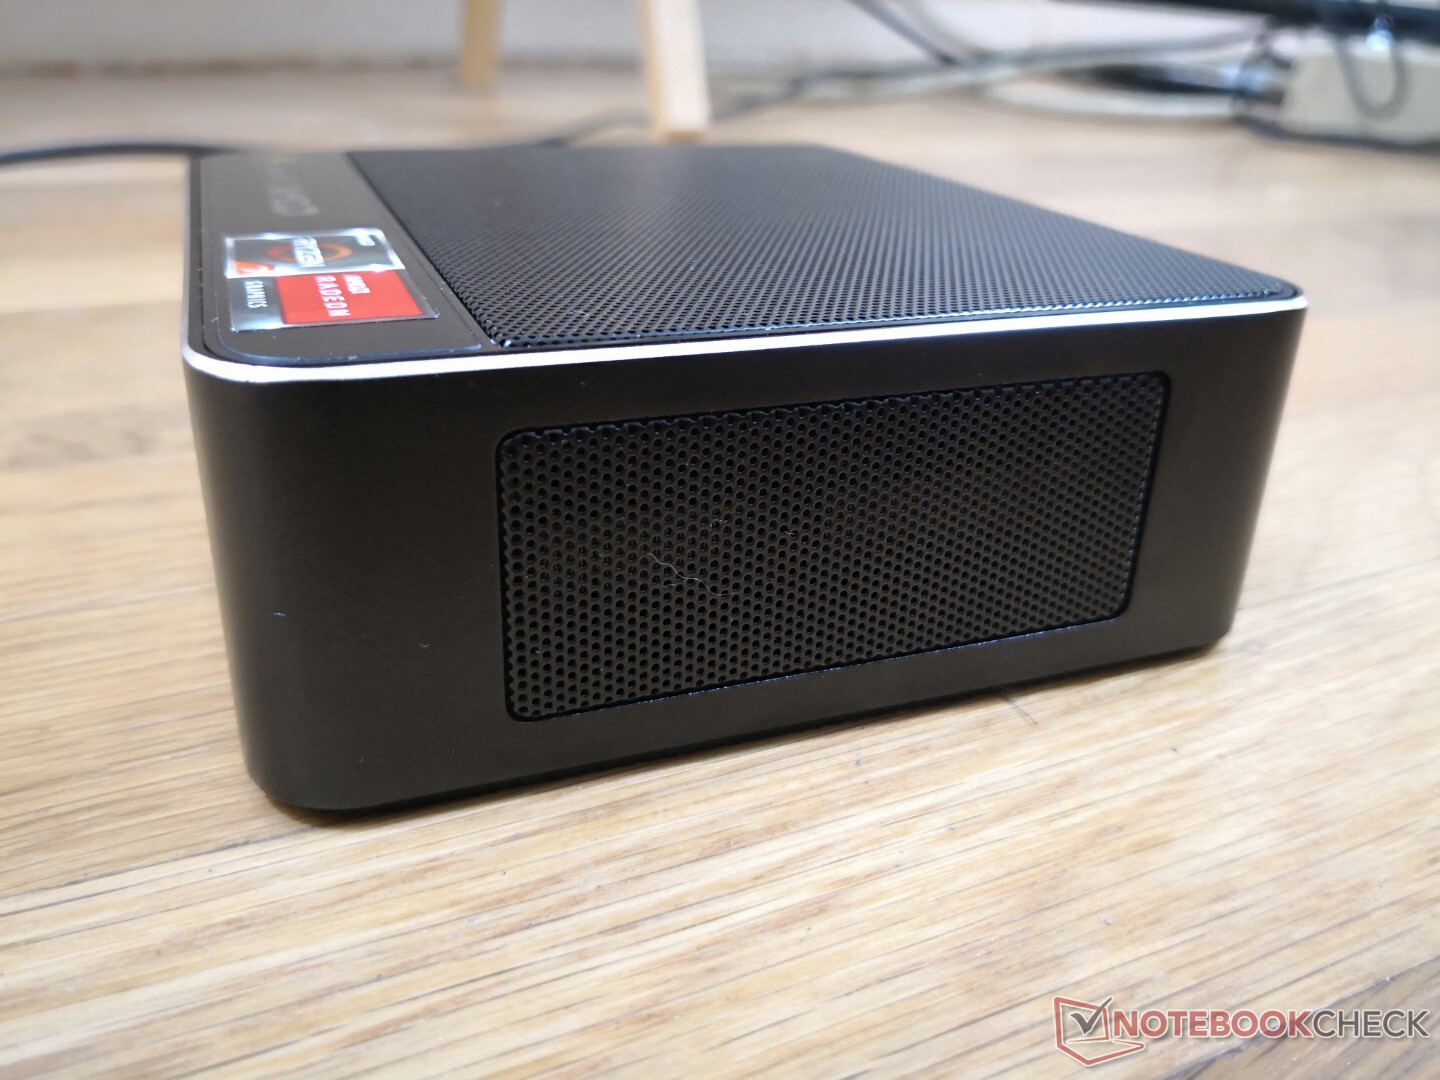
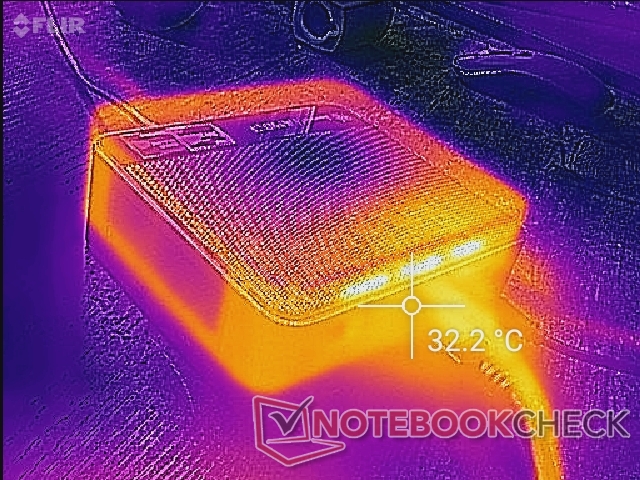
Yttemperaturer är inget problem för SER3. Varm luft kommer ut bakifrån medan kall luft kommer in uppifrån och därför rekommenderar vi inte att du staplar böcker eller papper på minidatorn
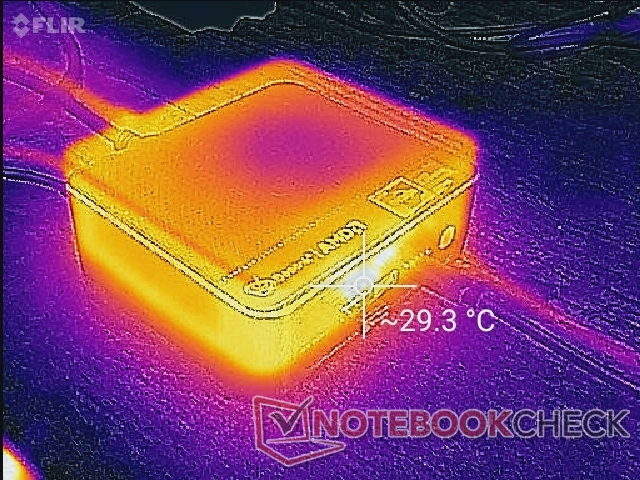
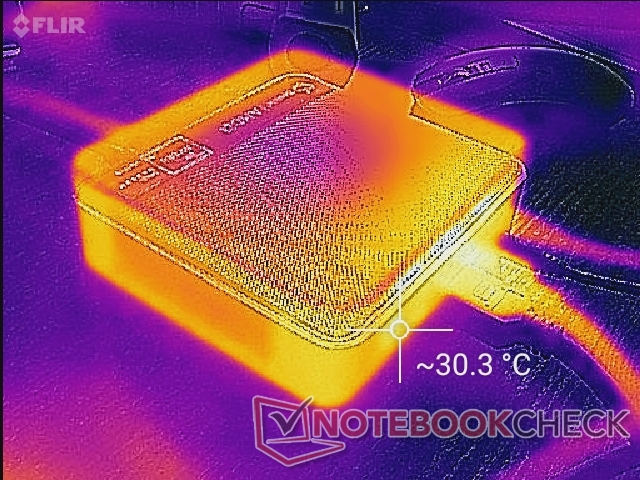
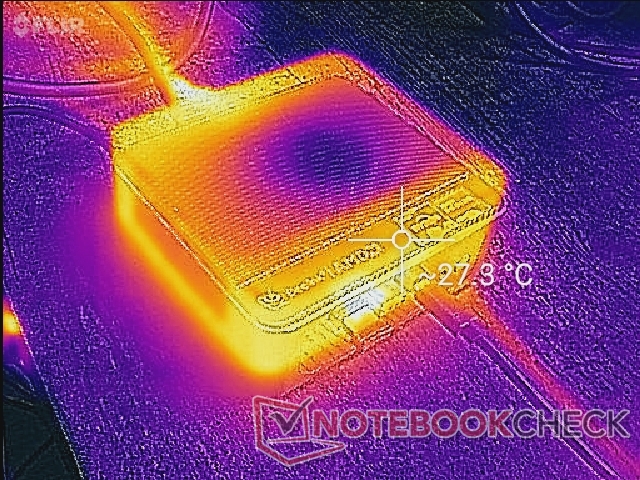
Växelströmsadaptern kan bli varmare än själva minidatorn vid hög belastning, vilket våra temperaturkartor visar.
Stresstest
När Prime95 körs ökar CPU-klockfrekvensen till 3,3 GHz under den första minuten tills kärnan når en temperatur på 78 C. Klockfrekvensen sjunker sedan till 3,0 GHz för att bibehålla en svalare kärntemperatur på 72 C.
Kärntemperaturen är relativt sval, endast 56 C vid körning Witcher 3 jämfört med 62 C på Intel NUC11TNKi5 Pro.
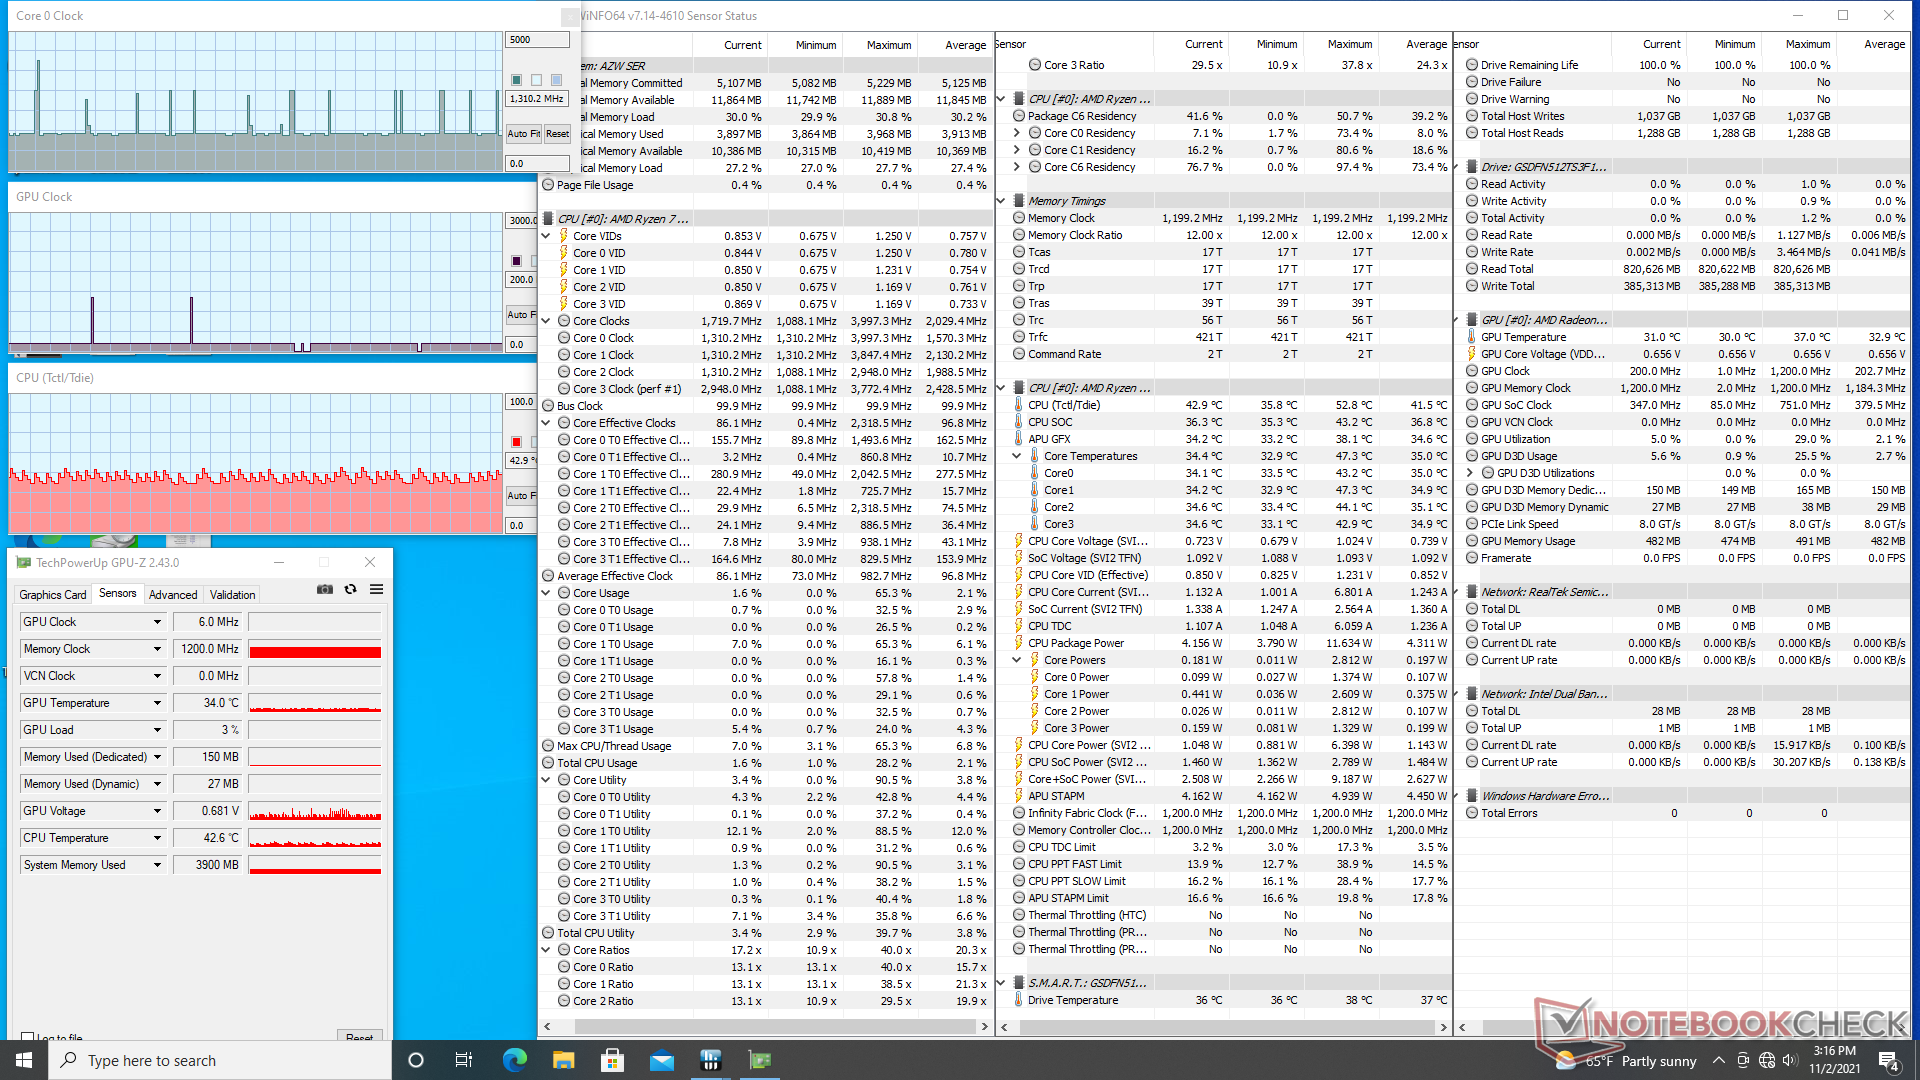
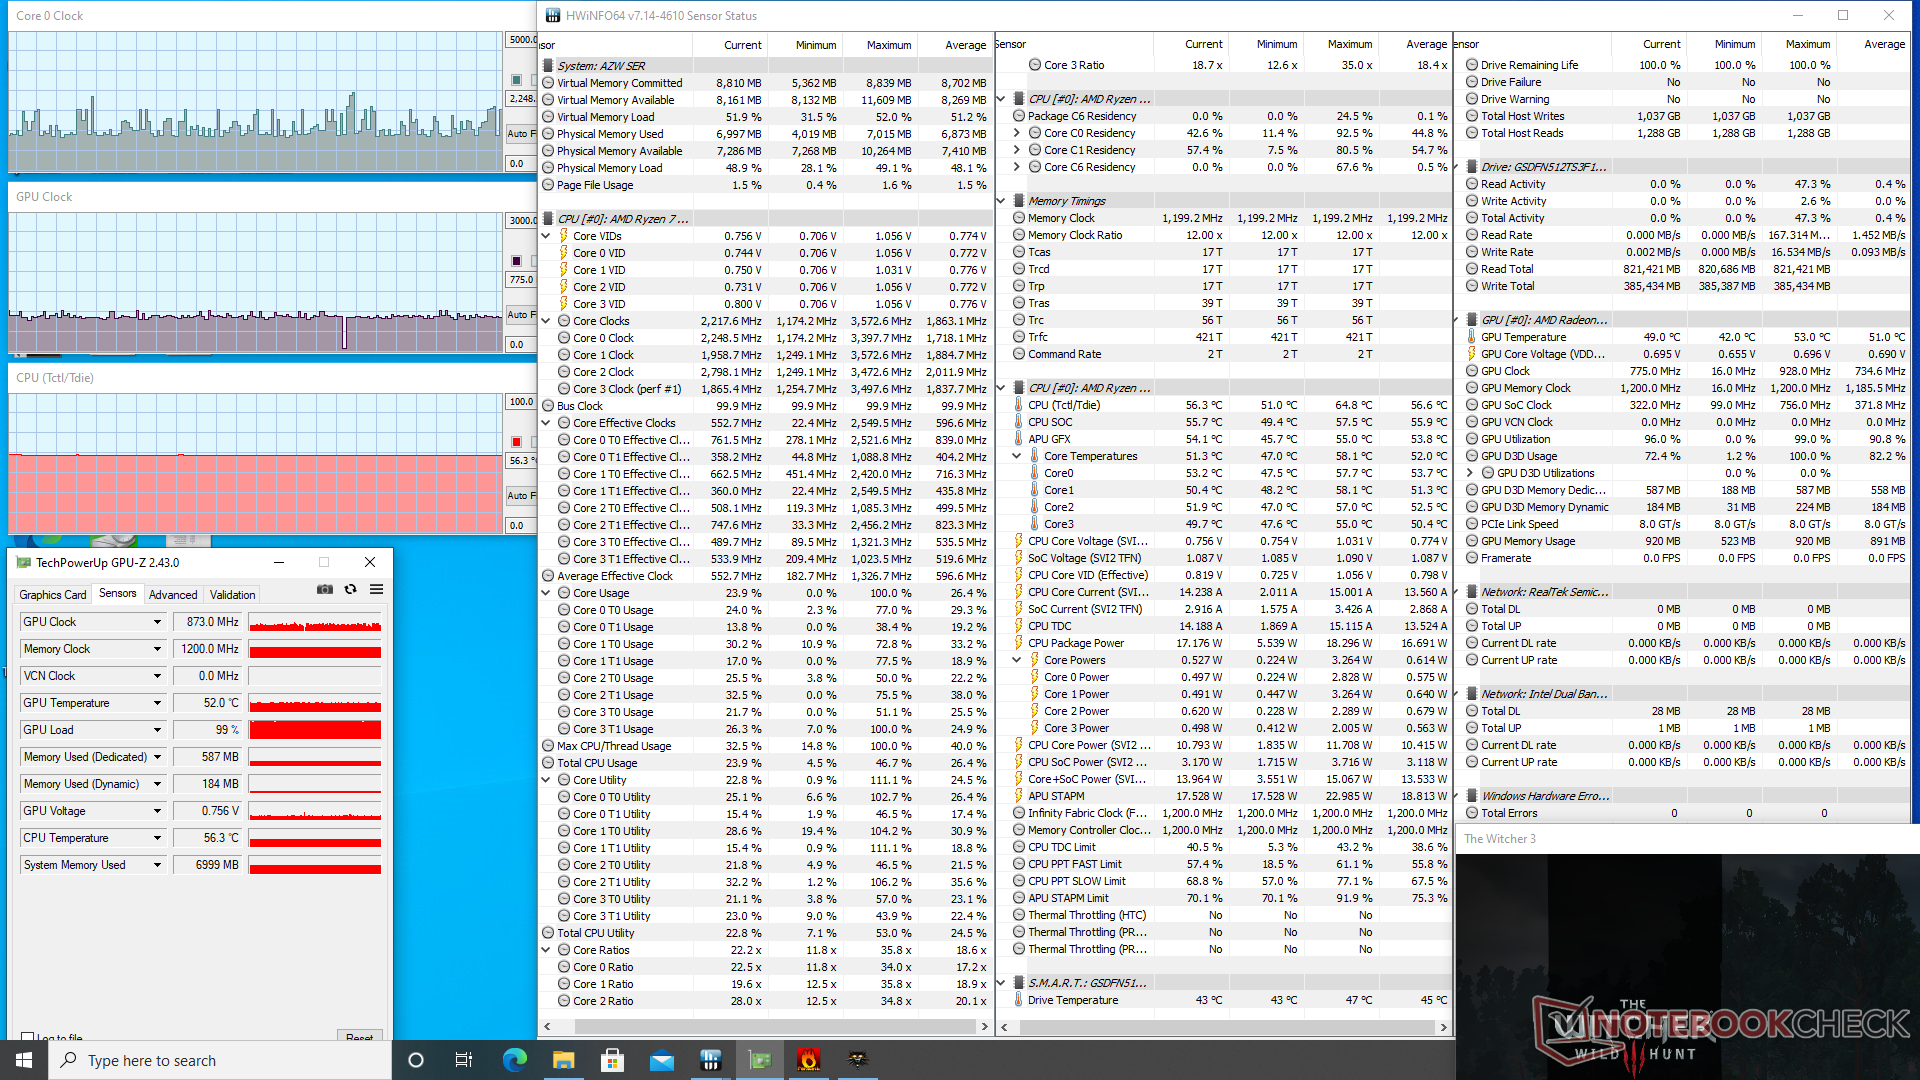
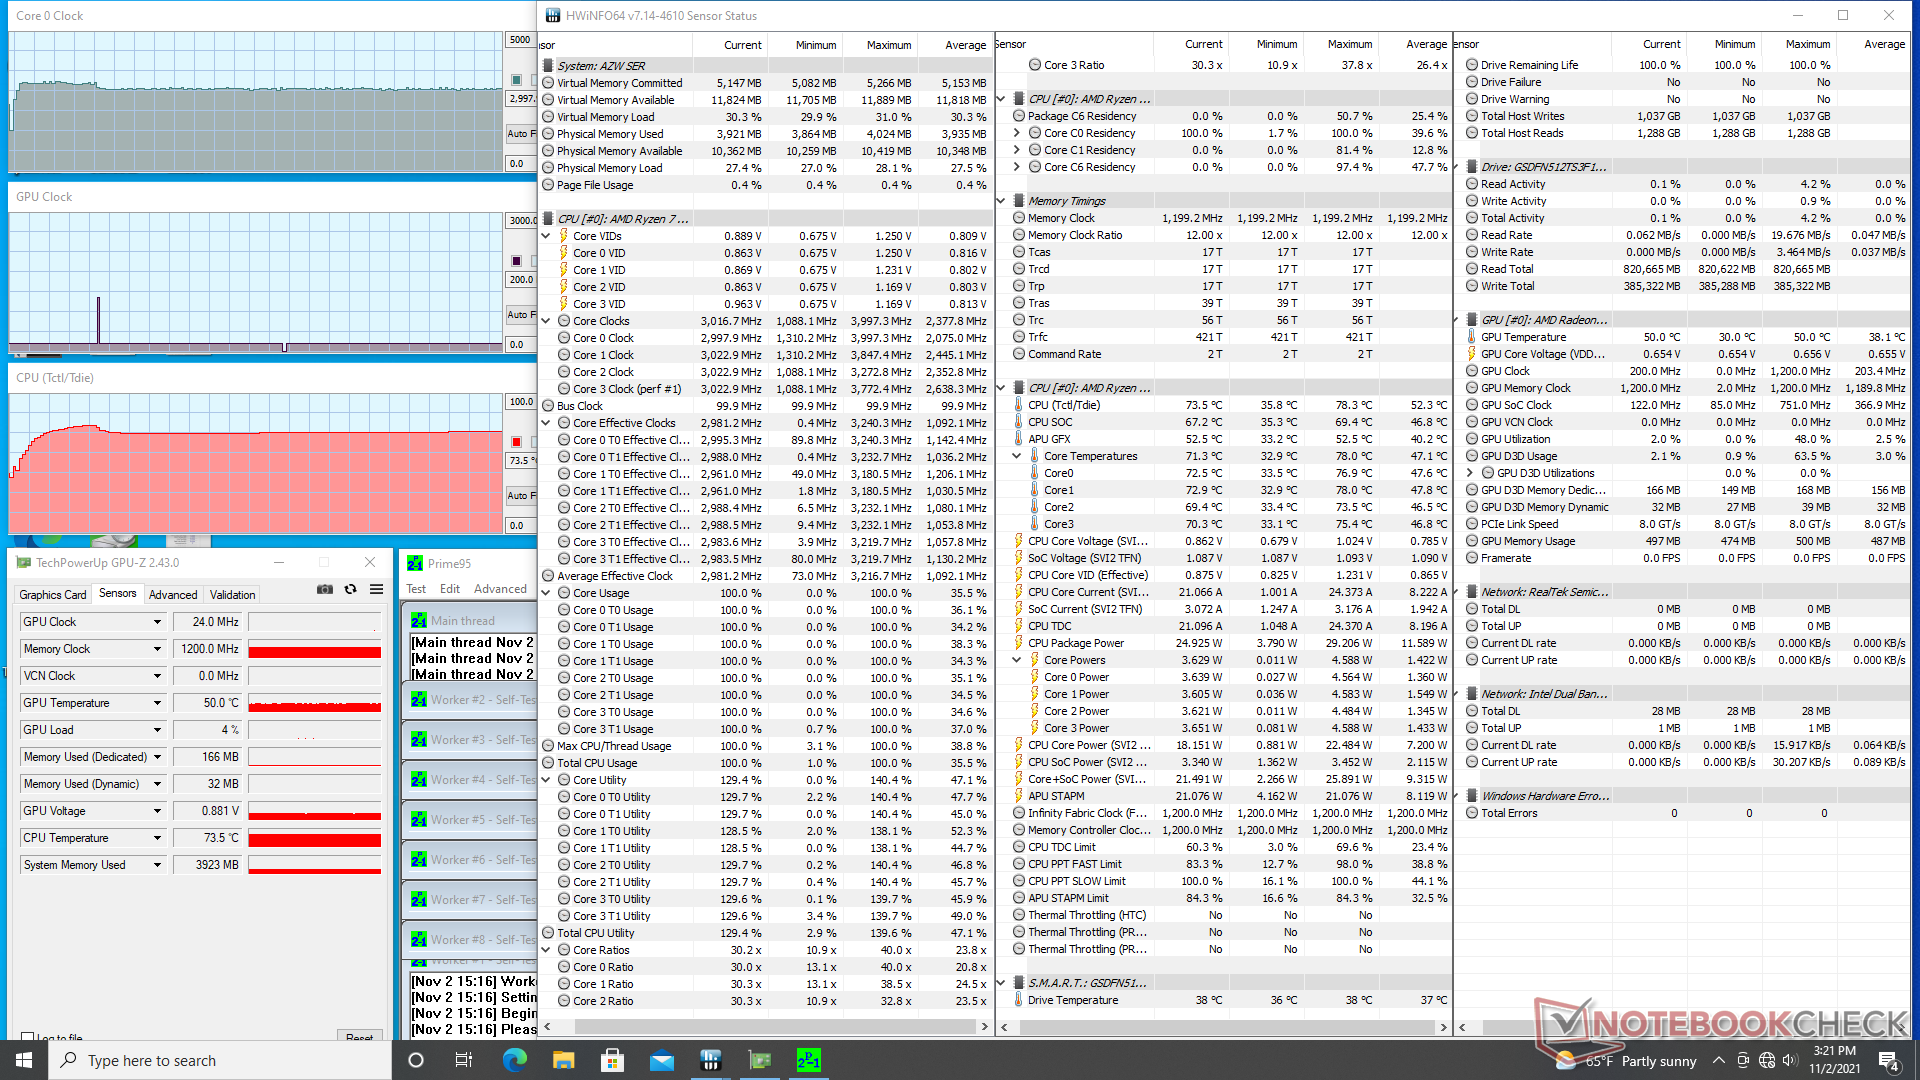
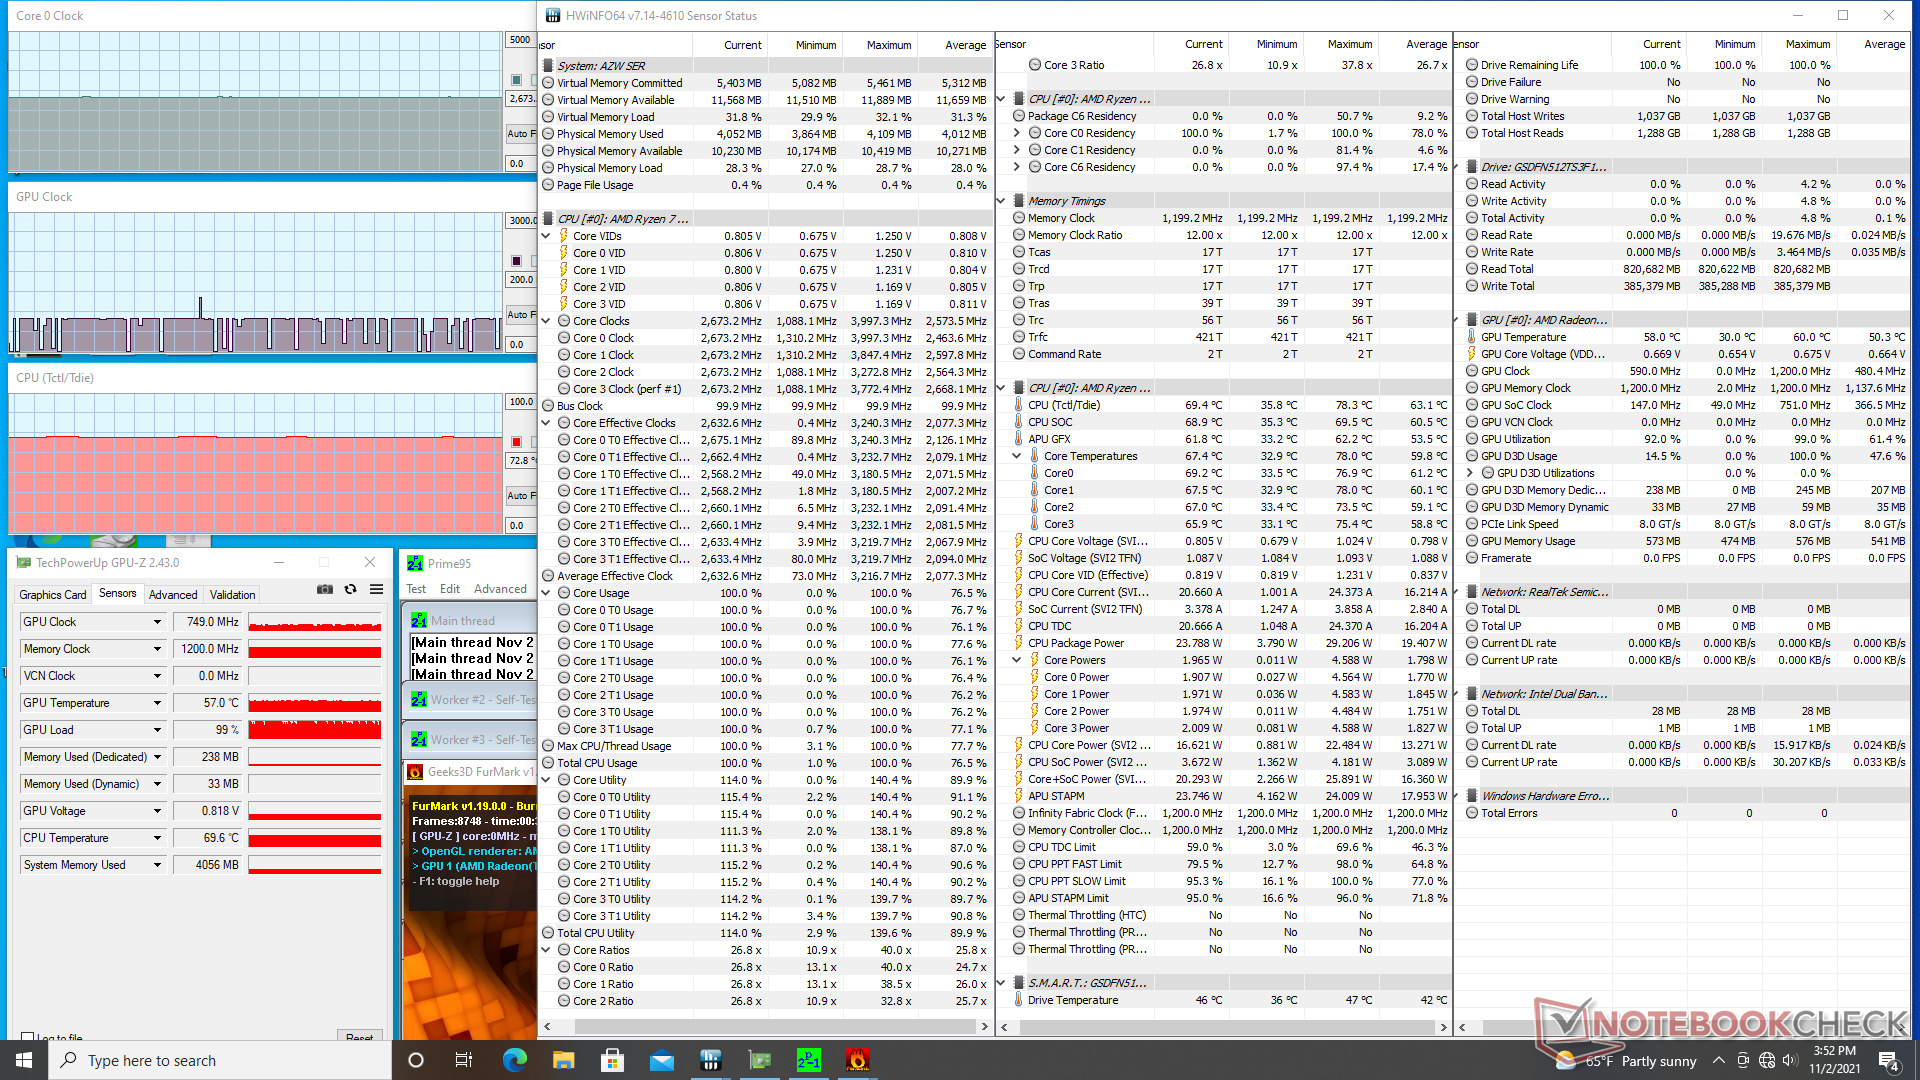
| CPU-klocka (GHz) | GPU-klocka (MHz) | GenomsnittligCPU-temperatur Tctl/Tdie (°C) | |
| Systemets tomgång | ---- | -- | |
| Prime95 Stress | 3.0 | ---- | 74 |
| Prime95 + FurMark Stress | 2.7 | 749 | 73 |
| Witcher 3 Stress | 0.3 - 0.8 | ~873 | 56 |
Energiförvaltning
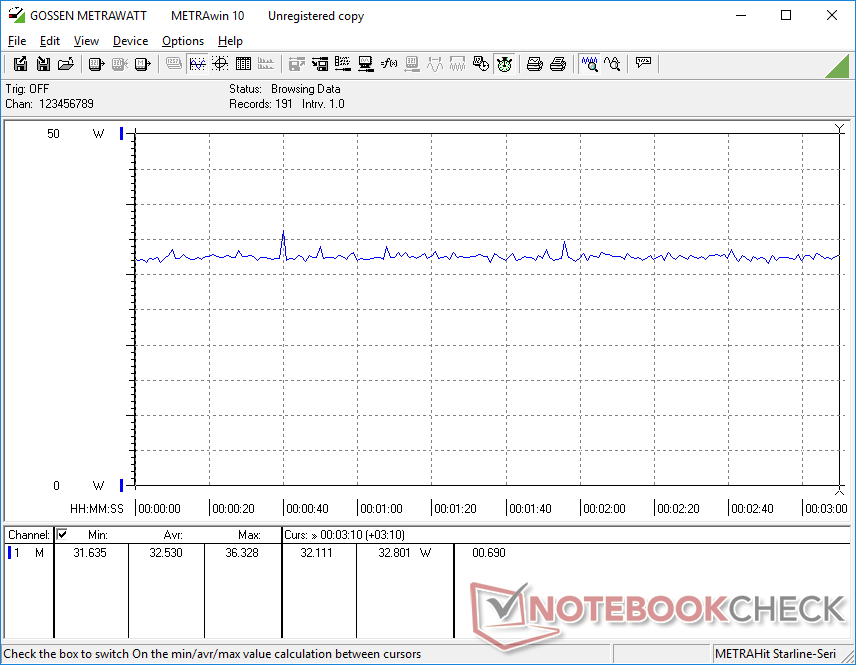
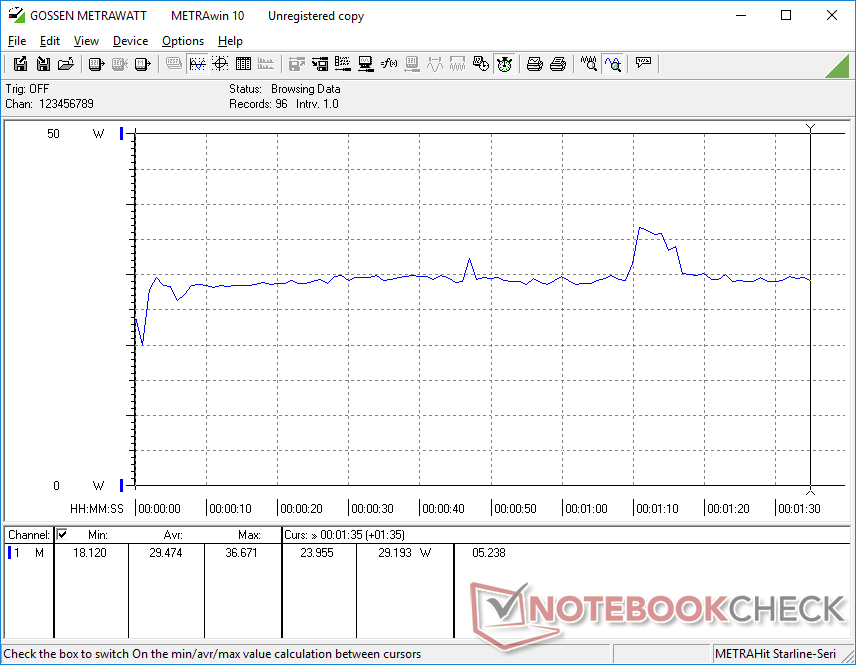
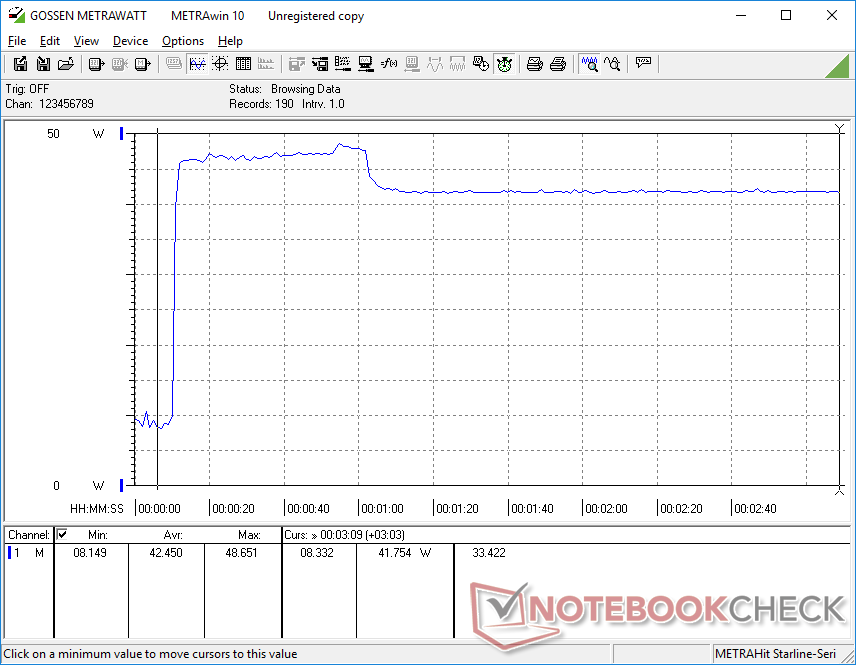
Effektförbrukning
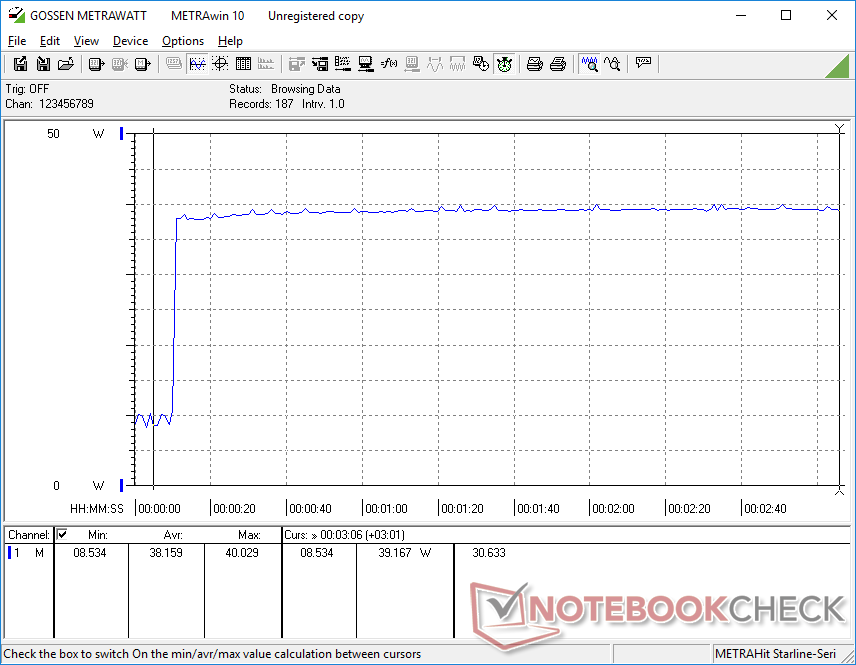
Strömförbrukningen vid tomgång på skrivbordet är något högre än för de flesta andra minidatorer som körs med Core U-seriens CPU:er eftersom vår SER3 använder en mer krävande H-seriens processor. Trots detta är strömförbrukningen vid högre belastning lägre än väntat, i genomsnitt bara 30-40 W
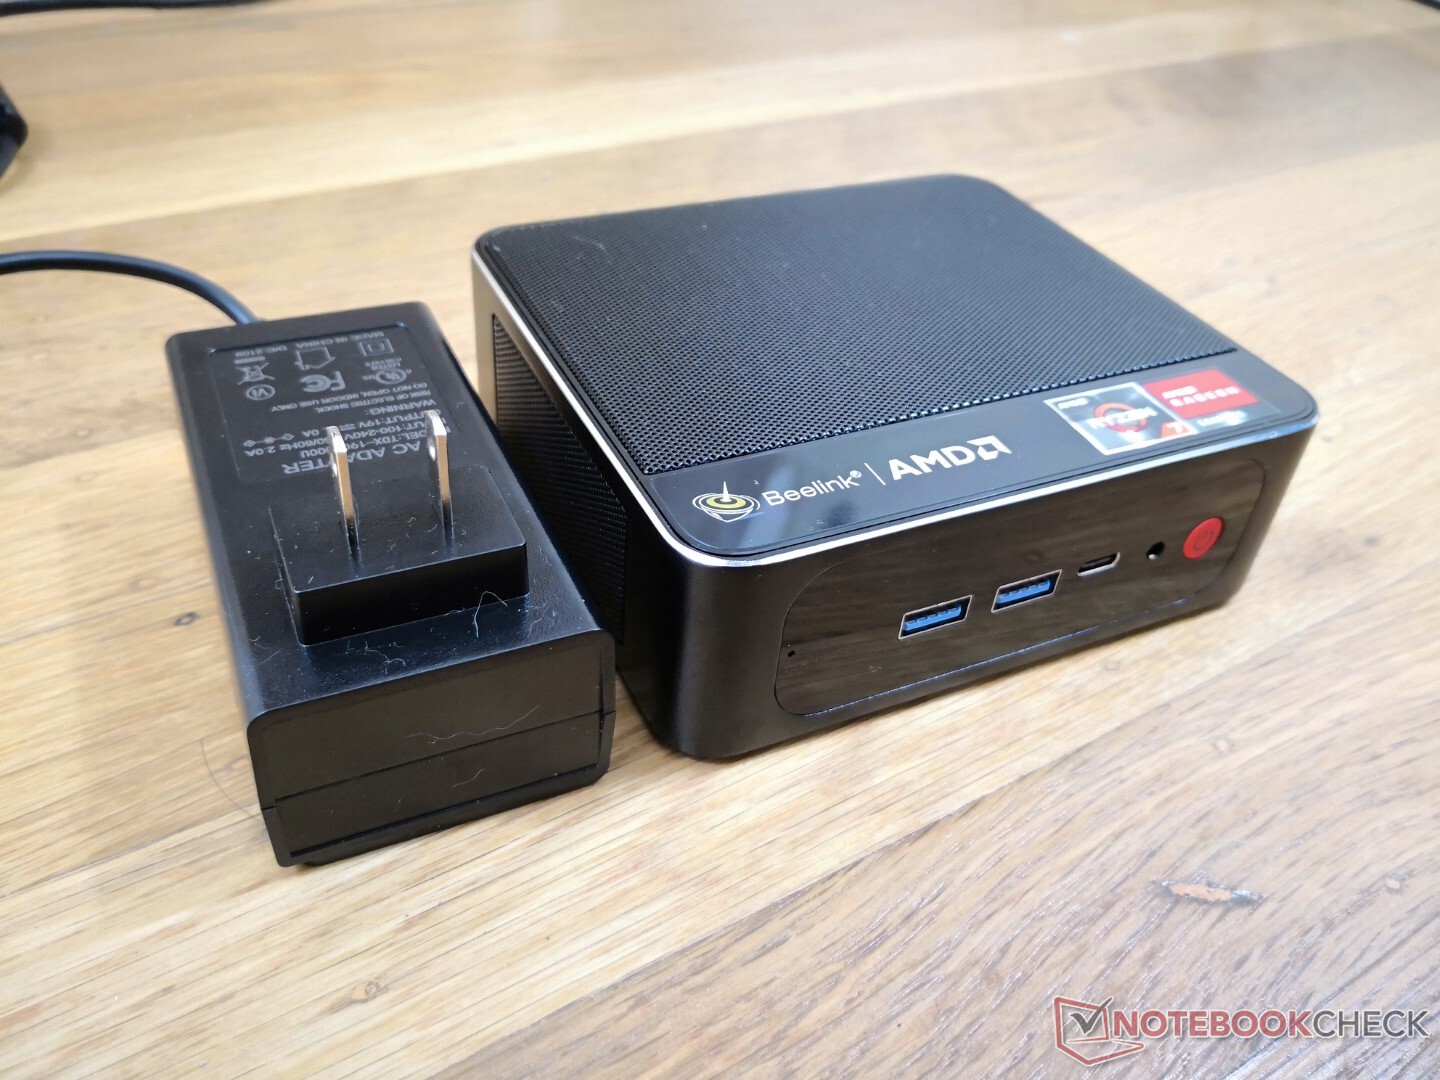
Vi kan registrera maximalt knappt 49 W från den medelstora (~10 x 5 x 6 cm inklusive prinsen) 57 W AC-adaptern när CPU-utnyttjandet är 100 procent. Denna hastighet sjunker efter ungefär en minut på grund av termiska begränsningar.
| Av/Standby | |
| Låg belastning | |
| Hög belastning |
|
Förklaring:
min: | |
| Beelink SER3 R7 3750H, Vega 10, GSemi AZW GSDFN512TS3F1OGCX, , x, | Beelink SEi10 i3-1005G1, UHD Graphics G1 (Ice Lake 32 EU), Silicon Motion AZW 256G M.2280 NVMe 4X 200725 D, , x, | Intel NUC8i7BE i7-8559U, Iris Plus Graphics 655, , , x, | GMK NucBox 2 i5-8259U, Iris Plus Graphics 655, Netac S930E8/256GPN, , x, | Zotac ZBox MI643 i5-10210U, UHD Graphics 620, Lexar NM610 1TB, , x, | Intel NUC11TNKi5 i5-1135G7, Iris Xe G7 80EUs, Transcend M.2 SSD 430S TS512GMTS430S, , x, | |
|---|---|---|---|---|---|---|
| Power Consumption | 17% | -8% | 0% | -10% | -43% | |
| Idle Minimum * (Watt) | 7 | 6.3 10% | 2.7 61% | 6.1 13% | 7.5 -7% | 11.5 -64% |
| Idle Average * (Watt) | 9.1 | 6.6 27% | 3.1 66% | 6.8 25% | 9.2 -1% | 12.4 -36% |
| Idle Maximum * (Watt) | 9.7 | 6.7 31% | 6.3 35% | 7.3 25% | 9.6 1% | 12.9 -33% |
| Load Average * (Watt) | 29.5 | 25.9 12% | 59.7 -102% | 46.3 -57% | 34.4 -17% | 40.7 -38% |
| Witcher 3 ultra * (Watt) | 32.5 | 47.2 -45% | 43.9 -35% | |||
| Load Maximum * (Watt) | 48.7 | 46.7 4% | 78 -60% | 50.7 -4% | 60.6 -24% | 73.5 -51% |
* ... mindre är bättre
Power Consumption Witcher 3 / Stresstest
För
Emot
Dom
För mindre än 500 USD får användarna en HTPC-klar minidator med en prestandanivå som liknar den för Core i5-8259U i vissa Intel NUCs. Systemet är flera steg högre än andra billiga minidatorer med Atom- eller Celeron-CPU:er som t.ex Chuwi LarkBox eller GBox som är notoriskt långsamma även när de kör krävande program. Vi uppskattar att Beelink erbjuder SER3 som färdiga datorer komplett med RAM och lagring medan Intel NUCs nästan alltid säljs som barebone SKUs.
Beelink SER3 är en lättanvänd diskret HTPC med lättillgängliga uppgraderingsmöjligheter. Var beredd på lite fläktljud, särskilt när du kör mycket krävande program.
Köpare bör vara medvetna om att SER3 utelämnar en handfull extrafunktioner som sannolikt är avsedda att hålla kostnaderna nere. Det finns inget Kensington-lås, SD-läsare, IR-mottagare eller Thunderbolt-stöd medan DP-over-USB-C kan vara opålitligt. Fläkten pulserar ofta och växelströmsadaptern är både tjock och kort. Den medföljande NVMe-SSD:n är visserligen hyfsat snabb, men den tappar i prestanda när den stressas på grund av avsaknaden av en inbyggd värmespridare.
Pris och tillgänglighet
Beelink SER3 finns på på Amazon för 479 USD med 8 GB RAM och 256 GB SSD eller 559 USD med dubbelt så mycket RAM och lagringsutrymme.
No, or more than one (0) Rating for the given SpecsID 326081 found

