Beelink GTR6 Ryzen 9 6900HX minidator recension: Snabbare än de flesta Intel NUCs

Till skillnad från de mindre Beelink SEi- och SER-serierna som drivs av U-seriens processorer består GTR-serien av modeller som drivs av snabbare H-seriens processorer. GTR6 är den direkta efterföljaren till den äldre GTR5 med både en uppgraderad processor (Zen 3 Ryzen 9 5900HX till Zen 3+ Ryzen 9 6900HX) och en liten omkonstruktion av chassit. Våra benchmarks nedan kommer att visa att det är en av de snabbaste minidatorerna i Beelinks omfattande sortiment.
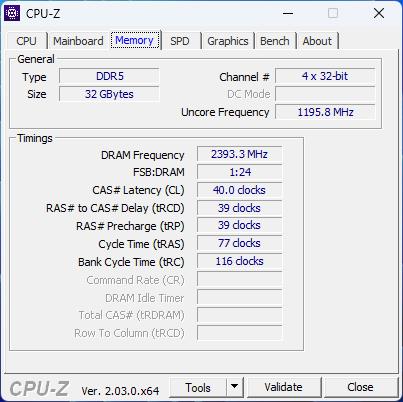
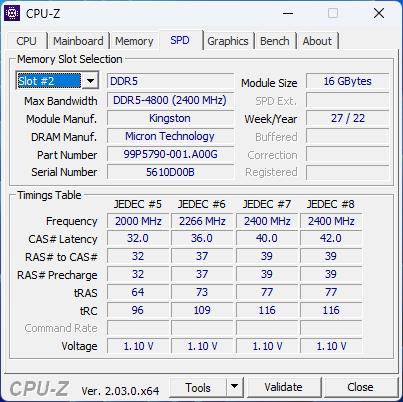
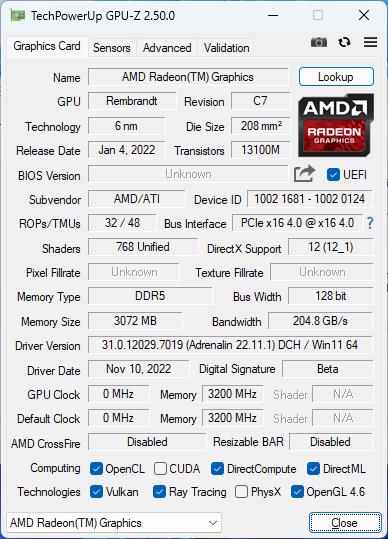
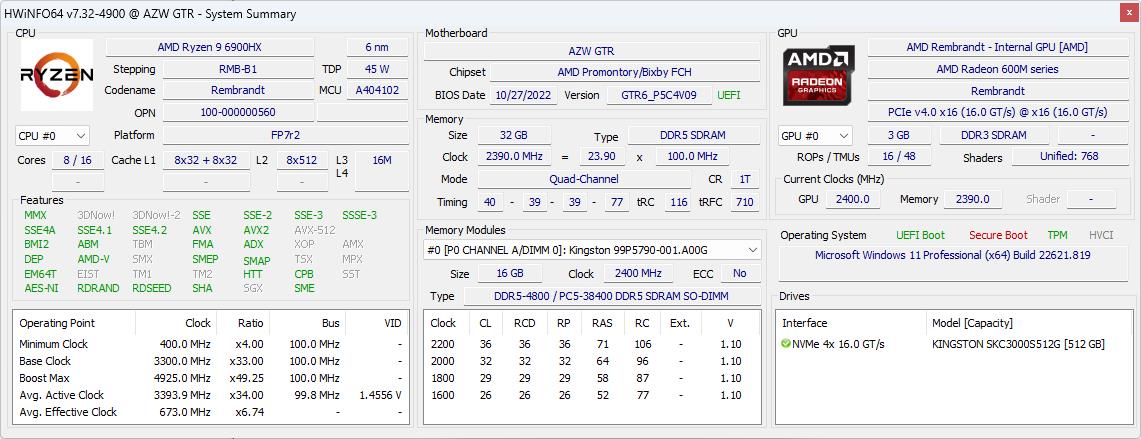
Vår enhet i recensionen är en fullt konfigurerad GTR6 komplett med 32 GB RAM och 512 GB NVMe SSD för cirka 750 USD. Alla alternativ kommer med samma Ryzen 9 6900HX CPU och integrerad Radeon 680M GPU. GTR6 konkurrerar direkt med Intel NUCs som drivs med integrerad grafik.
Fler recensioner från Beelink:
Potentiella konkurrenter i jämförelse
Gradering | Datum | Modell | Vikt | Höjd | Storlek | Upplösning | Pris |
|---|---|---|---|---|---|---|---|
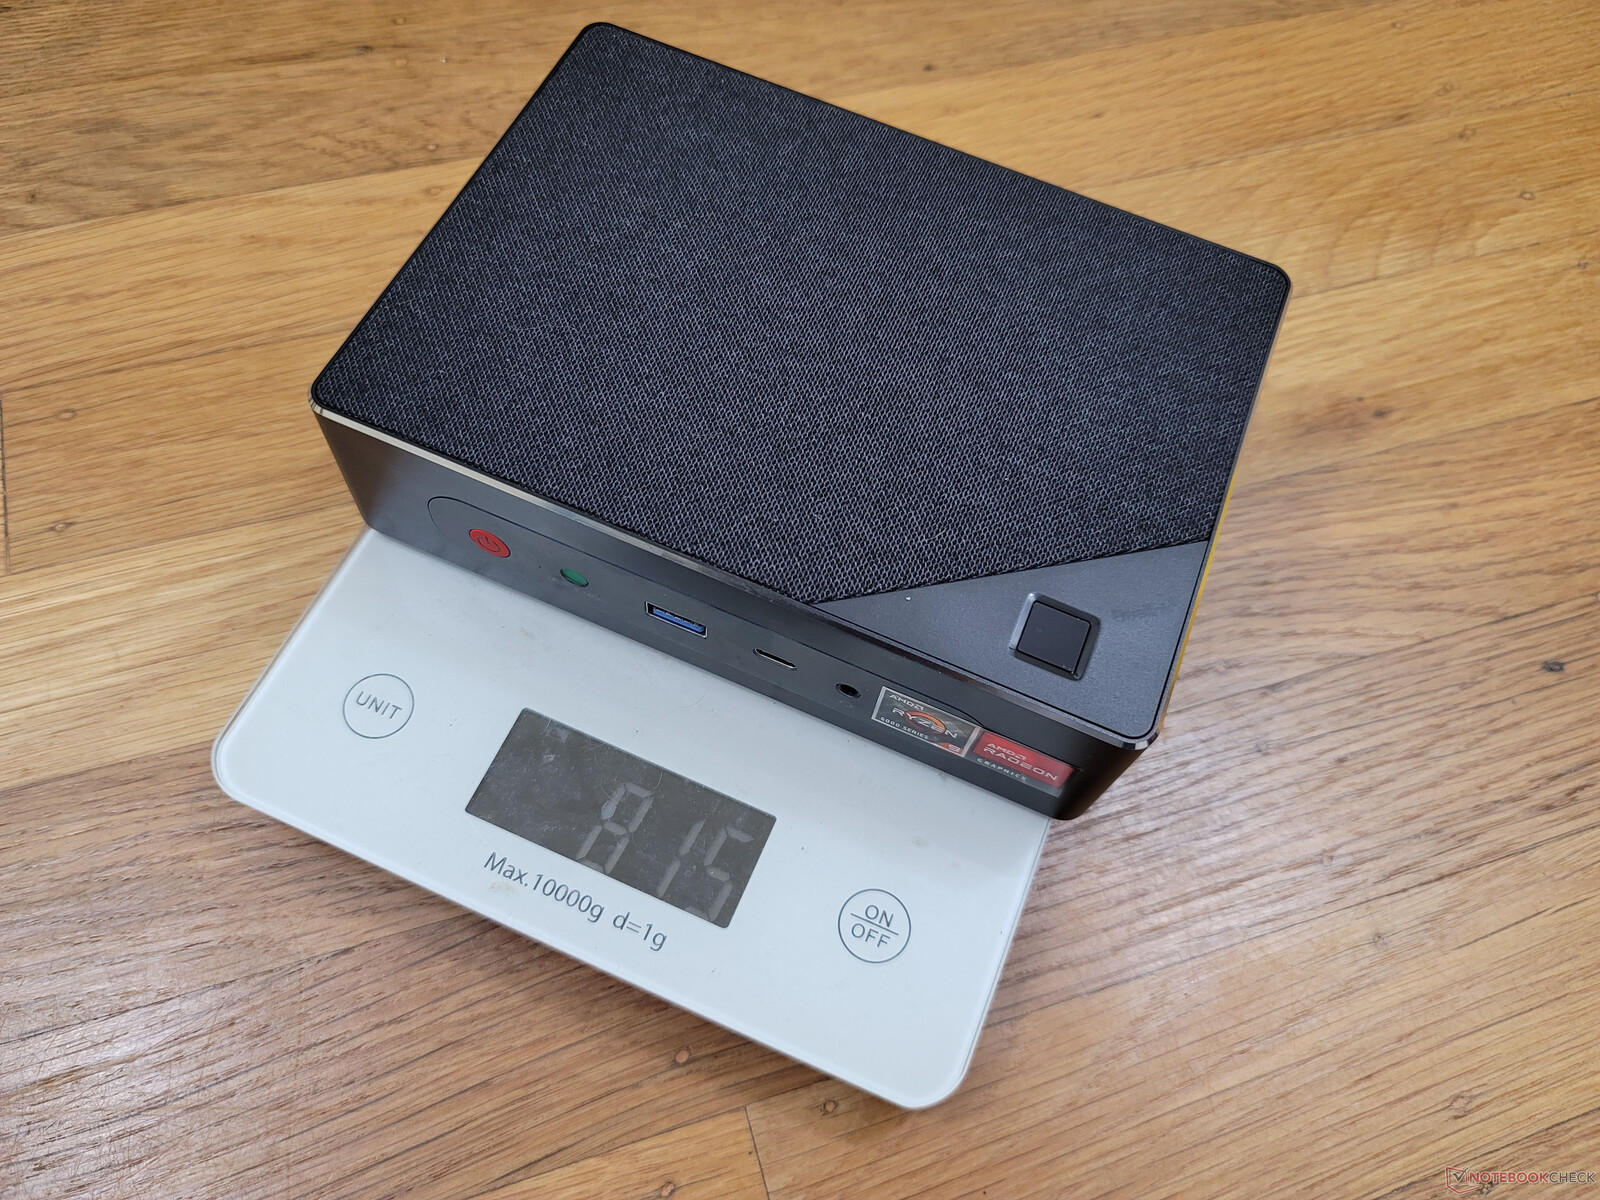
v (old) | 11/2022 | Beelink GTR6 R9 6900HX, Radeon 680M | 815 g | 43 mm | x | ||
v (old) | 09/2022 | Beelink SEi11 Pro i5-11320H, Iris Xe G7 96EUs | 440 g | 40 mm | x | ||
v (old) | 01/2022 | Beelink GTR5 R9 5900HX, Vega 8 | 686 g | 39 mm | x | ||
v (old) | Intel NUC11PHKi7C i7-1165G7, GeForce RTX 2060 Mobile | 1.4 kg | 42 mm | x | |||
v (old) | Intel NUC11TNKi5 i5-1135G7, Iris Xe G7 80EUs | 504 g | 37 mm | x | |||
v (old) | GMK NucBox 2 i5-8259U, Iris Plus Graphics 655 | 430 g | 50 mm | x |
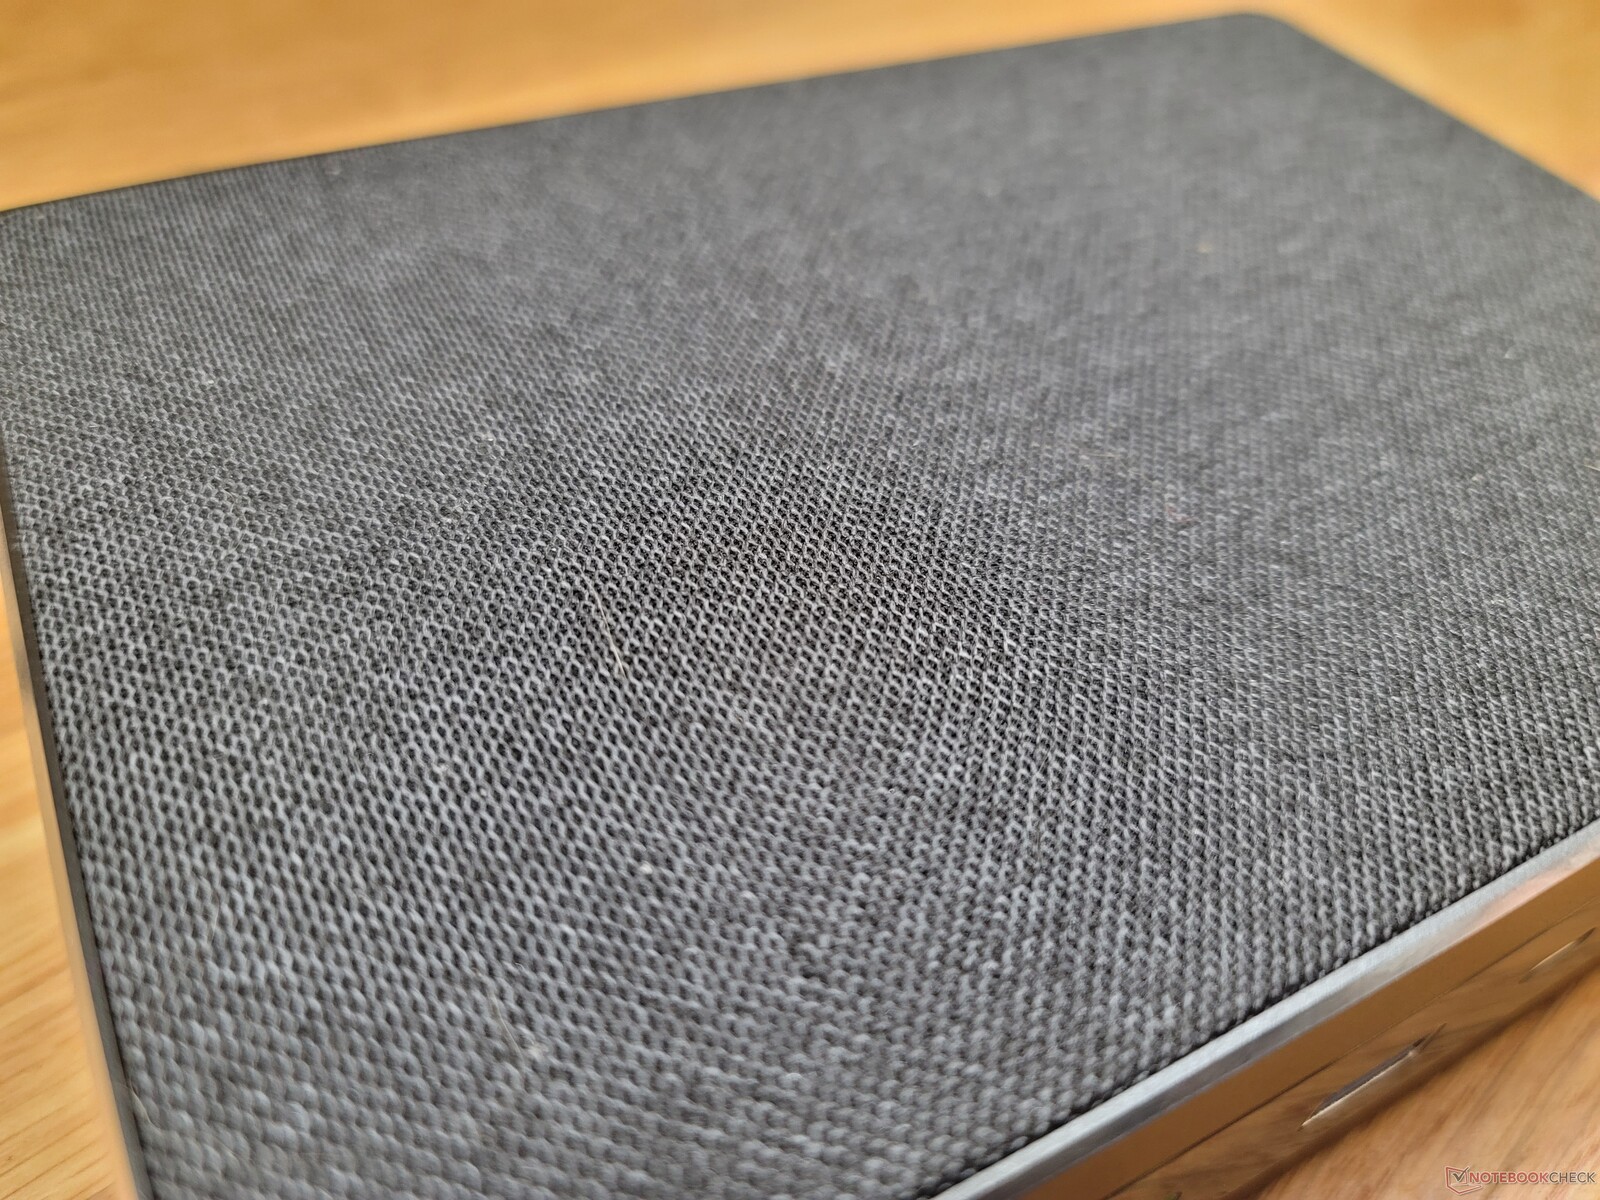
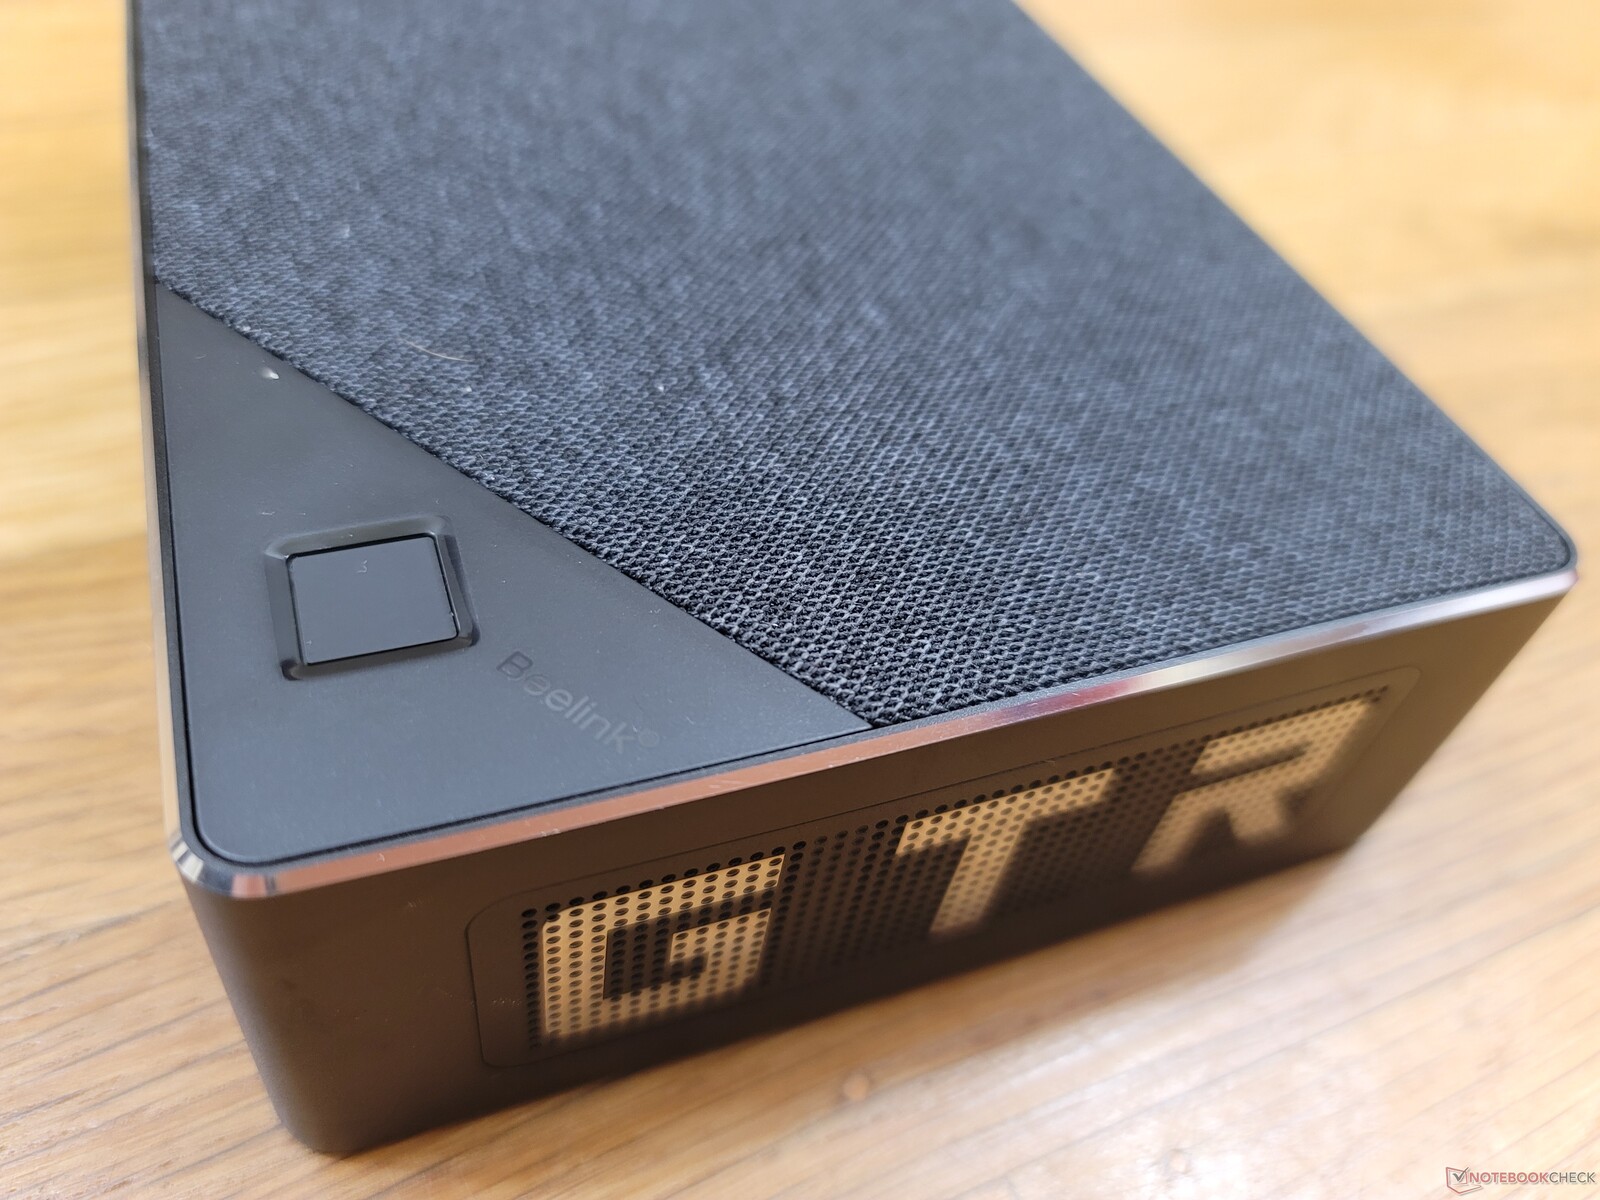
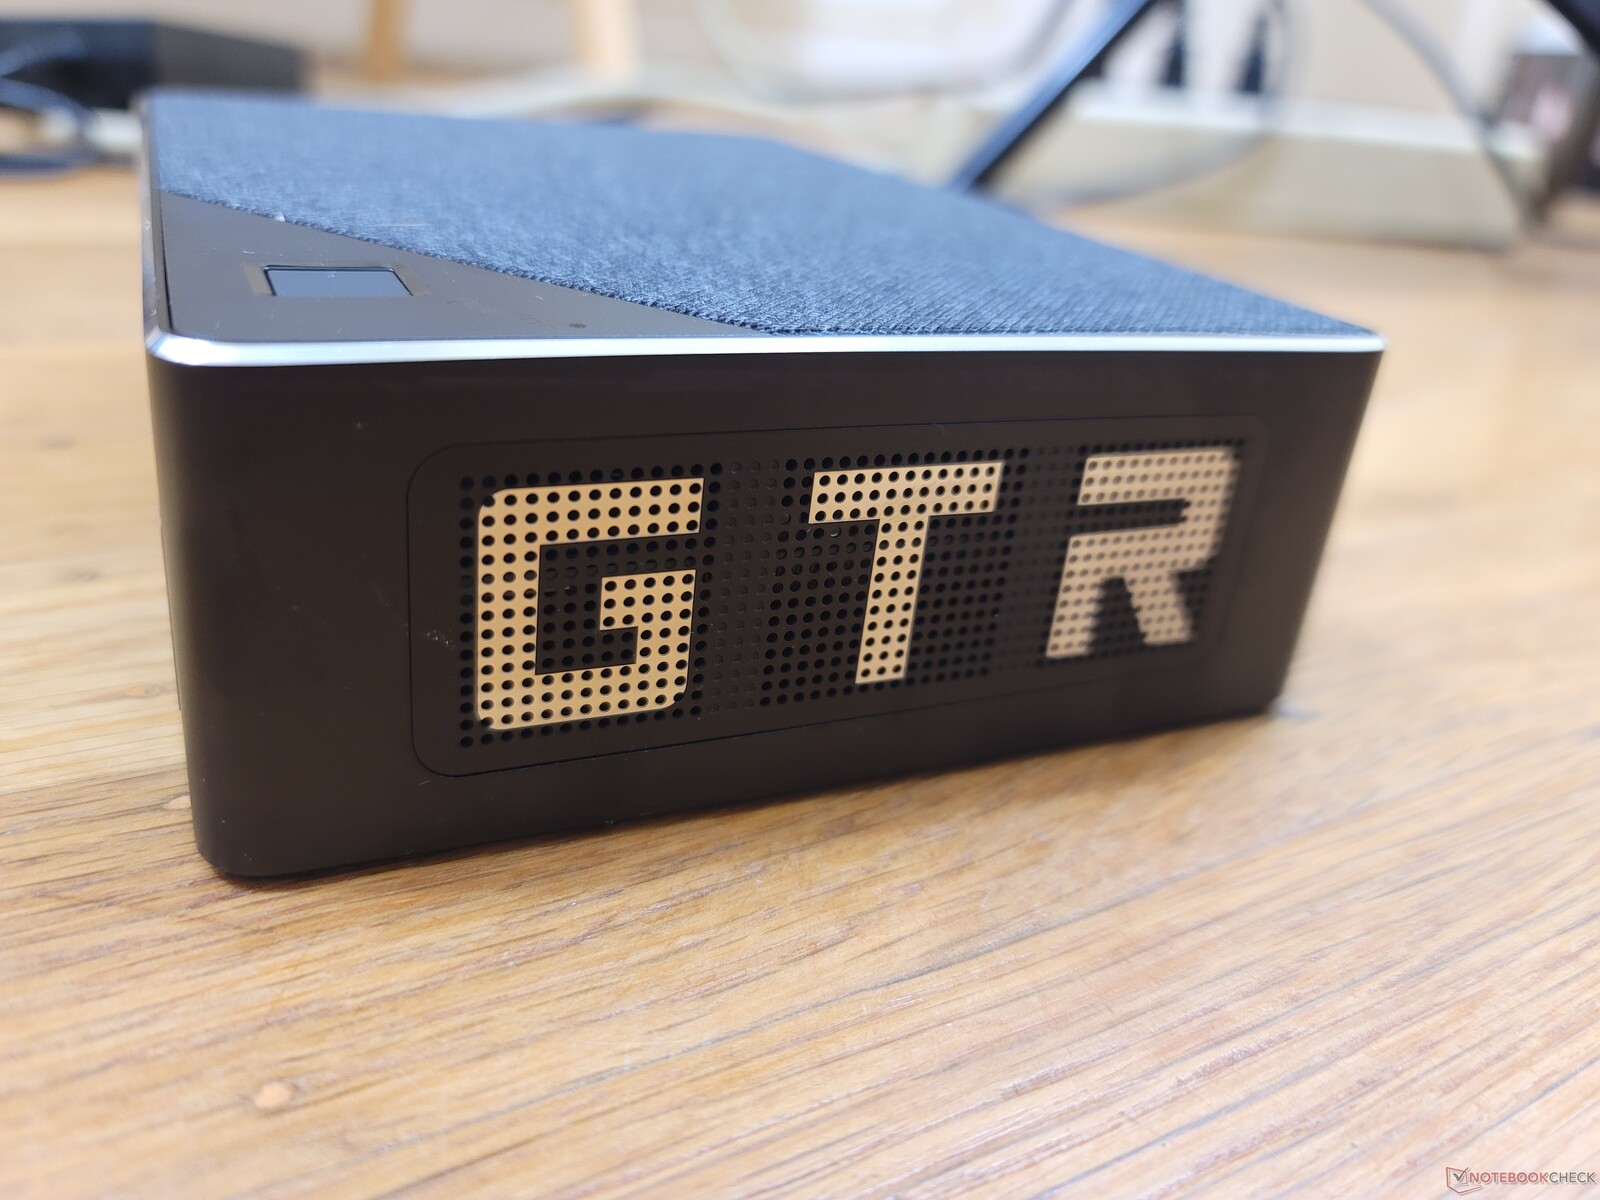
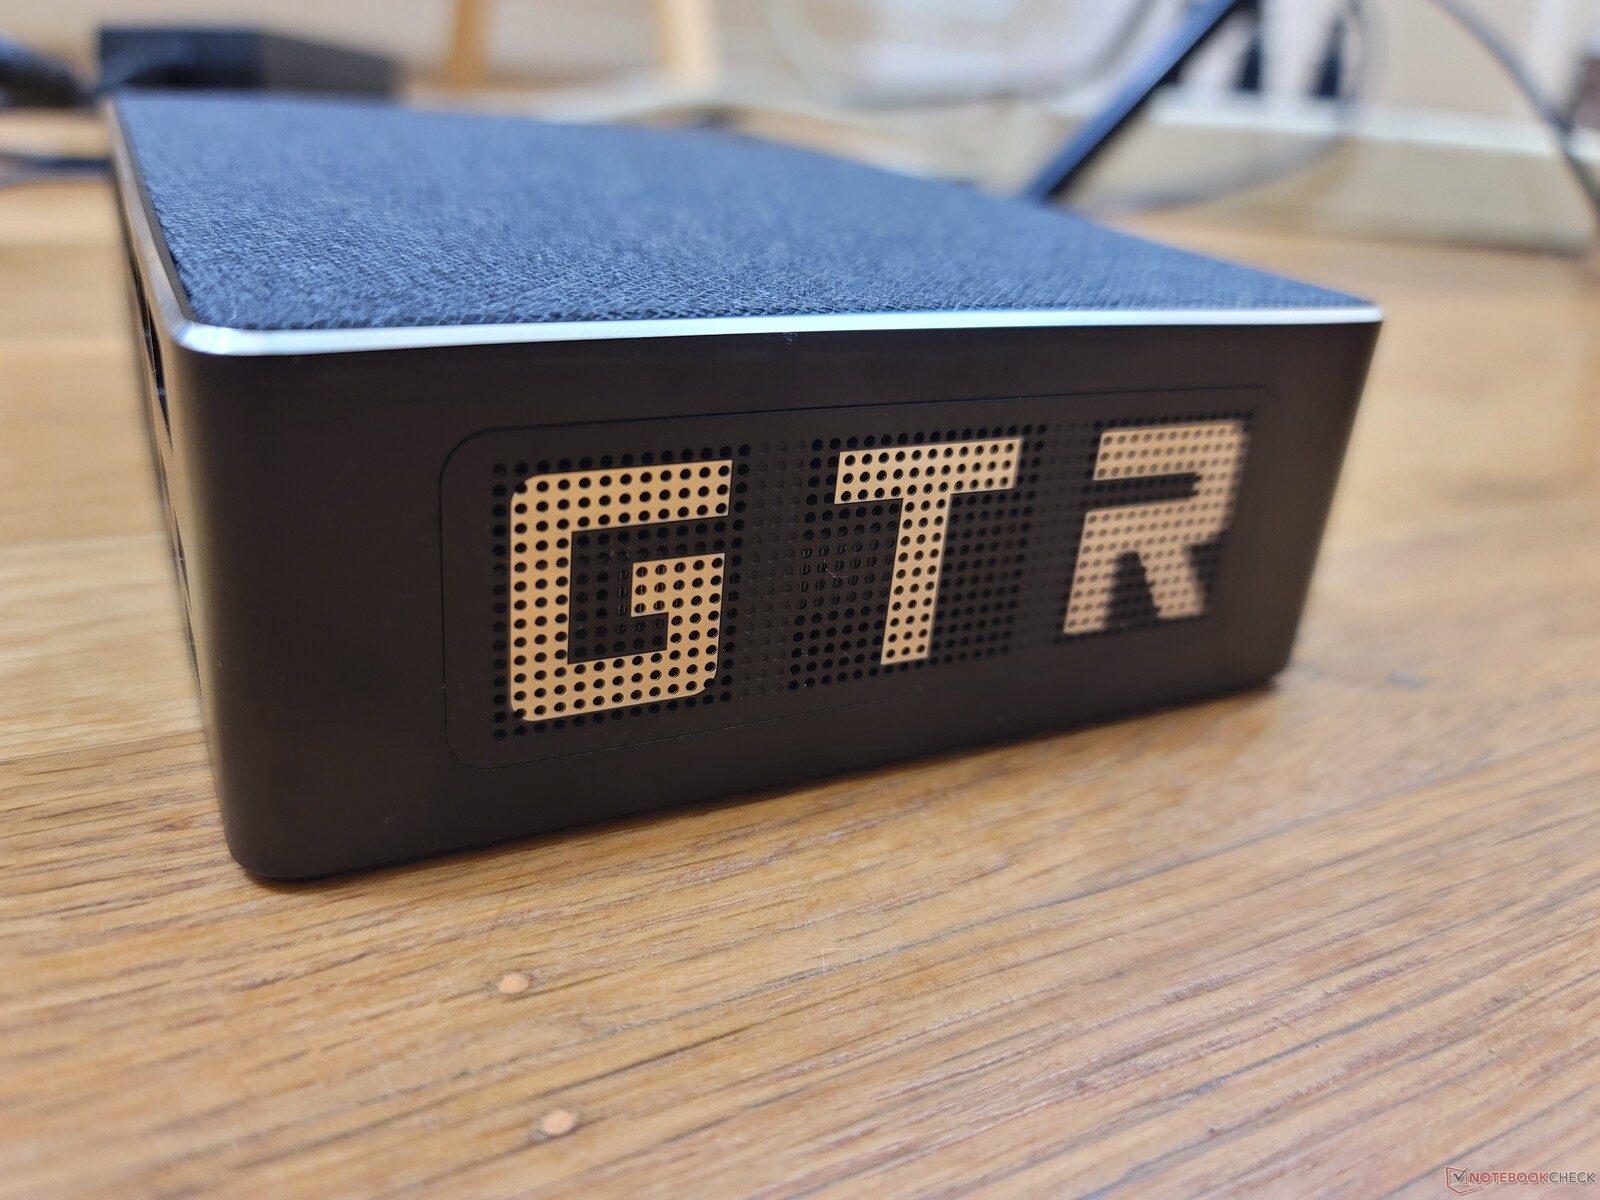
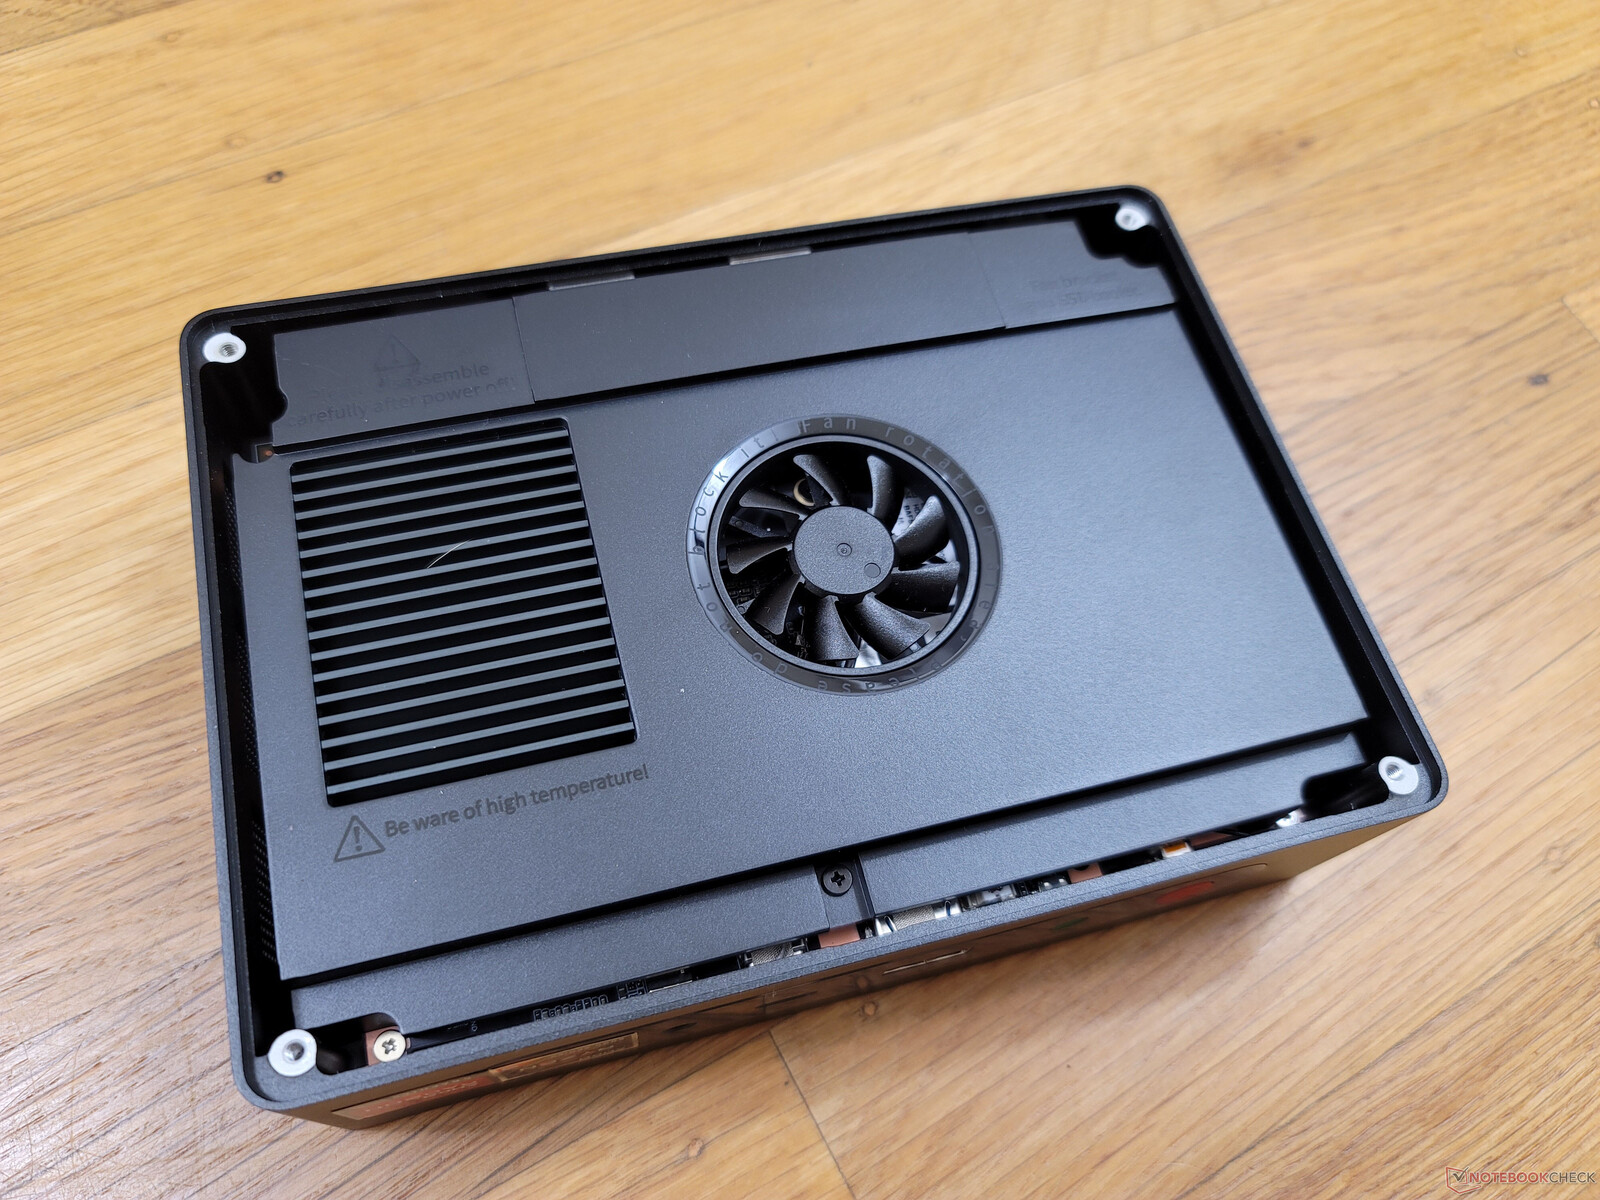
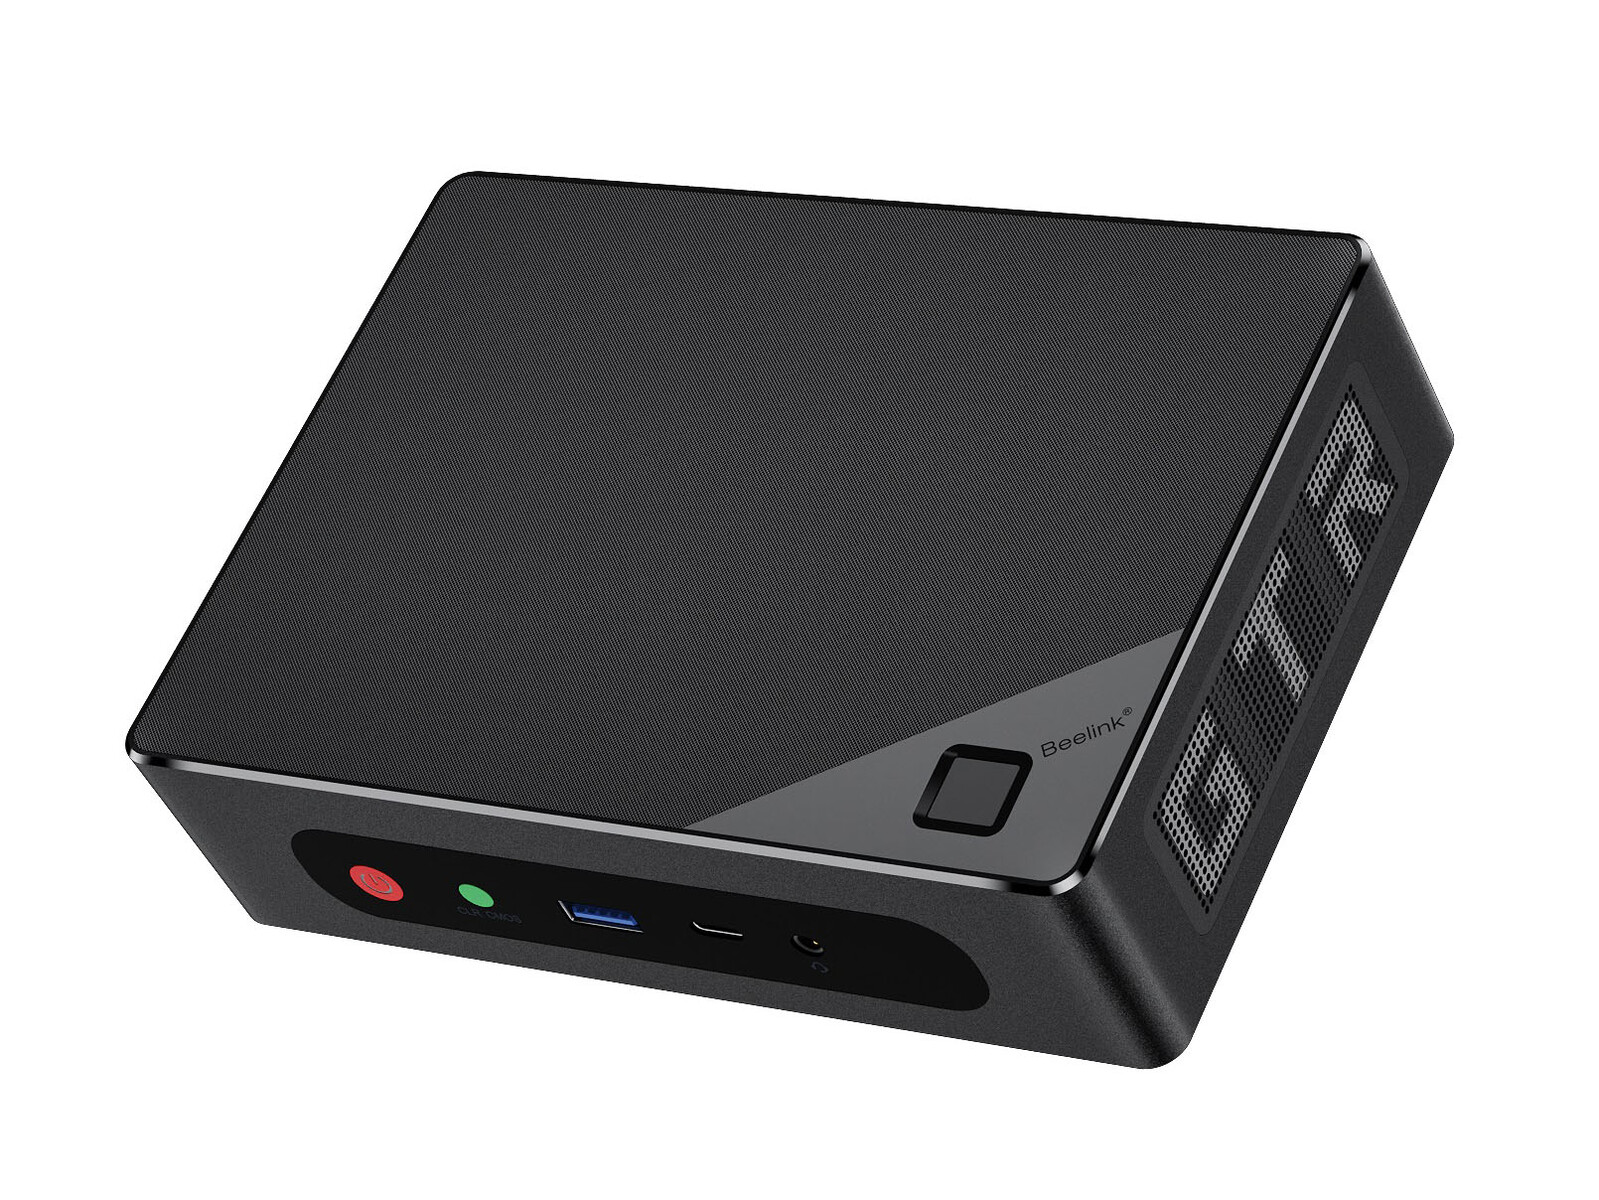
Väska - Ny mjuk nätöverdel
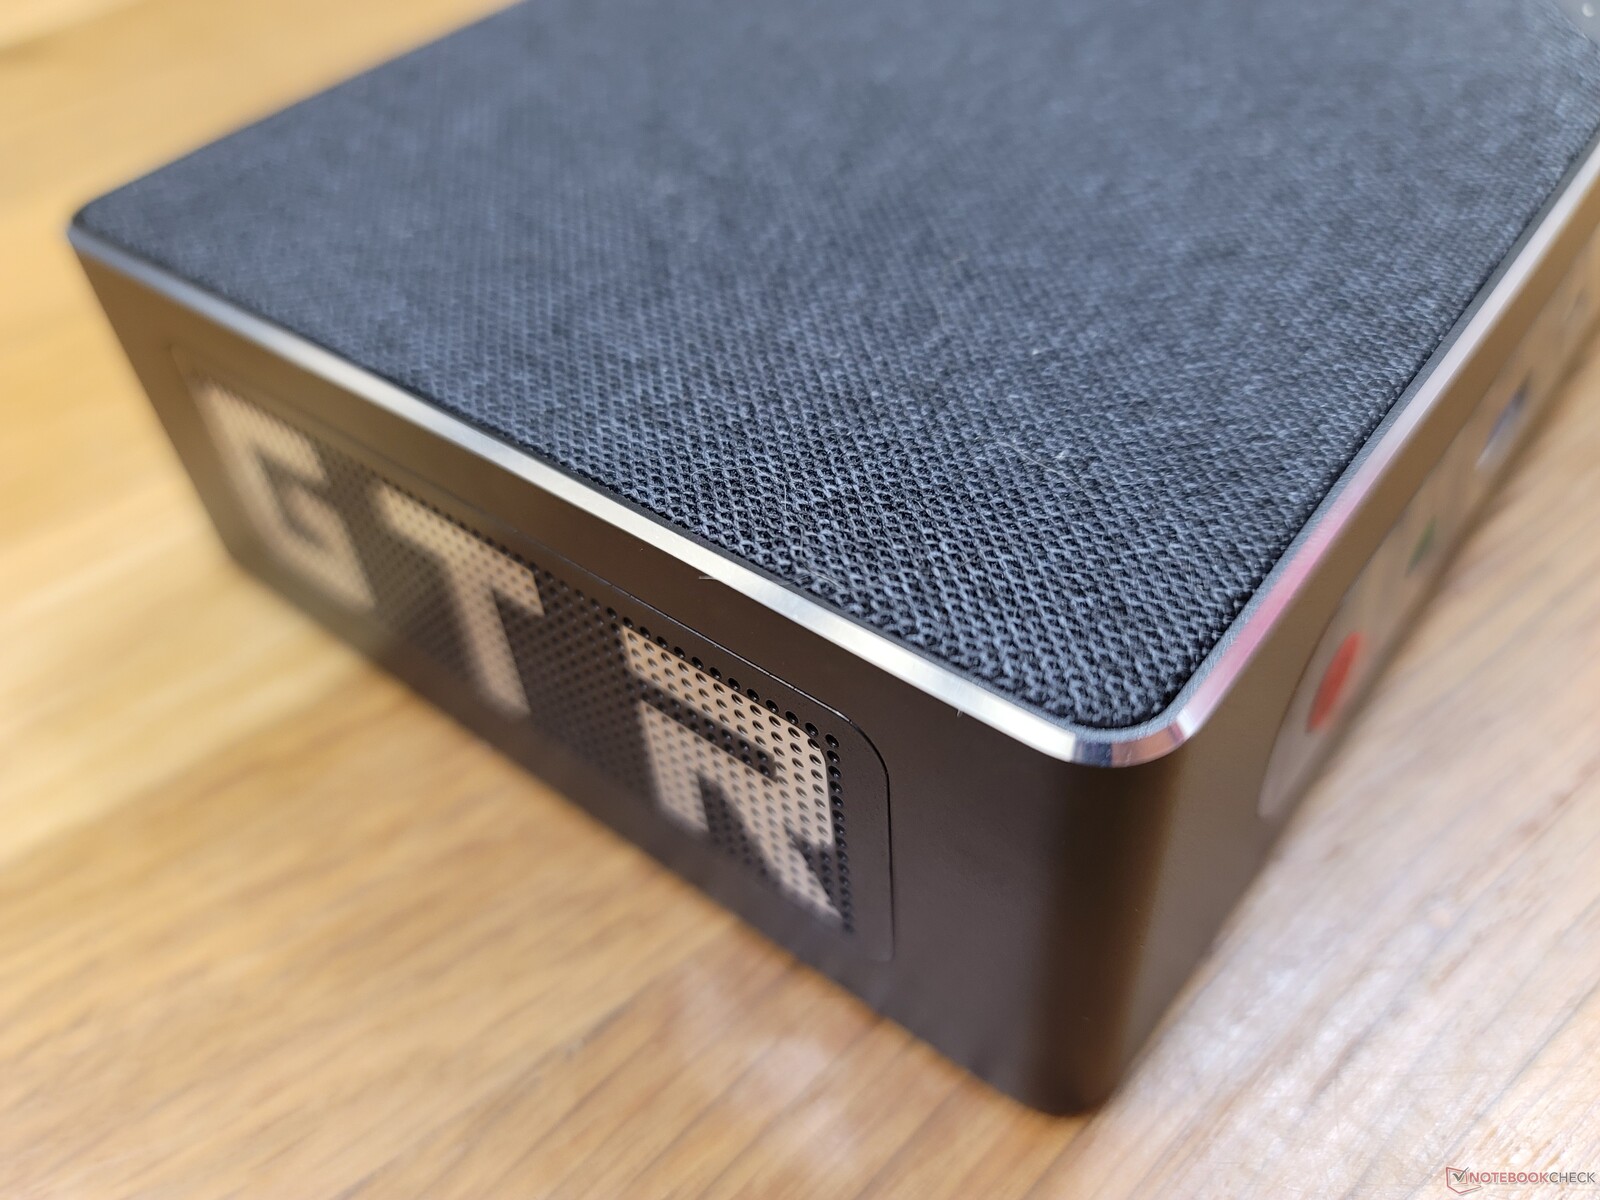
Fodralet känns starkt med sina metallsidor och andningsbart mjukt nät på ovansidan för luftflöde. Särskilt det sistnämnda är en nyhet för Beelink eftersom tidigare minidatorer från företaget istället hade plast- eller metalltoppar. Det avtagbara nätet tillför ett element av kvalitet eller lyxighet till den övergripande designen.
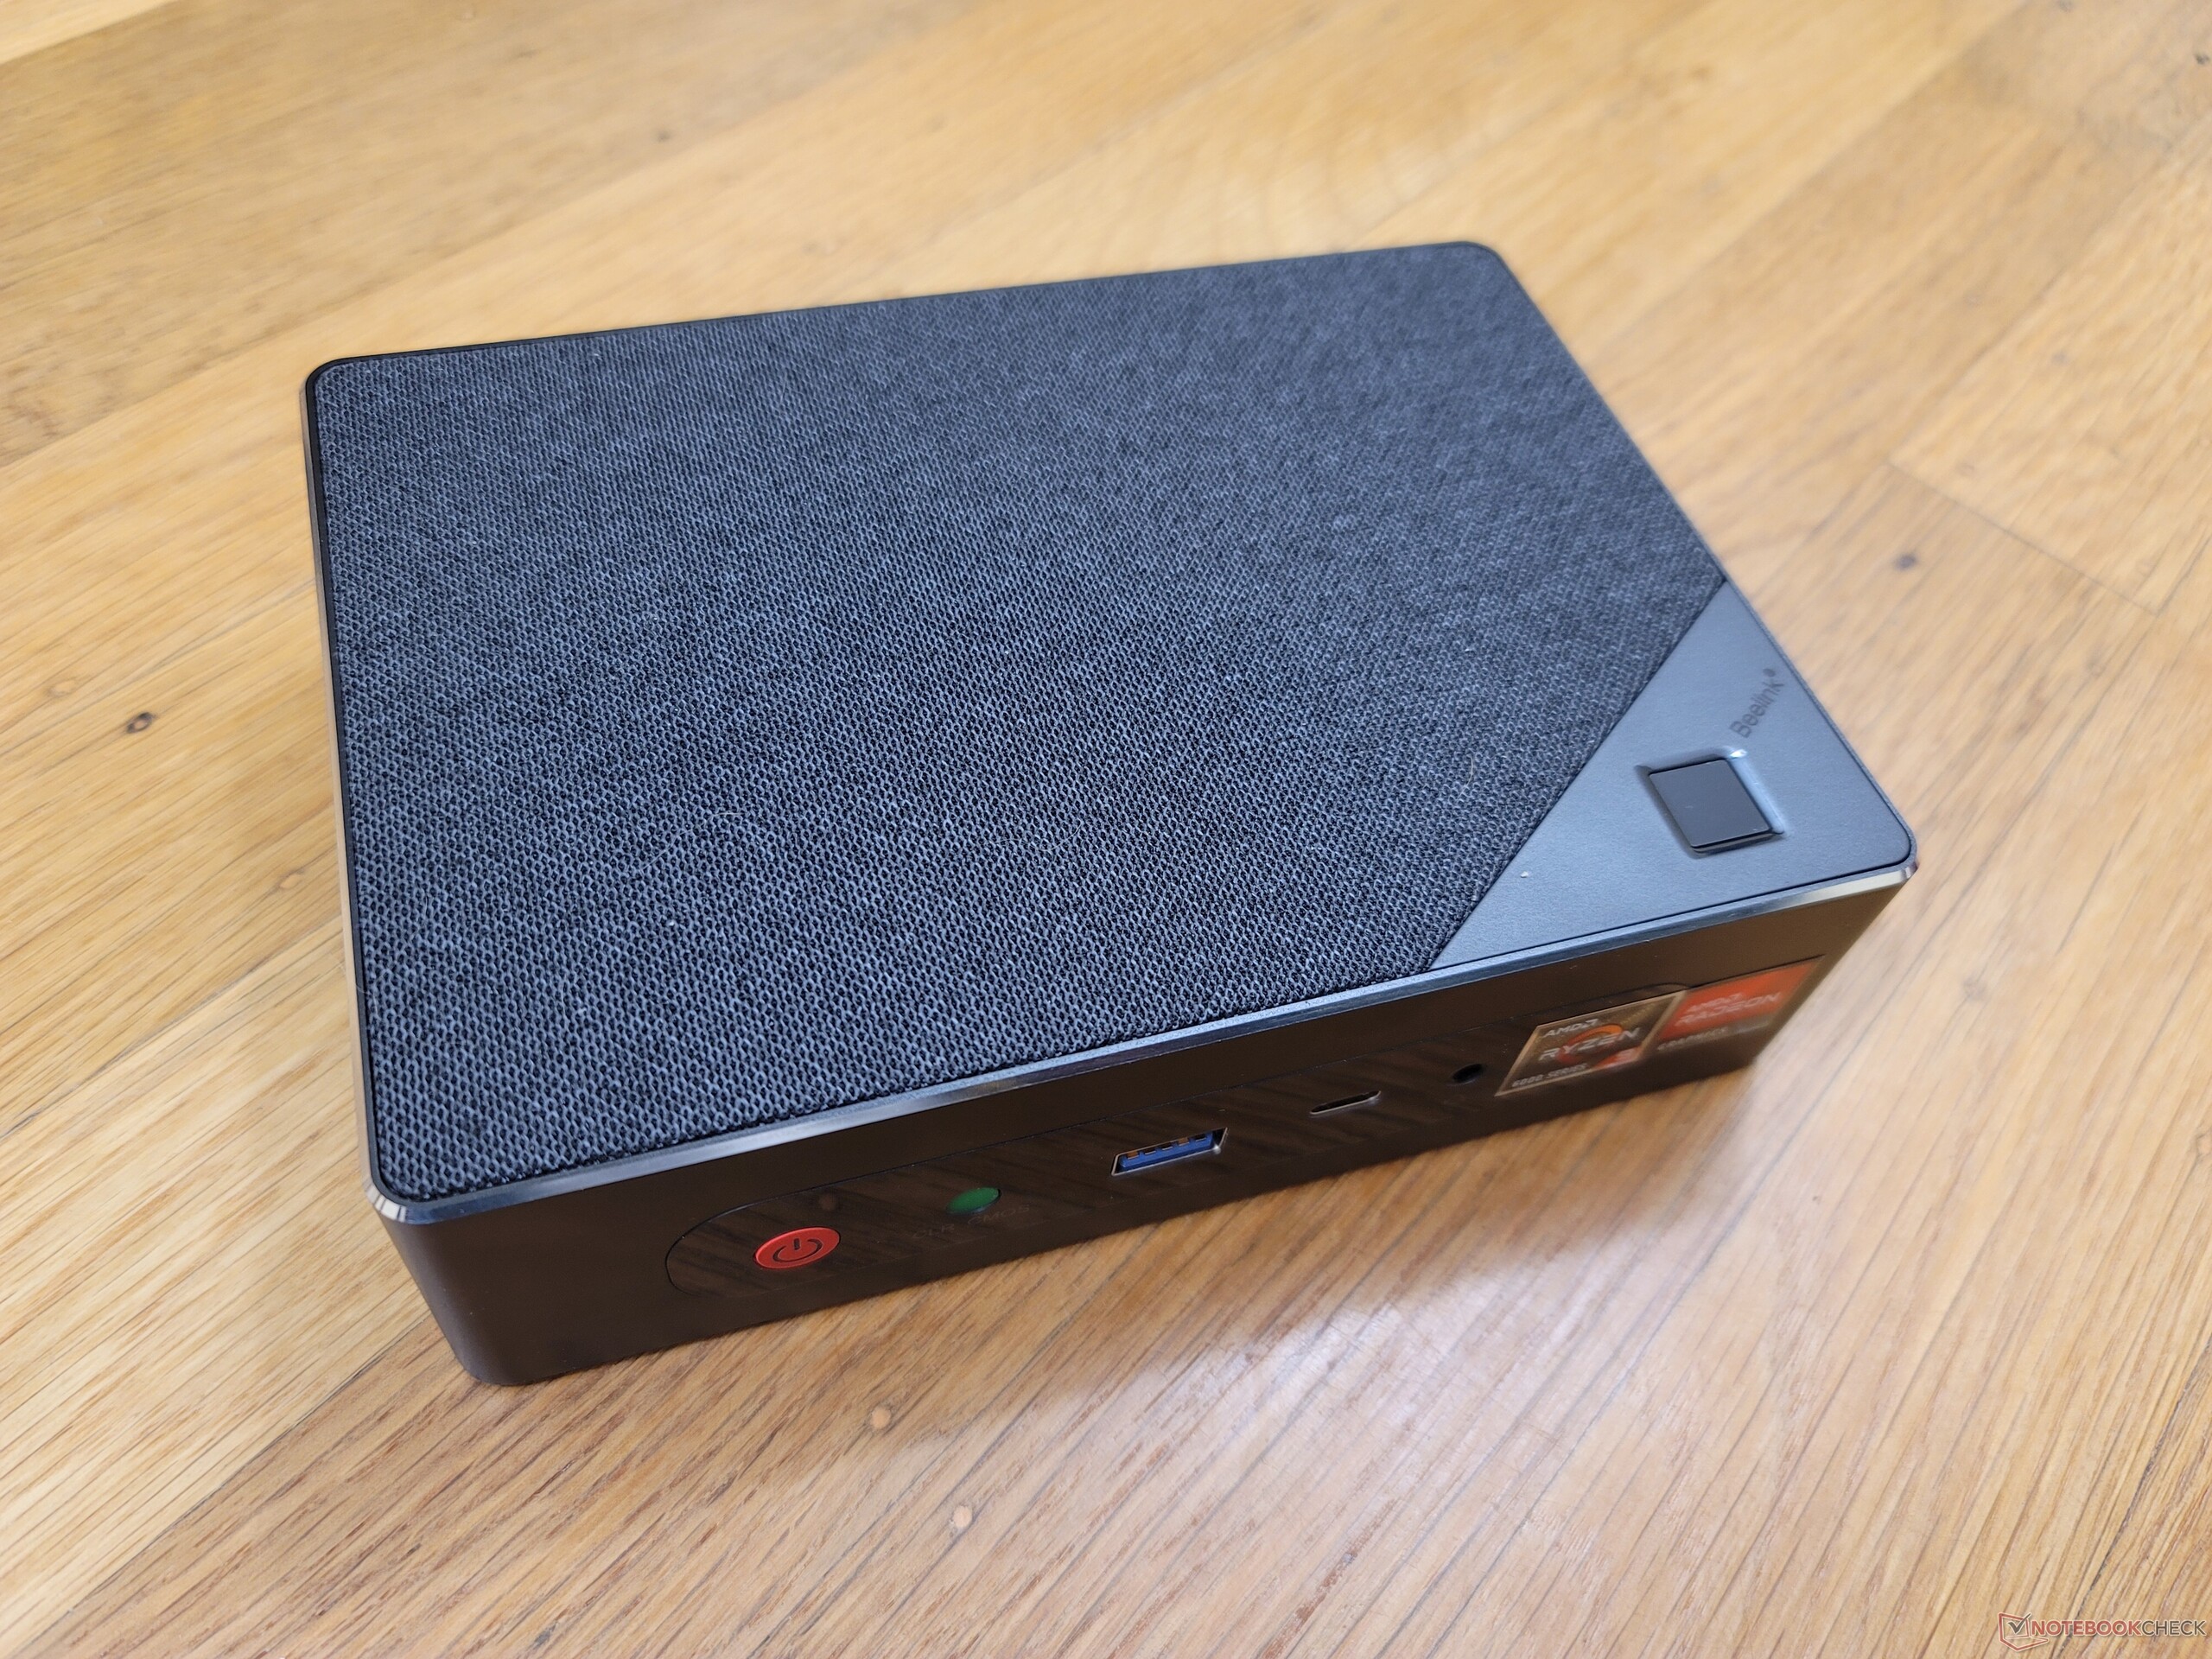
GTR6 är tjockare och tyngre än GTR5 och de flesta Intel NUC-modeller. Den större storleken beror delvis på den mer krävande AMD HX-processorn jämfört med Intel Core U-serien.
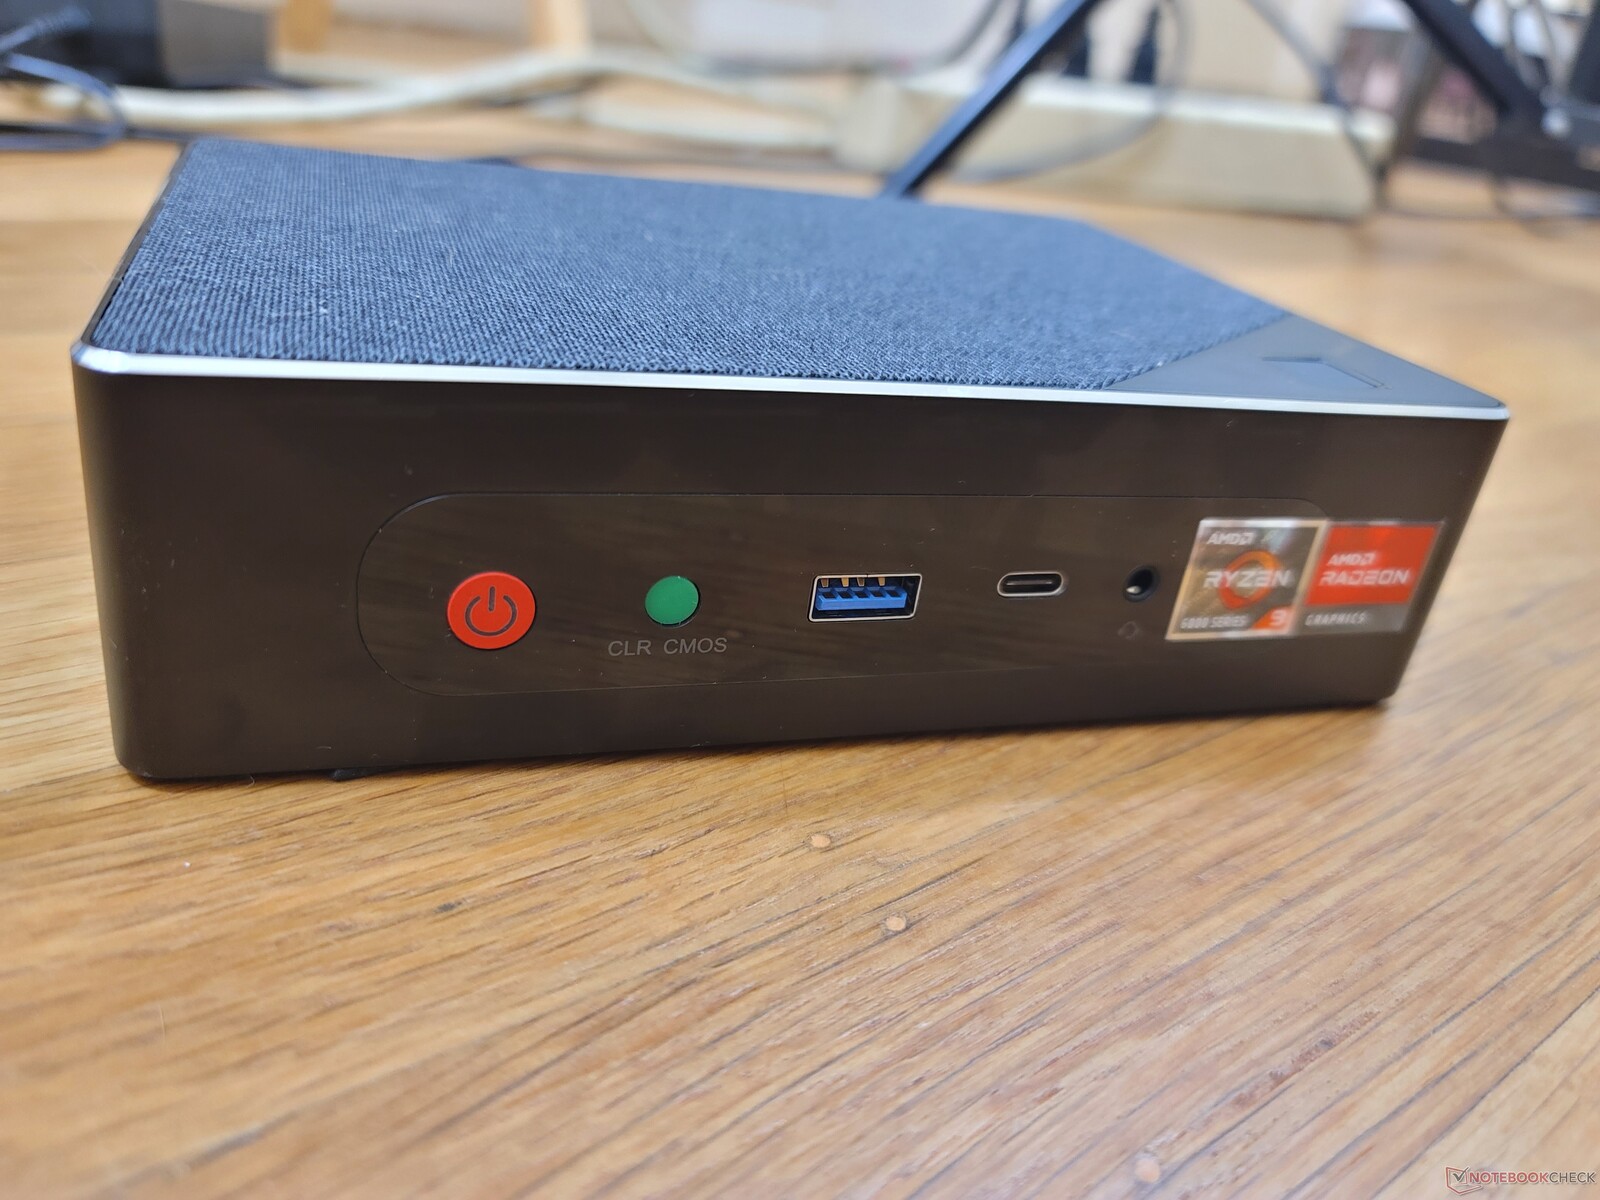
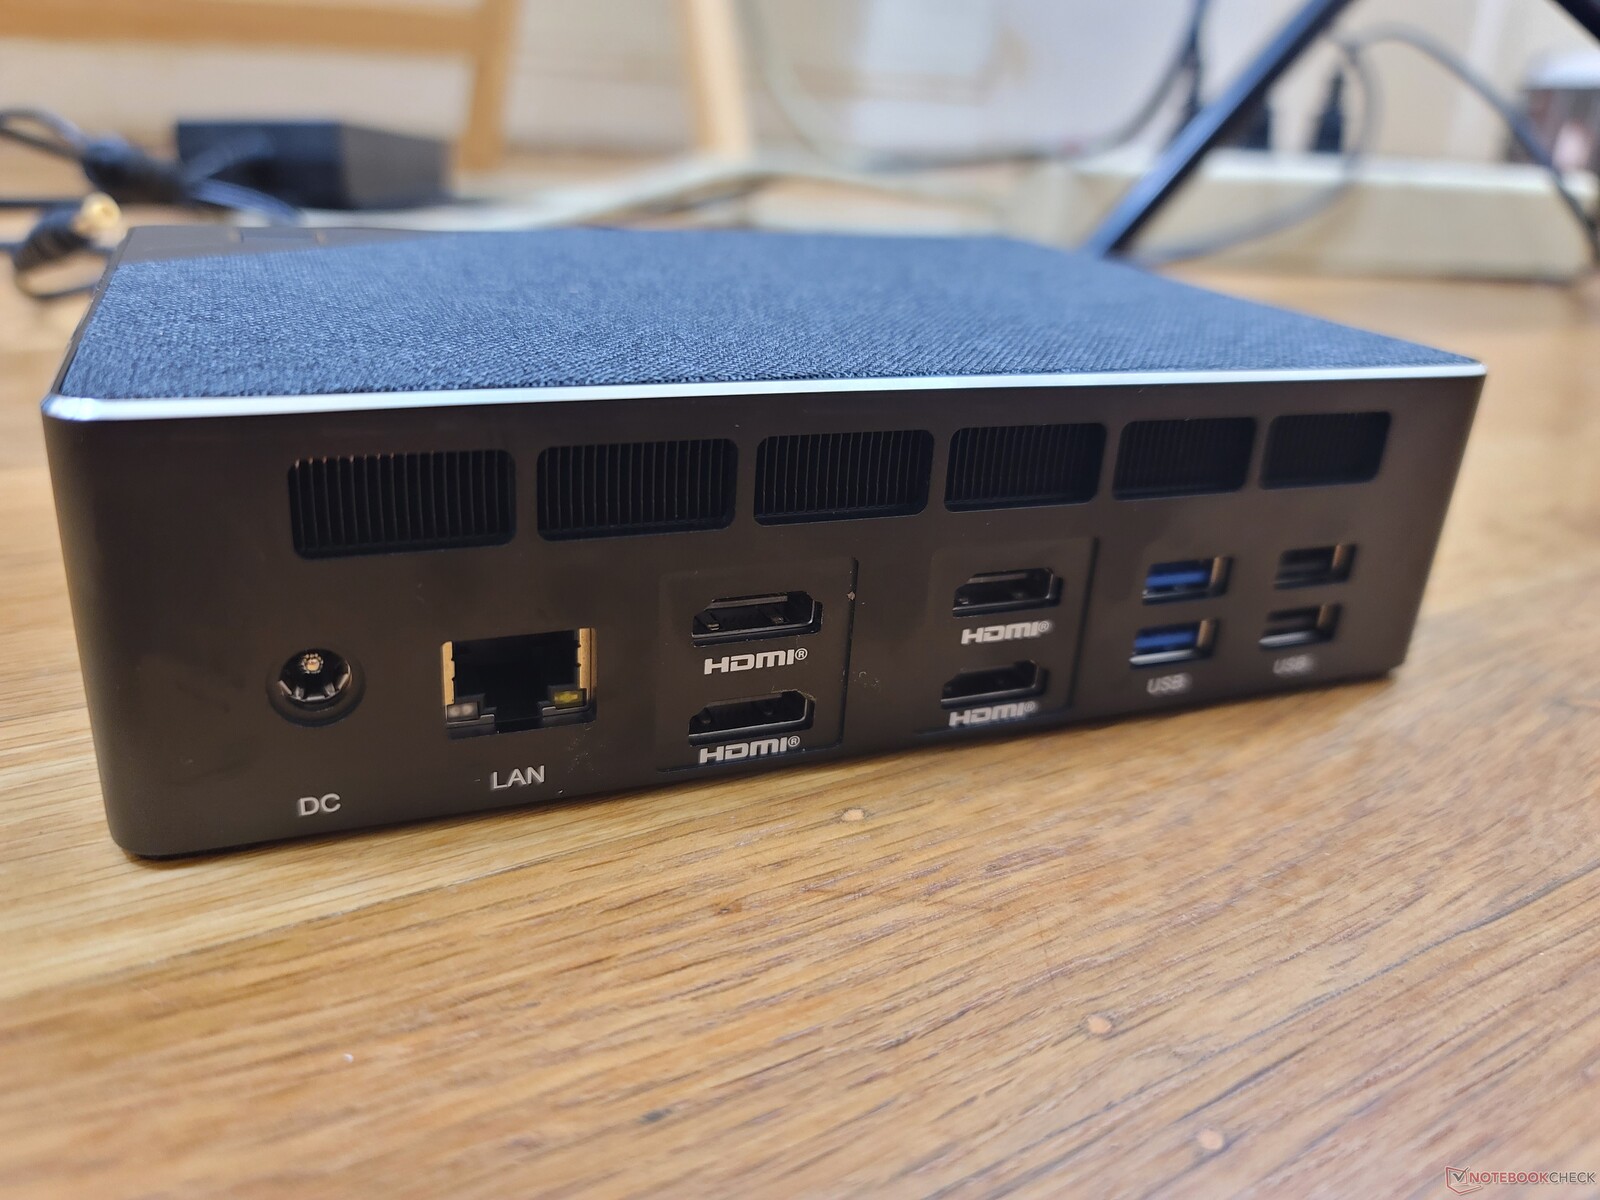
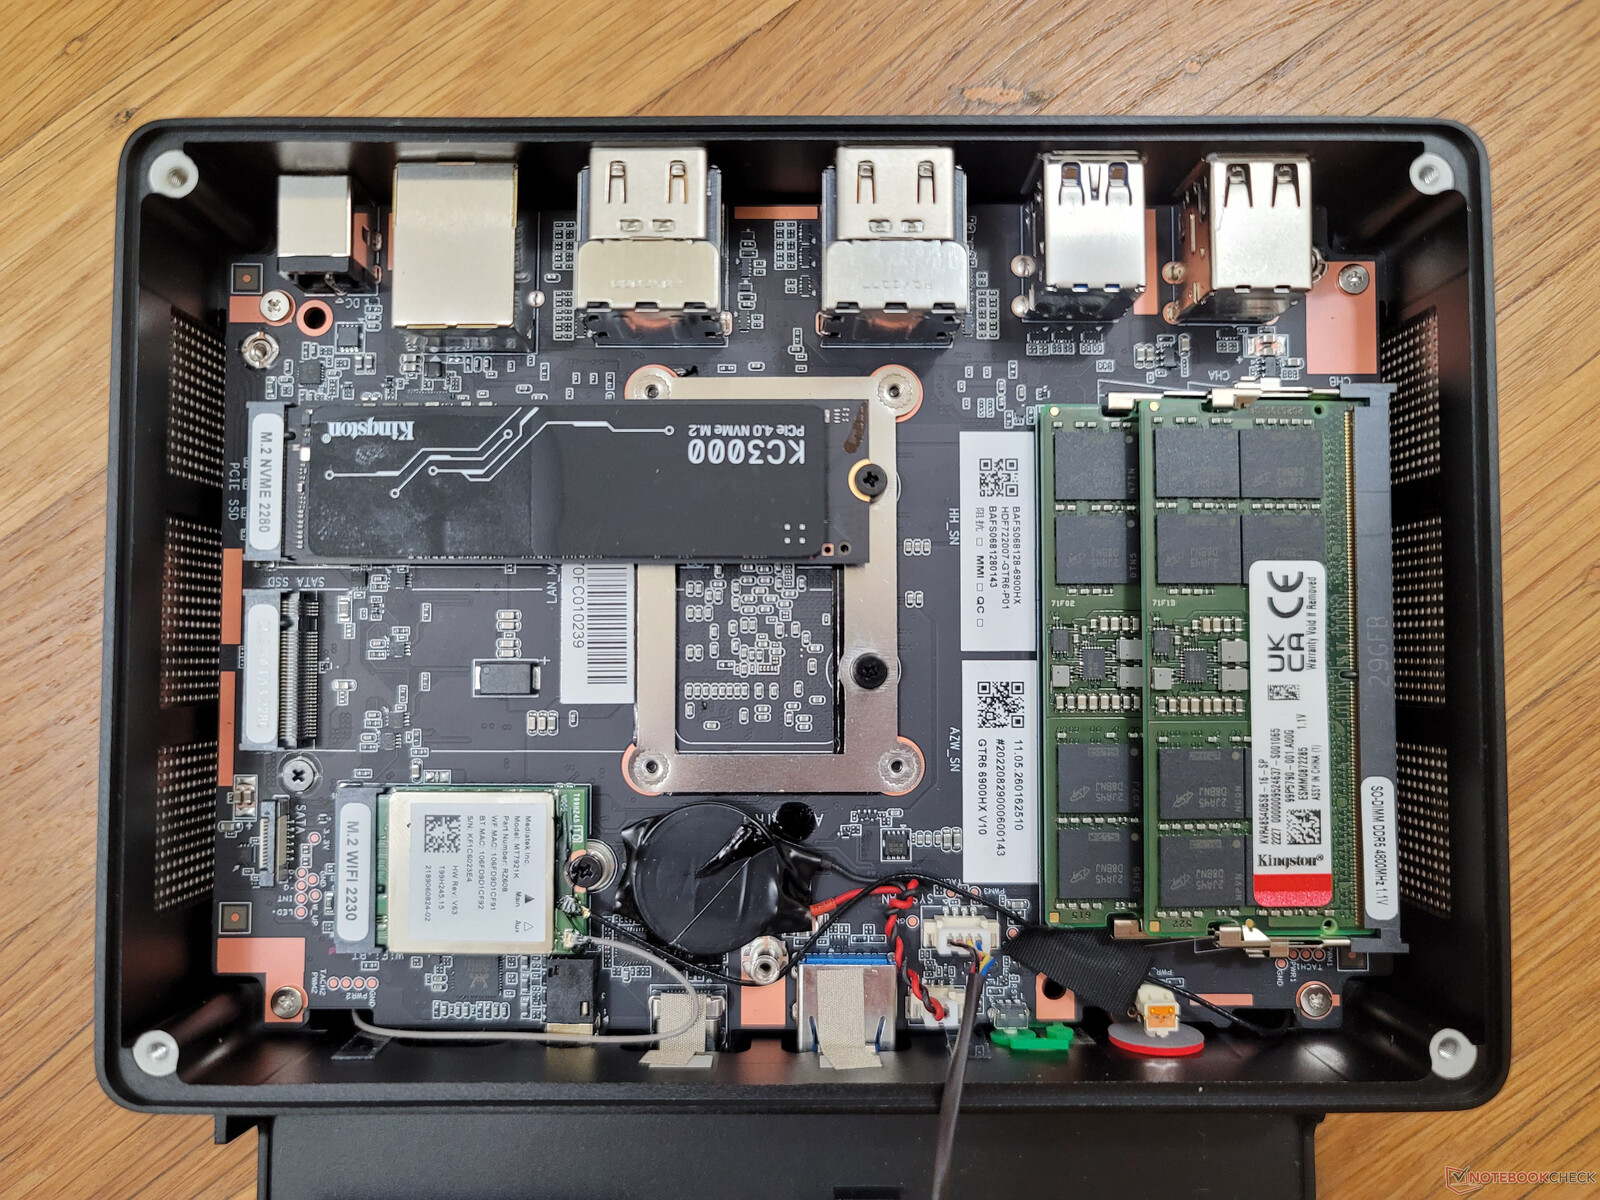
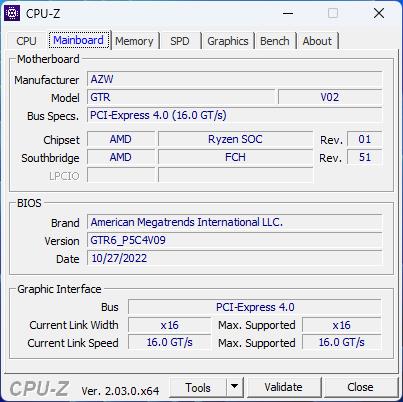
Anslutning - Ingen Thunderbolt
Portalternativen är utmärkta med fyra enskilda HDMI 2.1-portar som stöder upp till 8K-skärmar vid 60 Hz. Det finns dock bara en USB-C-port och LAN-porten har endast 1 Gbps medan många NUC-modeller nu stöder 10 Gbps
Thunderbolt stöds inte på grund av AMD:s CPU.
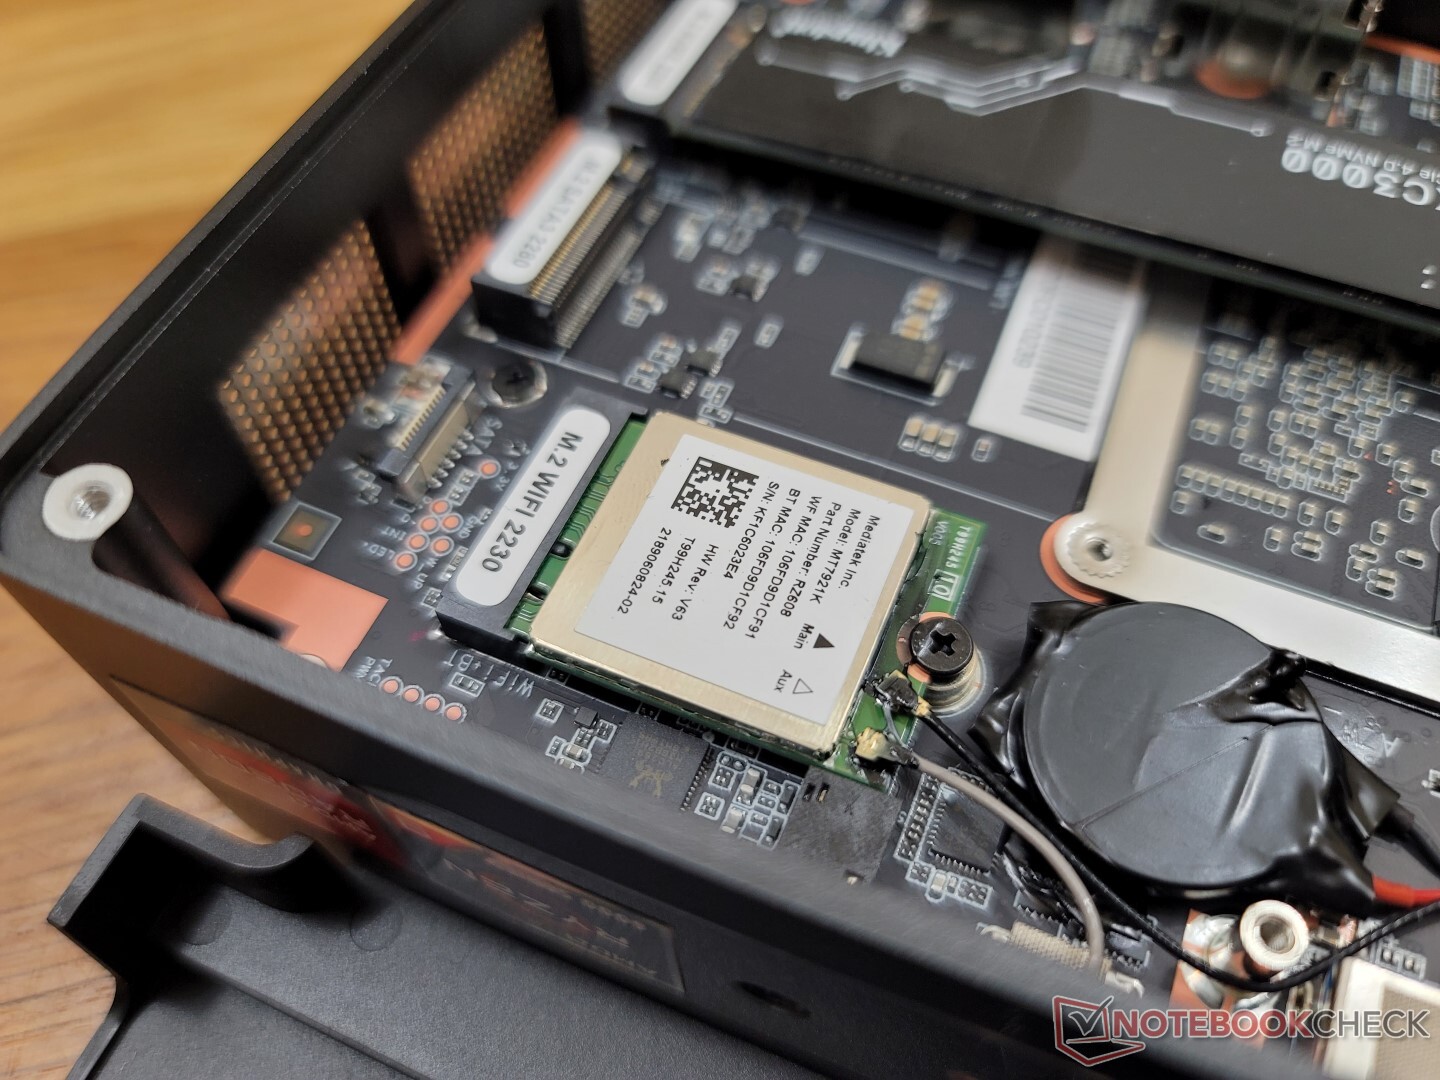
Kommunikation - Wi-Fi 6E Standard
En MediaTek RZ608 är standard för Wi-Fi 6E och Bluetooth 5.2. Överföringshastigheterna är stabila även om de är långsammare än de flesta Intel AX201/210-lösningar
RZ608 på vår testenhet var långsam att upptäcka vårt 6 GHz AXE11000-nätverk även efter uppdatering till de senaste drivrutinerna i skrivande stund. Du kan behöva vänta flera minuter innan systemet kan upptäcka och ansluta till ditt 6 GHz-nätverk.
| Networking | |
| iperf3 transmit AX12 | |
| Intel NUC11TNKi5 | |
| Intel NUC11PHKi7C | |
| Beelink GTR5 | |
| GMK NucBox 2 | |
| iperf3 receive AX12 | |
| Intel NUC11TNKi5 | |
| Intel NUC11PHKi7C | |
| Beelink GTR5 | |
| GMK NucBox 2 | |
| iperf3 receive AXE11000 6GHz | |
| Beelink GTR6 | |
| Beelink SEi11 Pro | |
| iperf3 receive AXE11000 | |
| Beelink GTR6 | |
| iperf3 transmit AXE11000 | |
| Beelink GTR6 | |
| iperf3 transmit AXE11000 6GHz | |
| Beelink GTR6 | |
| Beelink SEi11 Pro | |
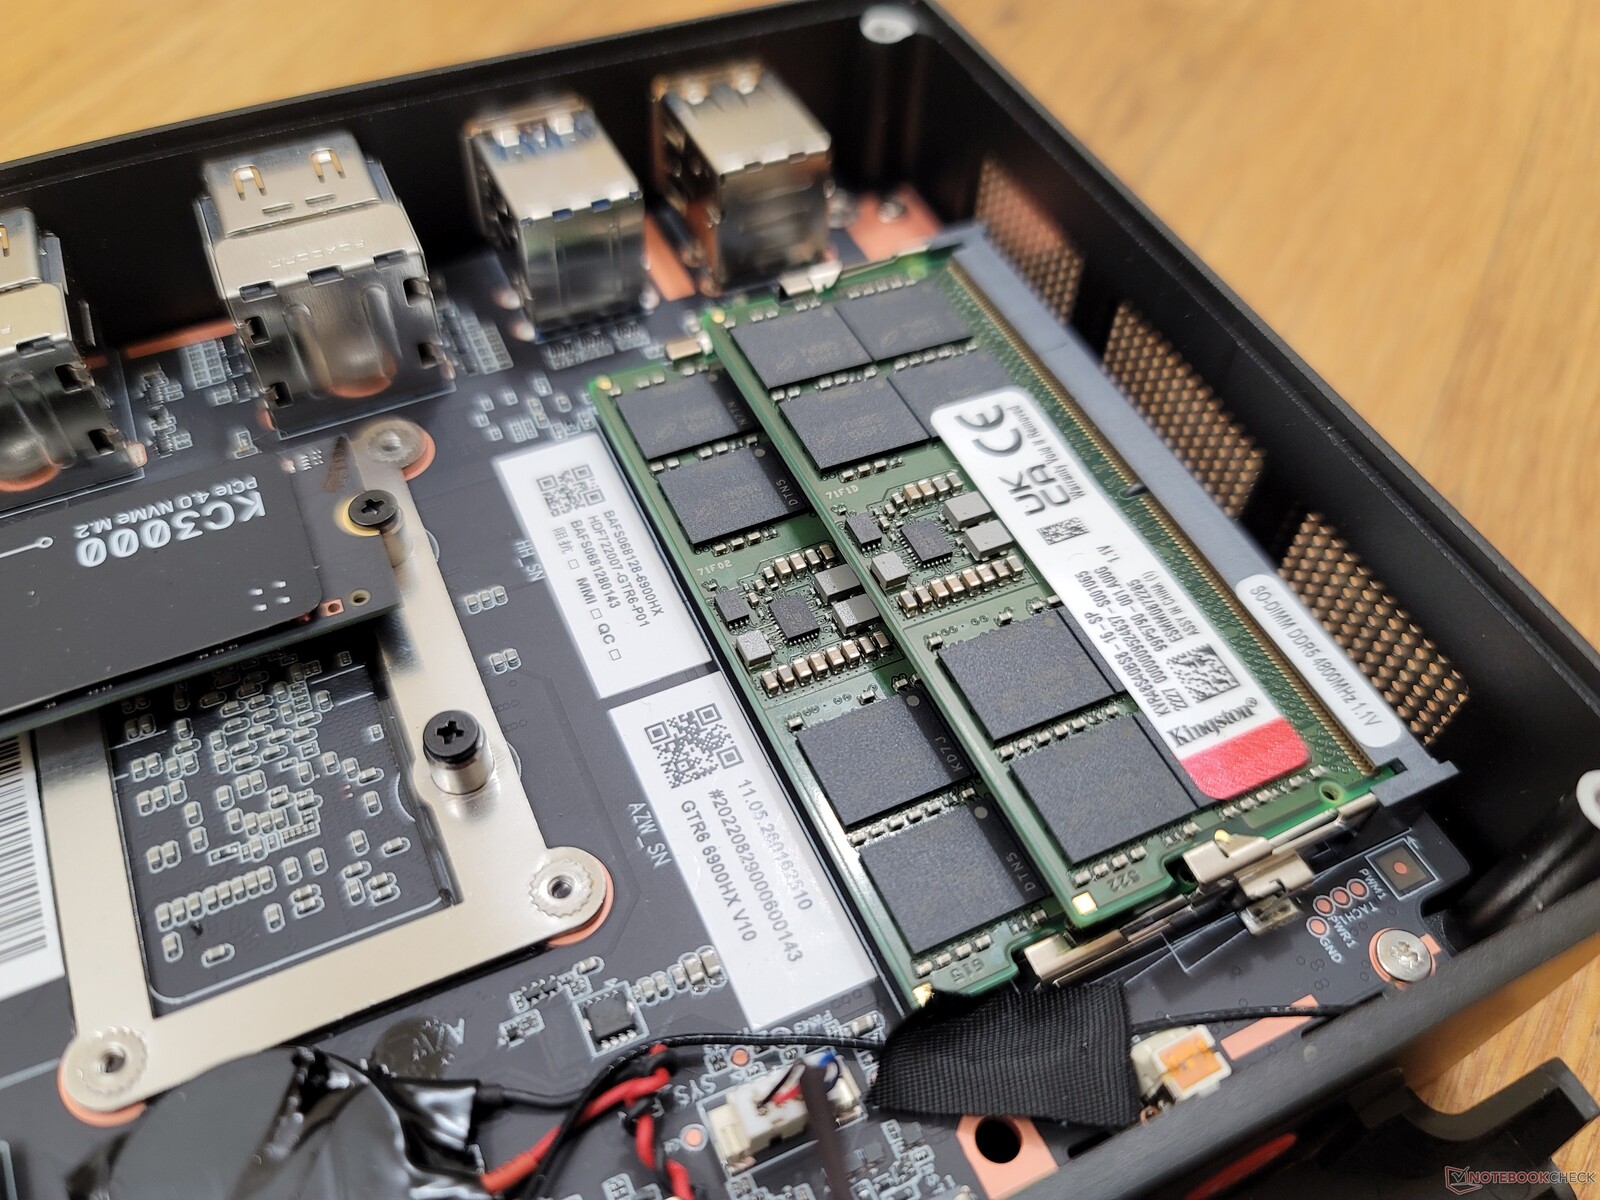
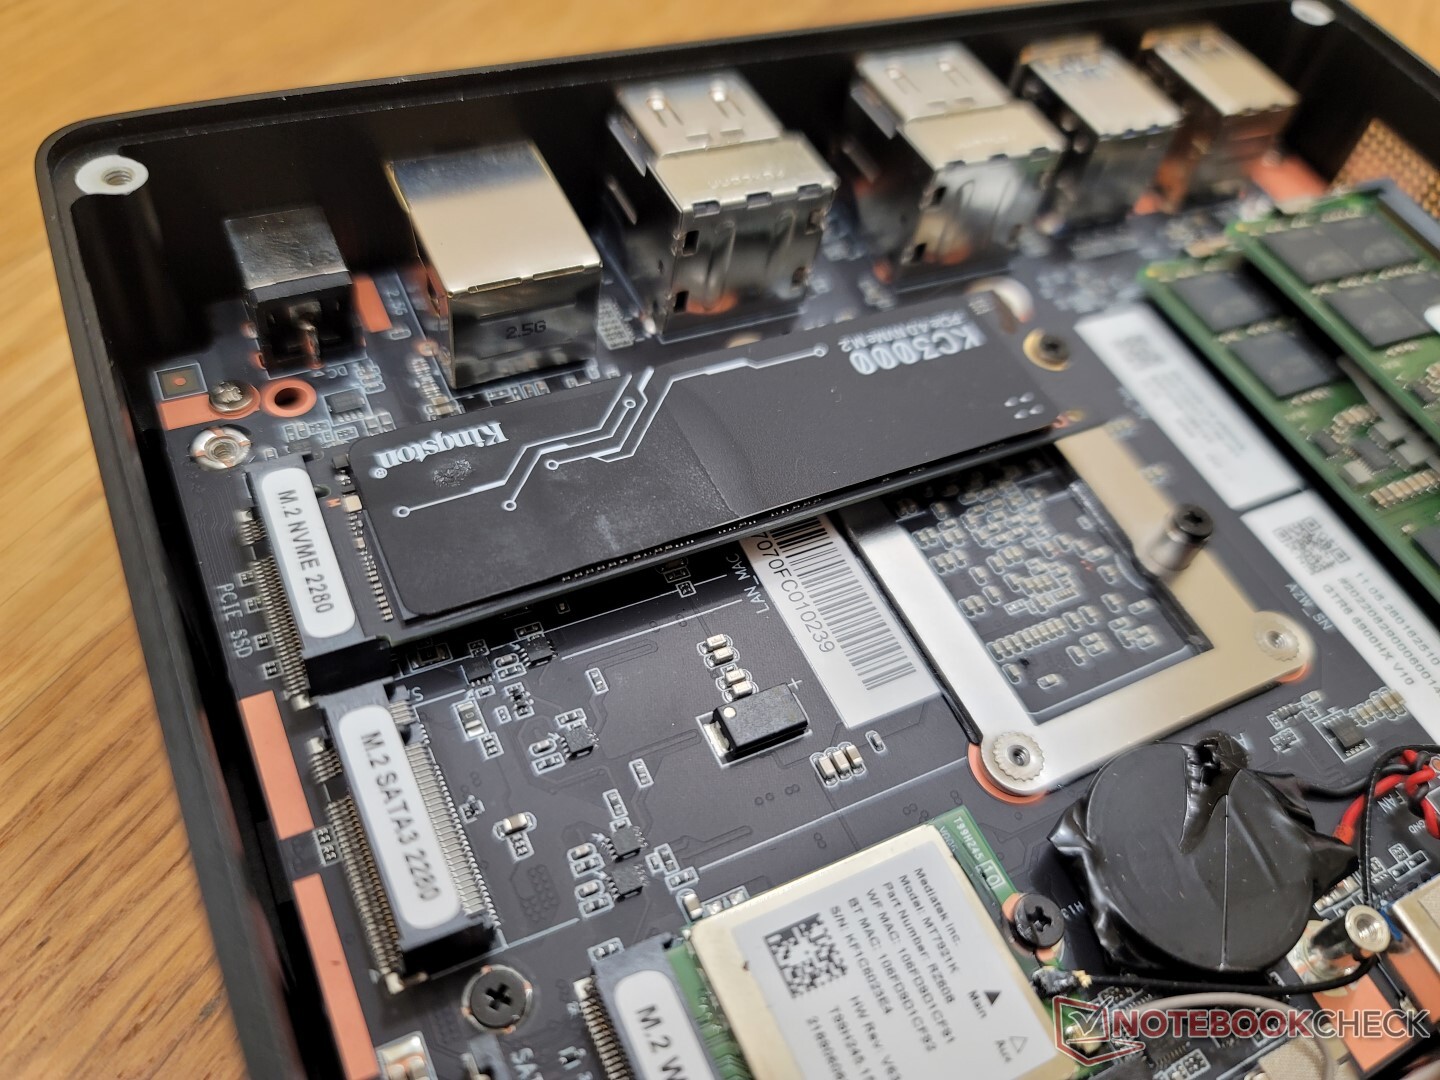
Underhåll
Bottenpanelen är fäst med bara fyra Philips-skruvar för enkel service. En annan platta sitter dock under och kräver att ytterligare fyra skruvar tas bort, vilket framgår av bilderna nedan.
Tillbehör och garanti
I förpackningen ingår två HDMI-kablar, ett avtagbart VESA-fäste med extra skruvar, bruksanvisning och två extra nätskydd med mjuk beröring för enhetens ovansida. Ett av dessa skydd är rött för att komplettera den AMD-baserade hårdvaran och trimfärgen.
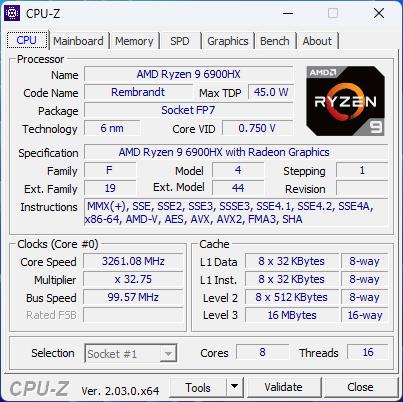
Prestanda - Zen 3+ uppgradering
Provningsförhållanden
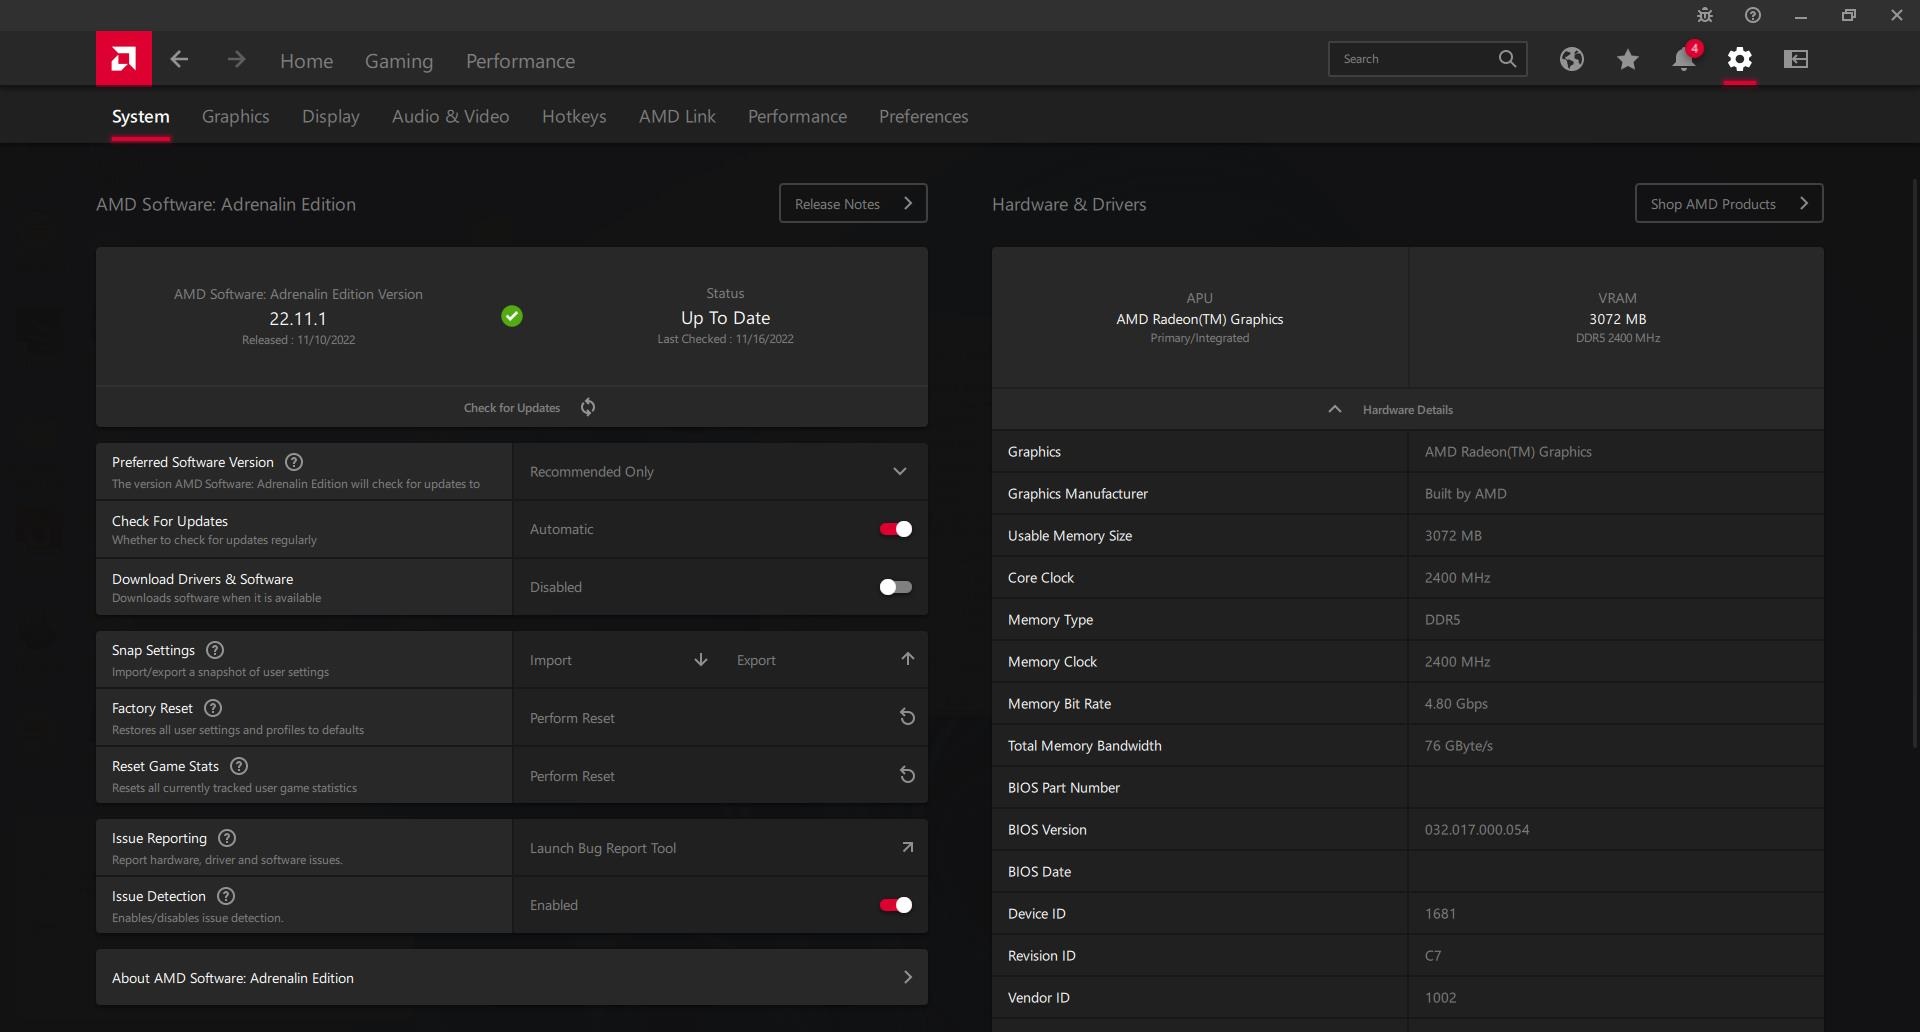
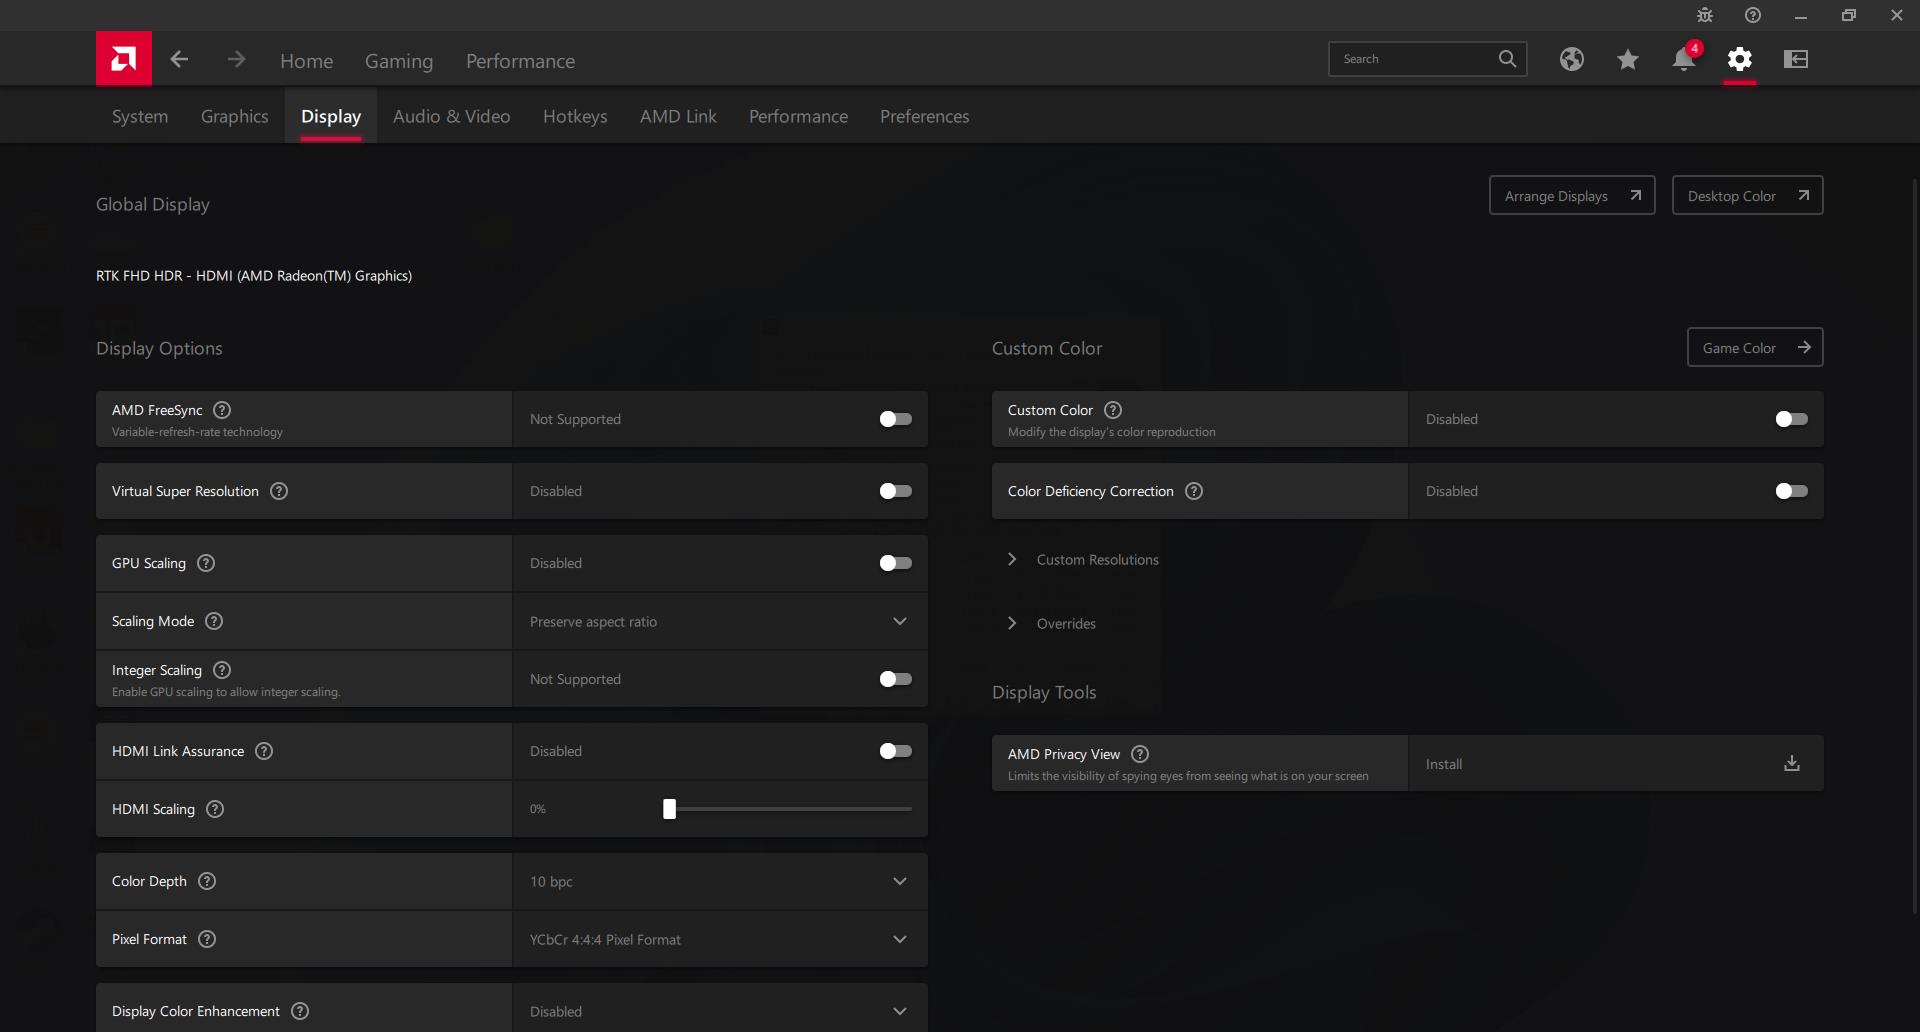
Vi ställde in vår enhet i prestandaläge via Windows innan vi körde alla benchmarks nedan. Beelink innehåller inga förinstallerade program för en ren Windows 11 Pro-upplevelse. Vi rekommenderar ändå att du installerar AMD Radeon-programvaran för ytterligare inställningar, vilket framgår av skärmdumparna nedan.
Processor
CPU-prestanda är tyvärr bara ett litet steg upp från den Ryzen 9 5900HX i bästa fall. Benchmarks visar identisk multitrådsprestanda med Ryzen 9 5900HX i Beelink GTR5 och bara något snabbare enkeltrådsprestanda med upp till 10 procent. Den genomsnittliga prestandan för flera trådar är ungefär 15 procent långsammare än på bärbara datorer med samma Ryzen 9 6900HX-processor som på Lenovo Legion S7 16. Trots detta är GTR6 fortfarande en av de snabbaste minidatorerna för storleken trots de små prestandabesvären.
Cinebench R15 Multi Loop
Cinebench R23: Multi Core | Single Core
Cinebench R15: CPU Multi 64Bit | CPU Single 64Bit
Blender: v2.79 BMW27 CPU
7-Zip 18.03: 7z b 4 | 7z b 4 -mmt1
Geekbench 5.5: Multi-Core | Single-Core
HWBOT x265 Benchmark v2.2: 4k Preset
LibreOffice : 20 Documents To PDF
R Benchmark 2.5: Overall mean
| Cinebench R20 / CPU (Multi Core) | |
| MSI GE67 HX 12UGS | |
| Schenker Vision 14 2022 RTX 3050 Ti | |
| Genomsnitt AMD Ryzen 9 6900HX (3742 - 5813, n=19) | |
| Beelink GTR6 | |
| Beelink GTR5 | |
| Alienware m15 R4 RTX 3080 | |
| Lenovo Legion C7 15IMH05 82EH0030GE | |
| Beelink SEi11 Pro | |
| Intel NUC11TNKi5 | |
| Intel NUC11PHKi7C | |
| GMK NucBox 2 | |
| Cinebench R20 / CPU (Single Core) | |
| Schenker Vision 14 2022 RTX 3050 Ti | |
| MSI GE67 HX 12UGS | |
| Beelink GTR6 | |
| Genomsnitt AMD Ryzen 9 6900HX (595 - 631, n=19) | |
| Intel NUC11PHKi7C | |
| Beelink GTR5 | |
| Beelink SEi11 Pro | |
| Intel NUC11TNKi5 | |
| Lenovo Legion C7 15IMH05 82EH0030GE | |
| Alienware m15 R4 RTX 3080 | |
| GMK NucBox 2 | |
| Cinebench R23 / Multi Core | |
| MSI GE67 HX 12UGS | |
| Schenker Vision 14 2022 RTX 3050 Ti | |
| Genomsnitt AMD Ryzen 9 6900HX (9709 - 15100, n=19) | |
| Beelink GTR6 | |
| Beelink GTR5 | |
| Alienware m15 R4 RTX 3080 | |
| Lenovo Legion C7 15IMH05 82EH0030GE | |
| Intel NUC11PHKi7C | |
| Beelink SEi11 Pro | |
| Intel NUC11TNKi5 | |
| GMK NucBox 2 | |
| Cinebench R23 / Single Core | |
| MSI GE67 HX 12UGS | |
| Schenker Vision 14 2022 RTX 3050 Ti | |
| Beelink GTR6 | |
| Genomsnitt AMD Ryzen 9 6900HX (1516 - 1616, n=19) | |
| Intel NUC11PHKi7C | |
| Beelink GTR5 | |
| Beelink SEi11 Pro | |
| Intel NUC11TNKi5 | |
| Lenovo Legion C7 15IMH05 82EH0030GE | |
| Alienware m15 R4 RTX 3080 | |
| GMK NucBox 2 | |
| Cinebench R15 / CPU Multi 64Bit | |
| MSI GE67 HX 12UGS | |
| Schenker Vision 14 2022 RTX 3050 Ti | |
| Genomsnitt AMD Ryzen 9 6900HX (1588 - 2411, n=19) | |
| Beelink GTR6 | |
| Beelink GTR5 | |
| Alienware m15 R4 RTX 3080 | |
| Lenovo Legion C7 15IMH05 82EH0030GE | |
| Intel NUC11PHKi7C | |
| Beelink SEi11 Pro | |
| Intel NUC11TNKi5 | |
| GMK NucBox 2 | |
| Cinebench R15 / CPU Single 64Bit | |
| Schenker Vision 14 2022 RTX 3050 Ti | |
| MSI GE67 HX 12UGS | |
| Beelink GTR6 | |
| Genomsnitt AMD Ryzen 9 6900HX (241 - 261, n=19) | |
| Beelink GTR5 | |
| Intel NUC11PHKi7C | |
| Beelink SEi11 Pro | |
| Lenovo Legion C7 15IMH05 82EH0030GE | |
| Intel NUC11TNKi5 | |
| Alienware m15 R4 RTX 3080 | |
| GMK NucBox 2 | |
| Blender / v2.79 BMW27 CPU | |
| GMK NucBox 2 | |
| Intel NUC11TNKi5 | |
| Intel NUC11PHKi7C | |
| Beelink SEi11 Pro | |
| Lenovo Legion C7 15IMH05 82EH0030GE | |
| Alienware m15 R4 RTX 3080 | |
| Beelink GTR5 | |
| Schenker Vision 14 2022 RTX 3050 Ti | |
| Beelink GTR6 | |
| Genomsnitt AMD Ryzen 9 6900HX (212 - 357, n=21) | |
| MSI GE67 HX 12UGS | |
| 7-Zip 18.03 / 7z b 4 | |
| MSI GE67 HX 12UGS | |
| Genomsnitt AMD Ryzen 9 6900HX (49526 - 65336, n=20) | |
| Beelink GTR6 | |
| Beelink GTR5 | |
| Schenker Vision 14 2022 RTX 3050 Ti | |
| Alienware m15 R4 RTX 3080 | |
| Lenovo Legion C7 15IMH05 82EH0030GE | |
| Beelink SEi11 Pro | |
| Intel NUC11PHKi7C | |
| Intel NUC11TNKi5 | |
| GMK NucBox 2 | |
| 7-Zip 18.03 / 7z b 4 -mmt1 | |
| Beelink GTR6 | |
| Schenker Vision 14 2022 RTX 3050 Ti | |
| Genomsnitt AMD Ryzen 9 6900HX (5090 - 6070, n=20) | |
| Beelink GTR5 | |
| MSI GE67 HX 12UGS | |
| Lenovo Legion C7 15IMH05 82EH0030GE | |
| Alienware m15 R4 RTX 3080 | |
| Intel NUC11PHKi7C | |
| Beelink SEi11 Pro | |
| Intel NUC11TNKi5 | |
| GMK NucBox 2 | |
| Geekbench 5.5 / Multi-Core | |
| MSI GE67 HX 12UGS | |
| Schenker Vision 14 2022 RTX 3050 Ti | |
| Genomsnitt AMD Ryzen 9 6900HX (8313 - 10490, n=21) | |
| Beelink GTR6 | |
| Lenovo Legion C7 15IMH05 82EH0030GE | |
| Beelink GTR5 | |
| Alienware m15 R4 RTX 3080 | |
| Intel NUC11PHKi7C | |
| Beelink SEi11 Pro | |
| Intel NUC11TNKi5 | |
| GMK NucBox 2 | |
| Geekbench 5.5 / Single-Core | |
| Schenker Vision 14 2022 RTX 3050 Ti | |
| MSI GE67 HX 12UGS | |
| Beelink GTR6 | |
| Genomsnitt AMD Ryzen 9 6900HX (1523 - 1652, n=21) | |
| Beelink GTR5 | |
| Intel NUC11PHKi7C | |
| Beelink SEi11 Pro | |
| Intel NUC11TNKi5 | |
| Lenovo Legion C7 15IMH05 82EH0030GE | |
| Alienware m15 R4 RTX 3080 | |
| GMK NucBox 2 | |
| HWBOT x265 Benchmark v2.2 / 4k Preset | |
| MSI GE67 HX 12UGS | |
| Genomsnitt AMD Ryzen 9 6900HX (12.6 - 18.7, n=20) | |
| Beelink GTR6 | |
| Beelink GTR5 | |
| Schenker Vision 14 2022 RTX 3050 Ti | |
| Alienware m15 R4 RTX 3080 | |
| Lenovo Legion C7 15IMH05 82EH0030GE | |
| Beelink SEi11 Pro | |
| Intel NUC11PHKi7C | |
| Intel NUC11TNKi5 | |
| GMK NucBox 2 | |
| LibreOffice / 20 Documents To PDF | |
| Alienware m15 R4 RTX 3080 | |
| GMK NucBox 2 | |
| Lenovo Legion C7 15IMH05 82EH0030GE | |
| Genomsnitt AMD Ryzen 9 6900HX (44.8 - 81.7, n=20) | |
| Intel NUC11TNKi5 | |
| Beelink GTR5 | |
| Beelink SEi11 Pro | |
| Intel NUC11PHKi7C | |
| Beelink GTR6 | |
| Schenker Vision 14 2022 RTX 3050 Ti | |
| MSI GE67 HX 12UGS | |
| R Benchmark 2.5 / Overall mean | |
| GMK NucBox 2 | |
| Intel NUC11TNKi5 | |
| Alienware m15 R4 RTX 3080 | |
| Lenovo Legion C7 15IMH05 82EH0030GE | |
| Beelink SEi11 Pro | |
| Intel NUC11PHKi7C | |
| Genomsnitt AMD Ryzen 9 6900HX (0.4627 - 0.4974, n=20) | |
| Beelink GTR5 | |
| Beelink GTR6 | |
| MSI GE67 HX 12UGS | |
| Schenker Vision 14 2022 RTX 3050 Ti | |
* ... mindre är bättre
AIDA64: FP32 Ray-Trace | FPU Julia | CPU SHA3 | CPU Queen | FPU SinJulia | FPU Mandel | CPU AES | CPU ZLib | FP64 Ray-Trace | CPU PhotoWorxx
| Performance rating | |
| Genomsnitt AMD Ryzen 9 6900HX | |
| Beelink GTR6 | |
| Beelink GTR5 | |
| Intel NUC11PHKi7C | |
| Beelink SEi11 Pro | |
| Intel NUC11TNKi5 | |
| GMK NucBox 2 | |
| AIDA64 / FP32 Ray-Trace | |
| Genomsnitt AMD Ryzen 9 6900HX (10950 - 17963, n=20) | |
| Beelink GTR5 | |
| Beelink GTR6 | |
| Intel NUC11PHKi7C | |
| Beelink SEi11 Pro | |
| Intel NUC11TNKi5 | |
| GMK NucBox 2 | |
| AIDA64 / FPU Julia | |
| Genomsnitt AMD Ryzen 9 6900HX (71414 - 110797, n=20) | |
| Beelink GTR5 | |
| Beelink GTR6 | |
| Intel NUC11PHKi7C | |
| Beelink SEi11 Pro | |
| Intel NUC11TNKi5 | |
| GMK NucBox 2 | |
| AIDA64 / CPU SHA3 | |
| Genomsnitt AMD Ryzen 9 6900HX (2471 - 3804, n=20) | |
| Beelink GTR6 | |
| Beelink GTR5 | |
| Intel NUC11PHKi7C | |
| Beelink SEi11 Pro | |
| Intel NUC11TNKi5 | |
| GMK NucBox 2 | |
| AIDA64 / CPU Queen | |
| Genomsnitt AMD Ryzen 9 6900HX (84185 - 107544, n=20) | |
| Beelink GTR5 | |
| Beelink GTR6 | |
| Intel NUC11PHKi7C | |
| Beelink SEi11 Pro | |
| Intel NUC11TNKi5 | |
| GMK NucBox 2 | |
| AIDA64 / FPU SinJulia | |
| Genomsnitt AMD Ryzen 9 6900HX (10970 - 13205, n=20) | |
| Beelink GTR5 | |
| Beelink GTR6 | |
| Intel NUC11PHKi7C | |
| Beelink SEi11 Pro | |
| Intel NUC11TNKi5 | |
| GMK NucBox 2 | |
| AIDA64 / FPU Mandel | |
| Genomsnitt AMD Ryzen 9 6900HX (39164 - 61370, n=20) | |
| Beelink GTR5 | |
| Beelink GTR6 | |
| Intel NUC11PHKi7C | |
| Beelink SEi11 Pro | |
| Intel NUC11TNKi5 | |
| GMK NucBox 2 | |
| AIDA64 / CPU AES | |
| Beelink GTR6 | |
| Beelink GTR5 | |
| Genomsnitt AMD Ryzen 9 6900HX (54613 - 142360, n=20) | |
| Intel NUC11PHKi7C | |
| Beelink SEi11 Pro | |
| Intel NUC11TNKi5 | |
| GMK NucBox 2 | |
| AIDA64 / CPU ZLib | |
| Genomsnitt AMD Ryzen 9 6900HX (578 - 911, n=20) | |
| Beelink GTR5 | |
| Beelink GTR6 | |
| Intel NUC11PHKi7C | |
| Intel NUC11TNKi5 | |
| Beelink SEi11 Pro | |
| GMK NucBox 2 | |
| AIDA64 / FP64 Ray-Trace | |
| Genomsnitt AMD Ryzen 9 6900HX (5798 - 9540, n=20) | |
| Beelink GTR5 | |
| Beelink GTR6 | |
| Intel NUC11PHKi7C | |
| Beelink SEi11 Pro | |
| Intel NUC11TNKi5 | |
| GMK NucBox 2 | |
| AIDA64 / CPU PhotoWorxx | |
| Beelink GTR6 | |
| Genomsnitt AMD Ryzen 9 6900HX (26873 - 30604, n=20) | |
| Intel NUC11PHKi7C | |
| Beelink SEi11 Pro | |
| Beelink GTR5 | |
| Intel NUC11TNKi5 | |
| GMK NucBox 2 | |
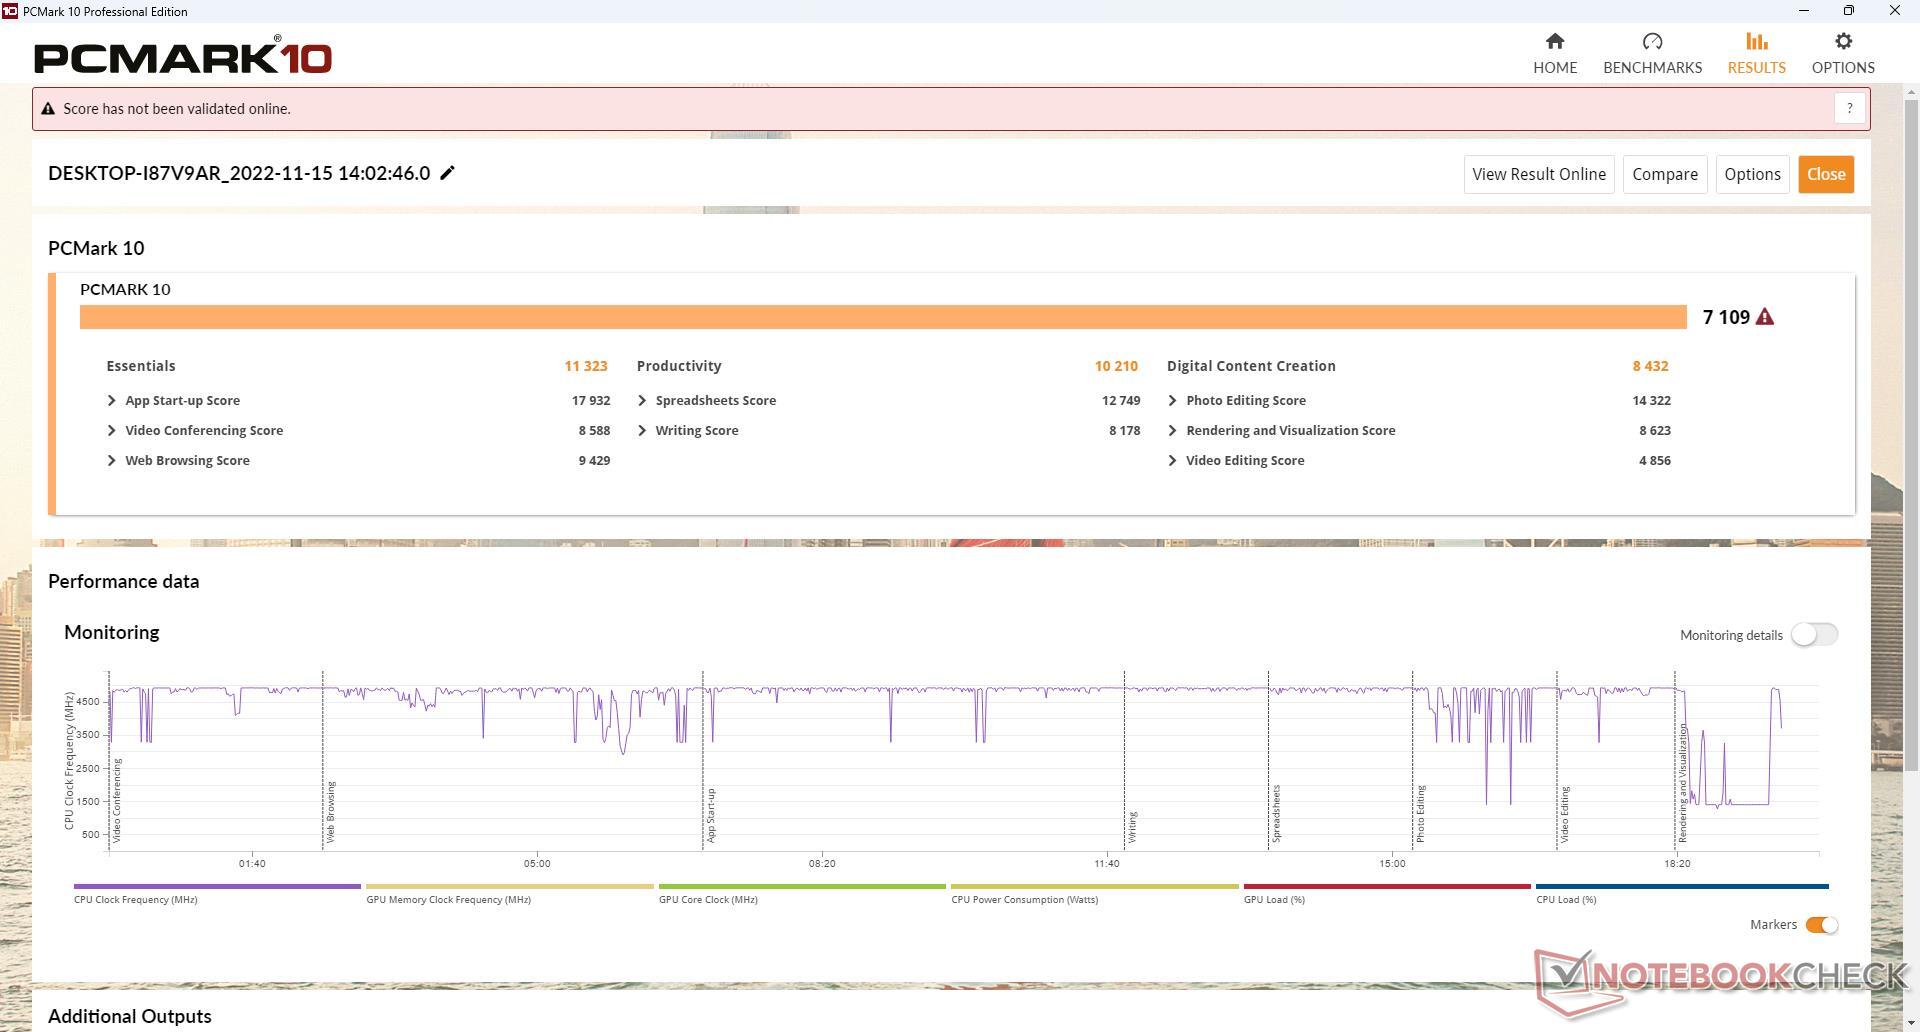
Systemets prestanda
PCMark 10-resultaten är genomgående högre än förra årets GTR5 särskilt i deltestet Digital Content Creation där grafikprestanda är viktigast.
CrossMark: Overall | Productivity | Creativity | Responsiveness
| PCMark 10 / Score | |
| Beelink GTR6 | |
| Genomsnitt AMD Ryzen 9 6900HX, AMD Radeon 680M (6251 - 7109, n=7) | |
| Beelink GTR5 | |
| Intel NUC11PHKi7C | |
| Beelink SEi11 Pro | |
| Intel NUC11TNKi5 | |
| GMK NucBox 2 | |
| PCMark 10 / Essentials | |
| Beelink GTR6 | |
| Beelink GTR5 | |
| Genomsnitt AMD Ryzen 9 6900HX, AMD Radeon 680M (10029 - 11323, n=7) | |
| Beelink SEi11 Pro | |
| Intel NUC11PHKi7C | |
| Intel NUC11TNKi5 | |
| GMK NucBox 2 | |
| PCMark 10 / Productivity | |
| Beelink GTR6 | |
| Beelink GTR5 | |
| Genomsnitt AMD Ryzen 9 6900HX, AMD Radeon 680M (9550 - 10210, n=7) | |
| Intel NUC11PHKi7C | |
| Beelink SEi11 Pro | |
| GMK NucBox 2 | |
| Intel NUC11TNKi5 | |
| PCMark 10 / Digital Content Creation | |
| Beelink GTR6 | |
| Genomsnitt AMD Ryzen 9 6900HX, AMD Radeon 680M (6920 - 8703, n=7) | |
| Beelink GTR5 | |
| Intel NUC11PHKi7C | |
| Beelink SEi11 Pro | |
| Intel NUC11TNKi5 | |
| GMK NucBox 2 | |
| CrossMark / Overall | |
| Beelink GTR6 | |
| Genomsnitt AMD Ryzen 9 6900HX, AMD Radeon 680M (1476 - 1731, n=7) | |
| Beelink GTR5 | |
| Beelink SEi11 Pro | |
| CrossMark / Productivity | |
| Beelink GTR6 | |
| Genomsnitt AMD Ryzen 9 6900HX, AMD Radeon 680M (1451 - 1738, n=7) | |
| Beelink GTR5 | |
| Beelink SEi11 Pro | |
| CrossMark / Creativity | |
| Beelink GTR6 | |
| Genomsnitt AMD Ryzen 9 6900HX, AMD Radeon 680M (1632 - 1745, n=7) | |
| Beelink GTR5 | |
| Beelink SEi11 Pro | |
| CrossMark / Responsiveness | |
| Beelink GTR6 | |
| Genomsnitt AMD Ryzen 9 6900HX, AMD Radeon 680M (1060 - 1671, n=7) | |
| Beelink SEi11 Pro | |
| Beelink GTR5 | |
| PCMark 10 Score | 7109 poäng | |
Hjälp | ||
| AIDA64 / Memory Copy | |
| Beelink GTR6 | |
| Genomsnitt AMD Ryzen 9 6900HX (47938 - 53345, n=20) | |
| GMK NucBox 2 | |
| Beelink GTR5 | |
| Beelink SEi11 Pro | |
| Intel NUC11PHKi7C | |
| Intel NUC11TNKi5 | |
| AIDA64 / Memory Read | |
| Beelink GTR6 | |
| Genomsnitt AMD Ryzen 9 6900HX (43892 - 53321, n=20) | |
| Beelink GTR5 | |
| Beelink SEi11 Pro | |
| Intel NUC11PHKi7C | |
| GMK NucBox 2 | |
| Intel NUC11TNKi5 | |
| AIDA64 / Memory Write | |
| Beelink GTR6 | |
| Genomsnitt AMD Ryzen 9 6900HX (51085 - 57202, n=20) | |
| GMK NucBox 2 | |
| Beelink SEi11 Pro | |
| Beelink GTR5 | |
| Intel NUC11PHKi7C | |
| Intel NUC11TNKi5 | |
| AIDA64 / Memory Latency | |
| Intel NUC11PHKi7C | |
| Genomsnitt AMD Ryzen 9 6900HX (80.7 - 120.6, n=20) | |
| Intel NUC11TNKi5 | |
| Beelink GTR6 | |
| Beelink SEi11 Pro | |
| Beelink GTR5 | |
| GMK NucBox 2 | |
* ... mindre är bättre
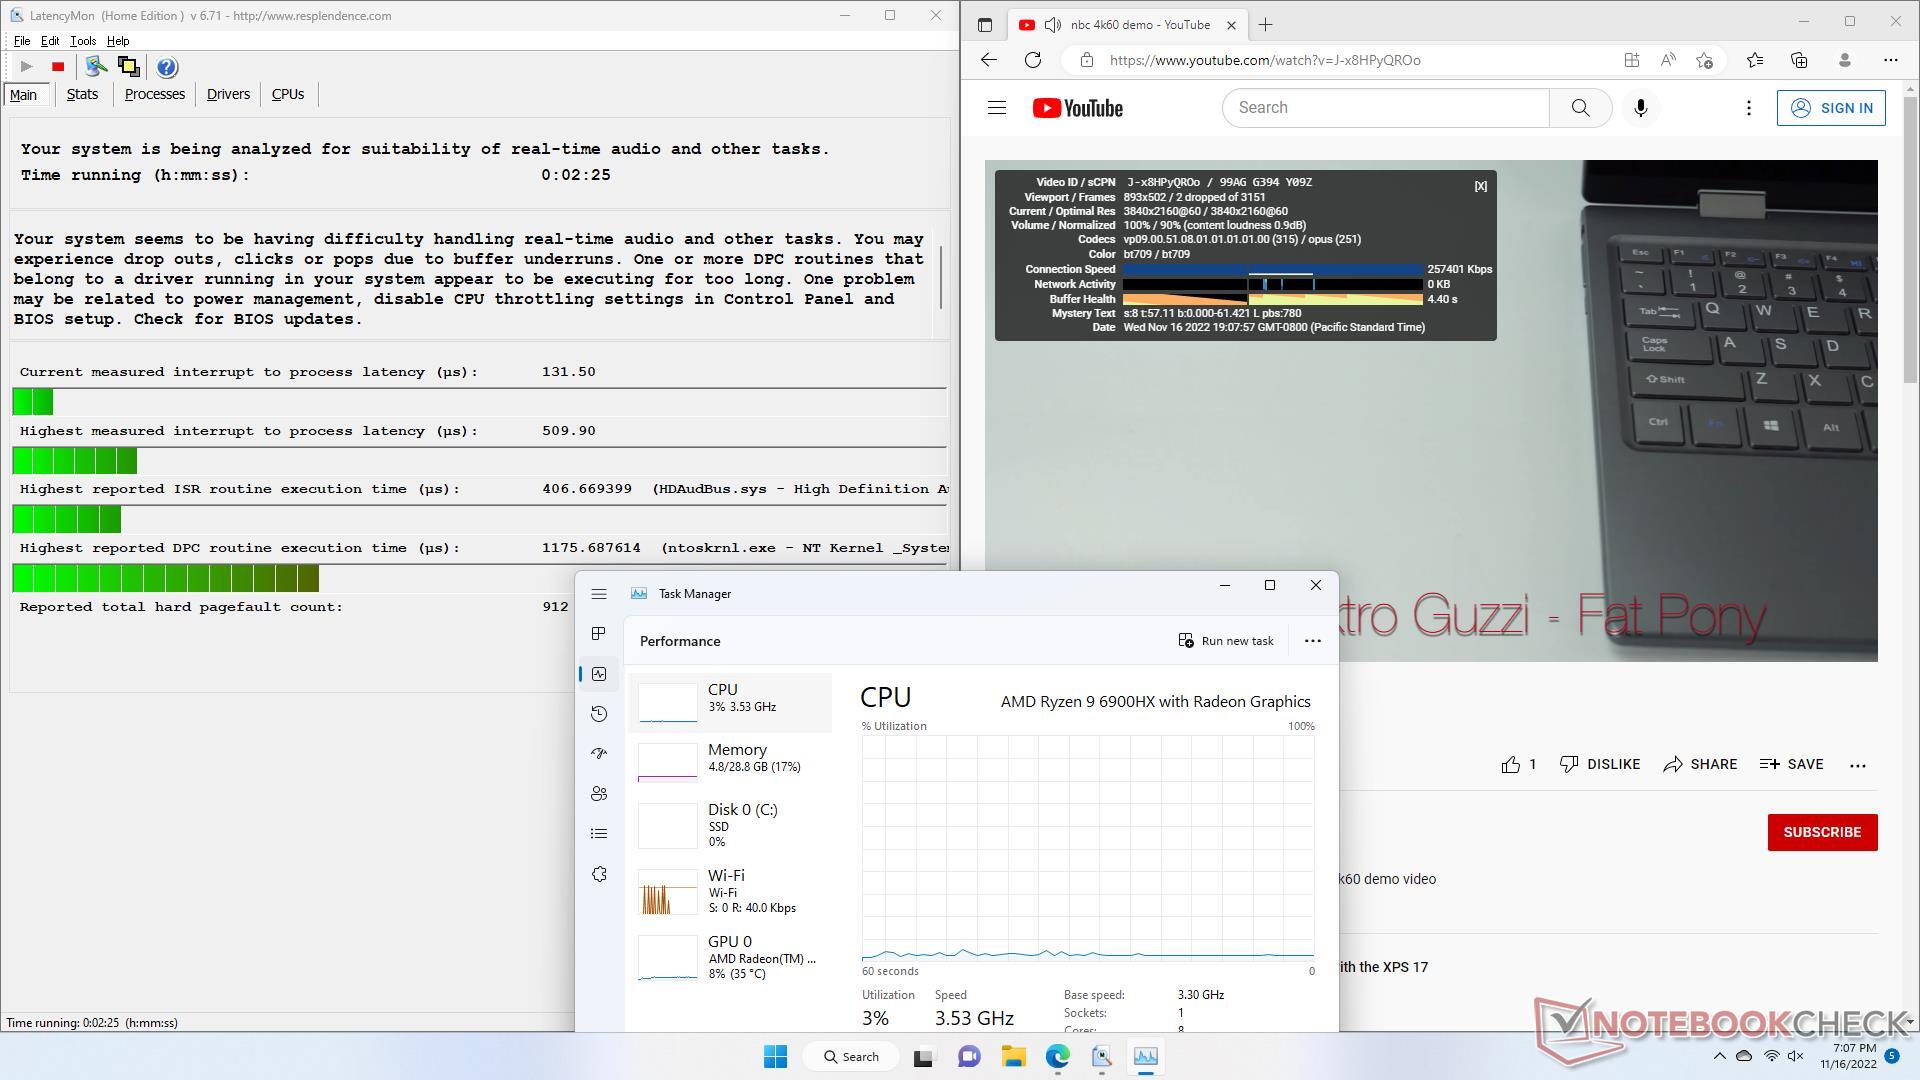
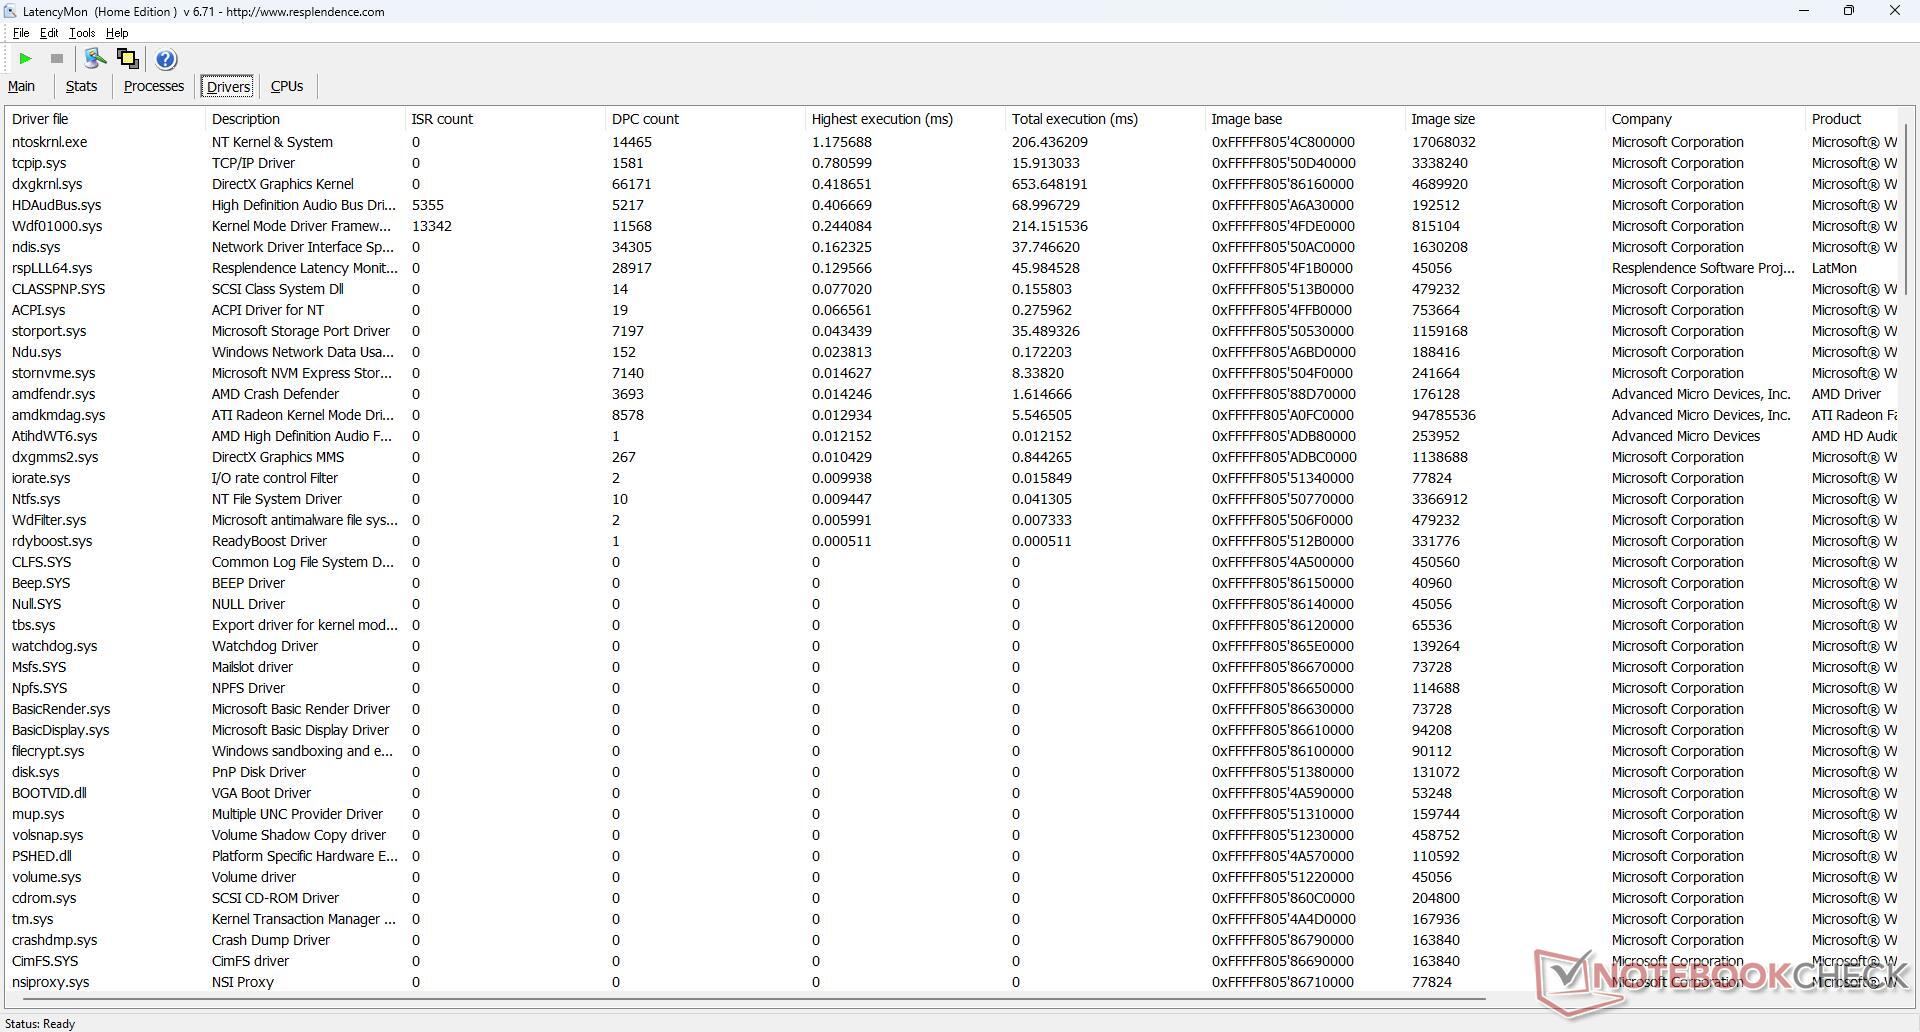
DPC-latenstid
Det finns mindre DPC-problem när man öppnar flera webbläsarflikar på vår hemsida. uppspelning av 4K-video vid 60 FPS är annars utmärkt med bara 2 tappade bilder under vår minutlånga testvideo. Processorutnyttjandet är mycket lågt i förhållande till datorer som drivs av långsammare CPU:er i U-serien.
| DPC Latencies / LatencyMon - interrupt to process latency (max), Web, Youtube, Prime95 | |
| Intel NUC11PHKi7C | |
| GMK NucBox 2 | |
| Intel NUC11TNKi5 | |
| Beelink GTR6 | |
| Beelink SEi11 Pro | |
| Beelink GTR5 | |
* ... mindre är bättre
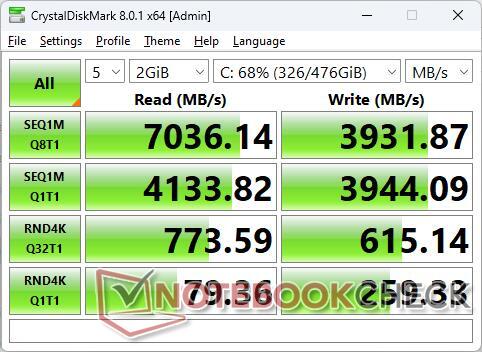
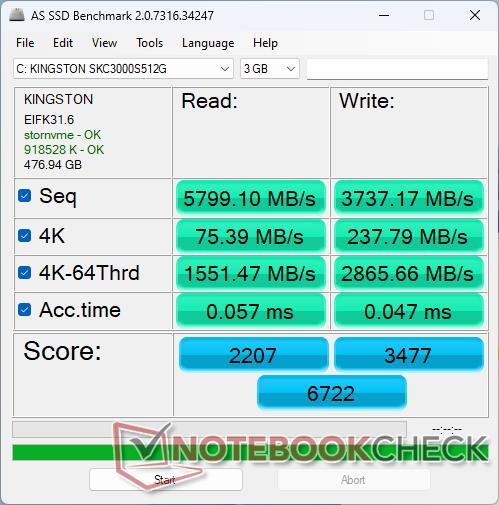
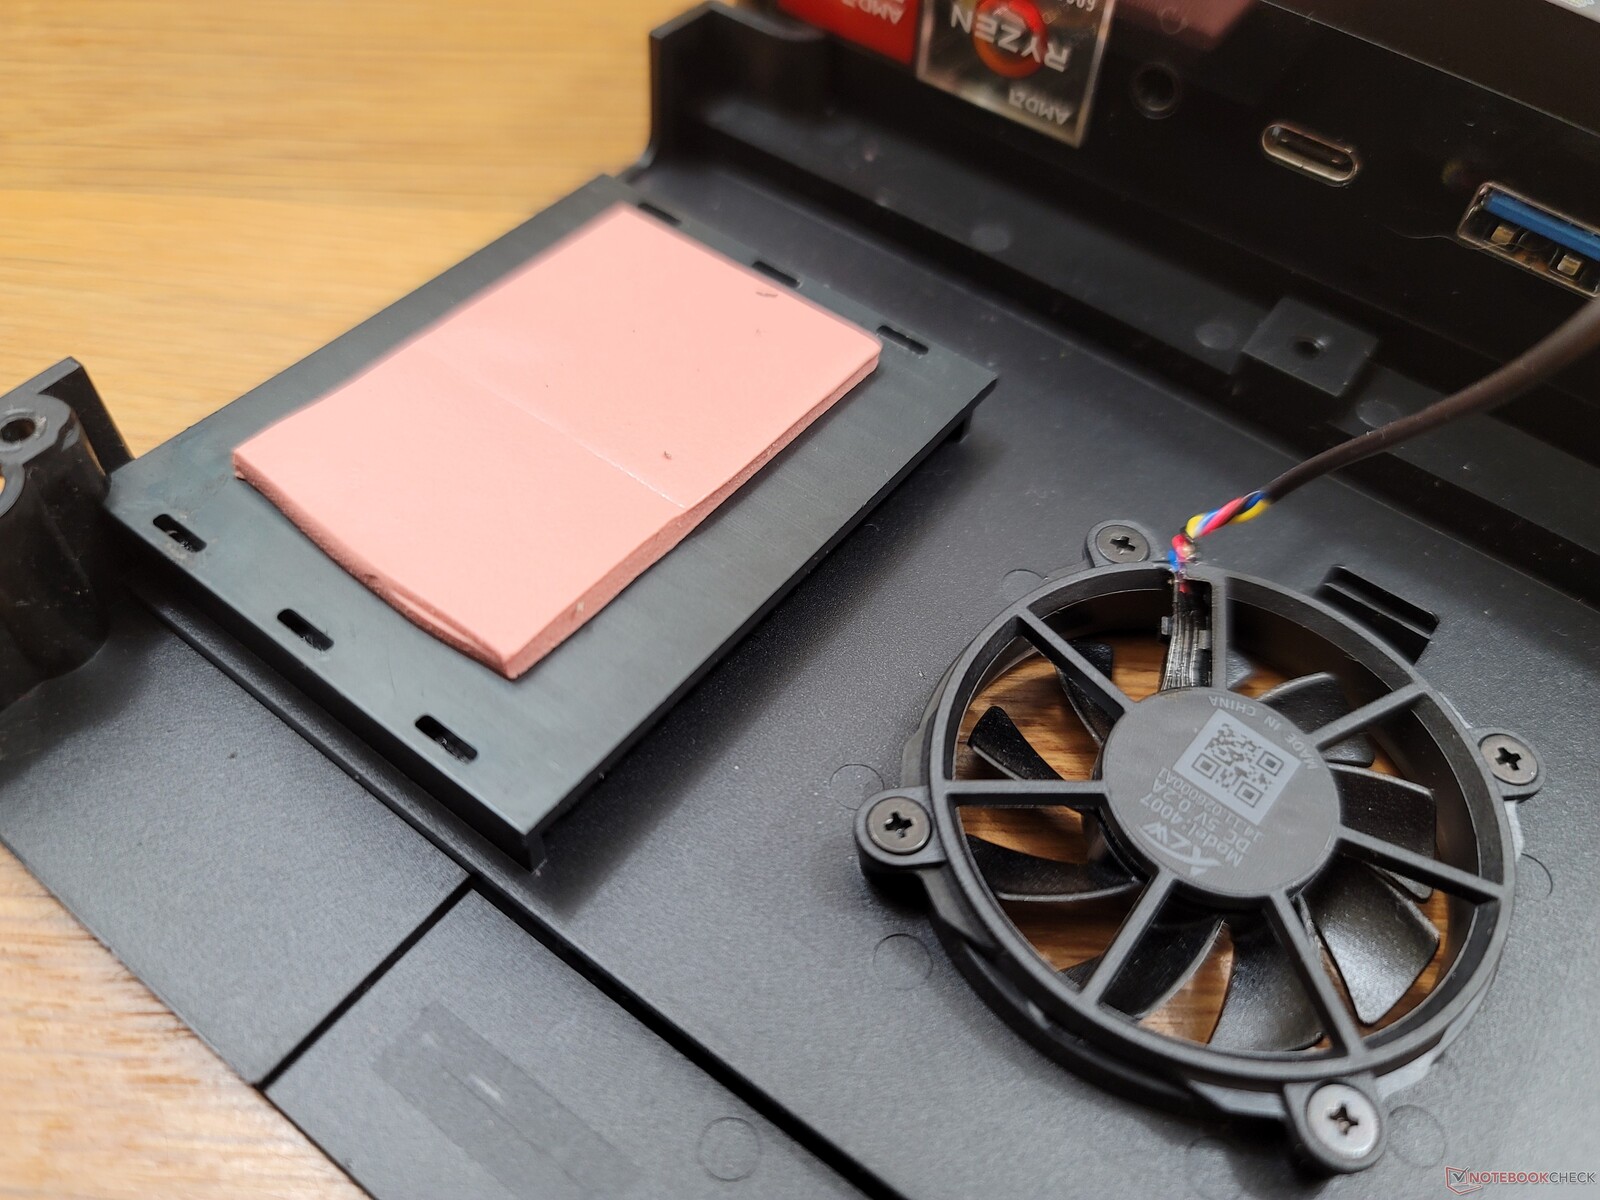
Lagringsenheter - SSD-kylning ingår
Vår enhet levereras med en 512 GB Kingston KC3000 PCIe4 x4 NVMe SSD som erbjuder sekventiell läs- och skrivhastighet på upp till 7000 MB/s respektive 4000 MB/s. Enheten uppvisar inga problem med att upprätthålla maximala överföringshastigheter under längre perioder eftersom en dedikerad kylfläns för SSD-enheten och en värmekudde är förinstallerade.

| Drive Performance rating - Percent | |
| Beelink GTR6 | |
| Intel NUC11PHKi7C | |
| Beelink SEi11 Pro | |
| Beelink GTR5 | |
| GMK NucBox 2 | |
| Intel NUC11TNKi5 | |
| DiskSpd | |
| seq read | |
| Beelink GTR6 | |
| Intel NUC11PHKi7C | |
| Beelink GTR5 | |
| Beelink SEi11 Pro | |
| GMK NucBox 2 | |
| Intel NUC11TNKi5 | |
| seq write | |
| Beelink GTR6 | |
| Intel NUC11PHKi7C | |
| Beelink GTR5 | |
| Beelink SEi11 Pro | |
| GMK NucBox 2 | |
| Intel NUC11TNKi5 | |
| seq q8 t1 read | |
| Beelink GTR6 | |
| Intel NUC11PHKi7C | |
| Beelink GTR5 | |
| Beelink SEi11 Pro | |
| GMK NucBox 2 | |
| Intel NUC11TNKi5 | |
| seq q8 t1 write | |
| Beelink GTR6 | |
| Intel NUC11PHKi7C | |
| Beelink GTR5 | |
| Beelink SEi11 Pro | |
| GMK NucBox 2 | |
| Intel NUC11TNKi5 | |
| 4k q1 t1 read | |
| Beelink GTR6 | |
| Beelink GTR5 | |
| Beelink SEi11 Pro | |
| Intel NUC11PHKi7C | |
| GMK NucBox 2 | |
| Intel NUC11TNKi5 | |
| 4k q1 t1 write | |
| Beelink GTR6 | |
| Beelink GTR5 | |
| Beelink SEi11 Pro | |
| GMK NucBox 2 | |
| Intel NUC11PHKi7C | |
| Intel NUC11TNKi5 | |
| 4k q32 t16 read | |
| Beelink GTR6 | |
| Intel NUC11PHKi7C | |
| Beelink GTR5 | |
| Beelink SEi11 Pro | |
| GMK NucBox 2 | |
| Intel NUC11TNKi5 | |
| 4k q32 t16 write | |
| Beelink GTR6 | |
| Beelink GTR5 | |
| GMK NucBox 2 | |
| Beelink SEi11 Pro | |
| Intel NUC11PHKi7C | |
| Intel NUC11TNKi5 | |
| AS SSD | |
| Score Total | |
| Beelink GTR6 | |
| Intel NUC11PHKi7C | |
| Beelink SEi11 Pro | |
| Beelink GTR5 | |
| GMK NucBox 2 | |
| Intel NUC11TNKi5 | |
| Score Read | |
| Beelink GTR6 | |
| Intel NUC11PHKi7C | |
| Beelink SEi11 Pro | |
| Beelink GTR5 | |
| GMK NucBox 2 | |
| Intel NUC11TNKi5 | |
| Score Write | |
| Beelink GTR6 | |
| Intel NUC11PHKi7C | |
| Beelink SEi11 Pro | |
| Beelink GTR5 | |
| GMK NucBox 2 | |
| Intel NUC11TNKi5 | |
| Seq Read | |
| Beelink GTR6 | |
| Intel NUC11PHKi7C | |
| Beelink GTR5 | |
| Beelink SEi11 Pro | |
| GMK NucBox 2 | |
| Intel NUC11TNKi5 | |
| Seq Write | |
| Beelink GTR6 | |
| Beelink SEi11 Pro | |
| Beelink GTR5 | |
| Intel NUC11PHKi7C | |
| GMK NucBox 2 | |
| Intel NUC11TNKi5 | |
| 4K Read | |
| Beelink GTR6 | |
| Beelink SEi11 Pro | |
| Beelink GTR5 | |
| GMK NucBox 2 | |
| Intel NUC11PHKi7C | |
| Intel NUC11TNKi5 | |
| 4K Write | |
| Beelink GTR6 | |
| Beelink SEi11 Pro | |
| Beelink GTR5 | |
| GMK NucBox 2 | |
| Intel NUC11PHKi7C | |
| Intel NUC11TNKi5 | |
| 4K-64 Read | |
| Beelink GTR6 | |
| Intel NUC11PHKi7C | |
| Beelink SEi11 Pro | |
| Beelink GTR5 | |
| GMK NucBox 2 | |
| Intel NUC11TNKi5 | |
| 4K-64 Write | |
| Beelink GTR6 | |
| Intel NUC11PHKi7C | |
| Beelink SEi11 Pro | |
| Beelink GTR5 | |
| GMK NucBox 2 | |
| Intel NUC11TNKi5 | |
| Access Time Read | |
| Intel NUC11TNKi5 | |
| Intel NUC11PHKi7C | |
| GMK NucBox 2 | |
| Beelink GTR6 | |
| Beelink GTR5 | |
| Beelink SEi11 Pro | |
| Access Time Write | |
| GMK NucBox 2 | |
| Beelink SEi11 Pro | |
| Beelink GTR5 | |
| Intel NUC11TNKi5 | |
| Intel NUC11PHKi7C | |
| Beelink GTR6 | |
* ... mindre är bättre
Disk Throttling: DiskSpd Read Loop, Queue Depth 8
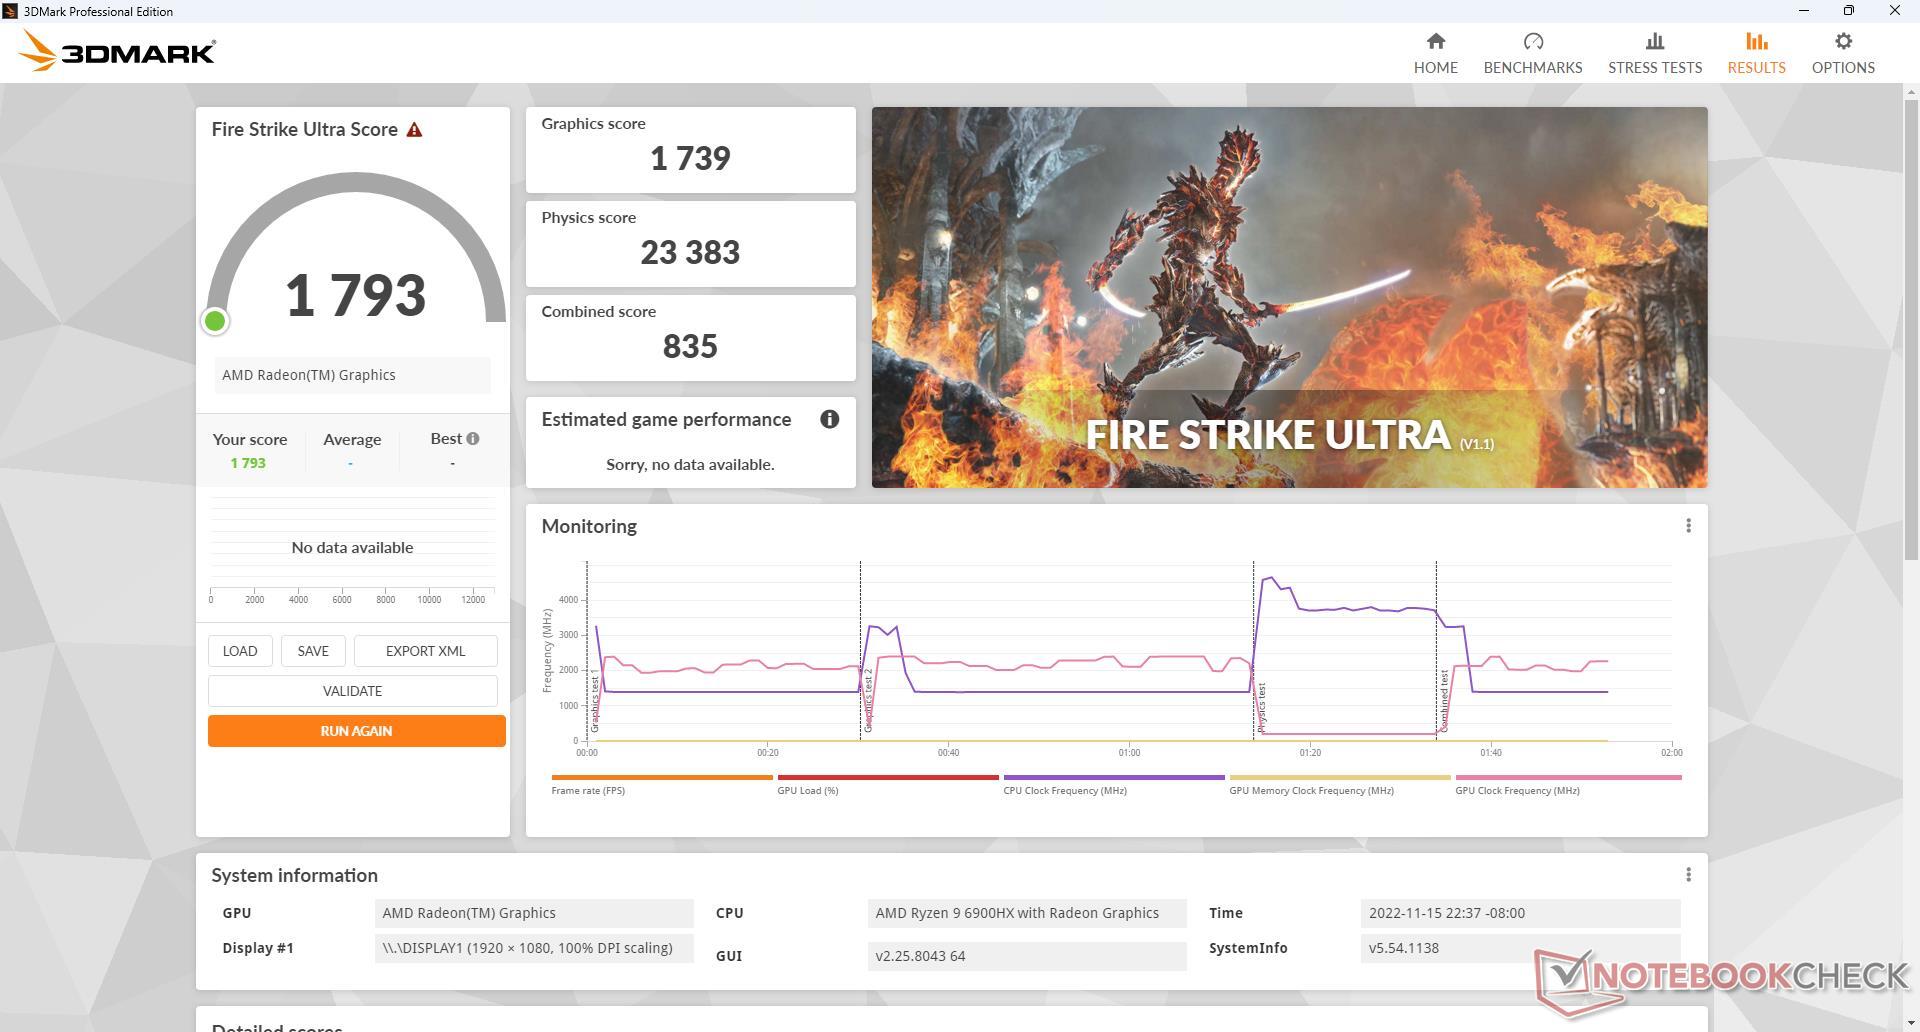
GPU-prestanda - Snabbaste integrerade grafik
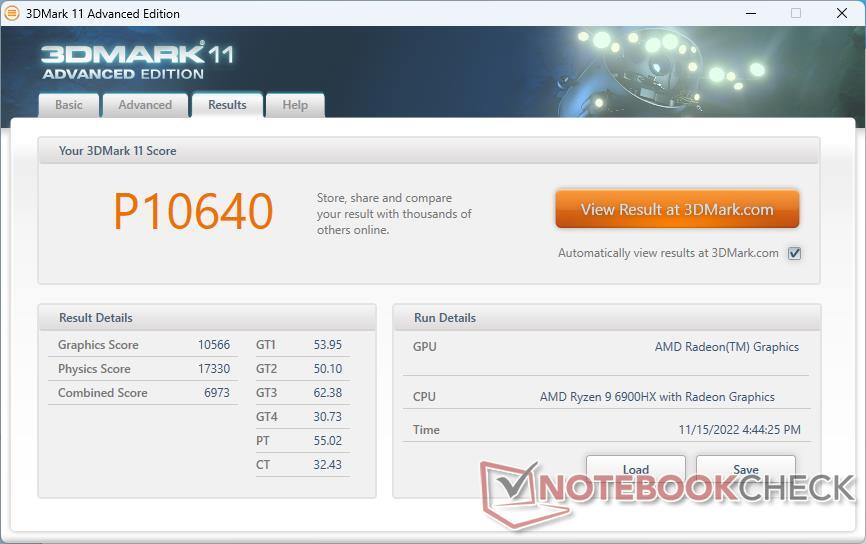
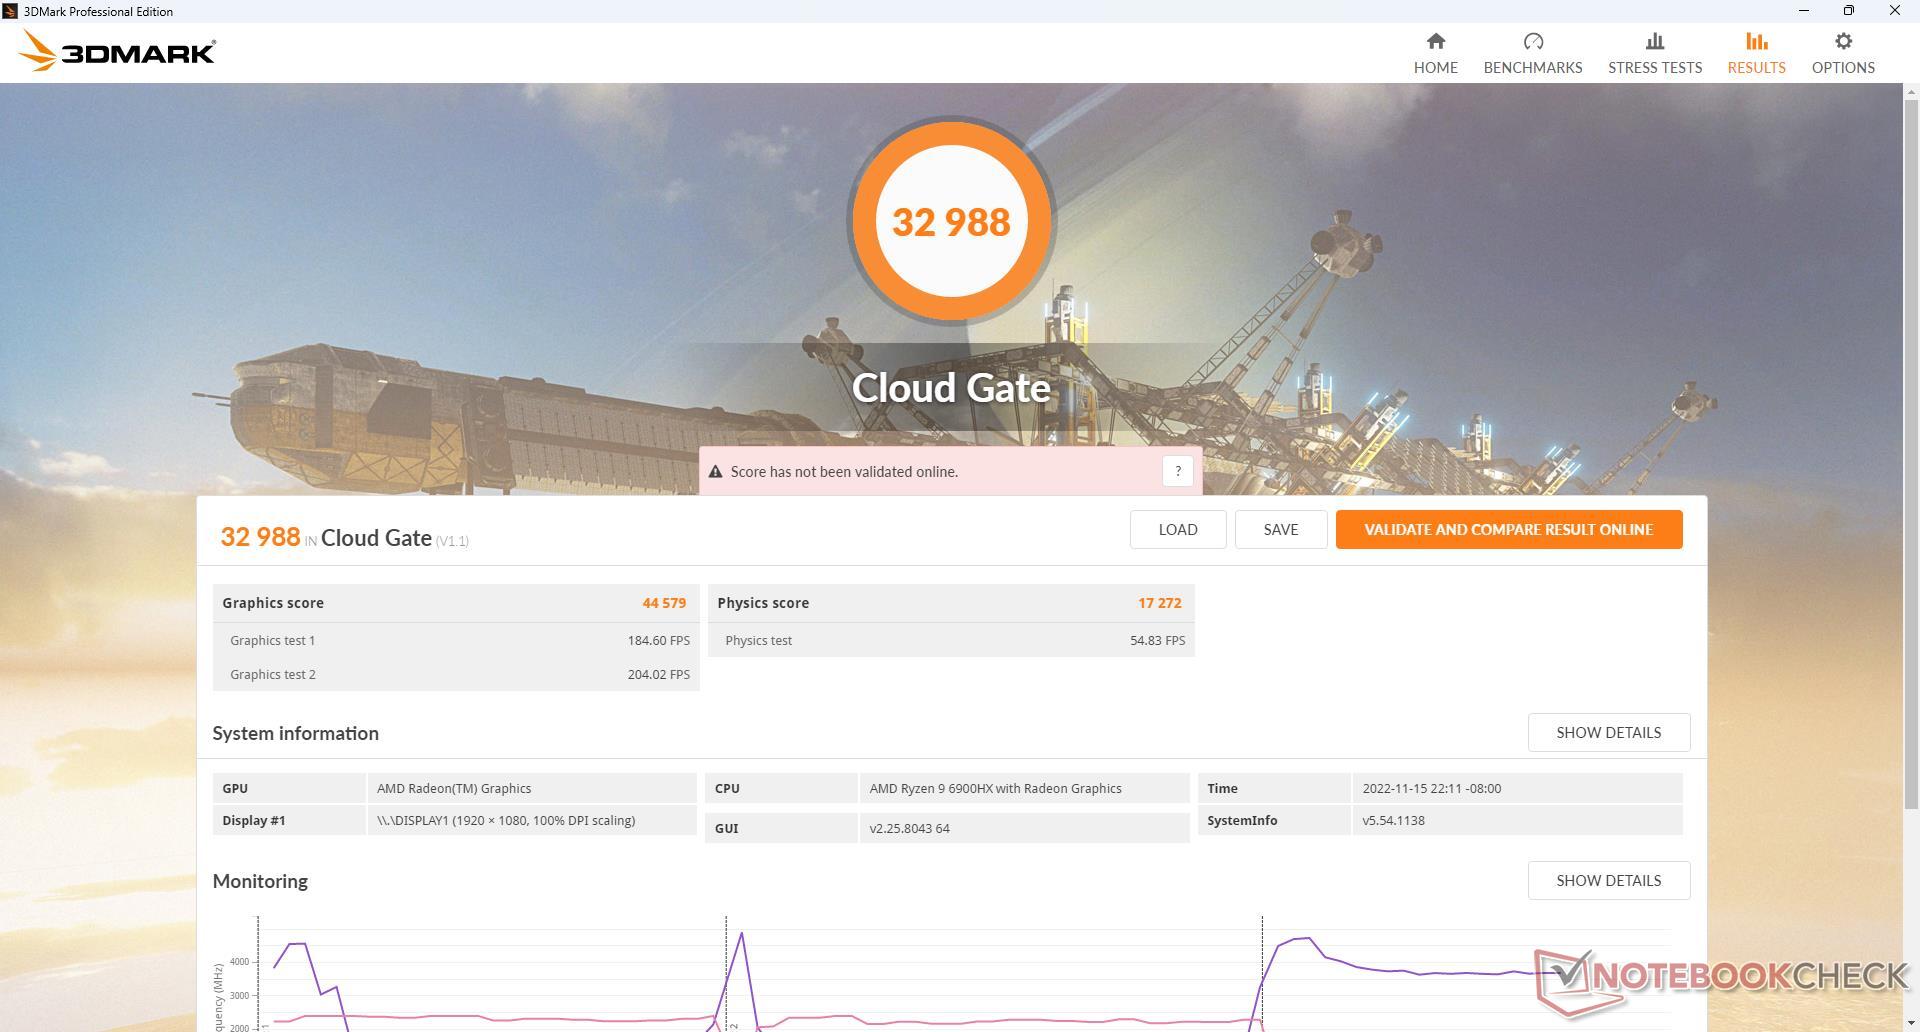
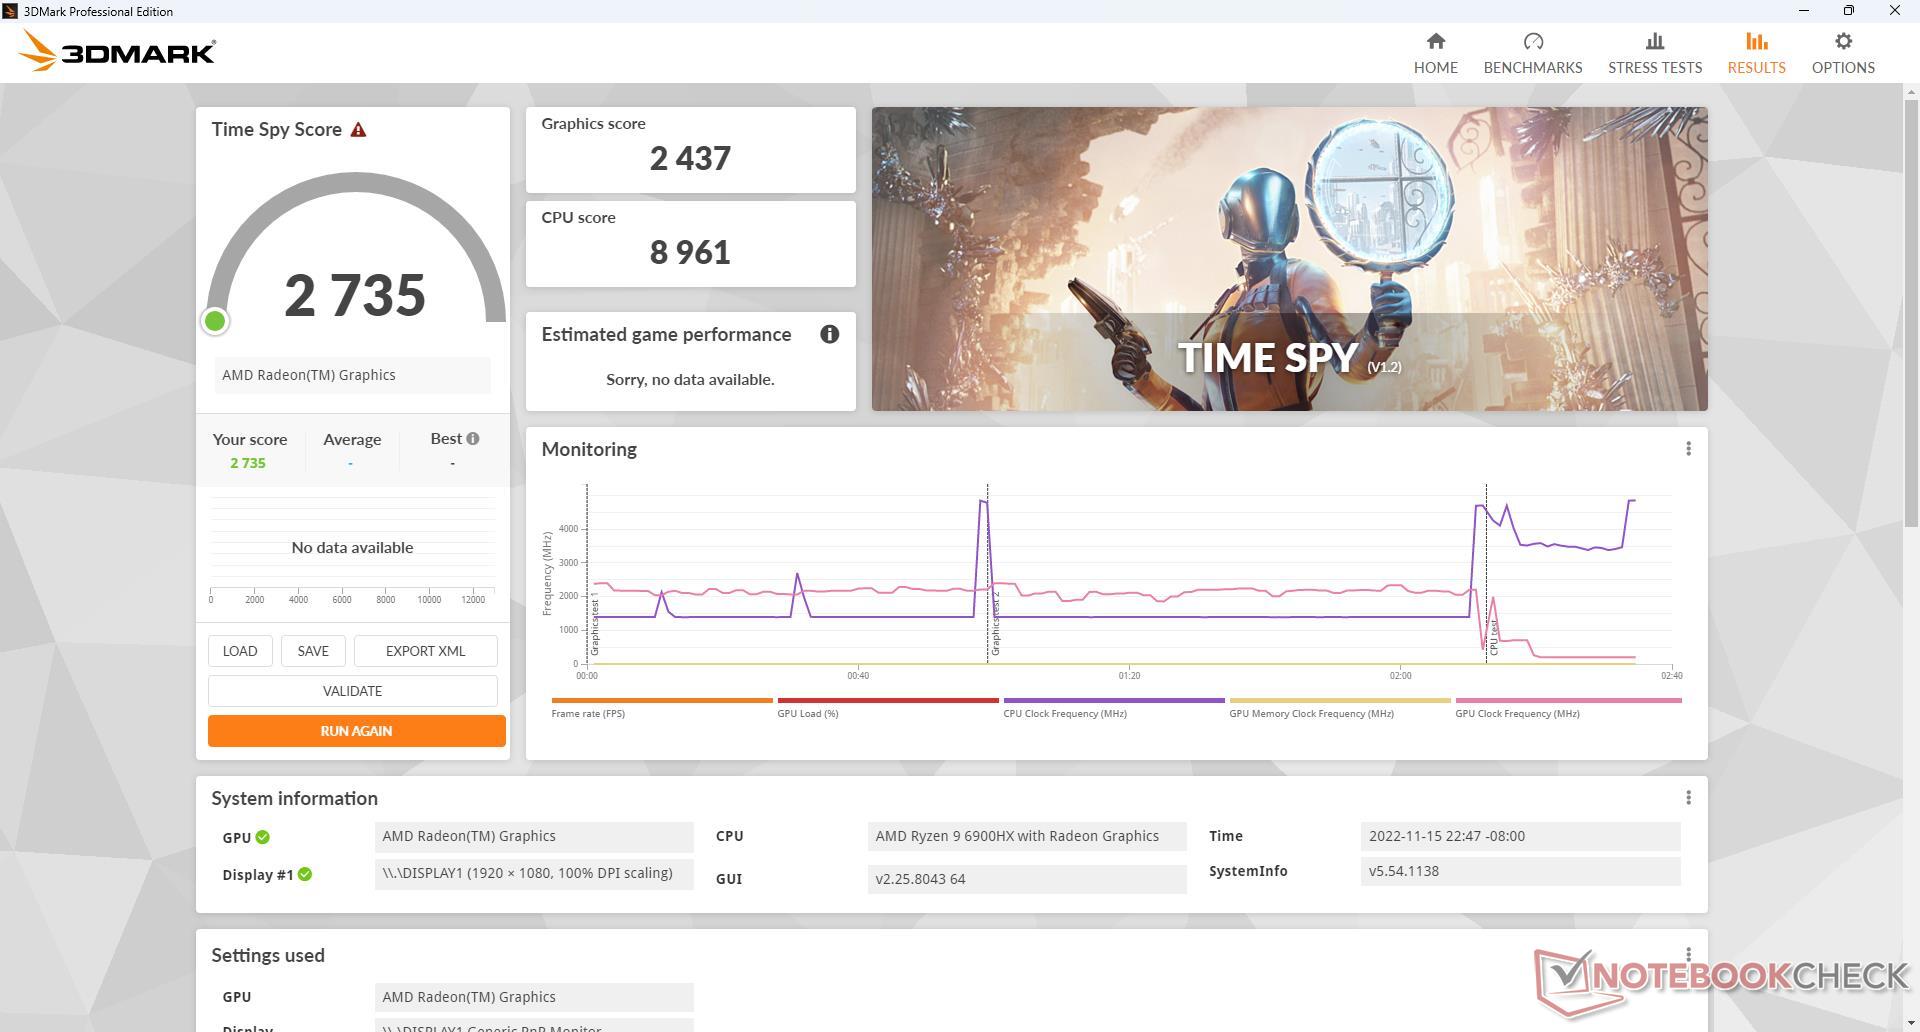
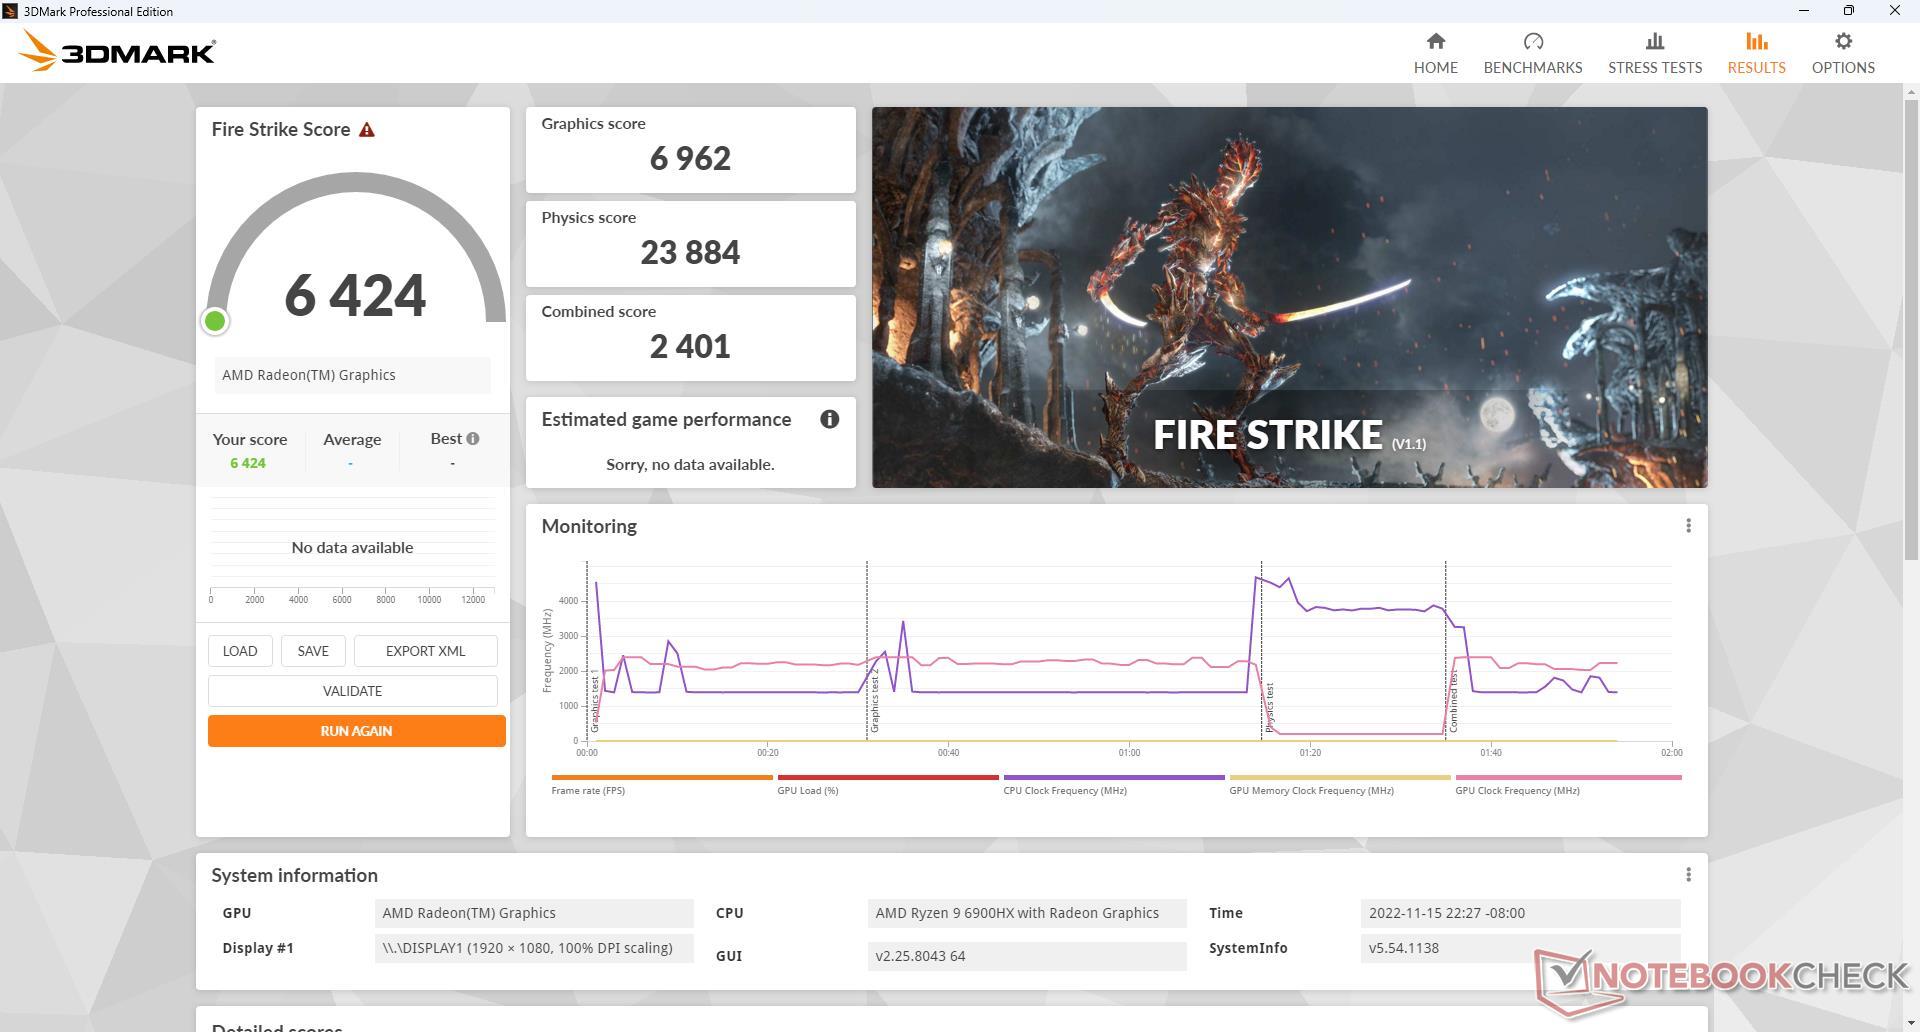
Radeon 680M fortsätter att imponera med resultat som är ungefär 60 procent snabbare än den utgående Radeon RX Vega 8 i den senaste generationen Ryzen 9 5900HX. Detta placerar den nya integrerade AMD GPU:n långt före alla Intel Iris Xe 96 EUs-lösningar med 50 procent eller mer. Dedikerade GPU:er i lågprissegmentet som GeForce GTX 1060 eller GTX 1650 är fortfarande mycket snabbare, men 680M är ändå imponerande för en integrerad GPU. De flesta titlar är spelbara på låga till låg-medelhöga inställningar i 1080p-upplösning, inklusive till och med Cyberpunk 2077.
| 3DMark | |
| 1920x1080 Fire Strike Graphics | |
| Intel NUC11PHKi7C | |
| Desktop PC Intel Xeon E5 2680v4 KFA2 GTX 1060 6GB | |
| KFA2 GeForce GTX 1650 EX One Click Plus | |
| Beelink GTR6 | |
| Genomsnitt AMD Radeon 680M (3791 - 7706, n=41) | |
| Beelink SEi11 Pro | |
| Beelink GTR5 | |
| Intel NUC11TNKi5 | |
| GMK NucBox 2 | |
| 2560x1440 Time Spy Graphics | |
| Intel NUC11PHKi7C | |
| Desktop PC Intel Xeon E5 2680v4 KFA2 GTX 1060 6GB | |
| KFA2 GeForce GTX 1650 EX One Click Plus | |
| Beelink GTR6 | |
| Genomsnitt AMD Radeon 680M (1359 - 2607, n=41) | |
| Beelink SEi11 Pro | |
| Beelink GTR5 | |
| Intel NUC11TNKi5 | |
| GMK NucBox 2 | |
| 2560x1440 Time Spy Score | |
| Intel NUC11PHKi7C | |
| Desktop PC Intel Xeon E5 2680v4 KFA2 GTX 1060 6GB | |
| KFA2 GeForce GTX 1650 EX One Click Plus | |
| Beelink GTR6 | |
| Genomsnitt AMD Radeon 680M (1546 - 2914, n=41) | |
| Beelink GTR5 | |
| Beelink SEi11 Pro | |
| Intel NUC11TNKi5 | |
| GMK NucBox 2 | |
| 3DMark 11 - 1280x720 Performance GPU | |
| Intel NUC11PHKi7C | |
| Desktop PC Intel Xeon E5 2680v4 KFA2 GTX 1060 6GB | |
| KFA2 GeForce GTX 1650 EX One Click Plus | |
| Beelink GTR6 | |
| Genomsnitt AMD Radeon 680M (6858 - 11755, n=39) | |
| Beelink GTR5 | |
| Beelink SEi11 Pro | |
| Intel NUC11TNKi5 | |
| GMK NucBox 2 | |
| 3DMark 11 Performance | 10640 poäng | |
| 3DMark Cloud Gate Standard Score | 32988 poäng | |
| 3DMark Fire Strike Score | 6424 poäng | |
| 3DMark Time Spy Score | 2735 poäng | |
Hjälp | ||
| Blender | |
| v3.3 Classroom HIP/AMD | |
| Beelink GTR6 | |
| Genomsnitt AMD Radeon 680M (270 - 555, n=34) | |
| v3.3 Classroom CPU | |
| Beelink SEi11 Pro | |
| Genomsnitt AMD Radeon 680M (389 - 980, n=37) | |
| Beelink GTR6 | |
* ... mindre är bättre
| Performance rating - Percent | |
| Intel NUC11PHKi7C | |
| Beelink GTR6 | |
| Beelink GTR5 | |
| Beelink SEi11 Pro -1! | |
| Intel NUC11TNKi5 -3! | |
| GMK NucBox 2 -3! | |
| The Witcher 3 - 1920x1080 Ultra Graphics & Postprocessing (HBAO+) | |
| Intel NUC11PHKi7C | |
| Beelink GTR6 | |
| Beelink GTR5 | |
| Beelink SEi11 Pro | |
| GTA V - 1920x1080 Highest AA:4xMSAA + FX AF:16x | |
| Intel NUC11PHKi7C | |
| Beelink GTR6 | |
| Beelink GTR5 | |
| Final Fantasy XV Benchmark - 1920x1080 High Quality | |
| Intel NUC11PHKi7C | |
| Beelink GTR6 | |
| Beelink GTR5 | |
| Beelink SEi11 Pro | |
| Intel NUC11TNKi5 | |
| GMK NucBox 2 | |
| Strange Brigade - 1920x1080 ultra AA:ultra AF:16 | |
| Intel NUC11PHKi7C | |
| Beelink GTR6 | |
| Beelink GTR5 | |
| Beelink SEi11 Pro | |
| Dota 2 Reborn - 1920x1080 ultra (3/3) best looking | |
| Intel NUC11PHKi7C | |
| Beelink GTR6 | |
| Beelink GTR5 | |
| Beelink SEi11 Pro | |
| Intel NUC11TNKi5 | |
| GMK NucBox 2 | |
| X-Plane 11.11 - 1920x1080 high (fps_test=3) | |
| Intel NUC11PHKi7C | |
| Beelink GTR6 | |
| Beelink GTR5 | |
| Beelink SEi11 Pro | |
| Intel NUC11TNKi5 | |
| GMK NucBox 2 | |
| Final Fantasy XV Benchmark | |
| 1280x720 Lite Quality | |
| Intel NUC11PHKi7C | |
| Beelink GTR6 | |
| Genomsnitt AMD Radeon 680M (34.4 - 74.7, n=39) | |
| Beelink GTR5 | |
| Beelink SEi11 Pro | |
| Intel NUC11TNKi5 | |
| GMK NucBox 2 | |
| 1920x1080 Standard Quality | |
| Intel NUC11PHKi7C | |
| Beelink GTR6 | |
| Genomsnitt AMD Radeon 680M (18.3 - 36.9, n=40) | |
| Beelink GTR5 | |
| Beelink SEi11 Pro | |
| Intel NUC11TNKi5 | |
| GMK NucBox 2 | |
| 1920x1080 High Quality | |
| Intel NUC11PHKi7C | |
| Beelink GTR6 | |
| Genomsnitt AMD Radeon 680M (12.9 - 26.2, n=40) | |
| Beelink GTR5 | |
| Beelink SEi11 Pro | |
| Intel NUC11TNKi5 | |
| GMK NucBox 2 | |
| The Witcher 3 | |
| 1024x768 Low Graphics & Postprocessing | |
| Intel NUC11PHKi7C | |
| Beelink GTR6 | |
| Genomsnitt AMD Radeon 680M (67.4 - 150, n=31) | |
| Beelink SEi11 Pro | |
| Beelink GTR5 | |
| Intel NUC11TNKi5 | |
| 1366x768 Medium Graphics & Postprocessing | |
| Intel NUC11PHKi7C | |
| Beelink GTR6 | |
| Genomsnitt AMD Radeon 680M (44.5 - 85.3, n=24) | |
| Beelink GTR5 | |
| Beelink SEi11 Pro | |
| 1920x1080 High Graphics & Postprocessing (Nvidia HairWorks Off) | |
| Intel NUC11PHKi7C | |
| Beelink GTR6 | |
| Genomsnitt AMD Radeon 680M (22.3 - 48, n=33) | |
| Beelink SEi11 Pro | |
| Beelink GTR5 | |
| 1920x1080 Ultra Graphics & Postprocessing (HBAO+) | |
| Intel NUC11PHKi7C | |
| Beelink GTR6 | |
| Genomsnitt AMD Radeon 680M (14.3 - 27.1, n=33) | |
| Beelink GTR5 | |
| Beelink SEi11 Pro | |
| GTA V | |
| 1024x768 Lowest Settings possible | |
| Intel NUC11PHKi7C | |
| Beelink GTR6 | |
| Beelink GTR5 | |
| Genomsnitt AMD Radeon 680M (67.7 - 155.4, n=35) | |
| Beelink SEi11 Pro | |
| 1920x1080 Lowest Settings possible | |
| Intel NUC11PHKi7C | |
| Beelink GTR6 | |
| Genomsnitt AMD Radeon 680M (56.9 - 115.8, n=27) | |
| Beelink GTR5 | |
| Beelink SEi11 Pro | |
| 1366x768 Normal/Off AF:4x | |
| Intel NUC11PHKi7C | |
| Beelink GTR6 | |
| Beelink GTR5 | |
| Genomsnitt AMD Radeon 680M (60.7 - 143.9, n=32) | |
| Beelink SEi11 Pro | |
| 1920x1080 Normal/Off AF:4x | |
| Intel NUC11PHKi7C | |
| Beelink GTR6 | |
| Genomsnitt AMD Radeon 680M (54.9 - 117.3, n=27) | |
| Beelink GTR5 | |
| Beelink SEi11 Pro | |
| 1920x1080 High/On (Advanced Graphics Off) AA:2xMSAA + FX AF:8x | |
| Intel NUC11PHKi7C | |
| Beelink GTR6 | |
| Genomsnitt AMD Radeon 680M (25.9 - 99.1, n=37) | |
| Beelink GTR5 | |
| Beelink SEi11 Pro | |
| 1920x1080 Highest AA:4xMSAA + FX AF:16x | |
| Intel NUC11PHKi7C | |
| Beelink GTR6 | |
| Genomsnitt AMD Radeon 680M (11.3 - 25.3, n=37) | |
| Beelink GTR5 | |
| Dota 2 Reborn | |
| 1280x720 min (0/3) fastest | |
| Beelink GTR6 | |
| Intel NUC11PHKi7C | |
| Beelink GTR5 | |
| Beelink SEi11 Pro | |
| Genomsnitt AMD Radeon 680M (34.4 - 146.2, n=41) | |
| GMK NucBox 2 | |
| Intel NUC11TNKi5 | |
| 1366x768 med (1/3) | |
| Intel NUC11PHKi7C | |
| Beelink GTR6 | |
| Beelink GTR5 | |
| Genomsnitt AMD Radeon 680M (33.3 - 121.4, n=41) | |
| Beelink SEi11 Pro | |
| GMK NucBox 2 | |
| Intel NUC11TNKi5 | |
| 1920x1080 high (2/3) | |
| Intel NUC11PHKi7C | |
| Beelink GTR6 | |
| Genomsnitt AMD Radeon 680M (33.2 - 89.1, n=41) | |
| Beelink GTR5 | |
| Beelink SEi11 Pro | |
| Intel NUC11TNKi5 | |
| GMK NucBox 2 | |
| 1920x1080 ultra (3/3) best looking | |
| Intel NUC11PHKi7C | |
| Beelink GTR6 | |
| Genomsnitt AMD Radeon 680M (33.2 - 84.9, n=41) | |
| Beelink GTR5 | |
| Beelink SEi11 Pro | |
| Intel NUC11TNKi5 | |
| GMK NucBox 2 | |
| Cyberpunk 2077 1.6 | |
| 1280x720 Low Preset | |
| Beelink GTR6 | |
| Genomsnitt AMD Radeon 680M (46.1 - 77.6, n=14) | |
| 1920x1080 Low Preset | |
| Beelink GTR6 | |
| Genomsnitt AMD Radeon 680M (26 - 50.6, n=15) | |
| Beelink SEi11 Pro | |
| 1920x1080 Medium Preset | |
| Beelink GTR6 | |
| Genomsnitt AMD Radeon 680M (20.1 - 41.8, n=15) | |
| Beelink SEi11 Pro | |
| 1920x1080 High Preset | |
| Beelink GTR6 | |
| Genomsnitt AMD Radeon 680M (16.3 - 33.6, n=15) | |
| Beelink SEi11 Pro | |
| 1920x1080 Ultra Preset | |
| Beelink GTR6 | |
| Genomsnitt AMD Radeon 680M (14 - 23.8, n=15) | |
| Beelink SEi11 Pro | |
| X-Plane 11.11 | |
| 1280x720 low (fps_test=1) | |
| Intel NUC11PHKi7C | |
| Beelink GTR6 | |
| Beelink GTR5 | |
| Beelink SEi11 Pro | |
| Genomsnitt AMD Radeon 680M (26.8 - 66.7, n=41) | |
| Intel NUC11TNKi5 | |
| GMK NucBox 2 | |
| 1920x1080 med (fps_test=2) | |
| Intel NUC11PHKi7C | |
| Beelink GTR6 | |
| Beelink GTR5 | |
| Genomsnitt AMD Radeon 680M (21.1 - 53.1, n=41) | |
| Beelink SEi11 Pro | |
| Intel NUC11TNKi5 | |
| GMK NucBox 2 | |
| 1920x1080 high (fps_test=3) | |
| Intel NUC11PHKi7C | |
| Beelink GTR6 | |
| Beelink GTR5 | |
| Beelink SEi11 Pro | |
| Genomsnitt AMD Radeon 680M (16.6 - 44.5, n=41) | |
| Intel NUC11TNKi5 | |
| GMK NucBox 2 | |
| Strange Brigade | |
| 1280x720 lowest AF:1 | |
| Intel NUC11PHKi7C | |
| Beelink GTR6 | |
| Genomsnitt AMD Radeon 680M (72.9 - 167.5, n=38) | |
| Beelink GTR5 | |
| Beelink SEi11 Pro | |
| 1920x1080 medium AA:medium AF:4 | |
| Intel NUC11PHKi7C | |
| Beelink GTR6 | |
| Genomsnitt AMD Radeon 680M (30 - 63, n=38) | |
| Beelink GTR5 | |
| Beelink SEi11 Pro | |
| 1920x1080 high AA:high AF:8 | |
| Intel NUC11PHKi7C | |
| Beelink GTR6 | |
| Genomsnitt AMD Radeon 680M (25.3 - 53.1, n=38) | |
| Beelink GTR5 | |
| Beelink SEi11 Pro | |
| 1920x1080 ultra AA:ultra AF:16 | |
| Intel NUC11PHKi7C | |
| Beelink GTR6 | |
| Genomsnitt AMD Radeon 680M (22 - 46, n=38) | |
| Beelink GTR5 | |
| Beelink SEi11 Pro | |
Witcher 3 FPS Chart
| låg | med. | hög | ultra | |
|---|---|---|---|---|
| GTA V (2015) | 152.6 | 138 | 51.8 | 23.7 |
| The Witcher 3 (2015) | 139.2 | 84 | 46 | 27.1 |
| Dota 2 Reborn (2015) | 141.9 | 112.7 | 80.9 | 71.4 |
| Final Fantasy XV Benchmark (2018) | 68.5 | 34.9 | 24.5 | |
| X-Plane 11.11 (2018) | 64.8 | 52.6 | 41.8 | |
| Strange Brigade (2018) | 142.4 | 57.4 | 48.5 | 41.6 |
| Cyberpunk 2077 1.6 (2022) | 43 | 33 | 22.3 | 17.5 |
Utsläpp
Systembrus
Fläktljudet är kanske den fråga som behöver mest uppmärksamhet från tillverkarens sida. GTR6 pulserar ständigt mellan 23 dB(A) och så mycket som 36 dB(A) även när det inte finns någon aktivitet på skärmen. Förändringarna i fläktljudet är märkbara och distraherande om man bara surfar på webben eller streamar video. De flesta andra minidatorer har överlägsna fläktkontroller och RPM-beteende än GTR6
Fläktljudet skulle stabilisera sig i det låga 40 dB(A)-området när man spelar, vilket åtminstone är jämförbart med många Ultrabooks och den äldre GTR5 under liknande testförhållanden. Det är bara synd att fläkten pulserar så ofta vid låg till låg-medelhög belastning.
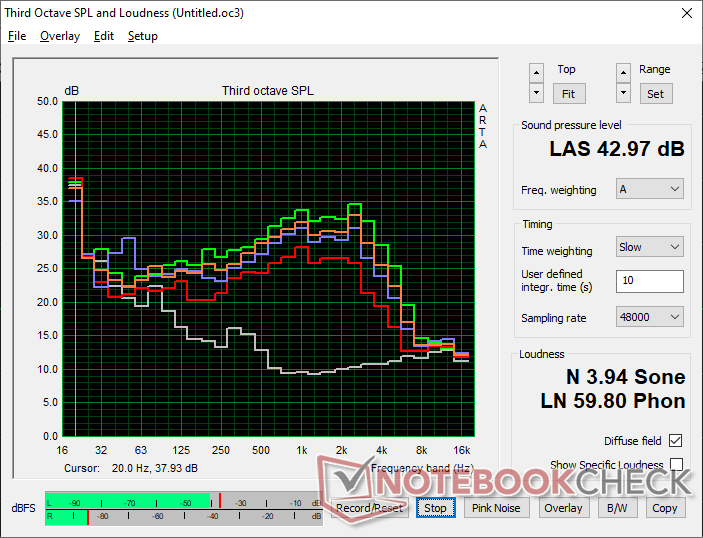
Ljudnivå
| Låg belastning |
| 23.6 / 23.8 / 36.2 dB(A) |
| Hög belastning |
| 39.7 / 43 dB(A) |
 | ||
30 dB tyst 40 dB(A) hörbar 50 dB(A) högt ljud |
||
min: | ||
| Beelink GTR6 Radeon 680M, R9 6900HX, Kingston KC3000 512G SKC3000S512G | Beelink SEi11 Pro Iris Xe G7 96EUs, i5-11320H, Kingston NV1 SNVS/500GCN | Beelink GTR5 Vega 8, R9 5900HX, Kingston NV1 SNVS/500GCN | Intel NUC11PHKi7C GeForce RTX 2060 Mobile, i7-1165G7, Samsung SSD 980 Pro 500GB MZ-V8P500BW | Intel NUC11TNKi5 Iris Xe G7 80EUs, i5-1135G7, Transcend M.2 SSD 430S TS512GMTS430S | GMK NucBox 2 Iris Plus Graphics 655, i5-8259U, Netac S930E8/256GPN | |
|---|---|---|---|---|---|---|
| Noise | 10% | -14% | 2% | -14% | 5% | |
| av / miljö * (dB) | 23.2 | 22.8 2% | 23.1 -0% | 24.5 -6% | 24.8 -7% | 25.6 -10% |
| Idle Minimum * (dB) | 23.6 | 24.7 -5% | 34.2 -45% | 25.3 -7% | 35.6 -51% | 25.7 -9% |
| Idle Average * (dB) | 23.8 | 24.7 -4% | 34.2 -44% | 25.3 -6% | 35.6 -50% | 25.7 -8% |
| Idle Maximum * (dB) | 36.2 | 25.3 30% | 34.2 6% | 25.3 30% | 35.6 2% | 25.7 29% |
| Load Average * (dB) | 39.7 | 33.2 16% | 44.6 -12% | 36.4 8% | 36.2 9% | 35.3 11% |
| Witcher 3 ultra * (dB) | 41 | 34.5 16% | 41.4 -1% | 39.7 3% | 38 7% | |
| Load Maximum * (dB) | 43 | 37.8 12% | 45.1 -5% | 47.9 -11% | 47.6 -11% | 35.1 18% |
* ... mindre är bättre
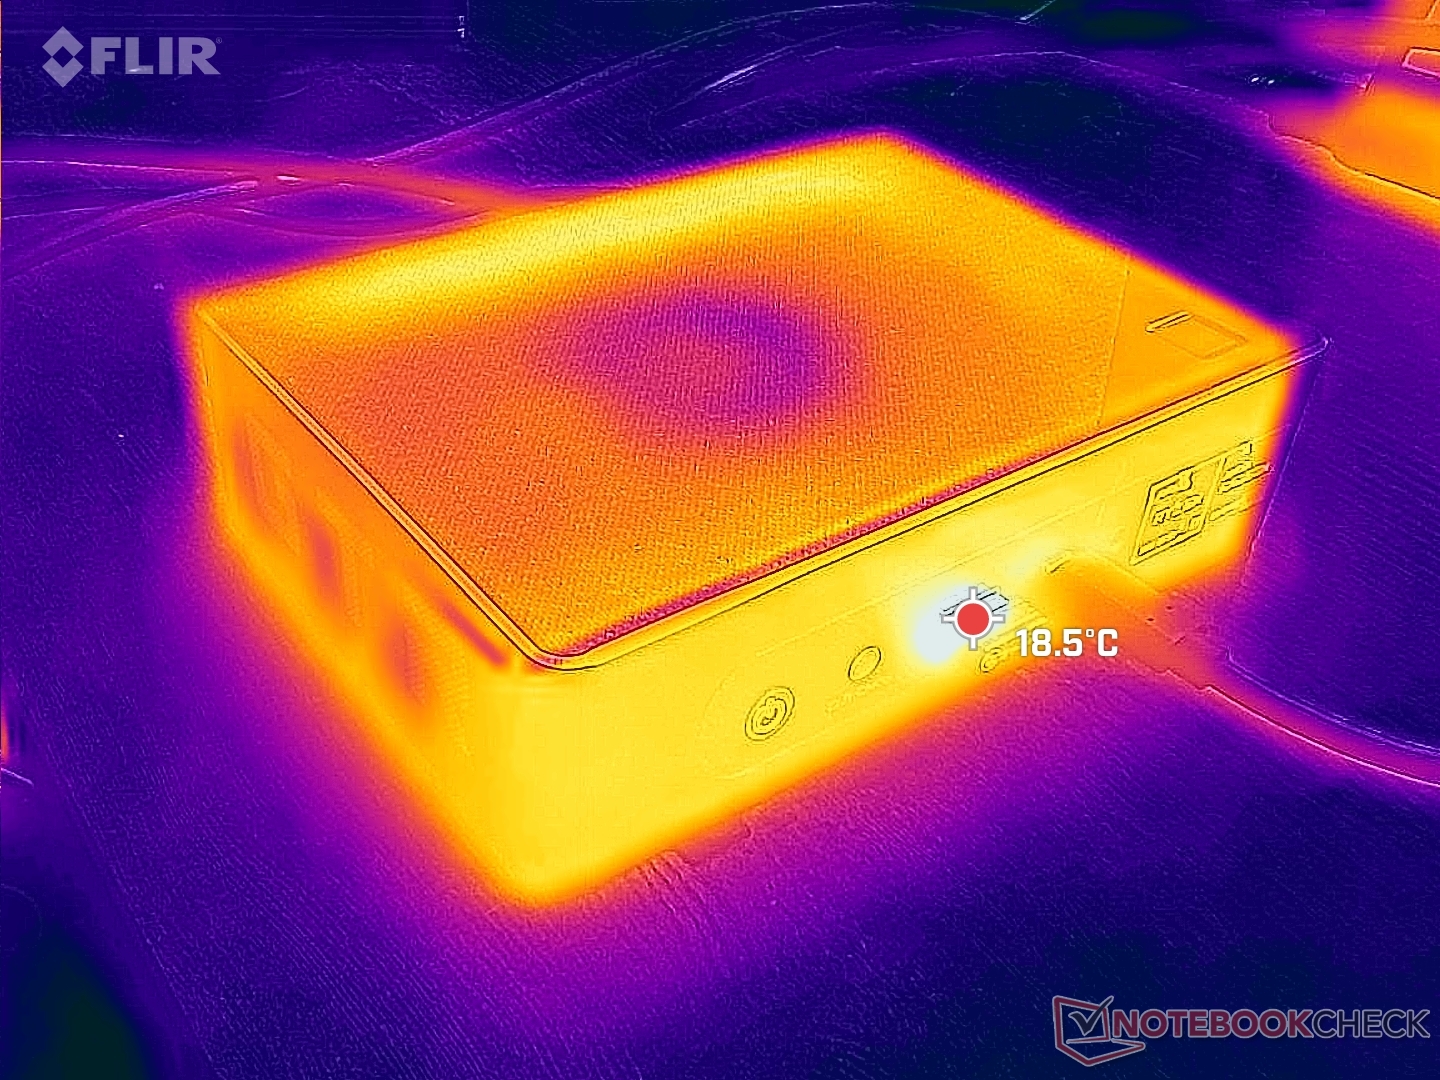
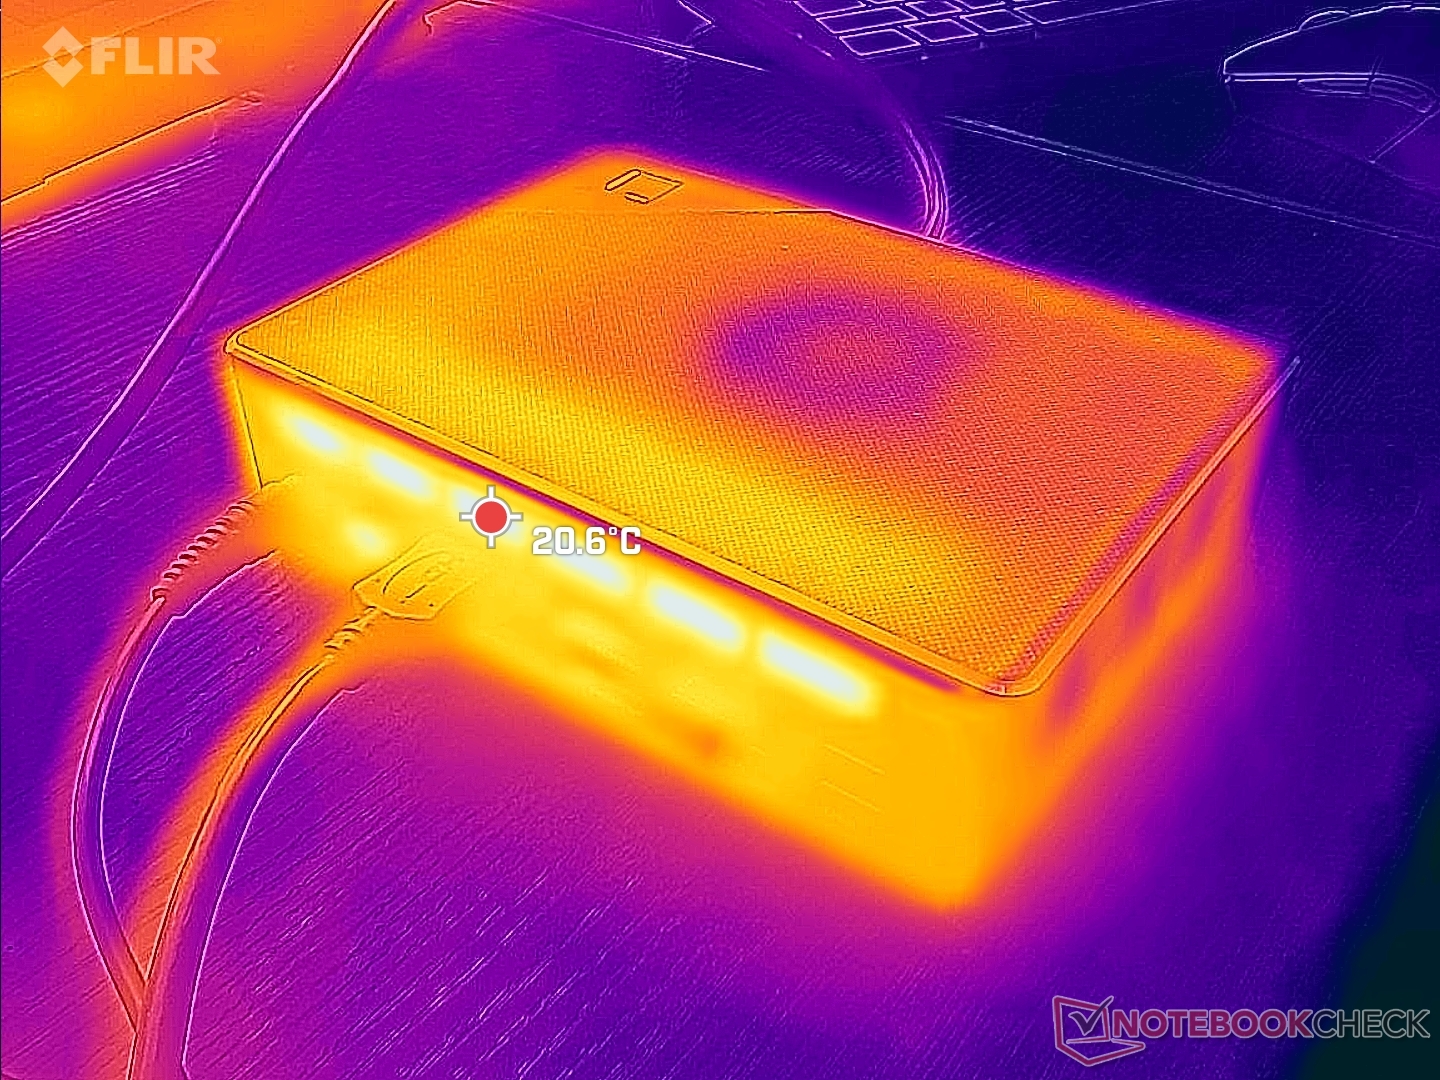
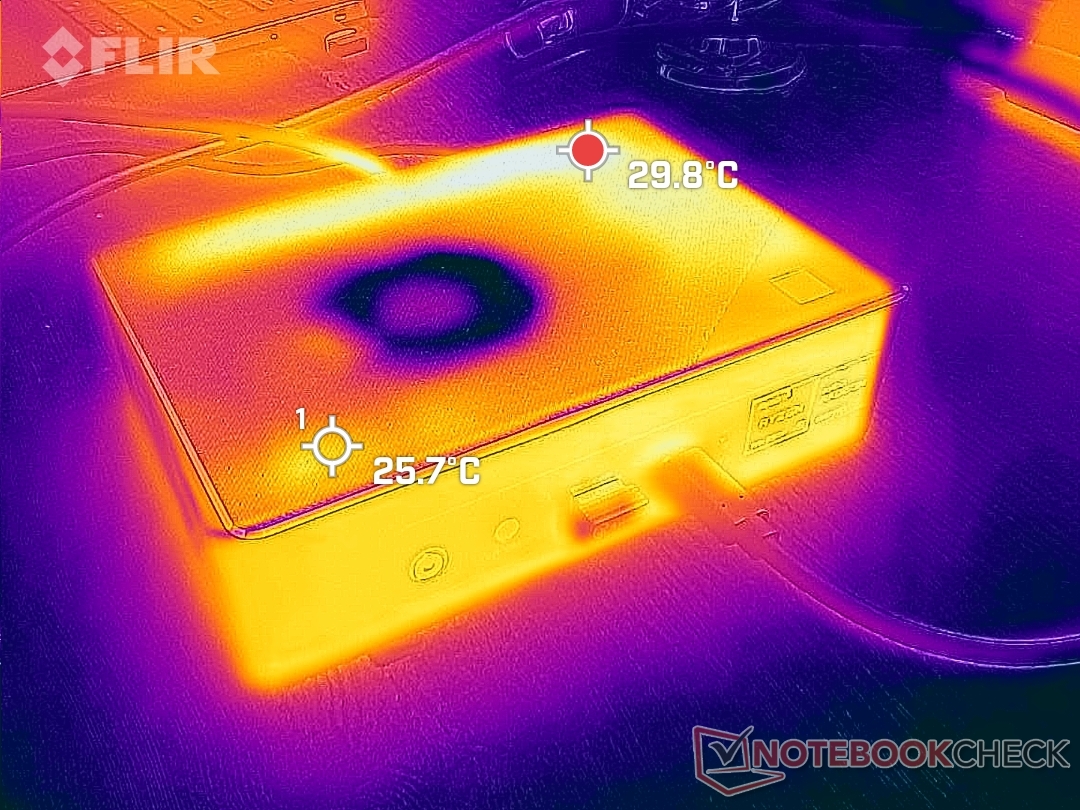
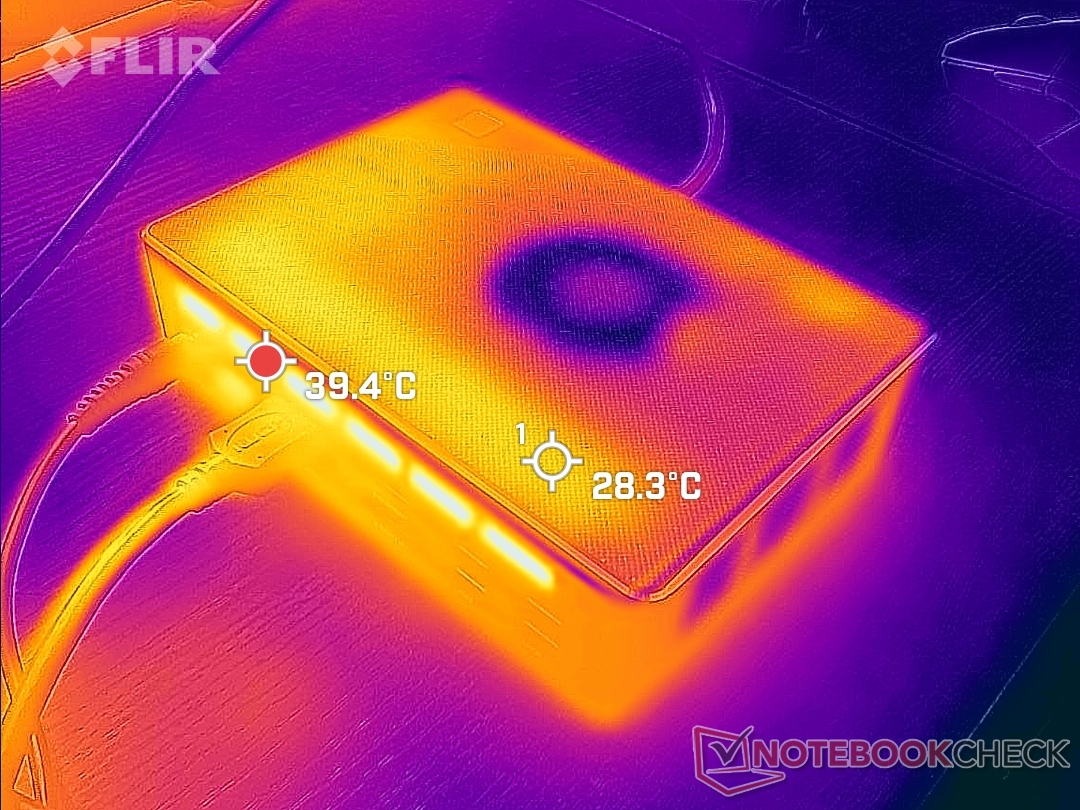
Temperatur
Yttemperaturen är inget problem eftersom den aldrig är obehagligt varm. Tänk dock på att den svala luften kommer in uppifrån, så det är inte rekommenderat att placera böcker eller föremål ovanpå enheten. Se till att lämna gott om utrymme bakom enheten också där spillvärme kommer ut.
Stresstest
När den stressades med Prime95 ökade processorn till 3,4 GHz och 45 W i bara några sekunder innan den stabiliserades på 3,1 GHz, 38 W och 66 C. Det finns definitivt utrymme för överklockning av slutanvändare eftersom tillverkaren verkar ha satt ett konservativt temperaturtak med standardinställningarna.
GPU-klockfrekvensen och temperaturen skulle stabiliseras vid 1977 MHz respektive en rimligt sval 56 C när man körde Witcher 3 för att representera typiska spelbelastningar.
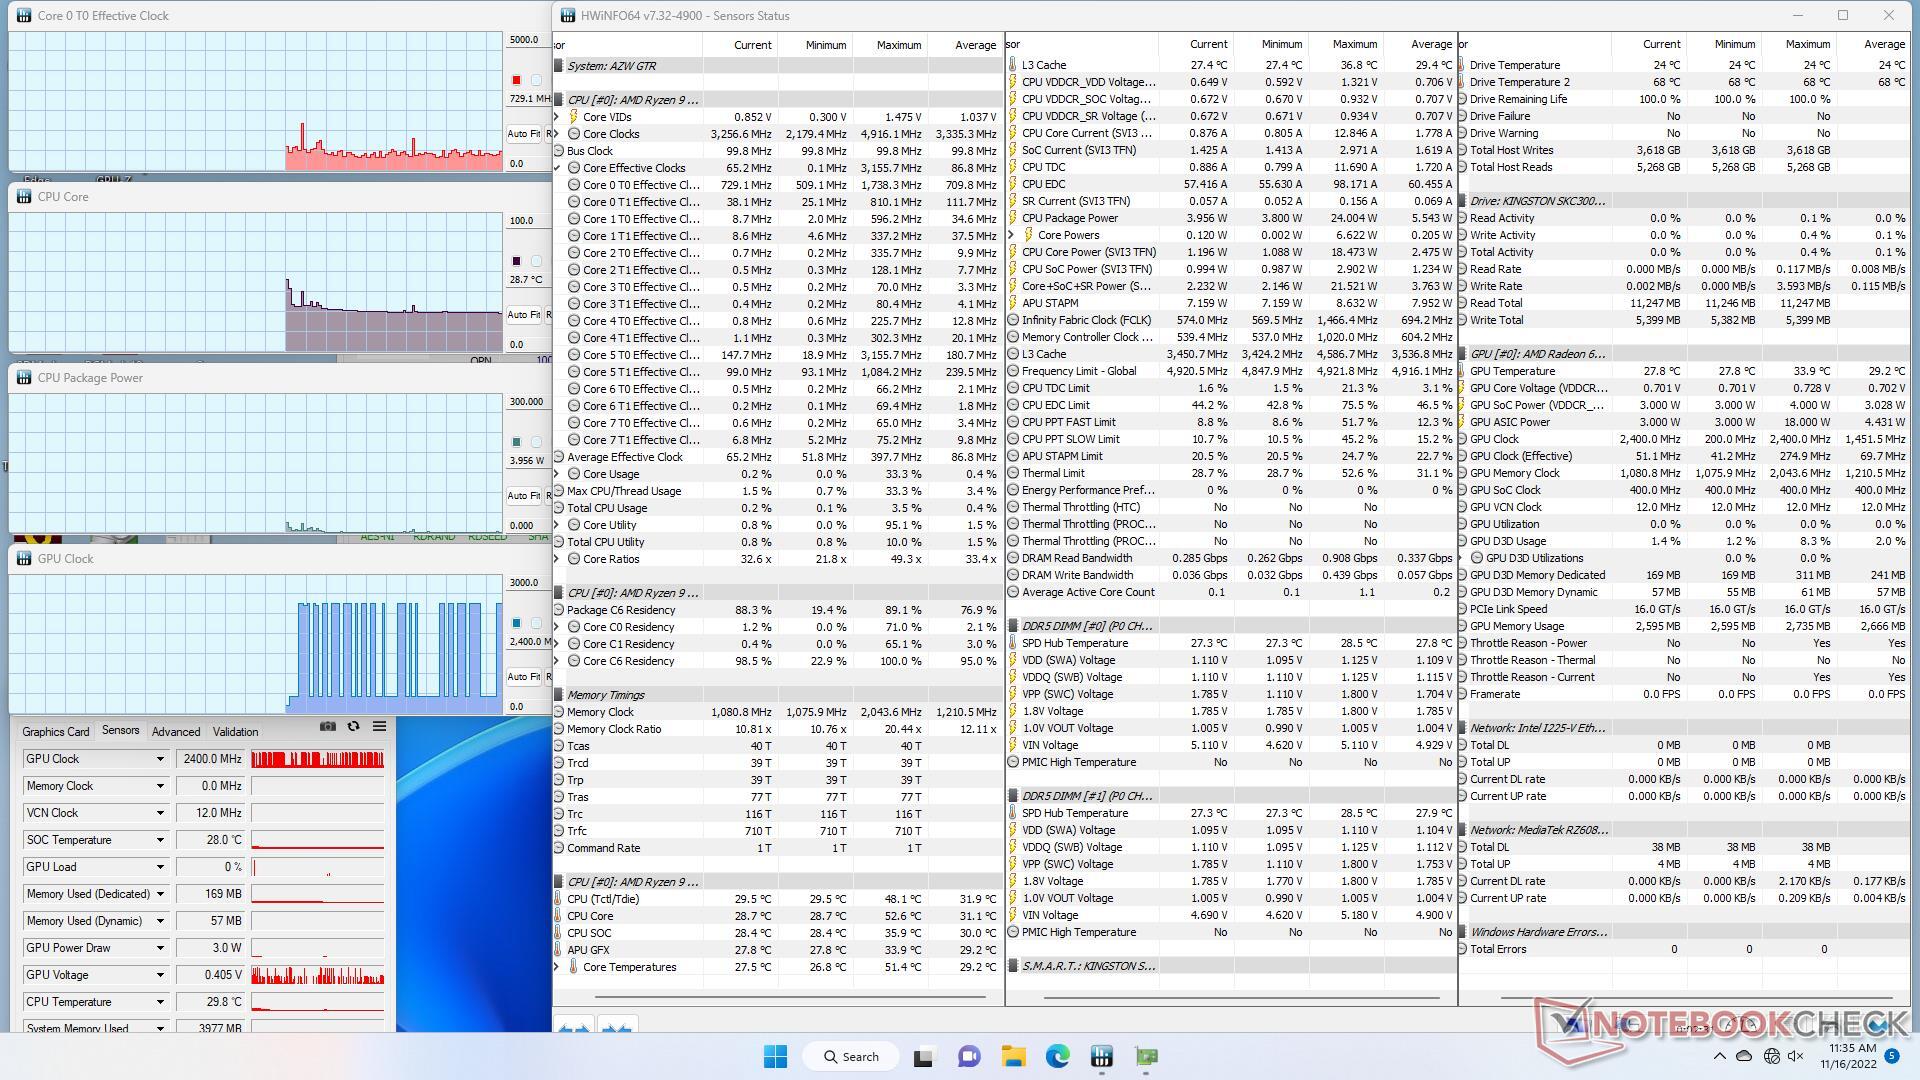
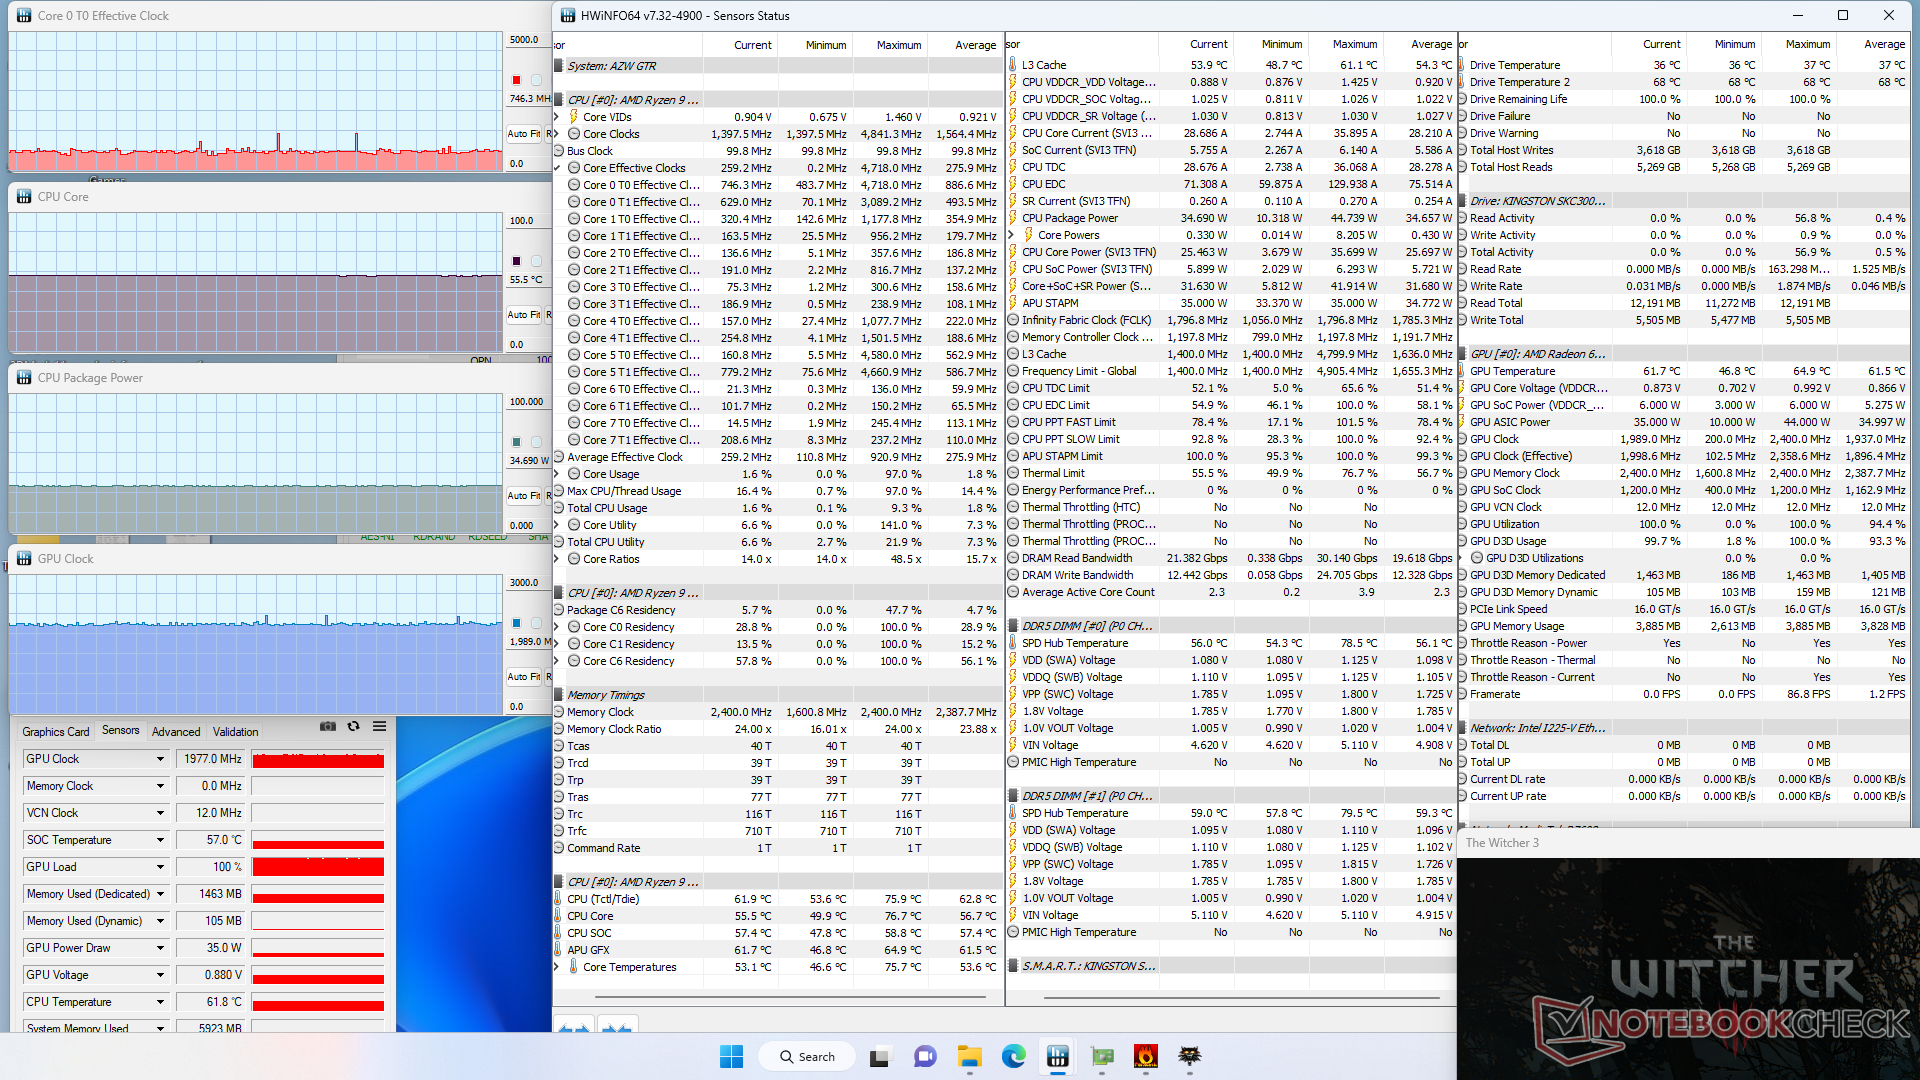
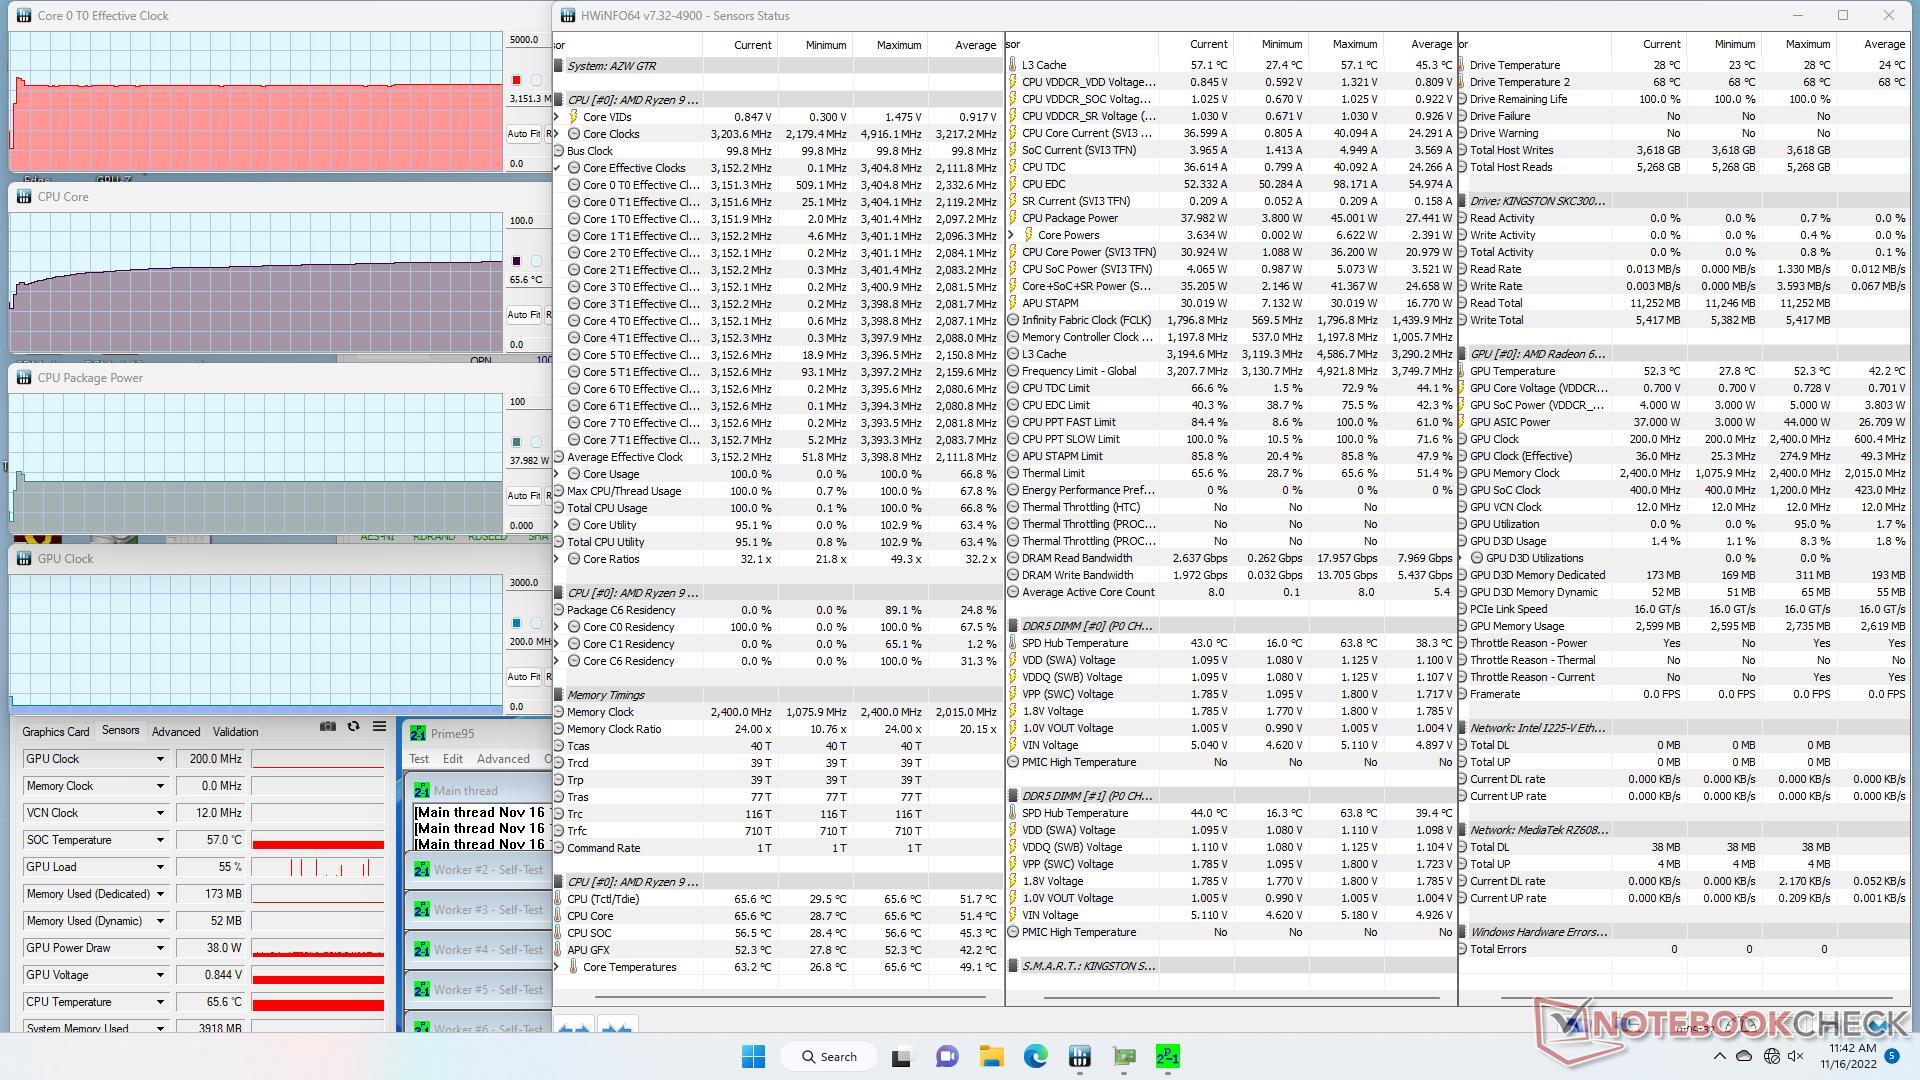
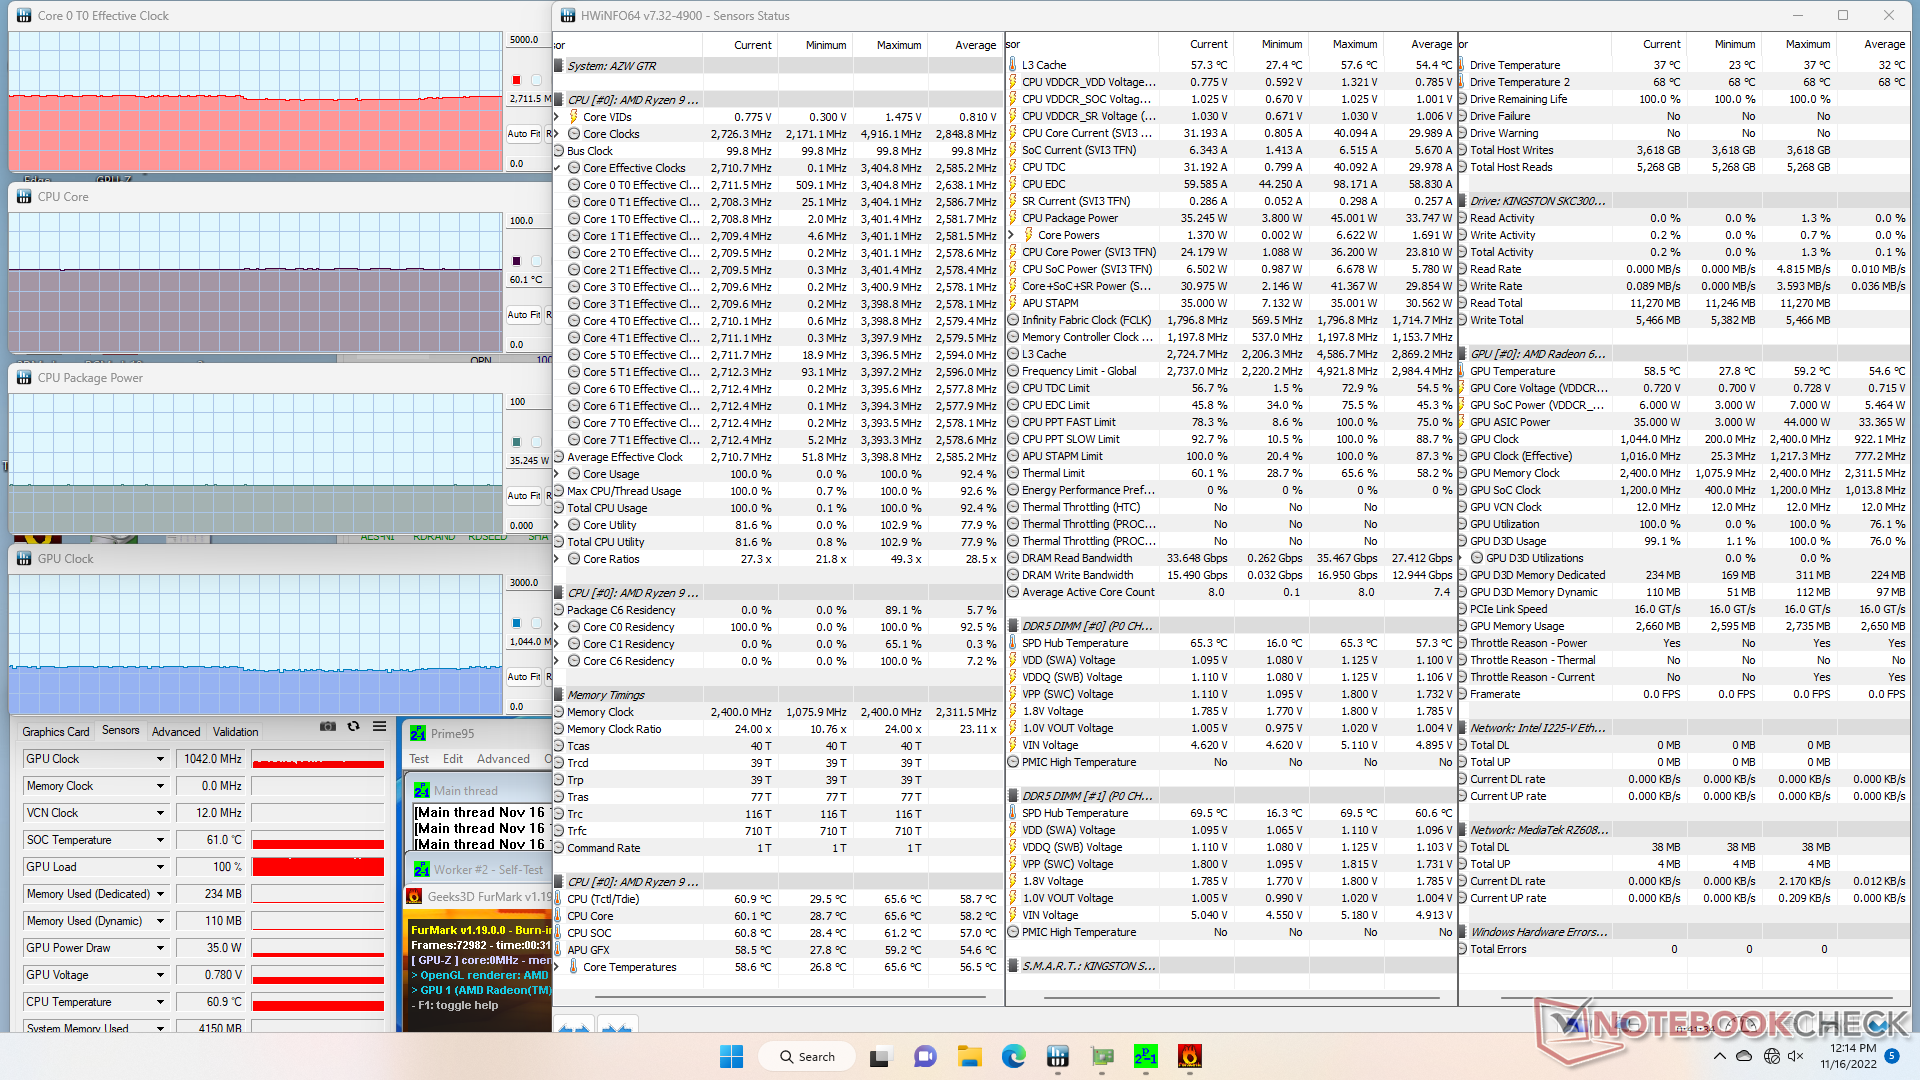
| CPU-klocka (GHz) | GPU-klocka (MHz) | Genomsnittlig CPU-temperatur (°C) | |
| Systemets tomgång | -- | -- | 28 |
| Prime95 Stress | 3.2 | -- | 66 |
| Prime95 + FurMark Stress | 2,7 | 1042 | 60 |
| Witcher 3 Stress | ~0,8 | 1977 | 56 |
Energiförvaltning
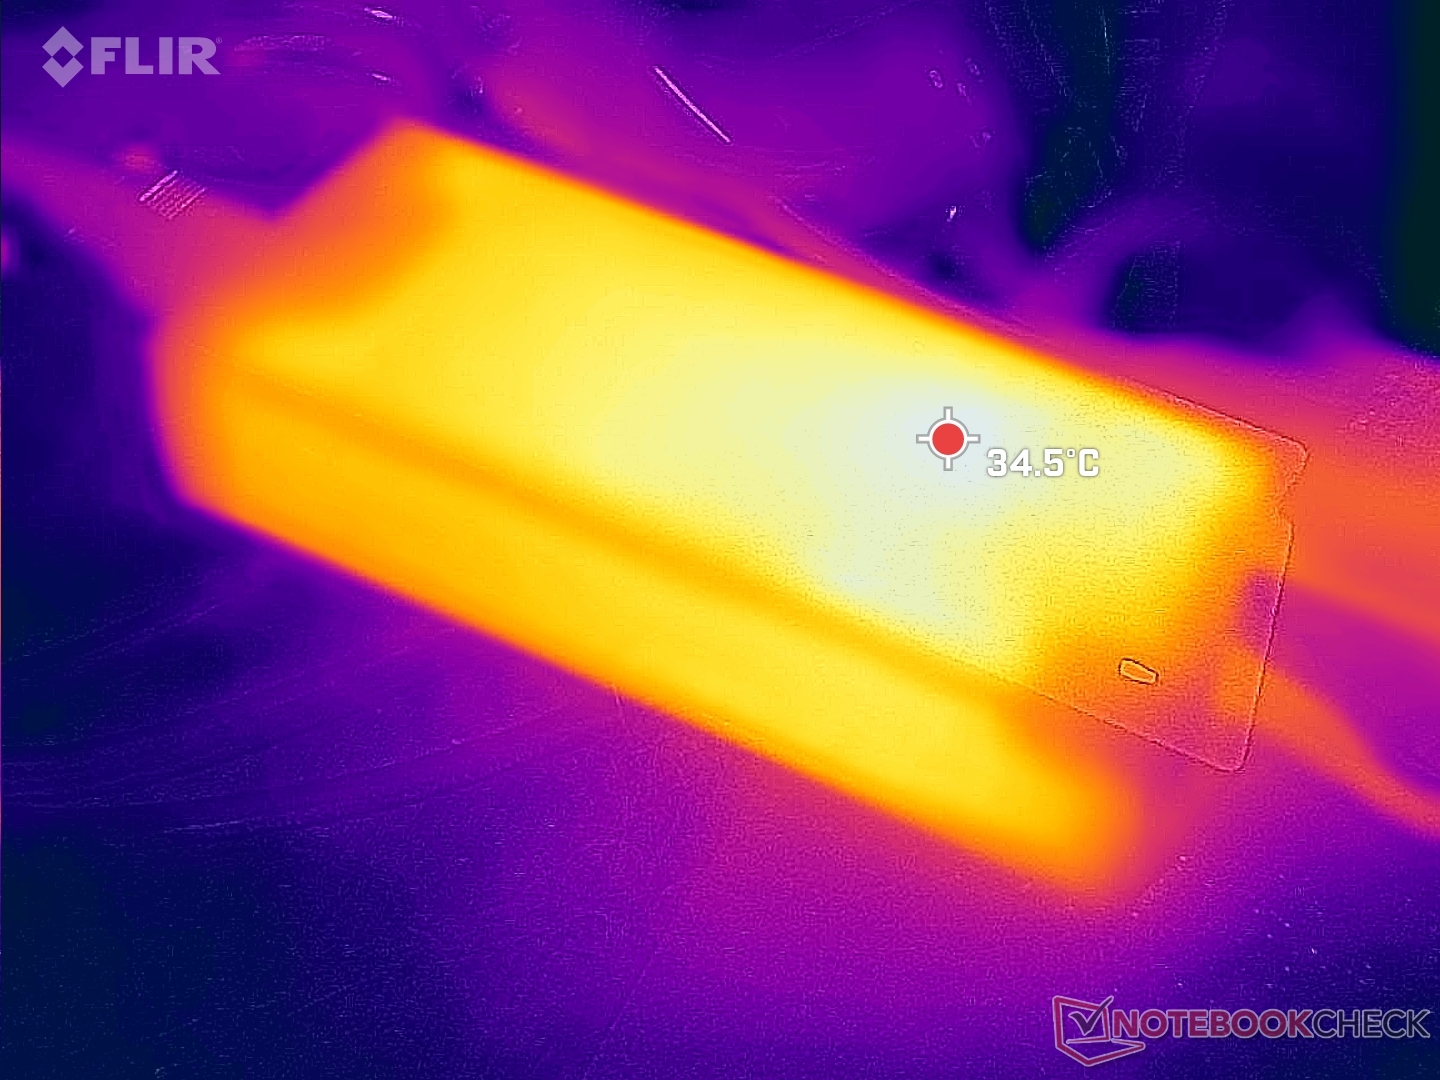
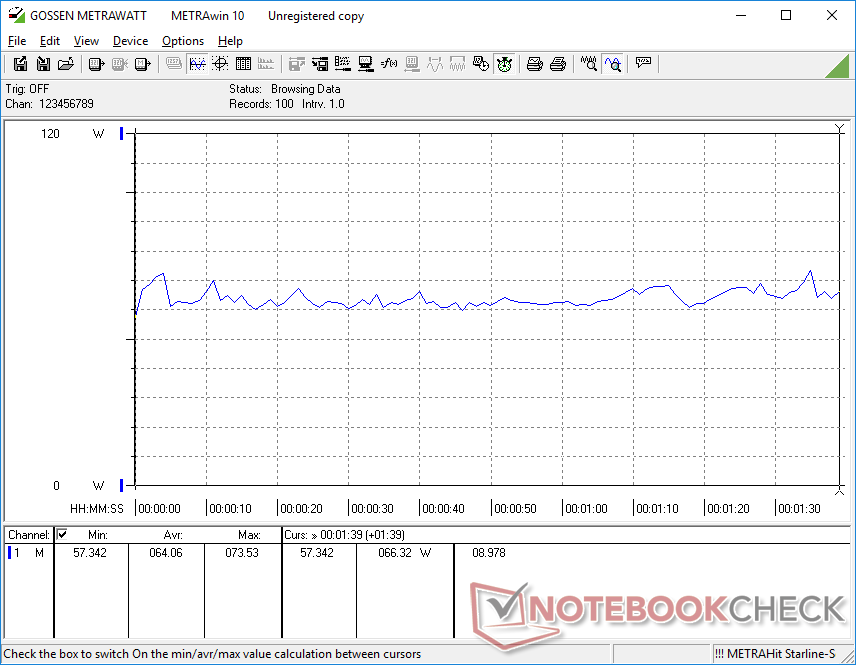
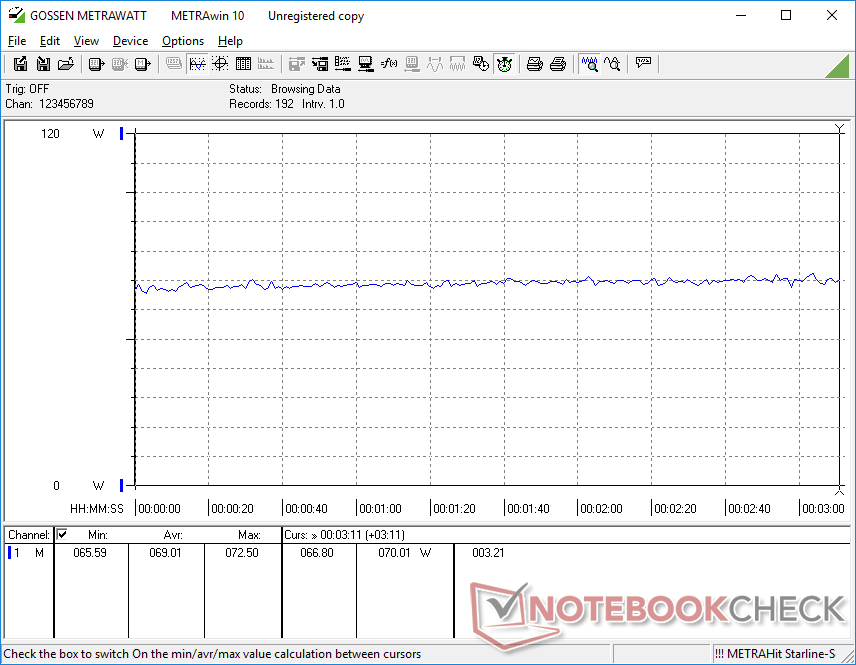
Effektförbrukning
Den totala förbrukningen är nästan identisk med vad vi registrerade på GTR5 trots den 60-procentiga ökningen av grafikprestanda. Med andra ord kan GTR6 ge betydligt snabbare grafikprestanda än sin föregångare under samma strömkuvert för mycket högre prestanda per watt. Strömförbrukningen är dock fortfarande mycket högre än de flesta bärbara datorer och minidatorer som drivs av Intel Core U CPU:er och Iris Xe 96 EU:er, vilket förklarar den större fysiska storleken på GTR6 i förhållande till många Intel NUC:er.
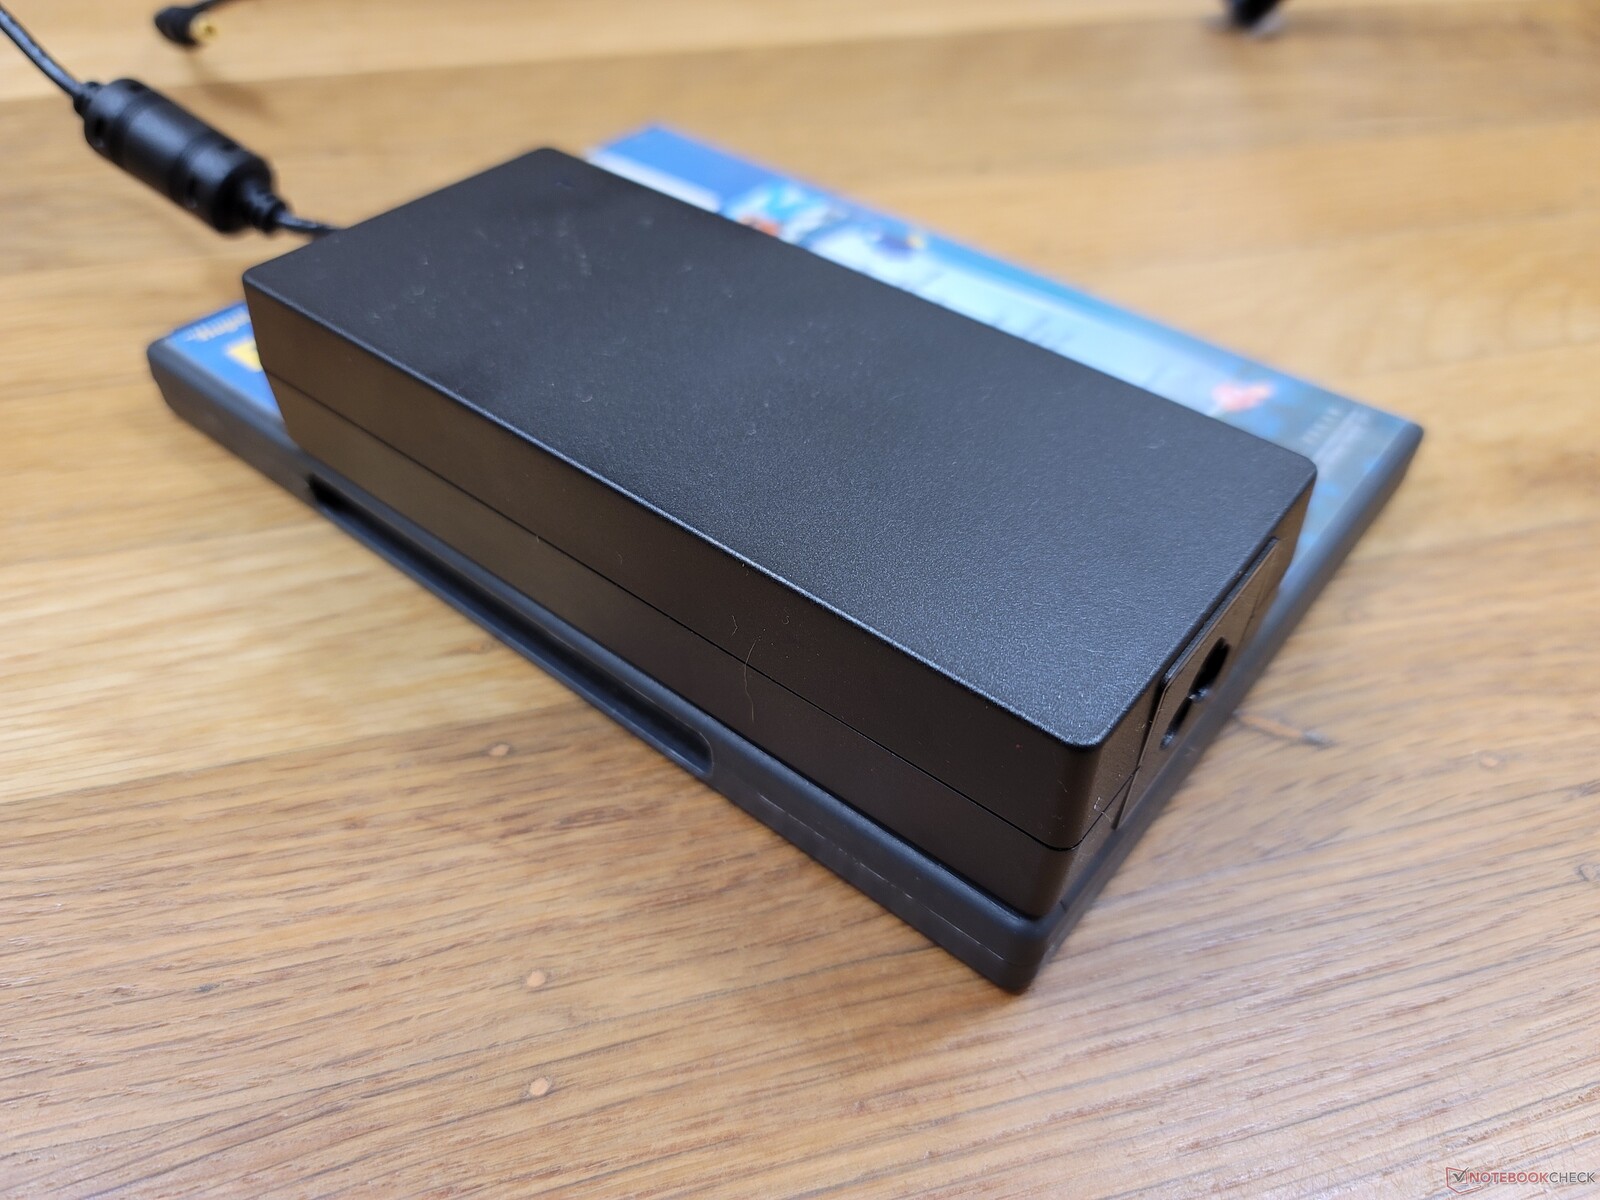
Vi kan registrera ett tillfälligt maximalt uttag på 81 W från den medelstora (~14,4 x 6,3 x 3 cm) 120 W AC-adaptern när CPU:n är 100 procent utnyttjad.


| Av/Standby | |
| Låg belastning | |
| Hög belastning |
|
Förklaring:
min: | |
| Beelink GTR6 R9 6900HX, Radeon 680M, Kingston KC3000 512G SKC3000S512G, , x, | Beelink SEi11 Pro i5-11320H, Iris Xe G7 96EUs, Kingston NV1 SNVS/500GCN, , x, | Beelink GTR5 R9 5900HX, Vega 8, Kingston NV1 SNVS/500GCN, , x, | Intel NUC11PHKi7C i7-1165G7, GeForce RTX 2060 Mobile, Samsung SSD 980 Pro 500GB MZ-V8P500BW, , x, | Intel NUC11TNKi5 i5-1135G7, Iris Xe G7 80EUs, Transcend M.2 SSD 430S TS512GMTS430S, , x, | GMK NucBox 2 i5-8259U, Iris Plus Graphics 655, Netac S930E8/256GPN, , x, | |
|---|---|---|---|---|---|---|
| Power Consumption | 6% | 8% | -73% | -3% | 29% | |
| Idle Minimum * (Watt) | 7.6 | 9.8 -29% | 6.2 18% | 5.8 24% | 11.5 -51% | 6.1 20% |
| Idle Average * (Watt) | 9.9 | 10.3 -4% | 8.9 10% | 5.9 40% | 12.4 -25% | 6.8 31% |
| Idle Maximum * (Watt) | 10.6 | 10.5 1% | 9 15% | 20.7 -95% | 12.9 -22% | 7.3 31% |
| Load Average * (Watt) | 64 | 54.2 15% | 66.8 -4% | 130.8 -104% | 40.7 36% | 46.3 28% |
| Witcher 3 ultra * (Watt) | 69 | 53.1 23% | 62.6 9% | 154.4 -124% | 43.9 36% | |
| Load Maximum * (Watt) | 80.4 | 59 27% | 81.6 -1% | 225.2 -180% | 73.5 9% | 50.7 37% |
* ... mindre är bättre
Power Consumption Witcher 3 / Stresstest
Power Consumption external Monitor
För
Emot
Bedömning - Allt om GPU:n
Den största fördelen med att välja Beelink GTR6 framför Beelink GTR6 GTR5 är den avsevärt förbättrade integrerade grafiken. I övrigt erbjuder Zen 3+ Ryzen 9 6900HX bara marginellt snabbare processorprestanda än Zen 3 Ryzen 9 5900HX. Om du planerar att mestadels strömma innehåll till din minidator med enstaka måttlig multitasking har GTR5 mer än tillräckligt med kraft för dina syften. Om du planerar att köra spel lokalt eller andra GPU-intensiva uppgifter kan GTR6 vara värd investeringen.
Priset är en annan viktig faktor att ta hänsyn till. För 750 USD levereras GTR6 komplett med RAM, SSD, licensierat Windows 11 Pro och en snabbare CPU och integrerad GPU än de flesta Intel NUC-alternativ, inklusive de senaste 12th gen NUC Pro-modellerna. Beelink erbjuder även en barebone SKU utan RAM eller lagring för endast 540 dollar.
AMD Radeon 680M GPU är höjdpunkten i Beelink GTR6. Prestanda per dollar är hög i förhållande till konkurrerande Intel NUCs i samma prisklass på 750 dollar.
Fläktljudet är kanske vårt största klagomål på GTR6 eftersom det pulserar till synes utan anledning när systemet går på tomgång eller kör kravlös belastning. I övrigt är både prestanda per dollar och funktionsuppsättning för GTR6 mycket konkurrenskraftiga.
Pris och tillgänglighet
Beelink GTR6 levereras nu i vår exakta konfiguration på Amazon för $999 USD eller endast $749 USD om du köper direkt från tillverkaren.
Price comparison

