Recension av mini-PC:n Beelink U59 - Prestandatester för Intel Celeron N5095 Jasper Lake

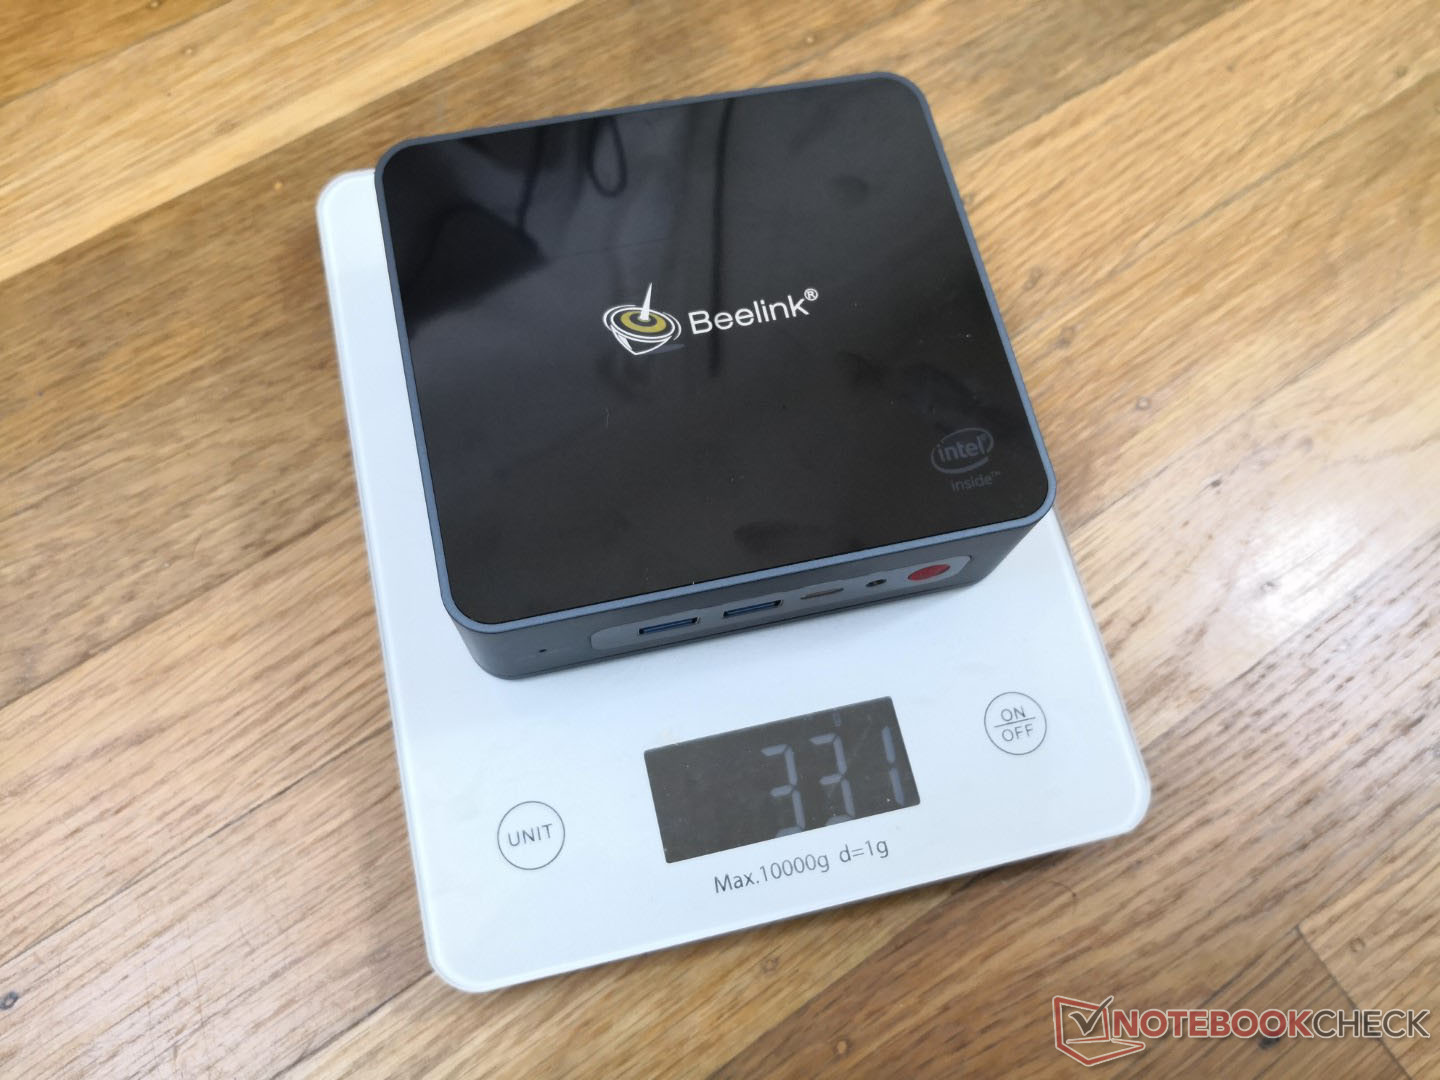
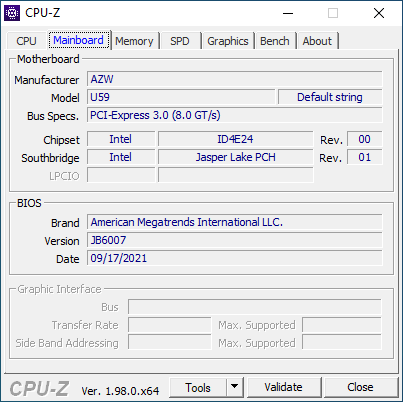
Beelink har nyligen lanserat sin minidator U59 som efterföljare till den senaste generationen U55. Systemet har Intels nya fyrkärniga Celeron N5095 som ersätter de äldre Celeron N4500, J4125 eller N4120 som vanligtvis finns i andra minidatorer i samma prisklass på 300 USD.
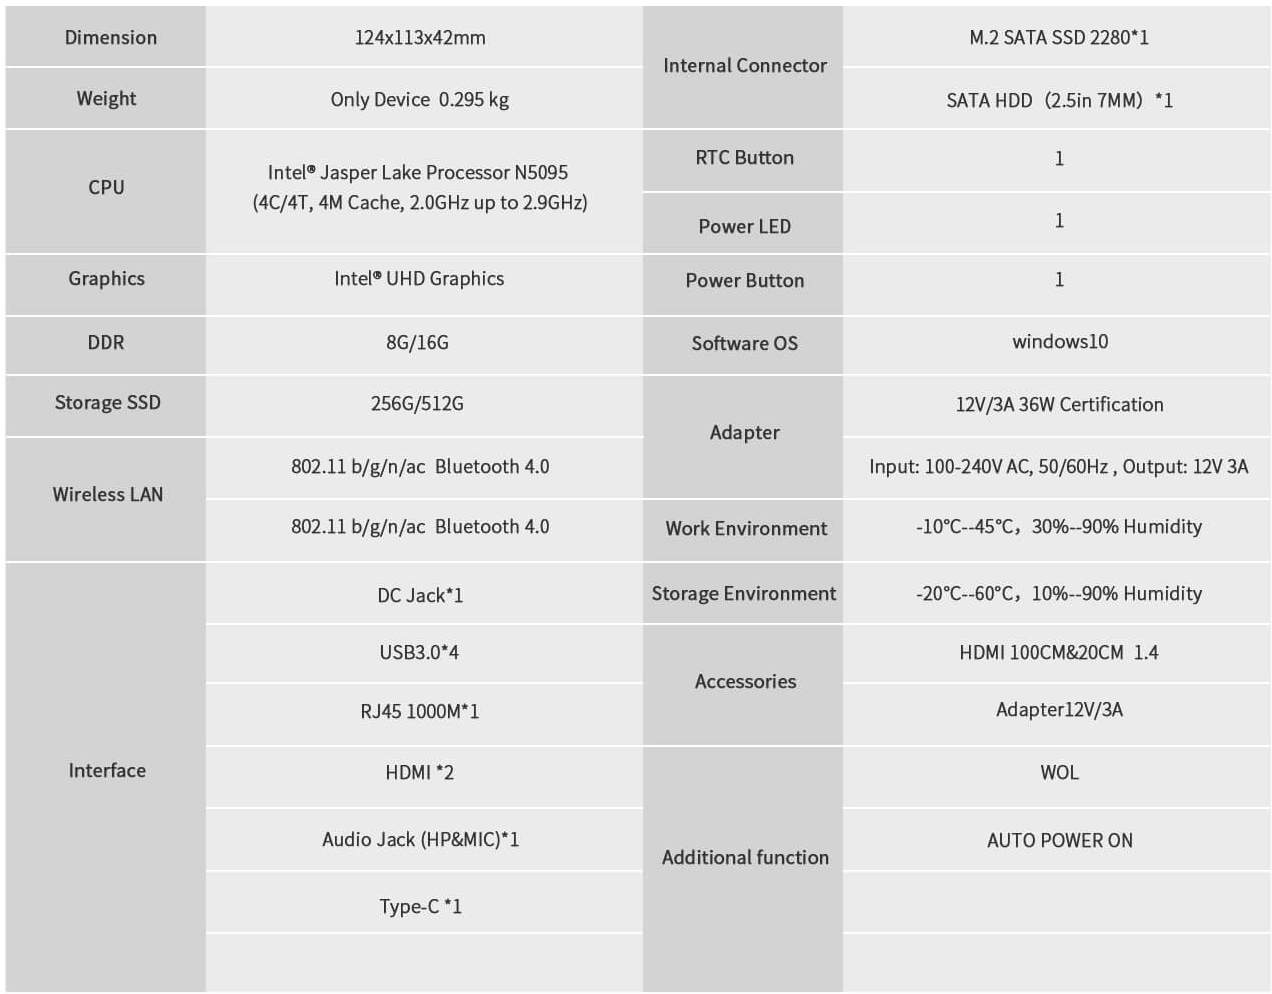
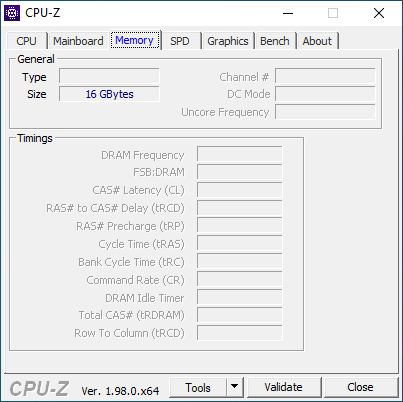
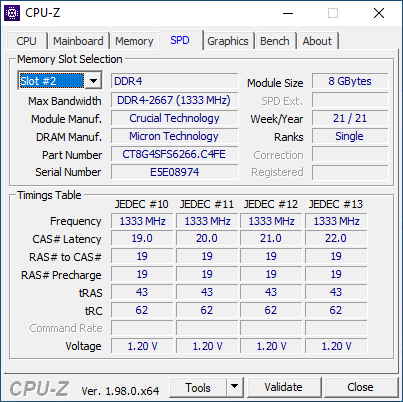
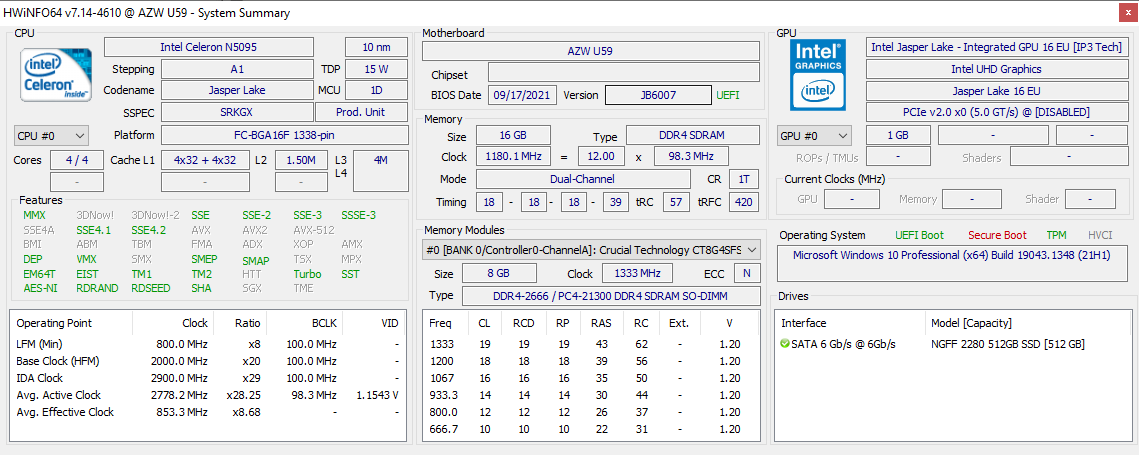
Vår specifika testkonfiguration med 16 GB dubbelkanals RAM och 512 GB M.2 SSD kan hittas online för 349 USD medan en mindre konfiguration med hälften så mycket RAM och lagring kan hittas för endast 279 USD. Ytterligare specifikationer om U59 finns på dess officiella produktsida här.
Fler recensioner från Beelink:
Testgrupp
Gradering | Datum | Modell | Vikt | Höjd | Storlek | Upplösning | Pris |
|---|---|---|---|---|---|---|---|
v (old) | 11/2021 | Beelink U59 Celeron N5095, UHD Graphics (Jasper Lake 16 EU) | 329 g | 42 mm | x | ||
v (old) | Intel NUC11TNKi5 i5-1135G7, Iris Xe G7 80EUs | 504 g | 37 mm | x | |||
v (old) | 11/2018 | Intel NUC8i7BE i7-8559U, Iris Plus Graphics 655 | 683 g | 51 mm | x | ||
v (old) | 12/2020 | Beelink SEi10 i3-1005G1, UHD Graphics G1 (Ice Lake 32 EU) | 350 g | 41 mm | x | ||
v (old) | Zotac ZBOX MI642 Nano i5-10210U, UHD Graphics 620 | 472 g | 51 mm | x | |||
v (old) | GMK NucBox K1 Celeron J4125, UHD Graphics 600 | 130 g | 42 mm | x |
Fall
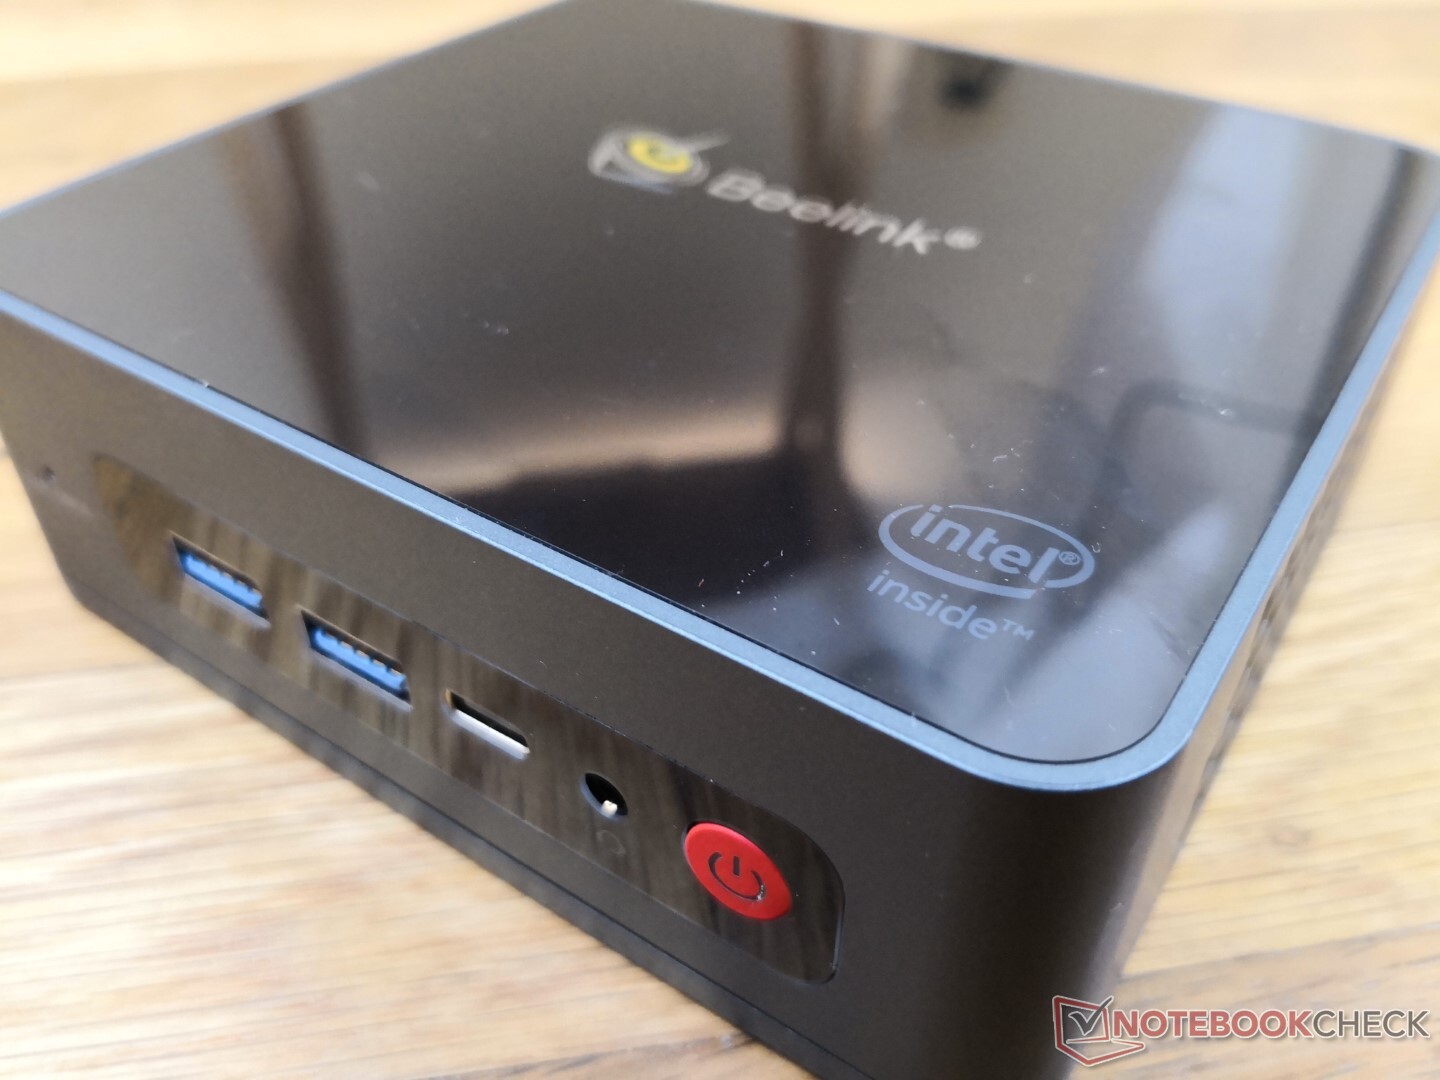
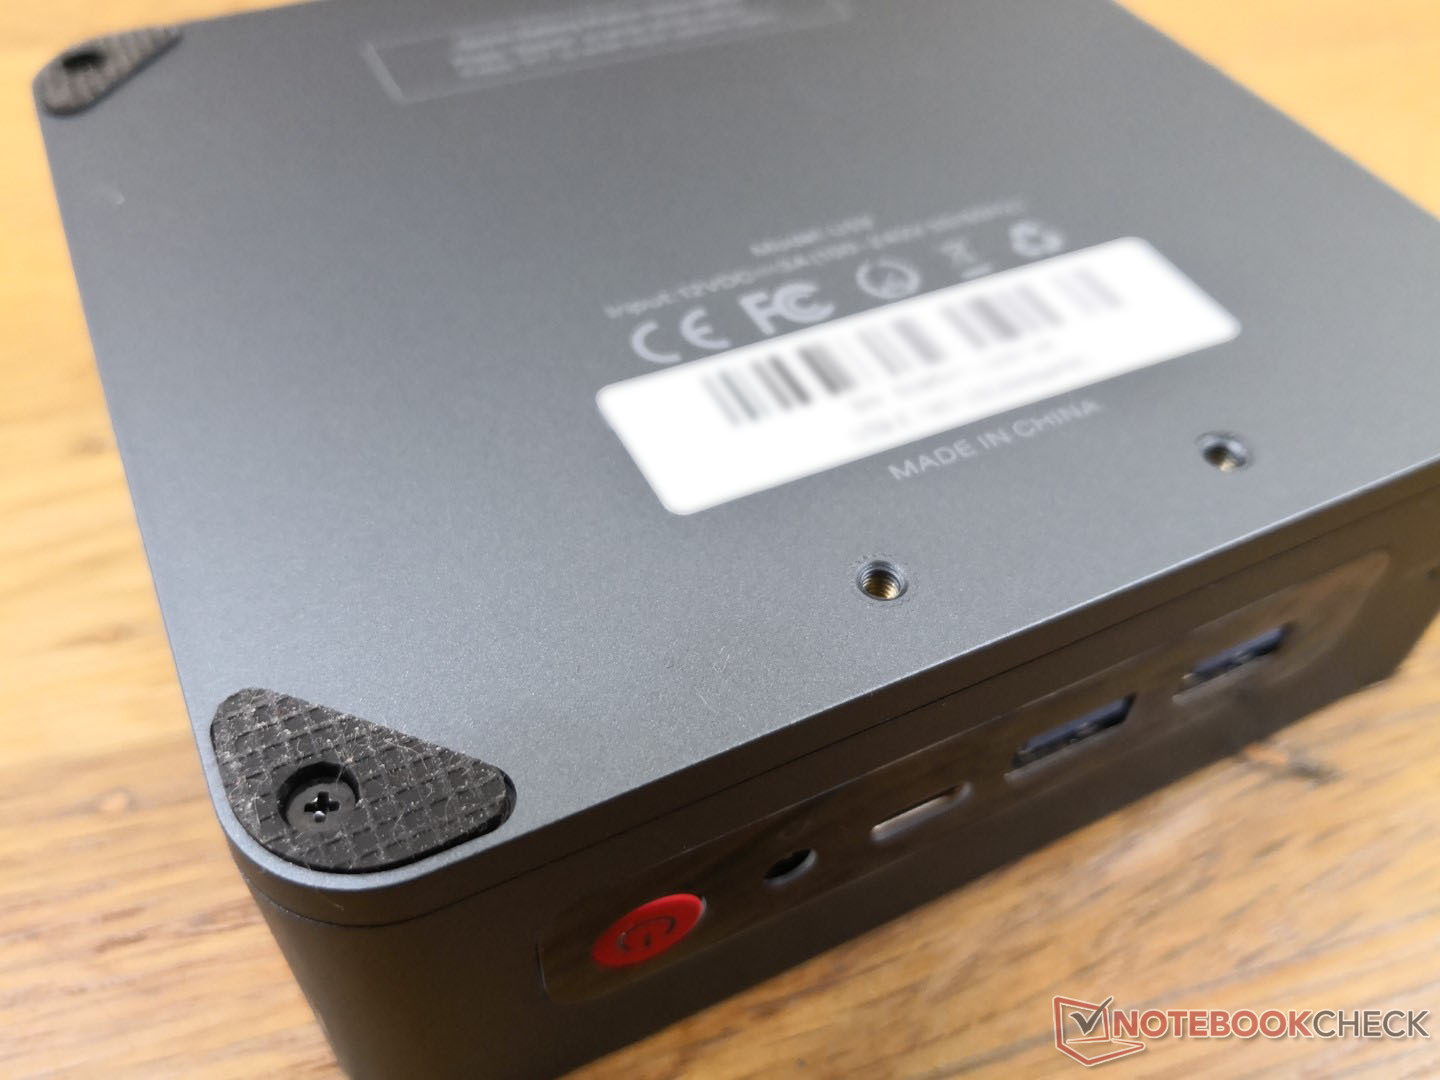
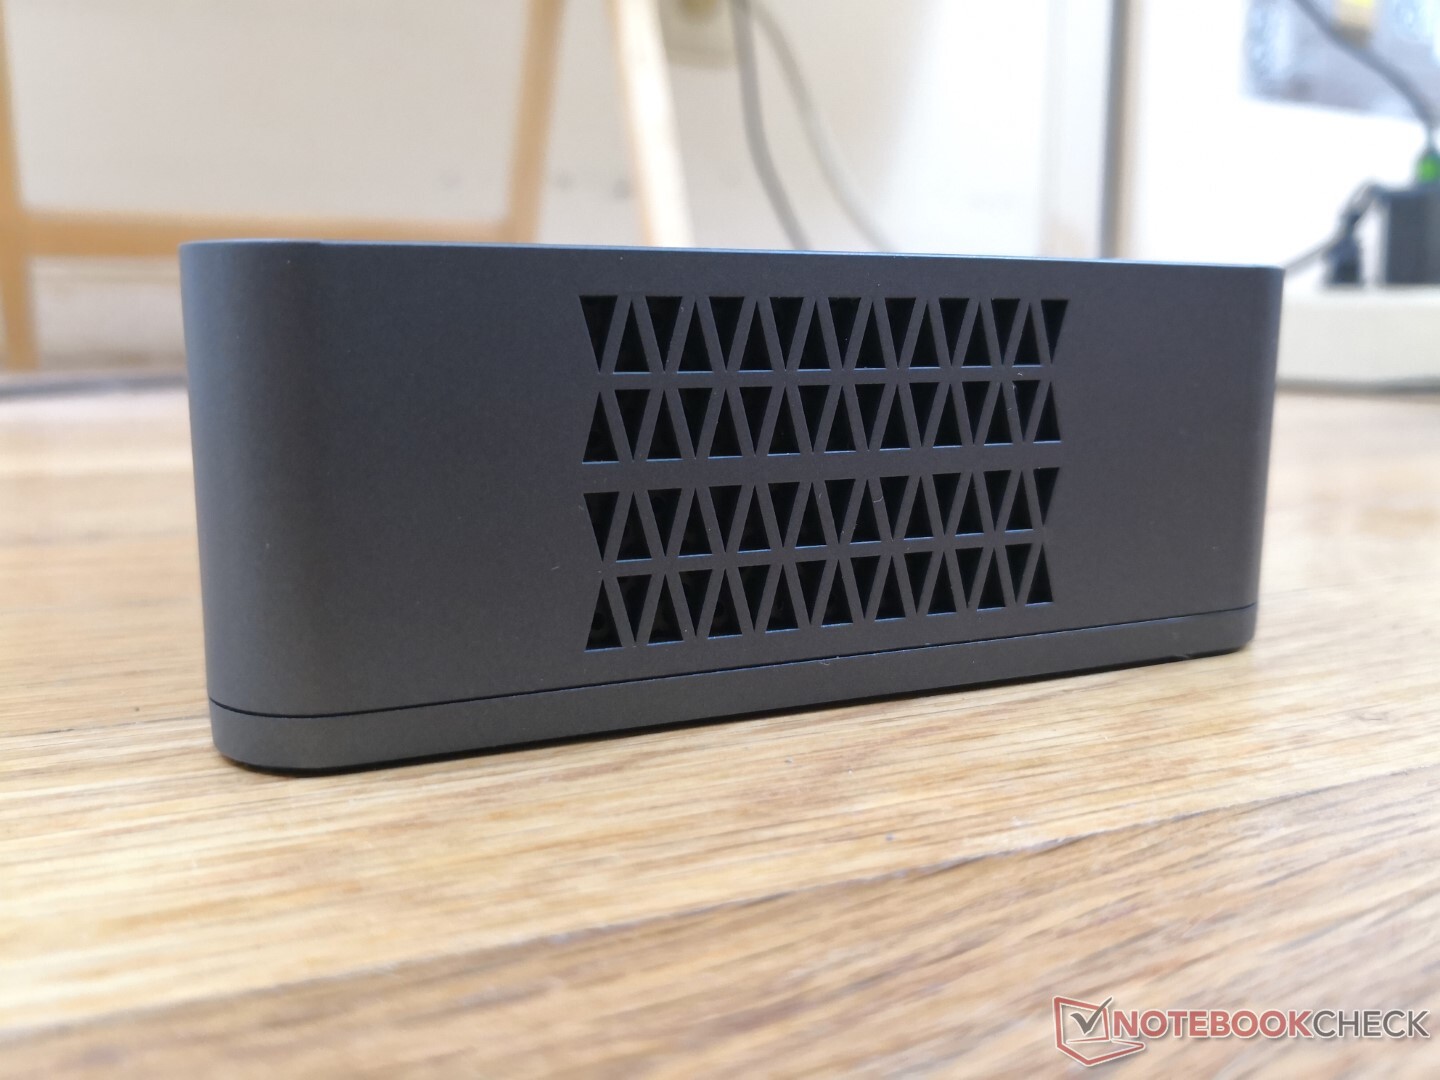
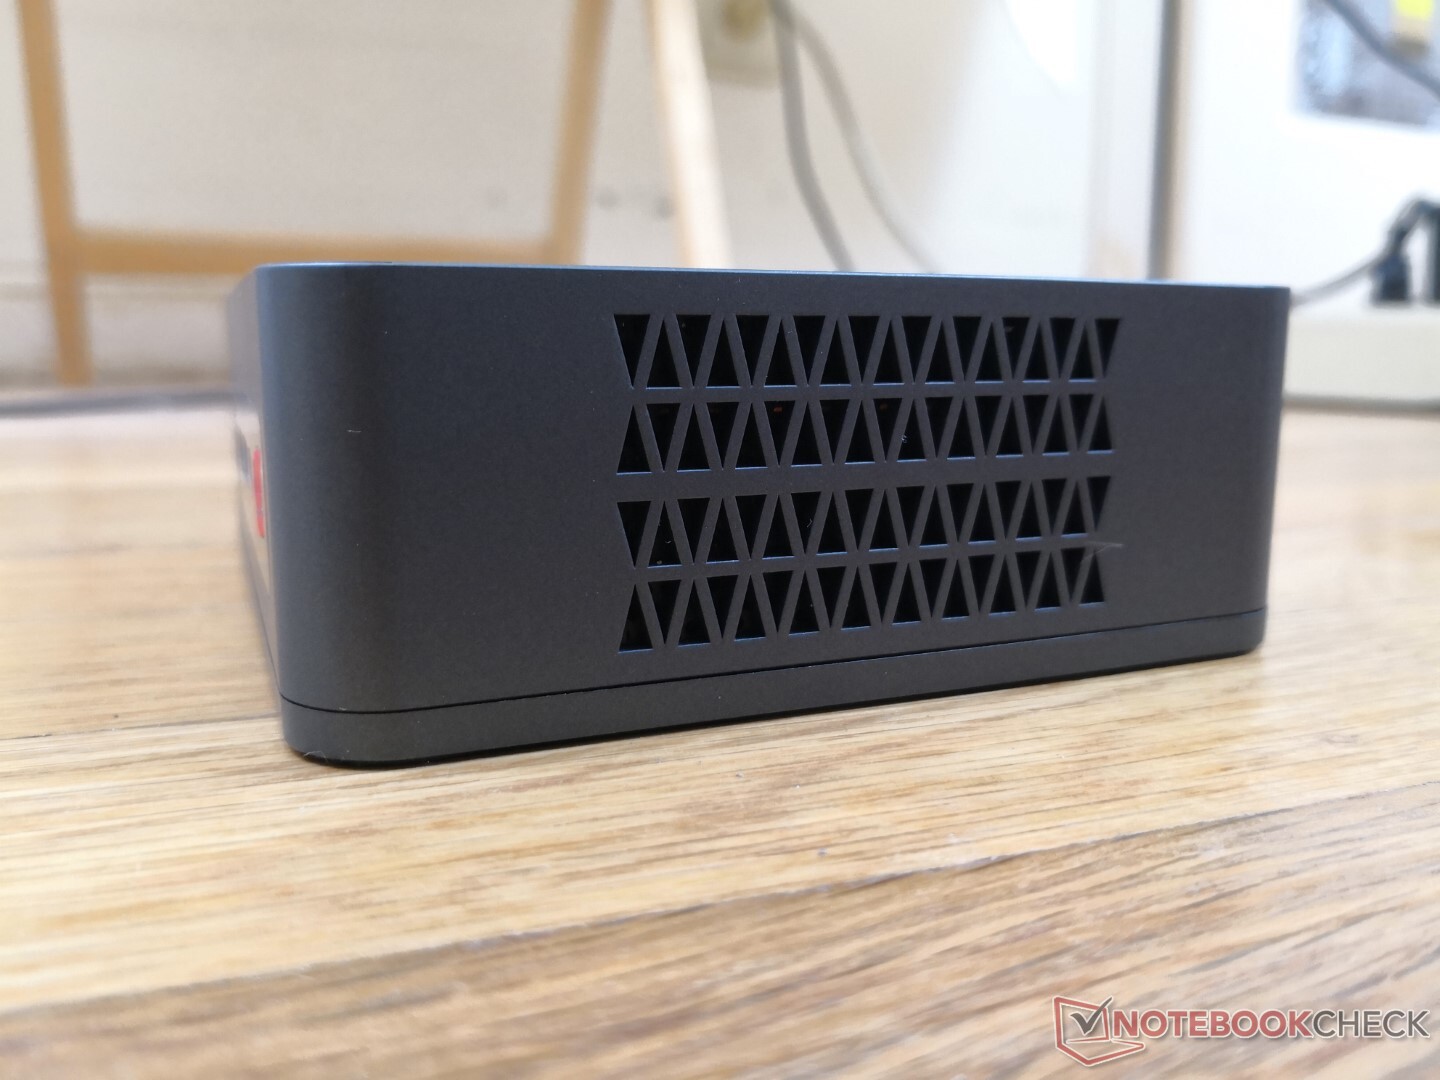
Beelink använder en liknande chassidesign för sina U59- och AMD-baserade SER3-minipc-serier. På U59 är dock toppen helt enkelt blanka plast utan metallgaller eller kromskurna omkretsar som finns på SER3 för ett mer dämpat utseende. Plasttoppen ser först trevlig ut, men även de svagaste repor eller fingeravtryck kommer att vara svåra att dölja. Den böjs också lättare nedåt i mitten jämfört med andra tjockare minidatorer som t.ex GMK NucBox 2 eller Intel NUC serien.
Anslutningsmöjligheter
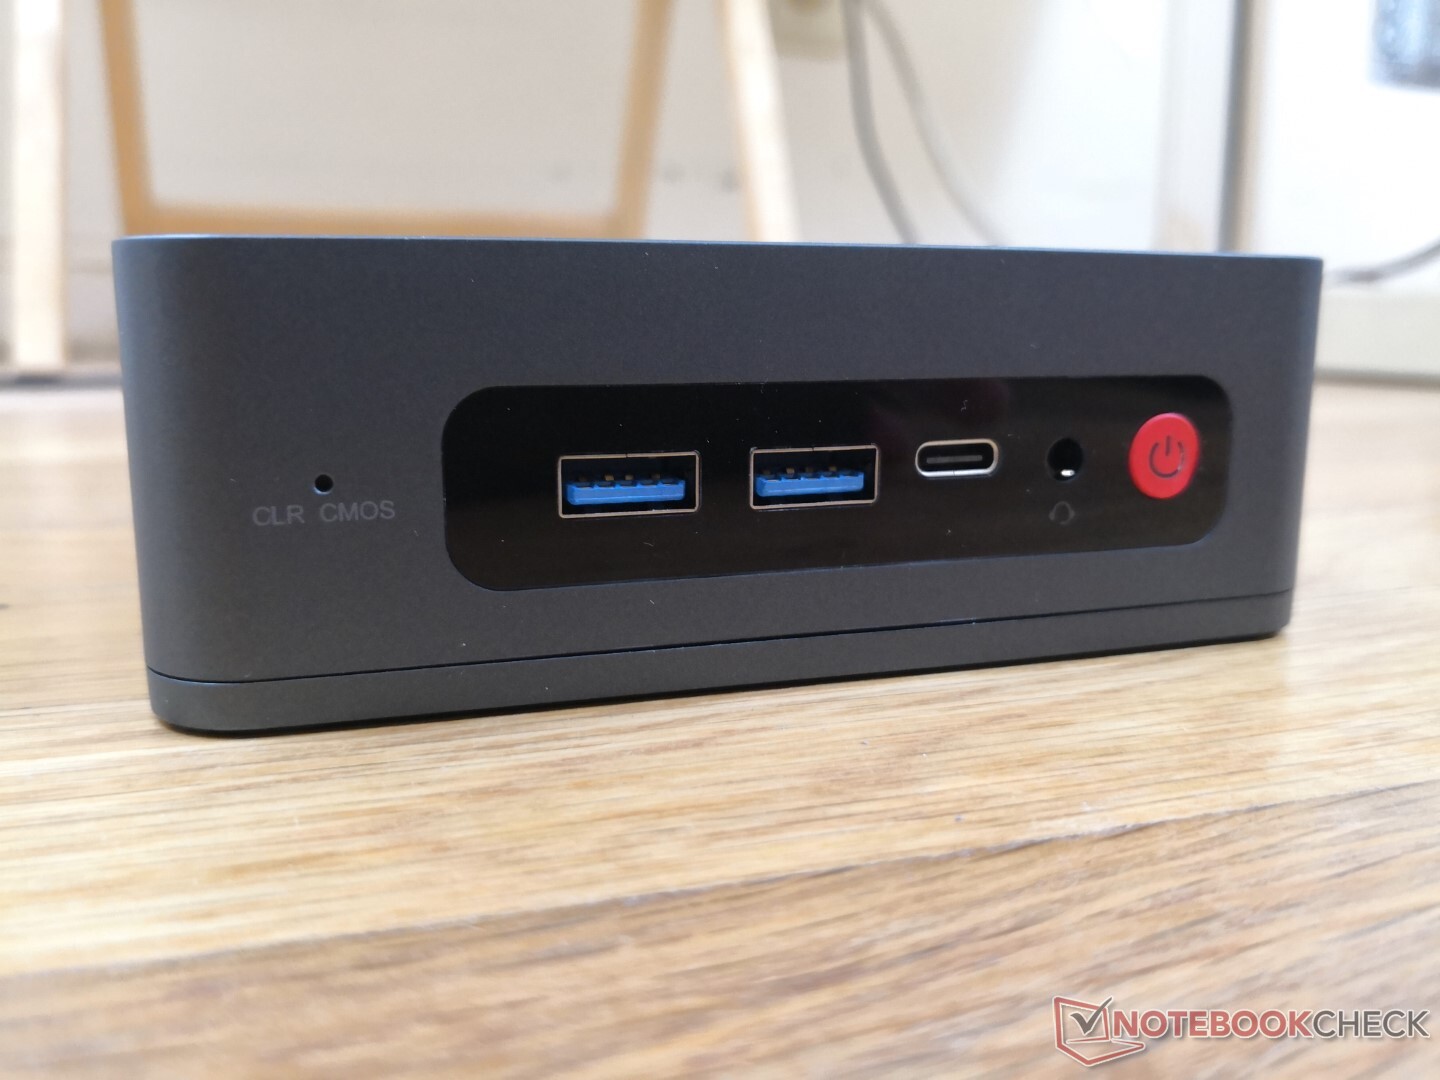
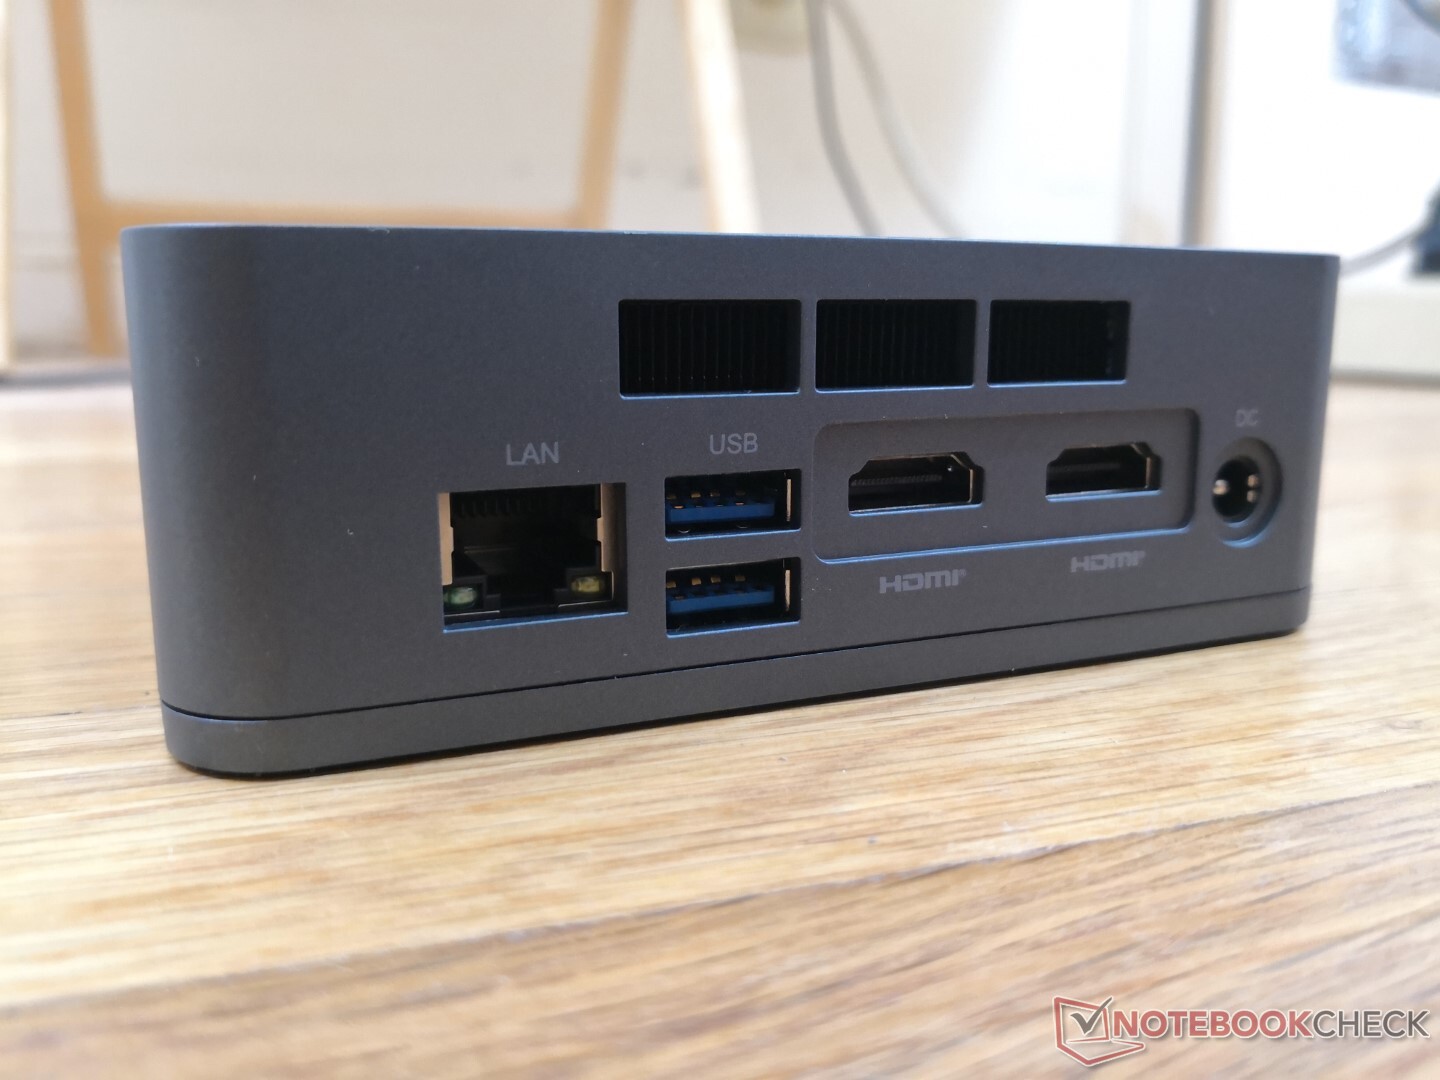
Alternativen för fysiska portar är identiska med alternativen för Beelink SEi10 men med undantag för Thunderbolt-stöd. Både DisplayPort-over-USB-C och 4K60-utgång stöds.
Kommunikation
Den 7 år gamla Intel 3165 är standard för Wi-Fi 5-uppkoppling upp till teoretiska 433 Mbps. Prestandan är stabil, även om den är mycket långsammare än moderna Wi-Fi 6-moduler med över en gigabit.
| Networking | |
| iperf3 transmit AX12 | |
| Intel NUC11TNKi5 | |
| Beelink SEi10 | |
| Intel NUC8i7BE | |
| Beelink U59 | |
| GMK NucBox K1 | |
| iperf3 receive AX12 | |
| Intel NUC11TNKi5 | |
| Beelink SEi10 | |
| Intel NUC8i7BE | |
| GMK NucBox K1 | |
| Beelink U59 | |
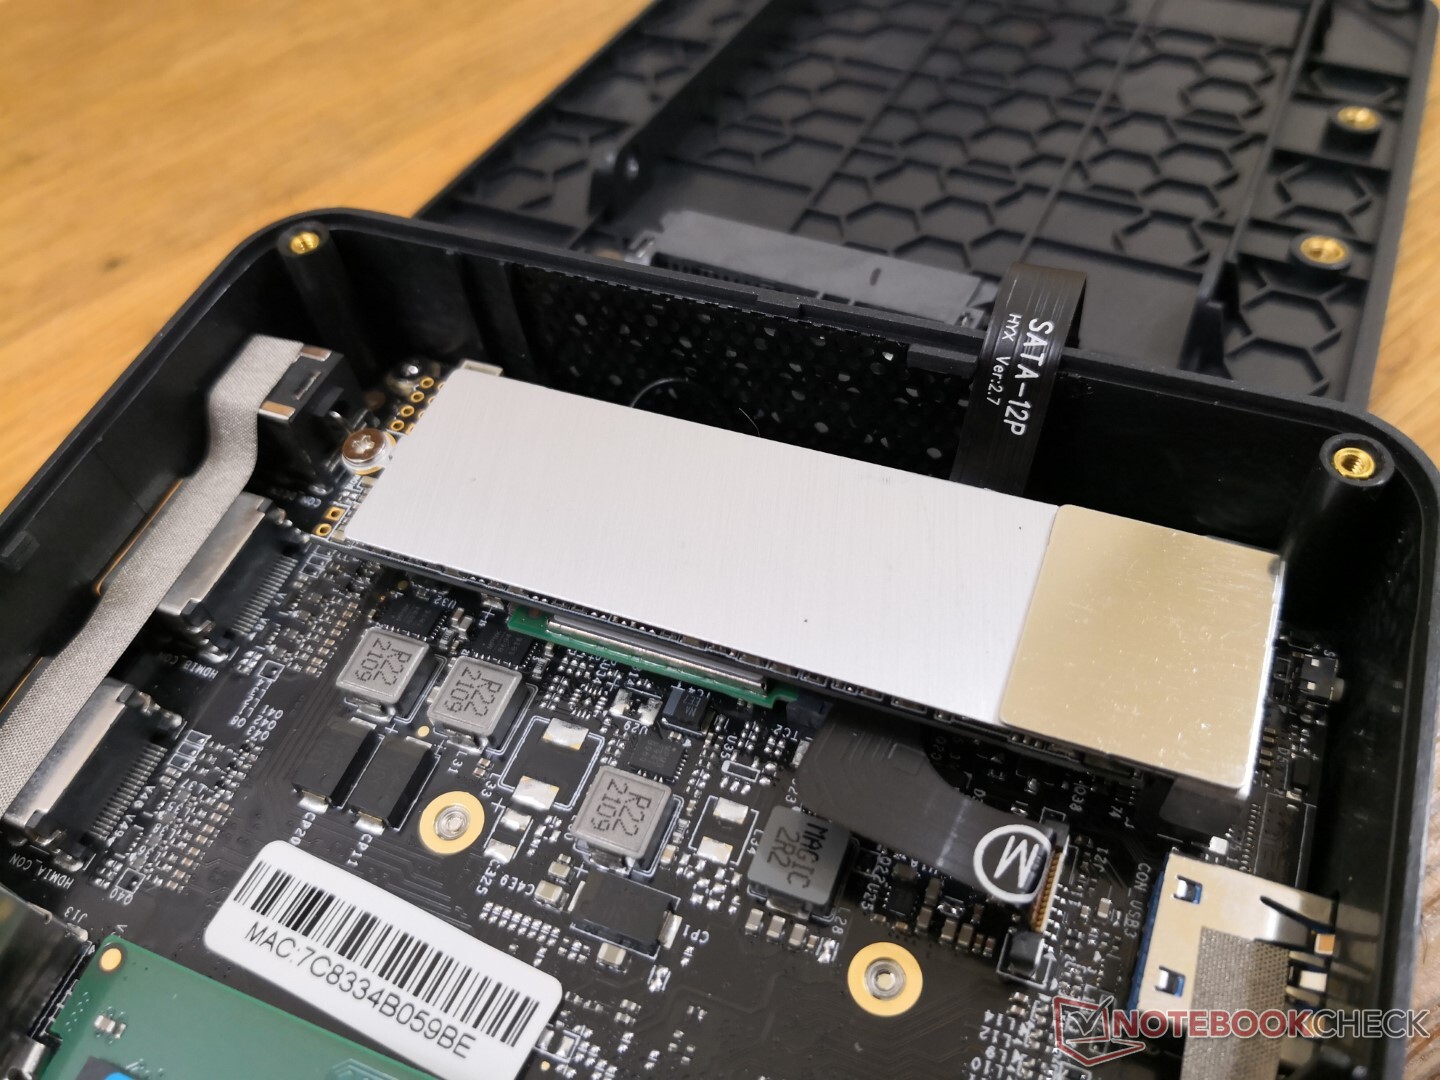
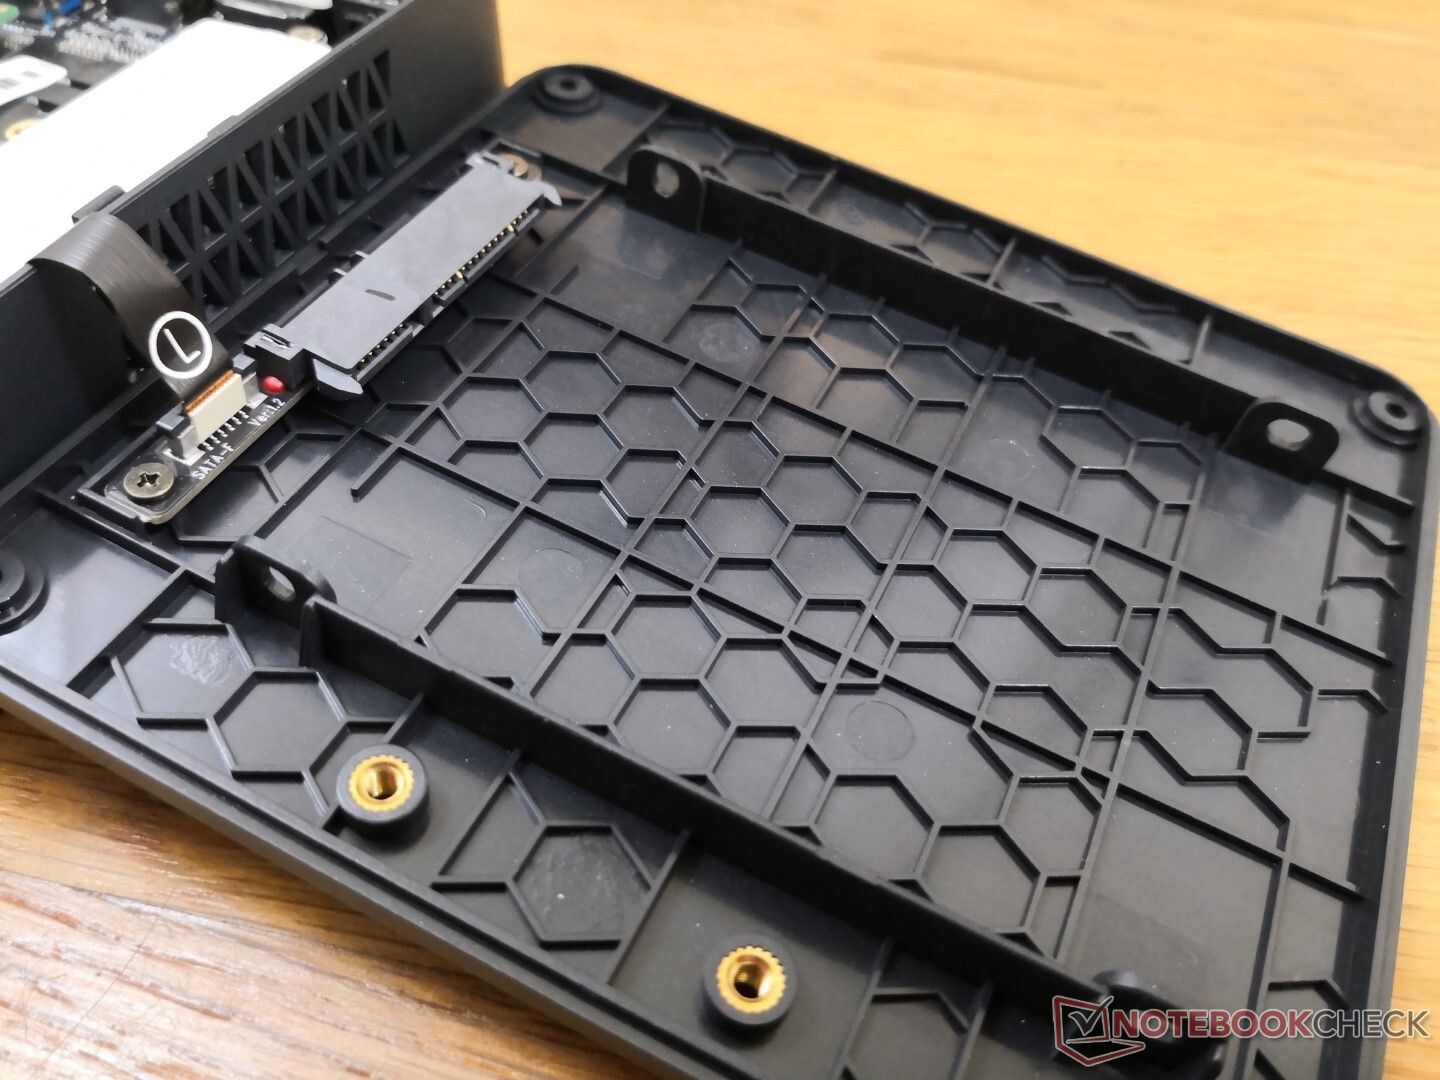
Underhåll
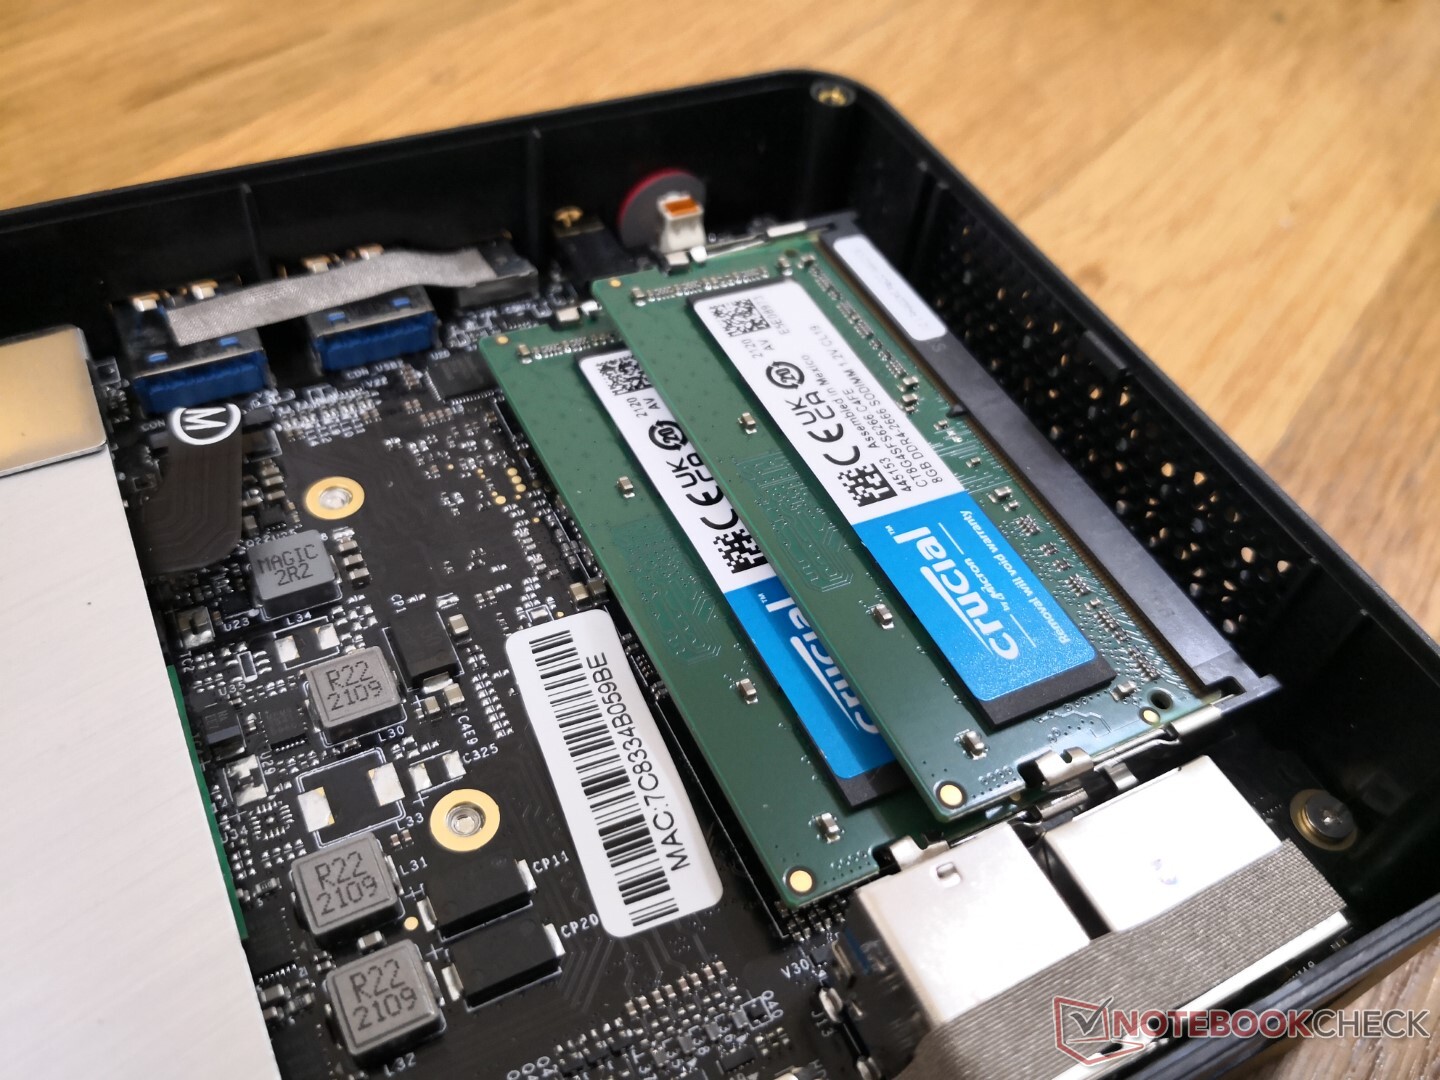
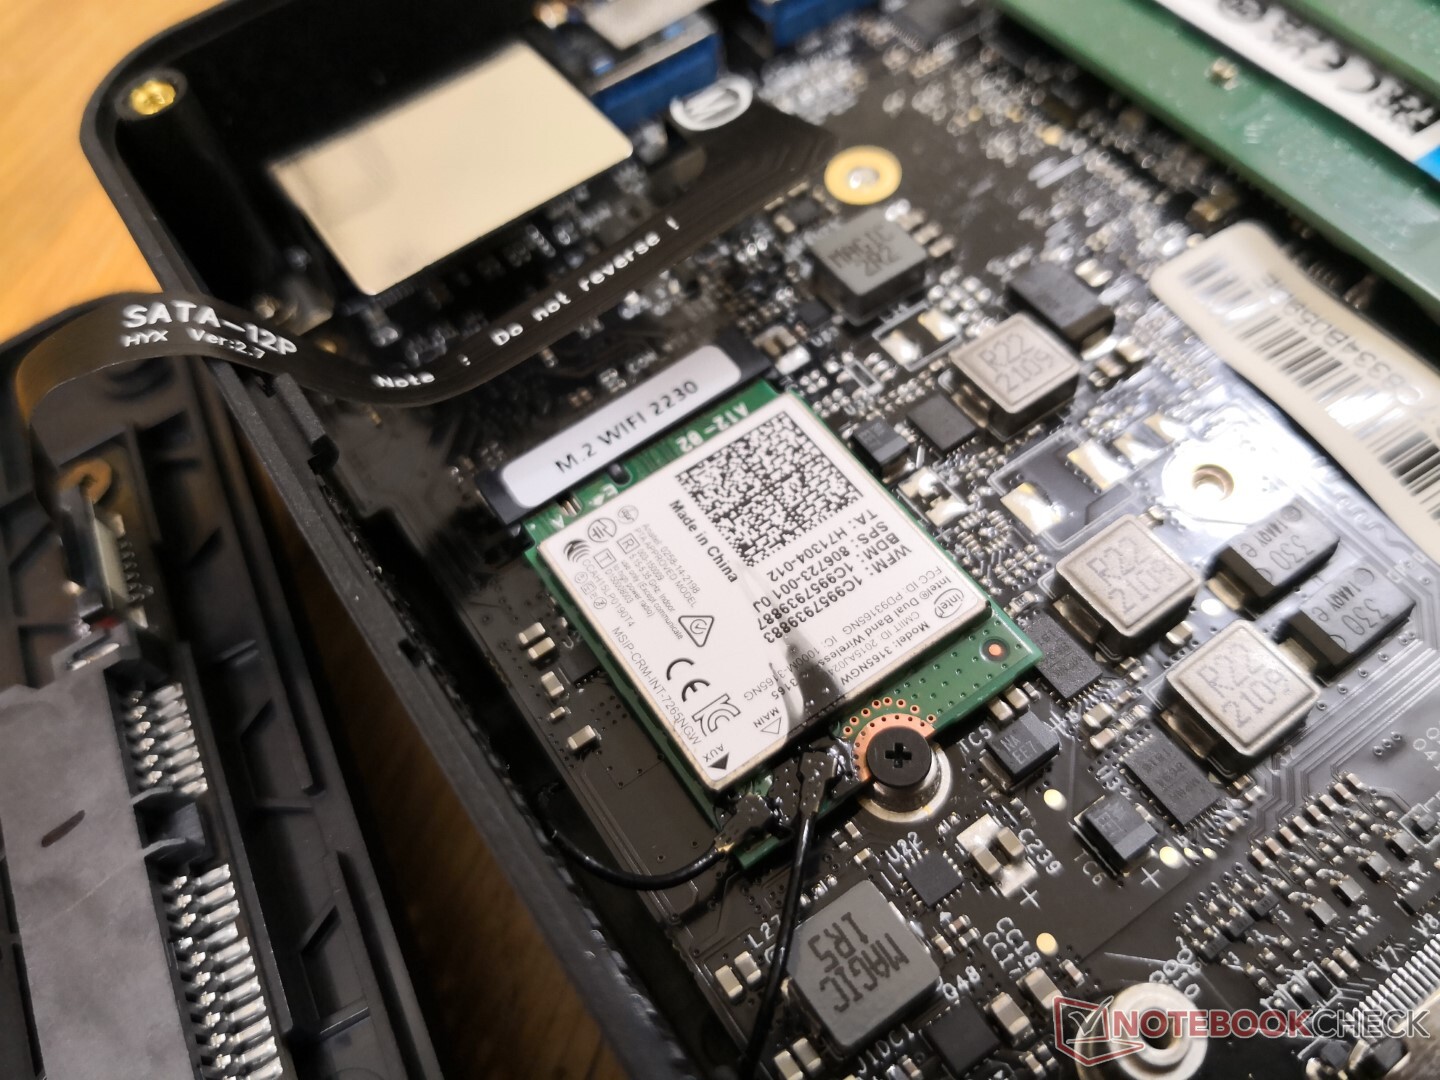
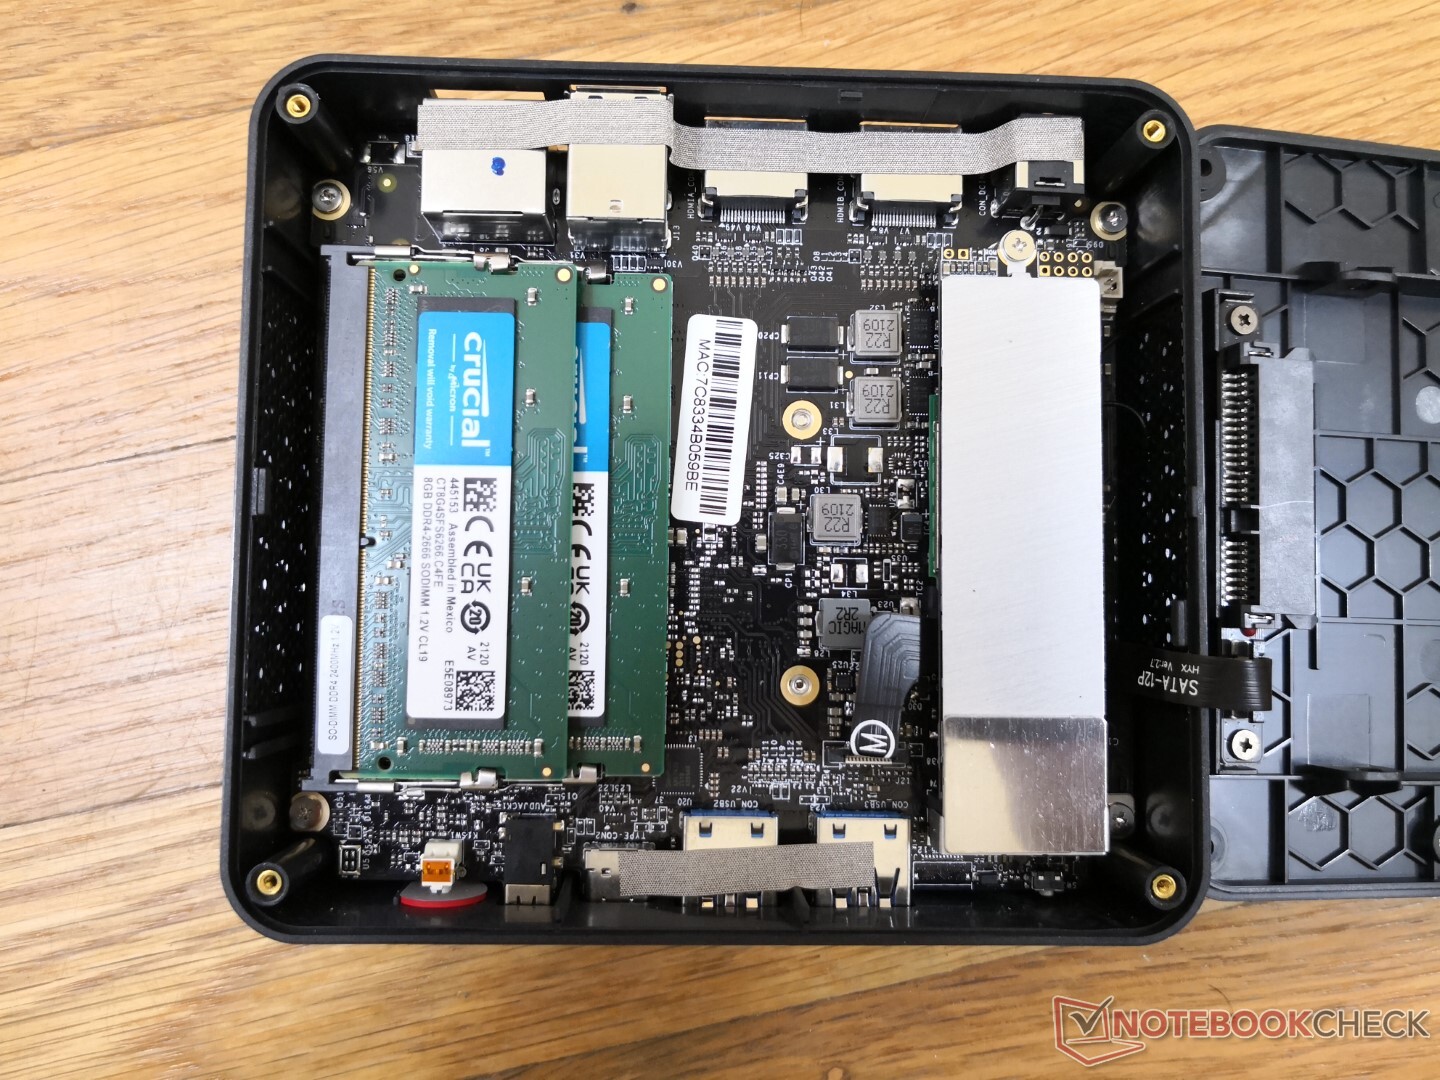
Bottenpanelen är säkrad med bara fyra Philips-skruvar för enkel borttagning. Användarna har direkt tillgång till 2x SODIMM-fack, den avtagbara M.2 WLAN-modulen och två lagringsfack (M.2 2280 SATA III + 2,5-tums SATA III). Tyvärr kräver processorn och fläkten ytterligare demontering eftersom båda finns på andra sidan av moderkortet.
Tillbehör och garanti
I förpackningen ingår två HDMI-kablar, växelströmsadapter, pappersarbete och ett avtagbart VESA-monteringsfäste. Den standardmässiga ettåriga begränsade garantin gäller
Prestanda
Processor
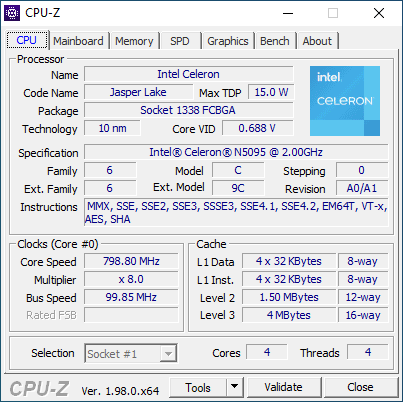
CPU-prestanda med flera trådar ligger förvånansvärt nära Ice Lake.Core i3-1005G1. Omvänt är prestandan för entrådig processorer mycket långsammare, med 30-40 procent. Celeron N5095 har fyra fysiska kärnor utan Hyper-Threading medan i3-1005G1 har två fysiska kärnor med Hyper-Threading och därför är det inte oväntat att se snabbare prestanda för en enda tråd på processorn med färre kärnor. Prestandahållbarheten över tid är annars utmärkt när man kör CineBench R15 xT i en slinga.
Cinebench R15 Multi Loop
Cinebench R23: Multi Core | Single Core
Cinebench R20: CPU (Multi Core) | CPU (Single Core)
Cinebench R15: CPU Multi 64Bit | CPU Single 64Bit
Blender: v2.79 BMW27 CPU
7-Zip 18.03: 7z b 4 | 7z b 4 -mmt1
Geekbench 5.5: Multi-Core | Single-Core
HWBOT x265 Benchmark v2.2: 4k Preset
LibreOffice : 20 Documents To PDF
R Benchmark 2.5: Overall mean
| CPU Performance rating | |
| Intel NUC11TNKi5 | |
| Intel NUC8i7BE -3! | |
| Zotac ZBOX MI642 Nano -2! | |
| Beelink SEi10 -2! | |
| Beelink U59 -2! | |
| Genomsnitt Intel Celeron N5095 | |
| GMK NucBox K1 -2! | |
| Blackview AceBook 1 -2! | |
| Jumper Tech Ez Book X3 Air -2! | |
| Asus BR1100FKA-BP0109RA | |
| Chuwi LapBook Plus -6! | |
| Cinebench R23 / Multi Core | |
| Intel NUC11TNKi5 | |
| Beelink U59 | |
| Genomsnitt Intel Celeron N5095 (2150 - 2219, n=5) | |
| Blackview AceBook 1 | |
| Asus BR1100FKA-BP0109RA | |
| Cinebench R23 / Single Core | |
| Intel NUC11TNKi5 | |
| Beelink U59 | |
| Genomsnitt Intel Celeron N5095 (587 - 621, n=5) | |
| Asus BR1100FKA-BP0109RA | |
| Blackview AceBook 1 | |
| Cinebench R20 / CPU (Multi Core) | |
| Intel NUC11TNKi5 | |
| Intel NUC8i7BE | |
| Zotac ZBOX MI642 Nano | |
| Beelink SEi10 | |
| Beelink U59 | |
| Genomsnitt Intel Celeron N5095 (804 - 844, n=5) | |
| Jumper Tech Ez Book X3 Air | |
| Blackview AceBook 1 | |
| Asus BR1100FKA-BP0109RA | |
| GMK NucBox K1 | |
| Chuwi LapBook Plus | |
| Cinebench R20 / CPU (Single Core) | |
| Intel NUC11TNKi5 | |
| Intel NUC8i7BE | |
| Zotac ZBOX MI642 Nano | |
| Beelink SEi10 | |
| Beelink U59 | |
| Genomsnitt Intel Celeron N5095 (228 - 239, n=5) | |
| Asus BR1100FKA-BP0109RA | |
| GMK NucBox K1 | |
| Blackview AceBook 1 | |
| Jumper Tech Ez Book X3 Air | |
| Chuwi LapBook Plus | |
| Cinebench R15 / CPU Multi 64Bit | |
| Intel NUC8i7BE | |
| Intel NUC11TNKi5 | |
| Zotac ZBOX MI642 Nano | |
| Beelink SEi10 | |
| Beelink U59 | |
| Genomsnitt Intel Celeron N5095 (221 - 379, n=6) | |
| GMK NucBox K1 | |
| Blackview AceBook 1 | |
| Jumper Tech Ez Book X3 Air | |
| Asus BR1100FKA-BP0109RA | |
| Chuwi LapBook Plus | |
| Cinebench R15 / CPU Single 64Bit | |
| Intel NUC11TNKi5 | |
| Intel NUC8i7BE | |
| Zotac ZBOX MI642 Nano | |
| Beelink SEi10 | |
| Beelink U59 | |
| Genomsnitt Intel Celeron N5095 (95.4 - 109, n=5) | |
| Asus BR1100FKA-BP0109RA | |
| GMK NucBox K1 | |
| Blackview AceBook 1 | |
| Jumper Tech Ez Book X3 Air | |
| Chuwi LapBook Plus | |
| Blender / v2.79 BMW27 CPU | |
| Chuwi LapBook Plus | |
| Asus BR1100FKA-BP0109RA | |
| Jumper Tech Ez Book X3 Air | |
| Blackview AceBook 1 | |
| GMK NucBox K1 | |
| Genomsnitt Intel Celeron N5095 (1502 - 1624, n=5) | |
| Beelink U59 | |
| Beelink SEi10 | |
| Zotac ZBOX MI642 Nano | |
| Intel NUC8i7BE | |
| Intel NUC8i7BE | |
| Intel NUC11TNKi5 | |
| 7-Zip 18.03 / 7z b 4 | |
| Intel NUC8i7BE | |
| Intel NUC8i7BE | |
| Intel NUC11TNKi5 | |
| Zotac ZBOX MI642 Nano | |
| Beelink U59 | |
| Genomsnitt Intel Celeron N5095 (10924 - 11168, n=5) | |
| Beelink SEi10 | |
| GMK NucBox K1 | |
| Blackview AceBook 1 | |
| Jumper Tech Ez Book X3 Air | |
| Asus BR1100FKA-BP0109RA | |
| Chuwi LapBook Plus | |
| 7-Zip 18.03 / 7z b 4 -mmt1 | |
| Intel NUC8i7BE | |
| Intel NUC8i7BE | |
| Intel NUC11TNKi5 | |
| Zotac ZBOX MI642 Nano | |
| Beelink SEi10 | |
| Beelink U59 | |
| Genomsnitt Intel Celeron N5095 (2935 - 3124, n=5) | |
| Asus BR1100FKA-BP0109RA | |
| Blackview AceBook 1 | |
| GMK NucBox K1 | |
| Jumper Tech Ez Book X3 Air | |
| Chuwi LapBook Plus | |
| Geekbench 5.5 / Multi-Core | |
| Intel NUC11TNKi5 | |
| Zotac ZBOX MI642 Nano | |
| Intel NUC8i7BE | |
| Beelink SEi10 | |
| Genomsnitt Intel Celeron N5095 (1933 - 2052, n=4) | |
| Jumper Tech Ez Book X3 Air | |
| GMK NucBox K1 | |
| Asus BR1100FKA-BP0109RA | |
| Geekbench 5.5 / Single-Core | |
| Intel NUC11TNKi5 | |
| Beelink SEi10 | |
| Zotac ZBOX MI642 Nano | |
| Intel NUC8i7BE | |
| Genomsnitt Intel Celeron N5095 (637 - 659, n=4) | |
| GMK NucBox K1 | |
| Jumper Tech Ez Book X3 Air | |
| Asus BR1100FKA-BP0109RA | |
| HWBOT x265 Benchmark v2.2 / 4k Preset | |
| Intel NUC11TNKi5 | |
| Intel NUC8i7BE | |
| Intel NUC8i7BE | |
| Zotac ZBOX MI642 Nano | |
| Beelink SEi10 | |
| Beelink U59 | |
| Genomsnitt Intel Celeron N5095 (1.9 - 2.05, n=5) | |
| GMK NucBox K1 | |
| Jumper Tech Ez Book X3 Air | |
| Blackview AceBook 1 | |
| Chuwi LapBook Plus | |
| Asus BR1100FKA-BP0109RA | |
| LibreOffice / 20 Documents To PDF | |
| Asus BR1100FKA-BP0109RA | |
| Blackview AceBook 1 | |
| Jumper Tech Ez Book X3 Air | |
| GMK NucBox K1 | |
| Genomsnitt Intel Celeron N5095 (97 - 107.9, n=5) | |
| Beelink U59 | |
| Zotac ZBOX MI642 Nano | |
| Beelink SEi10 | |
| Intel NUC11TNKi5 | |
| R Benchmark 2.5 / Overall mean | |
| Asus BR1100FKA-BP0109RA | |
| Jumper Tech Ez Book X3 Air | |
| Blackview AceBook 1 | |
| GMK NucBox K1 | |
| Genomsnitt Intel Celeron N5095 (1.16 - 1.2, n=5) | |
| Beelink U59 | |
| Beelink SEi10 | |
| Zotac ZBOX MI642 Nano | |
| Intel NUC8i7BE | |
| Intel NUC11TNKi5 | |
* ... mindre är bättre
AIDA64: FP32 Ray-Trace | FPU Julia | CPU SHA3 | CPU Queen | FPU SinJulia | FPU Mandel | CPU AES | CPU ZLib | FP64 Ray-Trace | CPU PhotoWorxx
| Performance rating | |
| Intel NUC11TNKi5 | |
| Intel NUC8i7BE -1! | |
| Zotac ZBOX MI642 Nano | |
| Beelink U59 | |
| AIDA64 / FP32 Ray-Trace | |
| Intel NUC11TNKi5 | |
| Intel NUC8i7BE | |
| Zotac ZBOX MI642 Nano | |
| Beelink U59 | |
| AIDA64 / FPU Julia | |
| Intel NUC11TNKi5 | |
| Intel NUC8i7BE | |
| Zotac ZBOX MI642 Nano | |
| Beelink U59 | |
| AIDA64 / CPU SHA3 | |
| Intel NUC11TNKi5 | |
| Zotac ZBOX MI642 Nano | |
| Beelink U59 | |
| AIDA64 / CPU Queen | |
| Intel NUC8i7BE | |
| Zotac ZBOX MI642 Nano | |
| Intel NUC11TNKi5 | |
| Beelink U59 | |
| AIDA64 / FPU SinJulia | |
| Intel NUC8i7BE | |
| Intel NUC11TNKi5 | |
| Zotac ZBOX MI642 Nano | |
| Beelink U59 | |
| AIDA64 / FPU Mandel | |
| Intel NUC11TNKi5 | |
| Intel NUC8i7BE | |
| Zotac ZBOX MI642 Nano | |
| Beelink U59 | |
| AIDA64 / CPU AES | |
| Intel NUC11TNKi5 | |
| Beelink U59 | |
| Intel NUC8i7BE | |
| Zotac ZBOX MI642 Nano | |
| AIDA64 / CPU ZLib | |
| Intel NUC11TNKi5 | |
| Intel NUC8i7BE | |
| Zotac ZBOX MI642 Nano | |
| Beelink U59 | |
| AIDA64 / FP64 Ray-Trace | |
| Intel NUC11TNKi5 | |
| Intel NUC8i7BE | |
| Zotac ZBOX MI642 Nano | |
| Beelink U59 | |
| AIDA64 / CPU PhotoWorxx | |
| Intel NUC8i7BE | |
| Intel NUC11TNKi5 | |
| Zotac ZBOX MI642 Nano | |
| Beelink U59 | |
Systemets prestanda
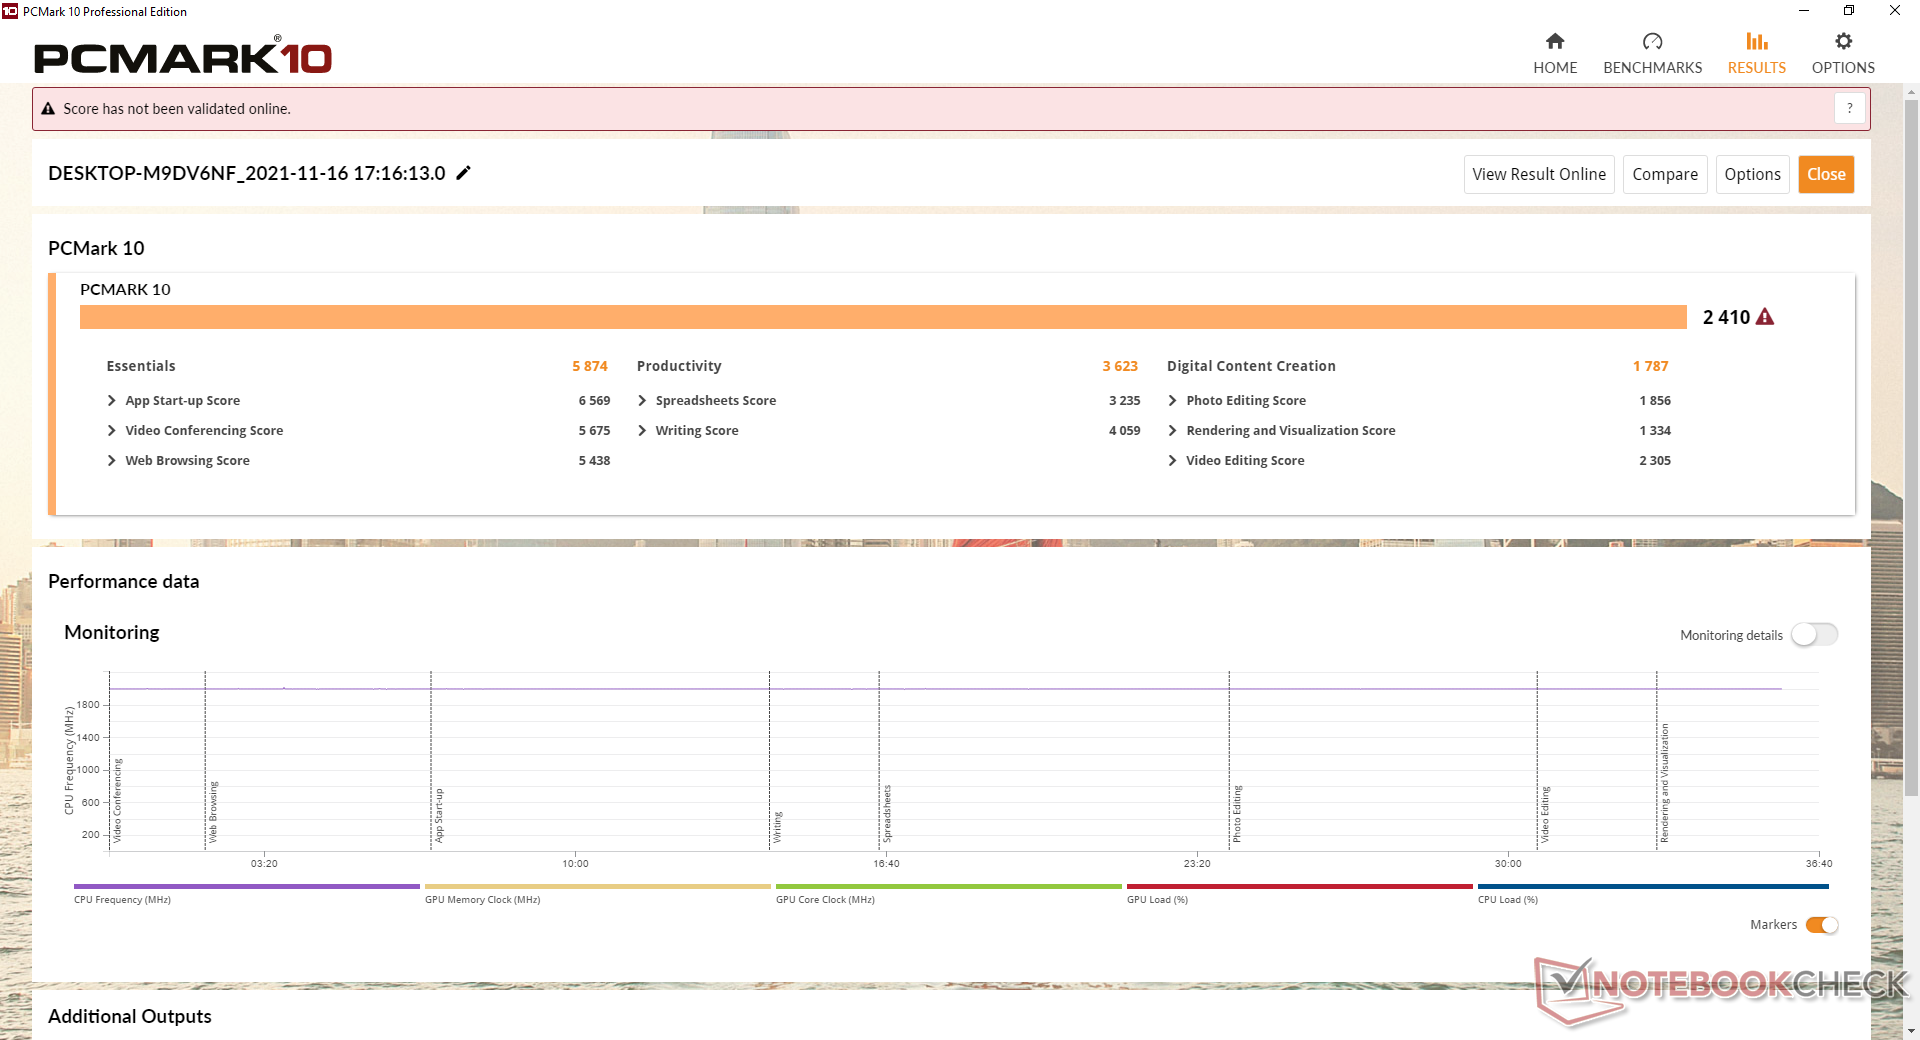
PCMark 10-resultaten är genomgående högre änGMK NucBox K1 samtidigt som de är långsammare än den Core i3-drivna Beelink SEi10.
| PCMark 10 / Score | |
| Intel NUC8i7BE | |
| Intel NUC11TNKi5 | |
| Zotac ZBOX MI642 Nano | |
| Beelink SEi10 | |
| Beelink U59 | |
| Genomsnitt Intel Celeron N5095, Intel UHD Graphics (Jasper Lake 16 EU) (2317 - 2417, n=5) | |
| GMK NucBox K1 | |
| PCMark 10 / Essentials | |
| Intel NUC11TNKi5 | |
| Intel NUC8i7BE | |
| Zotac ZBOX MI642 Nano | |
| Beelink SEi10 | |
| Beelink U59 | |
| Genomsnitt Intel Celeron N5095, Intel UHD Graphics (Jasper Lake 16 EU) (5516 - 5874, n=5) | |
| GMK NucBox K1 | |
| PCMark 10 / Productivity | |
| Intel NUC8i7BE | |
| Zotac ZBOX MI642 Nano | |
| Intel NUC11TNKi5 | |
| Beelink SEi10 | |
| Beelink U59 | |
| Genomsnitt Intel Celeron N5095, Intel UHD Graphics (Jasper Lake 16 EU) (3454 - 3666, n=5) | |
| GMK NucBox K1 | |
| PCMark 10 / Digital Content Creation | |
| Intel NUC11TNKi5 | |
| Intel NUC8i7BE | |
| Zotac ZBOX MI642 Nano | |
| Beelink SEi10 | |
| Beelink U59 | |
| Genomsnitt Intel Celeron N5095, Intel UHD Graphics (Jasper Lake 16 EU) (1752 - 1787, n=5) | |
| GMK NucBox K1 | |
| PCMark 10 Score | 2410 poäng | |
Hjälp | ||
| AIDA64 / Memory Copy | |
| Intel NUC8i7BE | |
| Zotac ZBOX MI642 Nano | |
| Beelink U59 | |
| Intel NUC11TNKi5 | |
| AIDA64 / Memory Read | |
| Intel NUC8i7BE | |
| Zotac ZBOX MI642 Nano | |
| Intel NUC11TNKi5 | |
| Beelink U59 | |
| AIDA64 / Memory Write | |
| Intel NUC8i7BE | |
| Zotac ZBOX MI642 Nano | |
| Beelink U59 | |
| Intel NUC11TNKi5 | |
| AIDA64 / Memory Latency | |
| Zotac ZBOX MI642 Nano | |
| Intel NUC11TNKi5 | |
| Beelink U59 | |
| Intel NUC8i7BE | |
* ... mindre är bättre
DPC-latenstid
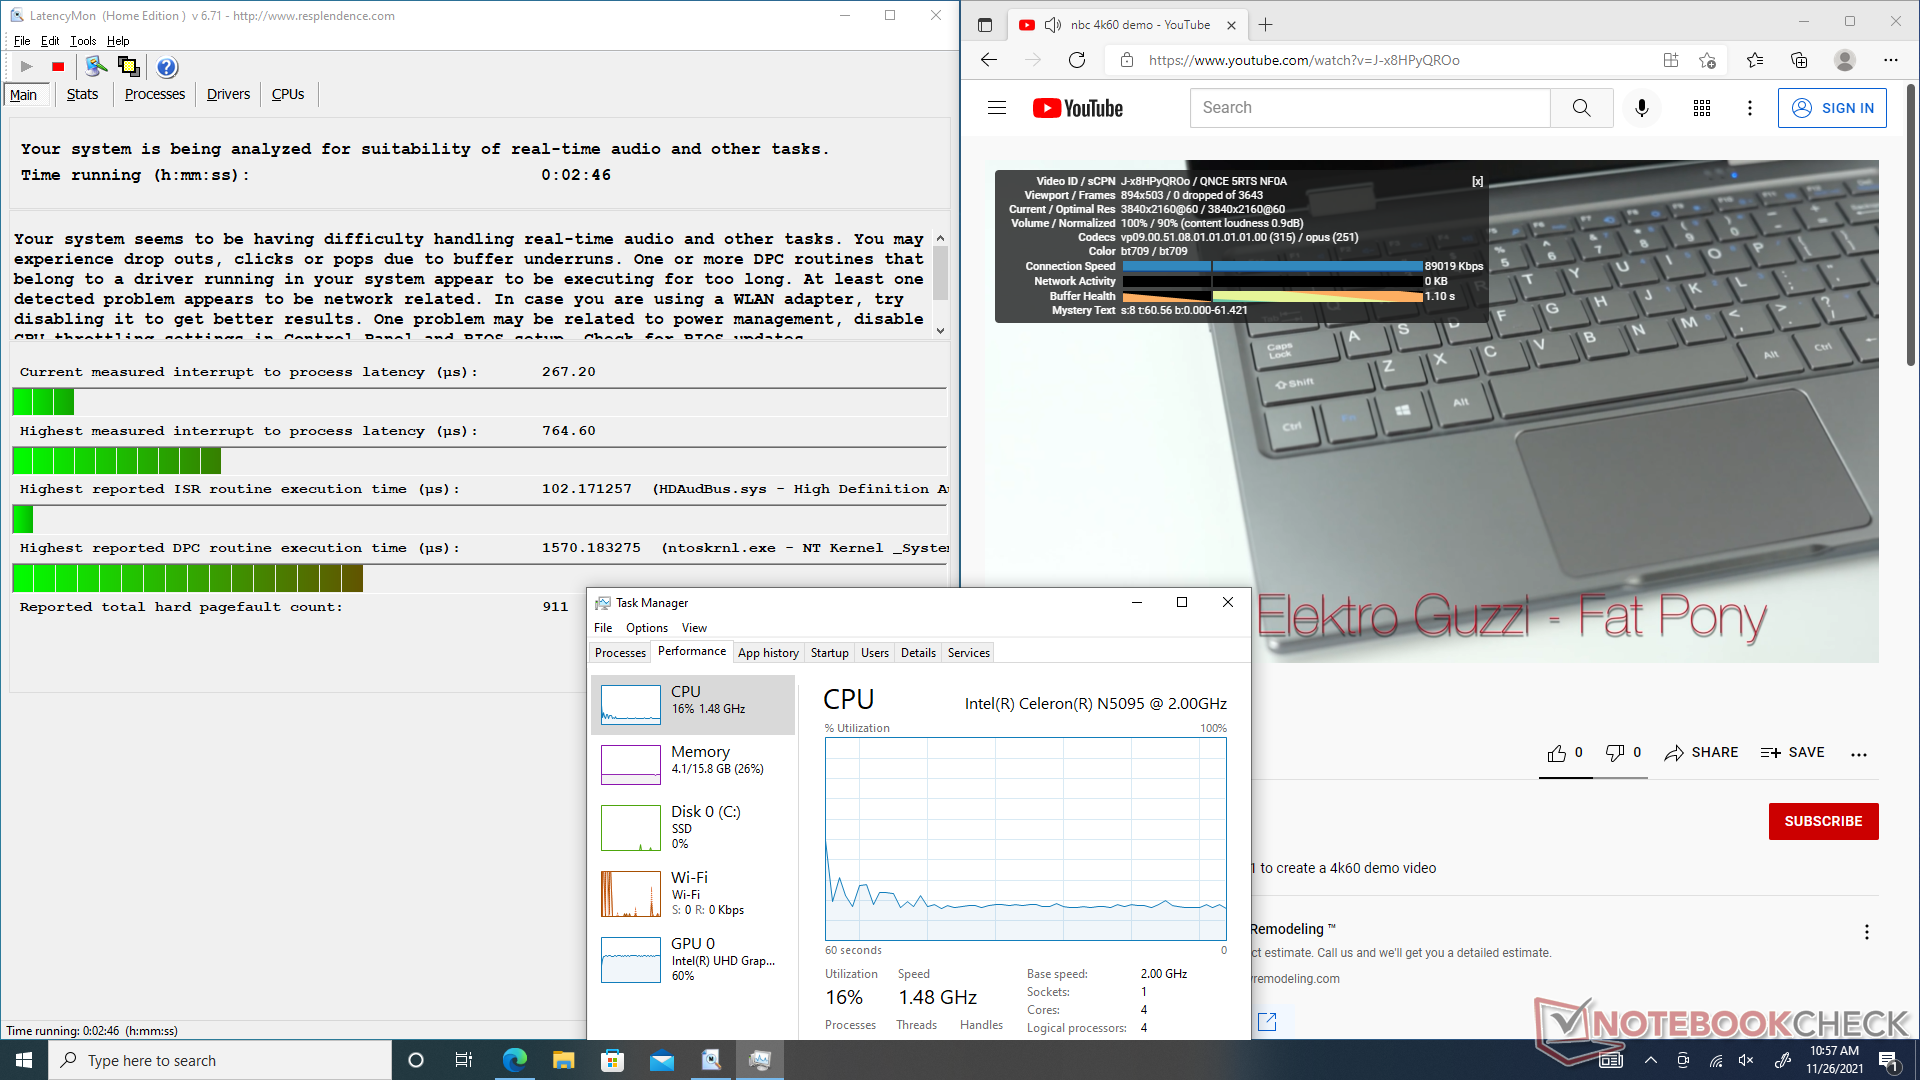
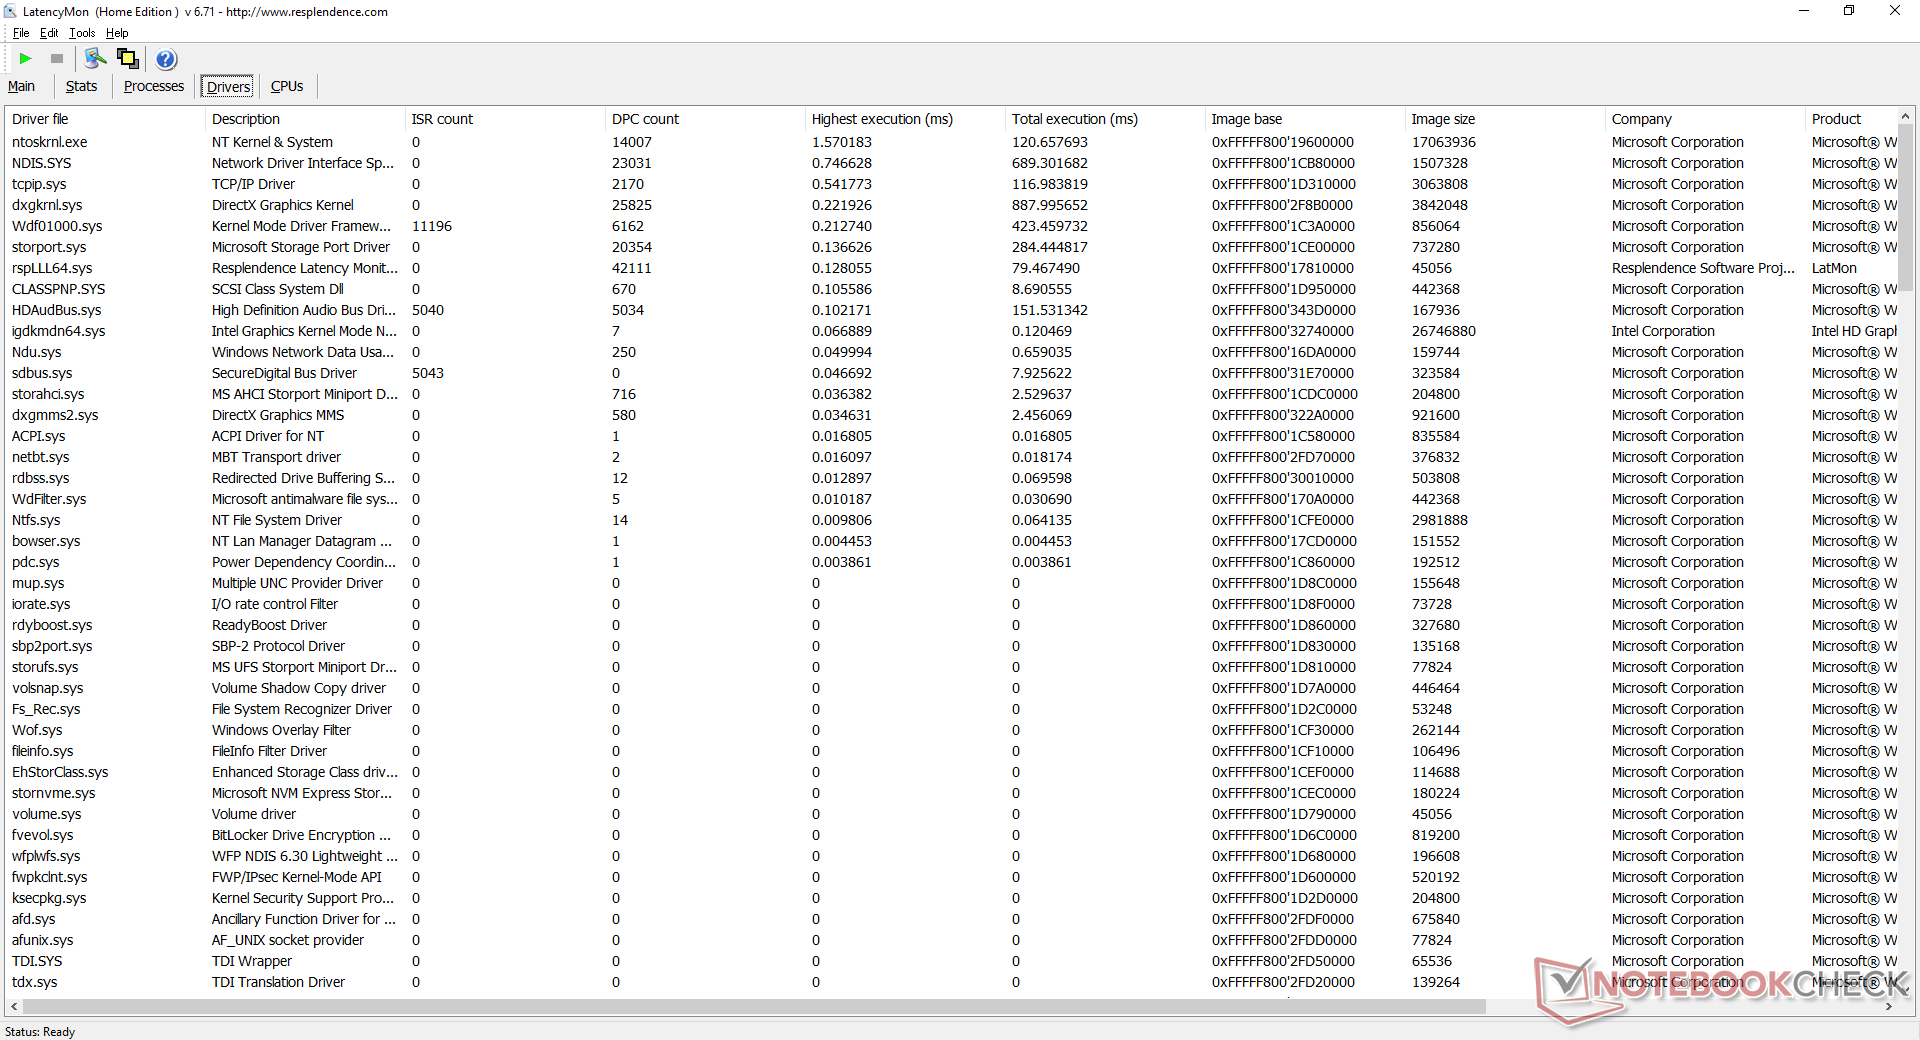
LatencyMon avslöjar mindre problem med DPC-avbrottet när man öppnar flera webbläsarflikar på vår hemsida. Uppspelning av 4K-video är annars utmärkt utan några tappade bilder under vårt minutlånga test. GPU-utnyttjandet skulle vara relativt högt med 60 procent.
| DPC Latencies / LatencyMon - interrupt to process latency (max), Web, Youtube, Prime95 | |
| GMK NucBox K1 | |
| Beelink SEi10 | |
| Beelink U59 | |
| Intel NUC11TNKi5 | |
* ... mindre är bättre
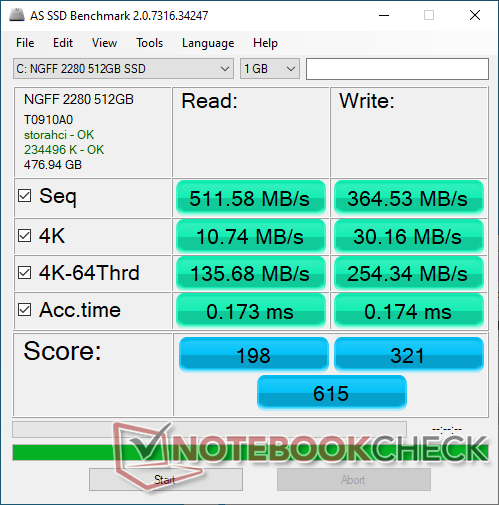
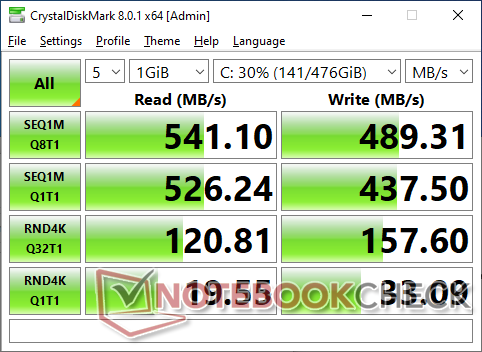
Lagringsenheter
Vår testenhet levereras med en 512 GB AZW M.2 2280 SATA III SSD vilket är ett relativt okänt märke som sannolikt sparar på kostnaderna. De flesta andra datorer använder mer välkända SSD-märken som Samsung, Intel, Kingston eller andra. Överföringshastigheterna är ändå utmärkta för en SATA III-enhet med sekventiella läs- och skrivhastigheter på cirka 500 MB/s vardera.

| Drive Performance rating - Percent | |
| Beelink SEi10 | |
| Zotac ZBOX MI642 Nano | |
| Intel NUC11TNKi5 | |
| Beelink U59 | |
| GMK NucBox K1 | |
| DiskSpd | |
| seq read | |
| Beelink SEi10 | |
| Intel NUC11TNKi5 | |
| Zotac ZBOX MI642 Nano | |
| Beelink U59 | |
| GMK NucBox K1 | |
| seq write | |
| Beelink SEi10 | |
| Zotac ZBOX MI642 Nano | |
| Intel NUC11TNKi5 | |
| Beelink U59 | |
| GMK NucBox K1 | |
| seq q8 t1 read | |
| Beelink SEi10 | |
| Intel NUC11TNKi5 | |
| Zotac ZBOX MI642 Nano | |
| Beelink U59 | |
| GMK NucBox K1 | |
| seq q8 t1 write | |
| Beelink SEi10 | |
| Zotac ZBOX MI642 Nano | |
| Intel NUC11TNKi5 | |
| GMK NucBox K1 | |
| Beelink U59 | |
| 4k q1 t1 read | |
| Beelink SEi10 | |
| Zotac ZBOX MI642 Nano | |
| Intel NUC11TNKi5 | |
| Beelink U59 | |
| GMK NucBox K1 | |
| 4k q1 t1 write | |
| Beelink SEi10 | |
| Zotac ZBOX MI642 Nano | |
| GMK NucBox K1 | |
| Intel NUC11TNKi5 | |
| Beelink U59 | |
| 4k q32 t16 read | |
| Beelink SEi10 | |
| Zotac ZBOX MI642 Nano | |
| Intel NUC11TNKi5 | |
| Beelink U59 | |
| GMK NucBox K1 | |
| 4k q32 t16 write | |
| Beelink SEi10 | |
| Intel NUC11TNKi5 | |
| Zotac ZBOX MI642 Nano | |
| GMK NucBox K1 | |
| Beelink U59 | |
| AS SSD | |
| Score Total | |
| Zotac ZBOX MI642 Nano | |
| Beelink SEi10 | |
| Intel NUC11TNKi5 | |
| Beelink U59 | |
| GMK NucBox K1 | |
| Score Read | |
| Beelink SEi10 | |
| Zotac ZBOX MI642 Nano | |
| Intel NUC11TNKi5 | |
| Beelink U59 | |
| GMK NucBox K1 | |
| Score Write | |
| Intel NUC11TNKi5 | |
| Zotac ZBOX MI642 Nano | |
| Beelink U59 | |
| Beelink SEi10 | |
| GMK NucBox K1 | |
| Seq Read | |
| Beelink SEi10 | |
| Intel NUC11TNKi5 | |
| Beelink U59 | |
| Zotac ZBOX MI642 Nano | |
| GMK NucBox K1 | |
| Seq Write | |
| Intel NUC11TNKi5 | |
| Zotac ZBOX MI642 Nano | |
| GMK NucBox K1 | |
| Beelink U59 | |
| Beelink SEi10 | |
| 4K Read | |
| Zotac ZBOX MI642 Nano | |
| Beelink SEi10 | |
| Intel NUC11TNKi5 | |
| Beelink U59 | |
| GMK NucBox K1 | |
| 4K Write | |
| Zotac ZBOX MI642 Nano | |
| Beelink SEi10 | |
| GMK NucBox K1 | |
| Intel NUC11TNKi5 | |
| Beelink U59 | |
| 4K-64 Read | |
| Zotac ZBOX MI642 Nano | |
| Beelink SEi10 | |
| Intel NUC11TNKi5 | |
| Beelink U59 | |
| GMK NucBox K1 | |
| 4K-64 Write | |
| Intel NUC11TNKi5 | |
| Beelink U59 | |
| Zotac ZBOX MI642 Nano | |
| Beelink SEi10 | |
| GMK NucBox K1 | |
| Access Time Read | |
| GMK NucBox K1 | |
| Beelink U59 | |
| Intel NUC11TNKi5 | |
| Zotac ZBOX MI642 Nano | |
| Beelink SEi10 | |
| Access Time Write | |
| Beelink SEi10 | |
| GMK NucBox K1 | |
| Intel NUC11TNKi5 | |
| Beelink U59 | |
| Zotac ZBOX MI642 Nano | |
* ... mindre är bättre
Disk Throttling: DiskSpd Read Loop, Queue Depth 8
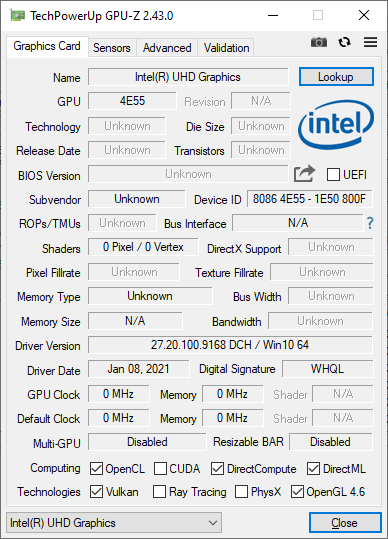
GPU-prestanda
Grafikprestanda är cirka 40-50 procent långsammare än den vanliga UHD Graphics 620 som fanns i äldre bärbara datorer och minidatorer före införandet av Iris Xe. Även om du kan streama kan du inte förvänta dig att de flesta inhemska spel körs bra.
| 3DMark Performance rating - Percent | |
| Intel NUC11TNKi5 | |
| Intel NUC8i7BE | |
| Zotac ZBOX MI642 Nano -3! | |
| Prime Computer PrimeMini 5 i7 NUC8v7PNB | |
| Beelink SEi10 | |
| Beelink U59 | |
| Genomsnitt Intel UHD Graphics (Jasper Lake 16 EU) | |
| Chuwi LapBook Plus -1! | |
| Blackview AceBook 1 -2! | |
| Asus BR1100FKA-BP0109RA | |
| GMK NucBox K1 | |
| Jumper Tech Ez Book X3 Air -1! | |
| 3DMark | |
| 1280x720 Cloud Gate Standard Graphics | |
| Intel NUC11TNKi5 | |
| Intel NUC8i7BE | |
| Zotac ZBOX MI642 Nano | |
| Prime Computer PrimeMini 5 i7 NUC8v7PNB | |
| Beelink SEi10 | |
| Beelink U59 | |
| Genomsnitt Intel UHD Graphics (Jasper Lake 16 EU) (4210 - 5217, n=8) | |
| Asus BR1100FKA-BP0109RA | |
| Chuwi LapBook Plus | |
| Blackview AceBook 1 | |
| GMK NucBox K1 | |
| 1920x1080 Fire Strike Graphics | |
| Intel NUC11TNKi5 | |
| Intel NUC8i7BE | |
| Zotac ZBOX MI642 Nano | |
| Prime Computer PrimeMini 5 i7 NUC8v7PNB | |
| Beelink SEi10 | |
| Beelink U59 | |
| Genomsnitt Intel UHD Graphics (Jasper Lake 16 EU) (392 - 679, n=8) | |
| Jumper Tech Ez Book X3 Air | |
| Blackview AceBook 1 | |
| GMK NucBox K1 | |
| Asus BR1100FKA-BP0109RA | |
| 2560x1440 Time Spy Graphics | |
| Intel NUC11TNKi5 | |
| Intel NUC8i7BE | |
| Prime Computer PrimeMini 5 i7 NUC8v7PNB | |
| Beelink SEi10 | |
| Beelink U59 | |
| Genomsnitt Intel UHD Graphics (Jasper Lake 16 EU) (129 - 182, n=5) | |
| Chuwi LapBook Plus | |
| Asus BR1100FKA-BP0109RA | |
| Jumper Tech Ez Book X3 Air | |
| GMK NucBox K1 | |
| 2560x1440 Time Spy Score | |
| Intel NUC11TNKi5 | |
| Intel NUC8i7BE | |
| Prime Computer PrimeMini 5 i7 NUC8v7PNB | |
| Beelink SEi10 | |
| Beelink U59 | |
| Genomsnitt Intel UHD Graphics (Jasper Lake 16 EU) (145 - 210, n=5) | |
| Chuwi LapBook Plus | |
| Asus BR1100FKA-BP0109RA | |
| Jumper Tech Ez Book X3 Air | |
| GMK NucBox K1 | |
| 3DMark 11 - 1280x720 Performance GPU | |
| Intel NUC11TNKi5 | |
| Intel NUC8i7BE | |
| Prime Computer PrimeMini 5 i7 NUC8v7PNB | |
| Beelink SEi10 | |
| Beelink U59 | |
| Genomsnitt Intel UHD Graphics (Jasper Lake 16 EU) (554 - 894, n=8) | |
| Chuwi LapBook Plus | |
| Jumper Tech Ez Book X3 Air | |
| GMK NucBox K1 | |
| Blackview AceBook 1 | |
| Asus BR1100FKA-BP0109RA | |
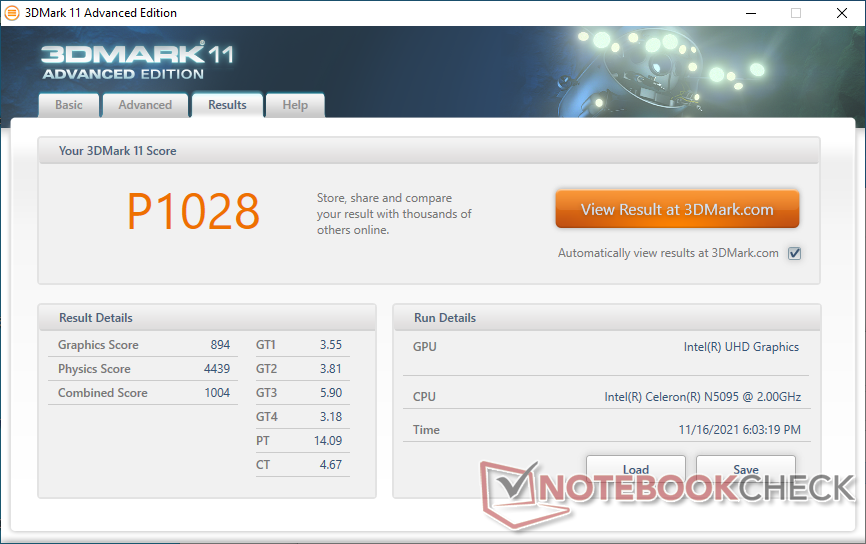
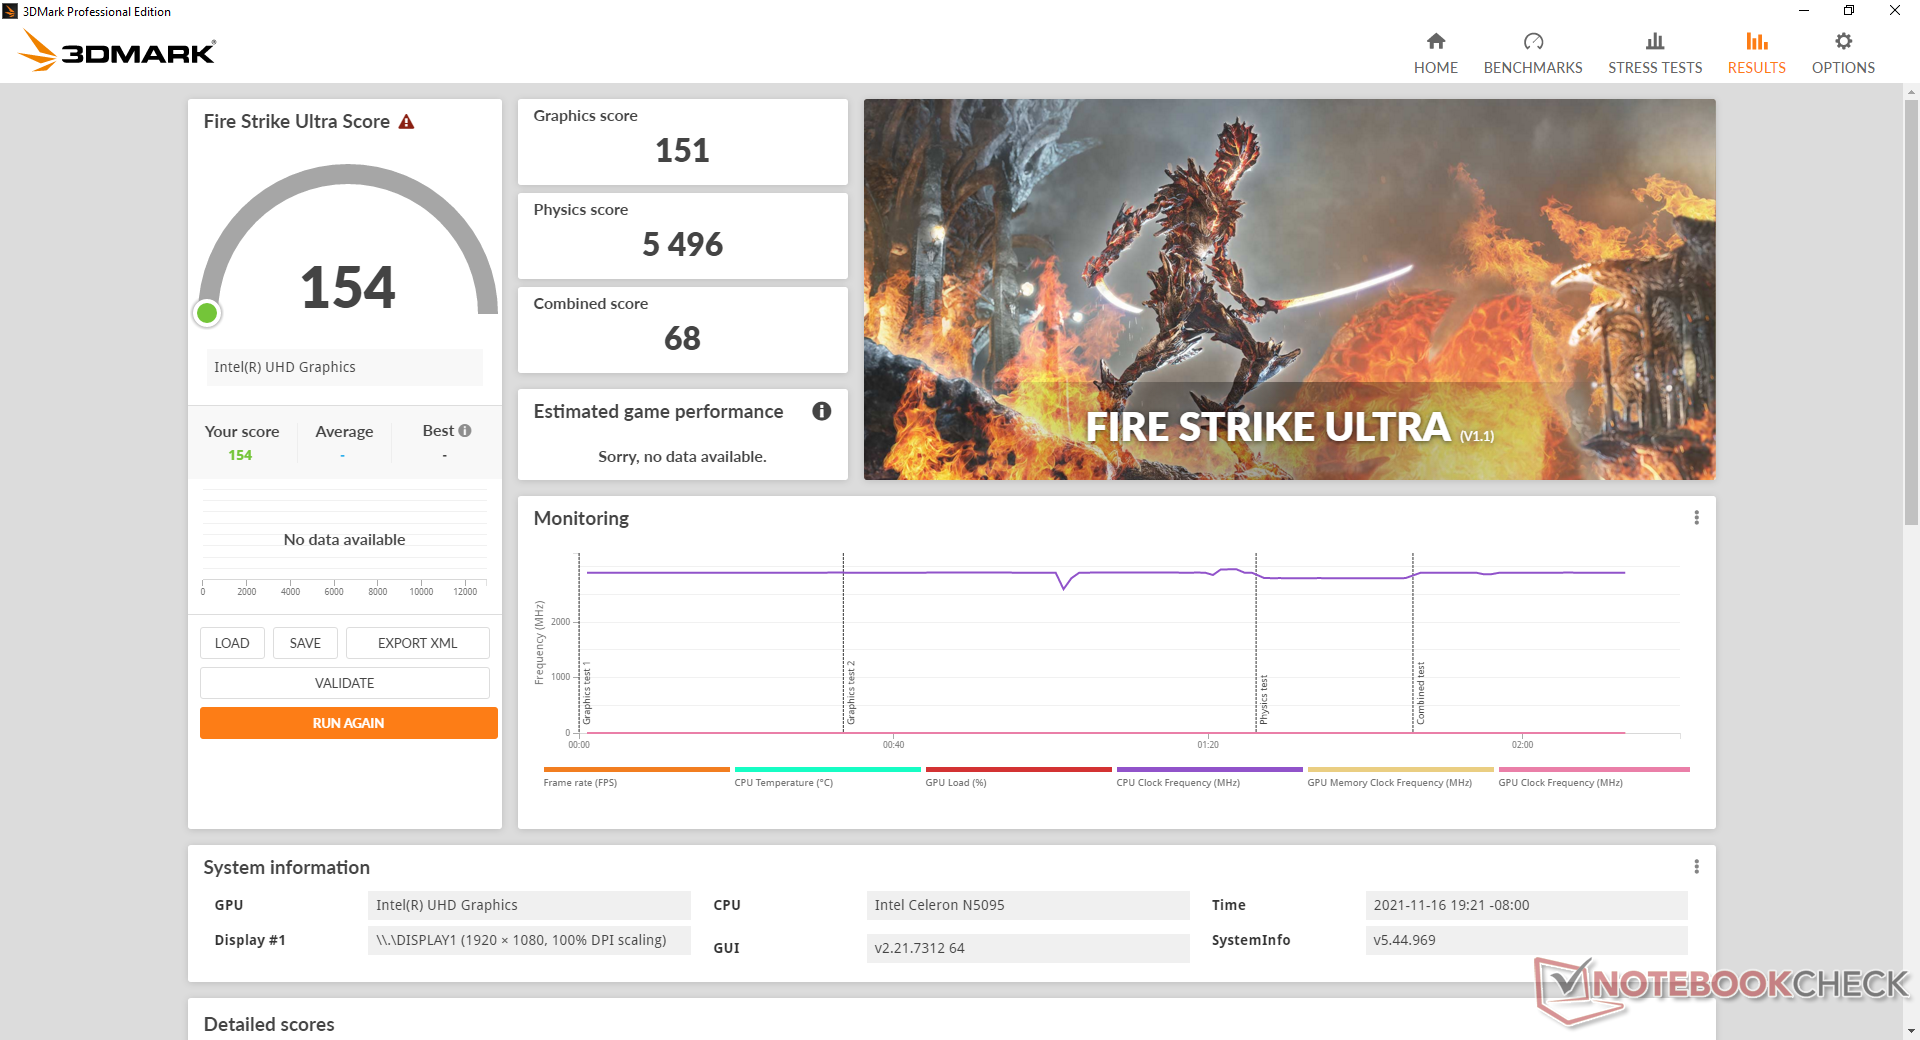
| 3DMark 11 Performance | 1028 poäng | |
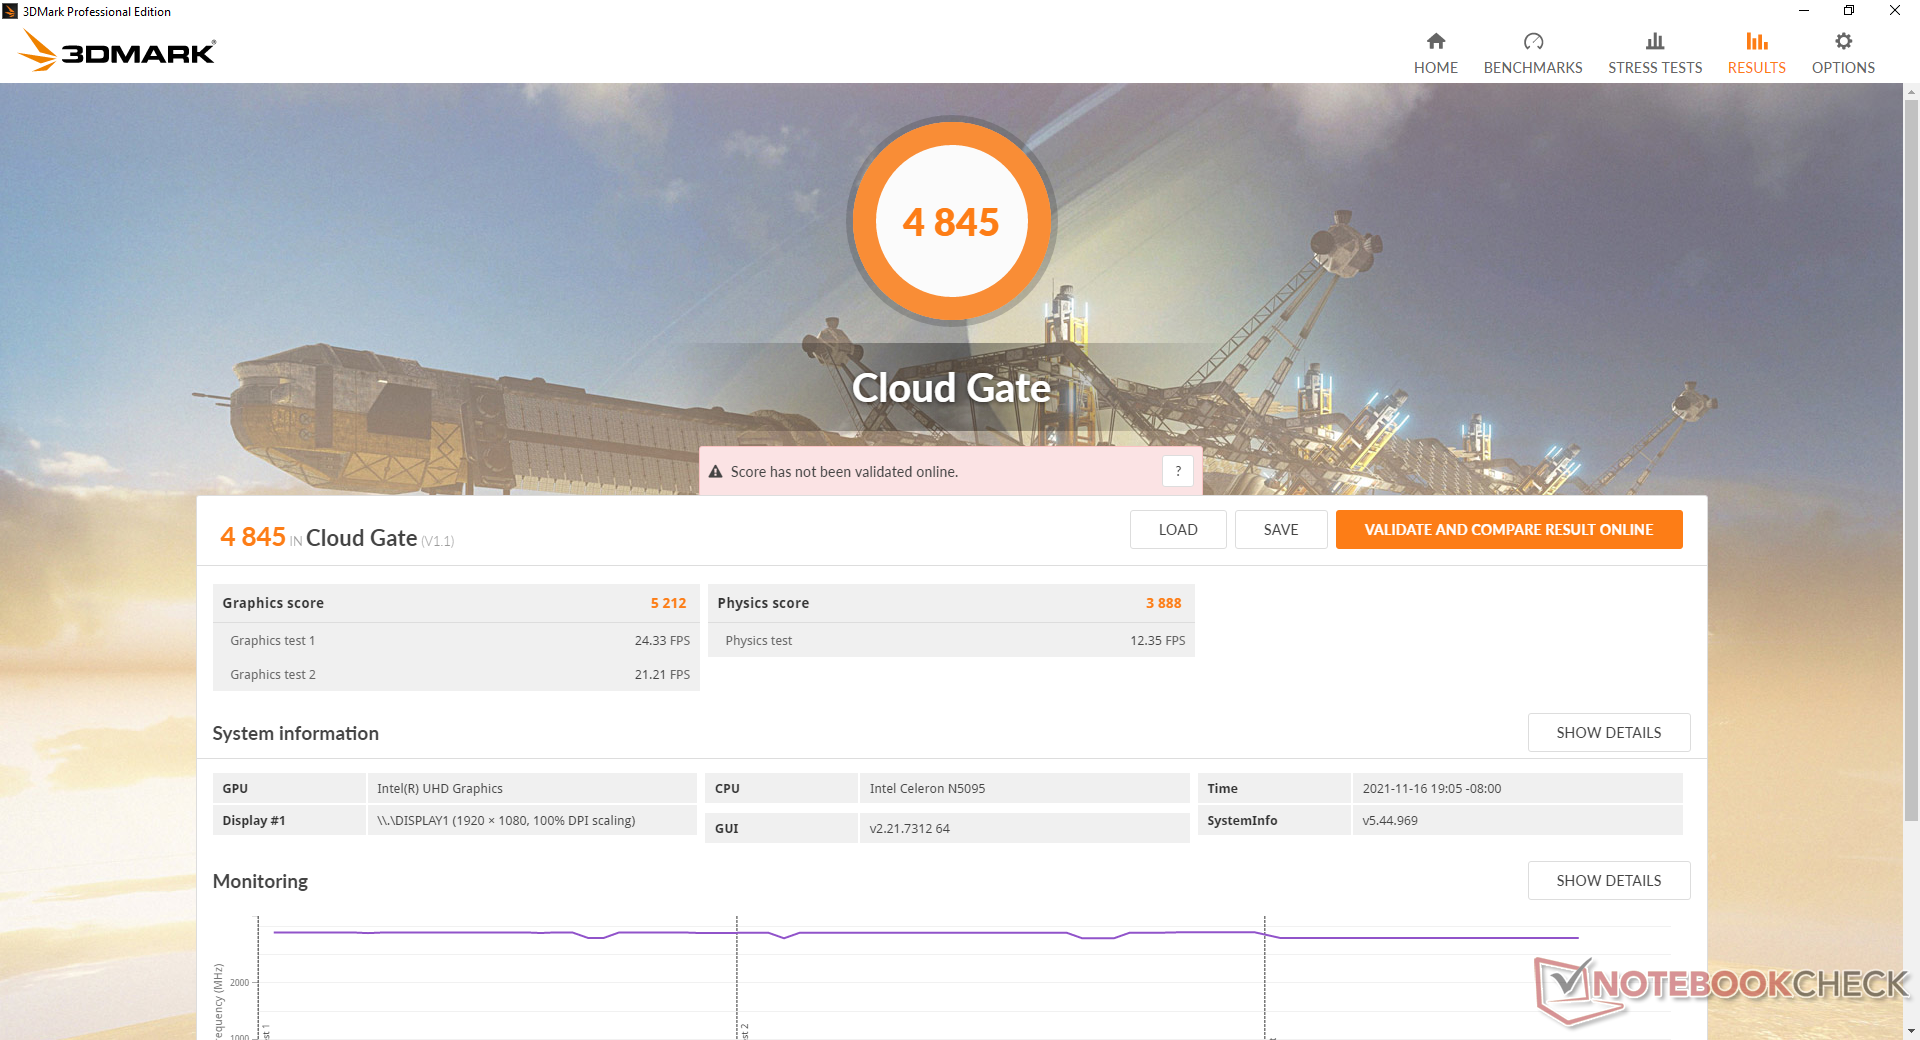
| 3DMark Cloud Gate Standard Score | 4845 poäng | |
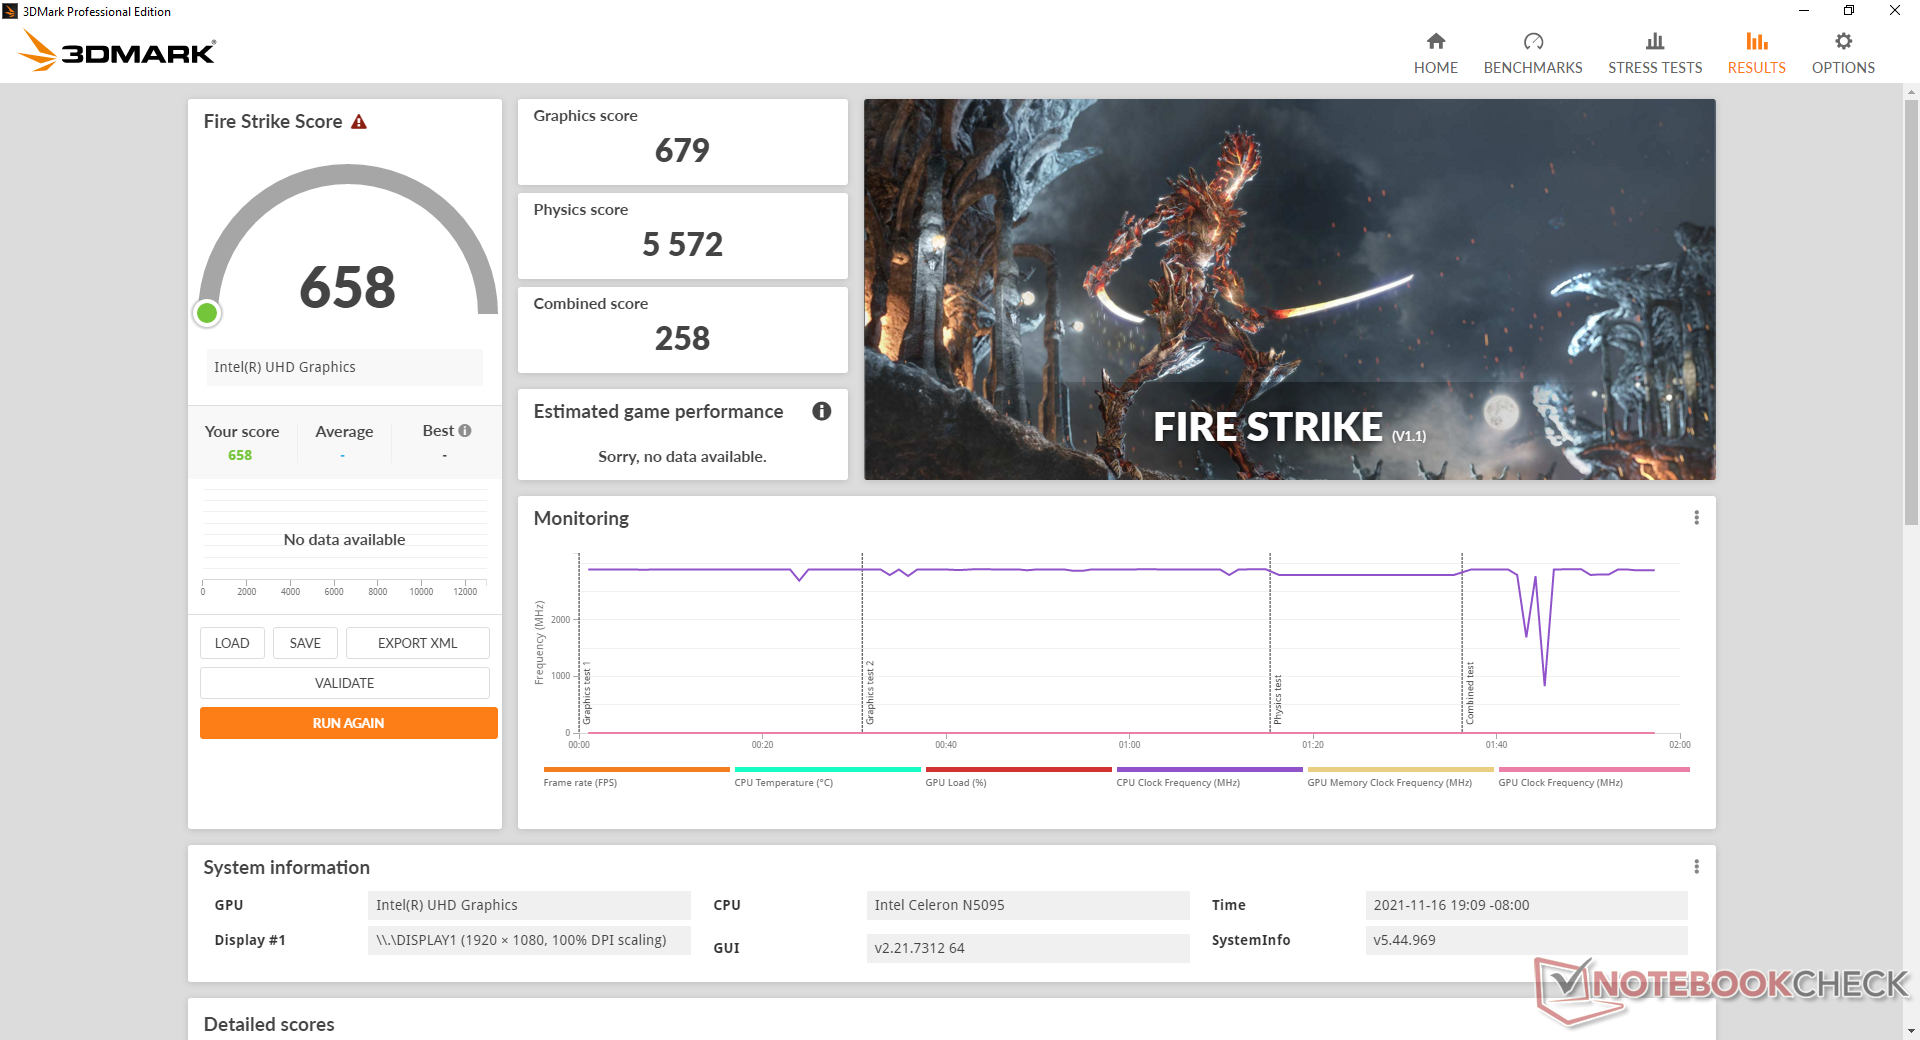
| 3DMark Fire Strike Score | 658 poäng | |
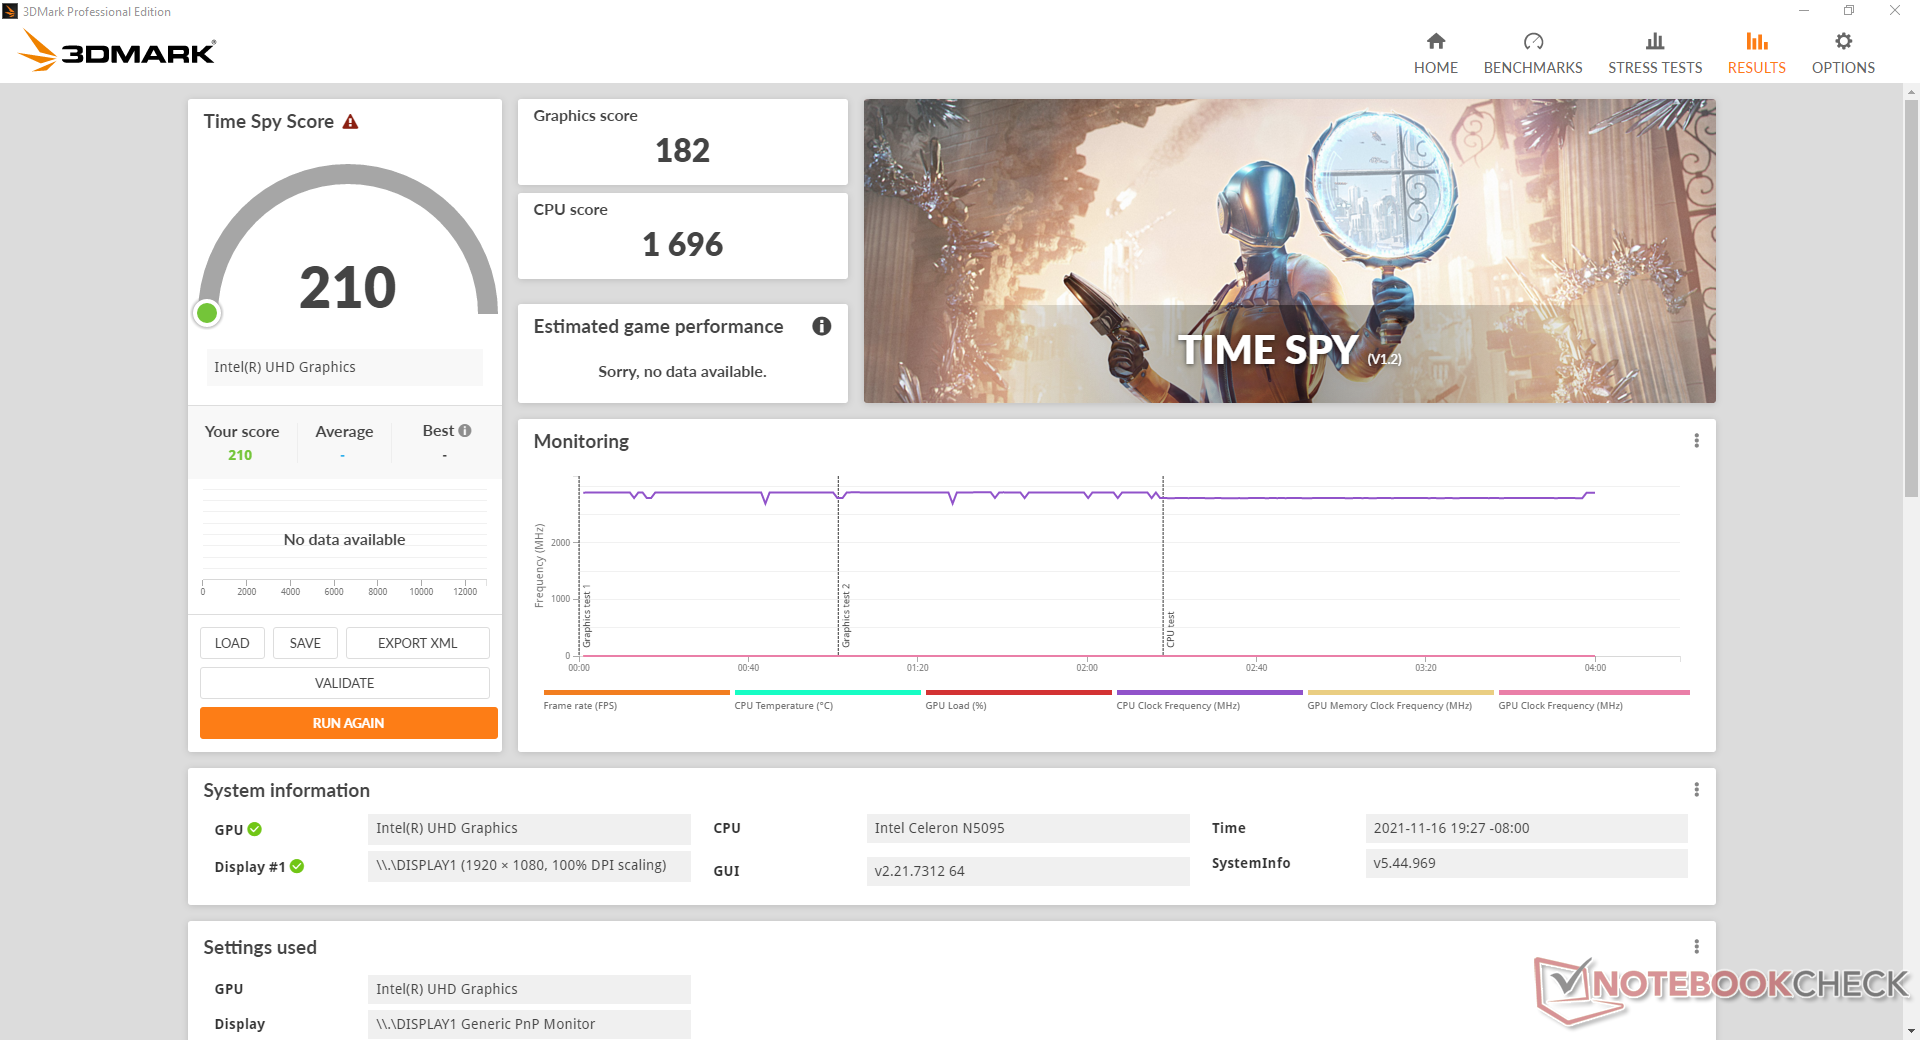
| 3DMark Time Spy Score | 210 poäng | |
Hjälp | ||
Witcher 3 FPS Chart
| låg | med. | hög | ultra | |
|---|---|---|---|---|
| The Witcher 3 (2015) | 14 | |||
| Dota 2 Reborn (2015) | 57.3 | 26.6 | 12 | 11.2 |
| Final Fantasy XV Benchmark (2018) | 7.17 | |||
| X-Plane 11.11 (2018) | 10.8 | 9.18 | 8.62 |
Utsläpp
Systembrus
Den interna fläkten är tyst med 24,5 dB(A) när systemet inte kör några program. Oftast är det dock så att användarna kommer att videostreama eller surfa på webben och då kommer fläkten ibland att stiga till 28,6 dB(A) eller 30,4 dB(A). Andra minidatorer är mycket högre, inklusive Beelinks egen SEi10.
När Prime95 körs får man ett maximalt fläktljud på 37,6 dB(A), vilket är märkbart men inte störande i en HTPC-miljö.
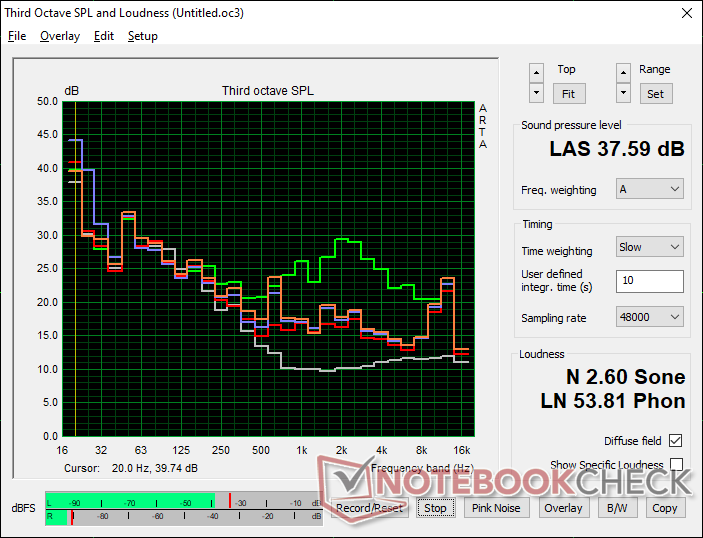
Ljudnivå
| Låg belastning |
| 24.5 / 24.5 / 28.6 dB(A) |
| Hög belastning |
| 29.7 / 37.6 dB(A) |
 | ||
30 dB tyst 40 dB(A) hörbar 50 dB(A) högt ljud |
||
min: | ||
| Beelink U59 UHD Graphics (Jasper Lake 16 EU), Celeron N5095, Silicon Motion AZW 512G NV428 | Intel NUC11TNKi5 Iris Xe G7 80EUs, i5-1135G7, Transcend M.2 SSD 430S TS512GMTS430S | Intel NUC8i7BE Iris Plus Graphics 655, i7-8559U | Beelink SEi10 UHD Graphics G1 (Ice Lake 32 EU), i3-1005G1, Silicon Motion AZW 256G M.2280 NVMe 4X 200725 D | Zotac ZBOX MI642 Nano UHD Graphics 620, i5-10210U, Western Digital WD Blue 3D WDBNCE5000PNC | GMK NucBox K1 UHD Graphics 600, Celeron J4125, HIKVision C100 NGFF SSD 128GB | |
|---|---|---|---|---|---|---|
| Noise | -27% | -19% | -27% | -24% | -20% | |
| av / miljö * (dB) | 24.5 | 24.8 -1% | 28.7 -17% | 27.5 -12% | 27.8 -13% | 27.8 -13% |
| Idle Minimum * (dB) | 24.5 | 35.6 -45% | 28.7 -17% | 30.9 -26% | 27.8 -13% | 27.8 -13% |
| Idle Average * (dB) | 24.5 | 35.6 -45% | 29.3 -20% | 33.5 -37% | 33.9 -38% | 27.8 -13% |
| Idle Maximum * (dB) | 28.6 | 35.6 -24% | 31.8 -11% | 33.5 -17% | 33.9 -19% | 27.8 3% |
| Load Average * (dB) | 29.7 | 36.2 -22% | 39 -31% | 38.5 -30% | 43.7 -47% | 46.8 -58% |
| Witcher 3 ultra * (dB) | 30.4 | 38 -25% | 39 -28% | |||
| Load Maximum * (dB) | 37.6 | 47.6 -27% | 41.4 -10% | 51.6 -37% | 43.7 -16% | 46.8 -24% |
* ... mindre är bättre
Temperatur
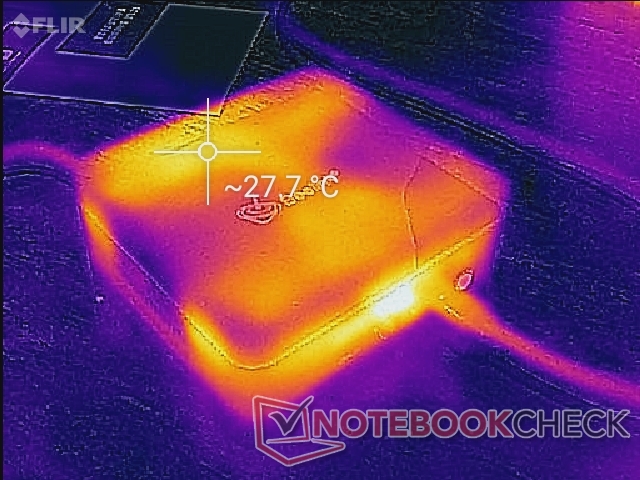
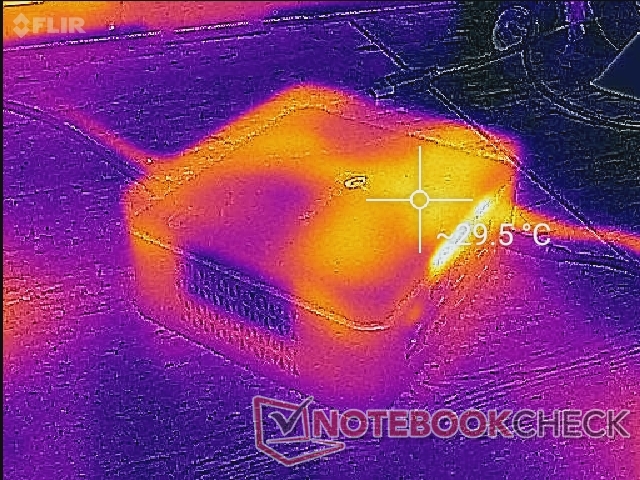
Temperaturen är inget problem för U59. Hot spots är knappt varmare även när systemet är fullt belastat.
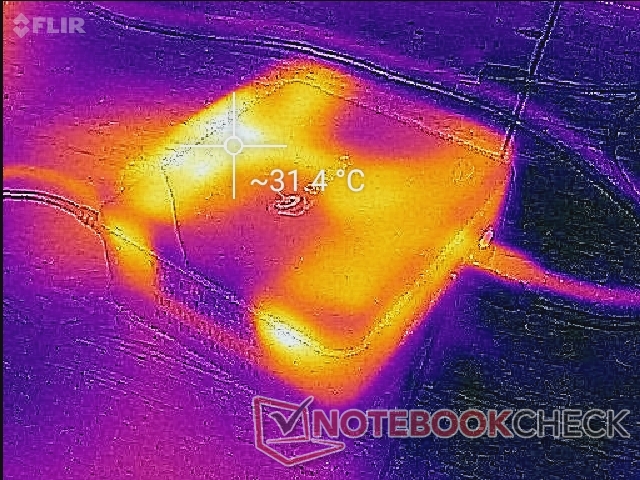
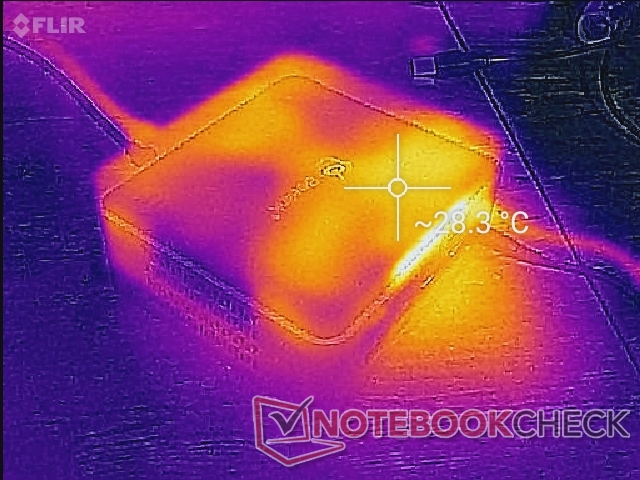
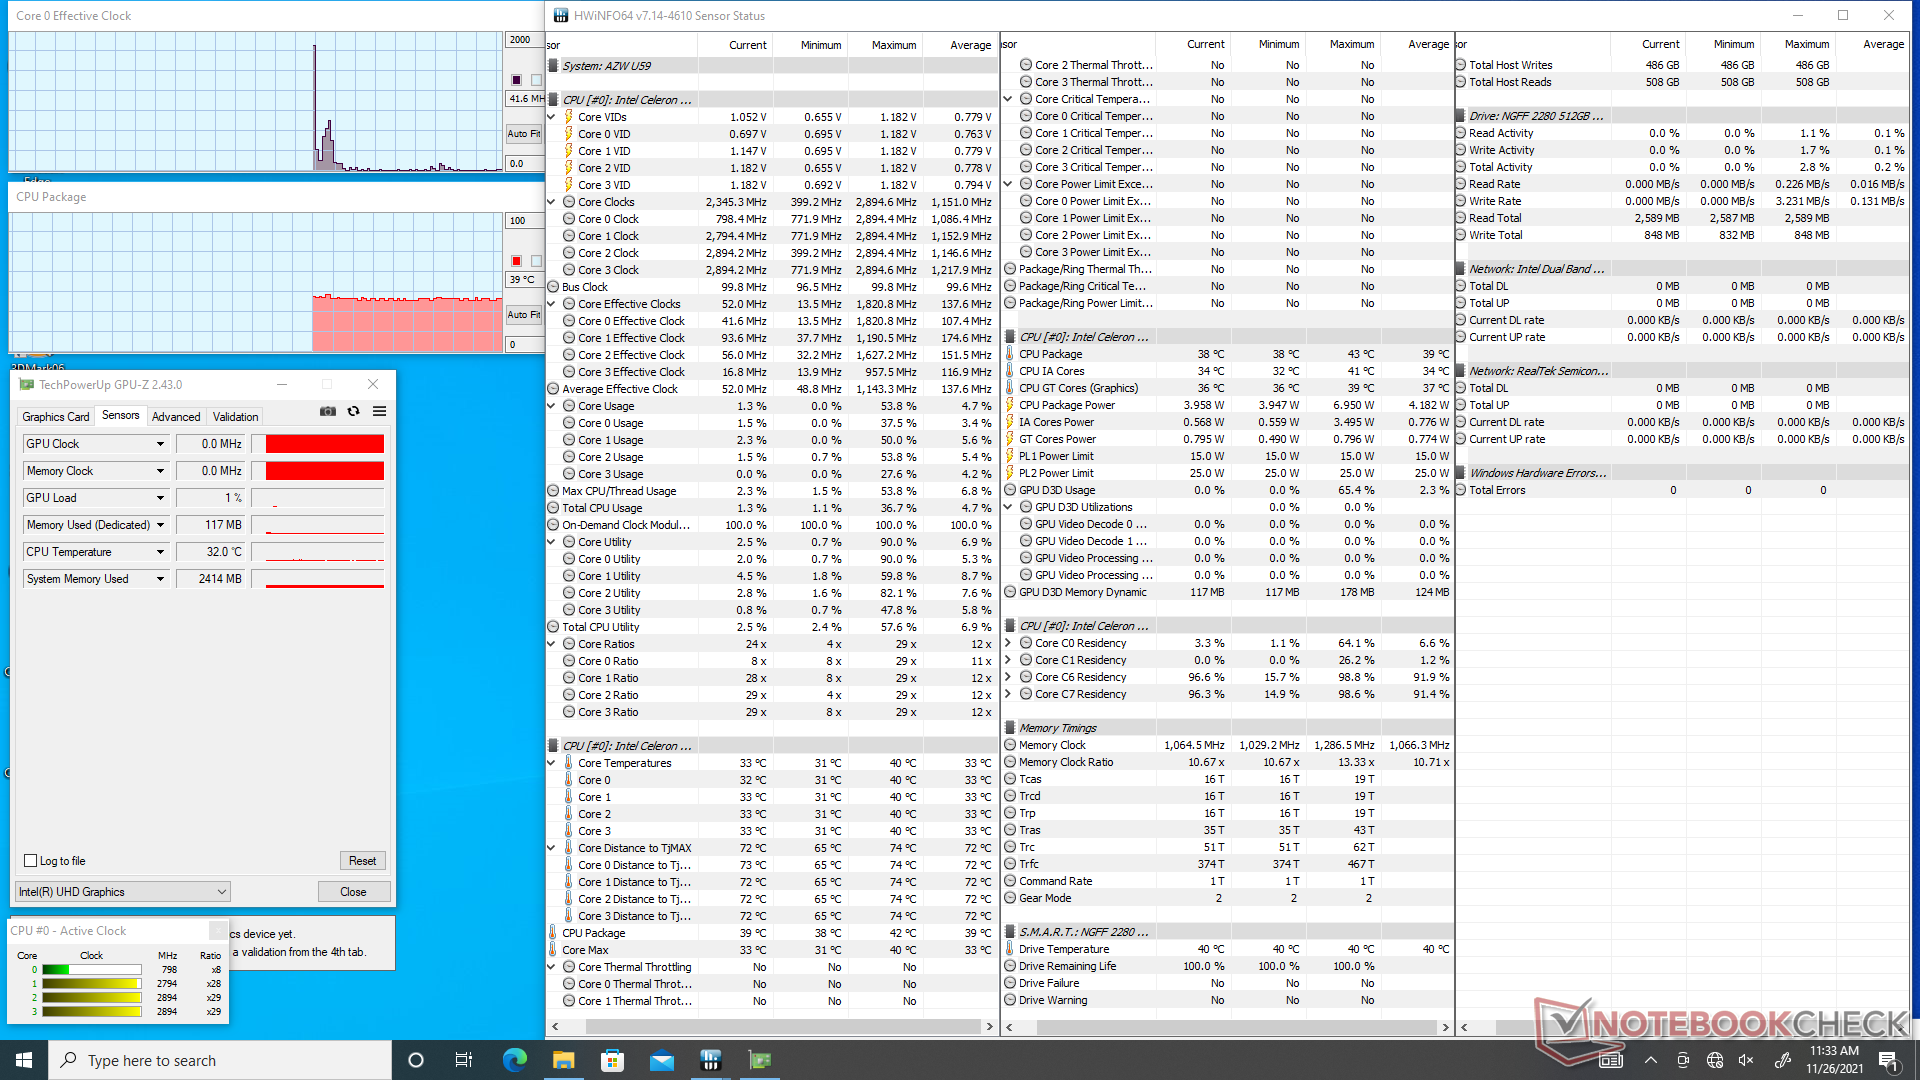
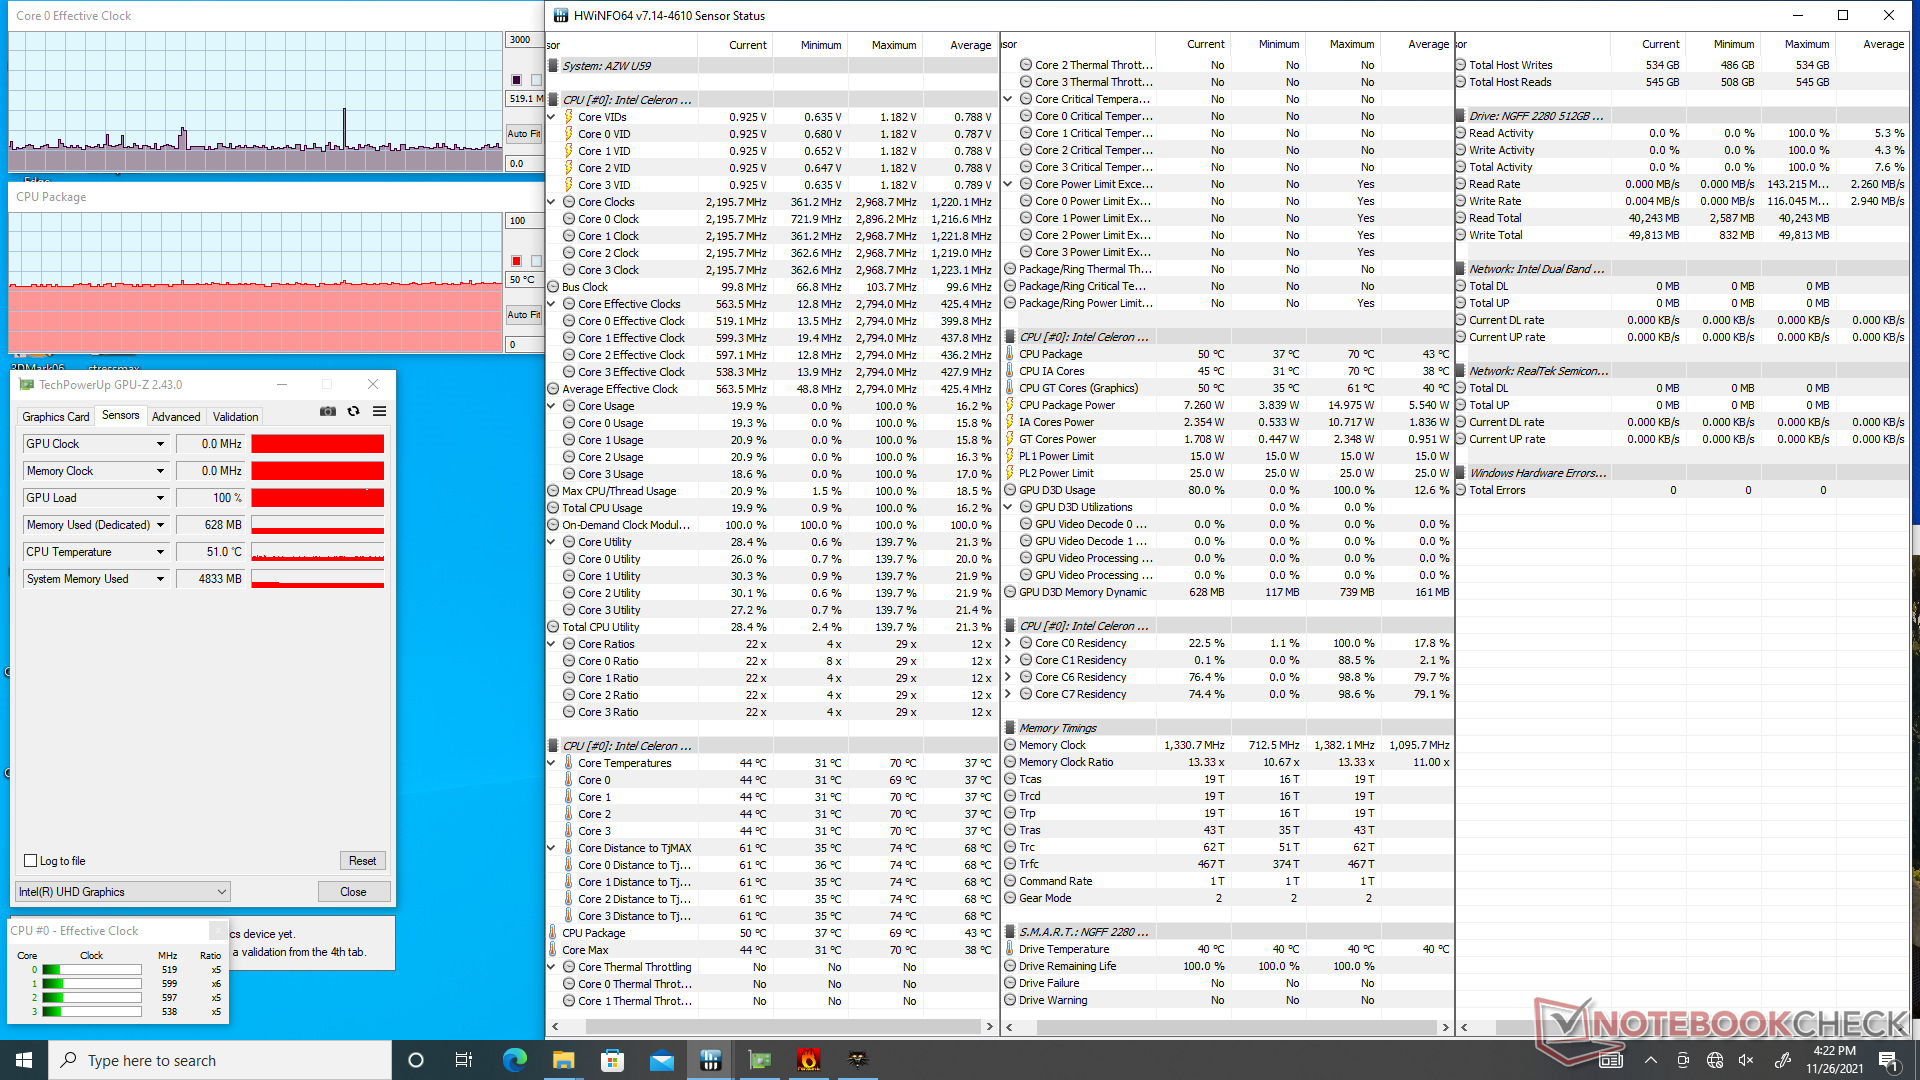
Stresstest
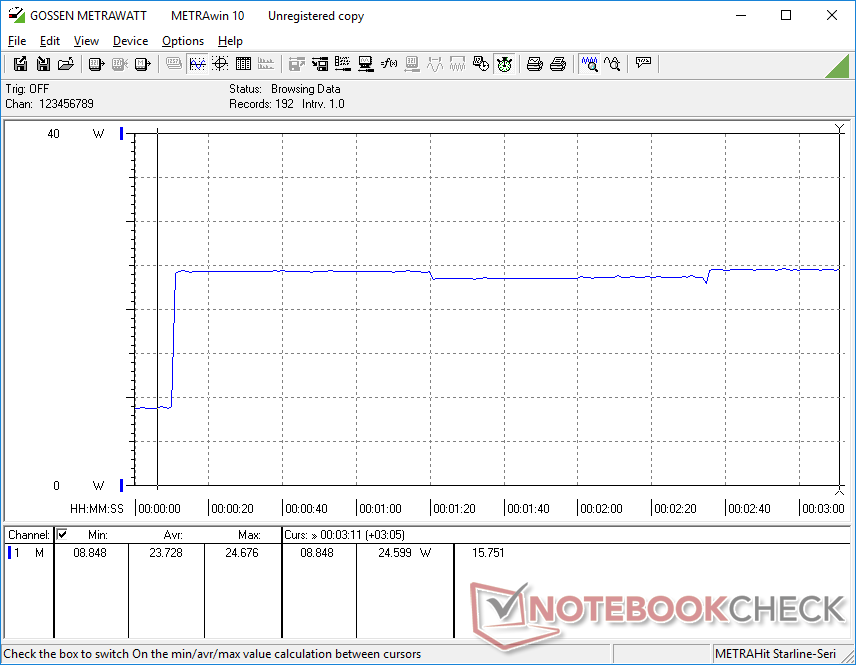
Processorn stabiliserades vid 2,8 GHz och 69 C när den utsattes för Prime95-stress. Det faktum att systemet använder en aktiv fläkt för kylning är sannolikt orsaken till de lägre temperaturerna än väntat och den stabila prestandan över tiden. HWiNFO rapporterar PL1- och PL2-nivåer på 15 W respektive 25 W, men vi kan bara nå upp till stabila 15 W när vi kör sådana extrema belastningar. När vi kör samma test på den Core i3-drivna Beelink SEi10 skulle resultera i en betydligt varmare kärntemperatur på 90 C
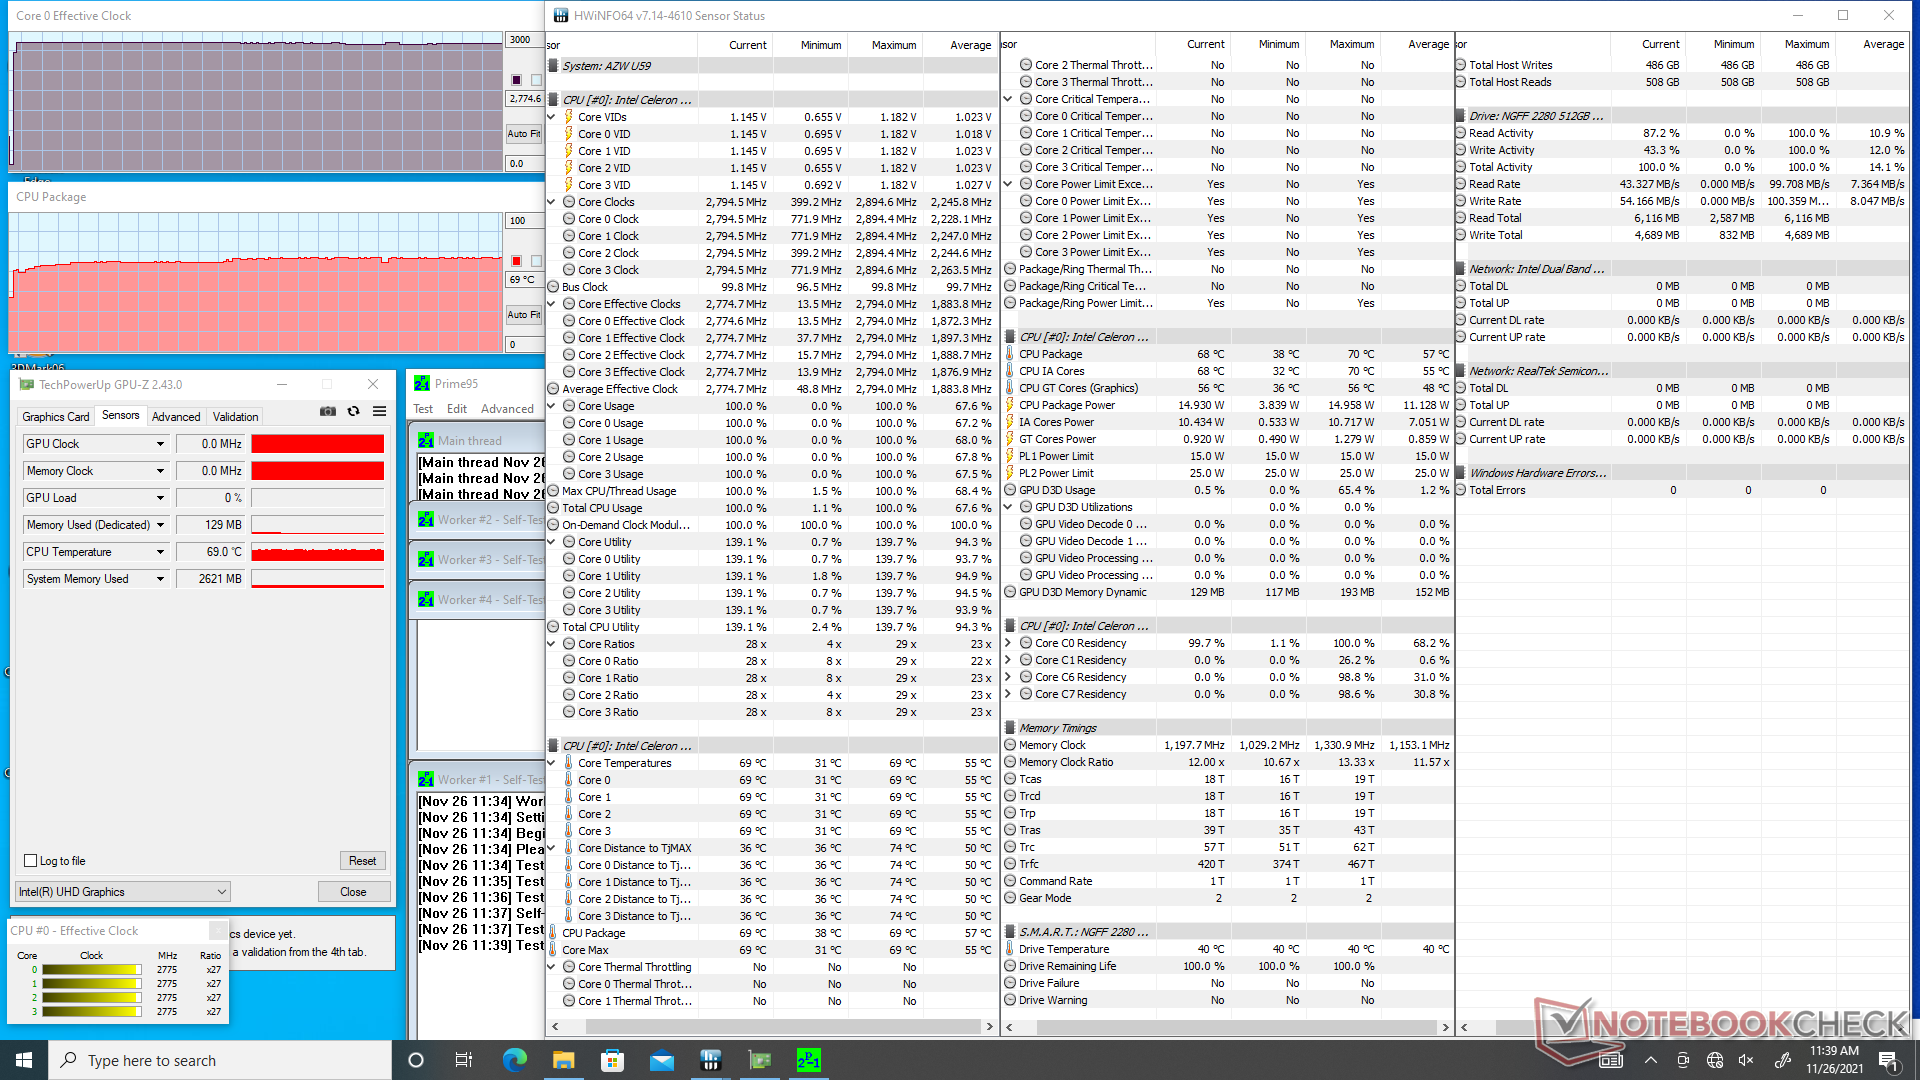
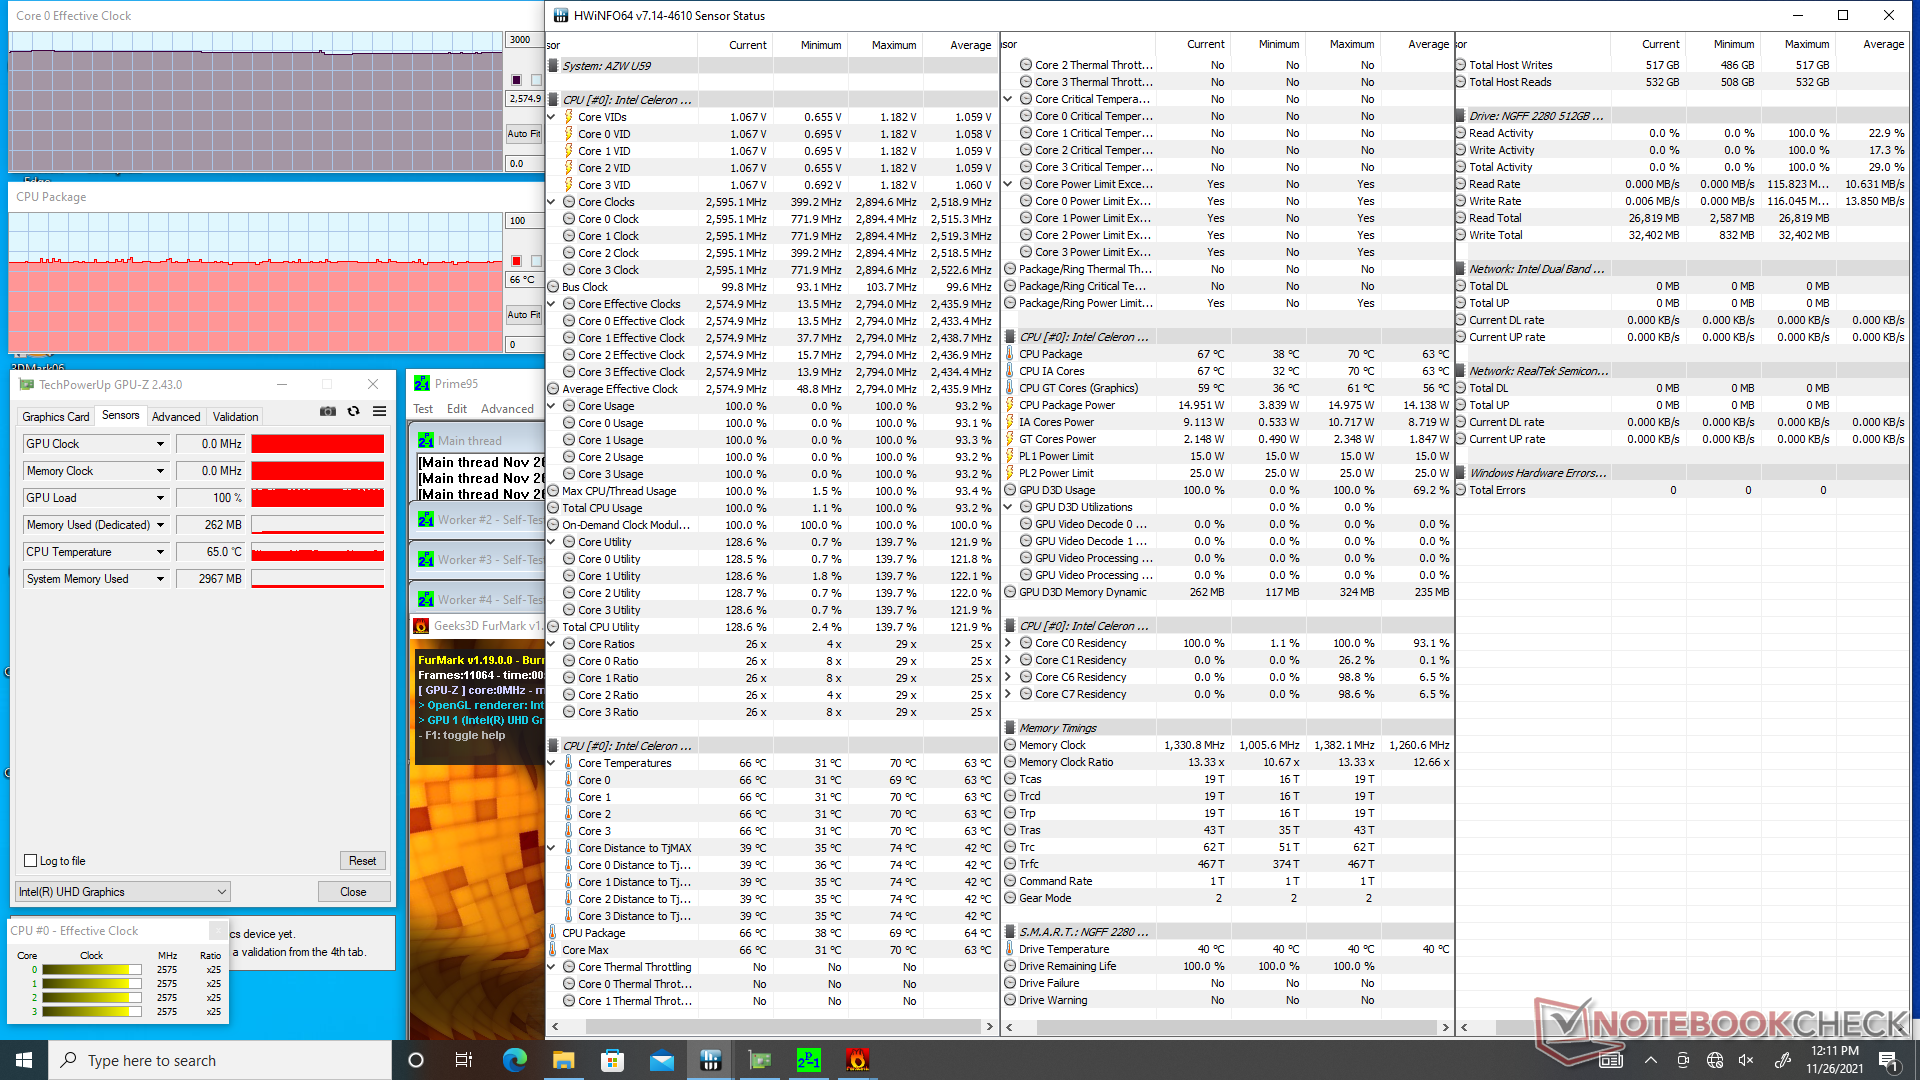
| CPU-klocka (GHz) | GPU-klocka (MHz) | GenomsnittligCPU-temperatur (°C) | |
| Systemets tomgång | ---- | ---- | 39 |
| Prime95 Stress | 2.8 | ---- | 69 |
| Prime95 + FurMark Stress | 2,6 | ---- | 66 |
| Witcher 3 Stress | 0.5 | ---- | 50 |
Energiförvaltning
Effektförbrukning
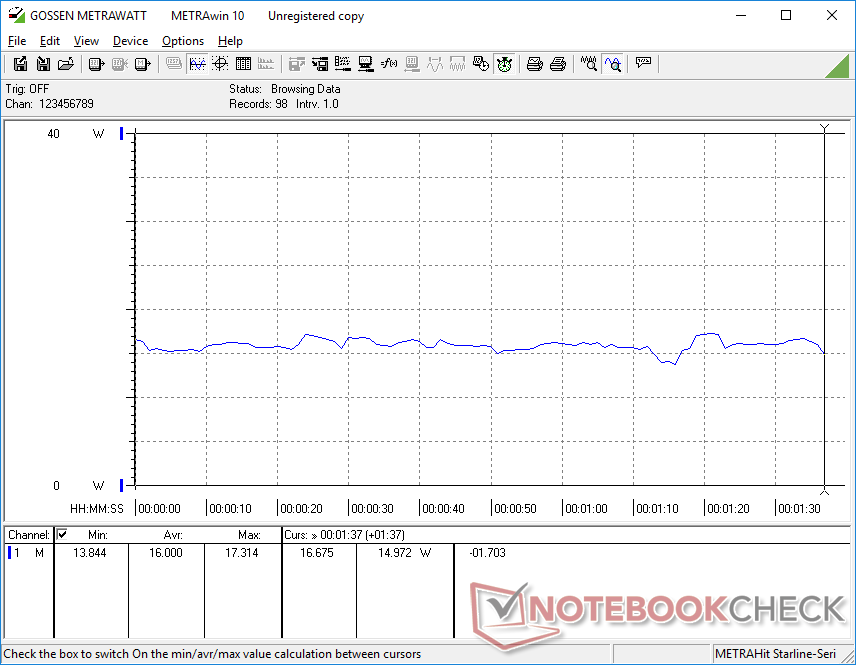
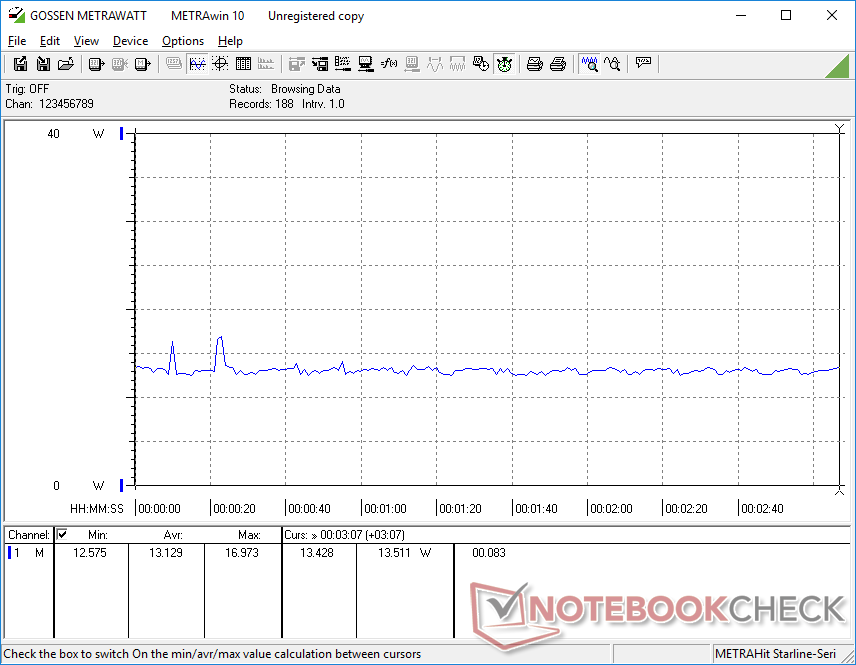
Om den går på tomgång på skrivbordet utan några pågående program skulle den förbruka mer än förväntat, omkring 7 W, medan Intel NUC8 eller GMK NucBox K1 kan förbruka så lite som 3 W vardera. Högre belastningar som spel skulle dra mycket mindre på vår U59 med bara 13-16 W i genomsnitt jämfört med 2x eller mer på minidatorer med snabbare UHD Graphics 620 eller Iris Xe GPU:er.

| Av/Standby | |
| Låg belastning | |
| Hög belastning |
|
Förklaring:
min: | |
| Beelink U59 Celeron N5095, UHD Graphics (Jasper Lake 16 EU), Silicon Motion AZW 512G NV428, , x, | Intel NUC11TNKi5 i5-1135G7, Iris Xe G7 80EUs, Transcend M.2 SSD 430S TS512GMTS430S, , x, | Intel NUC8i7BE i7-8559U, Iris Plus Graphics 655, , , x, | Beelink SEi10 i3-1005G1, UHD Graphics G1 (Ice Lake 32 EU), Silicon Motion AZW 256G M.2280 NVMe 4X 200725 D, , x, | Zotac ZBOX MI642 Nano i5-10210U, UHD Graphics 620, Western Digital WD Blue 3D WDBNCE5000PNC, , x, | GMK NucBox K1 Celeron J4125, UHD Graphics 600, HIKVision C100 NGFF SSD 128GB, , x, | |
|---|---|---|---|---|---|---|
| Power Consumption | -135% | -102% | -26% | -67% | 34% | |
| Idle Minimum * (Watt) | 6.7 | 11.5 -72% | 2.7 60% | 6.3 6% | 8.9 -33% | 3.4 49% |
| Idle Average * (Watt) | 6.7 | 12.4 -85% | 3.1 54% | 6.6 1% | 9 -34% | 3.8 43% |
| Idle Maximum * (Watt) | 7.4 | 12.9 -74% | 6.3 15% | 6.7 9% | 9.9 -34% | 3.9 47% |
| Load Average * (Watt) | 16 | 40.7 -154% | 59.7 -273% | 25.9 -62% | 33 -106% | 12.5 22% |
| Witcher 3 ultra * (Watt) | 13.1 | 43.9 -235% | 47.2 -260% | |||
| Load Maximum * (Watt) | 25.6 | 73.5 -187% | 78 -205% | 46.7 -82% | 58 -127% | 22.7 11% |
* ... mindre är bättre
Power Consumption Witcher 3 / Stresstest
Power Consumption external Monitor
För
Emot
Omdöme
Det låga priset på ca 2 790 - 3 490 kronor med RAM, lagringsutrymme och Windows 11 Pro är det mest övertygande försäljningsargumentet för Beelink U59. Prestandan per krona är märkbart högre än tidigare generationens Celeron-minidatorer med så mycket som 2x till 2,5x när det gäller flertrådsprestanda eller 50 procent när det gäller enkeltrådsprestanda och grafik. Vi uppskattar att båda lagringsfacken, båda RAM-platserna och WLAN-modulen är lättillgängliga och uppgraderingsbara, vilket innebär att intresserade köpare inte behöver betala för den mer avancerade konfigurationen om de inte har något emot att uppgradera sådana komponenter själva.
Det är inte riktigt en Core i3, men Jasper Lake Celeron N5095 är åtminstone mycket närmare en sådan än alla andra mobila Celeron-CPU:er före den. Beelink U59 erbjuder märkbart bättre prestanda än de flesta andra minidatorer i prisklassen 2 000 - 3 500 kronor.
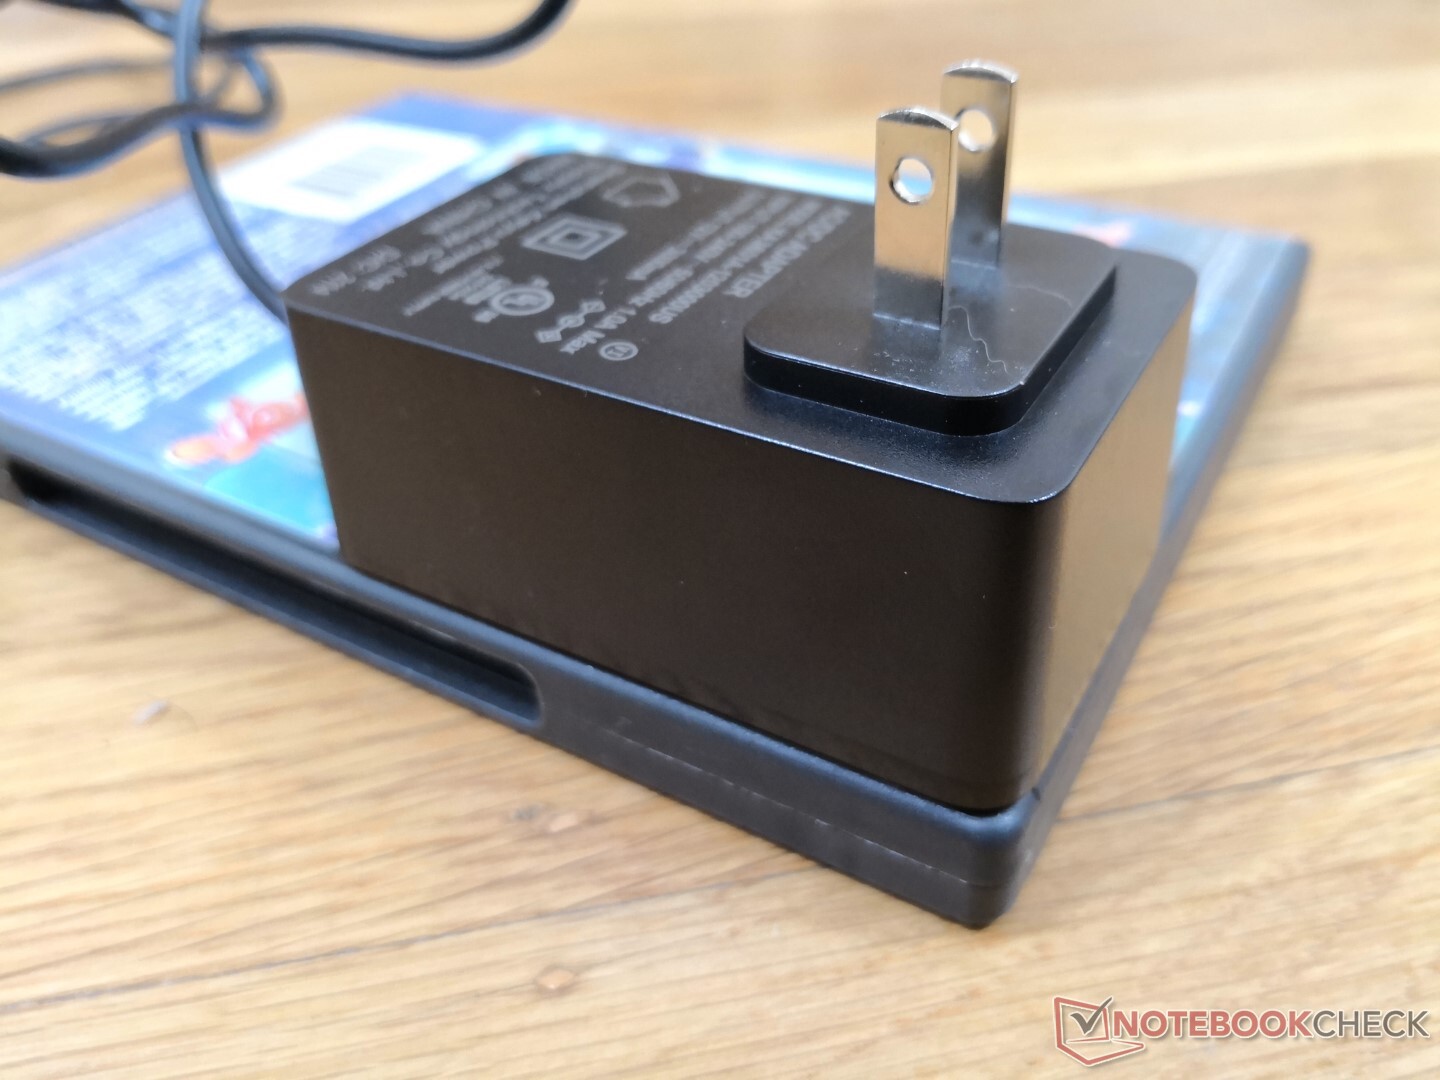
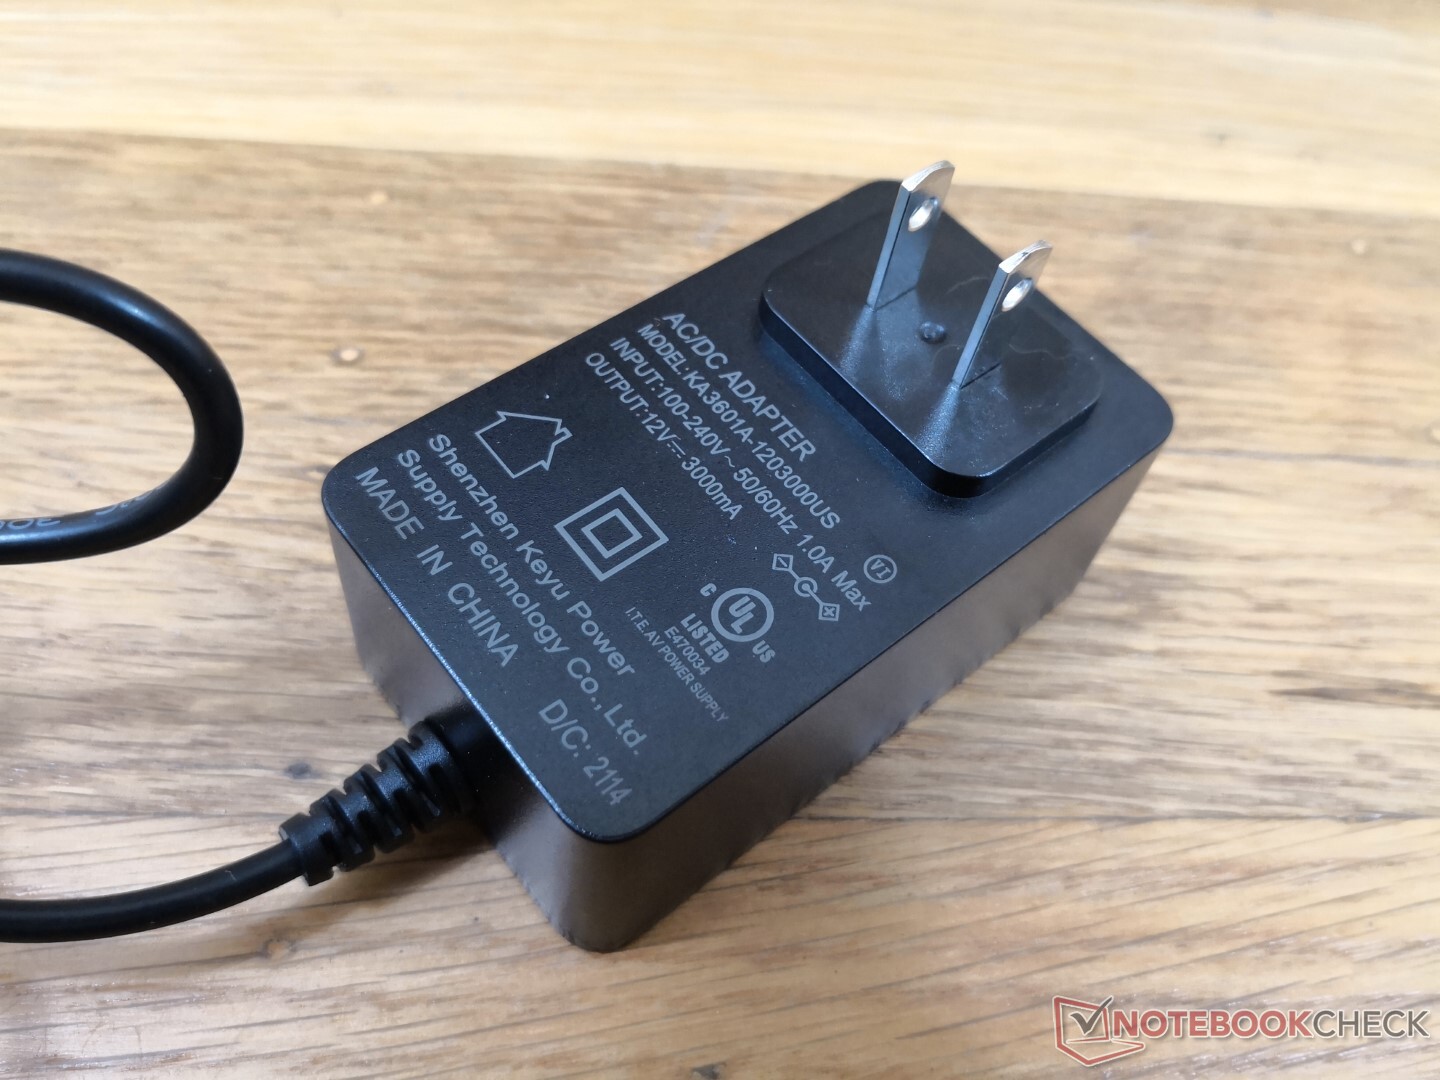
Nackdelarna är små men adderas snabbt. Det faktum att systemet kräver en proprietär AC-adapter är ett irritationsmoment när det kunde ha drivits av den mer universella USB-C i stället. Fläkten, även om den i allmänhet är tyst, tenderar att pulsera ofta som svar på arbetsbelastningen. Avsaknaden av en SD-kortläsare kan irritera användare som är beroende av en sådan medan den övre plastplattan känns billig och drar snabbt åt sig repor. Om du måste skaffa en Celeron-minidator kan dock Jasper Lake-drivna Beelink U59 vara ett bra alternativ helt enkelt på grund av de anmärkningsvärda prestandafördelarna jämfört med äldre Celeron-chip som de i t.ex. GMK NucBox K1 eller Chuwi GBox.
Pris och tillgänglighet
Beelink U59 säljs för närvarande på Amazon från 279 USD till 349 USD beroende på RAM- och lagringsalternativ.
Price comparison

