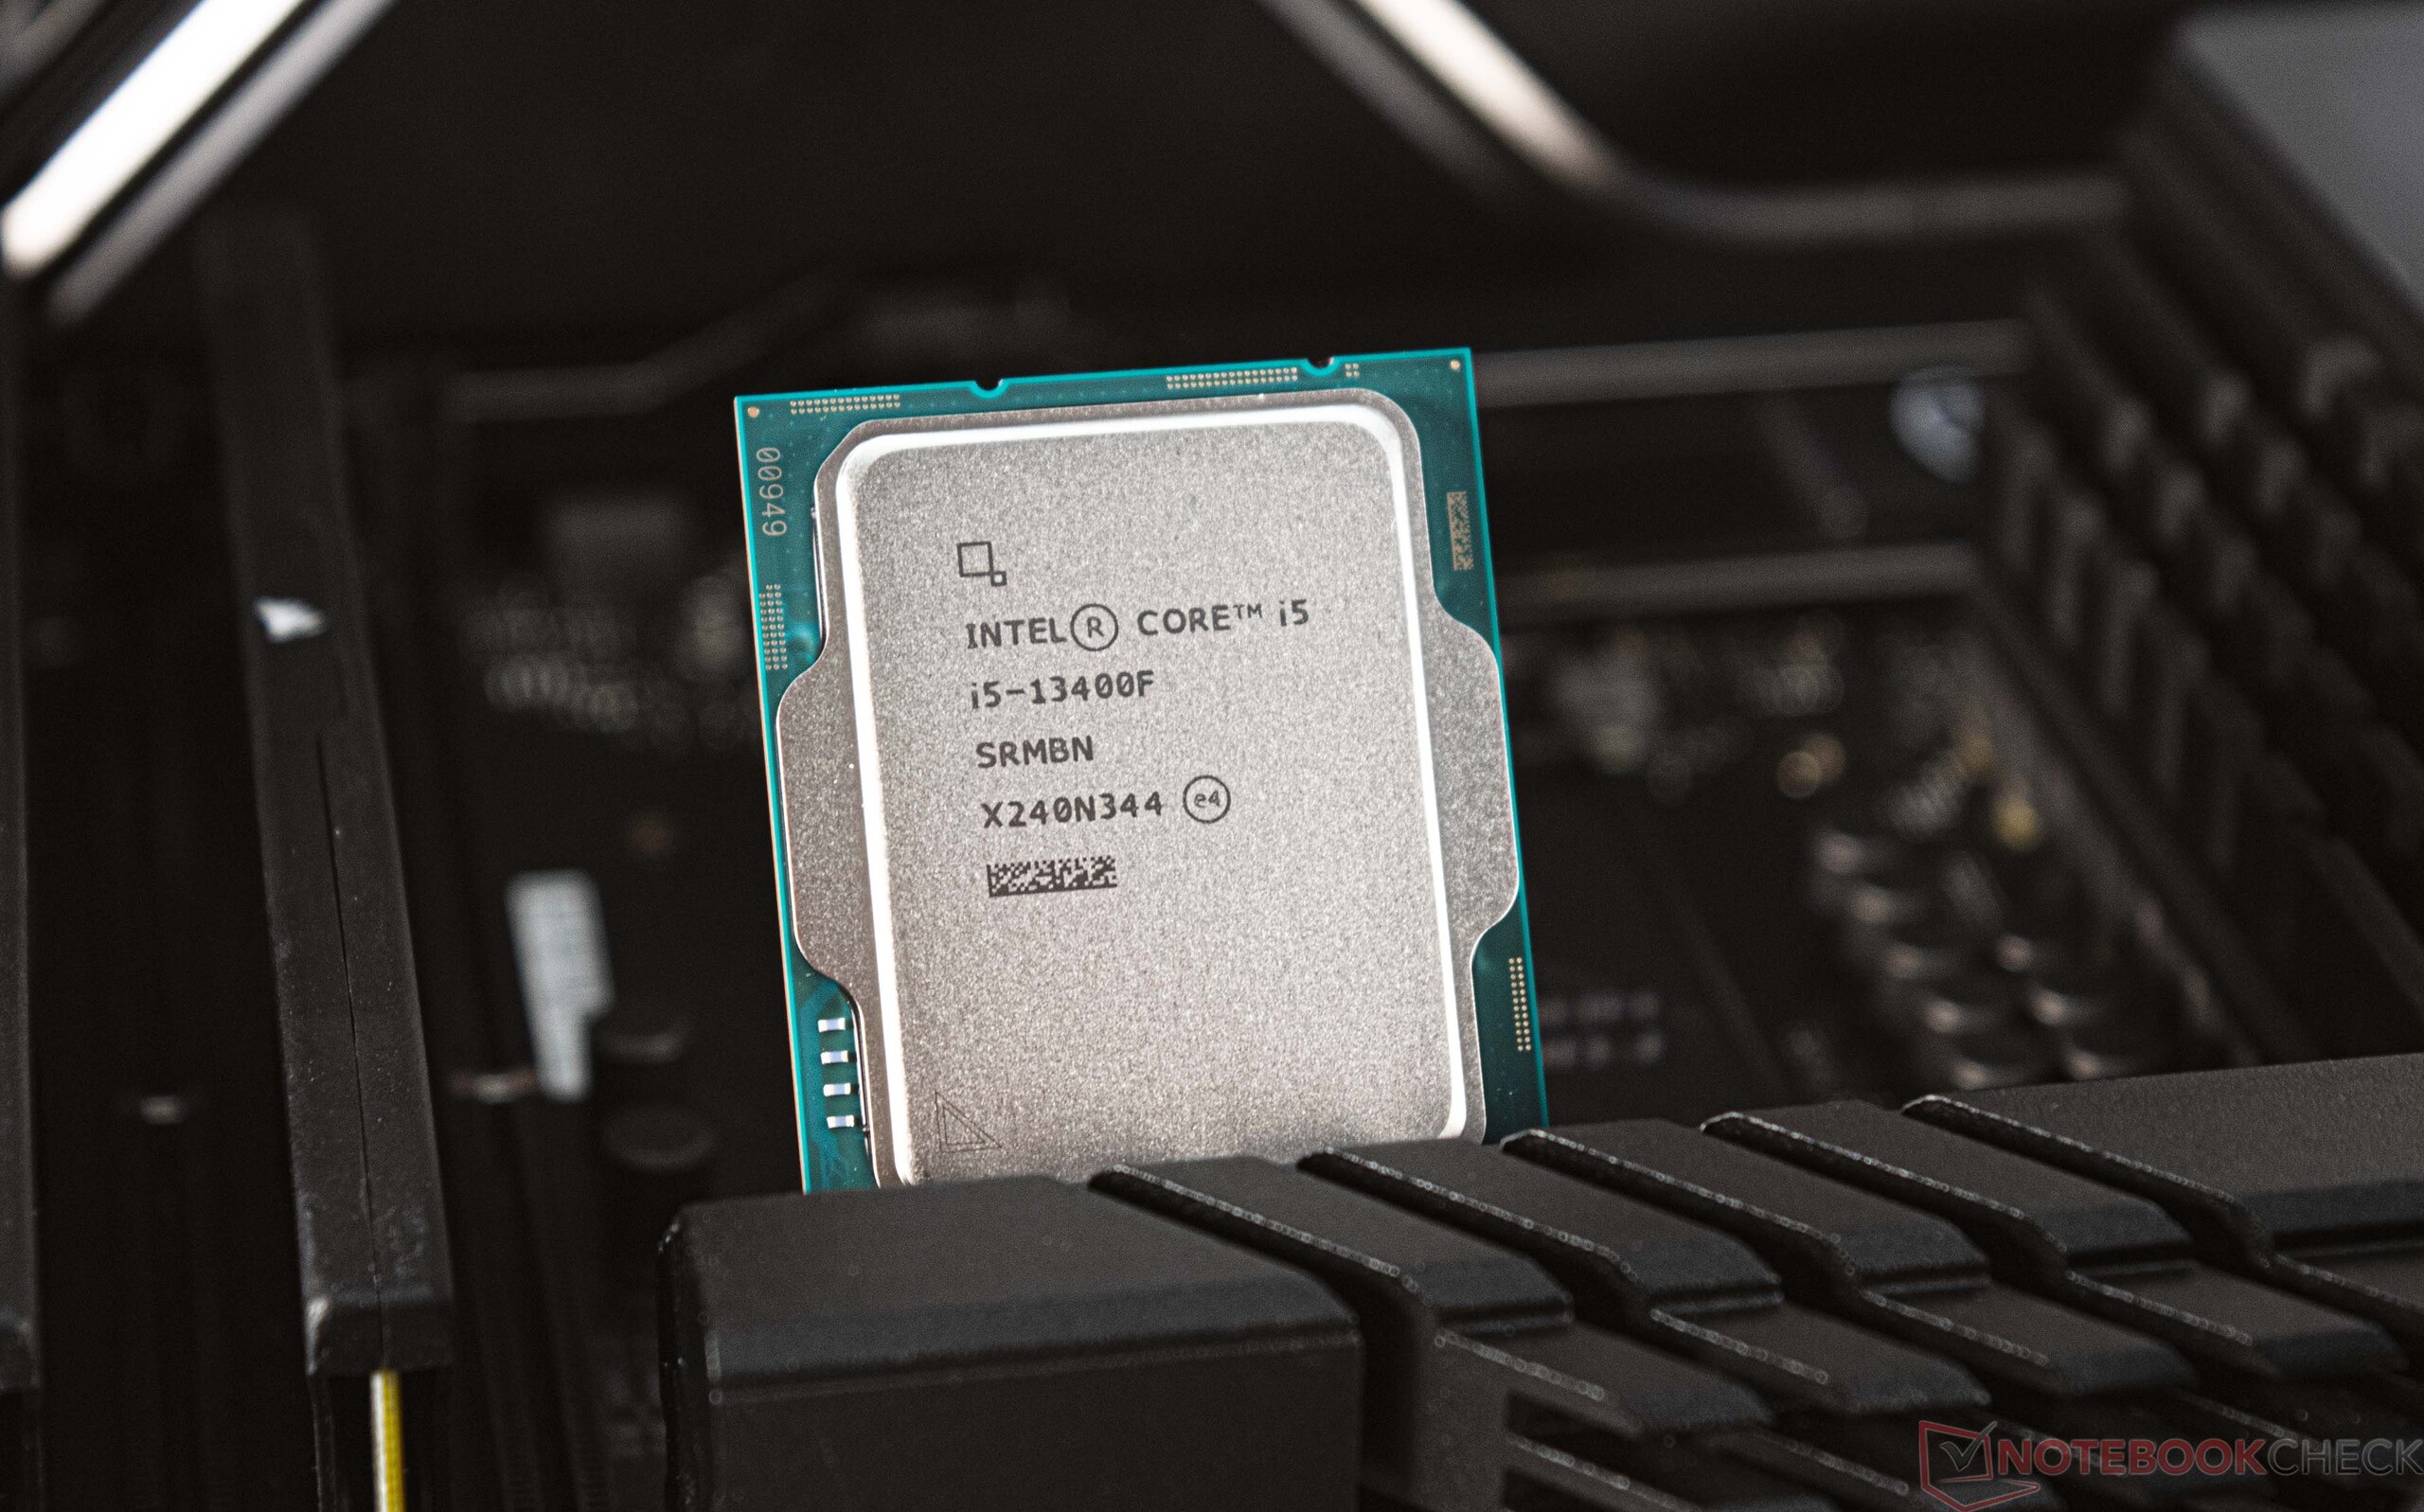
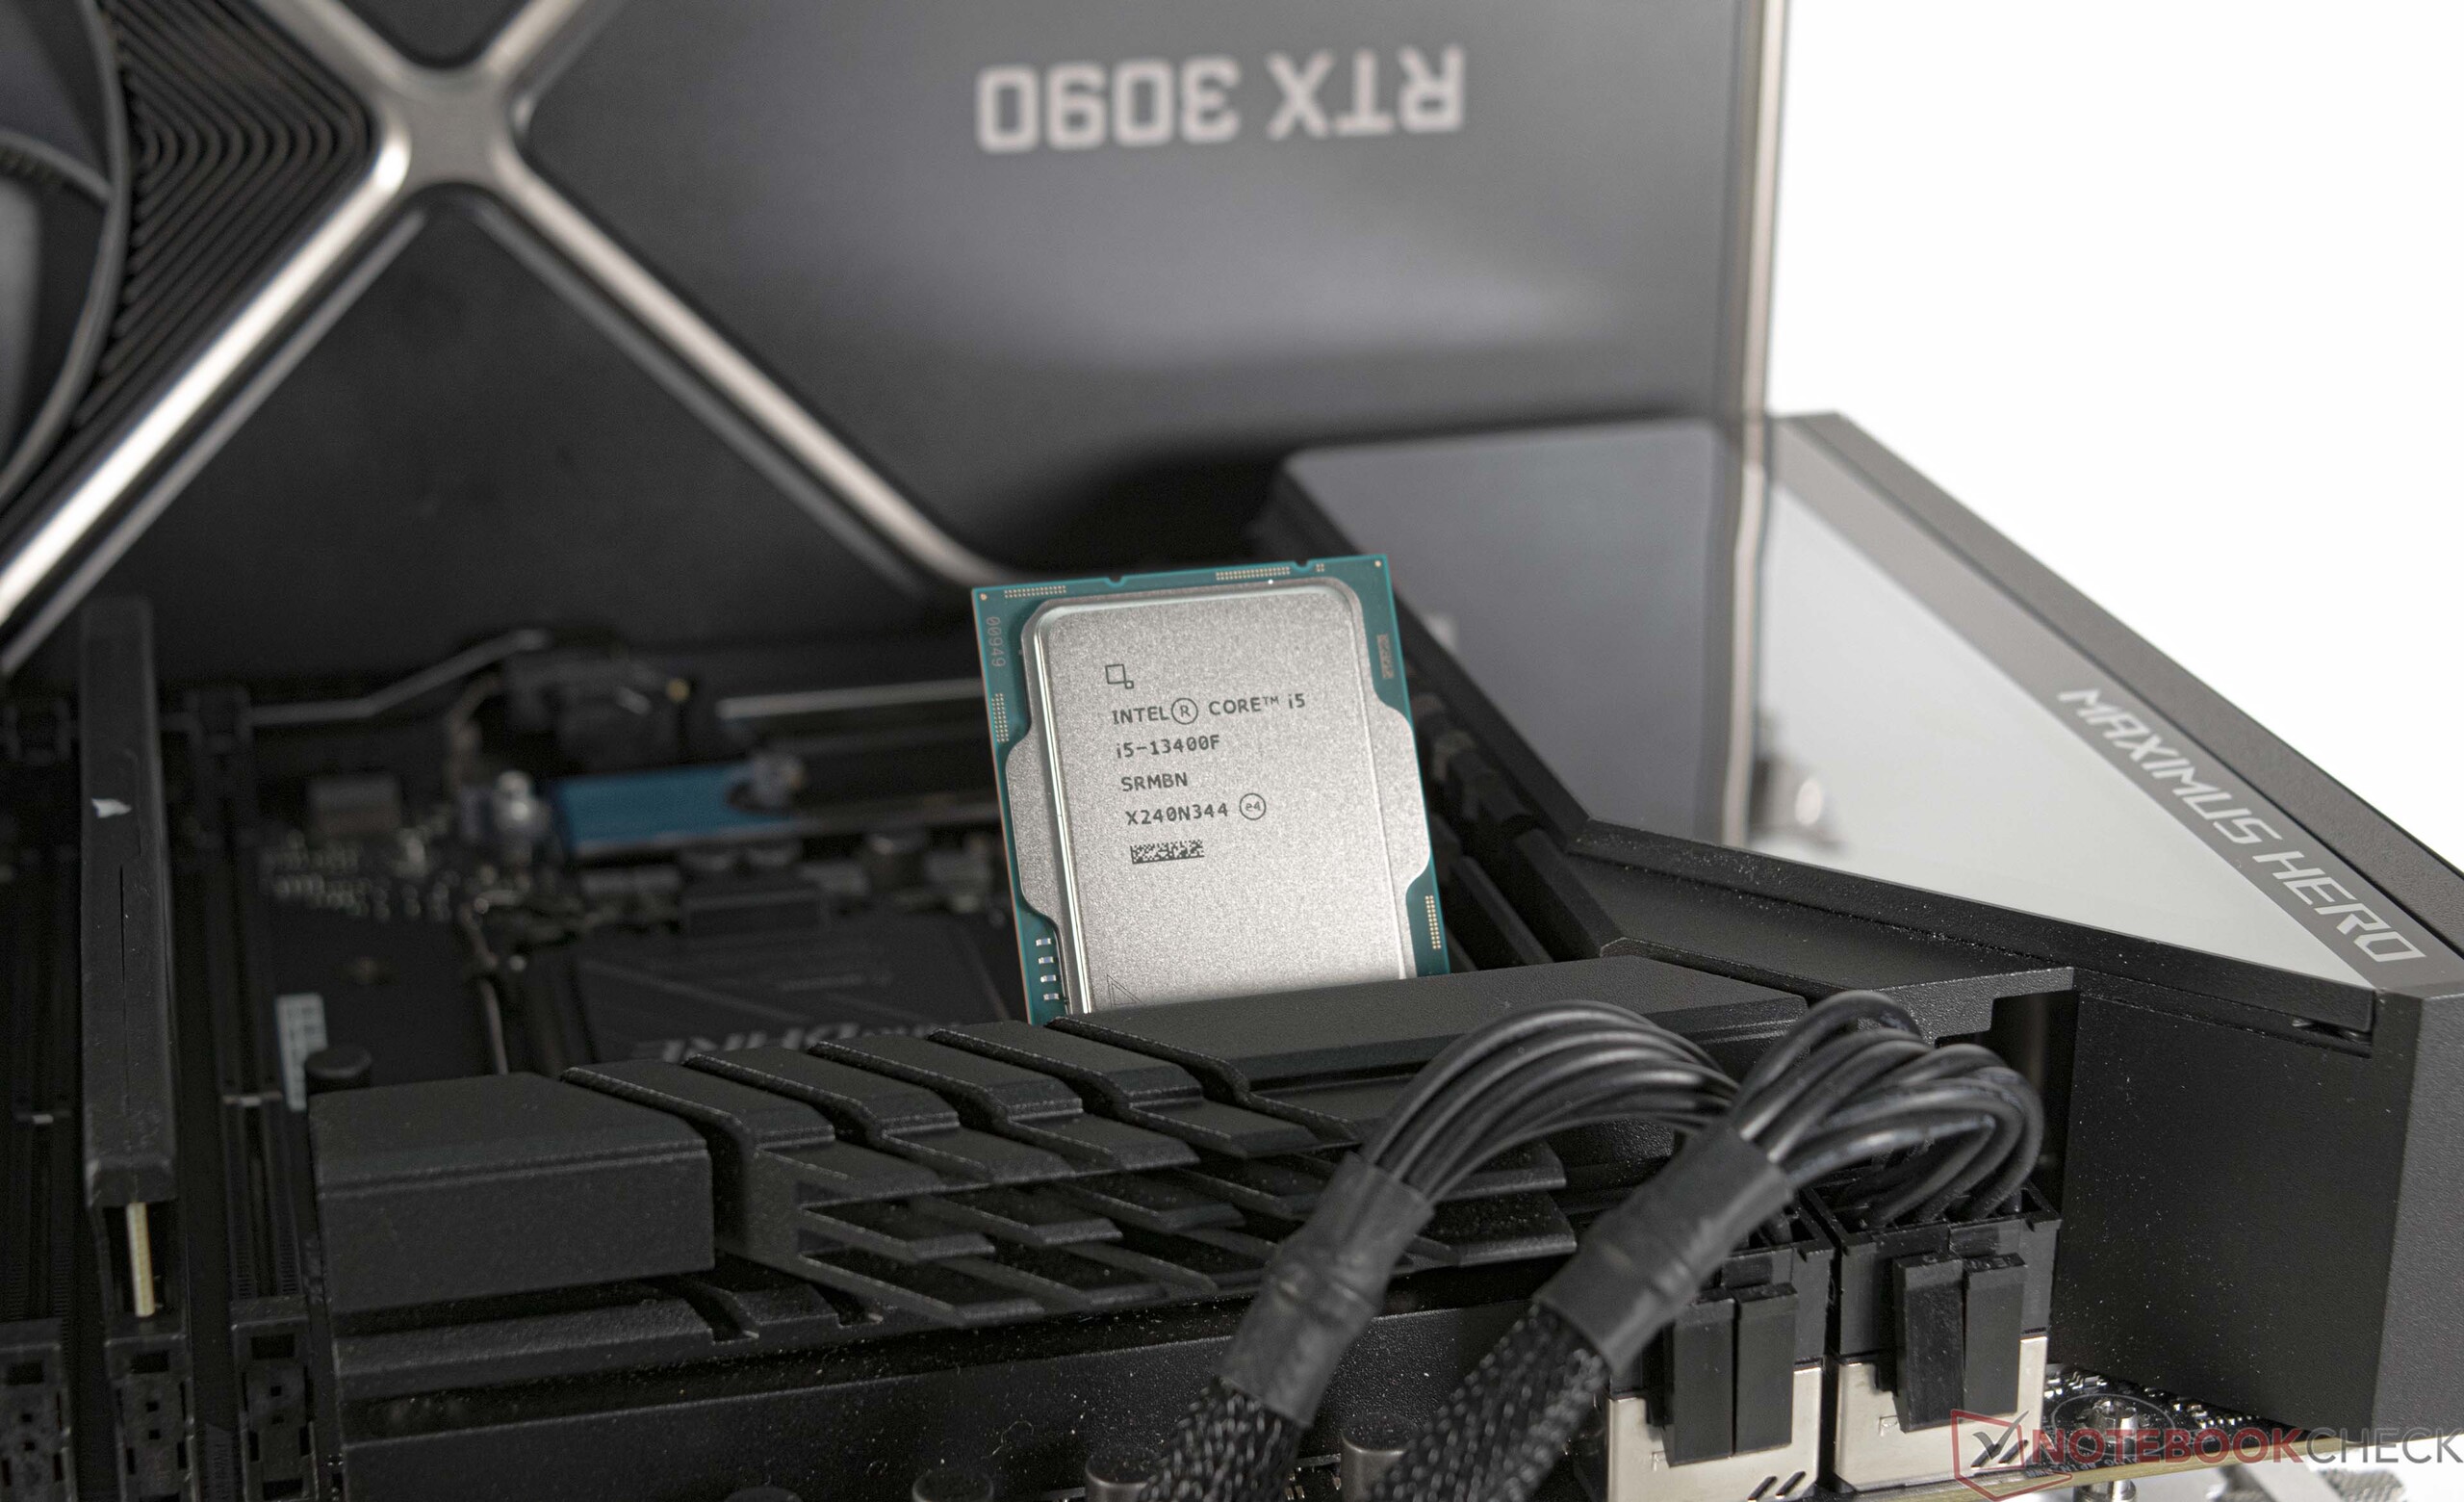
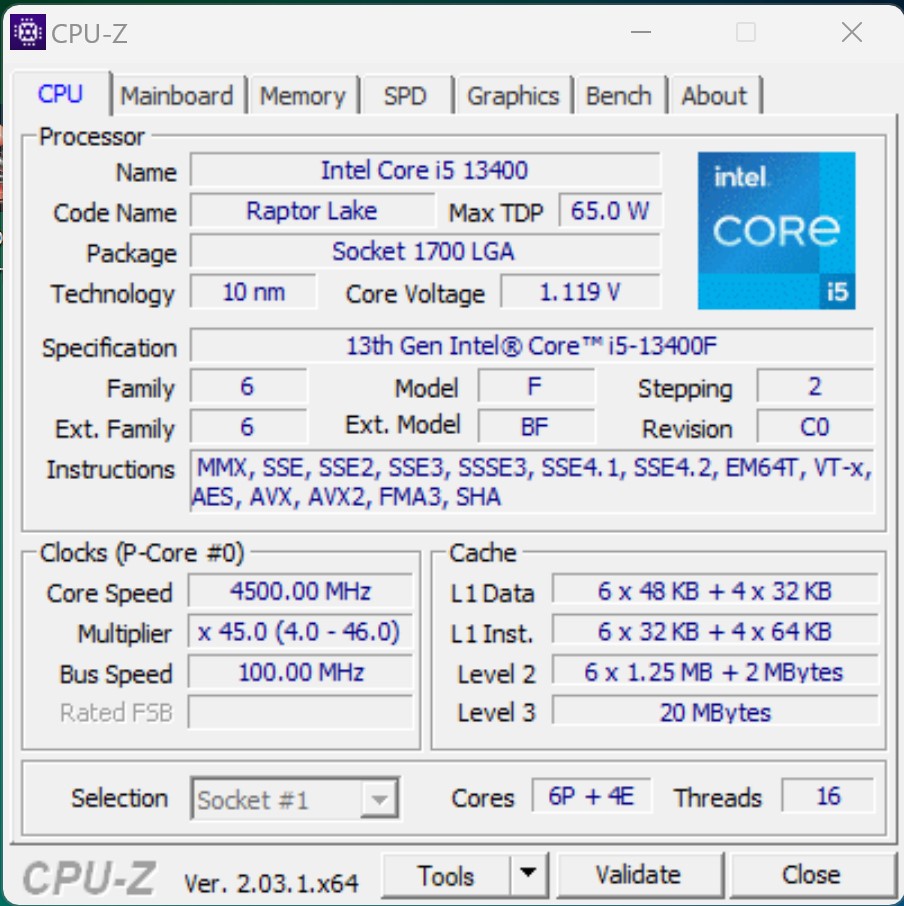
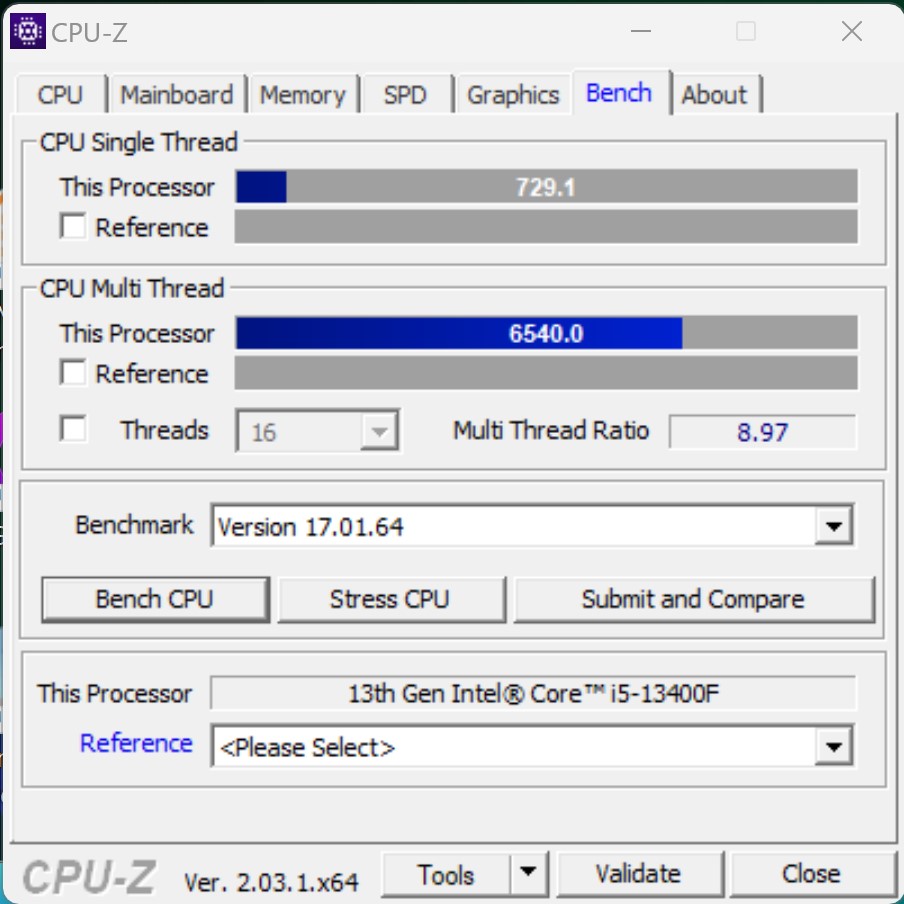
Intel Core i5-13400F processor för stationära datorer i en recension: Ekonomisk och billig 10-kärnig processor för spel och arbete

Intel lanserade den hybrida CPU-arkitekturen med Alder Lake-serien, som kombinerar de så kallade P- och E-kärnorna under en och samma värmespridare. E-kärnorna har hittills utelämnats i instegs-CPU:erna, vilket främst påverkade flertrådsprestandan. Med den 13:e Core-generationen har Intel äntligen gett Core i5-13400F 4 ytterligare E-kärnor utöver de 6 P-kärnorna. Därmed är den nu i nivå med en Intel Core i5-12600K i Alder Lake-serien. Trots detta skiljer sig dessa två modeller kraftigt åt när det gäller strömförbrukningen. Det är dock bara några få procentenheter som skiljer de två modellerna åt när det gäller prestanda, vilket vi kan avslöja vid det här laget.
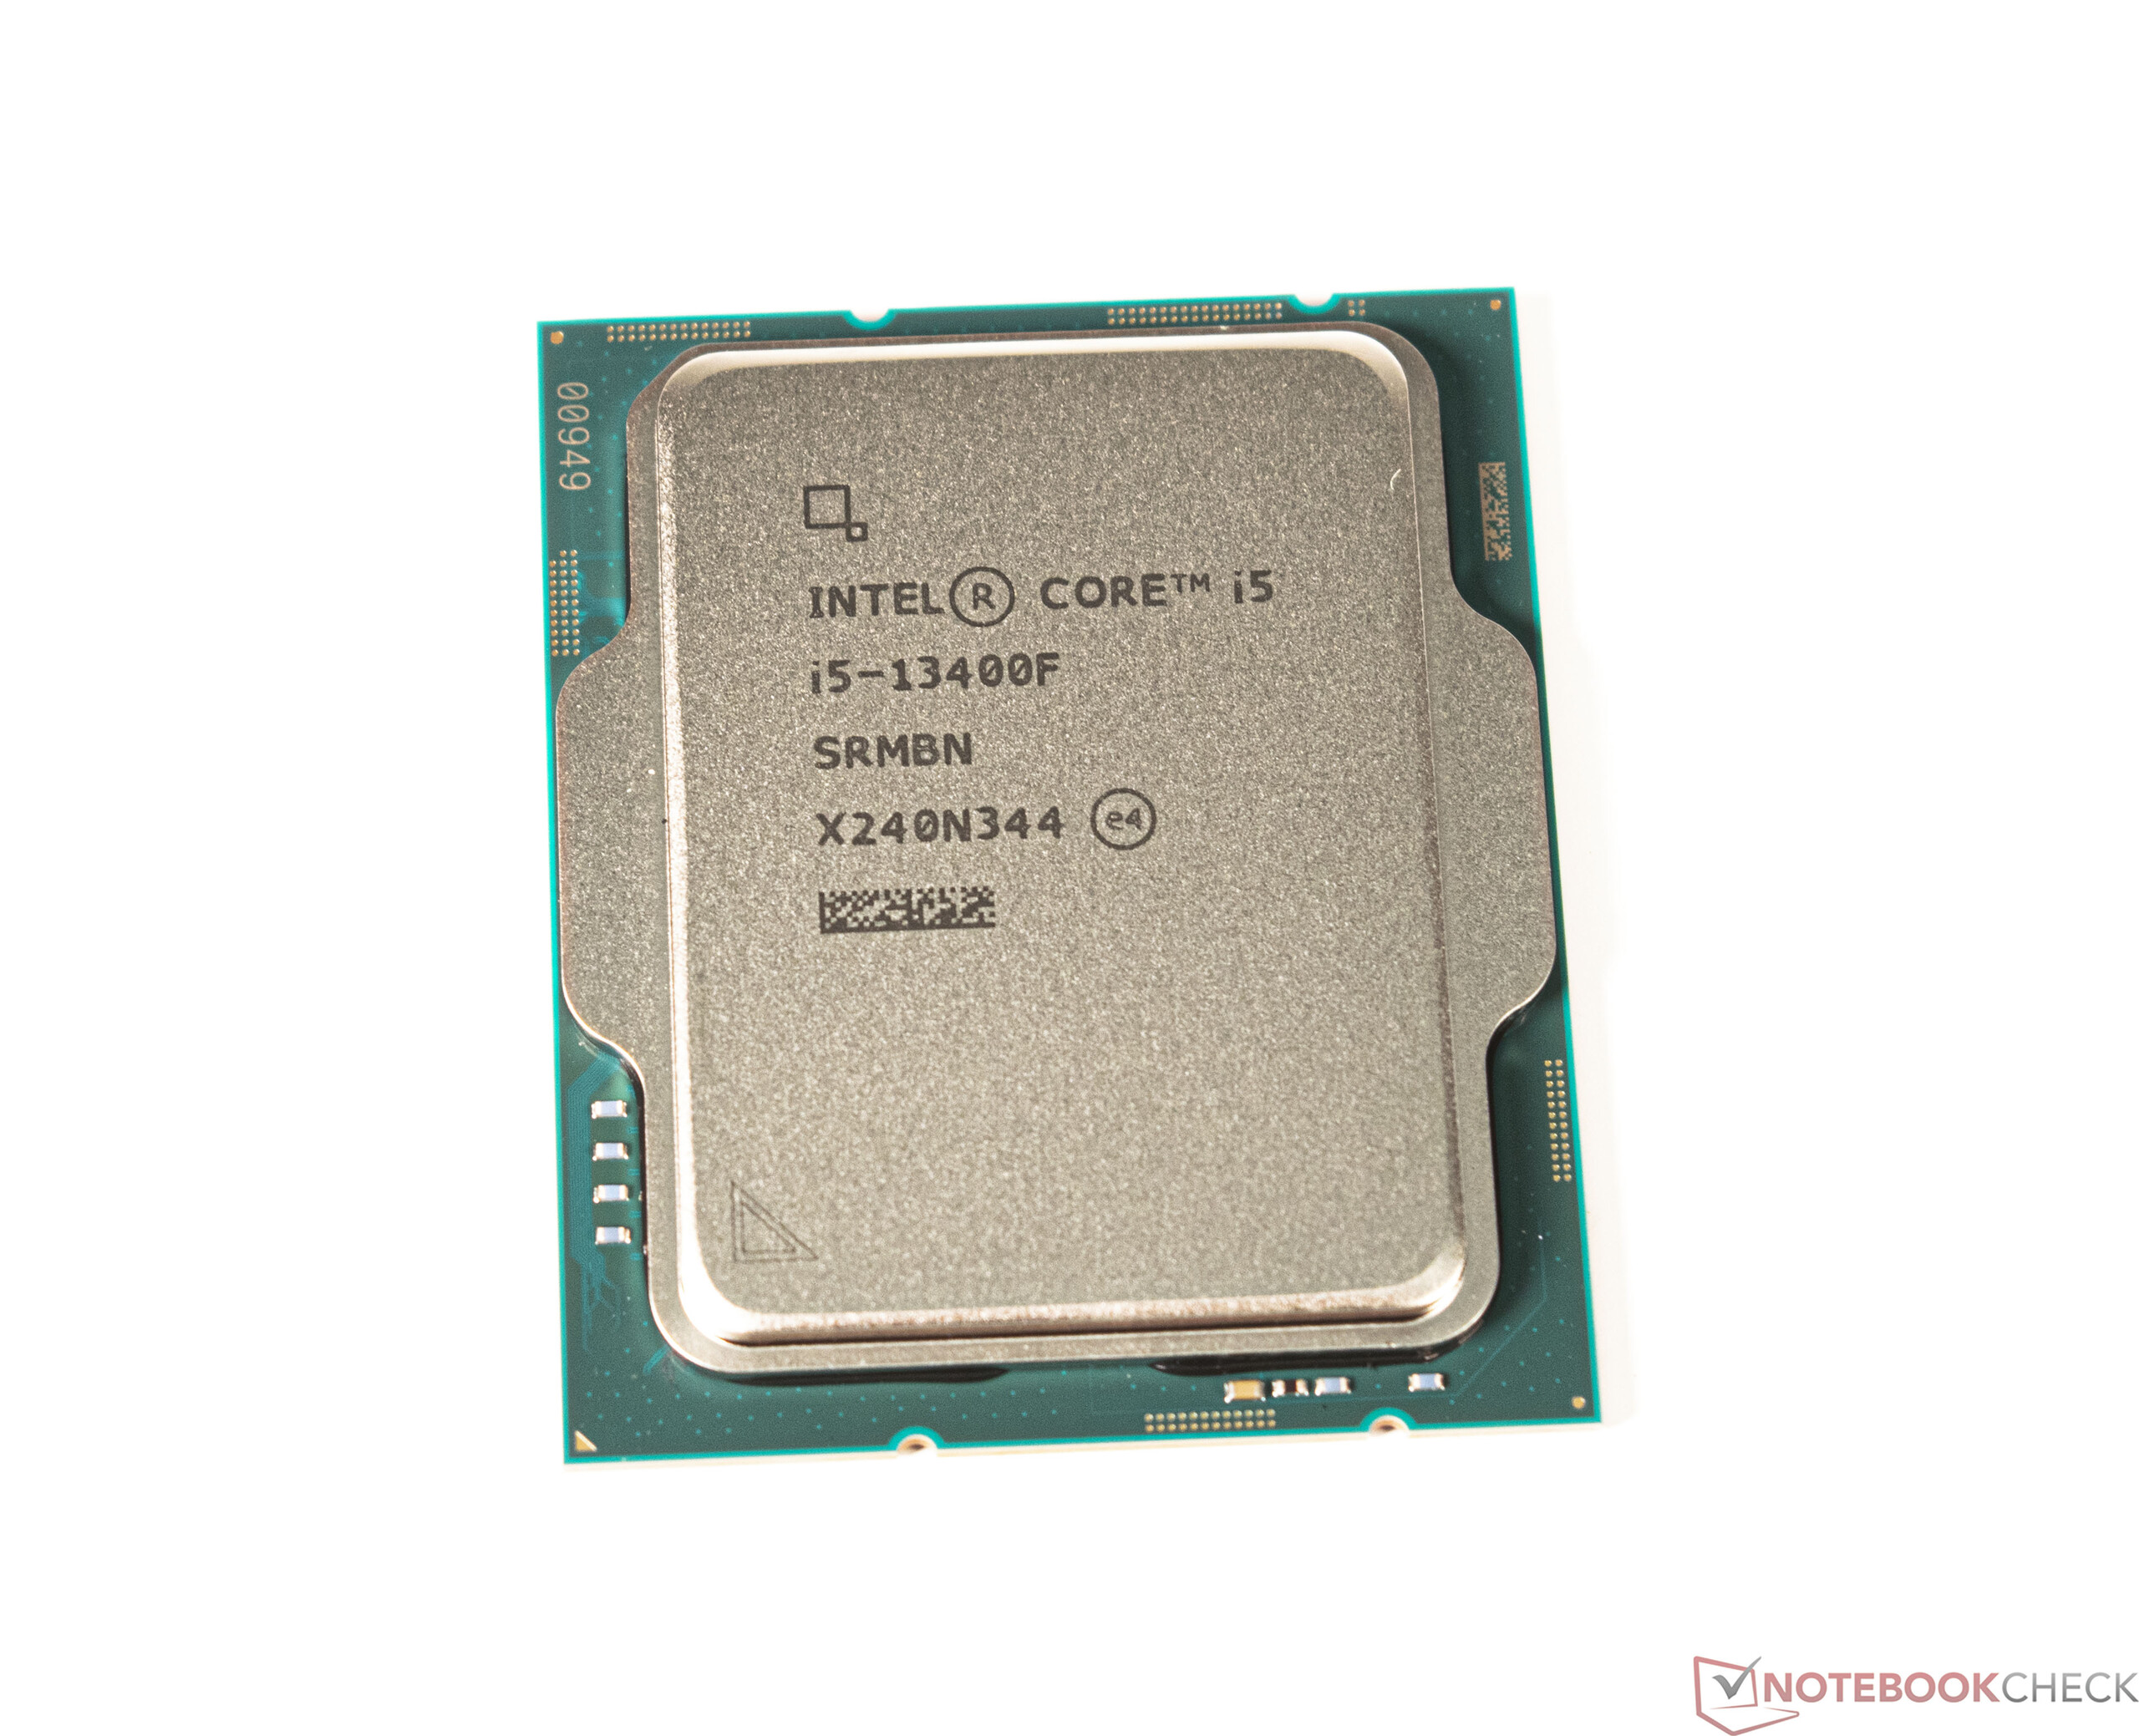
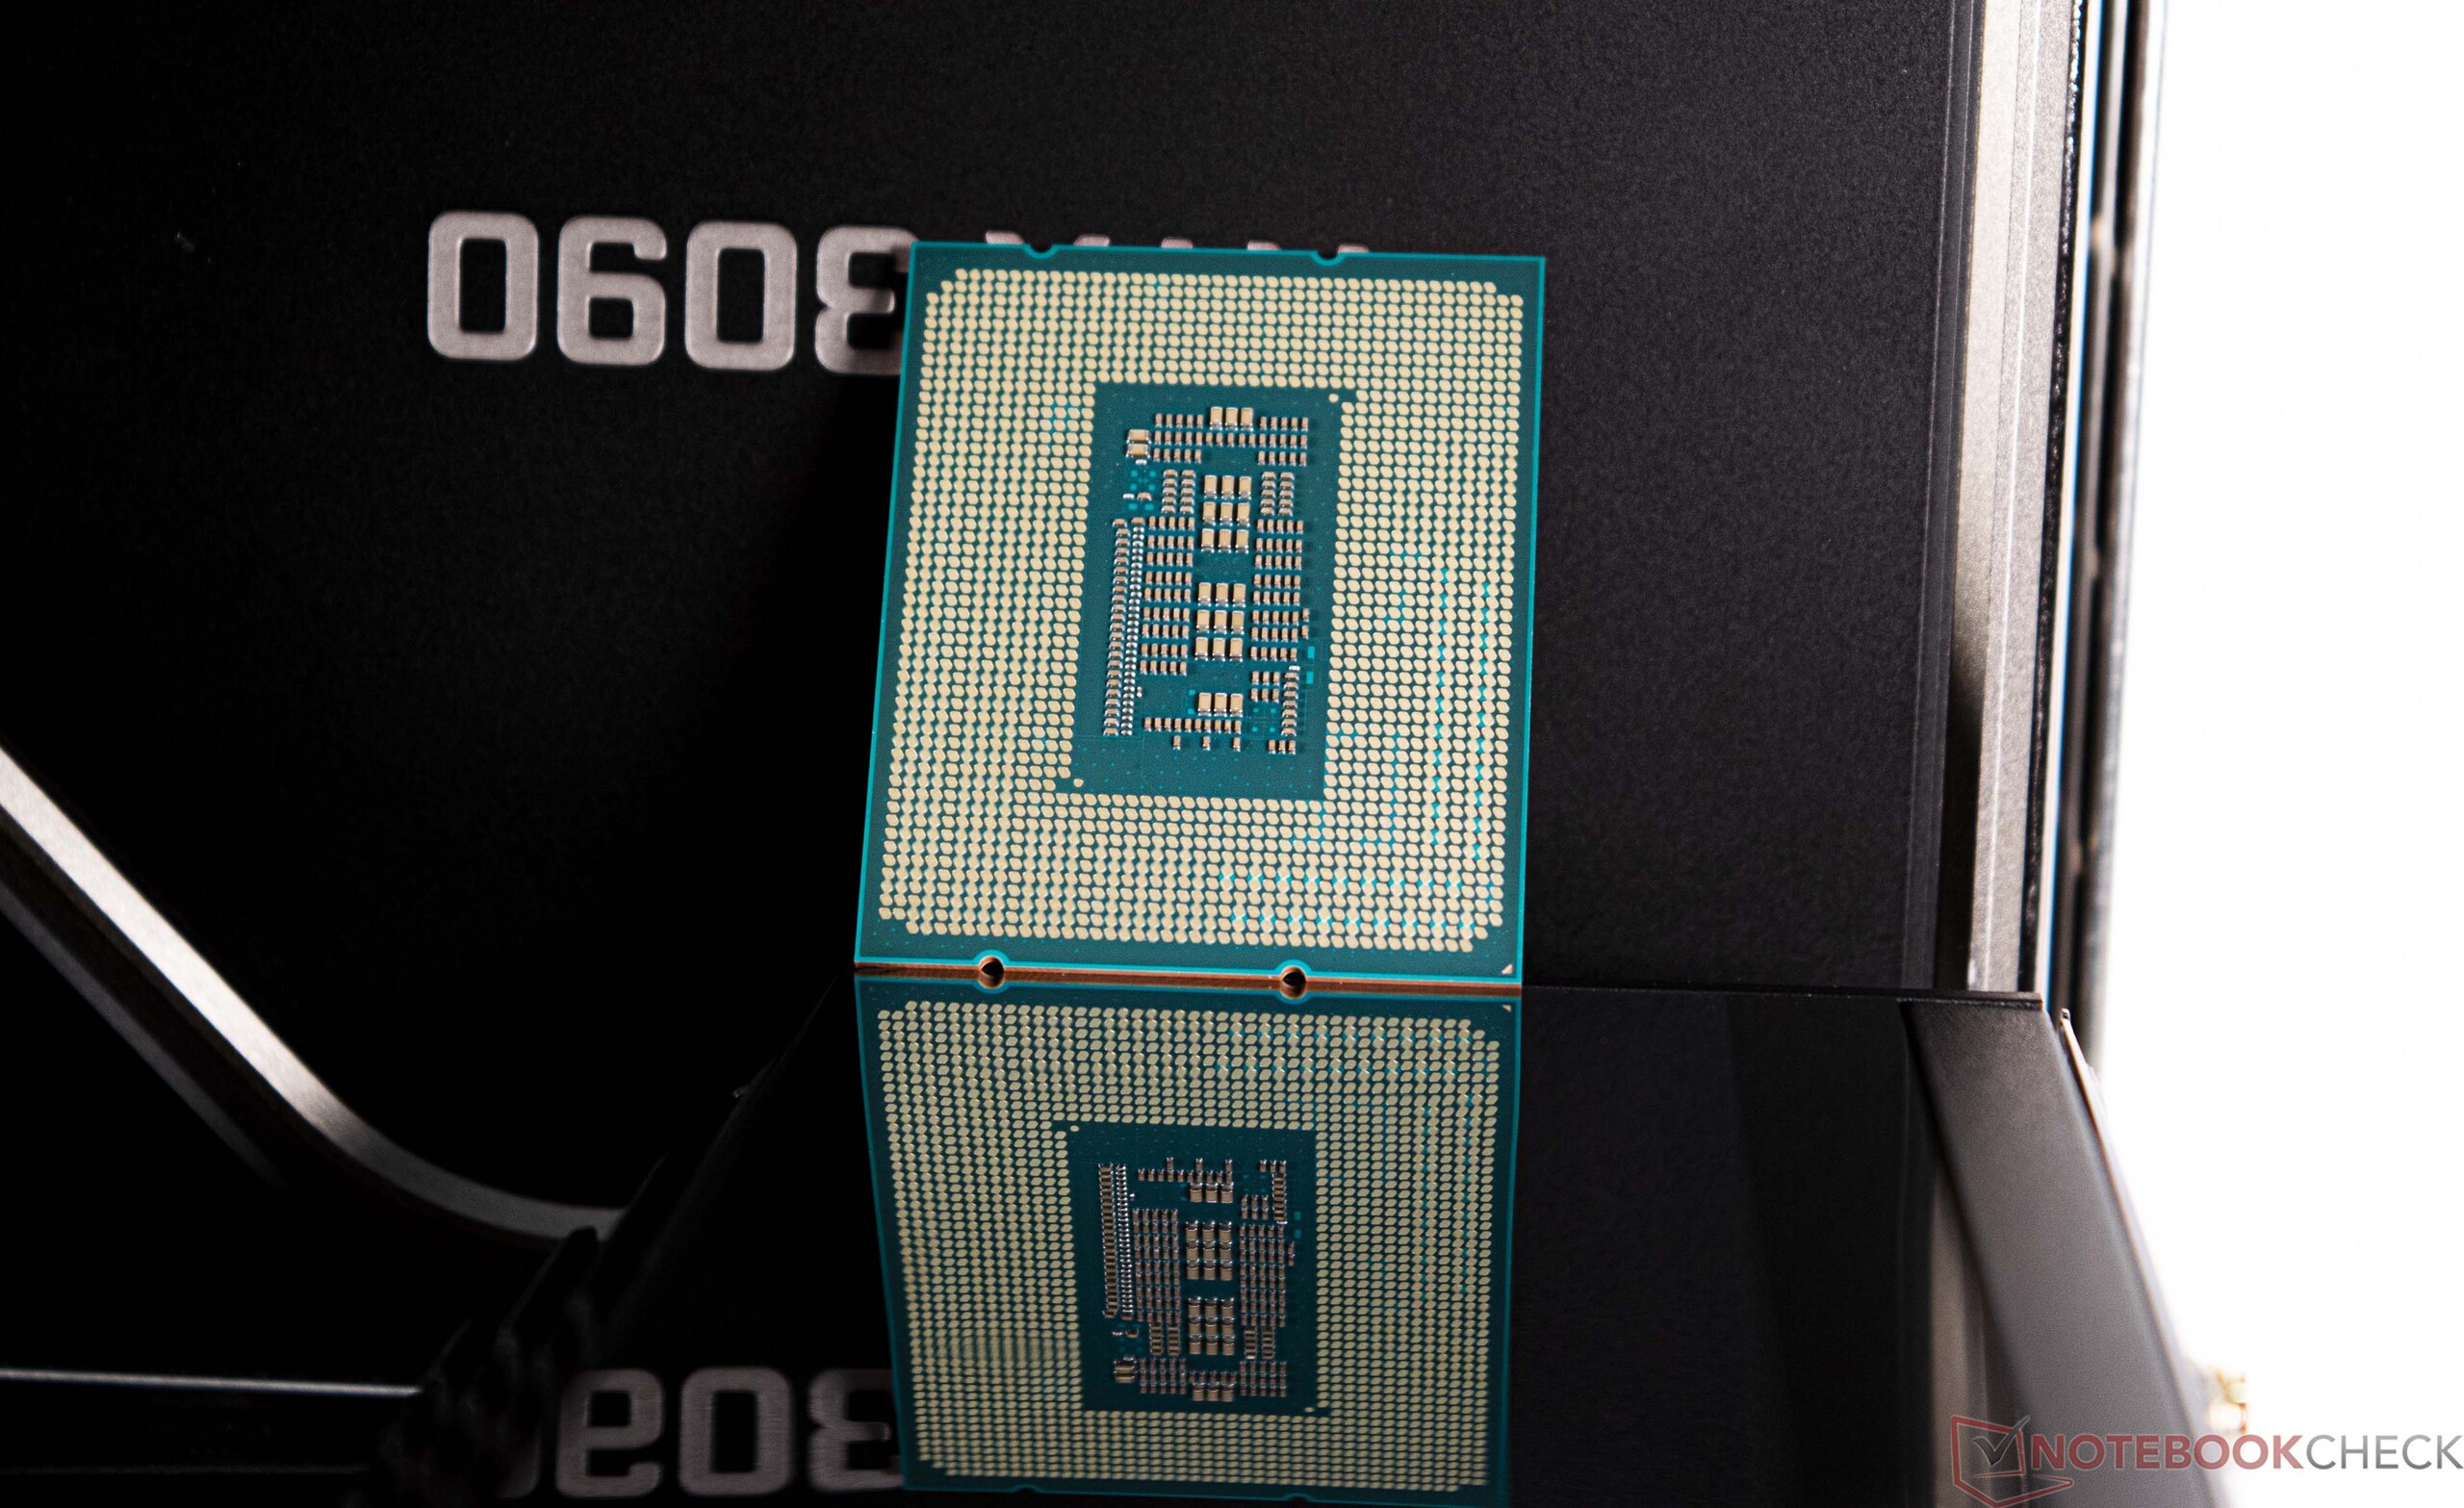
Intel Alder-Lake och Intel Raptor-Lake delar båda socket 1700 som underbyggnad. Således kan alla nya processorer även köras på de äldre 600-chipsetarna. Trots detta bör en BIOS-uppdatering utföras i förväg så att de senaste processorerna känns igen och stöds på rätt sätt. På tal om Alder-Lake och Raptor-Lake: Intel Core i5-13400F kan valfritt fås i B0- eller C0-stegning. B0-steget avser en Raptor-Lake DIE, medan en Alder-Lake DIE finns under värmespridaren i C0-steget.
I följande tabell har vi sammanställt de viktigaste företrädarna för den nya Raptor Lake S-familjen för dig. Mer information om Intel Core i5-13400F hittar du här.
Intels Core-processorer i jämförelse
| Modell | Kärnor / Trådar |
Klockan P-Core / Turbo | Klockan E-Core / Turbo | Cache L2 + L3 | Grafik | PBP | MTB | Pris (MSRP) |
| Core i9-13900K | 24 (8P + 16E) /32 | 3,0 GHz / 5,8 GHz | 2,2 GHz / 4,3 GHz | 32 + 36 MB | UHD 770 | 125 Watt | 253 Watt | $ 589 |
| Core i9-13900KF | 16 (8P + 16E) /32 | 3,0 GHz / 5,8 GHz | 2,2 GHz / 4,3 GHz | 32 + 36 MB | - | 125 Watt | 253 Watt | $ 564 |
| Core i9-12900K | 16 (8P + 8E) /24 | 3,2 GHz / 5,1 GHz | 2,4 GHz / 3,9 GHz | 14 + 30 MB | UHD 770 | 125 Watt | 241 Watt | $ 589 |
| Core i9-12900KF | 16 (8P + 8E) /24 | 3,2 GHz / 5,1 GHz | 2,4 GHz / 3,9 GHz | 14 + 30 MB | - | 125 Watt | 241 Watt | $ 564 |
| Core i7-13700K | 16 (8P + 8E) /24 | 3,4 GHz / 5,4 GHz | 2,5 GHz / 4,2 GHz | 24 + 30 MB | UHD 770 | 125 Watt | 253 Watt | $ 409 |
| Core i7-13700KF | 16 (8P + 8E) /24 | 3,4 GHz / 5,4 GHz | 2,5 GHz / 4,2 GHz | 24 + 30 MB | - | 125 Watt | 253 Watt | $ 384 |
| Core i7-12700K | 12 (8P + 4E) /20 | 3,6 GHz / 4,9 GHz | 2,7 GHz / 3,8 GHz | 12 + 25 MB | UHD 770 | 125 Watt | 190 Watt | $ 409 |
| Core i7-12700KF | 12 (8P + 4E) /20 | 3,6 GHz / 4,9 GHz | 2,7 GHz / 3,8 GHz | 12 + 25 MB | - | 125 Watt | 190 Watt | $ 384 |
| Core i5-13600K | 14 (6P + 8E) /20 | 3,5 GHz / 5,1 GHz | 2,6 GHz / 3,9 GHz | 20 + 24 MB | UHD 770 | 125 Watt | 181 Watt | 319 $ |
| Core i5-13600KF | 14 (6P + 8E) /20 | 3,5 GHz / 5,1 GHz | 2,6 GHz / 3,9 GHz | 20 + 24 MB | - | 125 Watt | 181 Watt | $ 294 |
| Core i5-12600K | 10 (6P + 4E) /16 | 3,7 GHz / 4,9 GHz | 2,8 GHz / 3,6 GHz | 9,5 + 20 MB | UHD 770 | 125 Watt | 150 Watt | $ 289 |
| Core i5-12600KF | 10 (6P + 4E) /16 | 3,7 GHz / 4,9 GHz | 2,8 GHz / 3,6 GHz | 9,5 + 20 MB | - | 125 Watt | 150 Watt | $ 264 |
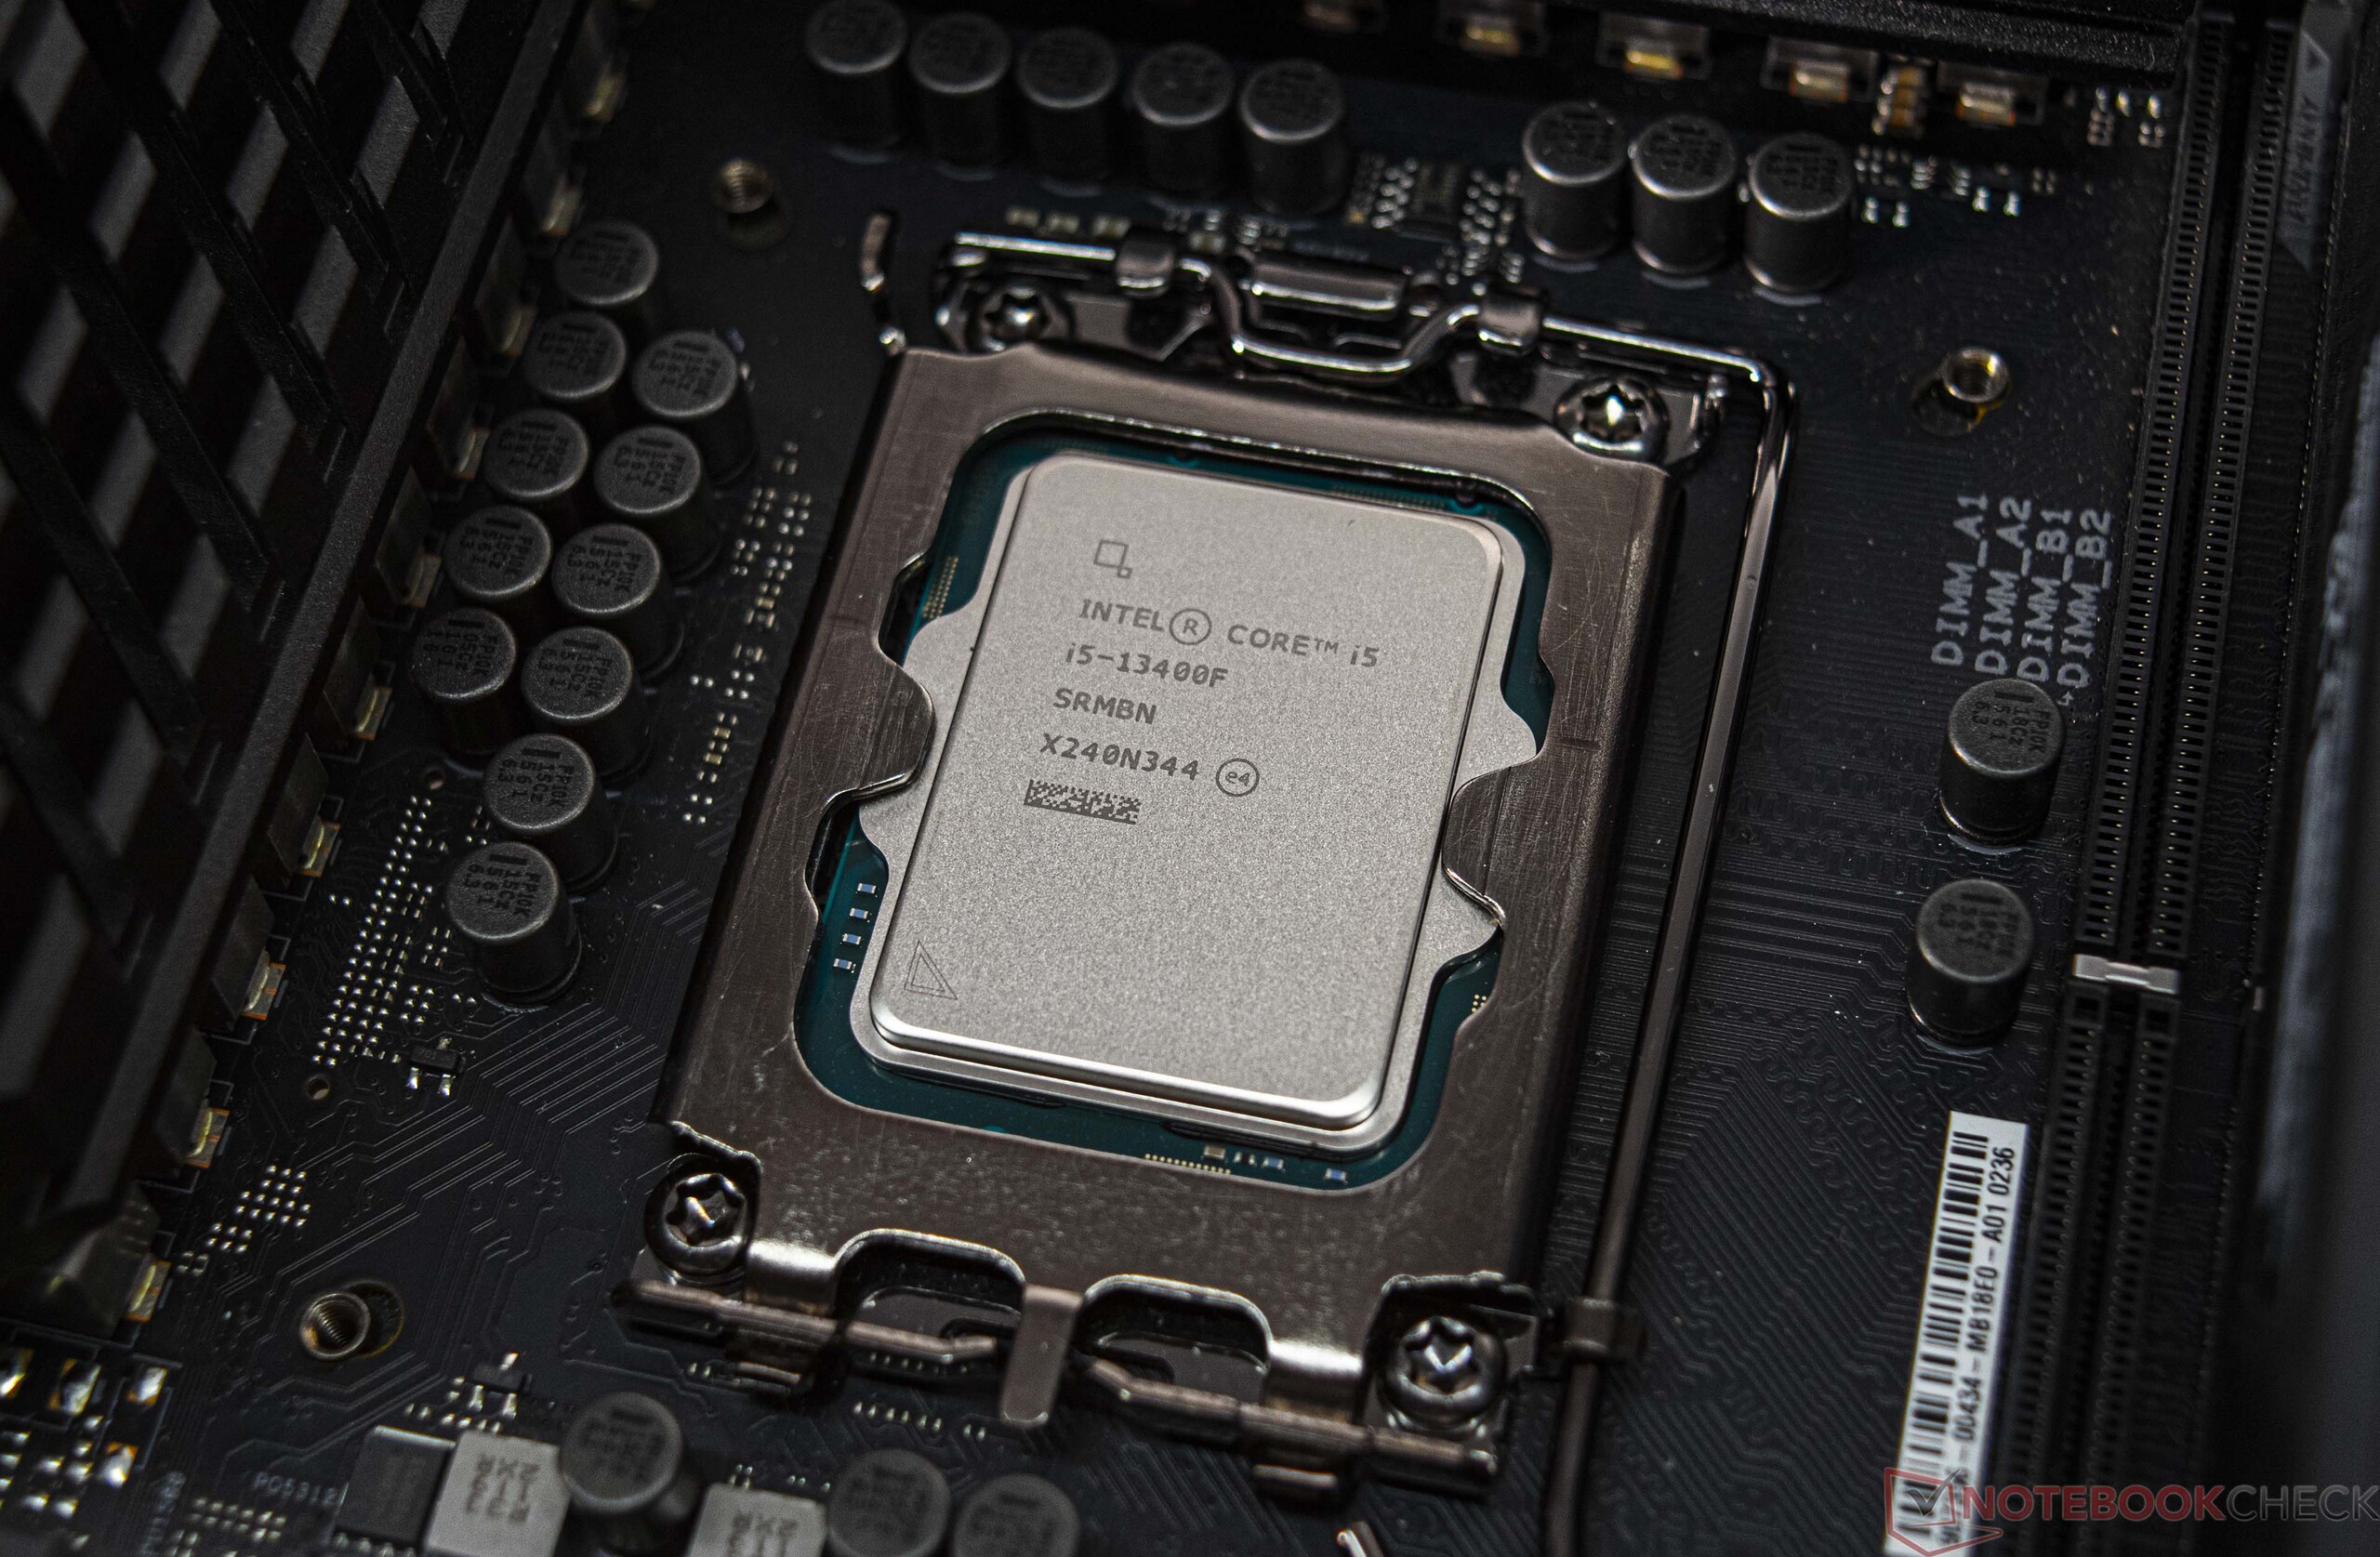
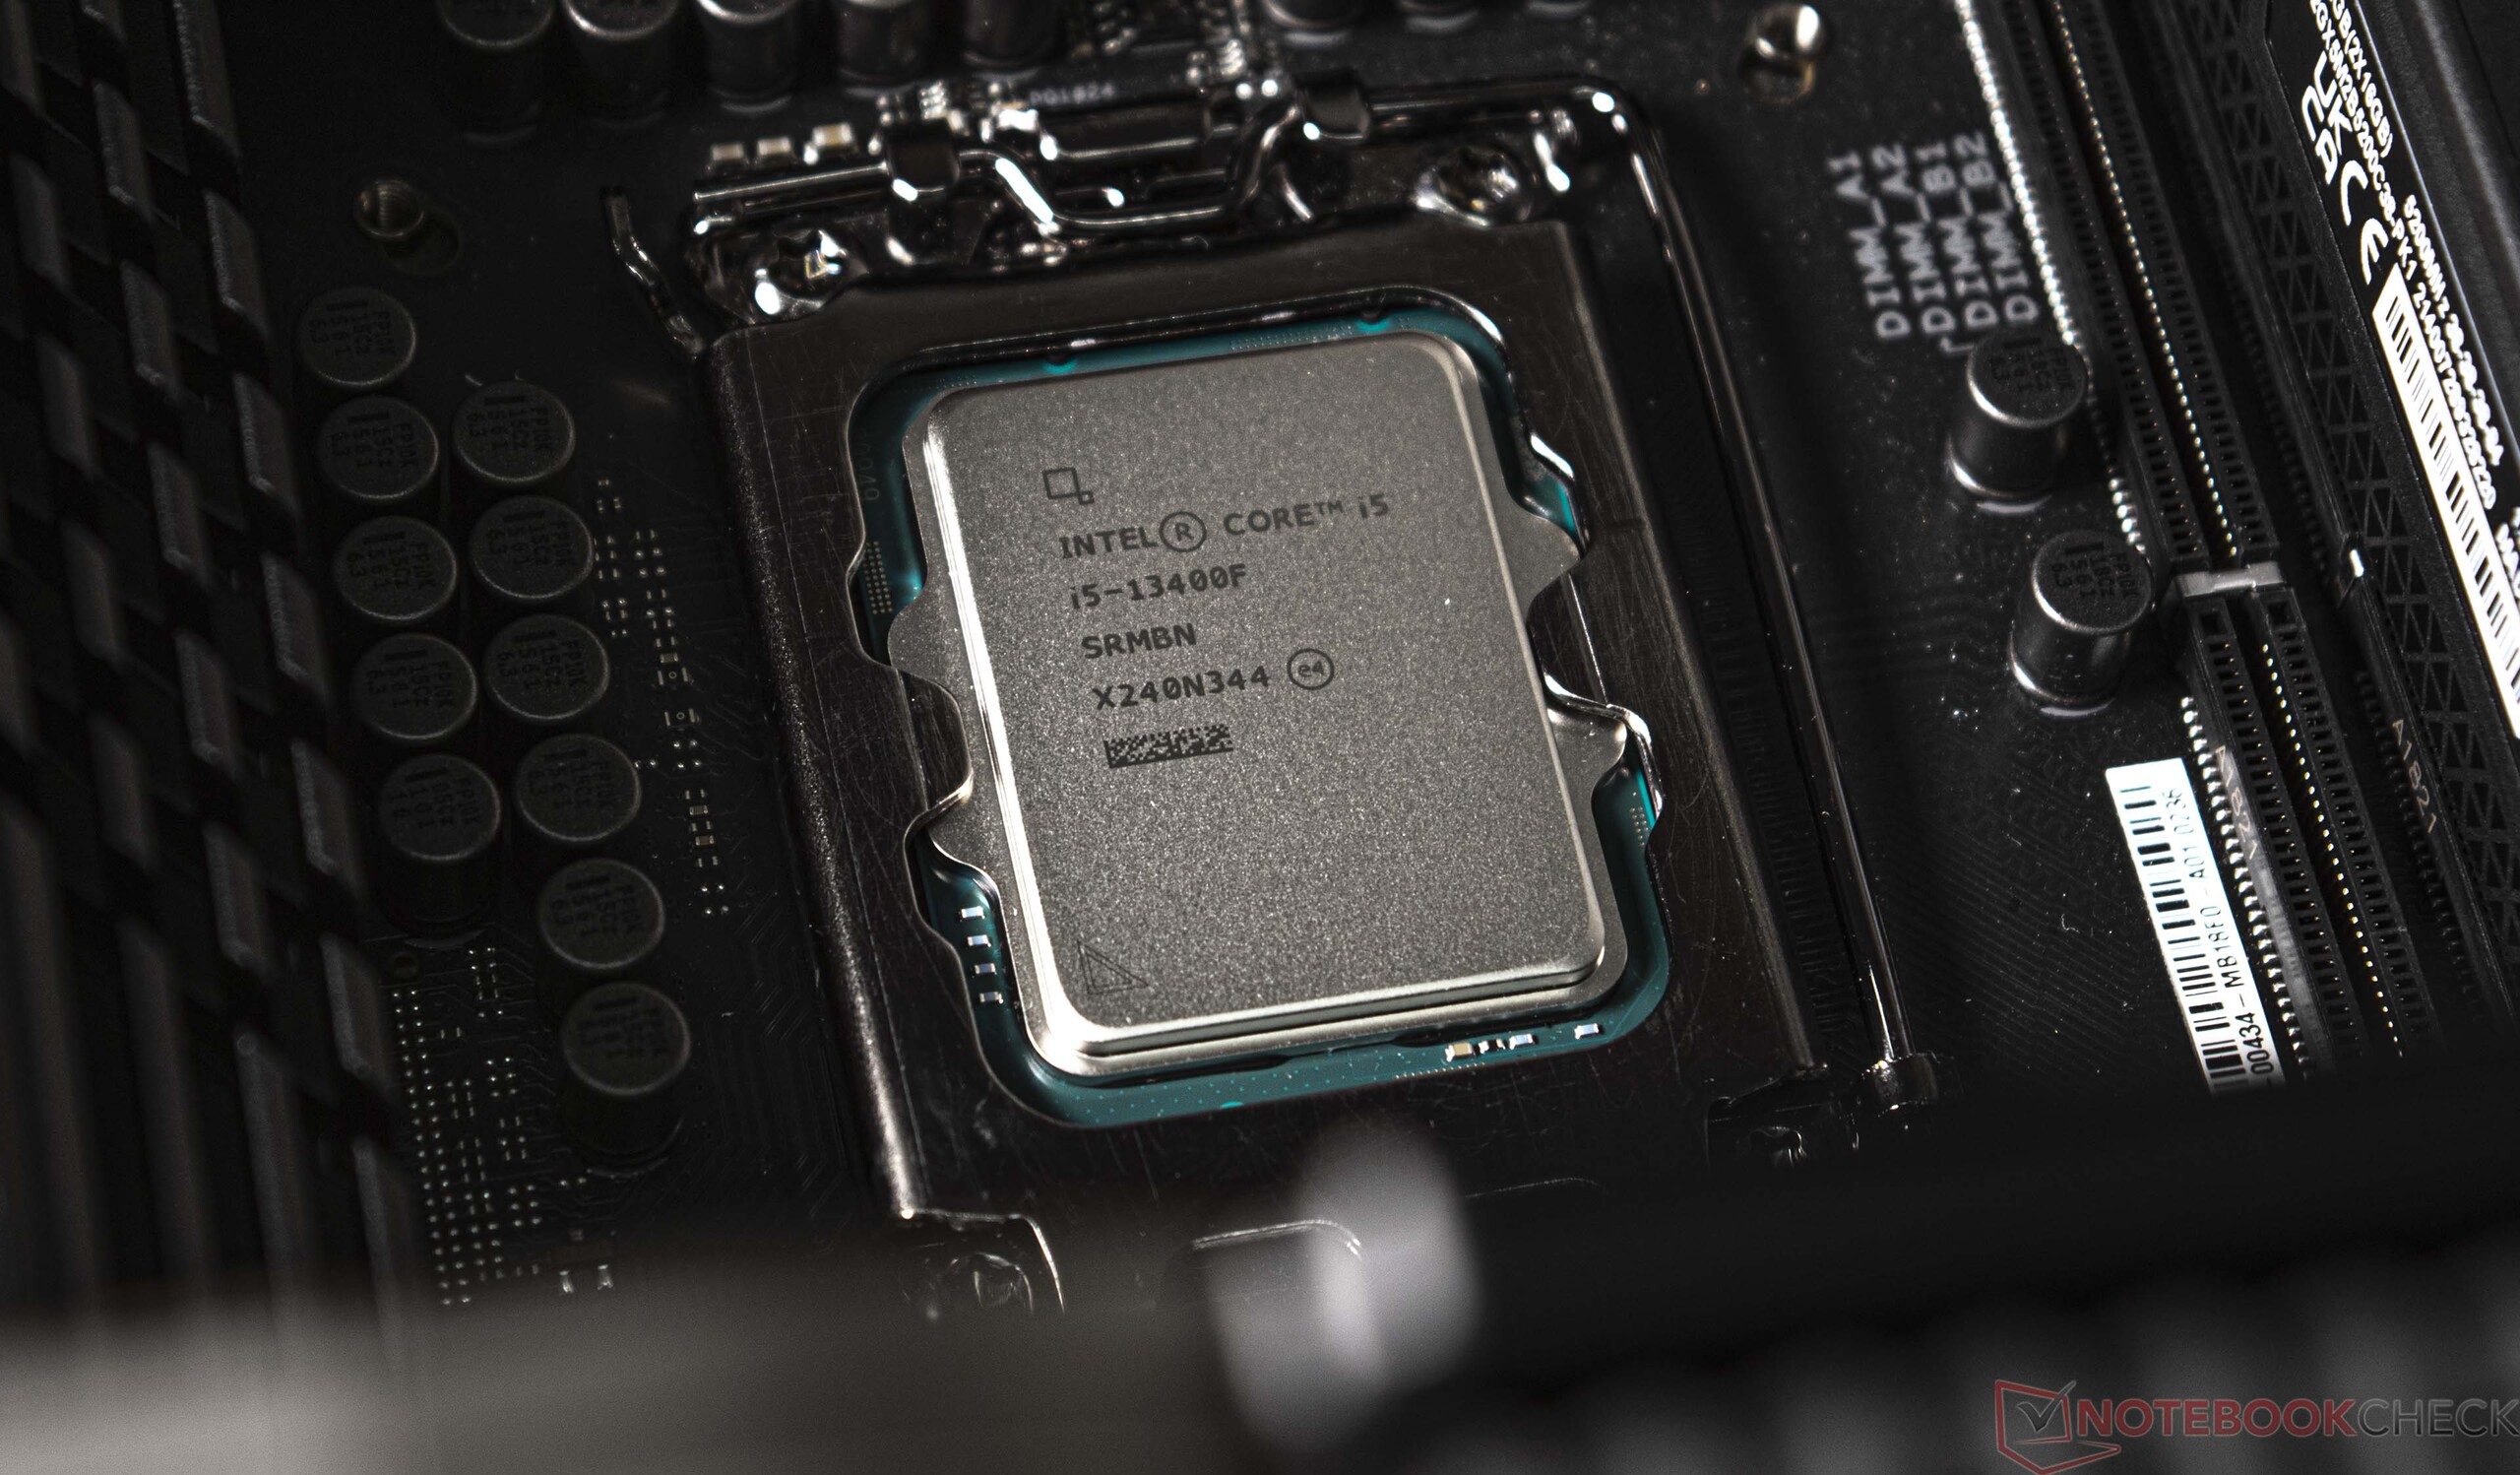
| Core i5-13400F | 10 (6P + 4E) /16 | 2,5 GHz / 4,6 GHz | 1,8 GHz / 3,3 GHz | 9,5 + 20 MB | - | 65 Watt | 148Watt | $ 196 |
| Core i5-12400F | 6 (6P + 0E) /12 | 2,5 GHz / 4,4 GHz | - | 7,5 + 18 MB | - | 65 Watt | 117 Watt | $ 194 |
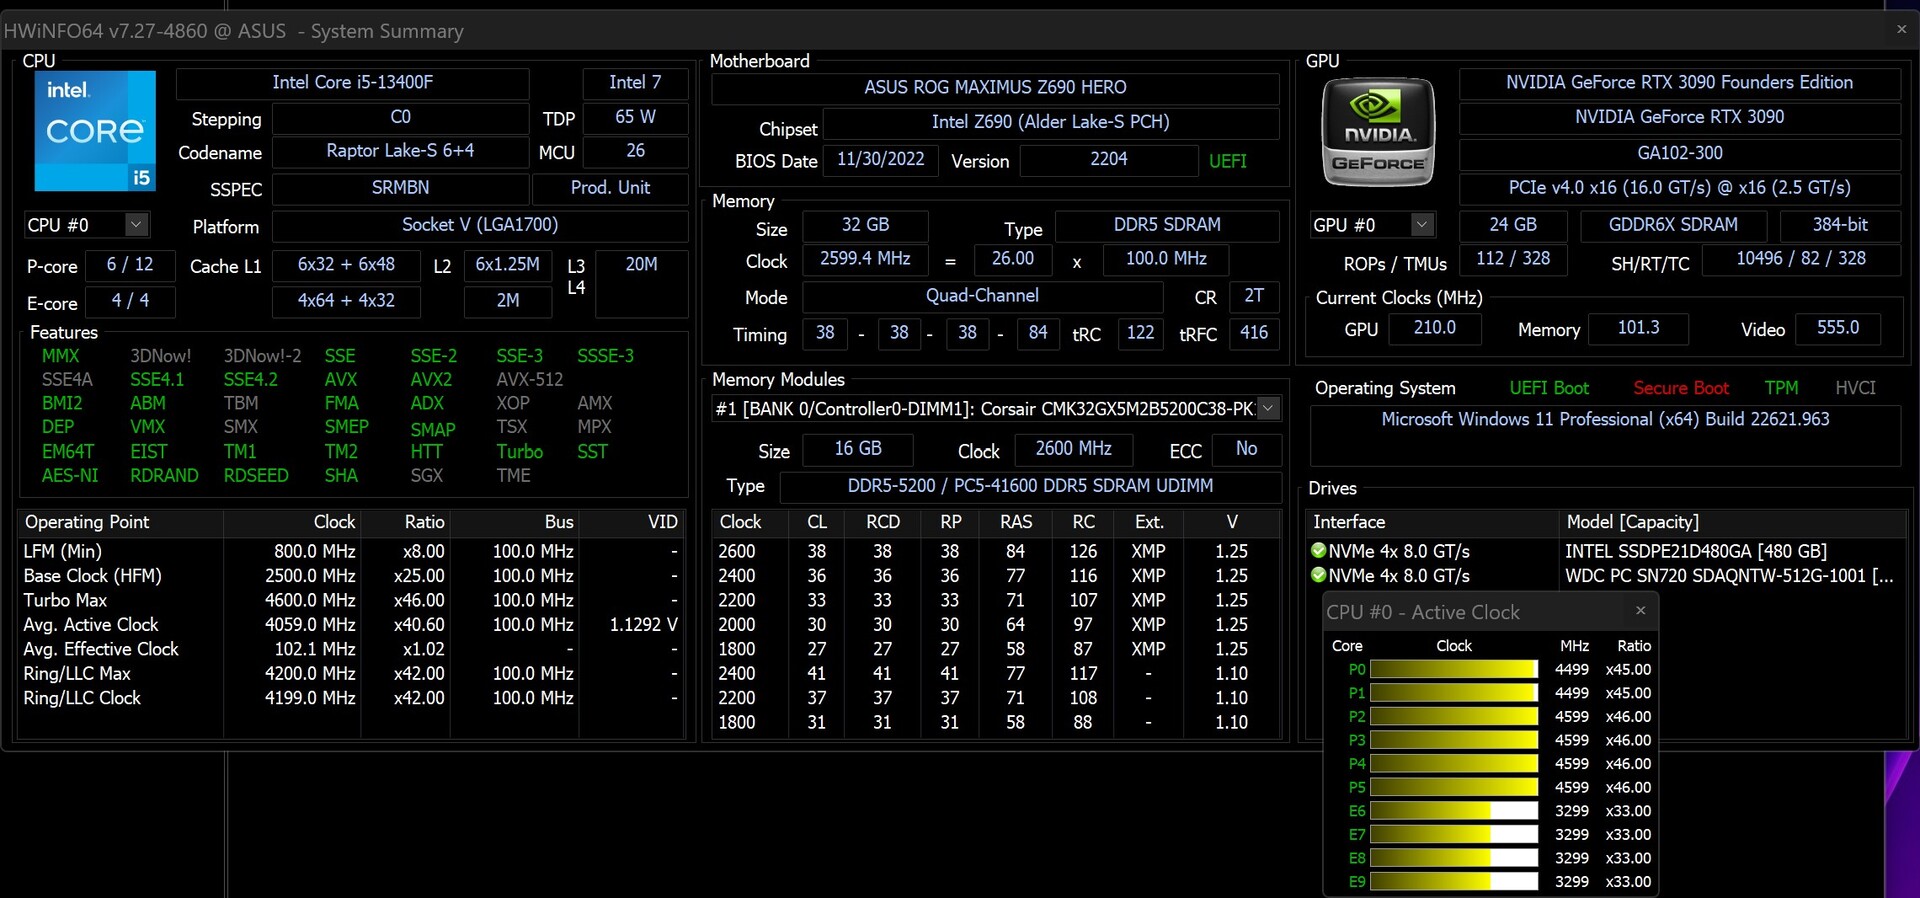
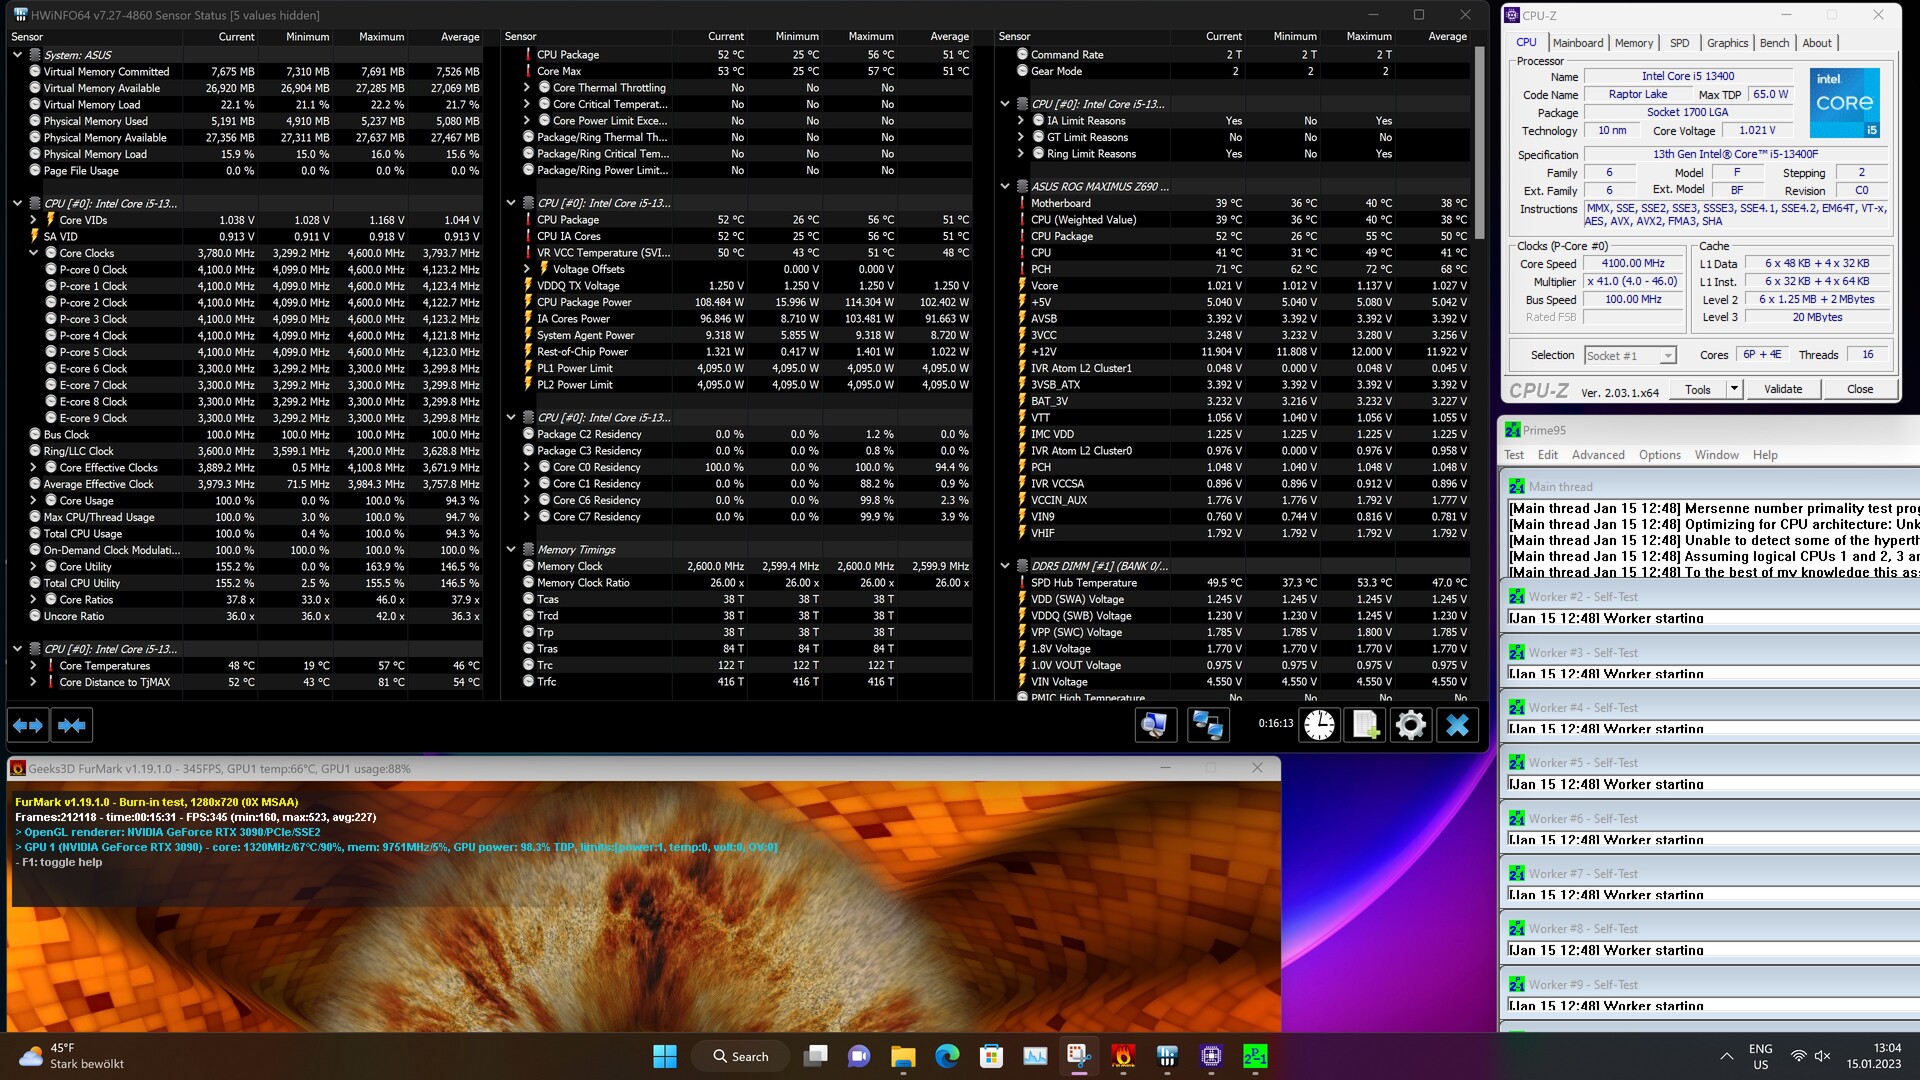
Detaljer om vårt testsystem
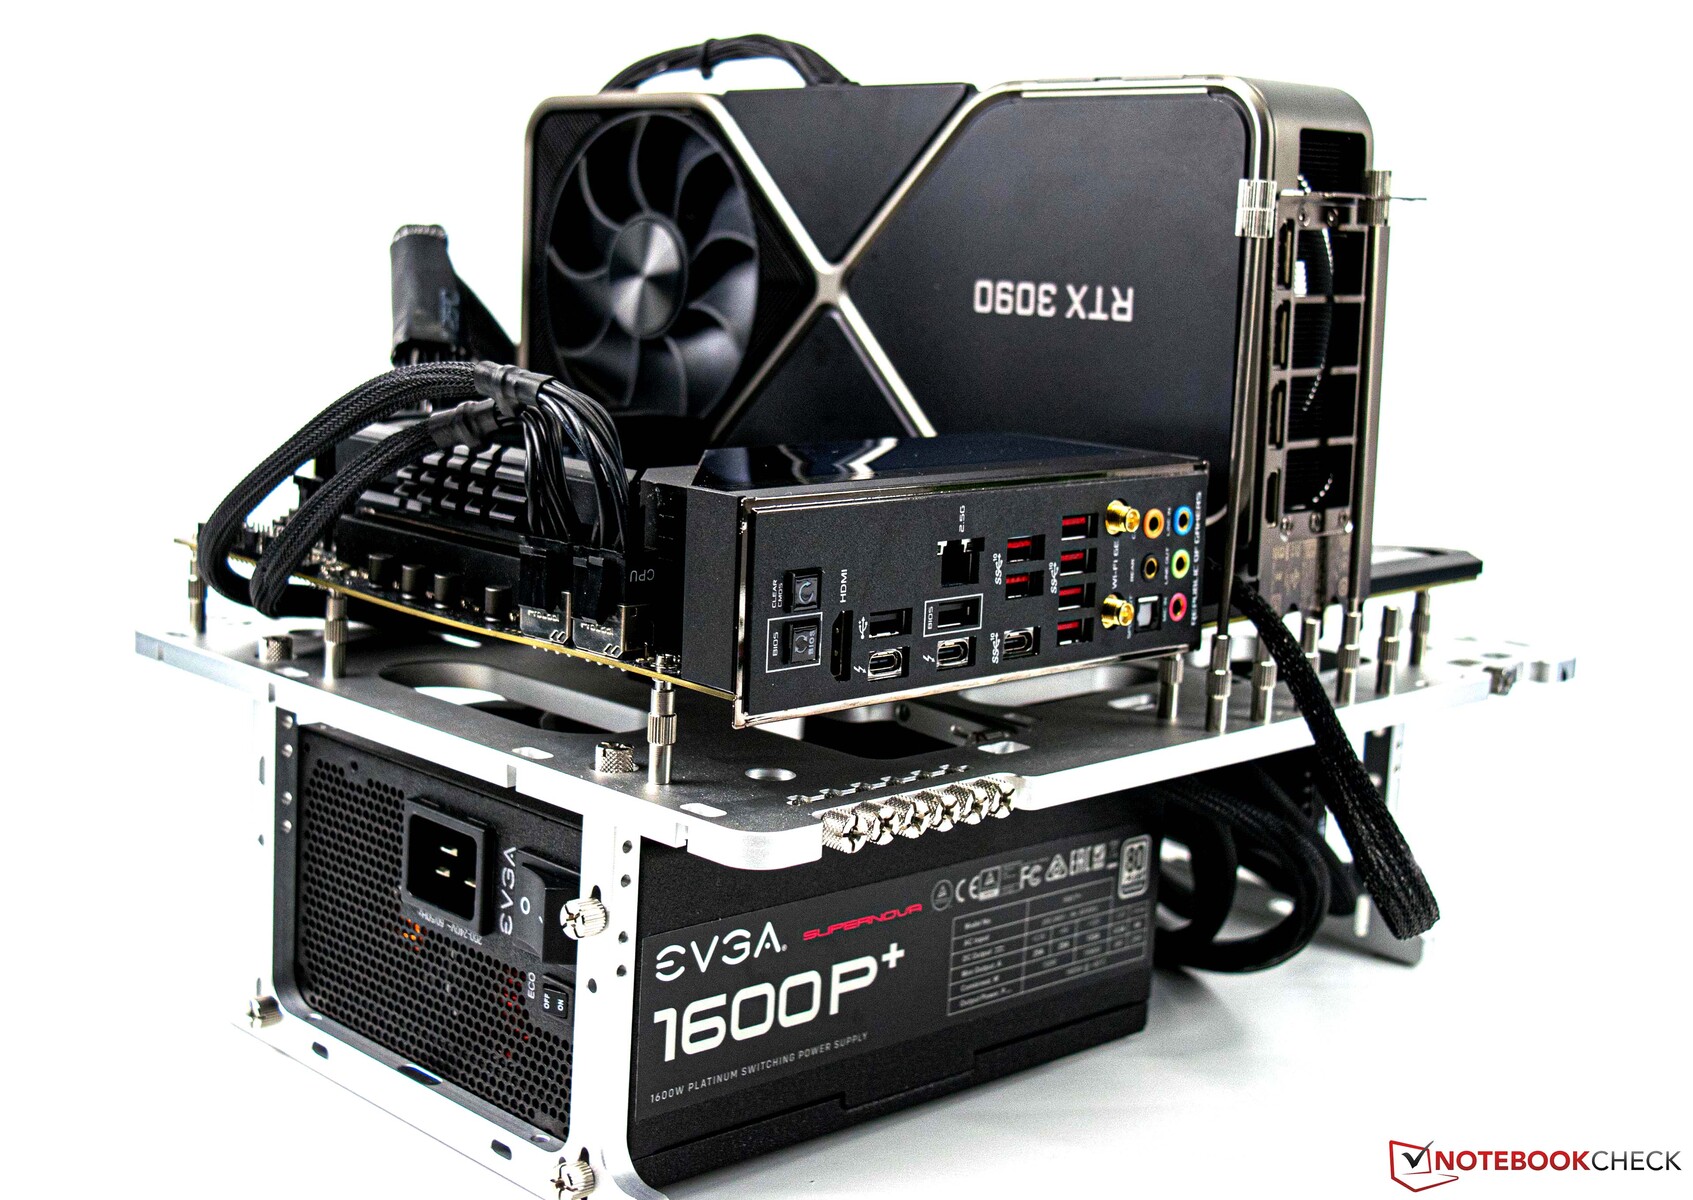
- Streacom BC1 V2 öppet bänkbord
- Intel Core i5-13400F
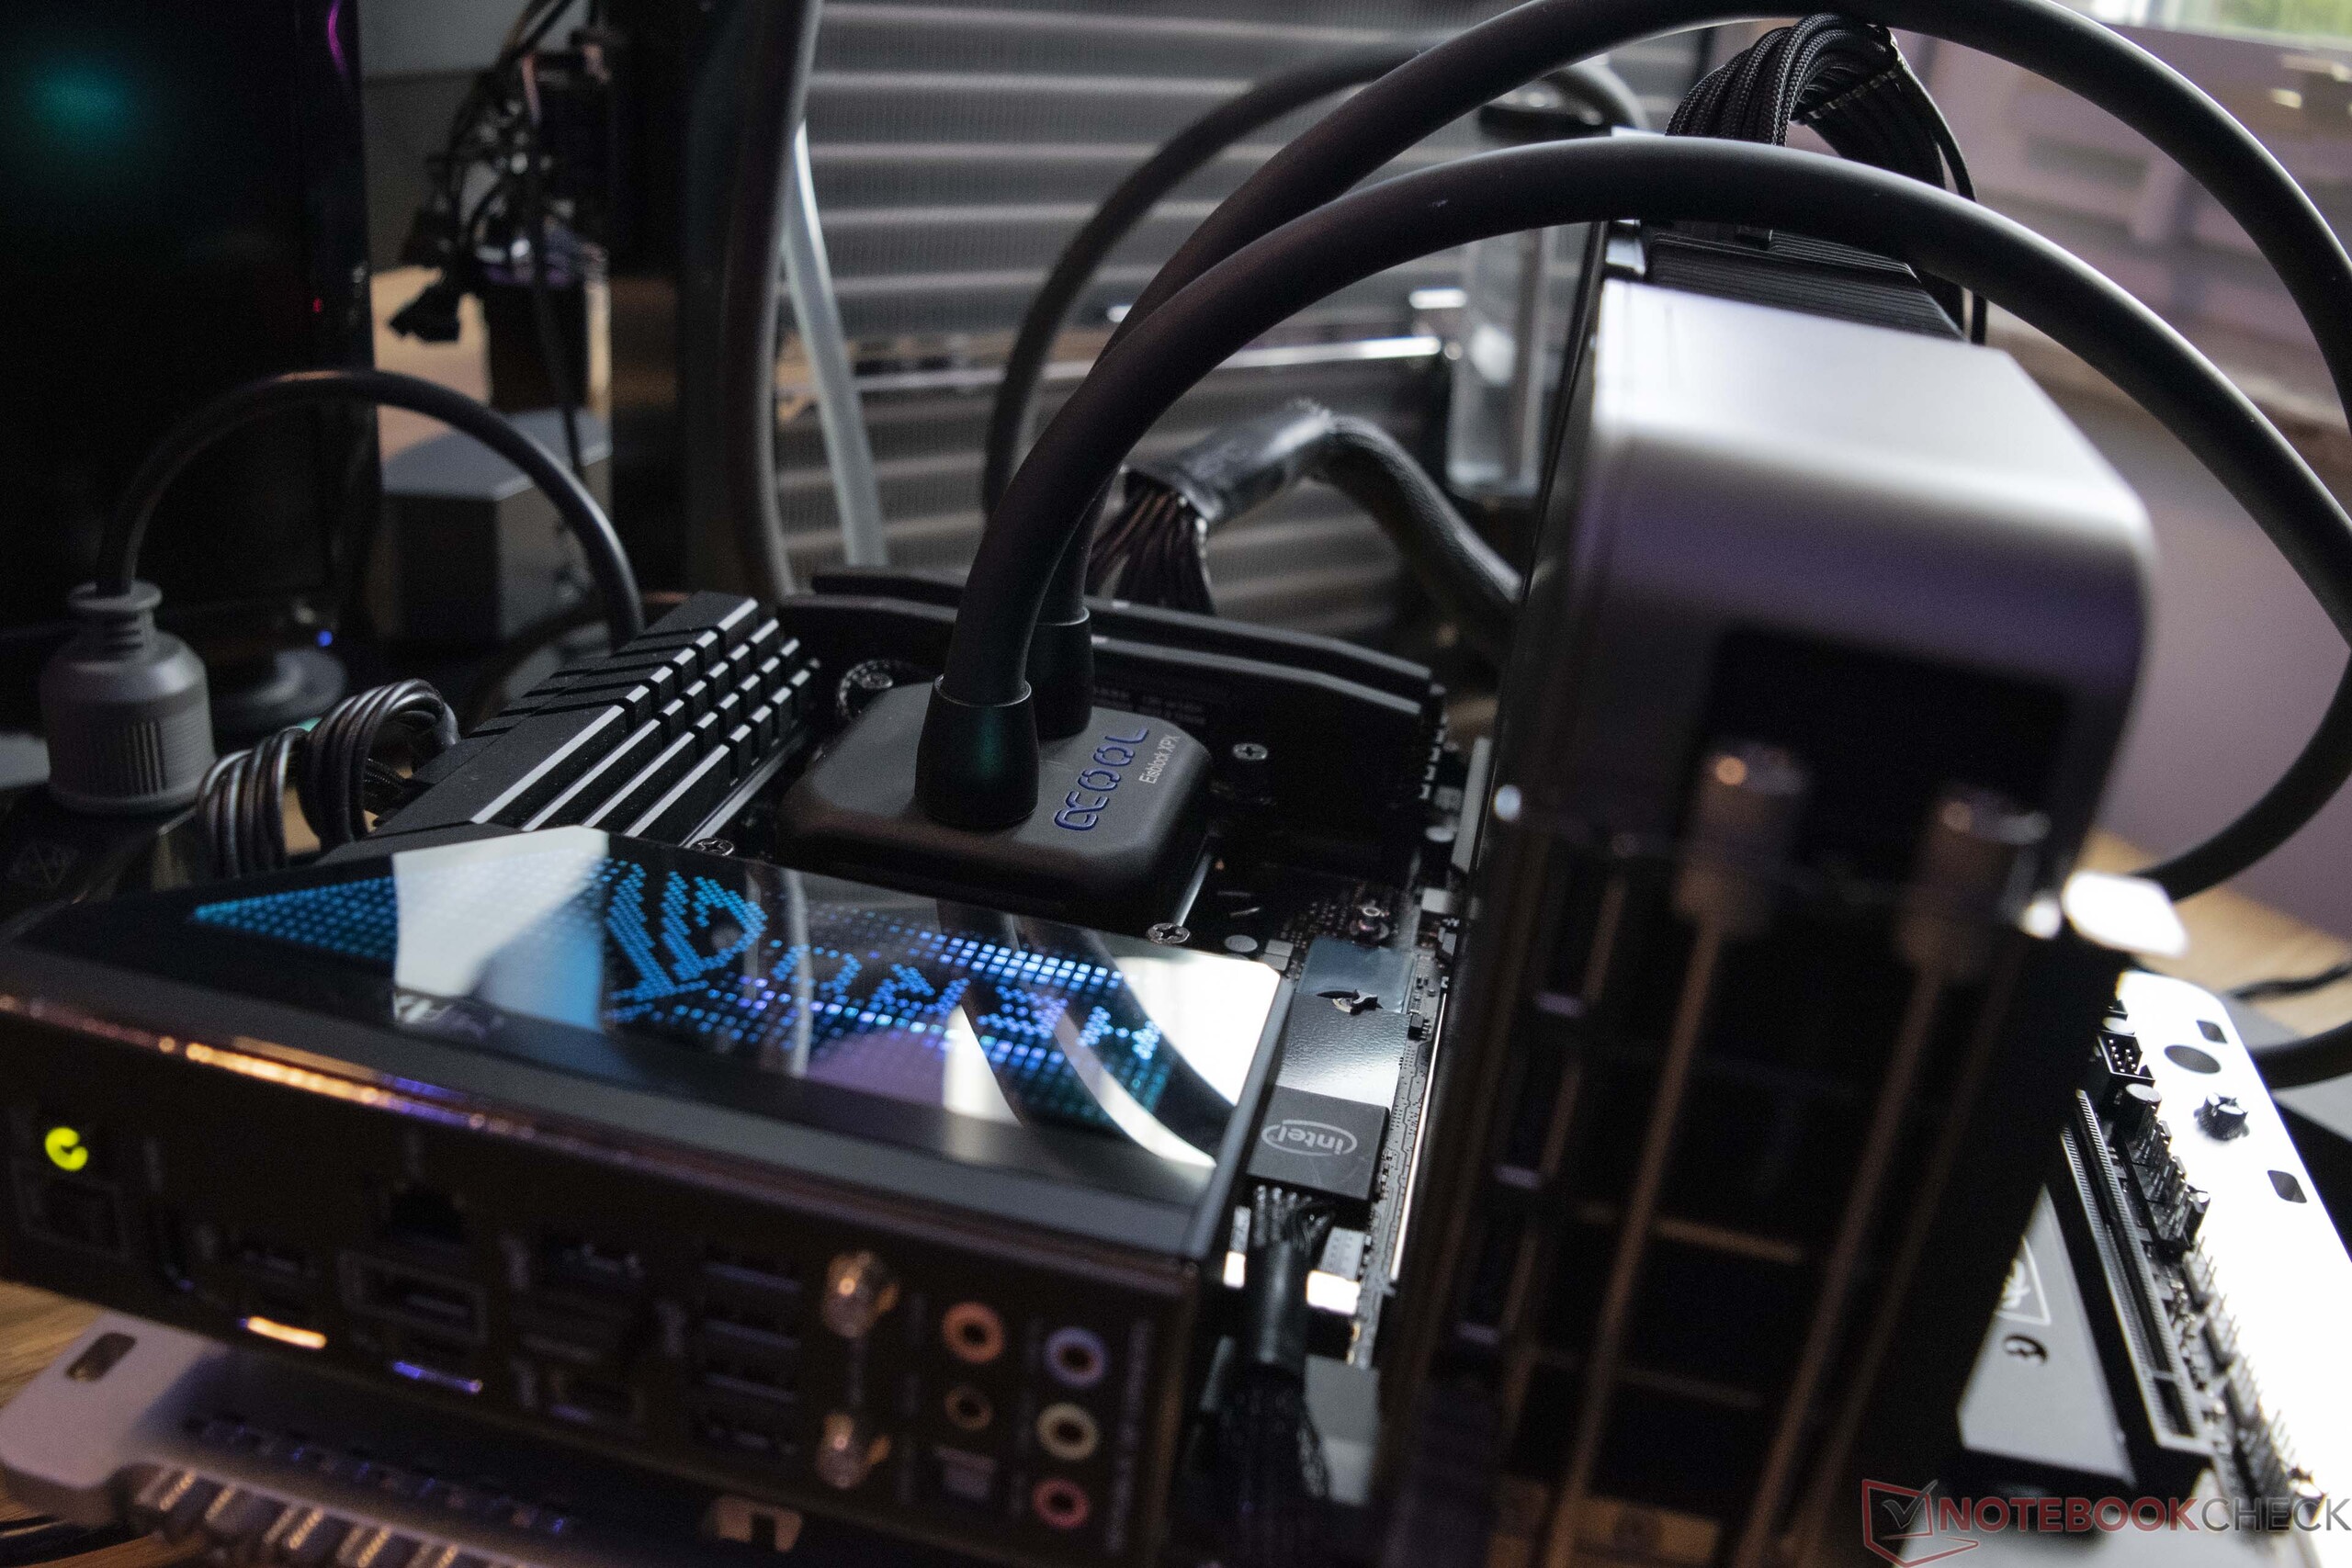
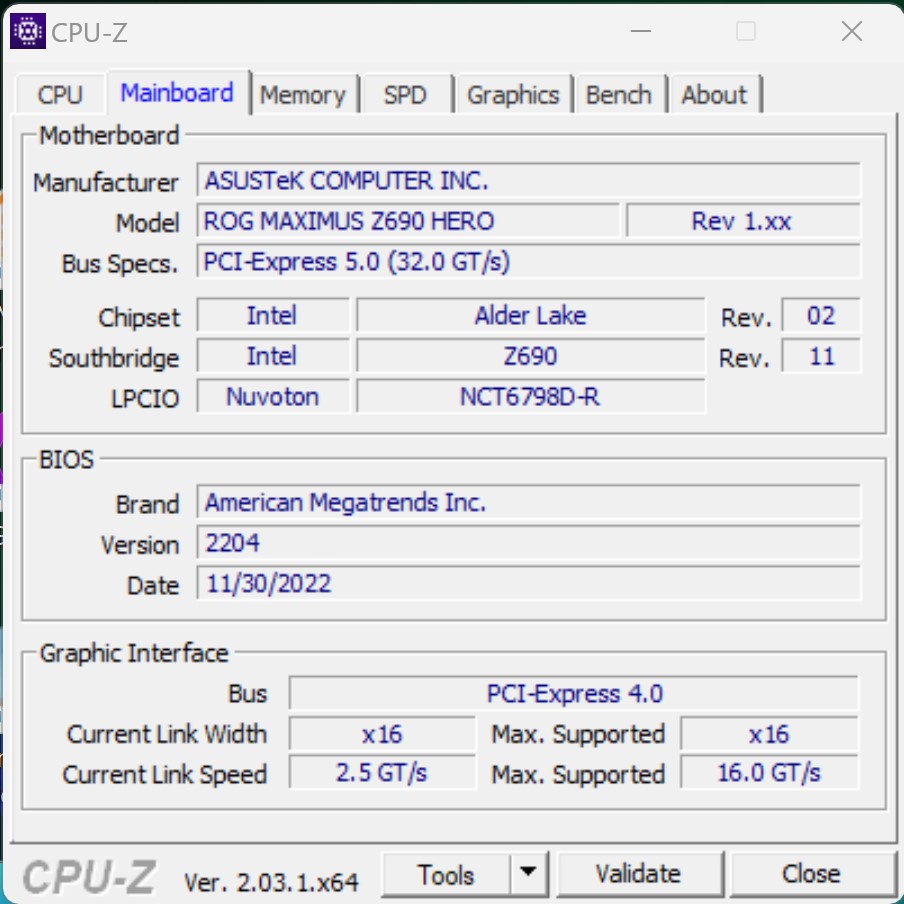
- Asus ROG Maximus Z690 Hero (BIOS v2204)
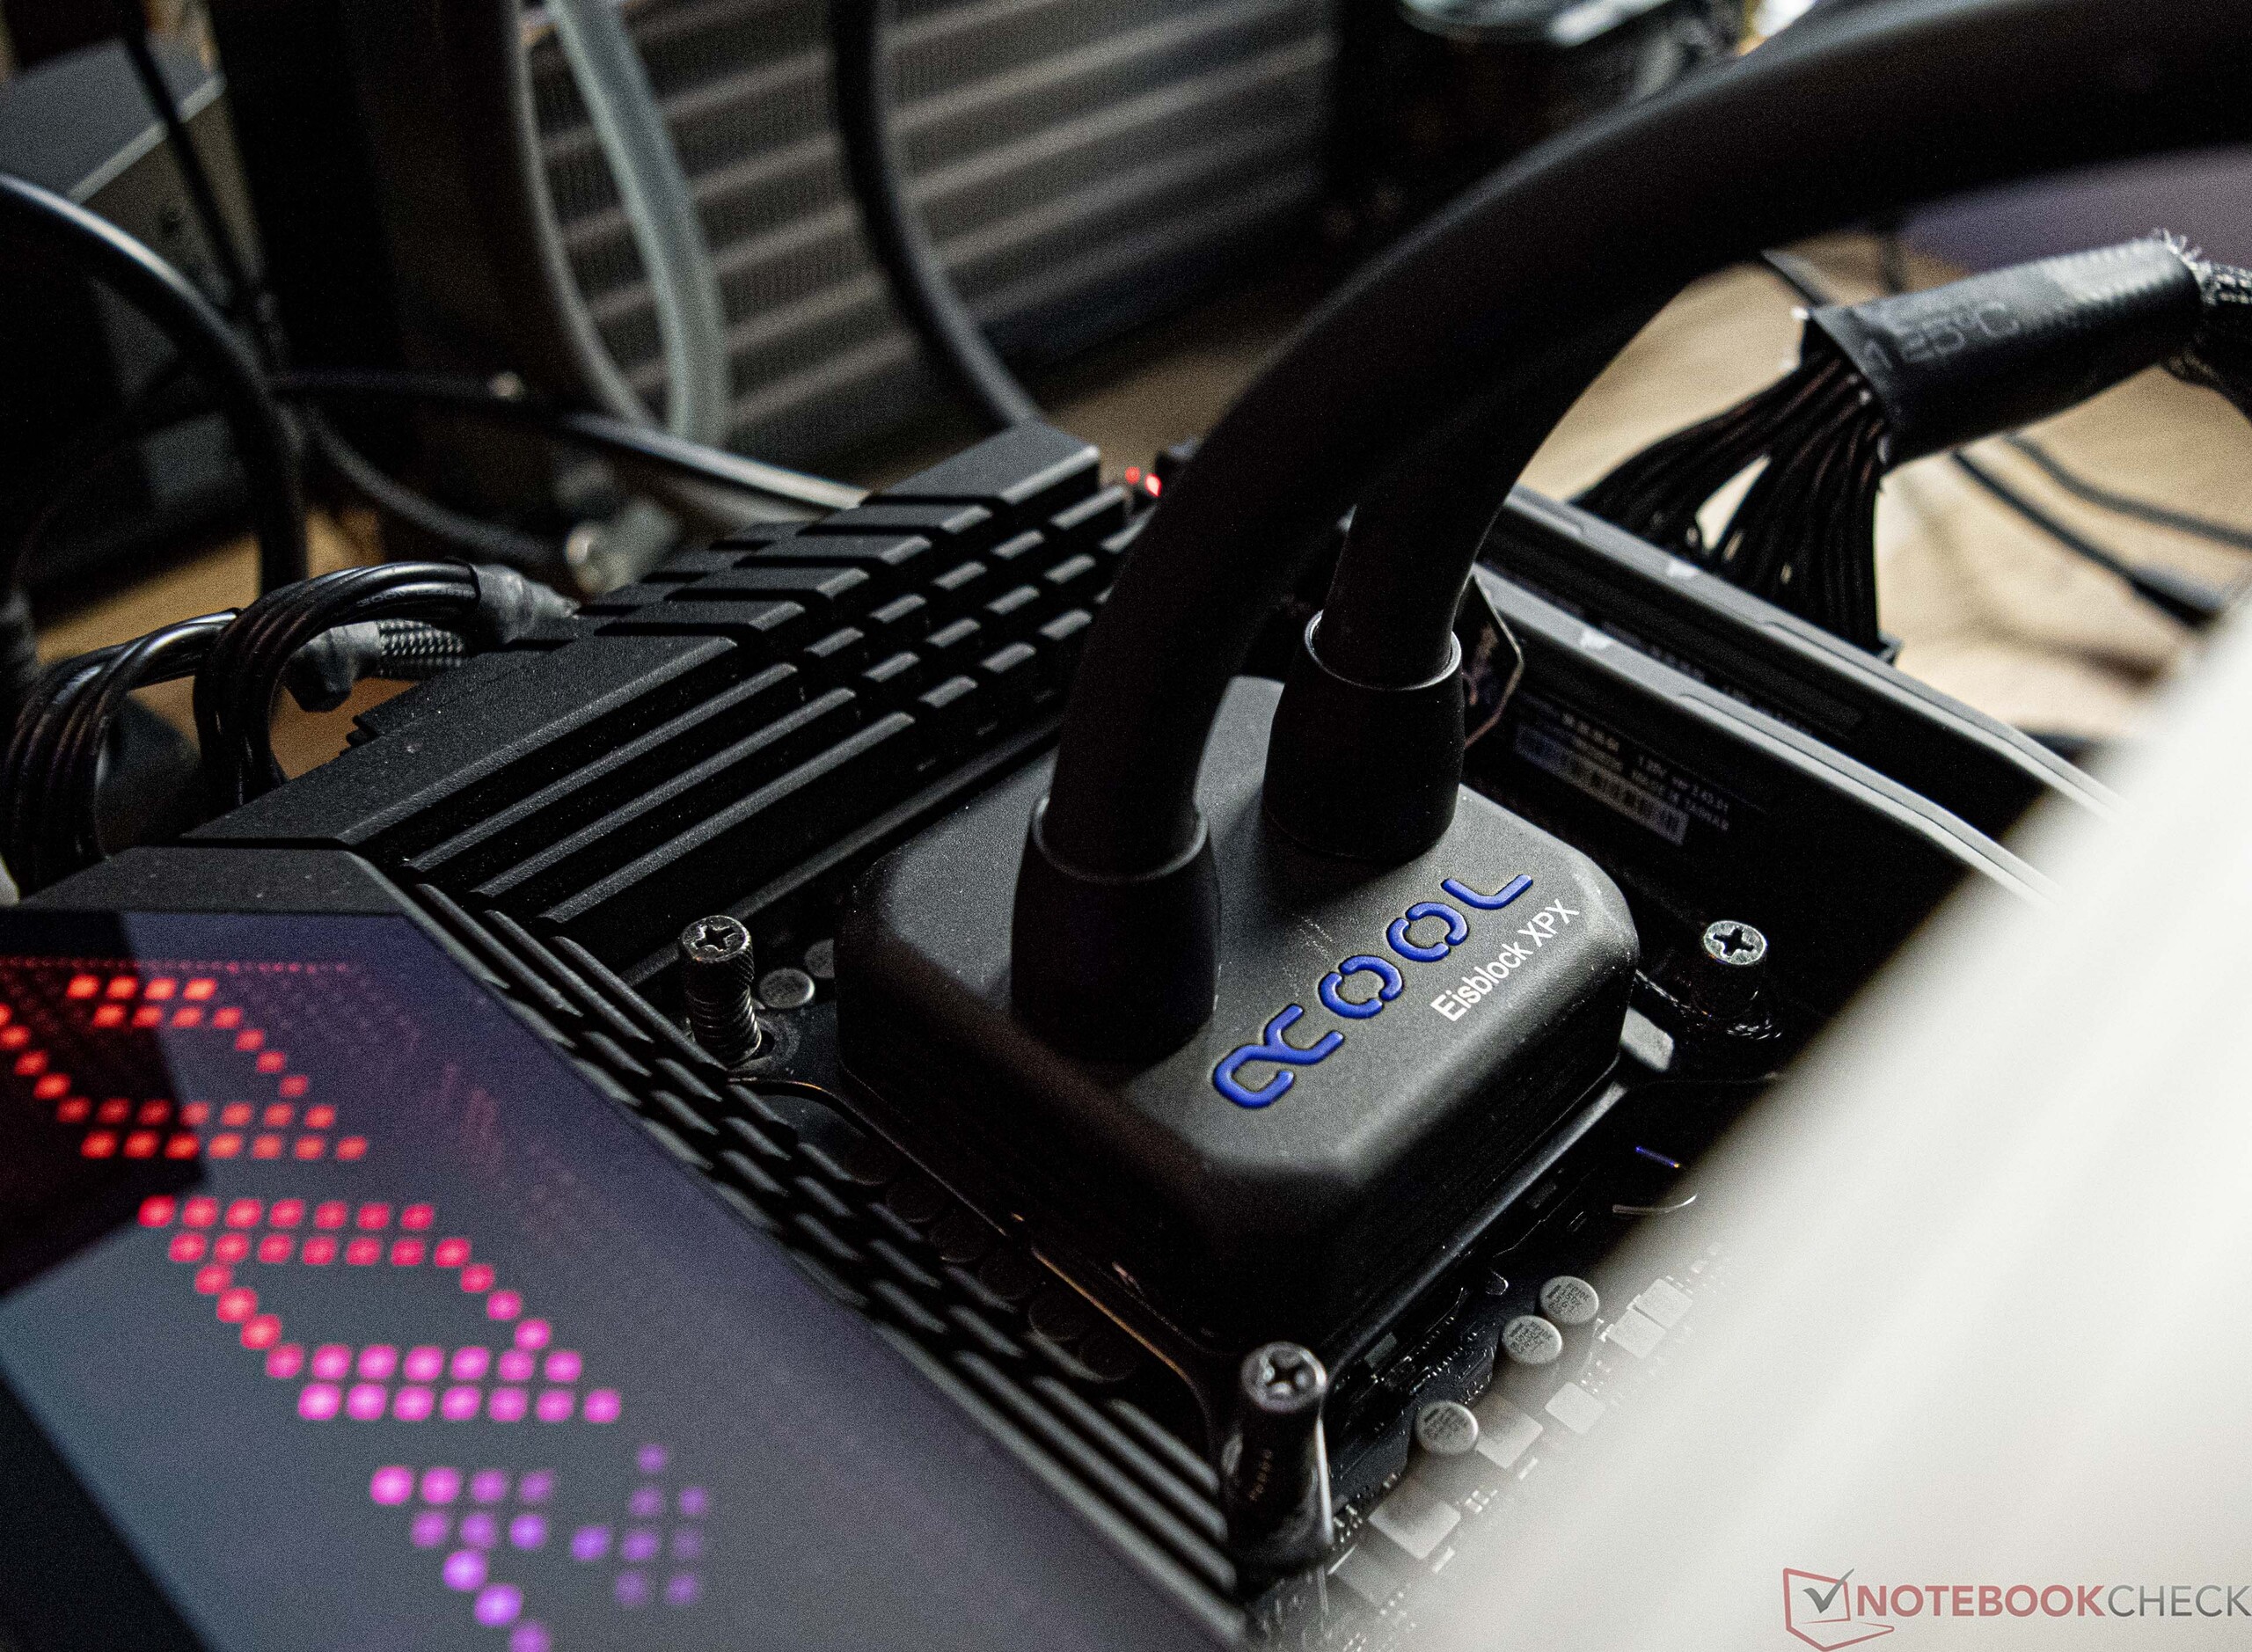
- Vattenkylning med anpassad slinga (pump: Alphacool Aquastream XT Ultra, kylare: EK MO-RA3 420 LT BLACK)
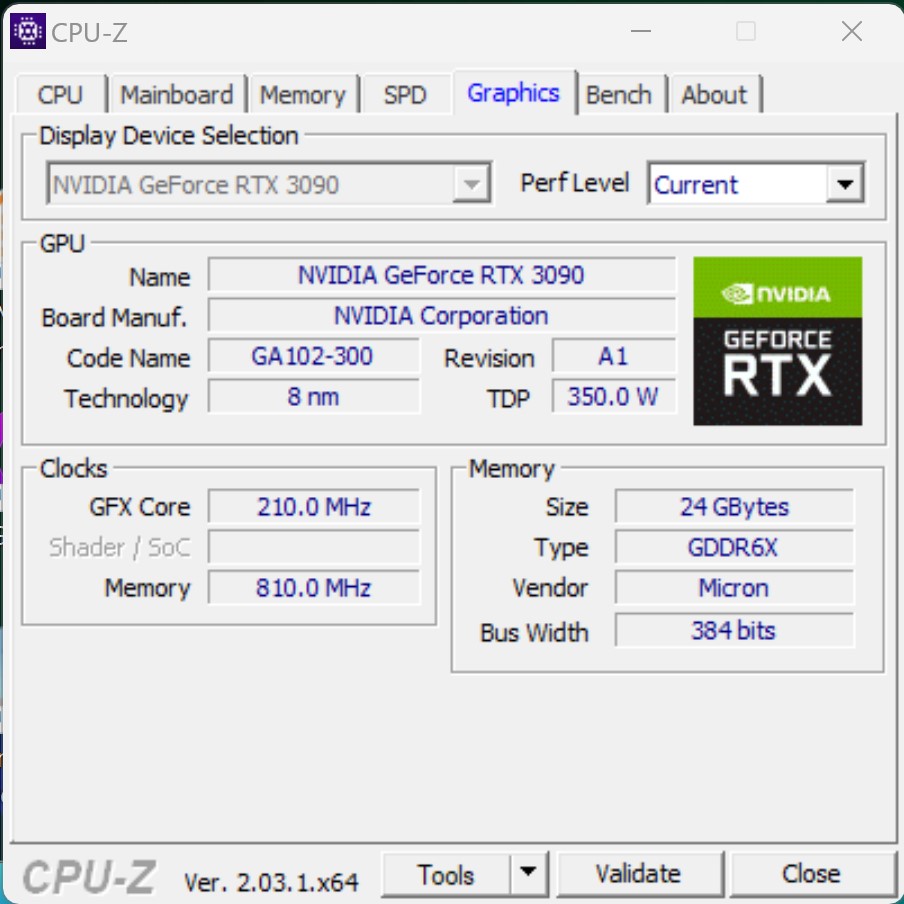
- Nvidia GeForce RTX 3090 Founders Edition (drivrutin: 528.02)
- EVGA SuperNOVA P+ 1600W
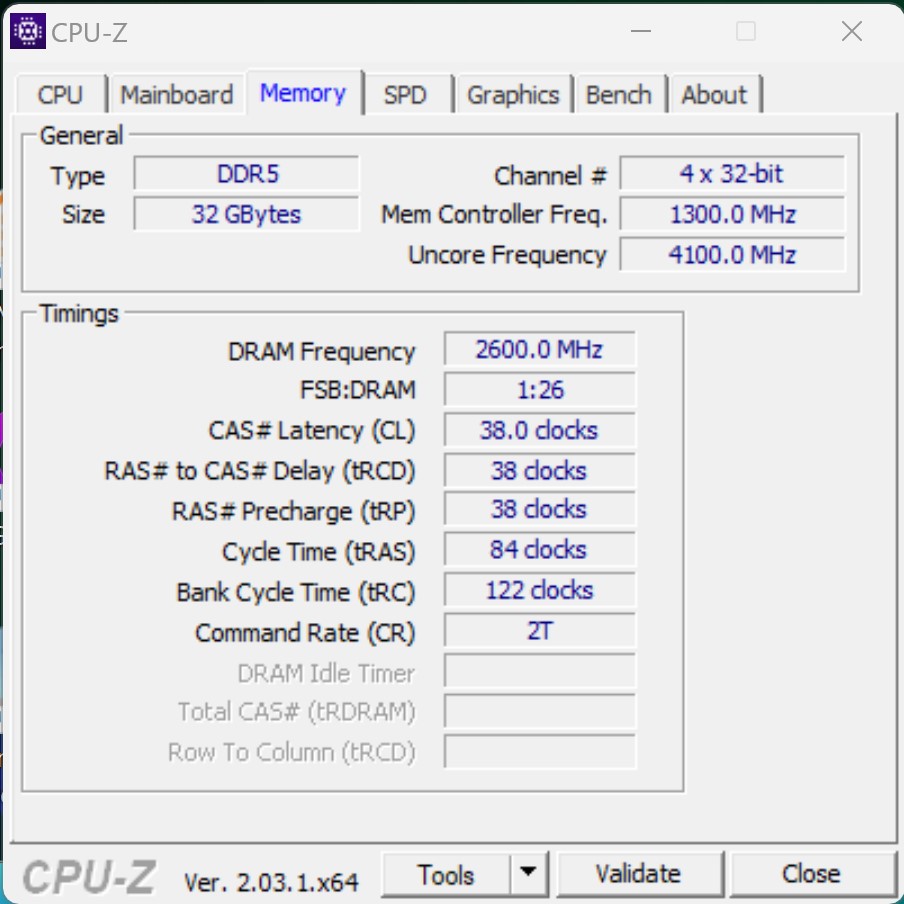
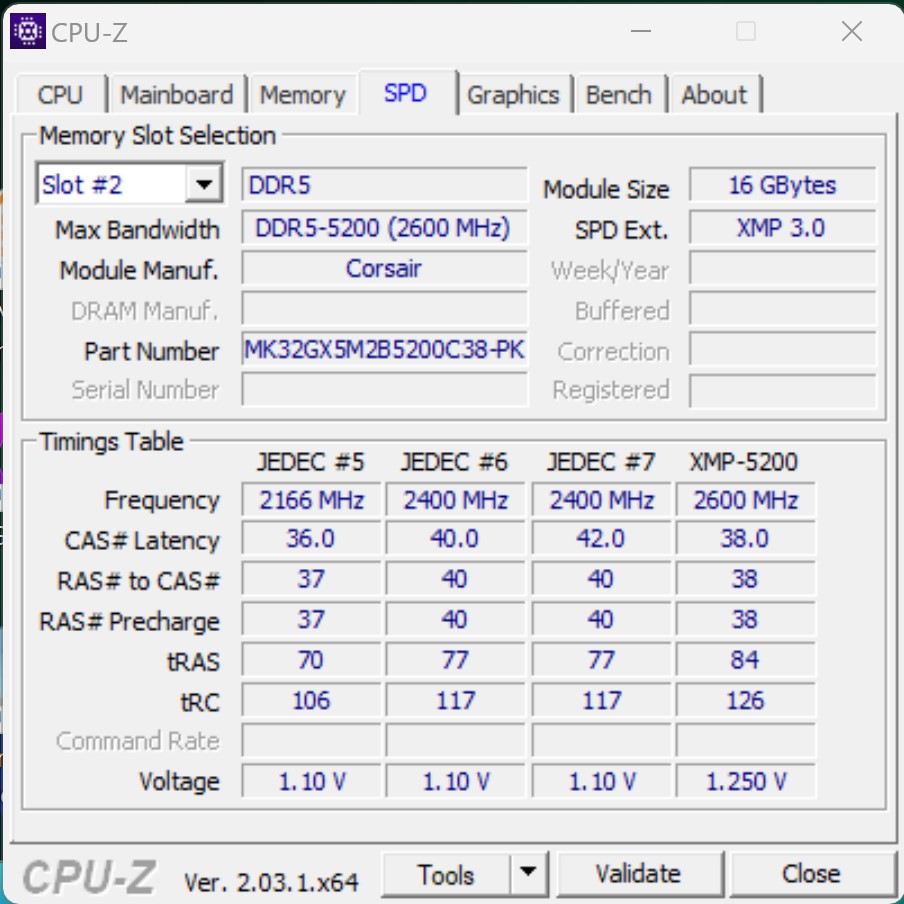
- G.Skill Ripjaws S5 (2x 16 GB - DDR5-5200 MT/s)
- Intel Optane 905p (480 GB system + riktmärken)
- Western Digital SN720 (spel)
- Microsoft Windows 11 Professional 64-bitars (version 22H2)

Testförhållanden - Z690 fortfarande användbar efter BIOS-uppdatering
Vi fortsätter att använda Asus ROG Maximus Z690 Hero som bas för det här testet, vilket redan har varit vårt val sedan lanseringen av Alder-Lake-processorer. Efter vissa problem, som vi upplevde under vårt test med den Intel Core i9-13900Kfanns det inga komplikationer medIntel Core i5-13400F. Den senaste BIOS v2204 installerades för att starta upp Intel Core i5-13400F. Lyckligtvis erbjuder Asus ROG Maximus Z690 Hero möjligheten att uppdatera BIOS utan CPU och RAM.
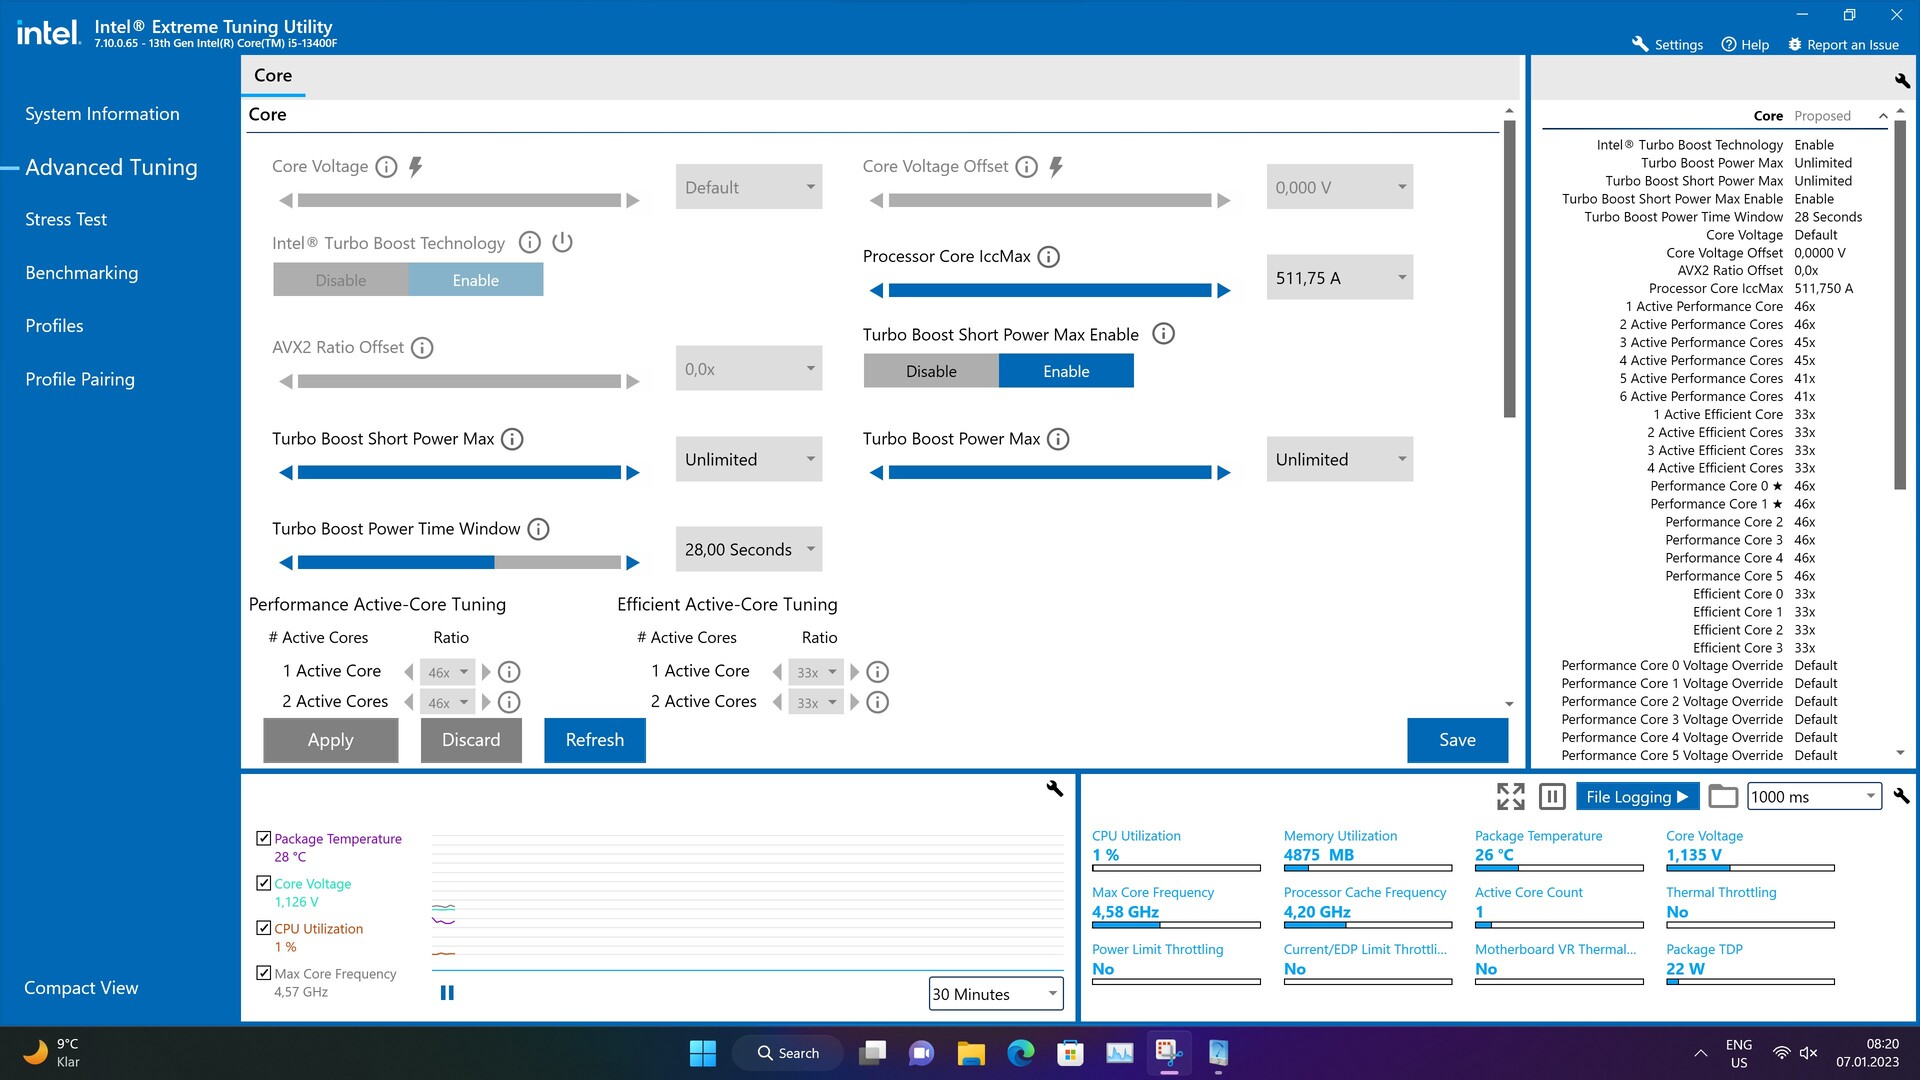
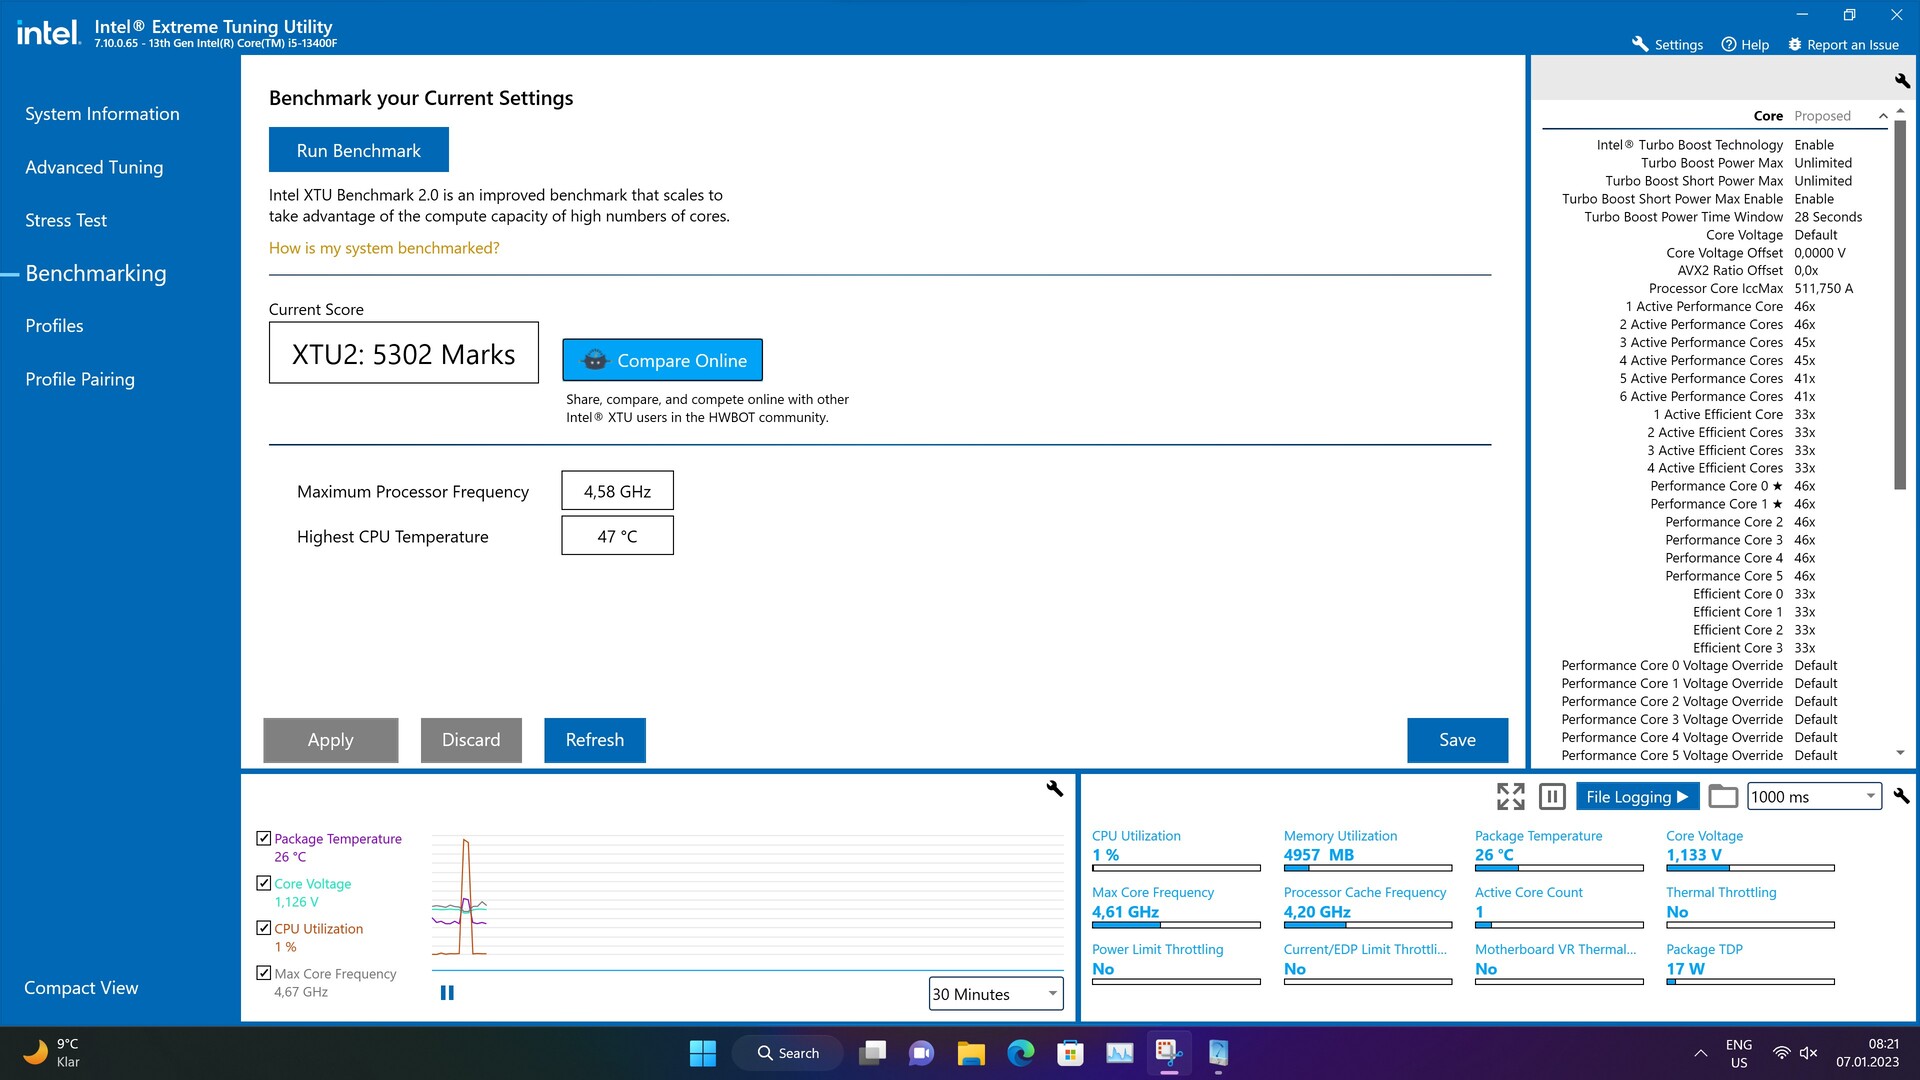
Alla tester utfördes med det senaste BIOSet och aktiverad XMP1-profil. Dessutom inaktiverades alla begränsningar av effektbegränsningar för att få tillgång till processorns fulla prestanda.
Benchmarks för processorer
Tyvärr kan vi inte göra en direkt jämförelse med Intel Core i5-12400F i det här läget. Vi har dock många andra processorer i vår databas som kan användas som referens. Vi ser alltså en minimal fördel för Intel Core i5-13400F jämfört med en Intel Core i7-12700F. I genomsnitt kan Intel Core i5-13400F uppnå ett bättre resultat, även om de saknade trådarna definitivt leder till ett sämre resultat i enskilda tester. Vi ser en nästan identisk bild i den direkta jämförelsen med AMD Ryzen 7 5800X. Precis som Intel Core i5-13400F erbjuder den senare 16 trådar, men kan få bättre resultat i de rena multitrådsbenchmarks.
Om du behöver mer prestanda kan du välja en Intel Core i5-13600K. Här finns det cirka 20 procent mer prestanda. Samma prestandaökning kan också uppnås med en AMD Ryzen 7 7700X.
Fler benchmarks om processorerna finns på följande sidorhär.
| Performance rating - Percent | |
| Intel Core i9-13900K | |
| Intel Core i5-13600K | |
| AMD Ryzen 7 7700X | |
| Intel Core i5-12600K | |
| AMD Ryzen 7 5800X | |
| Intel Core i7-12700F | |
| Intel Core i5-13400F | |
| AMD Ryzen 5 5600X | |
| Intel Core i5-11400F | |
| Cinebench R15 | |
| CPU Single 64Bit | |
| Intel Core i9-13900K | |
| AMD Ryzen 7 7700X | |
| Intel Core i5-13600K | |
| Intel Core i5-12600K | |
| Intel Core i7-12700F | |
| AMD Ryzen 7 5800X | |
| AMD Ryzen 5 5600X | |
| Intel Core i5-13400F | |
| Intel Core i5-11400F | |
| CPU Multi 64Bit | |
| Intel Core i9-13900K | |
| Intel Core i5-13600K | |
| AMD Ryzen 7 7700X | |
| AMD Ryzen 7 5800X | |
| Intel Core i7-12700F | |
| Intel Core i5-12600K | |
| Intel Core i5-13400F | |
| AMD Ryzen 5 5600X | |
| Intel Core i5-11400F | |
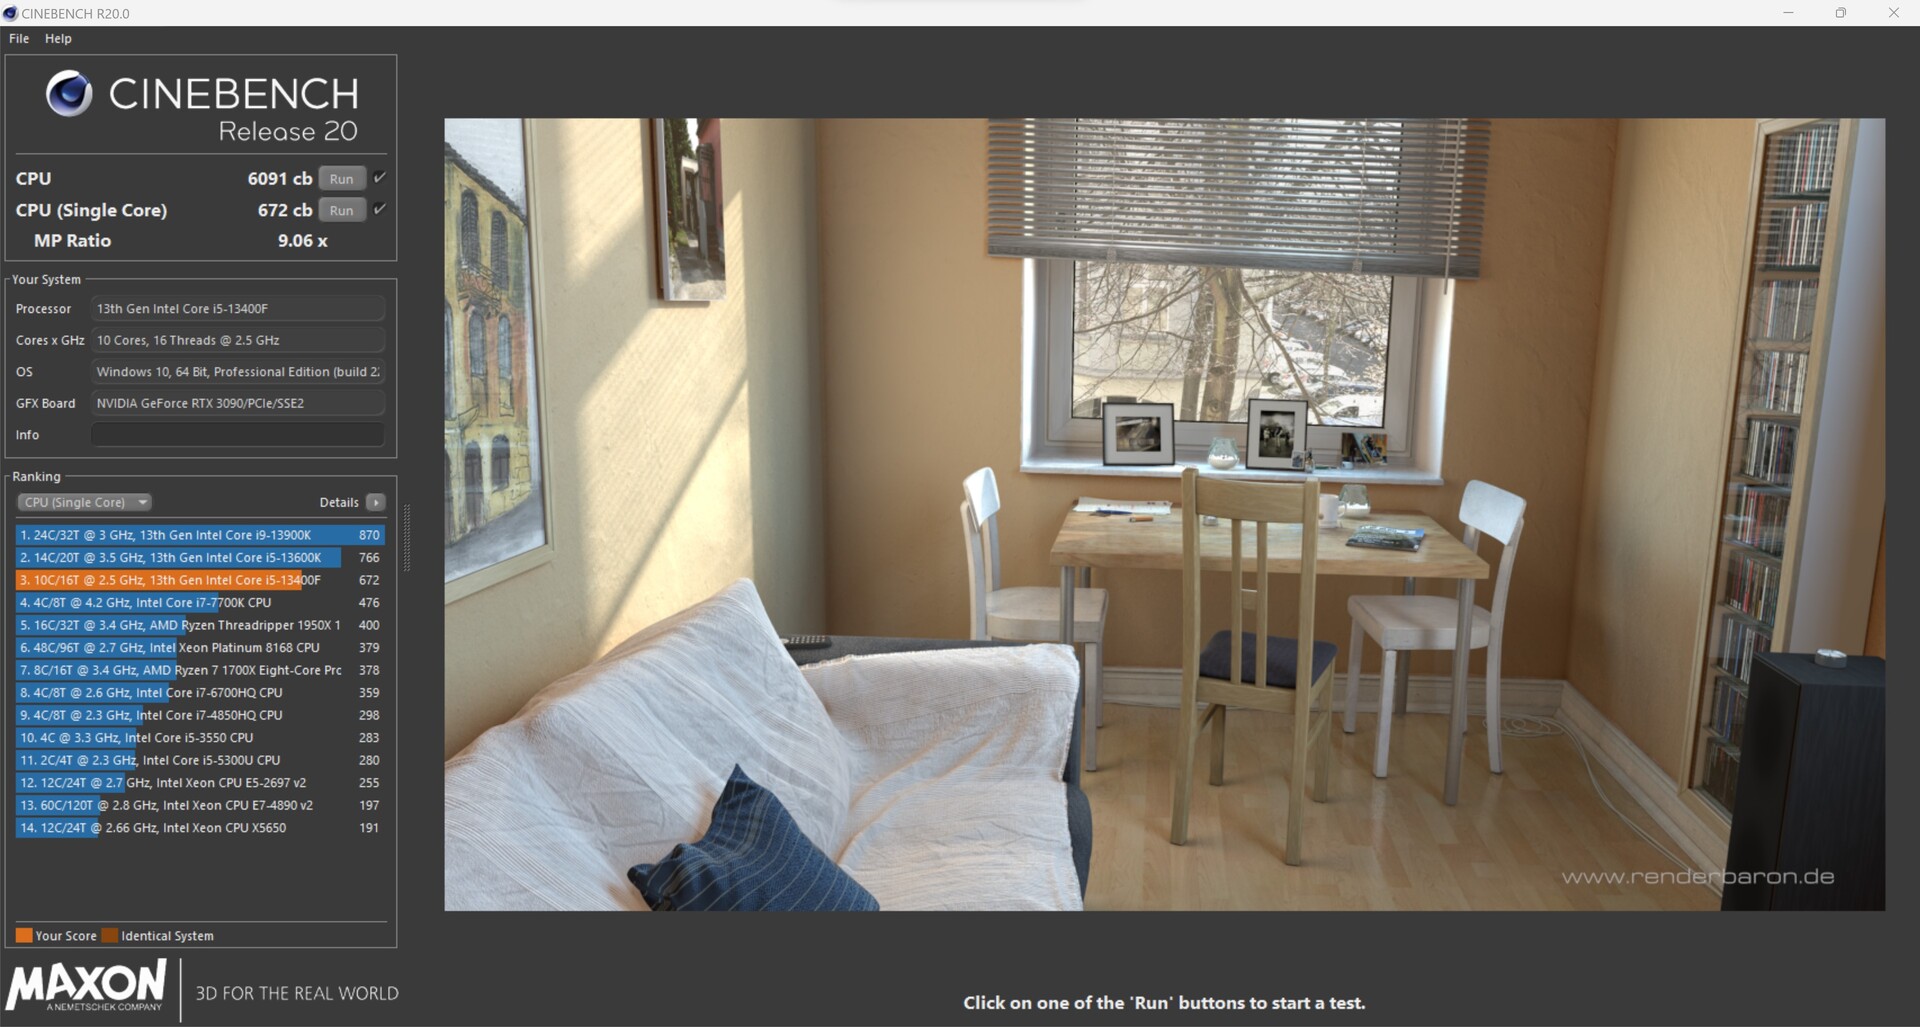
| Cinebench R20 | |
| CPU (Single Core) | |
| Intel Core i9-13900K | |
| Intel Core i5-13600K | |
| AMD Ryzen 7 7700X | |
| Intel Core i5-12600K | |
| Intel Core i7-12700F | |
| Intel Core i5-13400F | |
| AMD Ryzen 7 5800X | |
| AMD Ryzen 5 5600X | |
| Intel Core i5-11400F | |
| CPU (Multi Core) | |
| Intel Core i9-13900K | |
| Intel Core i5-13600K | |
| AMD Ryzen 7 7700X | |
| Intel Core i5-12600K | |
| Intel Core i5-13400F | |
| AMD Ryzen 7 5800X | |
| Intel Core i7-12700F | |
| AMD Ryzen 5 5600X | |
| Intel Core i5-11400F | |
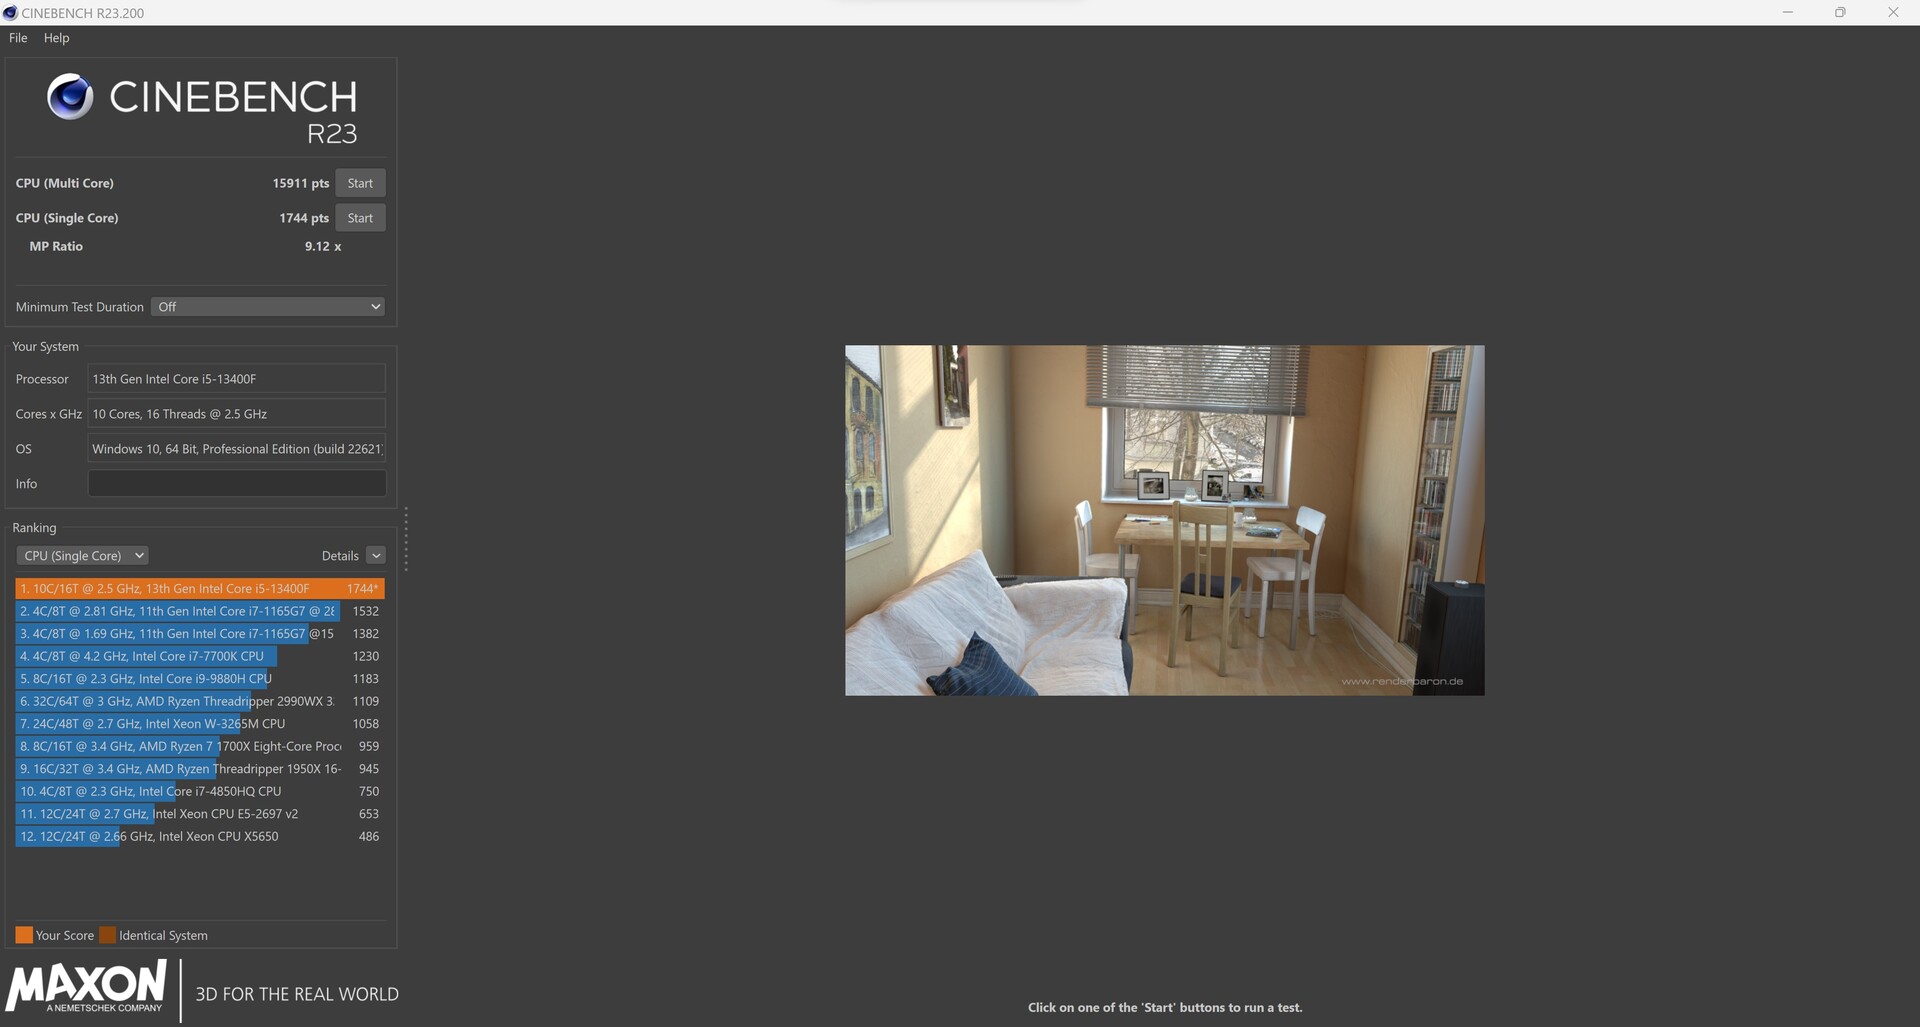
| Cinebench R23 | |
| Single Core | |
| Intel Core i9-13900K | |
| Intel Core i5-13600K | |
| AMD Ryzen 7 7700X | |
| Intel Core i5-12600K | |
| Intel Core i7-12700F | |
| Intel Core i5-13400F | |
| AMD Ryzen 7 5800X | |
| AMD Ryzen 5 5600X | |
| Intel Core i5-11400F | |
| Multi Core | |
| Intel Core i9-13900K | |
| Intel Core i5-13600K | |
| AMD Ryzen 7 7700X | |
| Intel Core i5-12600K | |
| Intel Core i5-13400F | |
| Intel Core i7-12700F | |
| AMD Ryzen 7 5800X | |
| AMD Ryzen 5 5600X | |
| Intel Core i5-11400F | |
| Cinebench R11.5 | |
| CPU Single 64Bit | |
| Intel Core i9-13900K | |
| AMD Ryzen 7 7700X | |
| Intel Core i5-13600K | |
| Intel Core i5-12600K | |
| Intel Core i7-12700F | |
| AMD Ryzen 7 5800X | |
| Intel Core i5-13400F | |
| AMD Ryzen 5 5600X | |
| Intel Core i5-11400F | |
| CPU Multi 64Bit | |
| Intel Core i9-13900K | |
| Intel Core i5-13600K | |
| AMD Ryzen 7 7700X | |
| Intel Core i7-12700F | |
| Intel Core i5-12600K | |
| AMD Ryzen 7 5800X | |
| Intel Core i5-13400F | |
| AMD Ryzen 5 5600X | |
| Intel Core i5-11400F | |
| Blender - v2.79 BMW27 CPU | |
| Intel Core i5-11400F | |
| AMD Ryzen 5 5600X | |
| Intel Core i7-12700F | |
| Intel Core i5-13400F | |
| AMD Ryzen 7 5800X | |
| Intel Core i5-12600K | |
| AMD Ryzen 7 7700X | |
| Intel Core i5-13600K | |
| Intel Core i9-13900K | |
| wPrime 2.10 | |
| 32m | |
| Intel Core i5-12600K | |
| Intel Core i5-11400F | |
| AMD Ryzen 5 5600X | |
| Intel Core i5-13400F | |
| AMD Ryzen 7 5800X | |
| Intel Core i7-12700F | |
| Intel Core i5-13600K | |
| AMD Ryzen 7 7700X | |
| Intel Core i9-13900K | |
| 1024m | |
| Intel Core i5-13400F | |
| Intel Core i5-12600K | |
| Intel Core i5-13600K | |
| Intel Core i7-12700F | |
| Intel Core i5-11400F | |
| AMD Ryzen 5 5600X | |
| AMD Ryzen 7 5800X | |
| Intel Core i9-13900K | |
| AMD Ryzen 7 7700X | |
| X264 HD Benchmark 4.0 | |
| Pass 1 | |
| Intel Core i9-13900K | |
| Intel Core i5-13600K | |
| AMD Ryzen 7 7700X | |
| AMD Ryzen 7 5800X | |
| Intel Core i5-12600K | |
| AMD Ryzen 5 5600X | |
| Intel Core i5-13400F | |
| Intel Core i7-12700F | |
| Intel Core i5-11400F | |
| Pass 2 | |
| Intel Core i9-13900K | |
| Intel Core i5-13600K | |
| AMD Ryzen 7 7700X | |
| AMD Ryzen 7 5800X | |
| Intel Core i5-12600K | |
| Intel Core i5-13400F | |
| Intel Core i7-12700F | |
| AMD Ryzen 5 5600X | |
| Intel Core i5-11400F | |
| WinRAR - Result | |
| AMD Ryzen 7 5800X | |
| AMD Ryzen 7 7700X | |
| Intel Core i9-13900K | |
| AMD Ryzen 5 5600X | |
| Intel Core i5-13600K | |
| Intel Core i7-12700F | |
| Intel Core i5-13400F | |
| Intel Core i5-11400F | |
| Intel Core i5-12600K | |
| TrueCrypt | |
| AES Mean 100MB | |
| Intel Core i9-13900K | |
| Intel Core i5-13600K | |
| AMD Ryzen 7 7700X | |
| AMD Ryzen 7 5800X | |
| Intel Core i5-12600K | |
| Intel Core i5-13400F | |
| AMD Ryzen 5 5600X | |
| Intel Core i5-11400F | |
| Intel Core i7-12700F | |
| Twofish Mean 100MB | |
| Intel Core i9-13900K | |
| Intel Core i5-13600K | |
| Intel Core i7-12700F | |
| AMD Ryzen 7 7700X | |
| Intel Core i5-12600K | |
| AMD Ryzen 7 5800X | |
| Intel Core i5-13400F | |
| AMD Ryzen 5 5600X | |
| Intel Core i5-11400F | |
| Serpent Mean 100MB | |
| Intel Core i9-13900K | |
| Intel Core i5-13600K | |
| Intel Core i7-12700F | |
| AMD Ryzen 7 7700X | |
| AMD Ryzen 7 5800X | |
| Intel Core i5-12600K | |
| Intel Core i5-13400F | |
| AMD Ryzen 5 5600X | |
| Intel Core i5-11400F | |
| Geekbench 5.5 | |
| Multi-Core | |
| Intel Core i9-13900K | |
| Intel Core i5-13600K | |
| AMD Ryzen 7 7700X | |
| Intel Core i5-12600K | |
| Intel Core i5-13400F | |
| AMD Ryzen 7 5800X | |
| Intel Core i7-12700F | |
| AMD Ryzen 5 5600X | |
| Intel Core i5-11400F | |
| Single-Core | |
| Intel Core i9-13900K | |
| AMD Ryzen 7 7700X | |
| Intel Core i5-13600K | |
| Intel Core i5-12600K | |
| Intel Core i5-13400F | |
| AMD Ryzen 7 5800X | |
| AMD Ryzen 5 5600X | |
| Intel Core i7-12700F | |
| Intel Core i5-11400F | |
| Geekbench 5.0 | |
| 5.0 Multi-Core | |
| Intel Core i9-13900K | |
| Intel Core i5-13600K | |
| AMD Ryzen 7 7700X | |
| Intel Core i5-12600K | |
| Intel Core i5-13400F | |
| AMD Ryzen 7 5800X | |
| Intel Core i7-12700F | |
| AMD Ryzen 5 5600X | |
| Intel Core i5-11400F | |
| 5.0 Single-Core | |
| Intel Core i9-13900K | |
| AMD Ryzen 7 7700X | |
| Intel Core i5-13600K | |
| Intel Core i5-12600K | |
| Intel Core i5-13400F | |
| AMD Ryzen 7 5800X | |
| AMD Ryzen 5 5600X | |
| Intel Core i7-12700F | |
| Intel Core i5-11400F | |
| Geekbench 4.4 | |
| 64 Bit Single-Core Score | |
| Intel Core i9-13900K | |
| AMD Ryzen 7 7700X | |
| Intel Core i5-13600K | |
| Intel Core i5-12600K | |
| Intel Core i5-13400F | |
| AMD Ryzen 7 5800X | |
| AMD Ryzen 5 5600X | |
| Intel Core i5-11400F | |
| Intel Core i7-12700F | |
| 64 Bit Multi-Core Score | |
| Intel Core i9-13900K | |
| Intel Core i5-13600K | |
| AMD Ryzen 7 7700X | |
| Intel Core i5-12600K | |
| AMD Ryzen 7 5800X | |
| Intel Core i5-13400F | |
| Intel Core i7-12700F | |
| AMD Ryzen 5 5600X | |
| Intel Core i5-11400F | |
| 3DMark 11 - 1280x720 Performance Physics | |
| Intel Core i9-13900K | |
| AMD Ryzen 7 7700X | |
| Intel Core i5-13600K | |
| Intel Core i5-12600K | |
| Intel Core i5-13400F | |
| Intel Core i7-12700F | |
| AMD Ryzen 7 5800X | |
| AMD Ryzen 5 5600X | |
| Intel Core i5-11400F | |
| 7-Zip 18.03 | |
| 7z b 4 | |
| Intel Core i9-13900K | |
| Intel Core i5-13600K | |
| AMD Ryzen 7 7700X | |
| AMD Ryzen 7 5800X | |
| Intel Core i5-12600K | |
| Intel Core i7-12700F | |
| Intel Core i5-13400F | |
| AMD Ryzen 5 5600X | |
| Intel Core i5-11400F | |
| 7z b 4 -mmt1 | |
| AMD Ryzen 7 7700X | |
| Intel Core i9-13900K | |
| AMD Ryzen 7 5800X | |
| AMD Ryzen 5 5600X | |
| Intel Core i5-13600K | |
| Intel Core i7-12700F | |
| Intel Core i5-12600K | |
| Intel Core i5-13400F | |
| Intel Core i5-11400F | |
| HWBOT x265 Benchmark v2.2 - 4k Preset | |
| Intel Core i9-13900K | |
| Intel Core i5-12600K | |
| Intel Core i5-13600K | |
| AMD Ryzen 7 7700X | |
| AMD Ryzen 7 5800X | |
| Intel Core i5-13400F | |
| Intel Core i7-12700F | |
| AMD Ryzen 5 5600X | |
| Intel Core i5-11400F | |
| R Benchmark 2.5 - Overall mean | |
| Intel Core i5-11400F | |
| AMD Ryzen 5 5600X | |
| Intel Core i5-13400F | |
| AMD Ryzen 7 5800X | |
| Intel Core i5-12600K | |
| Intel Core i7-12700F | |
| Intel Core i5-13600K | |
| AMD Ryzen 7 7700X | |
| Intel Core i9-13900K | |
| LibreOffice - 20 Documents To PDF | |
| Intel Core i5-12600K | |
| Intel Core i7-12700F | |
| Intel Core i5-11400F | |
| AMD Ryzen 5 5600X | |
| AMD Ryzen 7 5800X | |
| Intel Core i5-13400F | |
| Intel Core i9-13900K | |
| Intel Core i5-13600K | |
| AMD Ryzen 7 7700X | |
| WebXPRT 3 - Overall | |
| Intel Core i9-13900K | |
| AMD Ryzen 7 7700X | |
| Intel Core i5-13600K | |
| AMD Ryzen 7 5800X | |
| Intel Core i5-13400F | |
| Intel Core i5-12600K | |
| AMD Ryzen 5 5600X | |
| Intel Core i7-12700F | |
| Intel Core i5-11400F | |
| Mozilla Kraken 1.1 - Total | |
| Intel Core i5-11400F | |
| AMD Ryzen 5 5600X | |
| AMD Ryzen 7 5800X | |
| Intel Core i5-13400F | |
| Intel Core i7-12700F | |
| Intel Core i5-12600K | |
| Intel Core i5-13600K | |
| AMD Ryzen 7 7700X | |
| Intel Core i9-13900K | |
| 3DMark | |
| 1920x1080 Fire Strike Physics | |
| Intel Core i9-13900K | |
| Intel Core i5-13600K | |
| AMD Ryzen 7 7700X | |
| Intel Core i7-12700F | |
| AMD Ryzen 7 5800X | |
| Intel Core i5-12600K | |
| Intel Core i5-13400F | |
| AMD Ryzen 5 5600X | |
| Intel Core i5-11400F | |
| 2560x1440 Time Spy CPU | |
| Intel Core i9-13900K | |
| Intel Core i5-13600K | |
| AMD Ryzen 7 7700X | |
| Intel Core i5-12600K | |
| Intel Core i5-13400F | |
| AMD Ryzen 7 5800X | |
| Intel Core i7-12700F | |
| AMD Ryzen 5 5600X | |
| Intel Core i5-11400F | |
* ... mindre är bättre
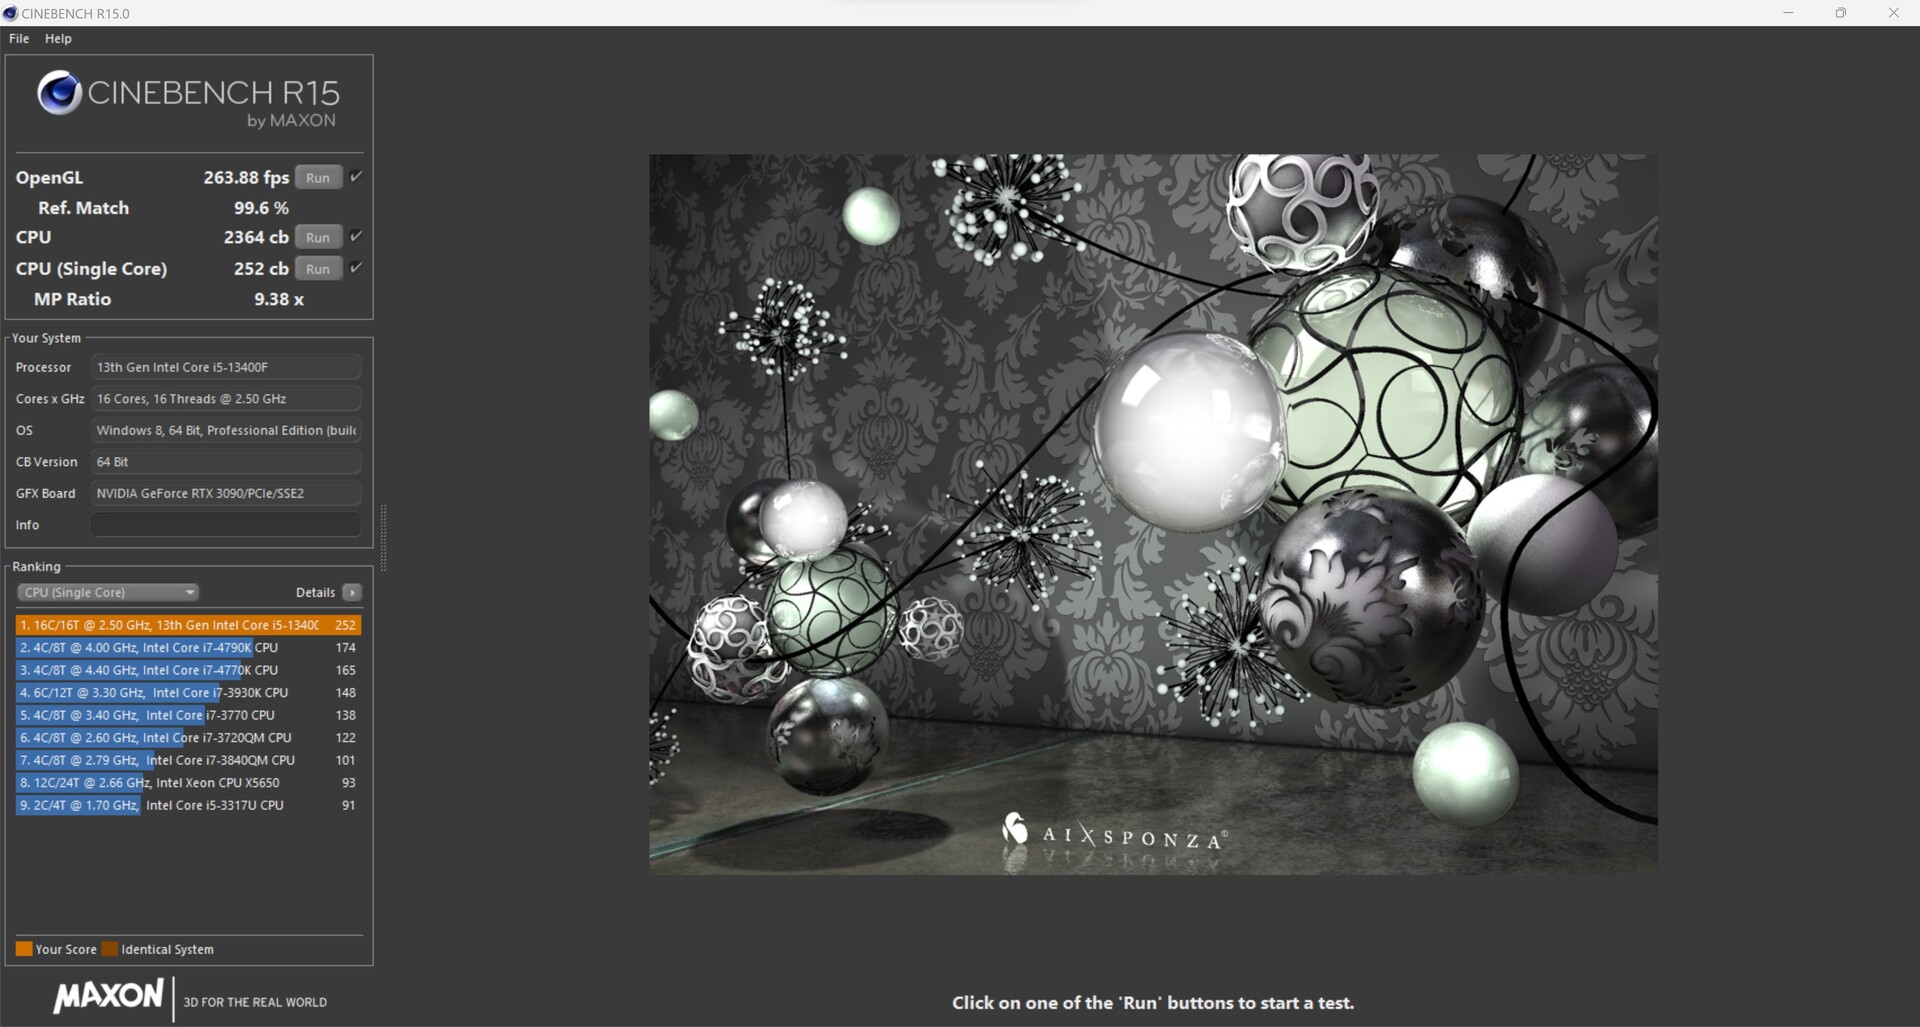
Intel Core i5-13400F mot Cinebench R15 multiloop
Under stresstestet, som vi kör med Cinebench R15 kontinuerlig loop, finns det inga problem när det gäller en stabil strömutveckling. Med maximalt 148 watt, som Intel tillåter Core i5-13400F, är kylsystemet inte särskilt utmanat. Intel Core i5-13400F är endast marginellt långsammare än en Intel Core i5-12600K med ett genomsnitt på 2 338 poäng över alla 50 körningar Intel Core i5-12600K (2 545 poäng).
Syntetiska riktmärken och tillämpningsprestanda
Intel Core i5-13400F kan också göra bra ifrån sig i benchmarks för tillämpningar och är likvärdig med en Intel Core i5-12600K när det gäller prestanda. Jämfört med K-modellerna av Raptor-Lake-processorerna som är listade här måste vårt granskningsexemplar dock acceptera ett klart underskott. Trots detta erbjuder Intel Core i5-13400F en solid prestanda i vardagligt bruk, vilket är helt tillräckligt för de flesta tillämpningar.
| PCMark 10 - Score | |
| Intel Core i9-13900K | |
| AMD Ryzen 5 7600X | |
| Intel Core i5-13600K | |
| AMD Ryzen 9 5950X | |
| Intel Core i9-12900K | |
| Intel Core i5-13400F | |
| AMD Ryzen 5 5600X | |
| Intel Core i5-12600K | |
| Intel Core i7-12700F | |
| Intel Core i5-11400F | |
| AMD Ryzen 9 5900X | |
| 3DMark | |
| 1920x1080 Fire Strike Physics | |
| Intel Core i9-13900K | |
| AMD Ryzen 9 5950X | |
| Intel Core i9-12900K | |
| Intel Core i5-13600K | |
| AMD Ryzen 9 5900X | |
| Intel Core i7-12700F | |
| AMD Ryzen 5 7600X | |
| Intel Core i5-12600K | |
| Intel Core i5-13400F | |
| AMD Ryzen 5 5600X | |
| Intel Core i5-11400F | |
| 2560x1440 Time Spy CPU | |
| Intel Core i9-13900K | |
| Intel Core i9-12900K | |
| Intel Core i5-13600K | |
| Intel Core i5-12600K | |
| AMD Ryzen 9 5950X | |
| Intel Core i5-13400F | |
| AMD Ryzen 9 5900X | |
| Intel Core i7-12700F | |
| AMD Ryzen 5 7600X | |
| AMD Ryzen 5 5600X | |
| Intel Core i5-11400F | |
| 3DMark 11 - 1280x720 Performance Physics | |
| Intel Core i9-13900K | |
| Intel Core i5-13600K | |
| Intel Core i9-12900K | |
| AMD Ryzen 5 7600X | |
| AMD Ryzen 9 5950X | |
| Intel Core i5-12600K | |
| Intel Core i5-13400F | |
| Intel Core i7-12700F | |
| Intel Core i9-12900K | |
| AMD Ryzen 9 5900X | |
| AMD Ryzen 5 5600X | |
| Intel Core i5-11400F | |
| CrossMark - Overall | |
| Intel Core i9-13900K | |
| Intel Core i5-13600K | |
| AMD Ryzen 5 7600X | |
| Intel Core i5-13400F | |
| Intel Core i7-12700F | |
| Intel Core i5-12600K | |
| AMD Ryzen 9 5900X | |
| AMD Ryzen 9 5950X | |
| AMD Ryzen 5 5600X | |
| AIDA64 / Memory Copy | |
| Intel Core i9-13900K | |
| Intel Core i5-13600K | |
| Intel Core i5-13400F | |
| Intel Core i5-12600K | |
| AMD Ryzen 9 5900X | |
| AMD Ryzen 5 7600X | |
| AMD Ryzen 9 5950X | |
| AMD Ryzen 5 5600X | |
| Genomsnitt av klass (4514 - 234662, n=2198) | |
| AIDA64 / Memory Read | |
| Intel Core i9-13900K | |
| Intel Core i5-13400F | |
| Intel Core i5-12600K | |
| Intel Core i5-13600K | |
| AMD Ryzen 9 5900X | |
| AMD Ryzen 9 5950X | |
| AMD Ryzen 5 5600X | |
| AMD Ryzen 5 7600X | |
| Genomsnitt av klass (4031 - 271066, n=2160) | |
| AIDA64 / Memory Write | |
| AMD Ryzen 5 7600X | |
| Intel Core i9-13900K | |
| Intel Core i5-12600K | |
| Intel Core i5-13600K | |
| Intel Core i5-13400F | |
| Genomsnitt av klass (3506 - 242868, n=2165) | |
| AMD Ryzen 9 5900X | |
| AMD Ryzen 9 5950X | |
| AMD Ryzen 5 5600X | |
| AIDA64 / Memory Latency | |
| Genomsnitt av klass (6.1 - 536, n=2227) | |
| Intel Core i5-12600K | |
| Intel Core i5-13600K | |
| Intel Core i5-13400F | |
| Intel Core i9-13900K | |
| AMD Ryzen 9 5950X | |
| AMD Ryzen 5 5600X | |
| AMD Ryzen 5 7600X | |
| AMD Ryzen 9 5900X | |
* ... mindre är bättre
Spel riktmärken
Som tidigare duellerar vårt testprov främst med Intel Core i5-12600K i speltesterna. I höga upplösningar och en hög förinställning glider rivalerna närmare varandra. Om det enbart handlar om spelande går du definitivt inte fel med Intel Core i5-13400F. Med sina 16 trådar är alla spel för närvarande spelbara väl med motsvarande grafikkort. I vårt test använde vi en Nvidia GeForce RTX 3090 Founder Edition för att kunna jämföra prestandan hos vårt testprov med jämförelsenheterna. Om du även vill streama samtidigt som du spelar rekommenderar vi för närvarande ett Intel Core i9-13900K eller ta en AMD Ryzen 9 7950X.
Gaming Performance
| Performance rating - Percent | |
| Intel Core i9-13900K | |
| AMD Ryzen 9 7900X | |
| AMD Ryzen 5 7600X | |
| Intel Core i9-12900K | |
| Intel Core i5-13600K | |
| Intel Core i5-13400F | |
| Intel Core i5-12600K | |
| F1 22 | |
| 1920x1080 Low Preset AA:T AF:16x | |
| AMD Ryzen 9 7900X | |
| AMD Ryzen 5 7600X | |
| Intel Core i5-13600K | |
| Intel Core i9-13900K | |
| Intel Core i9-12900K | |
| Intel Core i5-13400F | |
| Intel Core i5-12600K | |
| 1920x1080 Ultra High Preset AA:T AF:16x | |
| Intel Core i9-12900K | |
| Intel Core i5-12600K | |
| Intel Core i5-13600K | |
| Intel Core i5-13400F | |
| AMD Ryzen 5 7600X | |
| AMD Ryzen 9 7900X | |
| Intel Core i9-13900K | |
| Far Cry 5 | |
| 1920x1080 Ultra Preset AA:T | |
| Intel Core i9-13900K | |
| Intel Core i5-13600K | |
| Intel Core i9-12900K | |
| AMD Ryzen 9 7900X | |
| AMD Ryzen 5 7600X | |
| Intel Core i5-12600K | |
| Intel Core i5-13400F | |
| 1280x720 Low Preset AA:T | |
| Intel Core i9-13900K | |
| AMD Ryzen 9 7900X | |
| Intel Core i5-13600K | |
| AMD Ryzen 5 7600X | |
| Intel Core i9-12900K | |
| Intel Core i5-12600K | |
| Intel Core i5-13400F | |
| X-Plane 11.11 | |
| 1920x1080 high (fps_test=3) | |
| AMD Ryzen 9 7900X | |
| AMD Ryzen 5 7600X | |
| Intel Core i9-13900K | |
| Intel Core i9-12900K | |
| Intel Core i5-13600K | |
| Intel Core i5-13400F | |
| Intel Core i5-12600K | |
| 1280x720 low (fps_test=1) | |
| Intel Core i9-13900K | |
| AMD Ryzen 5 7600X | |
| AMD Ryzen 9 7900X | |
| Intel Core i9-12900K | |
| Intel Core i5-13600K | |
| Intel Core i5-13400F | |
| Intel Core i5-12600K | |
| Final Fantasy XV Benchmark | |
| 1920x1080 High Quality | |
| AMD Ryzen 9 7900X | |
| Intel Core i5-13600K | |
| Intel Core i9-13900K | |
| AMD Ryzen 5 7600X | |
| Intel Core i9-12900K | |
| Intel Core i5-13400F | |
| Intel Core i5-12600K | |
| 1280x720 Lite Quality | |
| AMD Ryzen 9 7900X | |
| Intel Core i5-13600K | |
| Intel Core i9-13900K | |
| Intel Core i9-12900K | |
| AMD Ryzen 5 7600X | |
| Intel Core i5-13400F | |
| Intel Core i5-12600K | |
| Dota 2 Reborn | |
| 1920x1080 ultra (3/3) best looking | |
| AMD Ryzen 9 7900X | |
| Intel Core i9-13900K | |
| AMD Ryzen 5 7600X | |
| Intel Core i5-13600K | |
| Intel Core i9-12900K | |
| Intel Core i5-12600K | |
| Intel Core i5-13400F | |
| 1280x720 min (0/3) fastest | |
| AMD Ryzen 5 7600X | |
| AMD Ryzen 9 7900X | |
| Intel Core i9-13900K | |
| Intel Core i5-13600K | |
| Intel Core i9-12900K | |
| Intel Core i5-12600K | |
| Intel Core i5-13400F | |
| GTA V | |
| 1920x1080 Highest AA:4xMSAA + FX AF:16x | |
| Intel Core i9-13900K | |
| AMD Ryzen 9 7900X | |
| AMD Ryzen 5 7600X | |
| Intel Core i5-13600K | |
| Intel Core i9-12900K | |
| Intel Core i5-12600K | |
| Intel Core i5-13400F | |
| 1024x768 Lowest Settings possible | |
| Intel Core i9-13900K | |
| AMD Ryzen 9 7900X | |
| AMD Ryzen 5 7600X | |
| Intel Core i5-13600K | |
| Intel Core i9-12900K | |
| Intel Core i5-13400F | |
| Intel Core i5-12600K | |
| låg | med. | hög | ultra | QHD | 4K | |
|---|---|---|---|---|---|---|
| GTA V (2015) | 187.5 | 187.5 | 187.1 | 161.4 | 151.8 | 182.2 |
| The Witcher 3 (2015) | 773 | 586 | 384 | 188.1 | 156.9 | |
| Dota 2 Reborn (2015) | 293.1 | 257 | 250.4 | 231.65 | 216.7 | |
| Final Fantasy XV Benchmark (2018) | 236 | 231 | 190.8 | 146.6 | 88.8 | |
| X-Plane 11.11 (2018) | 225 | 199.2 | 160.9 | 133.5 | ||
| Far Cry 5 (2018) | 244 | 211 | 203 | 186 | 176 | 110 |
| Strange Brigade (2018) | 741 | 479 | 380 | 329 | 249 | 153.1 |
| Shadow of the Tomb Raider (2018) | 314 | 261 | 251 | 234 | 172.2 | 99.6 |
| Far Cry New Dawn (2019) | 200 | 176 | 169 | 151 | 143 | 109 |
| Metro Exodus (2019) | 311 | 223 | 175.2 | 140.1 | 115.8 | 76.6 |
| Borderlands 3 (2019) | 244 | 213 | 190.8 | 164.1 | 131.6 | 75.3 |
| F1 2020 (2020) | 487 | 403 | 374 | 270 | 218 | 138.8 |
| F1 2021 (2021) | 648 | 548 | 441 | 224 | 175.4 | 105.3 |
| Cyberpunk 2077 1.6 (2022) | 214 | 213 | 174 | 173 | 88 | 46 |
| Tiny Tina's Wonderlands (2022) | 364 | 294 | 212 | 168.5 | 124 | 70.8 |
| F1 22 (2022) | 344 | 361 | 321 | 125.1 | 83.8 | 42.4 |
| The Quarry (2022) | 282 | 216 | 177.7 | 144.4 | 103.6 | 58.9 |
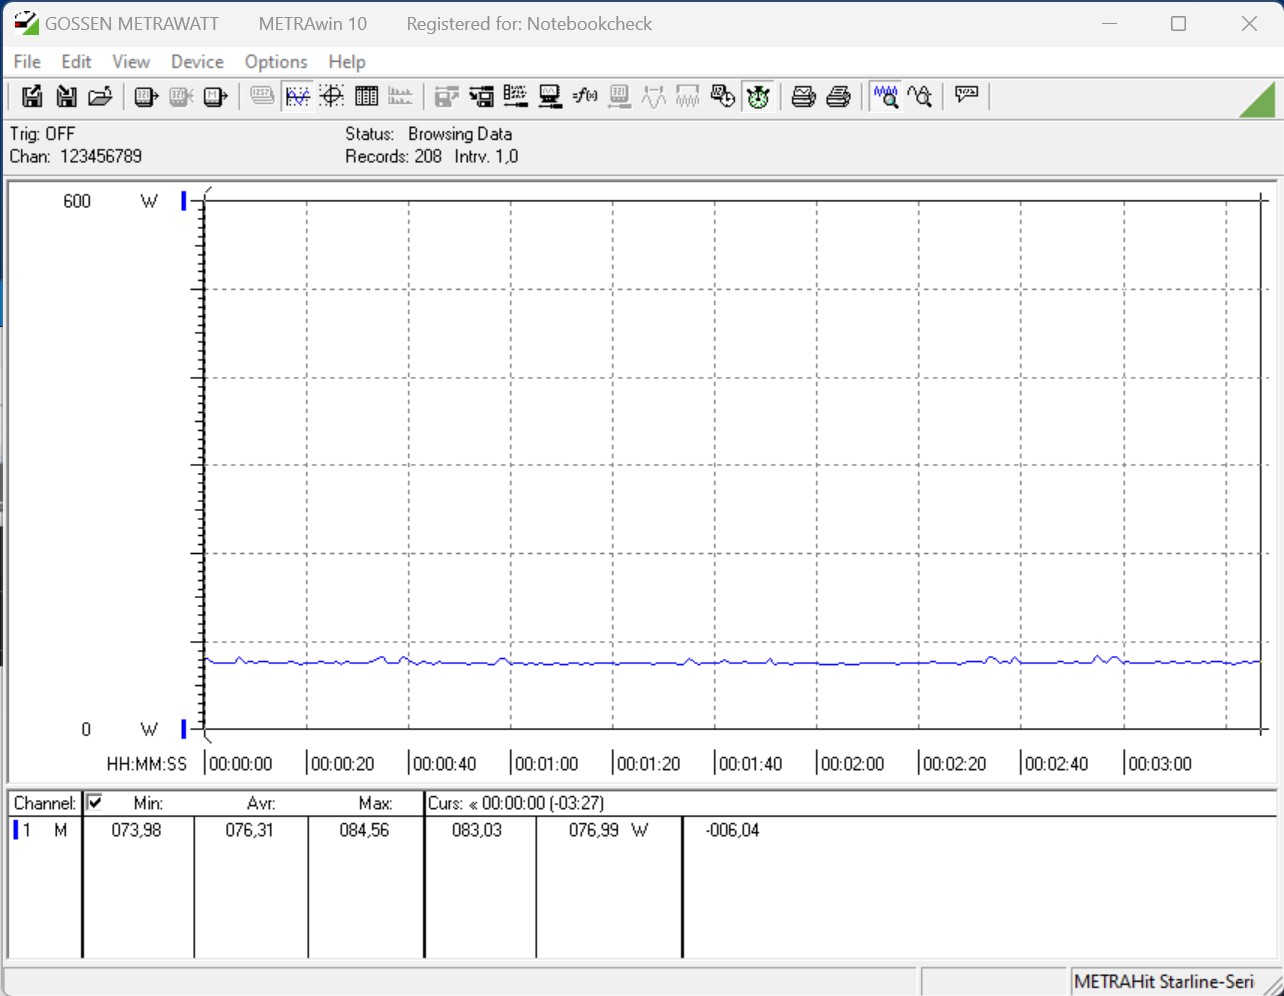
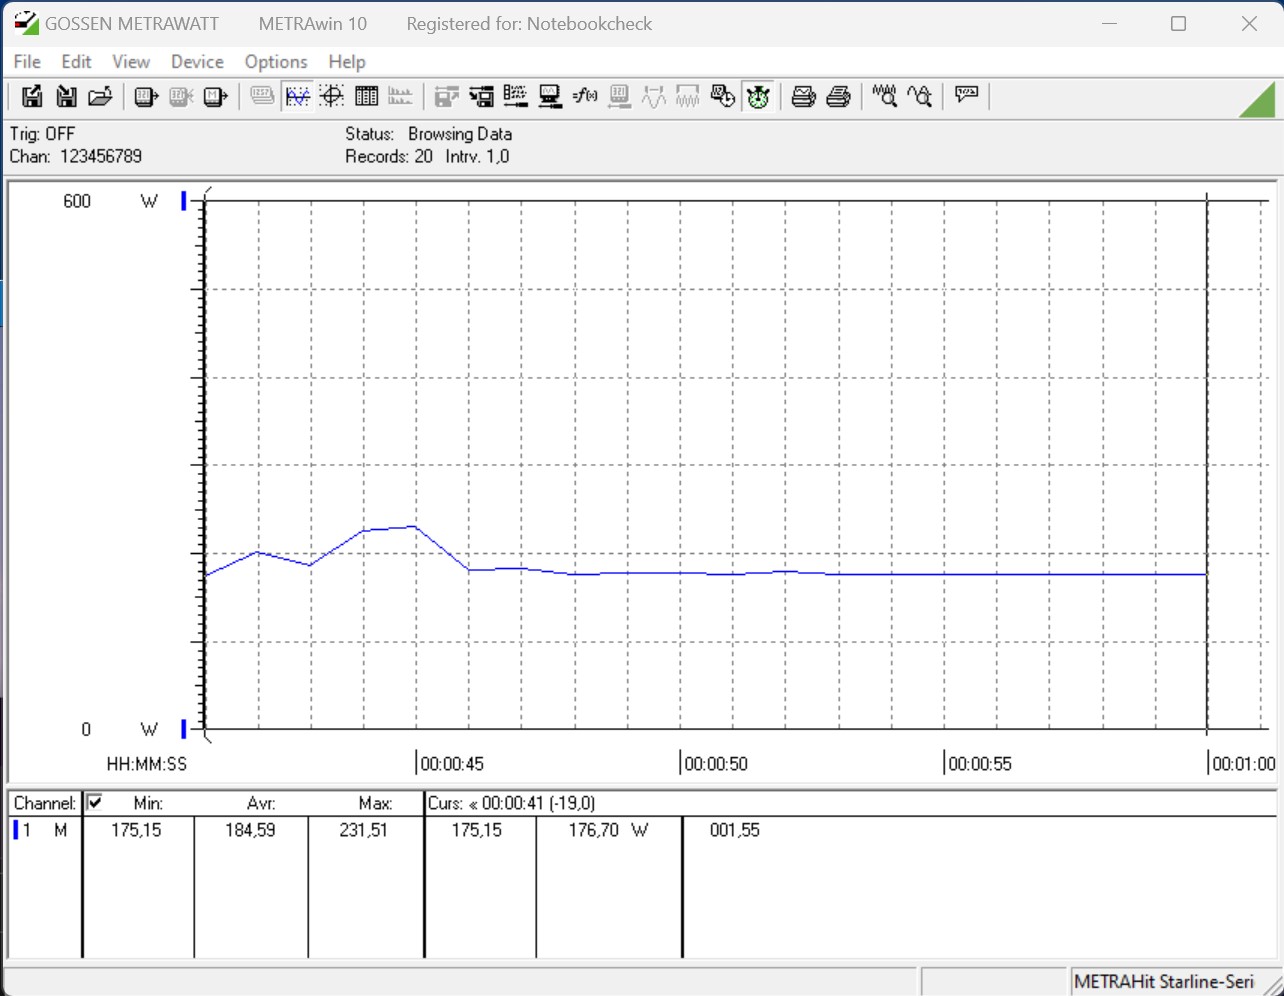
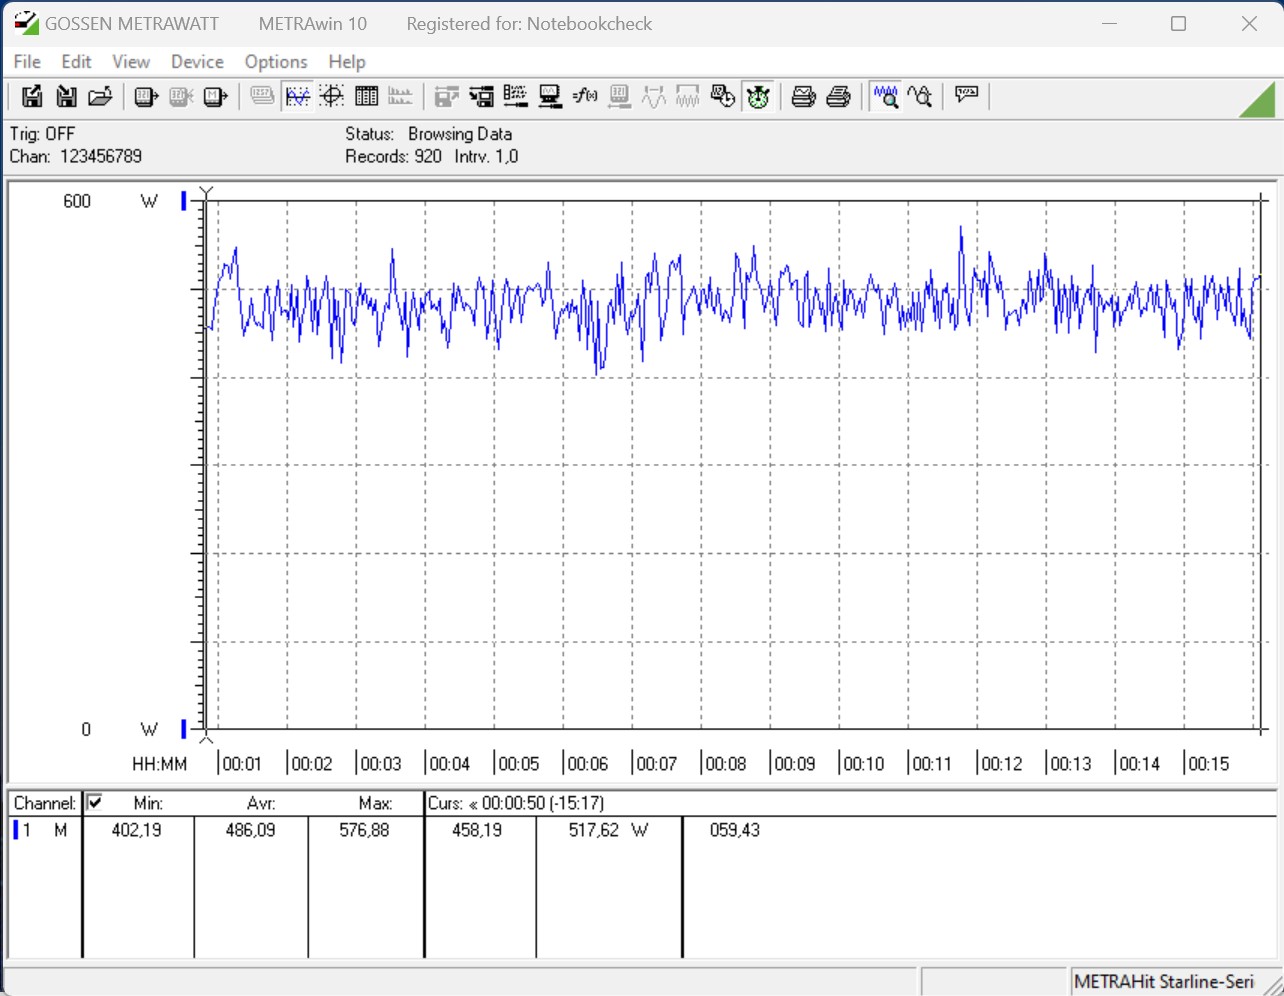
Energiförbrukning
Enligt de tekniska specifikationerna för Intel Core i5-13400F är strömförbrukningen 65 watt och kan nå upp till 148 watt under belastning. Om begränsningarna av processorns strömförbrukning inte begränsas i BIOS, är de 148 watt permanent på och begränsas inte tillfälligt av daggningsvärdet. Alla tester som vi gjorde med processorn utfördes utan några begränsningar. Vi registrerar testsystemets strömförbrukning med endast 184 watt i multitestet Cinebench R15. Intel Core i5-13400F är alltså betydligt sparsammare än en Intel Core i5-12600K, som kräver knappt 206 watt i vårt test. Vi noterar lite mer med 214 watt i stresstestet. Trots detta är energiförbrukningen glädjande låg.
På grund av den låga energiförbrukningen behöver Intel Core i5-13400F inte mycket kylning. Således kan du tryggt avstå från en AiO och en högkvalitativ luftkylare är helt tillräcklig för den här CPU:n.
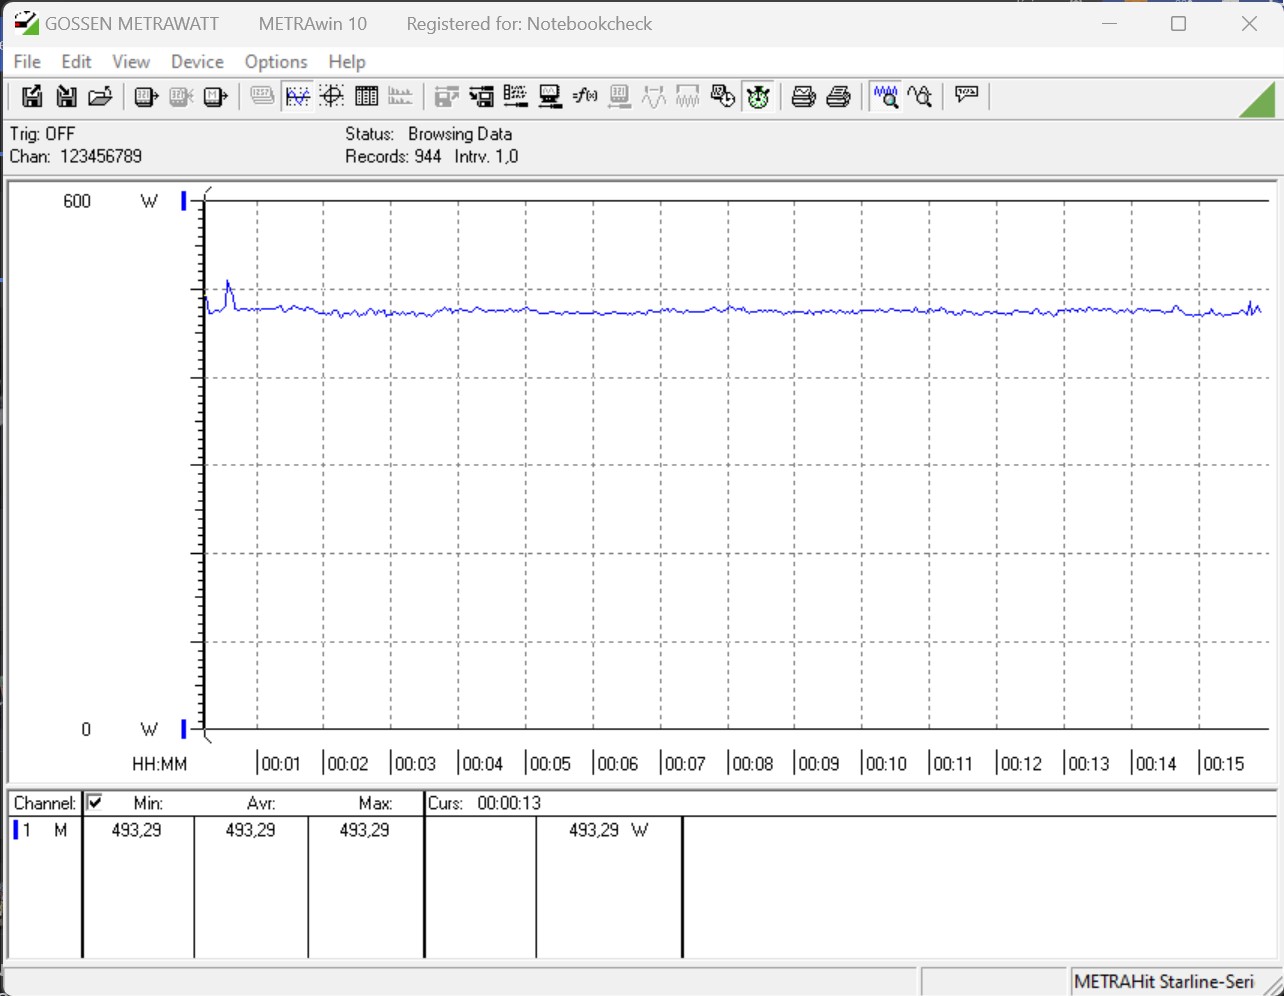
| Power Consumption / Cinebench R15 Multi (external Monitor) | |
| Intel Core i9-13900K | |
| Intel Core i9-12900K (Idle: 70.5 W) | |
| AMD Ryzen 9 7900X | |
| Intel Core i5-13600K | |
| AMD Ryzen 9 5900X (Idle: 78.1 W) | |
| AMD Ryzen 9 5950X (Idle: 78 W) | |
| AMD Ryzen 5 7600X | |
| Intel Core i5-12600K (Idle: 70.45 W) | |
| Intel Core i5-13400F | |
| AMD Ryzen 5 5600X (Idle: 79.23 W) | |
| Power Consumption / Prime95 V2810 Stress (external Monitor) | |
| Intel Core i9-13900K | |
| Intel Core i5-13600K | |
| AMD Ryzen 9 7900X | |
| Intel Core i9-12900K (Idle: 70.5 W) | |
| Intel Core i5-12600K (Idle: 70.45 W) | |
| AMD Ryzen 9 5950X (Idle: 78 W) | |
| AMD Ryzen 9 5900X (Idle: 78.1 W) | |
| AMD Ryzen 5 7600X | |
| Intel Core i5-13400F | |
| AMD Ryzen 5 5600X (Idle: 79.23 W) | |
| Power Consumption / The Witcher 3 ultra (external Monitor) | |
| AMD Ryzen 9 7900X | |
| Intel Core i9-13900K | |
| AMD Ryzen 5 7600X | |
| Intel Core i5-13600K | |
| Intel Core i5-13400F | |
| Nvidia GeForce RTX 3090 Founders Edition (Idle: 91.1 W) | |
| Intel Core i9-12900K (Idle: 70.5 W) | |
| AMD Ryzen 9 5950X (Idle: 78 W) | |
| AMD Ryzen 9 5900X (Idle: 78.1 W) | |
| AMD Ryzen 5 5600X (Idle: 79.23 W) | |
| Intel Core i5-12600K (Idle: 70.45 W) | |
* ... mindre är bättre
Power Consumption With External Monitor
För
Emot
Slutsats - Ekonomisk, snabb och lätt att kyla

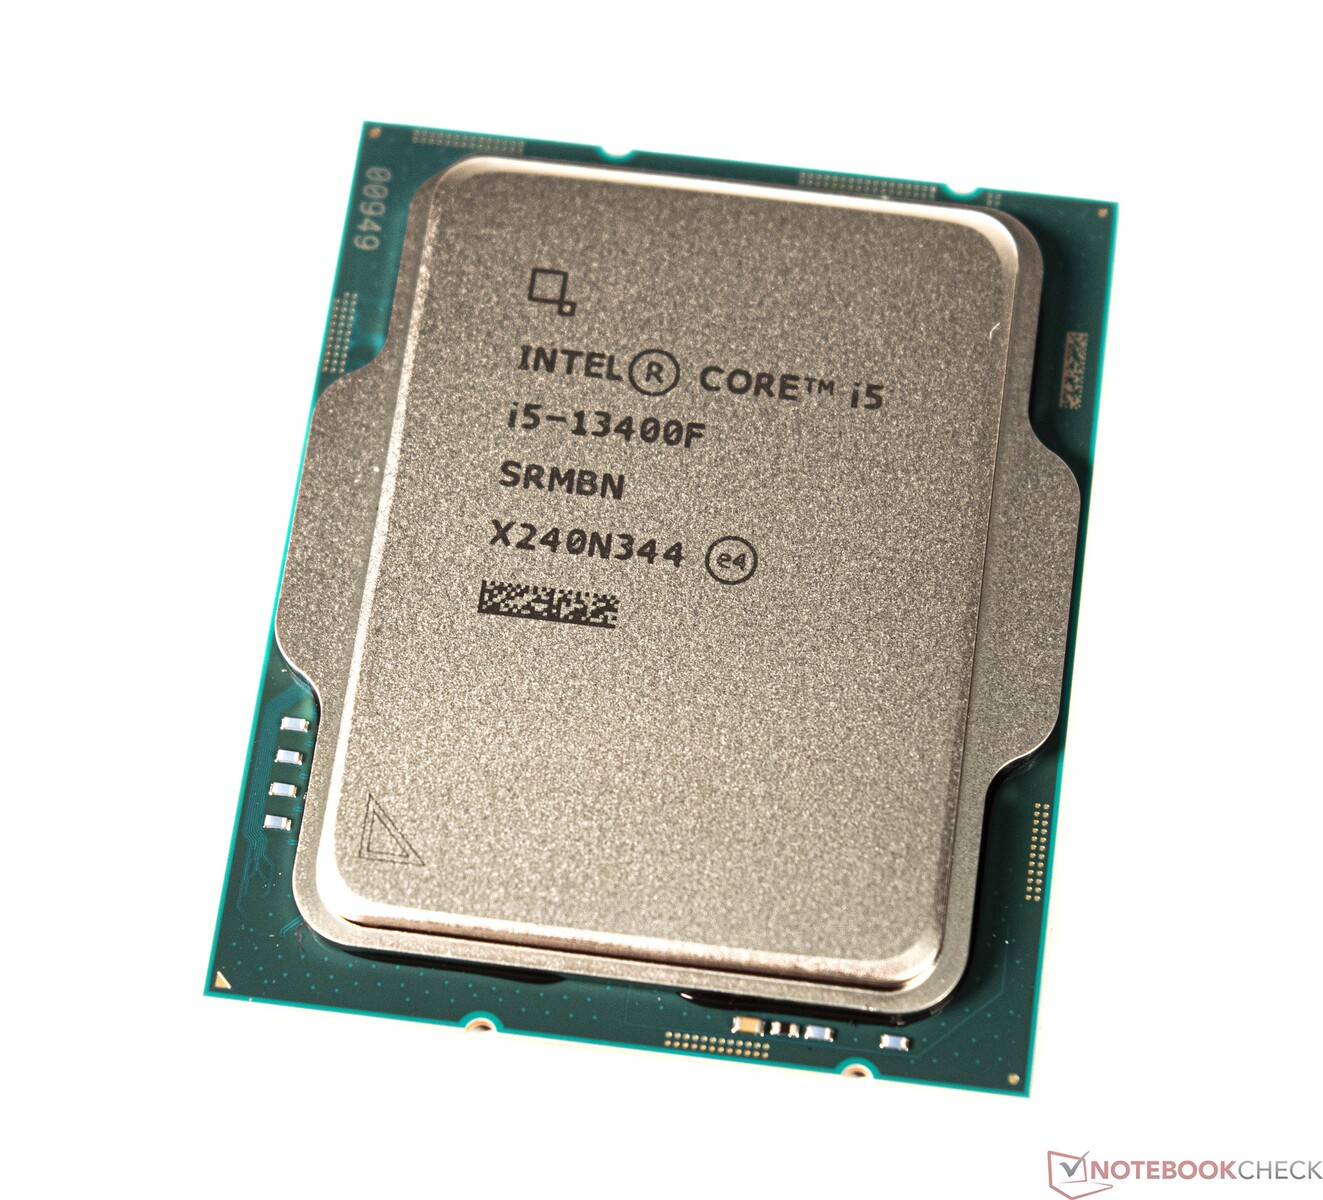
Intel har redan skickat in en ärevördig efterföljare av Alder Lake-generationen i tävlingen med Raptor Lake. Mellan- och instegsmodellerna på samma grund anländer nu successivt. Ändå måste du ta en närmare titt och vara uppmärksam på CPU-steget eftersom det inte alltid är en Raptor Lake CPU. I vårt fall har vi Intel Core i5-13400F i C0-stegring, vilket indikerar att det är en Alder Lake CPU i grunden. Endast B0-steget indikerar en infödd Raptor-Lake CPU. Båda versionerna ska finnas tillgängliga, och vi antar att de presterar lika bra.
Samtidigt erbjuder Intel en sparsam 10-kärnig med Intel Core i5-13400F, som också har 4 E-kärnor förutom P-kärnorna. Med upp till 148 watt är modellen relativt sparsam vid full belastning. Dessutom är temperaturerna lätta att hantera och kräver ingen komplicerad och dyr kylning. I testet kan Intel Core i5-13400F hålla jämna steg med en Intel Core i5-12600K, matchningen när det gäller energieffektivitet är klart till förmån för den mer sparsamma modellen. AMD:s Zen 4-processorer går inte att hålla jämna steg med. Här rankas den infödda 10-kärniga i vårt test snarare med en AMD Ryzen 7 5800X, som dessutom har totalt 16 trådar.
Intel Core i5-13400F erbjuder solid prestanda för vardaglig användning och bemästrar även de senaste spelen. Tack vare den låga TDP kan den sparsamma processorn även kylas i små höljen utan problem.
Ett moderkort med ett chipset i 600-serien kan fortfarande användas som basenhet. Detta belastar inte plånboken alltför mycket vid en uppgradering. Man måste dock ta hänsyn till att det inte längre kommer någon ny Intelgeneration för socket 1700. Den aktuella rykteskvarnen säger att socket 1851 kommer att introduceras med Meteor Lake. Detta innebär att ett nytt moderkort kommer att vara obligatoriskt igen.
Priser och tillgänglighet
Intel Core i5-13400F är för närvarande tillgänglig för 227 euro (~$247) på Notebooksbilliger.de. För 260 Euros (~$283) kan du köpa den med integrerad grafikenhet, också på Notebooksbilliger.de.
