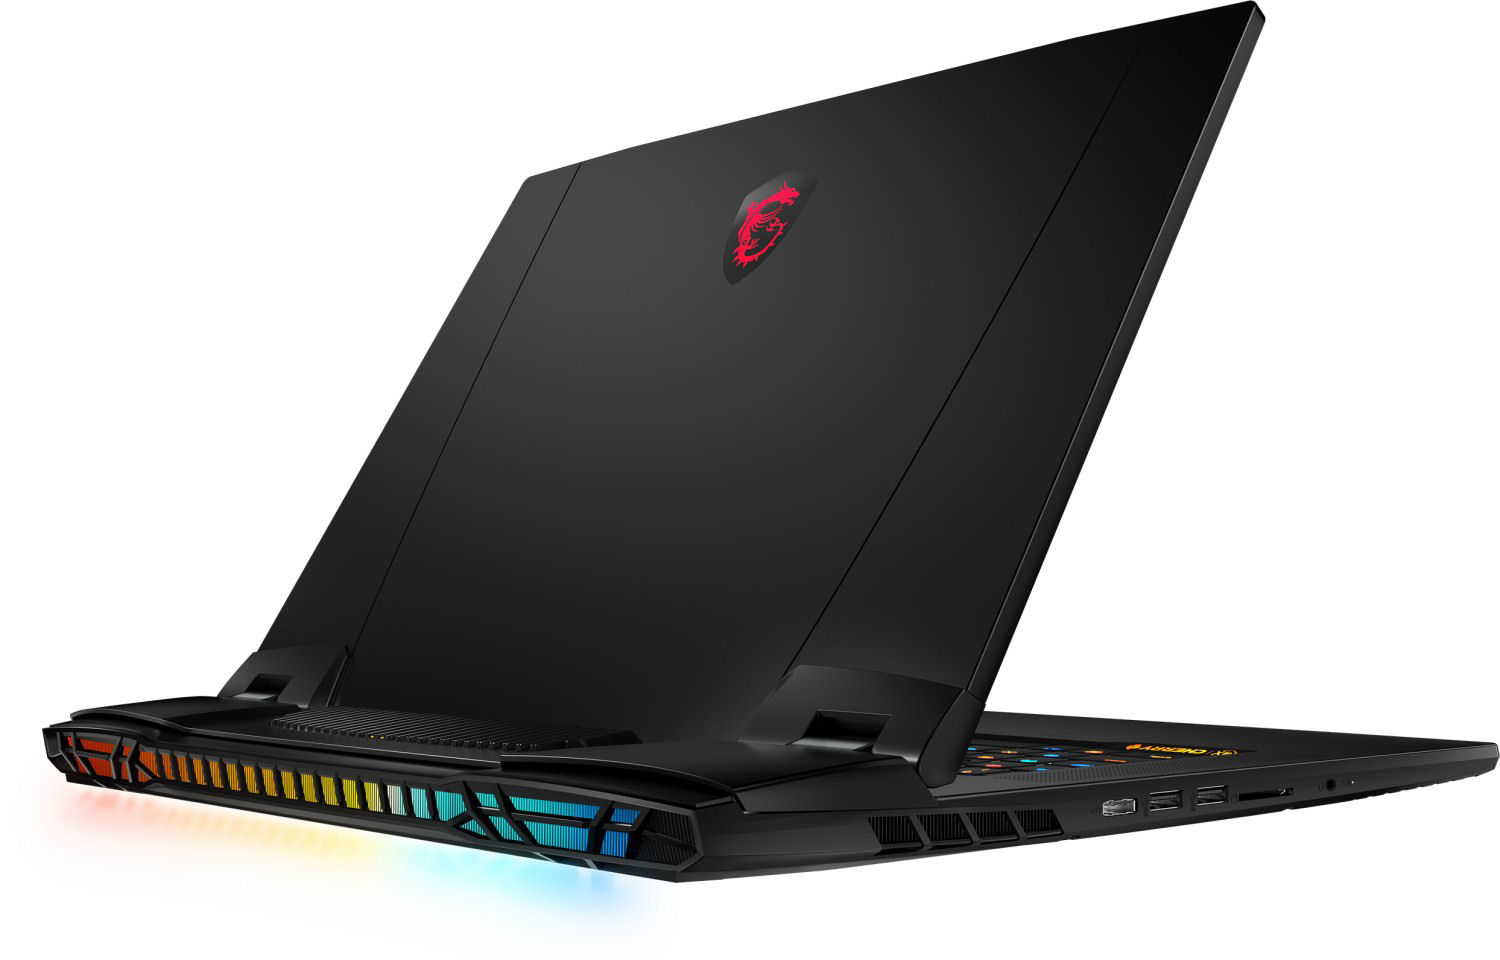
Recension av MSI Titan GT77 12UHS 4K - Elit bland bärbara datorer med UHD DTR
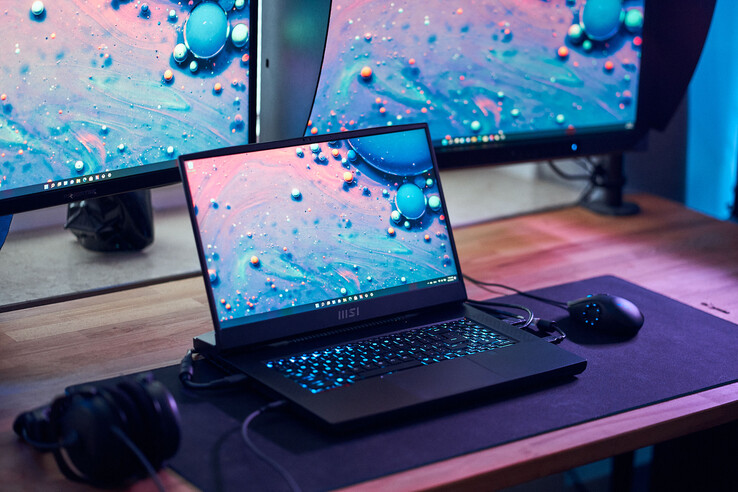
Spelare och kreatörer är båda en del av målgruppen för MSI Titan GT77 12UHS - en bärbar dator som ersätter en stationär dator (DTR). De avancerade specifikationerna (Core i9-12900HX, GeForce RTX 3080 Ti Laptop och 64 GB RAM) driver upp priset på den bärbara datorn till cirka 5 600 euro (5 980 USD). Skärmen är den största skillnaden mellan den här enheten och dess FHD-syskonmodellsom vi nyligen recenserade: den aktuella recensionsenheten har en 4K-panel ombord. Några av dess konkurrenter är bland annat Schenker XMG Ultra 17, den Razer Blade 17 och Alienware x17 R2.
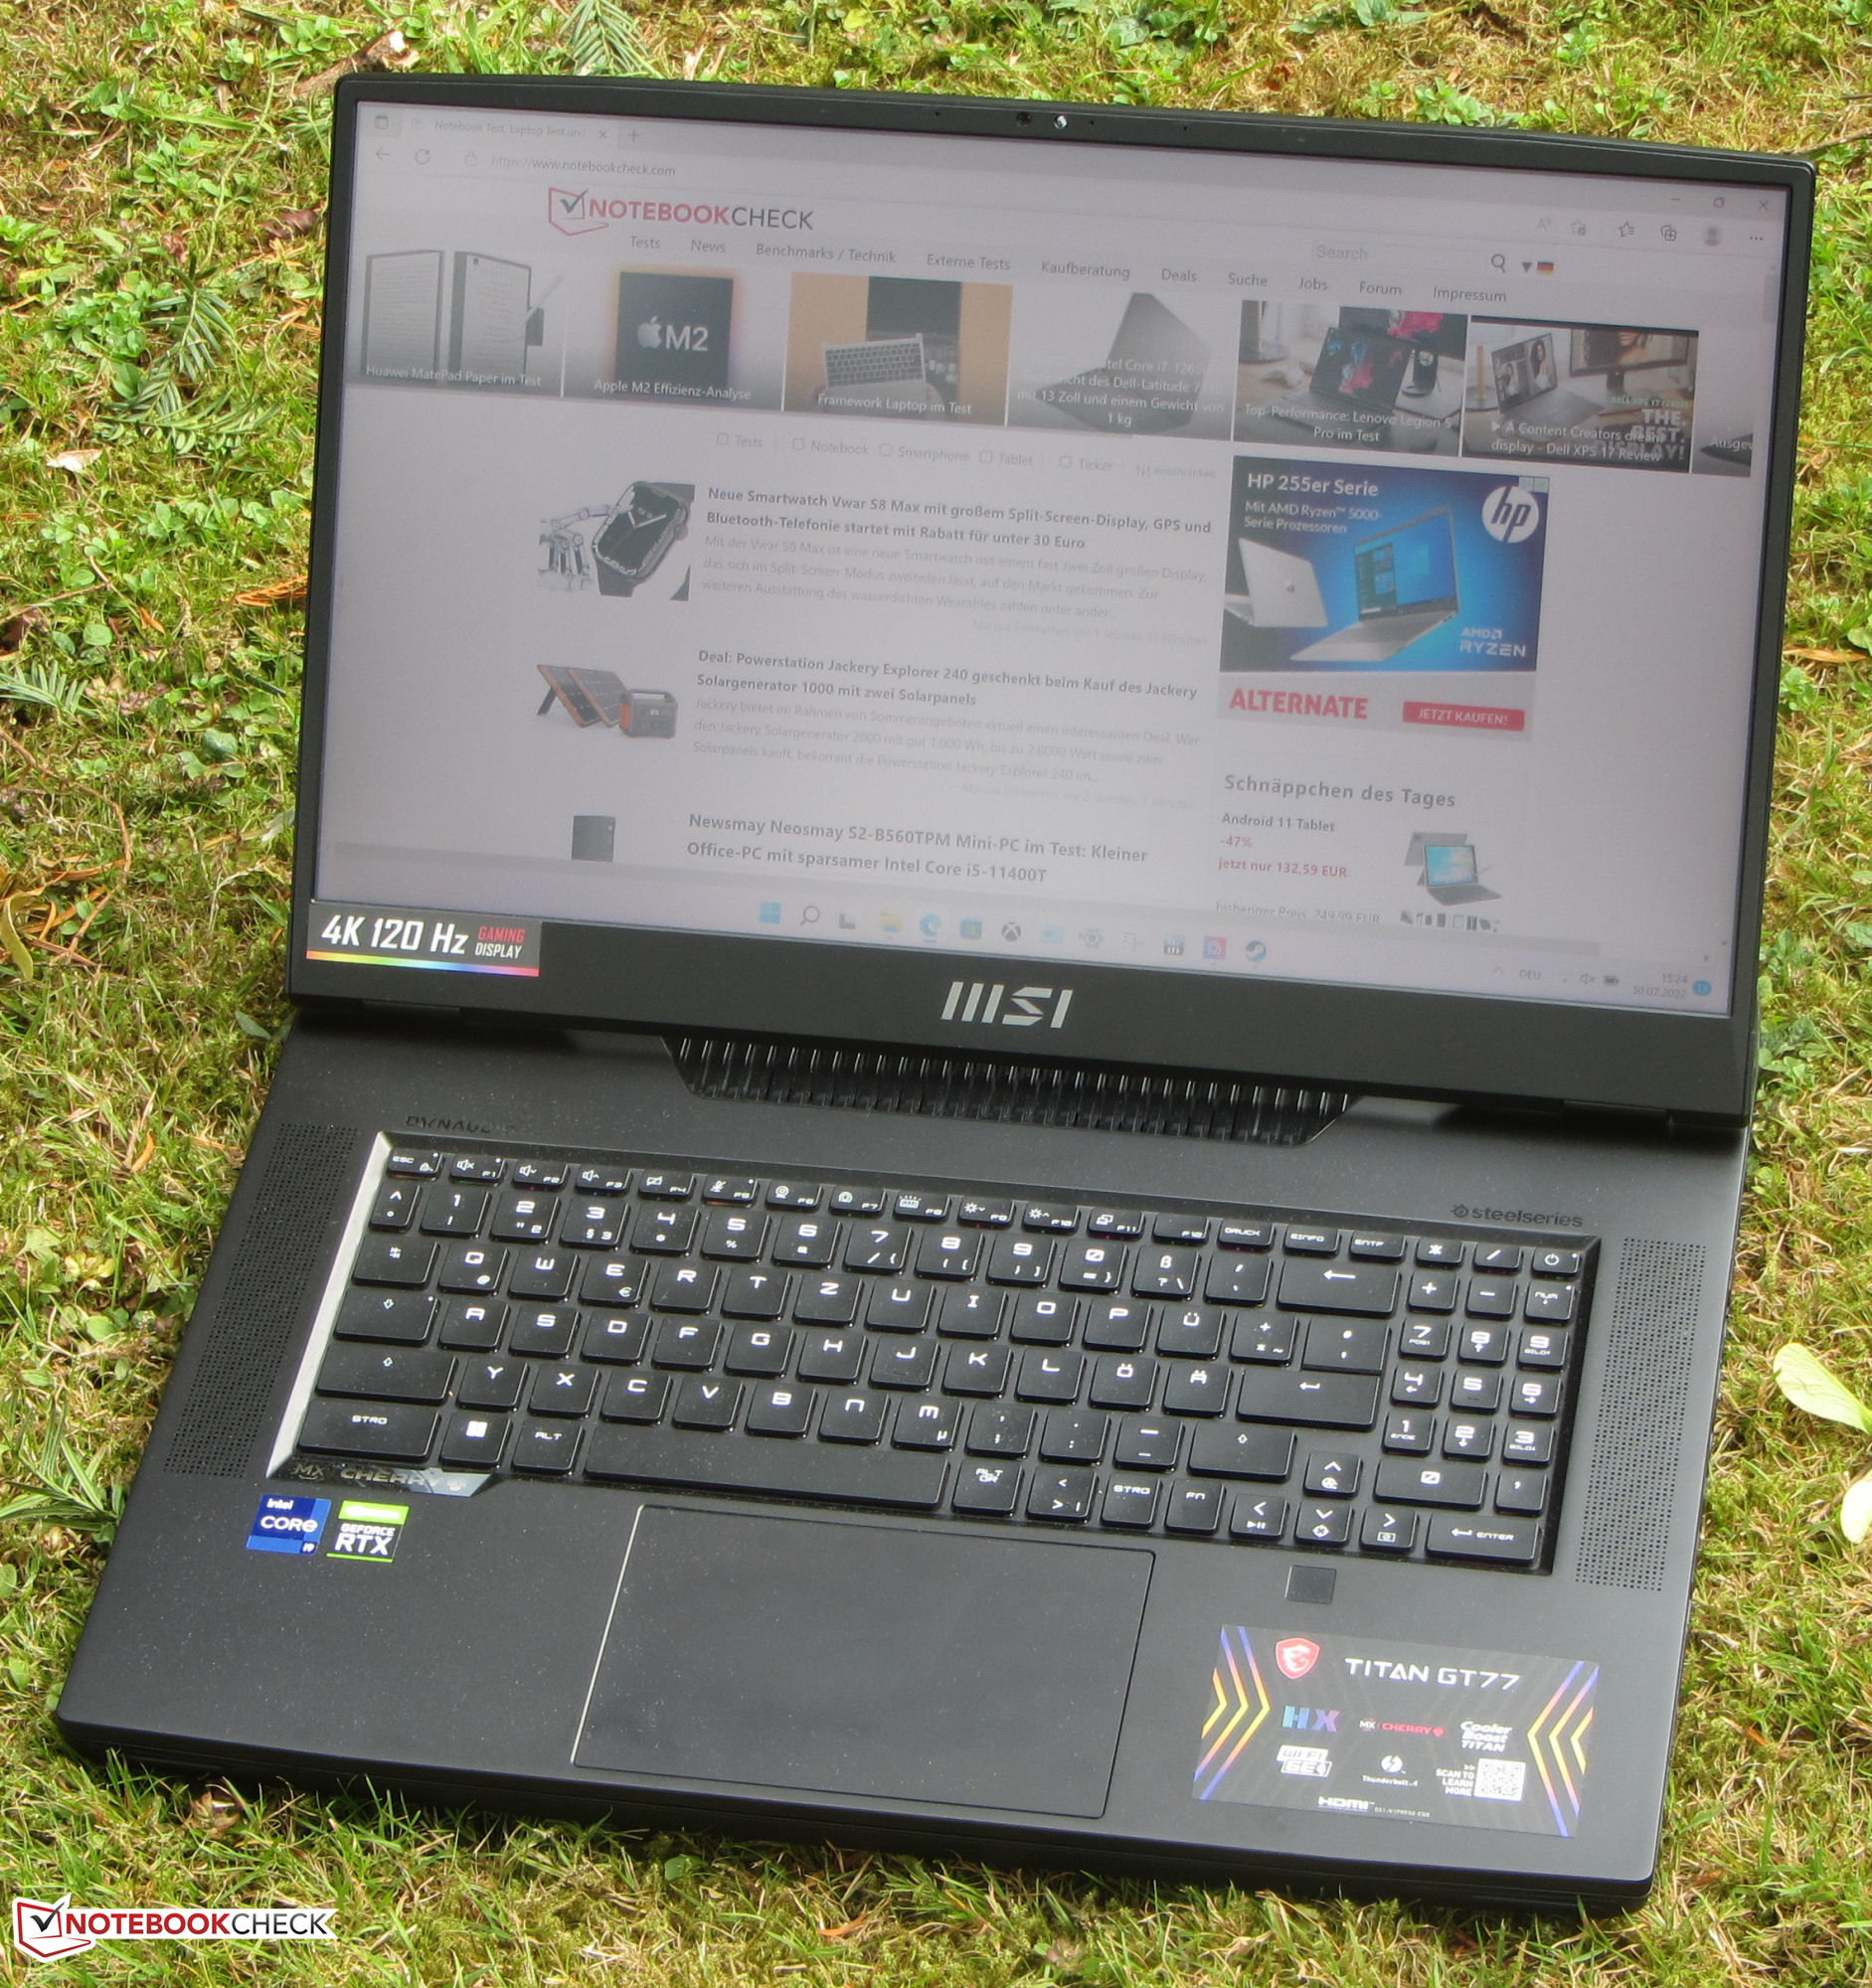
Eftersom den här enheten och dess FHD motsvarighet är byggda på samma sätt kan du läsa vår recension av den här enheten och dess FHD motsvarighet MSI Titan GT77 12UHS (Core i9, FHD)för mer information om chassit, inmatningsenheter och högtalare.
Potentiella konkurrenter i jämförelse
Gradering | Datum | Modell | Vikt | Höjd | Storlek | Upplösning | Pris |
|---|---|---|---|---|---|---|---|
| 87.8 % v7 (old) | 09/2022 | MSI Titan GT77 12UHS i9-12900HX, GeForce RTX 3080 Ti Laptop GPU | 3.4 kg | 23 mm | 17.30" | 3840x2160 | |
| 89.9 % v7 (old) | 07/2022 | Razer Blade 17 Early 2022 i9-12900H, GeForce RTX 3080 Ti Laptop GPU | 2.8 kg | 19.9 mm | 17.30" | 3840x2160 | |
| 89.2 % v7 (old) | 05/2022 | Alienware x17 R2 P48E i9-12900HK, GeForce RTX 3080 Ti Laptop GPU | 3.1 kg | 20.9 mm | 17.30" | 1920x1080 | |
| 84.9 % v7 (old) | Schenker XMG Ultra 17 Rocket Lake i9-11900K, GeForce RTX 3080 Laptop GPU | 4.7 kg | 43.5 mm | 17.30" | 1920x1080 |

| SD Card Reader - average JPG Copy Test (av. of 3 runs) | |
| Schenker XMG Ultra 17 Rocket Lake | |
| Alienware x17 R2 P48E (AV Pro V60) | |
| Razer Blade 17 Early 2022 (AV PRO microSD 128 GB V60) | |
| Genomsnitt av klass Gaming (20.9 - 210, n=54, senaste 2 åren) | |
| MSI Titan GT77 12UHS (AV PRO microSD 128 GB V60) | |
| MSI Titan GT77 12UHS 4k (AV PRO microSD 128 GB V60) | |
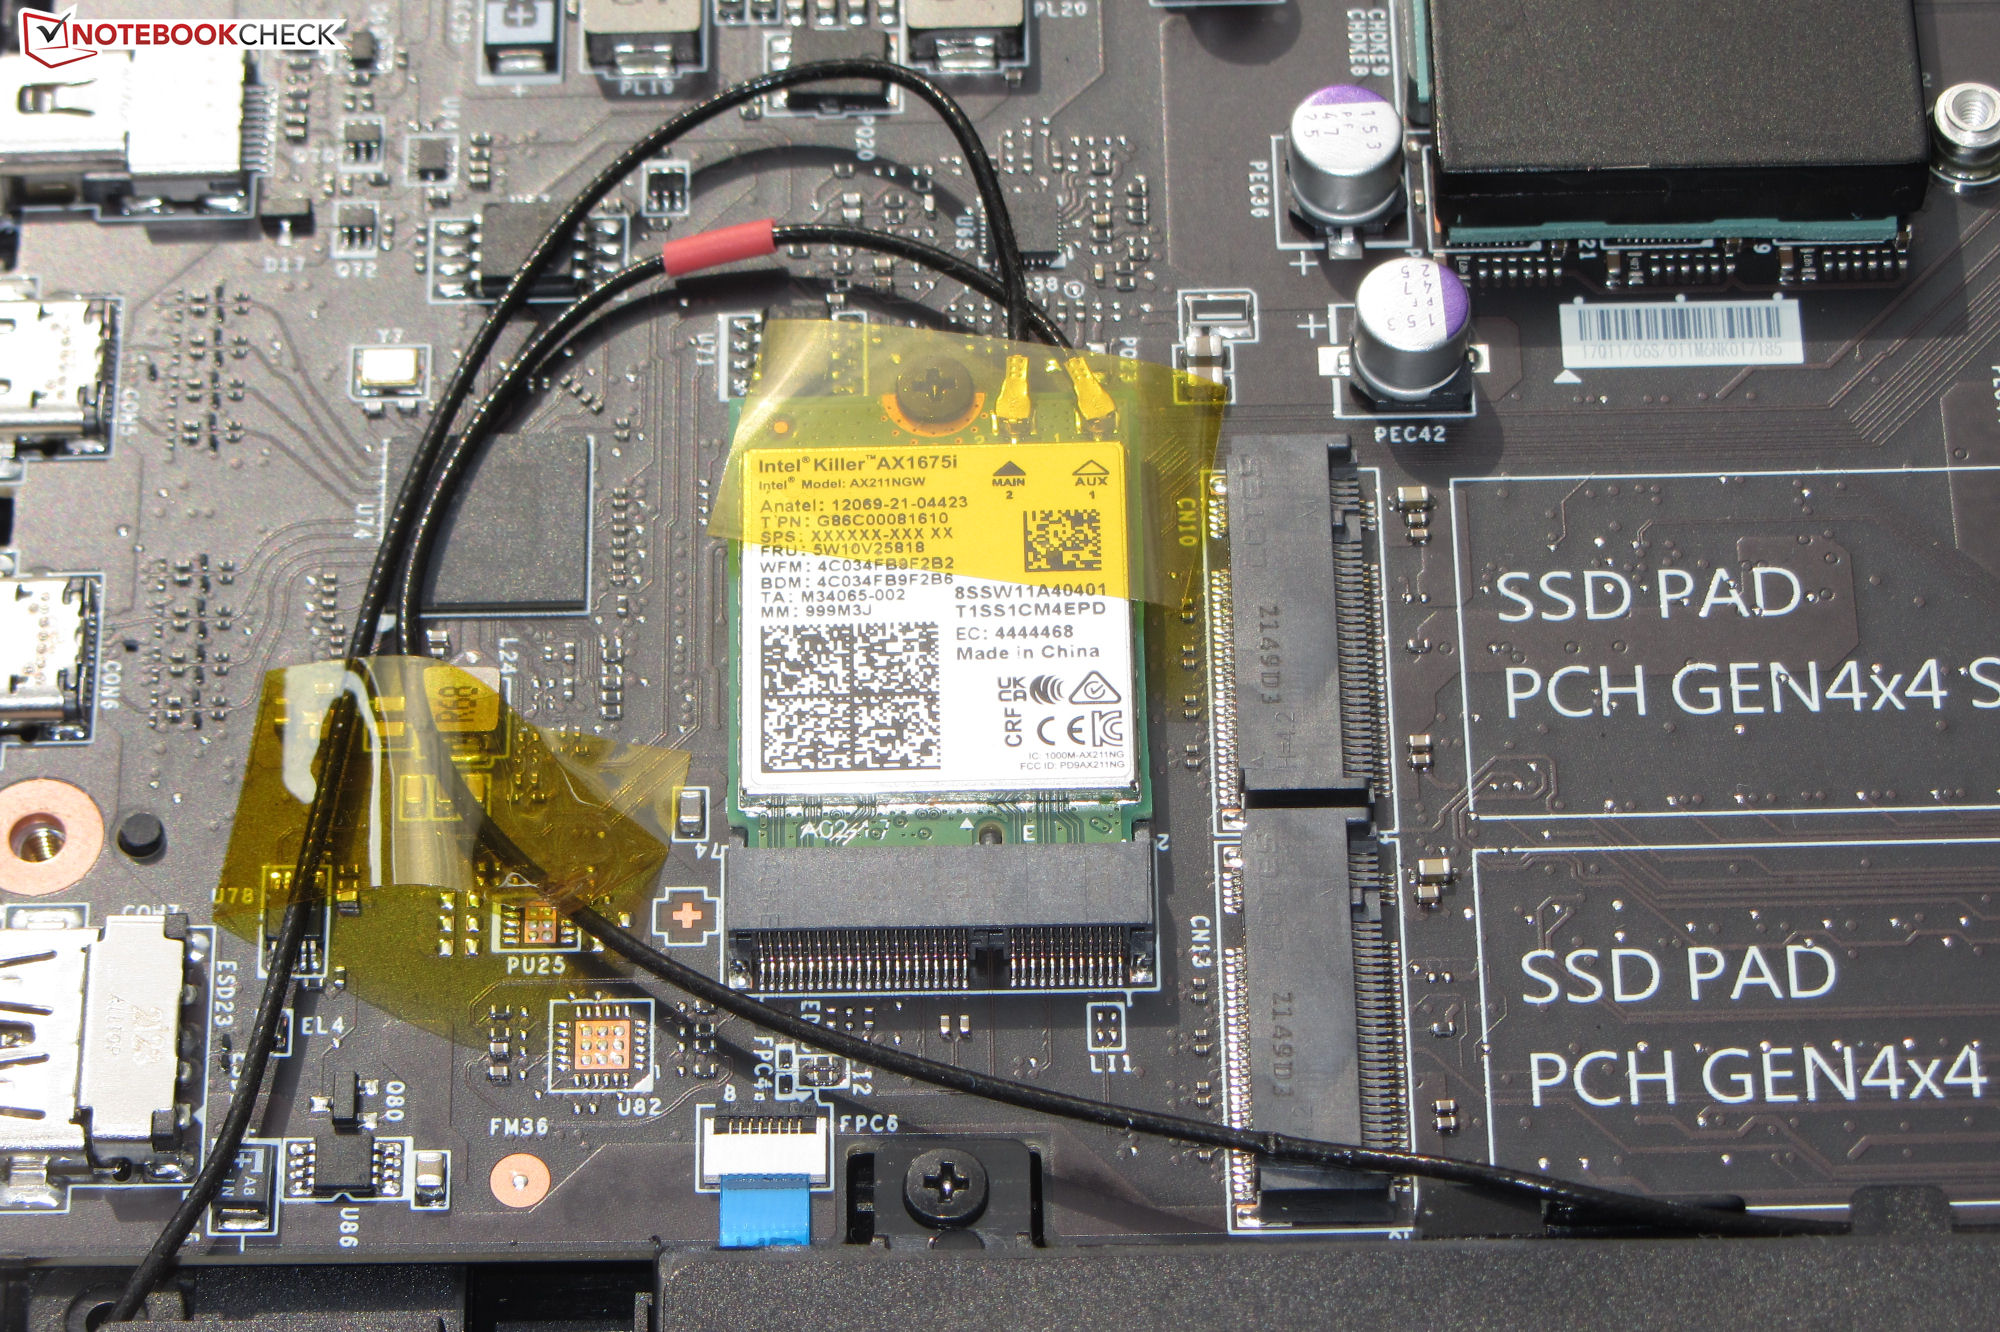
| Networking | |
| iperf3 receive AXE11000 | |
| MSI Titan GT77 12UHS | |
| MSI Titan GT77 12UHS 4k | |
| Razer Blade 17 Early 2022 | |
| Genomsnitt Killer Wi-Fi 6E AX1675i 160MHz Wireless Network Adapter (872 - 1714, n=29) | |
| Genomsnitt av klass Gaming (680 - 1745, n=87, senaste 2 åren) | |
| iperf3 transmit AXE11000 | |
| MSI Titan GT77 12UHS | |
| Genomsnitt Killer Wi-Fi 6E AX1675i 160MHz Wireless Network Adapter (797 - 1622, n=27) | |
| MSI Titan GT77 12UHS 4k | |
| Genomsnitt av klass Gaming (560 - 1862, n=87, senaste 2 åren) | |
| iperf3 receive AX12 | |
| Schenker XMG Ultra 17 Rocket Lake | |
| Alienware x17 R2 P48E | |
| Genomsnitt Killer Wi-Fi 6E AX1675i 160MHz Wireless Network Adapter (1137 - 1270, n=2) | |
| iperf3 transmit AX12 | |
| Schenker XMG Ultra 17 Rocket Lake | |
| Alienware x17 R2 P48E | |
| Genomsnitt Killer Wi-Fi 6E AX1675i 160MHz Wireless Network Adapter (986 - 1257, n=2) | |


Skärm - Ljusstark panel som täcker stor del av DCI-P3
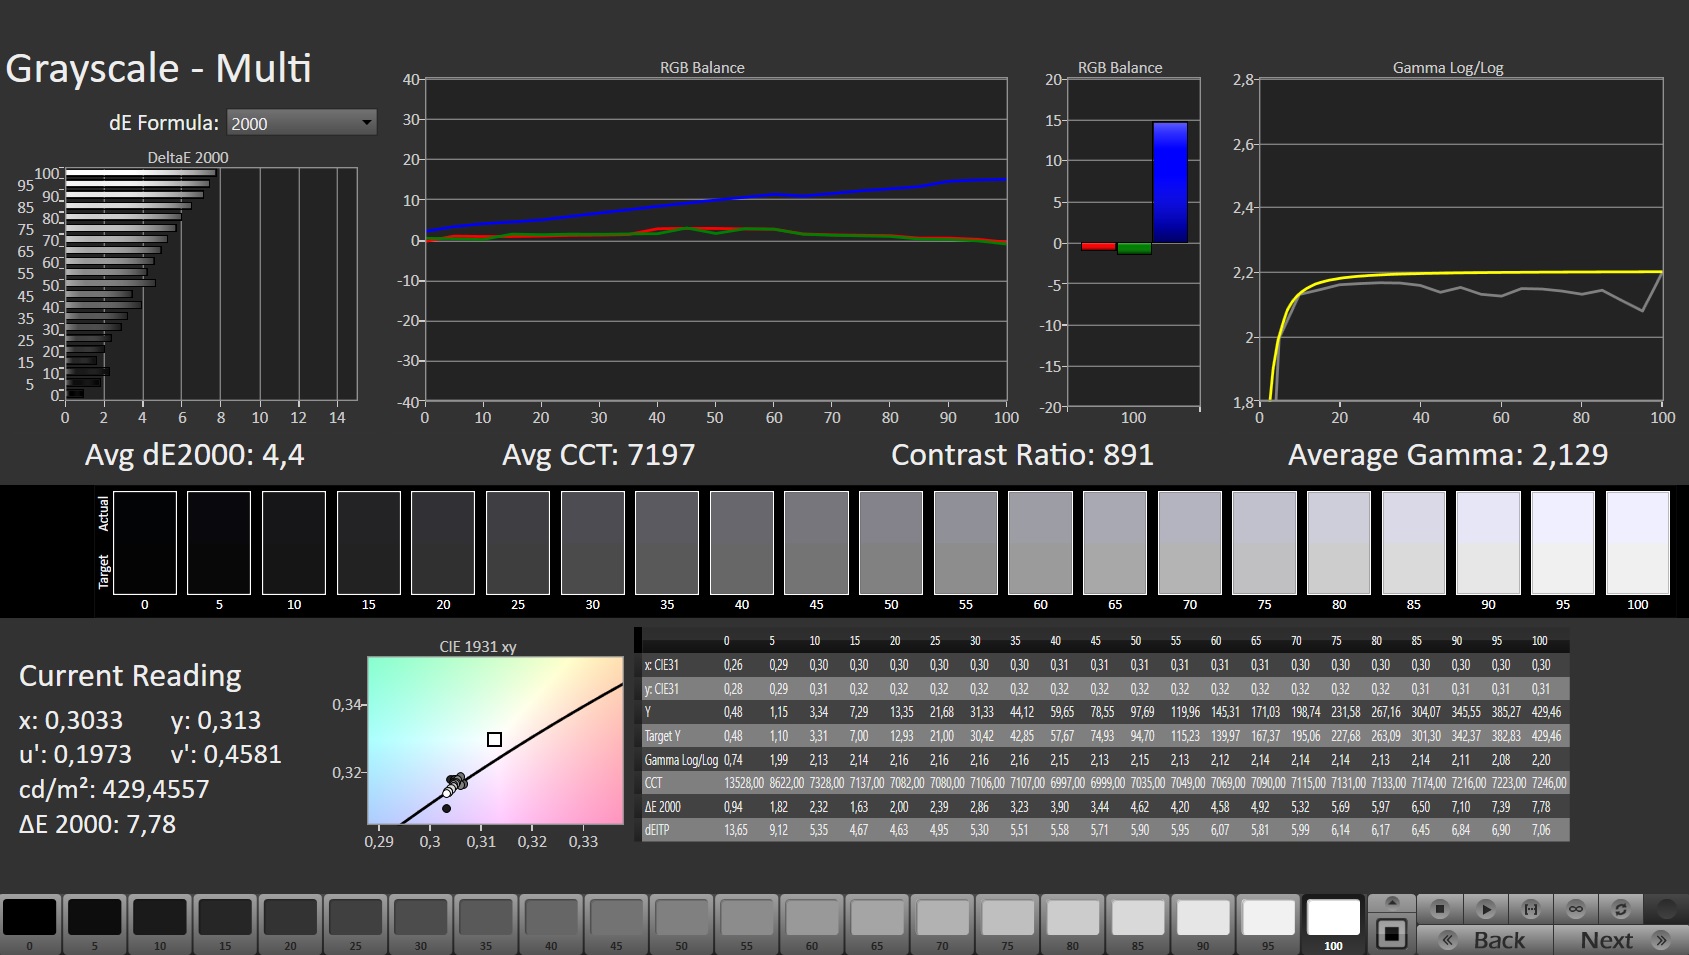
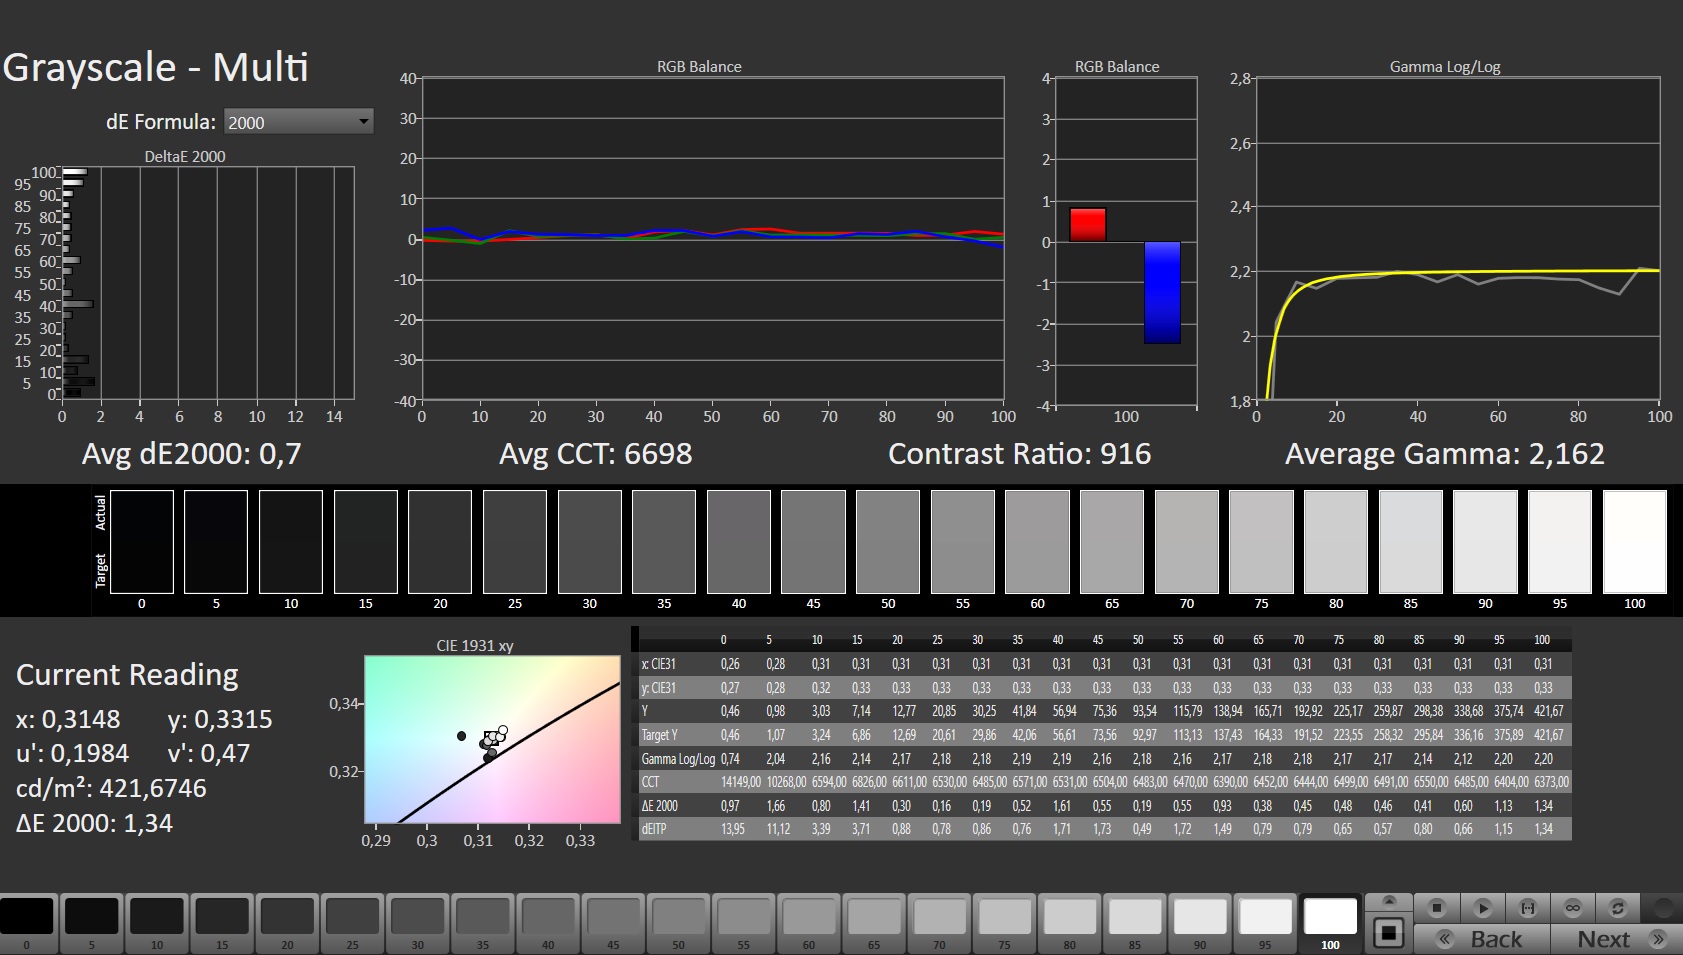
Den matta 4K-panelen (3 840 x 2 160 pixlar) på den aktuella recensionsenheten ger betydligt högre toppljusstyrka än FHD-skärmen på dess systermodell (401 cd/m² jämfört med 275,1 cd/m²).
Trots detta finns det fortfarande utrymme för förbättringar när det gäller kontrast (871:1 vs. 700:1): båda skärmarna ligger under vad vi anser vara bra värden (> 1 000:1). Medan de två panelerna är mycket responsiva erbjuder FHD-modellen en betydligt högre uppdateringsfrekvens (120 Hz jämfört med 360 Hz). Vi observerade inget PWM-flimmer under våra mätningar.
| |||||||||||||||||||||||||
Distribution av ljusstyrkan: 91 %
Mitt på batteriet: 418 cd/m²
Kontrast: 871:1 (Svärta: 0.48 cd/m²)
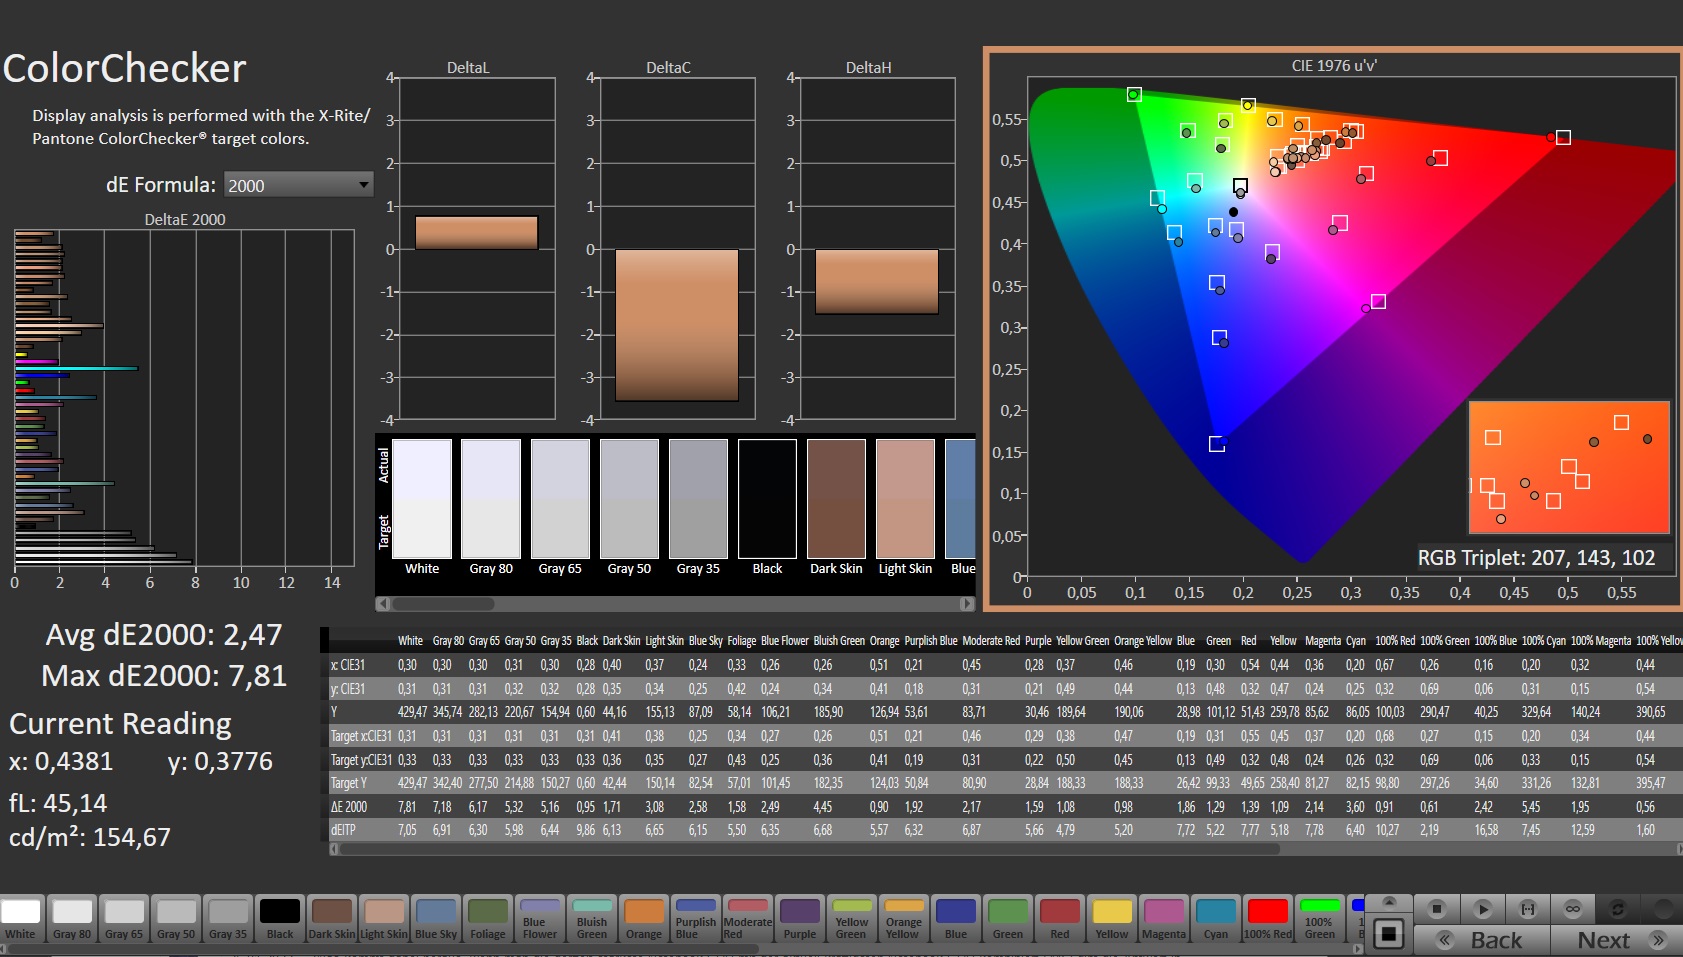
ΔE ColorChecker Calman: 2.47 | ∀{0.5-29.43 Ø4.71}
calibrated: 0.66
ΔE Greyscale Calman: 4.4 | ∀{0.09-98 Ø4.96}
86.2% AdobeRGB 1998 (Argyll 3D)
99.8% sRGB (Argyll 3D)
97% Display P3 (Argyll 3D)
Gamma: 2.129
CCT: 7197 K
| MSI Titan GT77 12UHS 4k AU Optronics B173ZAN06.1, IPS, 3840x2160, 17.3" | Razer Blade 17 Early 2022 AU Optronics B173ZAN06.9, IPS, 3840x2160, 17.3" | Alienware x17 R2 P48E AU Optronics B173HAN, IPS, 1920x1080, 17.3" | Schenker XMG Ultra 17 Rocket Lake AU Optronics B173HAN05.1, IPS, 1920x1080, 17.3" | MSI Titan GT77 12UHS Sharp SHP1544 LQ173M1JW08, IPS-Level, 1920x1080, 17.3" | |
|---|---|---|---|---|---|
| Display | 1% | -9% | -16% | -14% | |
| Display P3 Coverage (%) | 97 | 99.4 2% | 79.2 -18% | 69.8 -28% | 70.8 -27% |
| sRGB Coverage (%) | 99.8 | 100 0% | 99.8 0% | 97.2 -3% | 98.9 -1% |
| AdobeRGB 1998 Coverage (%) | 86.2 | 87.3 1% | 79.6 -8% | 72 -16% | 73 -15% |
| Response Times | -27% | -109% | -44% | 19% | |
| Response Time Grey 50% / Grey 80% * (ms) | 5.2 ? | 7.5 ? -44% | 12.4 ? -138% | 5.6 ? -8% | 3.03 ? 42% |
| Response Time Black / White * (ms) | 5.1 ? | 5.6 ? -10% | 9.2 ? -80% | 9.2 ? -80% | 5.28 ? -4% |
| PWM Frequency (Hz) | |||||
| Screen | 28% | 3% | 9% | -17% | |
| Brightness middle (cd/m²) | 418 | 503 20% | 365.4 -13% | 306 -27% | 280 -33% |
| Brightness (cd/m²) | 401 | 486 21% | 344 -14% | 299 -25% | 275 -31% |
| Brightness Distribution (%) | 91 | 84 -8% | 85 -7% | 93 2% | 79 -13% |
| Black Level * (cd/m²) | 0.48 | 0.44 8% | 0.29 40% | 0.22 54% | 0.4 17% |
| Contrast (:1) | 871 | 1143 31% | 1260 45% | 1391 60% | 700 -20% |
| Colorchecker dE 2000 * | 2.47 | 1.08 56% | 3.17 -28% | 1.92 22% | 2.1 15% |
| Colorchecker dE 2000 max. * | 7.81 | 4.54 42% | 7.69 2% | 4.78 39% | 5.83 25% |
| Colorchecker dE 2000 calibrated * | 0.66 | 0.6 9% | 0.51 23% | 1.34 -103% | 1.58 -139% |
| Greyscale dE 2000 * | 4.4 | 1.3 70% | 5.3 -20% | 2 55% | 3.3 25% |
| Gamma | 2.129 103% | 2.151 102% | 2.18 101% | 2.153 102% | 2.13 103% |
| CCT | 7197 90% | 6541 99% | 5879 111% | 6738 96% | 7060 92% |
| Color Space (Percent of AdobeRGB 1998) (%) | 72 | ||||
| Color Space (Percent of sRGB) (%) | 93 | ||||
| Totalt genomsnitt (program/inställningar) | 1% /
14% | -38% /
-15% | -17% /
-4% | -4% /
-11% |
* ... mindre är bättre
4K-skärmen täcker nästan hela sRGB (99,8 %) och DCI-P3 (97 %) färgområdet och upp till 86 % av AdobeRGB. FHD-panelen på syskonmodellen Recension av MSI Titan GT77 12UHS - Praktexempel av Alder Lake-HX med obehindrad prestanda i skrivbordsklass kan inte hänga med i detta avseende (sRGB: 97 %, AdobeRGB: 73 %, DCI-P3: 71 %). Detta innebär att 4K-panelen är det bästa alternativet om färgprecisionen är viktig för dig
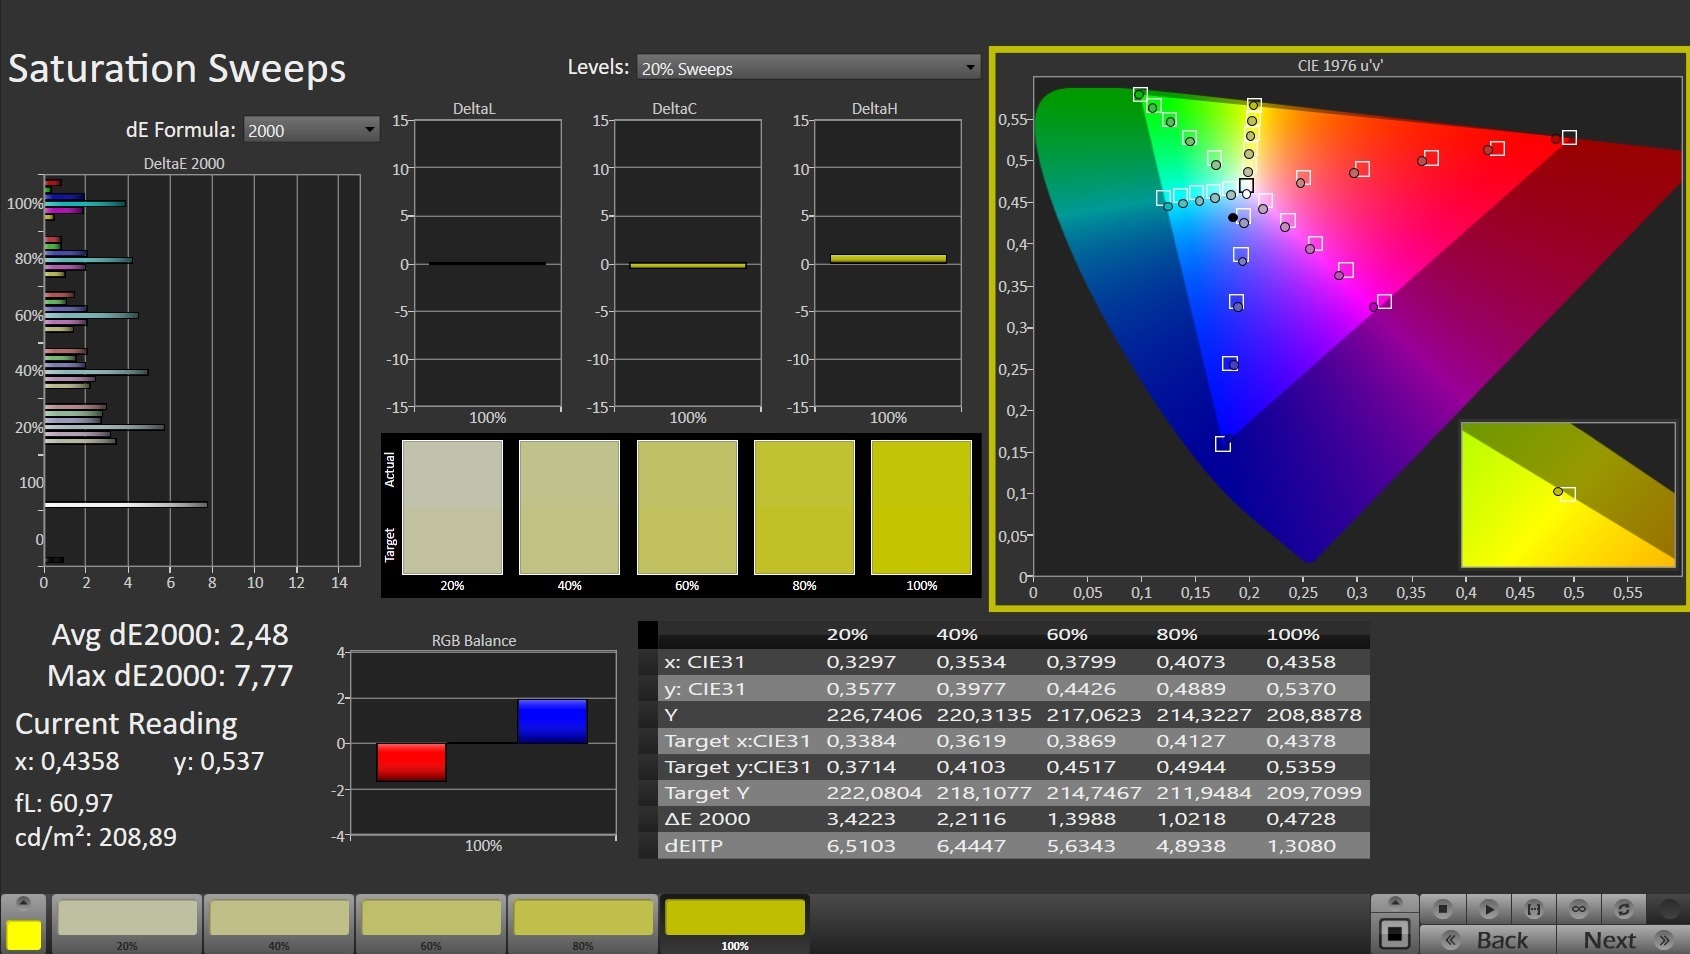
Skärmarna har redan från början en bra färgåtergivning: UHD- och FHD-skärmarna uppfyller det önskade värdet (Delta E < 3) med sina icke-märkbara färgskillnader på 2,47 respektive 2,1. Kalibrering av skärmarna gjorde deras gråskalereproduktion mer balanserad och minskade färgskillnaderna till 0,66 respektive 1,58. I infoboxen för varje skärm finns en länk för att ladda ner de färgprofiler som vi har skapat gratis.
Obs: Med MSI True Color-programvaran kan du justera färgerna för att bättre passa en färgskala eller ett definierat användningsscenario. Vi valde förinställningen "Display P3".

Visa svarstider
| ↔ Svarstid svart till vitt | ||
|---|---|---|
| 5.1 ms ... stiga ↗ och falla ↘ kombinerat | ↗ 1.5 ms stiga |  |
| ↘ 3.6 ms hösten | ||
| Skärmen visar väldigt snabba svarsfrekvenser i våra tester och borde vara mycket väl lämpad för fartfyllt spel. I jämförelse sträcker sig alla testade enheter från 0.1 (minst) till 240 (maximalt) ms. » 18 % av alla enheter är bättre. Det betyder att den uppmätta svarstiden är bättre än genomsnittet av alla testade enheter (19.8 ms). | ||
| ↔ Svarstid 50 % grått till 80 % grått | ||
| 5.2 ms ... stiga ↗ och falla ↘ kombinerat | ↗ 1.2 ms stiga | 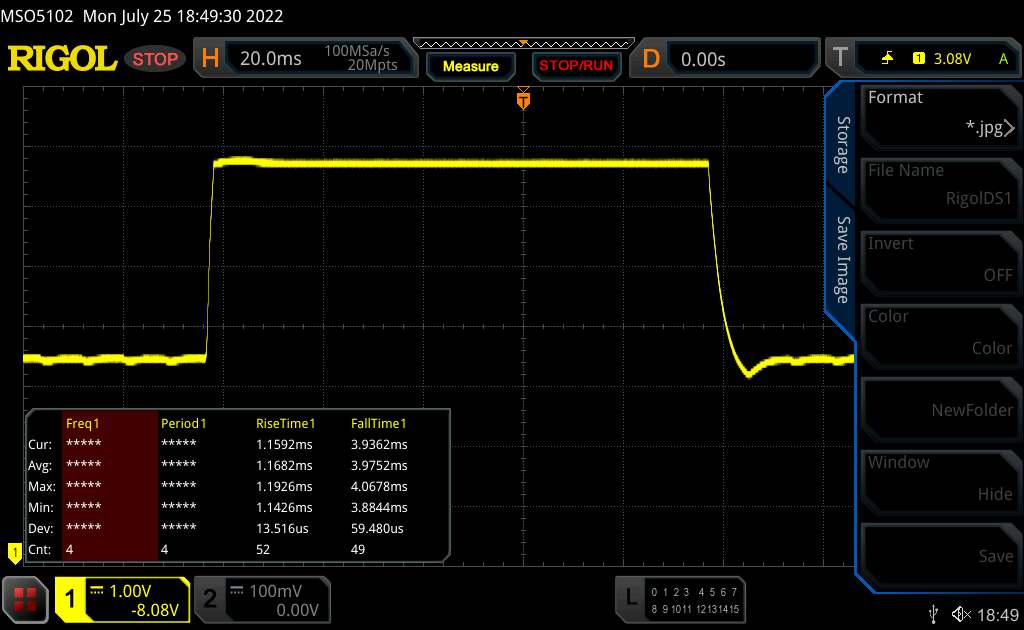 |
| ↘ 4 ms hösten | ||
| Skärmen visar väldigt snabba svarsfrekvenser i våra tester och borde vara mycket väl lämpad för fartfyllt spel. I jämförelse sträcker sig alla testade enheter från 0.165 (minst) till 636 (maximalt) ms. » 18 % av alla enheter är bättre. Det betyder att den uppmätta svarstiden är bättre än genomsnittet av alla testade enheter (30.9 ms). | ||
Skärmflimmer / PWM (Puls-Width Modulation)
| Skärmflimmer / PWM upptäcktes inte | 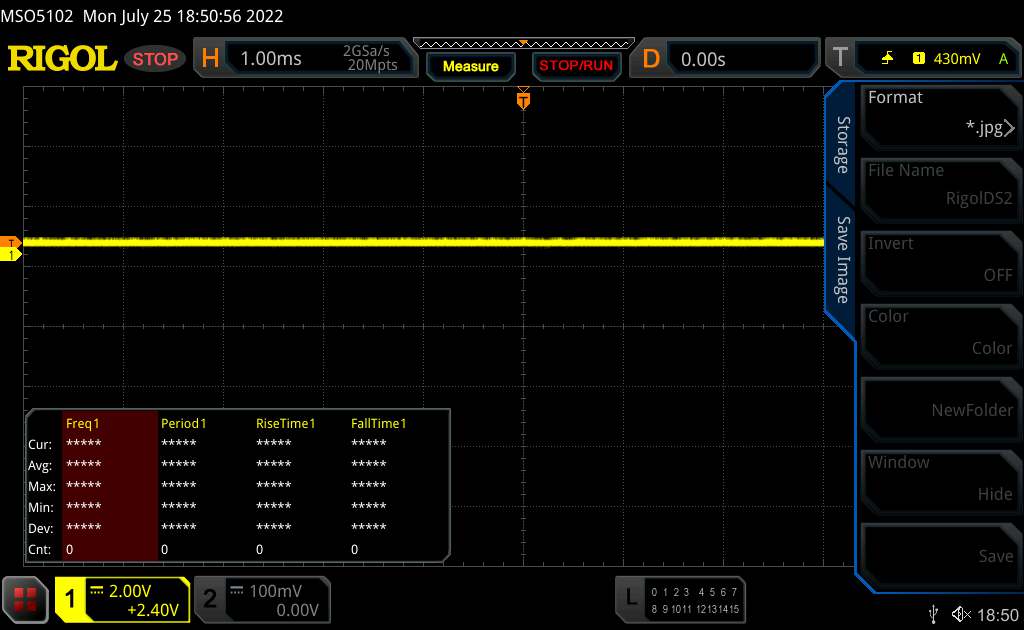 | ||
Som jämförelse: 52 % av alla testade enheter använder inte PWM för att dämpa skärmen. Om PWM upptäcktes mättes ett medelvärde av 7748 (minst: 5 - maximum: 343500) Hz. | |||
IPS-panelen har en stabil betraktningsvinkel och kan därför lätt ses från alla positioner. Skärmen är också mycket läsbar utomhus.

Felaktig färgåtergivning på grund av programvaruproblem
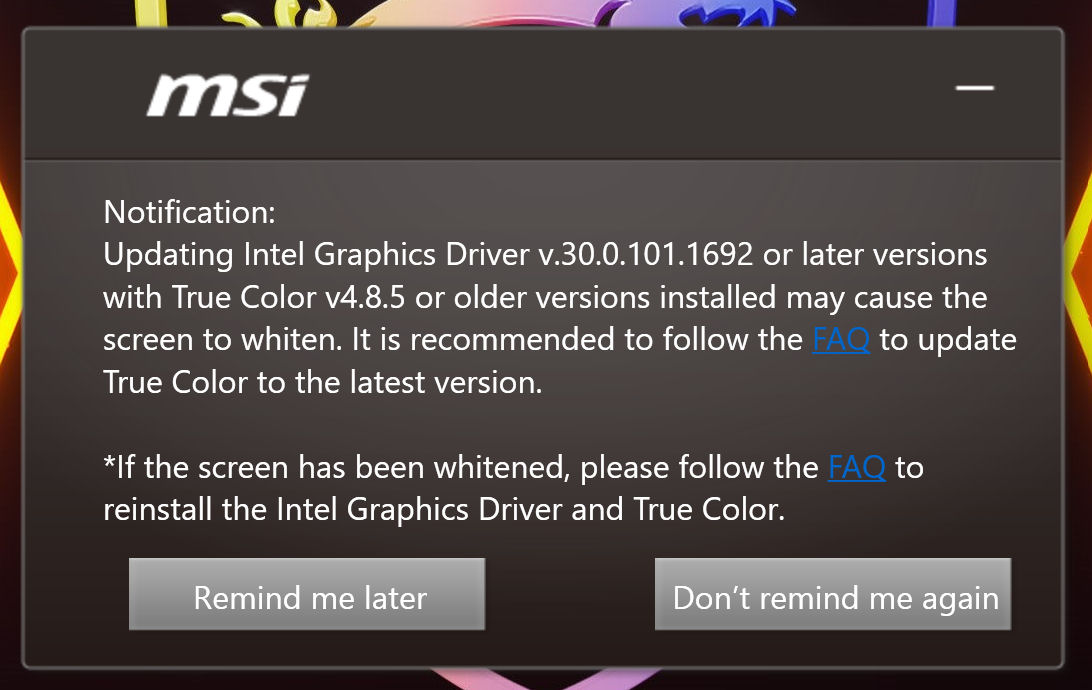
Vissa kombinationer av True Color-programvaran och iGPU-drivrutinen kan leda till felaktig återgivning av bilder. När detta händer kommer alla färger som visas att verka förvrängda och blekta. MSI rekommenderar att du helt avinstallerar och sedan installerar om båda komponenterna. Efter att ha gjort ett försök fann vi att denna metod löser problemet.
Prestanda - Ampere och Alder Lake ger mycket kraft.
Med Titan GT77 12UHS har MSI en mycket kraftfull 17,3-tums bärbar dator i sitt produktsortiment som fungerar bra i alla typer av krävande användningssituationer.
Provningsvillkor
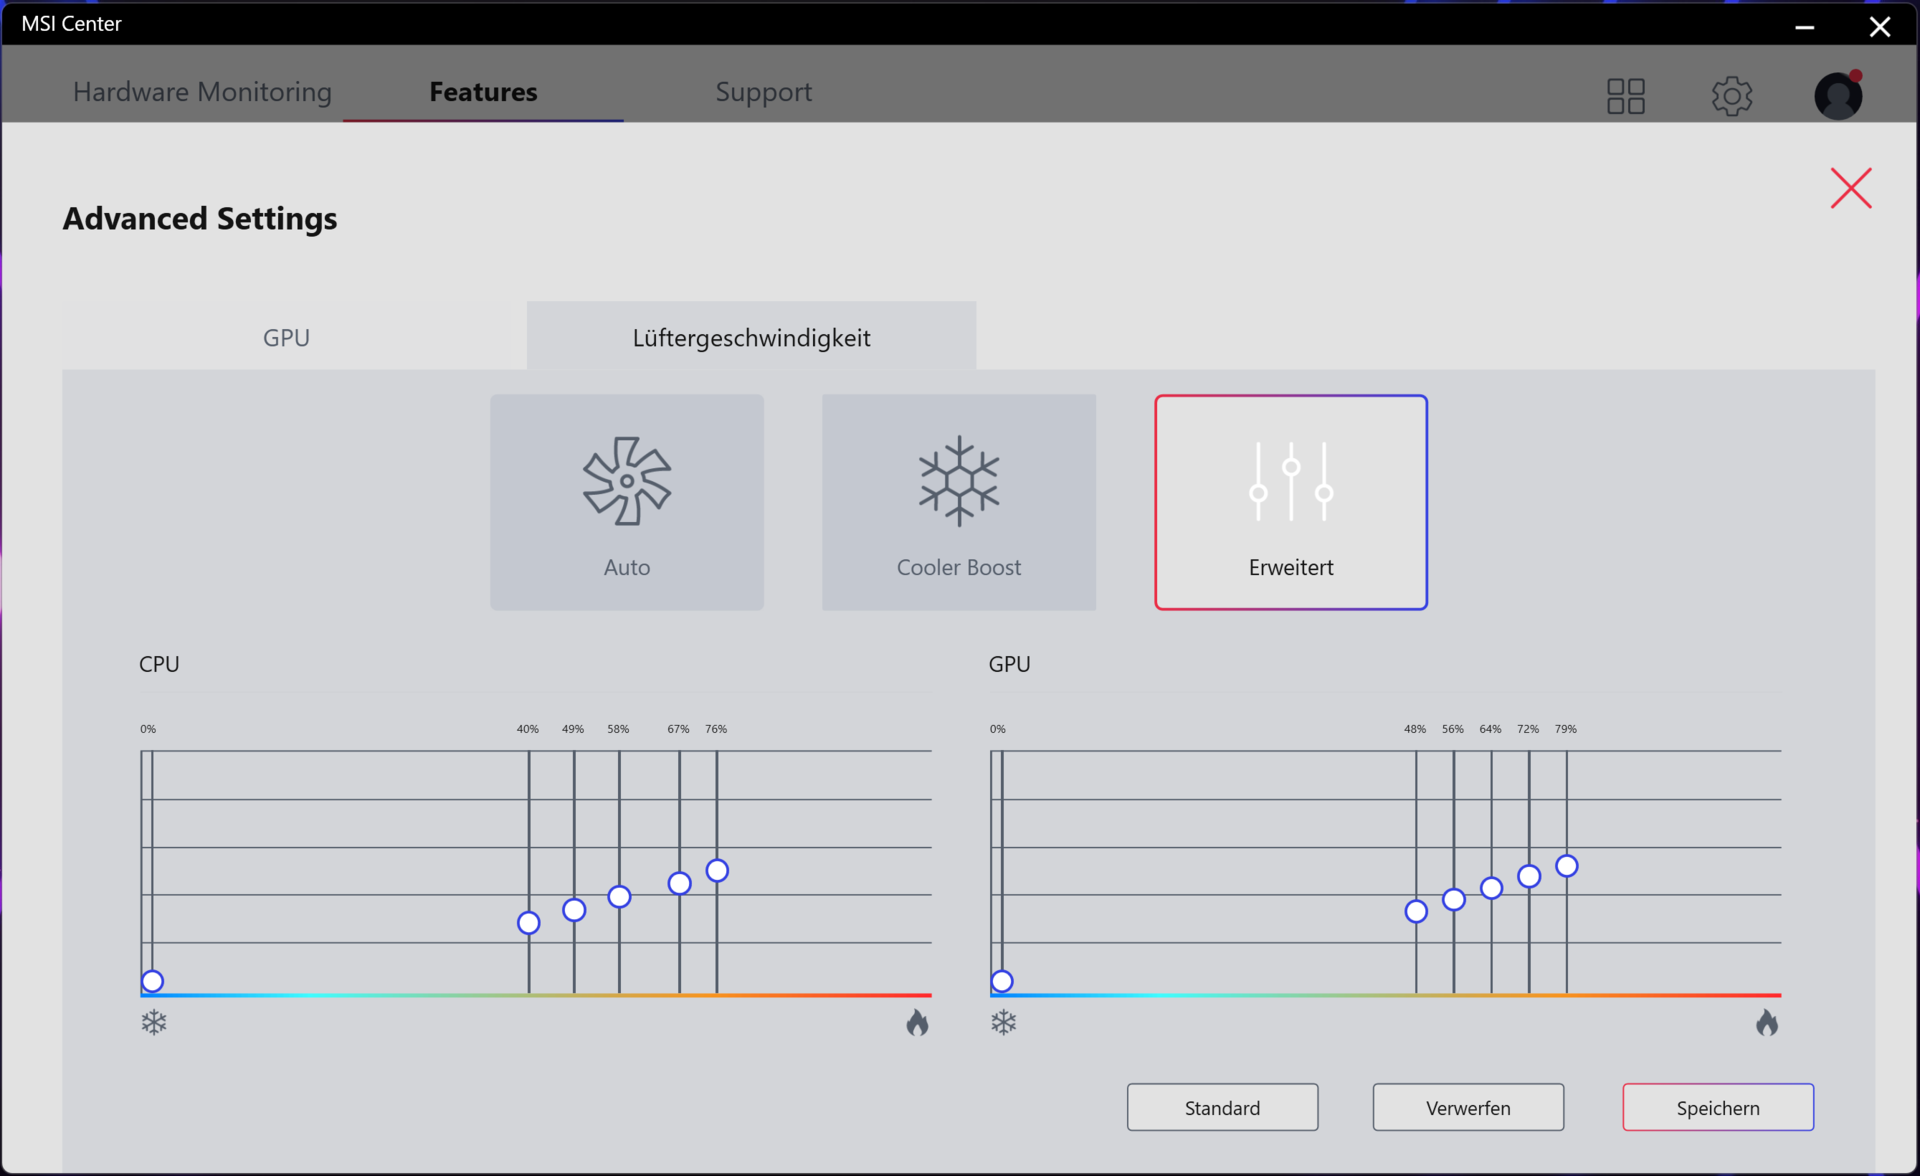
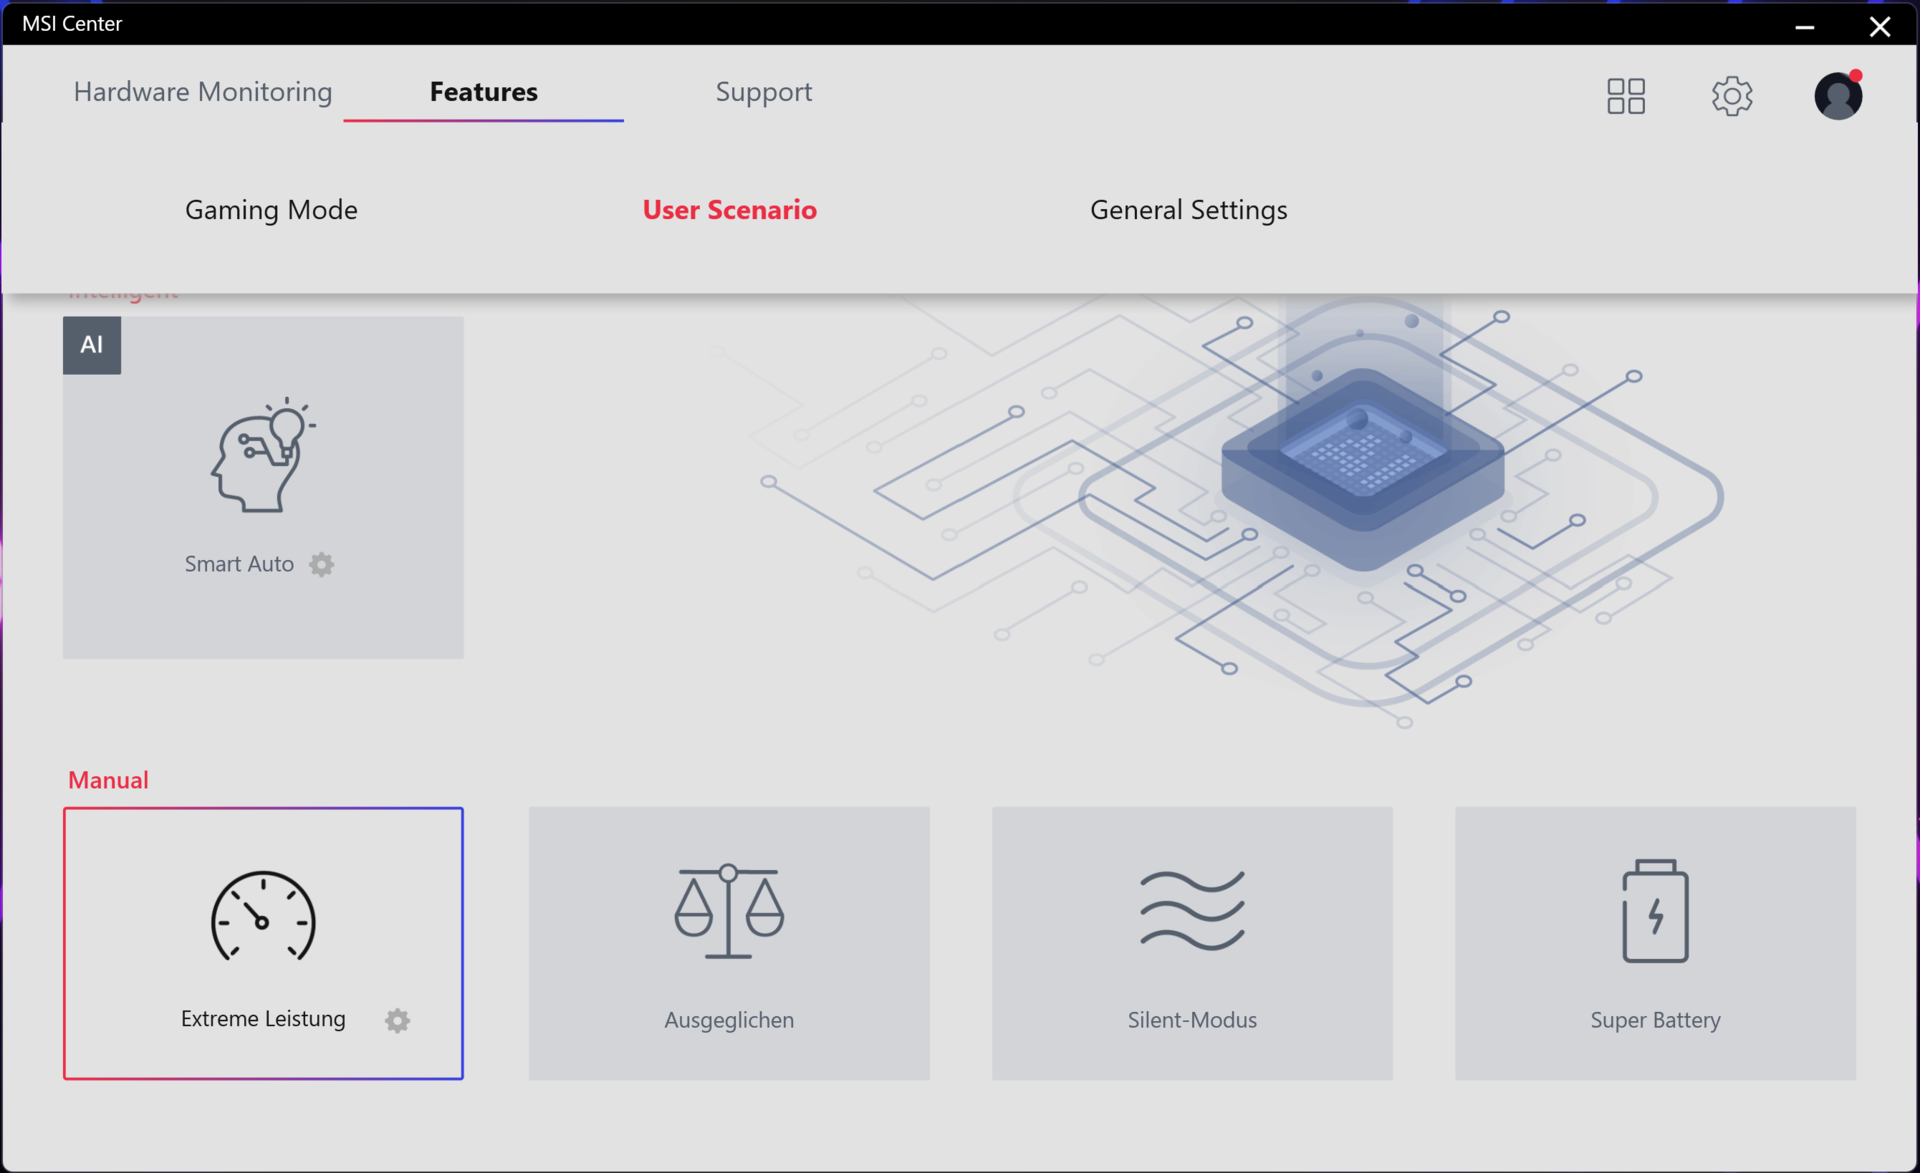
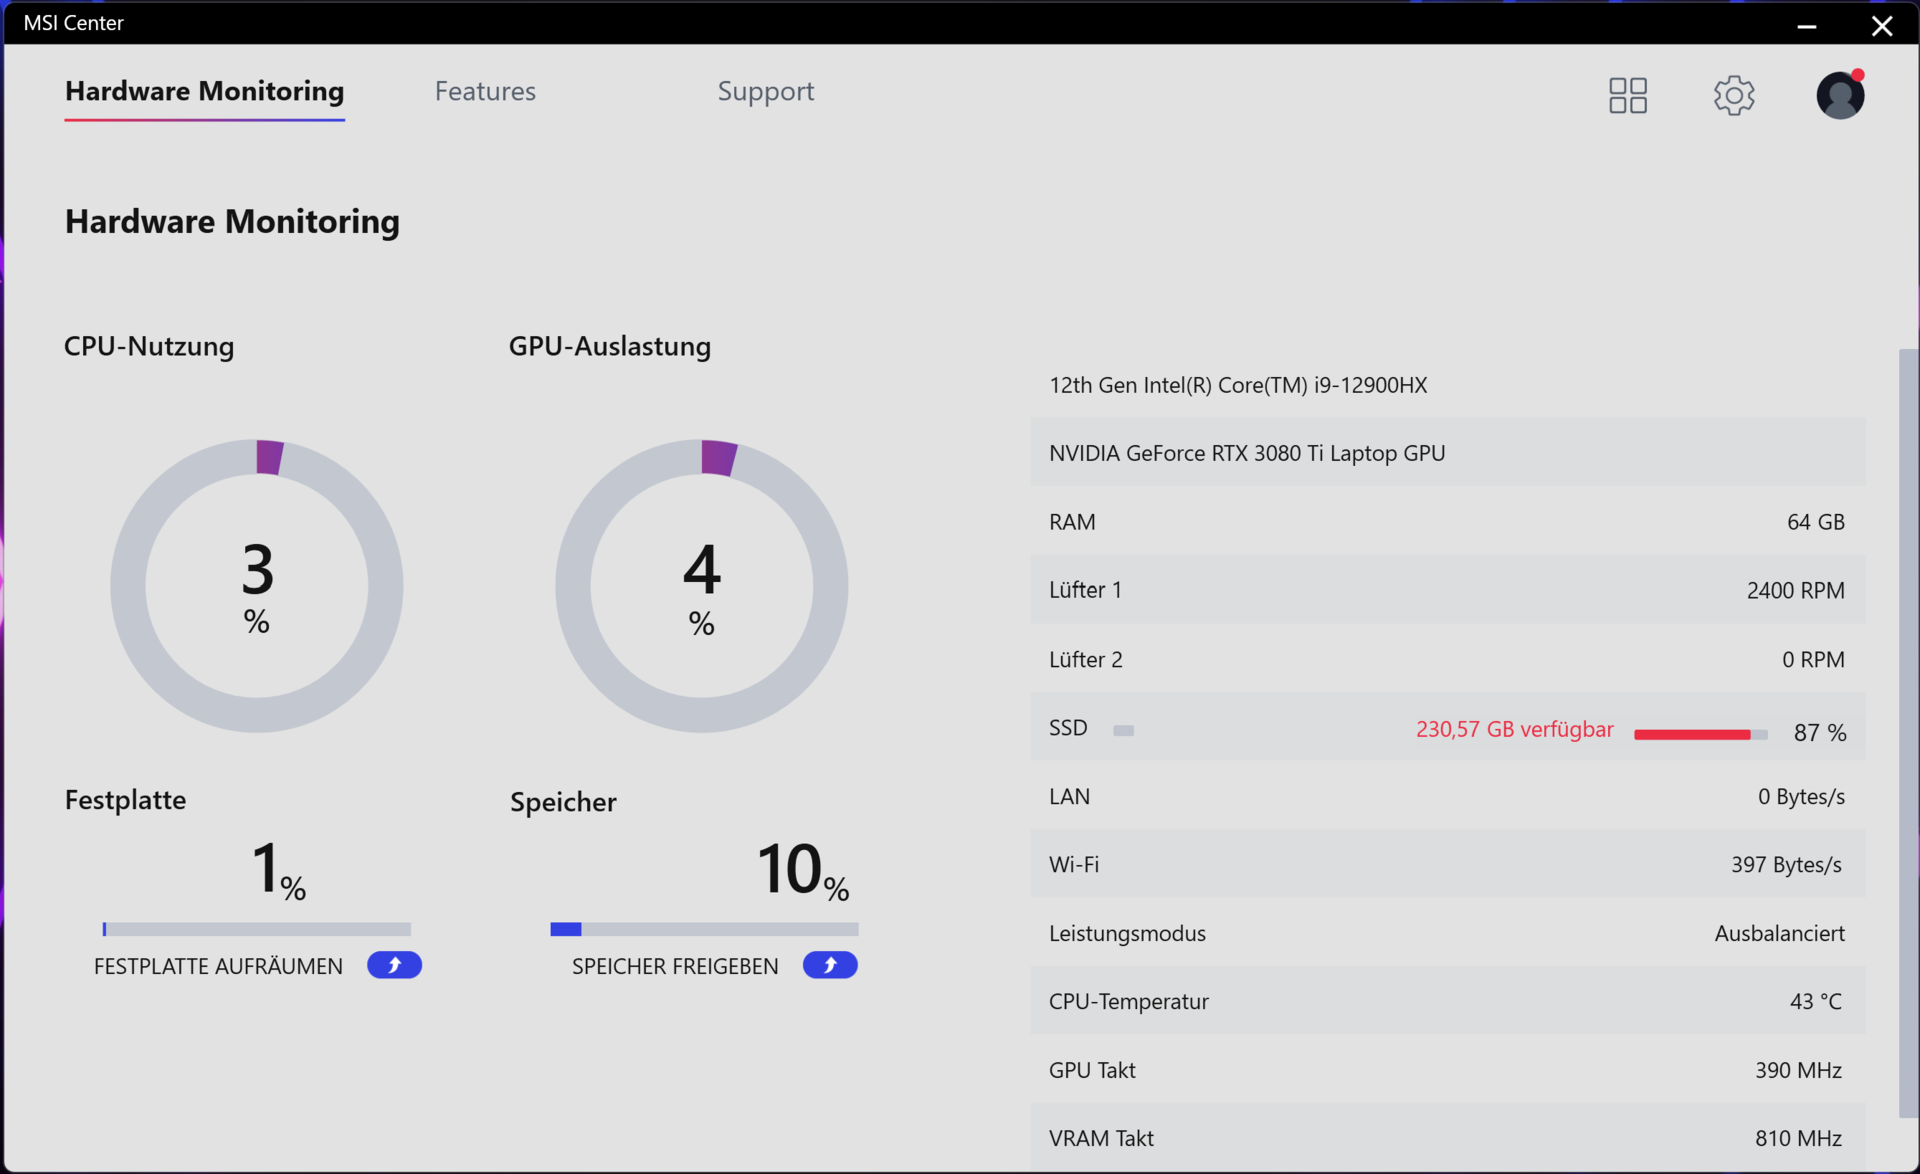
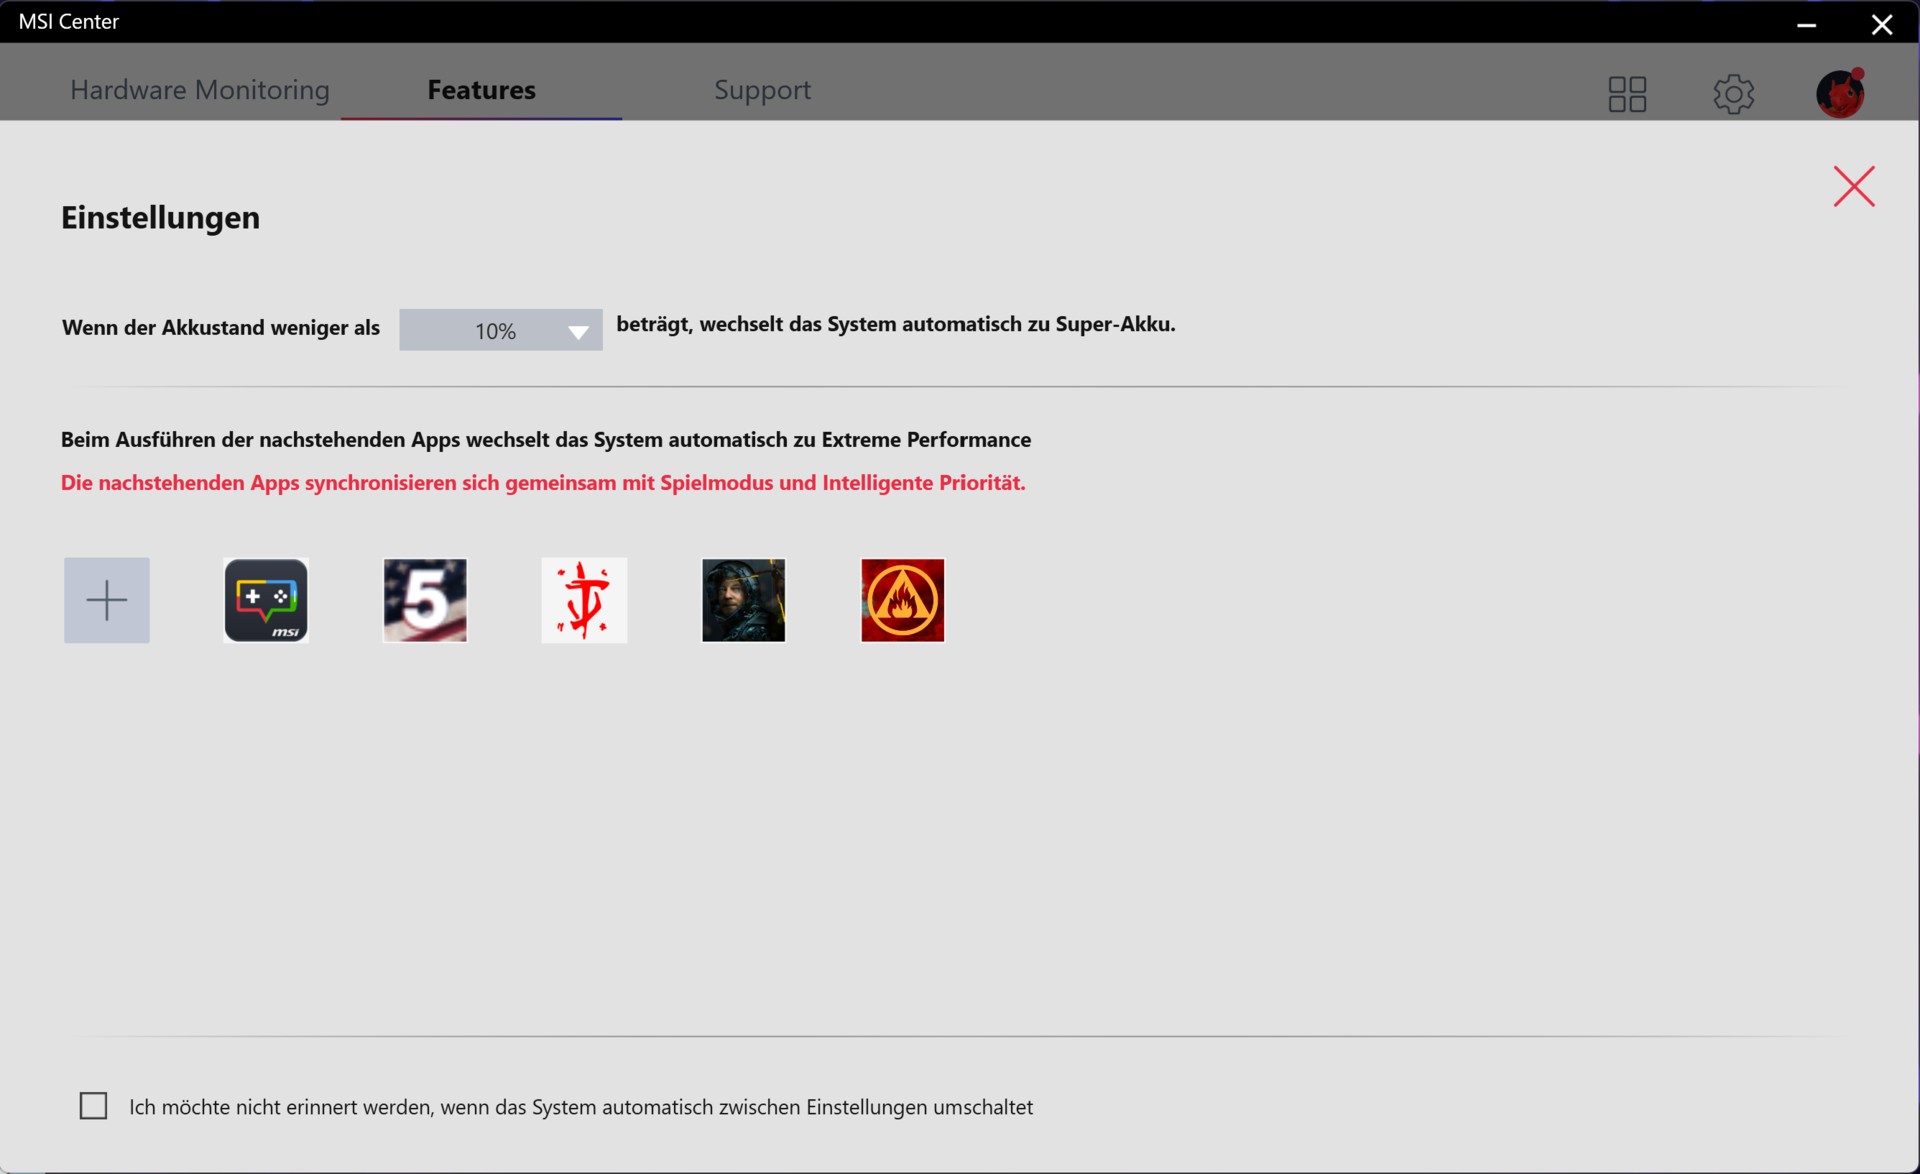
Du kan växla mellan fyra prestandaprofiler med hjälp av det förinstallerade MSI Center (se bilder) eller genom att trycka på tangentkombinationen Fn+F7. Om den högre AI-baserade funktionen "Smart Auto" är aktiverad (som i vårt fall) väljer MSI Center automatiskt den lämpliga profilen för den aktuella situationen.
Vi testade FHD-modellen med dGPU-läget aktivt. Däremot var Nvidia Optimus aktiverat under vår granskning av den aktuella enheten. Därför är mätresultaten kanske inte alltid direkt jämförbara.
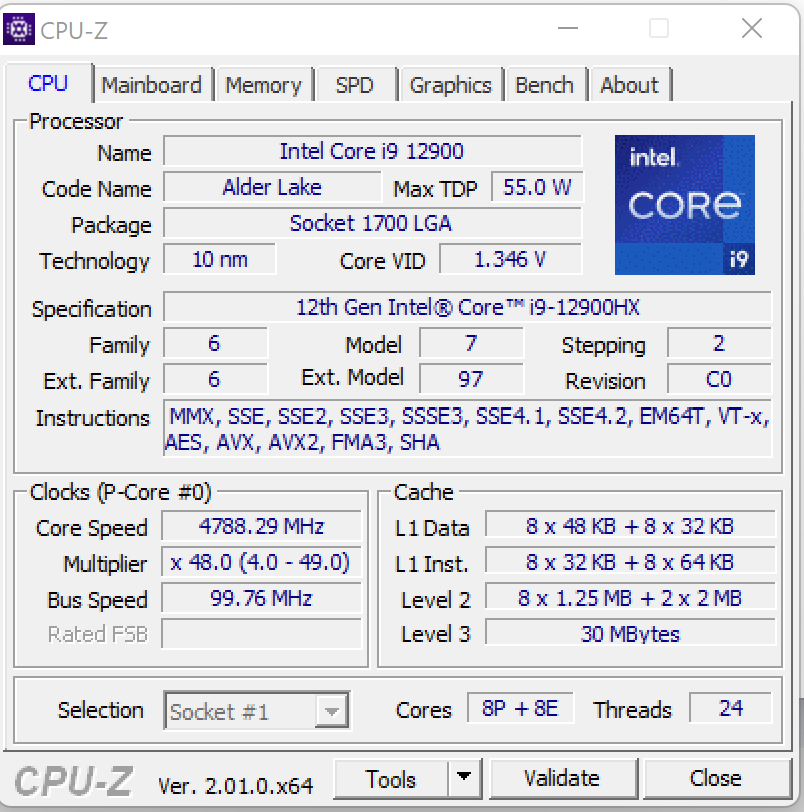
Processor
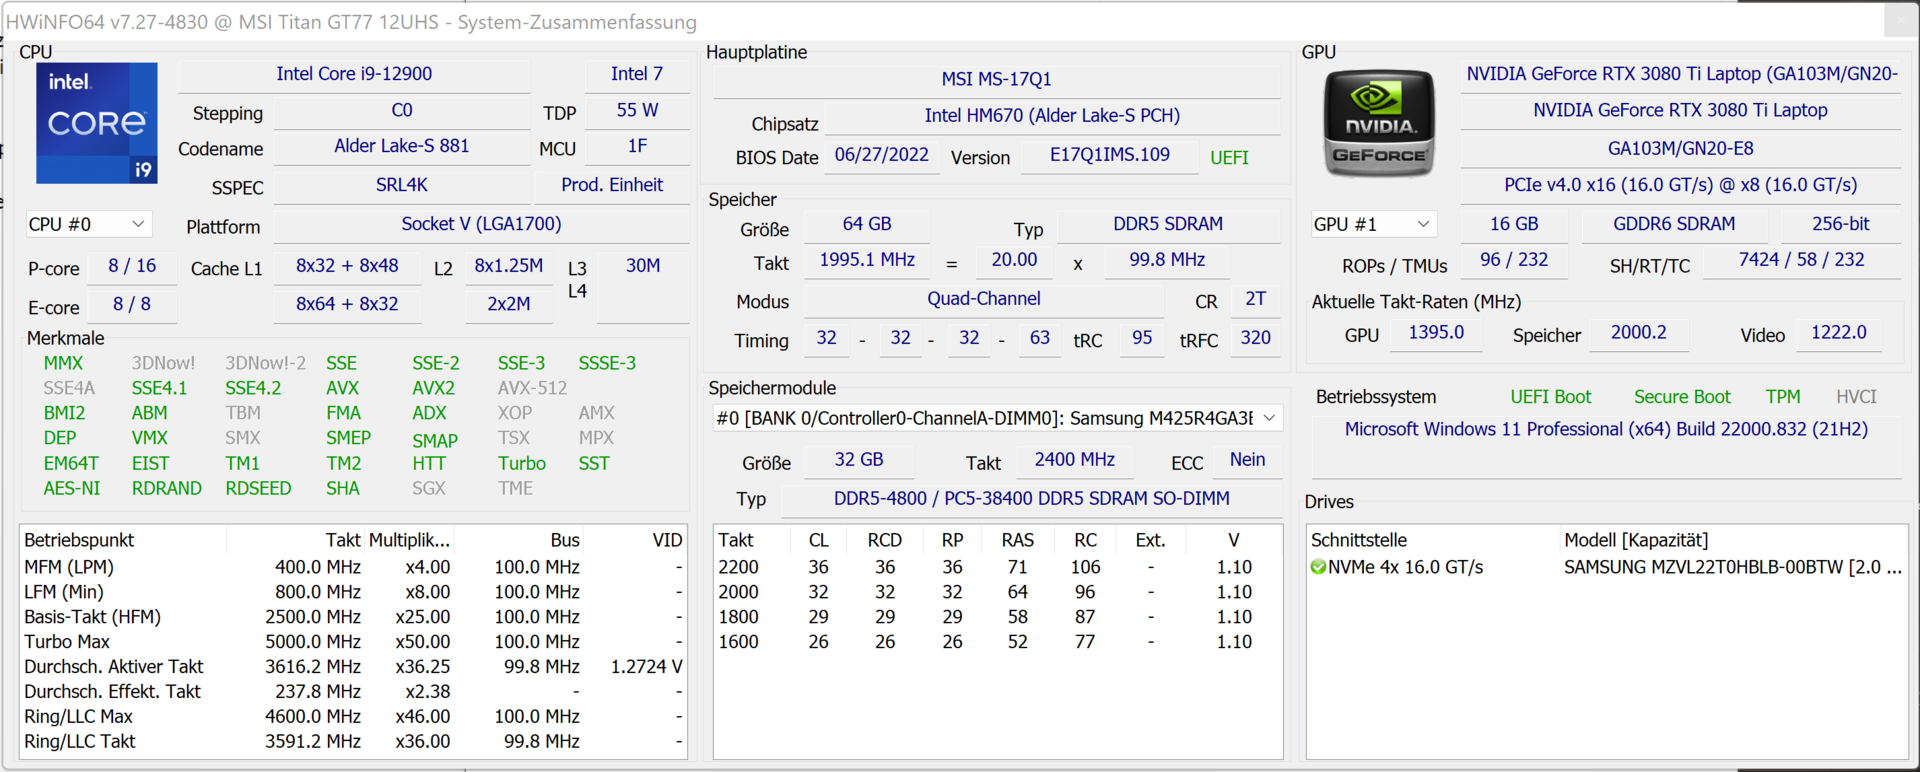
Core i9-12900HX-processorn (Alder Lake) består av åtta prestandakärnor (Hyper-Threading, 2,3 till 5 GHz) och åtta effektivitetskärnor (ingen Hyper-Threading, 1,7 till 3,6 GHz), vilket ger totalt 24 trådar.
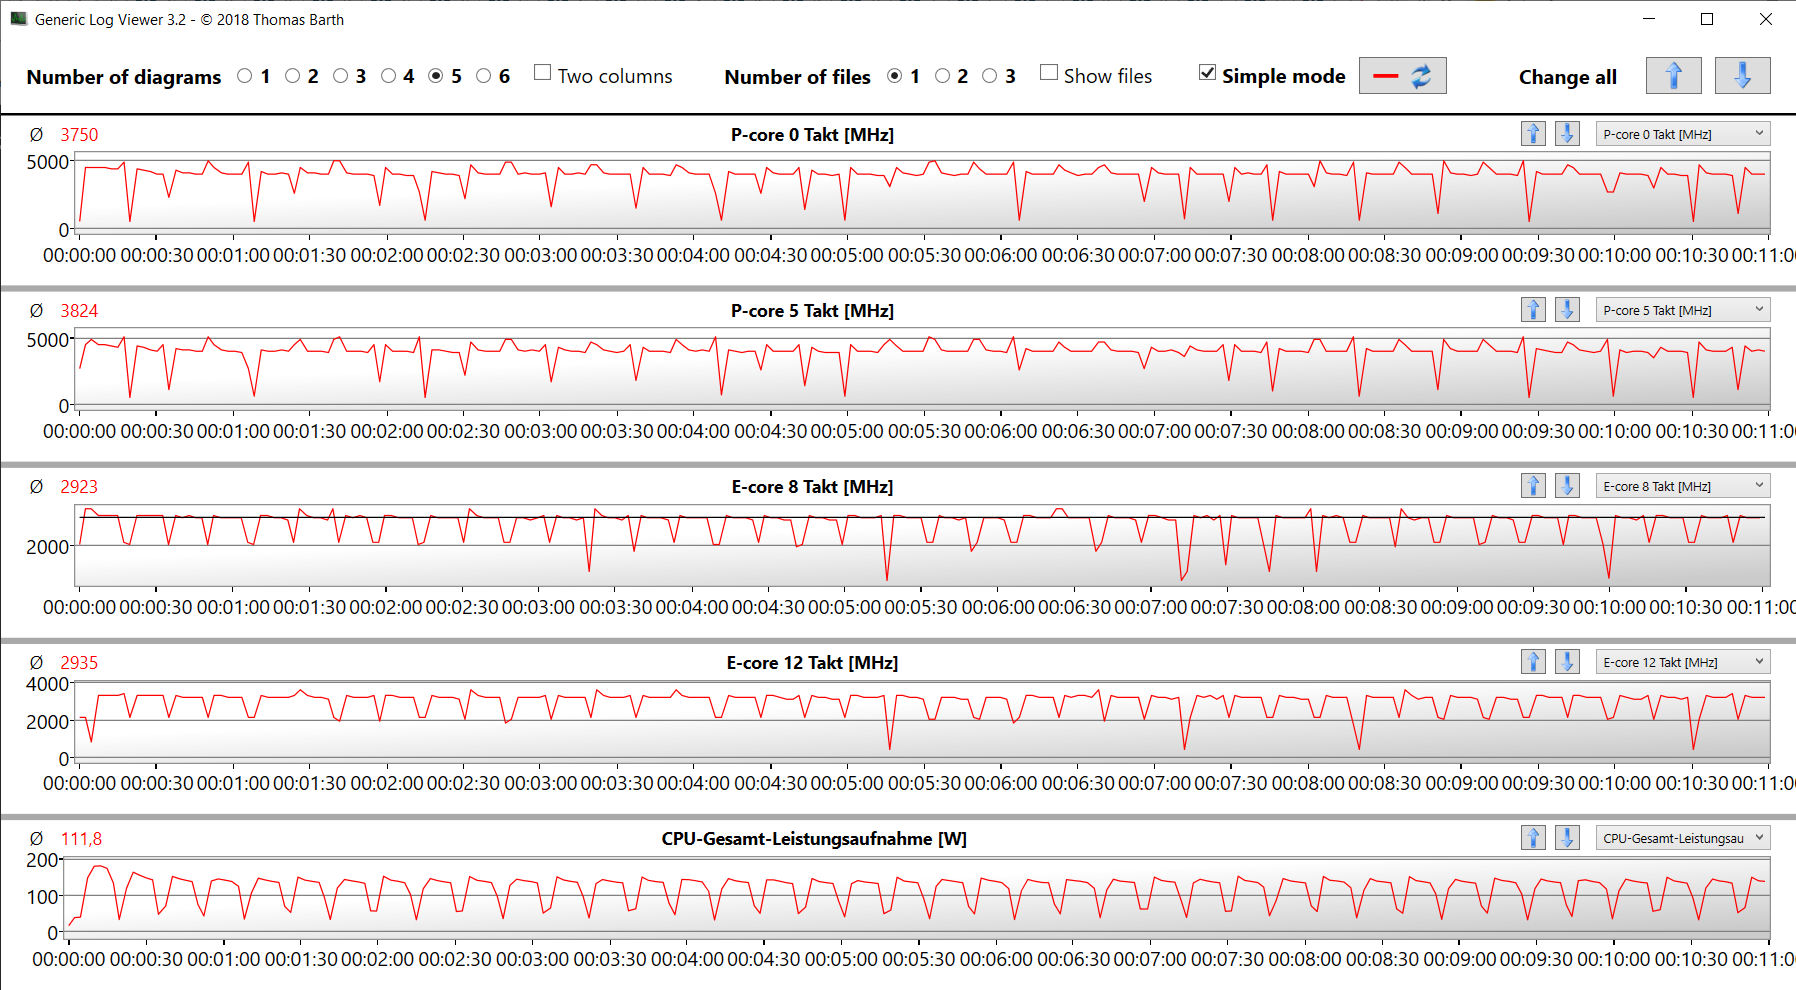
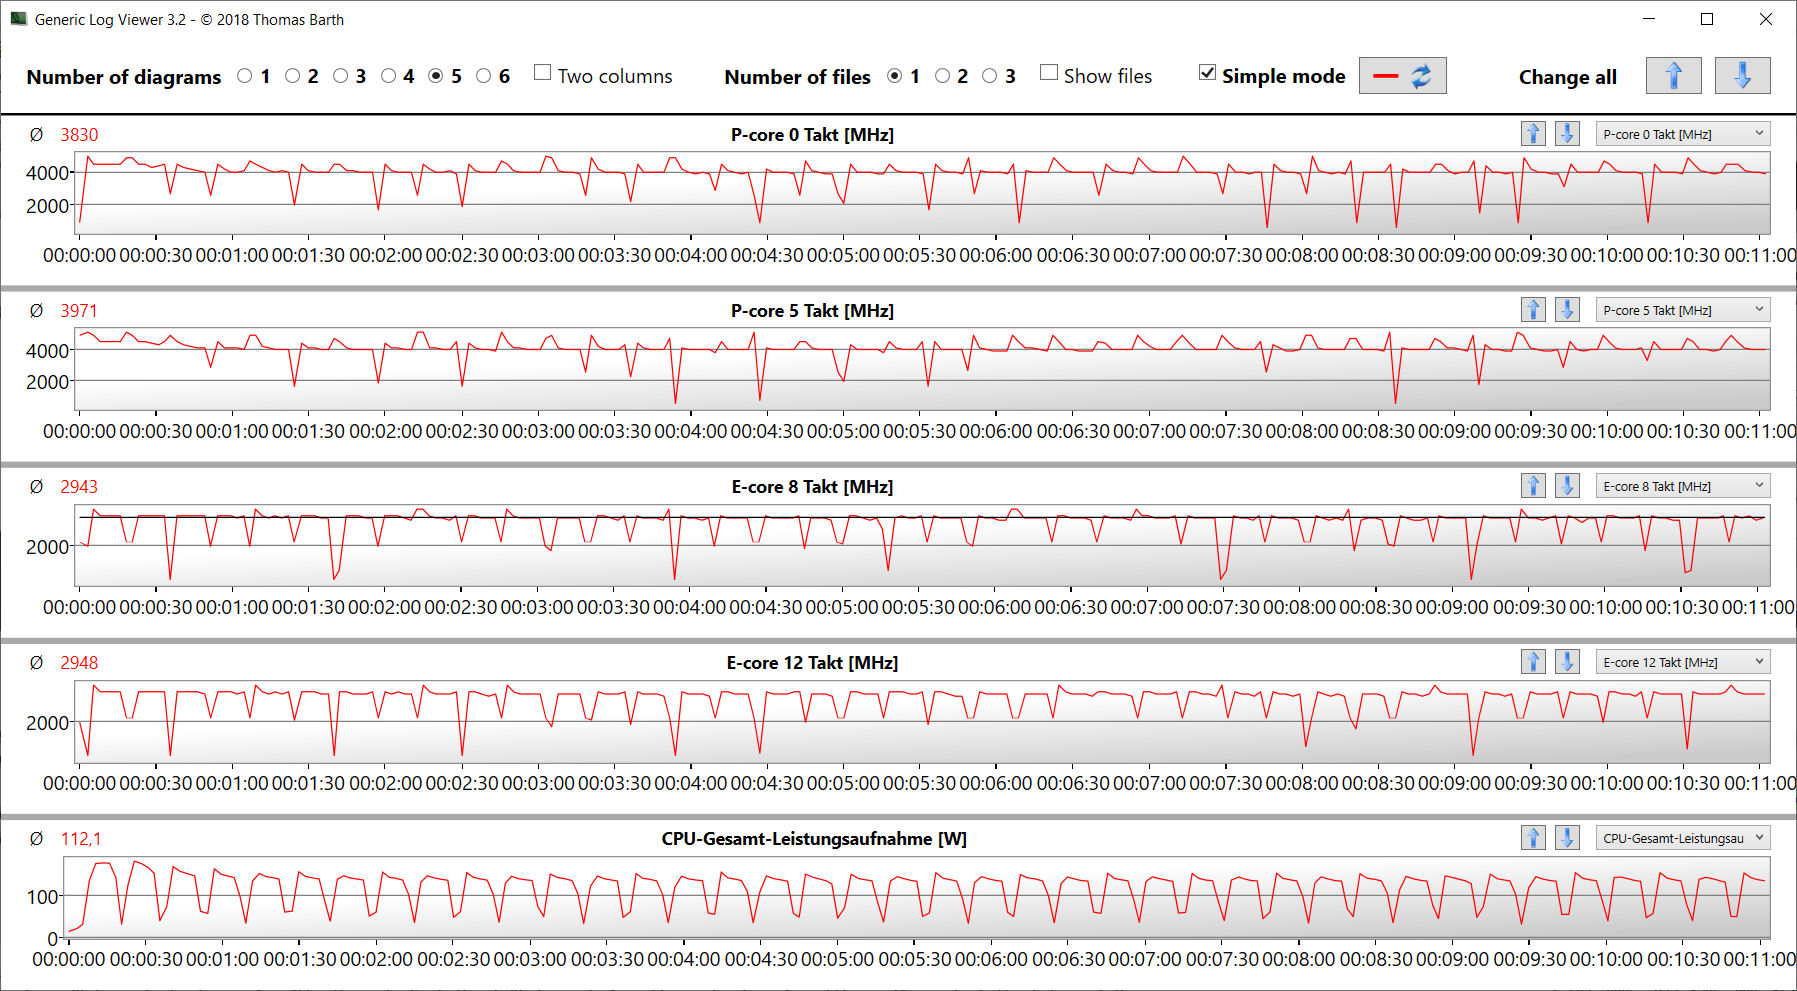
I Cinebench R15 slutförde processorn både multitrådstestet (P-kärnor: 4,4 GHz, E-kärnor: 3,3 GHz) och enkeltrådstestet (P-kärnor: 500 MHz till 5 GHz, E-kärnor: 400 MHz till 3,6 GHz) vid höga klockfrekvenser. Den presterade något långsammare på batteri.
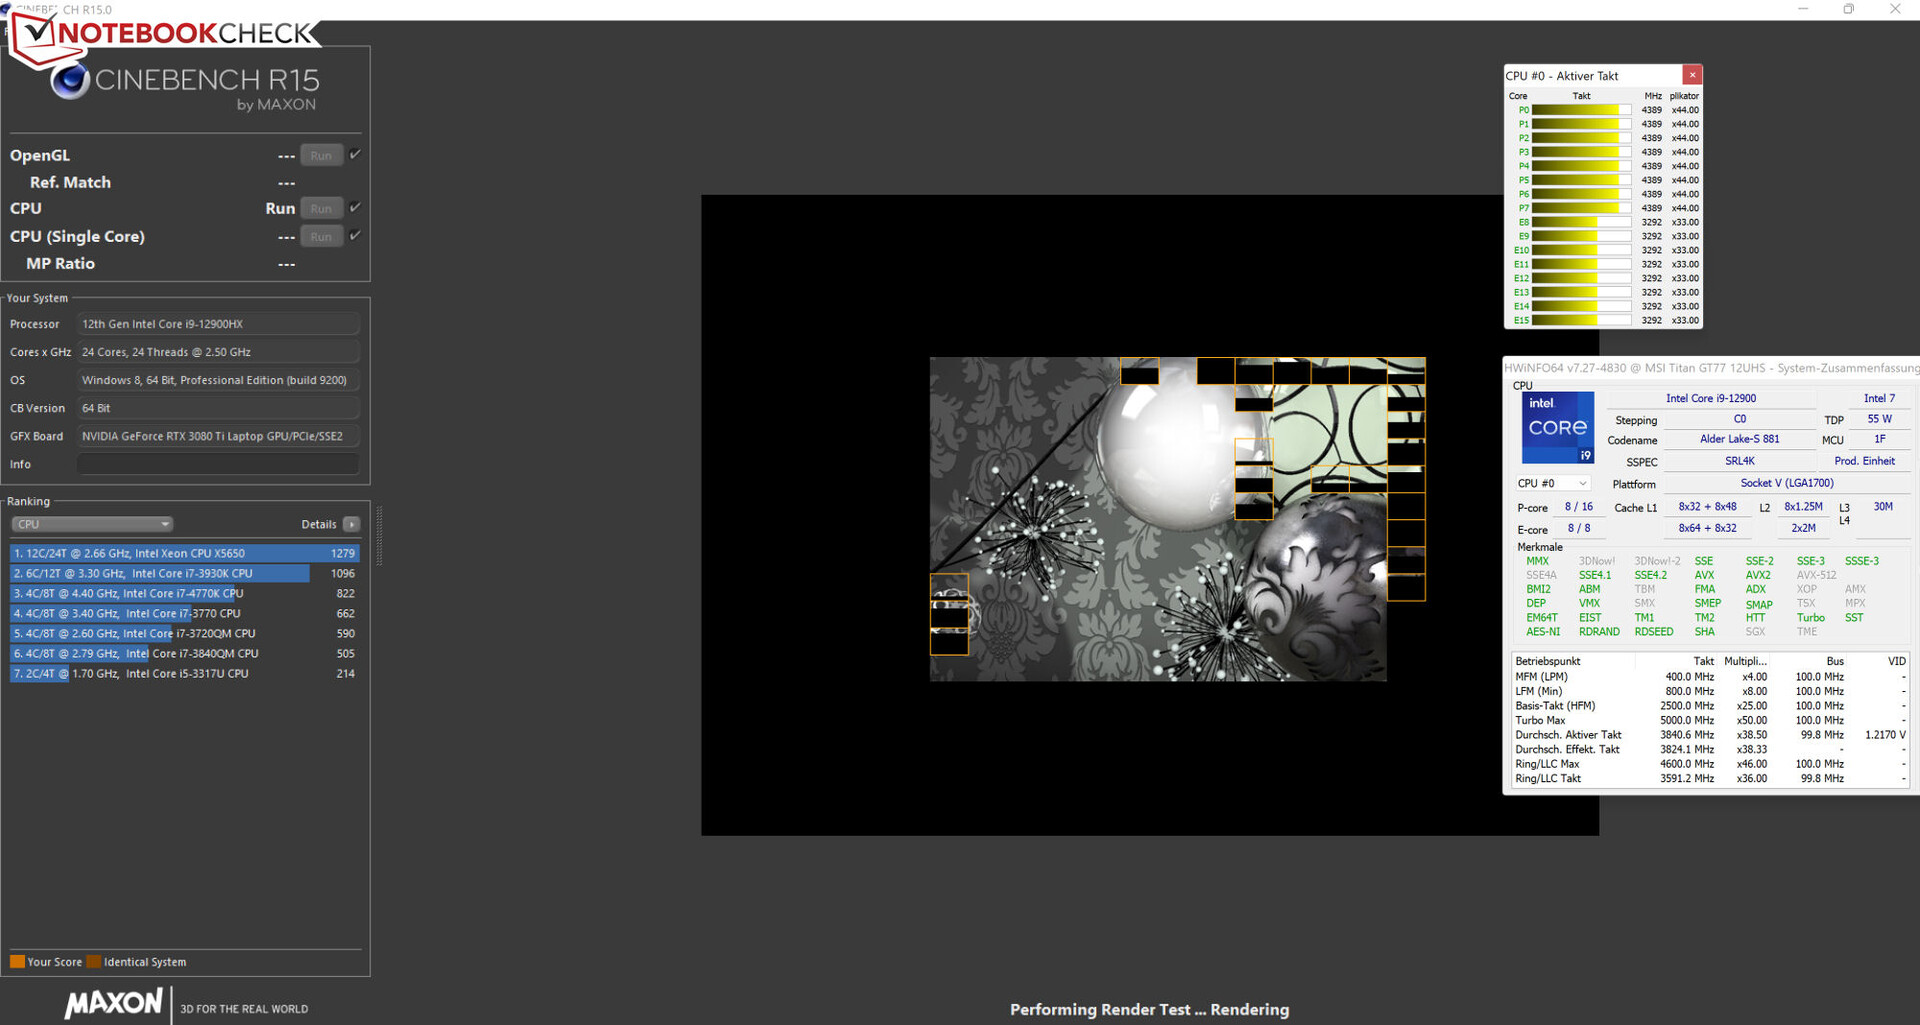
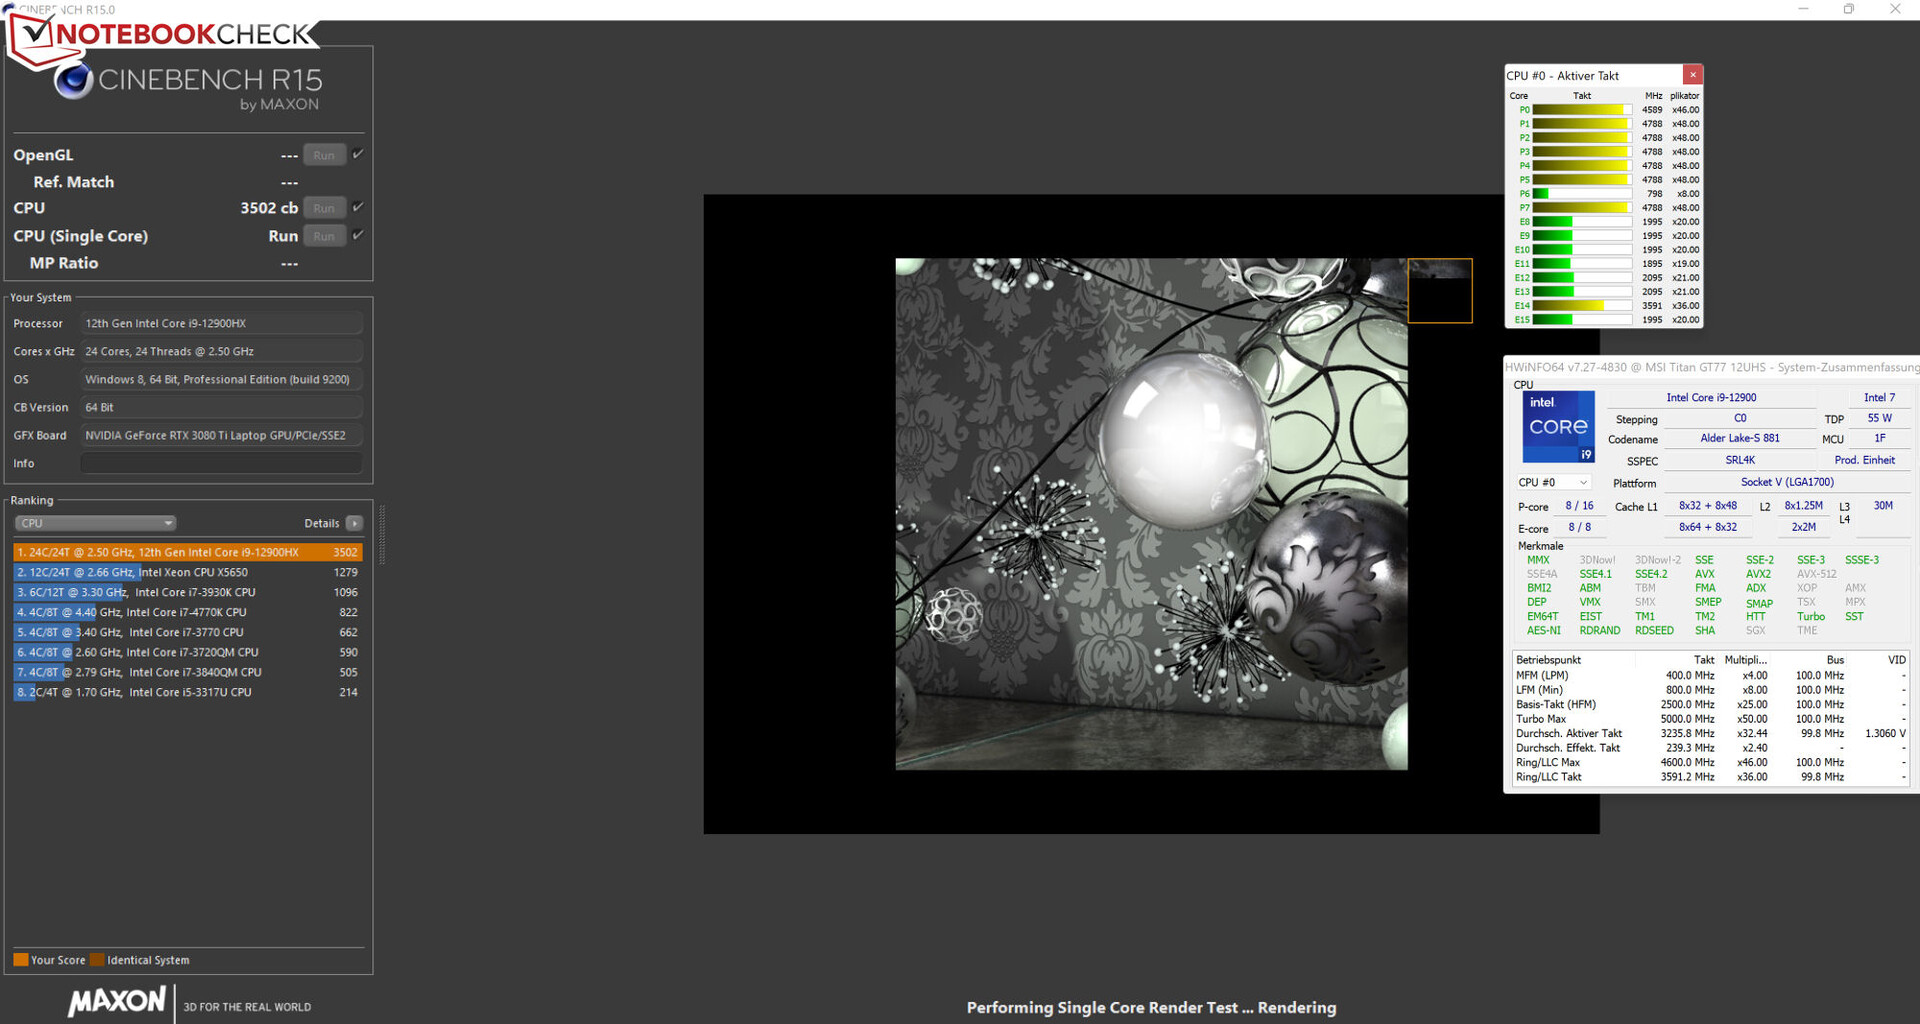
Cinebench 15 loop-testet visade att processorn kan köras med höga klockfrekvenser kontinuerligt. Genom att använda profilen "Extreme Performance" blev prestandan marginellt stabilare.
Cinebench R15 Multi continuous test
| CPU Performance rating - Percent | |
| Genomsnitt av klass Gaming | |
| MSI Titan GT77 12UHS 4k | |
| MSI Titan GT77 12UHS | |
| MSI Titan GT77 12UHS | |
| Genomsnitt Intel Core i9-12900HX | |
| Alienware x17 R2 P48E | |
| Schenker XMG Ultra 17 Rocket Lake | |
| Razer Blade 17 Early 2022 | |
| Cinebench R23 | |
| Multi Core | |
| Genomsnitt av klass Gaming (10488 - 42661, n=104, senaste 2 åren) | |
| MSI Titan GT77 12UHS 4k | |
| MSI Titan GT77 12UHS (4k, Extreme Leistung, Cooler Boost) | |
| MSI Titan GT77 12UHS | |
| Genomsnitt Intel Core i9-12900HX (18337 - 23482, n=8) | |
| Alienware x17 R2 P48E | |
| Schenker XMG Ultra 17 Rocket Lake | |
| Razer Blade 17 Early 2022 | |
| Single Core | |
| Genomsnitt av klass Gaming (1601 - 2415, n=104, senaste 2 åren) | |
| MSI Titan GT77 12UHS 4k | |
| Genomsnitt Intel Core i9-12900HX (1897 - 1936, n=8) | |
| MSI Titan GT77 12UHS | |
| MSI Titan GT77 12UHS (4k, Extreme Leistung, Cooler Boost) | |
| Razer Blade 17 Early 2022 | |
| Alienware x17 R2 P48E | |
| Schenker XMG Ultra 17 Rocket Lake | |
| Cinebench R20 | |
| CPU (Multi Core) | |
| Genomsnitt av klass Gaming (4029 - 16433, n=103, senaste 2 åren) | |
| MSI Titan GT77 12UHS 4k | |
| MSI Titan GT77 12UHS (4k, Extreme Leistung, Cooler Boost) | |
| MSI Titan GT77 12UHS | |
| Genomsnitt Intel Core i9-12900HX (7037 - 9042, n=8) | |
| Alienware x17 R2 P48E | |
| Schenker XMG Ultra 17 Rocket Lake | |
| Razer Blade 17 Early 2022 | |
| CPU (Single Core) | |
| Genomsnitt av klass Gaming (622 - 913, n=103, senaste 2 åren) | |
| MSI Titan GT77 12UHS 4k | |
| MSI Titan GT77 12UHS | |
| Genomsnitt Intel Core i9-12900HX (728 - 745, n=8) | |
| MSI Titan GT77 12UHS (4k, Extreme Leistung, Cooler Boost) | |
| Alienware x17 R2 P48E | |
| Razer Blade 17 Early 2022 | |
| Schenker XMG Ultra 17 Rocket Lake | |
| Cinebench R15 | |
| CPU Multi 64Bit | |
| Genomsnitt av klass Gaming (1578 - 6330, n=102, senaste 2 åren) | |
| MSI Titan GT77 12UHS 4k | |
| MSI Titan GT77 12UHS (4k, Extreme Leistung, Cooler Boost) | |
| MSI Titan GT77 12UHS | |
| Genomsnitt Intel Core i9-12900HX (2830 - 3652, n=8) | |
| Alienware x17 R2 P48E | |
| Schenker XMG Ultra 17 Rocket Lake | |
| Razer Blade 17 Early 2022 | |
| CPU Single 64Bit | |
| Genomsnitt av klass Gaming (188.8 - 350, n=103, senaste 2 åren) | |
| MSI Titan GT77 12UHS 4k | |
| MSI Titan GT77 12UHS | |
| MSI Titan GT77 12UHS (4k, Extreme Leistung, Cooler Boost) | |
| Genomsnitt Intel Core i9-12900HX (274 - 282, n=8) | |
| Alienware x17 R2 P48E | |
| Razer Blade 17 Early 2022 | |
| Schenker XMG Ultra 17 Rocket Lake | |
| Blender - v2.79 BMW27 CPU | |
| Razer Blade 17 Early 2022 | |
| Schenker XMG Ultra 17 Rocket Lake | |
| Alienware x17 R2 P48E | |
| Genomsnitt Intel Core i9-12900HX (144 - 201, n=8) | |
| MSI Titan GT77 12UHS 4k | |
| Genomsnitt av klass Gaming (79 - 330, n=101, senaste 2 åren) | |
| MSI Titan GT77 12UHS | |
| MSI Titan GT77 12UHS (4k, Extreme Leistung, Cooler Boost) | |
| 7-Zip 18.03 | |
| 7z b 4 | |
| Genomsnitt av klass Gaming (33491 - 148086, n=102, senaste 2 åren) | |
| MSI Titan GT77 12UHS 4k | |
| MSI Titan GT77 12UHS (4k, Extreme Leistung, Cooler Boost) | |
| MSI Titan GT77 12UHS | |
| Genomsnitt Intel Core i9-12900HX (69778 - 88128, n=7) | |
| Alienware x17 R2 P48E | |
| Schenker XMG Ultra 17 Rocket Lake | |
| Razer Blade 17 Early 2022 | |
| 7z b 4 -mmt1 | |
| Genomsnitt av klass Gaming (4824 - 7436, n=102, senaste 2 åren) | |
| MSI Titan GT77 12UHS 4k | |
| Genomsnitt Intel Core i9-12900HX (6165 - 6358, n=7) | |
| MSI Titan GT77 12UHS | |
| MSI Titan GT77 12UHS | |
| Schenker XMG Ultra 17 Rocket Lake | |
| Razer Blade 17 Early 2022 | |
| Alienware x17 R2 P48E | |
| Geekbench 5.5 | |
| Multi-Core | |
| Genomsnitt av klass Gaming (6460 - 28263, n=102, senaste 2 åren) | |
| MSI Titan GT77 12UHS 4k | |
| MSI Titan GT77 12UHS (4k, Extreme Leistung, Cooler Boost) | |
| MSI Titan GT77 12UHS | |
| Genomsnitt Intel Core i9-12900HX (15116 - 16925, n=8) | |
| Alienware x17 R2 P48E | |
| Schenker XMG Ultra 17 Rocket Lake | |
| Razer Blade 17 Early 2022 | |
| Single-Core | |
| Genomsnitt av klass Gaming (1403 - 2474, n=102, senaste 2 åren) | |
| MSI Titan GT77 12UHS | |
| MSI Titan GT77 12UHS 4k | |
| MSI Titan GT77 12UHS (4k, Extreme Leistung, Cooler Boost) | |
| Genomsnitt Intel Core i9-12900HX (1874 - 1949, n=8) | |
| Alienware x17 R2 P48E | |
| Razer Blade 17 Early 2022 | |
| Schenker XMG Ultra 17 Rocket Lake | |
| HWBOT x265 Benchmark v2.2 - 4k Preset | |
| Genomsnitt av klass Gaming (11.5 - 44.4, n=102, senaste 2 åren) | |
| MSI Titan GT77 12UHS 4k | |
| MSI Titan GT77 12UHS (4k, Extreme Leistung, Cooler Boost) | |
| MSI Titan GT77 12UHS | |
| Genomsnitt Intel Core i9-12900HX (19.6 - 26.6, n=7) | |
| Alienware x17 R2 P48E | |
| Schenker XMG Ultra 17 Rocket Lake | |
| Razer Blade 17 Early 2022 | |
| LibreOffice - 20 Documents To PDF | |
| Genomsnitt av klass Gaming (33.2 - 88.8, n=102, senaste 2 åren) | |
| Alienware x17 R2 P48E | |
| Schenker XMG Ultra 17 Rocket Lake | |
| Razer Blade 17 Early 2022 | |
| MSI Titan GT77 12UHS | |
| MSI Titan GT77 12UHS 4k | |
| Genomsnitt Intel Core i9-12900HX (33.6 - 42.4, n=7) | |
| MSI Titan GT77 12UHS (4k, Extreme Leistung, Cooler Boost) | |
| R Benchmark 2.5 - Overall mean | |
| Schenker XMG Ultra 17 Rocket Lake | |
| Razer Blade 17 Early 2022 | |
| Alienware x17 R2 P48E | |
| MSI Titan GT77 12UHS 4k | |
| Genomsnitt av klass Gaming (0.3439 - 0.59, n=102, senaste 2 åren) | |
| MSI Titan GT77 12UHS (4k, Extreme Leistung, Cooler Boost) | |
| Genomsnitt Intel Core i9-12900HX (0.4159 - 0.4242, n=7) | |
| MSI Titan GT77 12UHS | |
* ... mindre är bättre
AIDA64: FP32 Ray-Trace | FPU Julia | CPU SHA3 | CPU Queen | FPU SinJulia | FPU Mandel | CPU AES | CPU ZLib | FP64 Ray-Trace | CPU PhotoWorxx
| Performance rating | |
| Genomsnitt av klass Gaming | |
| MSI Titan GT77 12UHS 4k | |
| MSI Titan GT77 12UHS | |
| MSI Titan GT77 12UHS | |
| Genomsnitt Intel Core i9-12900HX | |
| Schenker XMG Ultra 17 Rocket Lake | |
| Alienware x17 R2 P48E | |
| Razer Blade 17 Early 2022 | |
| AIDA64 / FP32 Ray-Trace | |
| Genomsnitt av klass Gaming (10227 - 85542, n=102, senaste 2 åren) | |
| MSI Titan GT77 12UHS 4k (v6.70.6000) | |
| MSI Titan GT77 12UHS (v6.70.6000, 4k, Extreme Leistung, Cooler Boost) | |
| MSI Titan GT77 12UHS (v6.70.6000) | |
| Genomsnitt Intel Core i9-12900HX (11535 - 22183, n=7) | |
| Schenker XMG Ultra 17 Rocket Lake (v6.32.5600) | |
| Alienware x17 R2 P48E (v6.50.5800) | |
| Razer Blade 17 Early 2022 (v6.50.5800) | |
| AIDA64 / FPU Julia | |
| Genomsnitt av klass Gaming (51376 - 372155, n=102, senaste 2 åren) | |
| MSI Titan GT77 12UHS 4k (v6.70.6000) | |
| MSI Titan GT77 12UHS (v6.70.6000) | |
| MSI Titan GT77 12UHS (v6.70.6000, 4k, Extreme Leistung, Cooler Boost) | |
| Genomsnitt Intel Core i9-12900HX (52916 - 110093, n=7) | |
| Schenker XMG Ultra 17 Rocket Lake (v6.32.5600) | |
| Alienware x17 R2 P48E (v6.50.5800) | |
| Razer Blade 17 Early 2022 (v6.50.5800) | |
| AIDA64 / CPU SHA3 | |
| Genomsnitt av klass Gaming (2180 - 10115, n=102, senaste 2 åren) | |
| MSI Titan GT77 12UHS 4k (v6.70.6000) | |
| MSI Titan GT77 12UHS (v6.70.6000, 4k, Extreme Leistung, Cooler Boost) | |
| MSI Titan GT77 12UHS (v6.70.6000) | |
| Schenker XMG Ultra 17 Rocket Lake (v6.32.5600) | |
| Genomsnitt Intel Core i9-12900HX (3559 - 5123, n=7) | |
| Alienware x17 R2 P48E (v6.50.5800) | |
| Razer Blade 17 Early 2022 (v6.50.5800) | |
| AIDA64 / CPU Queen | |
| Genomsnitt av klass Gaming (49785 - 173351, n=86, senaste 2 åren) | |
| Alienware x17 R2 P48E (v6.50.5800) | |
| Schenker XMG Ultra 17 Rocket Lake (v6.32.5600) | |
| MSI Titan GT77 12UHS (v6.70.6000) | |
| MSI Titan GT77 12UHS 4k (v6.70.6000) | |
| MSI Titan GT77 12UHS (v6.70.6000, 4k, Extreme Leistung, Cooler Boost) | |
| Genomsnitt Intel Core i9-12900HX (101029 - 104457, n=7) | |
| Razer Blade 17 Early 2022 (v6.50.5800) | |
| AIDA64 / FPU SinJulia | |
| Genomsnitt av klass Gaming (4424 - 33636, n=102, senaste 2 åren) | |
| MSI Titan GT77 12UHS 4k (v6.70.6000) | |
| MSI Titan GT77 12UHS (v6.70.6000, 4k, Extreme Leistung, Cooler Boost) | |
| MSI Titan GT77 12UHS (v6.70.6000) | |
| Genomsnitt Intel Core i9-12900HX (10475 - 13062, n=7) | |
| Schenker XMG Ultra 17 Rocket Lake (v6.32.5600) | |
| Alienware x17 R2 P48E (v6.50.5800) | |
| Razer Blade 17 Early 2022 (v6.50.5800) | |
| AIDA64 / FPU Mandel | |
| Genomsnitt av klass Gaming (25115 - 196829, n=102, senaste 2 åren) | |
| MSI Titan GT77 12UHS 4k (v6.70.6000) | |
| MSI Titan GT77 12UHS (v6.70.6000, 4k, Extreme Leistung, Cooler Boost) | |
| MSI Titan GT77 12UHS (v6.70.6000) | |
| Genomsnitt Intel Core i9-12900HX (31779 - 53628, n=7) | |
| Schenker XMG Ultra 17 Rocket Lake (v6.32.5600) | |
| Alienware x17 R2 P48E (v6.50.5800) | |
| Razer Blade 17 Early 2022 (v6.50.5800) | |
| AIDA64 / CPU AES | |
| MSI Titan GT77 12UHS (v6.70.6000, 4k, Extreme Leistung, Cooler Boost) | |
| MSI Titan GT77 12UHS | |
| MSI Titan GT77 12UHS 4k (v6.70.6000) | |
| Genomsnitt Intel Core i9-12900HX (125268 - 183146, n=7) | |
| Schenker XMG Ultra 17 Rocket Lake (v6.32.5600) | |
| Genomsnitt av klass Gaming (39258 - 247074, n=102, senaste 2 åren) | |
| Alienware x17 R2 P48E (v6.50.5800) | |
| Razer Blade 17 Early 2022 (v6.50.5800) | |
| AIDA64 / CPU ZLib | |
| Genomsnitt av klass Gaming (574 - 2531, n=102, senaste 2 åren) | |
| MSI Titan GT77 12UHS 4k (v6.70.6000) | |
| MSI Titan GT77 12UHS (v6.70.6000, 4k, Extreme Leistung, Cooler Boost) | |
| MSI Titan GT77 12UHS (v6.70.6000) | |
| Genomsnitt Intel Core i9-12900HX (990 - 1408, n=7) | |
| Alienware x17 R2 P48E (v6.50.5800) | |
| Schenker XMG Ultra 17 Rocket Lake (v6.32.5600) | |
| Razer Blade 17 Early 2022 (v6.50.5800) | |
| AIDA64 / FP64 Ray-Trace | |
| Genomsnitt av klass Gaming (5509 - 45446, n=102, senaste 2 åren) | |
| MSI Titan GT77 12UHS 4k (v6.70.6000) | |
| MSI Titan GT77 12UHS (v6.70.6000, 4k, Extreme Leistung, Cooler Boost) | |
| MSI Titan GT77 12UHS (v6.70.6000) | |
| Genomsnitt Intel Core i9-12900HX (6663 - 11913, n=7) | |
| Schenker XMG Ultra 17 Rocket Lake (v6.32.5600) | |
| Alienware x17 R2 P48E (v6.50.5800) | |
| Razer Blade 17 Early 2022 (v6.50.5800) | |
| AIDA64 / CPU PhotoWorxx | |
| Genomsnitt av klass Gaming (12271 - 89891, n=102, senaste 2 åren) | |
| Genomsnitt Intel Core i9-12900HX (40239 - 47710, n=7) | |
| MSI Titan GT77 12UHS (v6.70.6000) | |
| MSI Titan GT77 12UHS 4k (v6.70.6000) | |
| MSI Titan GT77 12UHS (v6.70.6000, 4k, Extreme Leistung, Cooler Boost) | |
| Razer Blade 17 Early 2022 (v6.50.5800) | |
| Alienware x17 R2 P48E (v6.50.5800) | |
| Schenker XMG Ultra 17 Rocket Lake (v6.32.5600) | |
Systemprestanda
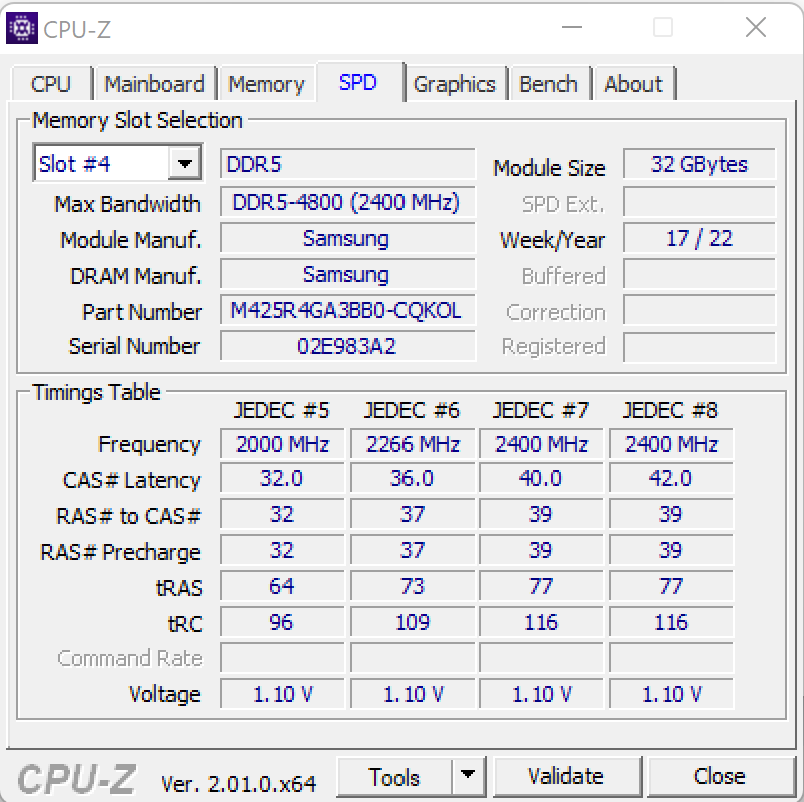
GT77 saknar inte datorkraft - det är uppenbart bara genom att titta på specifikationerna. Den 17-tums bärbara datorn kan hantera spel, rendering och mycket annat med lätthet. Överföringshastigheterna för RAM-minne är i linje med den vanliga prestandanivån för DDR4-4800-minne. Systemet fick också bra resultat i PCMark.
CrossMark: Overall | Productivity | Creativity | Responsiveness
| PCMark 10 / Score | |
| Genomsnitt av klass Gaming (5828 - 12414, n=93, senaste 2 åren) | |
| MSI Titan GT77 12UHS (dGPU, Extreme Leistung) | |
| MSI Titan GT77 12UHS | |
| Alienware x17 R2 P48E | |
| Genomsnitt Intel Core i9-12900HX, NVIDIA GeForce RTX 3080 Ti Laptop GPU (6812 - 8636, n=6) | |
| Schenker XMG Ultra 17 Rocket Lake | |
| Razer Blade 17 Early 2022 | |
| MSI Titan GT77 12UHS 4k | |
| PCMark 10 / Essentials | |
| Alienware x17 R2 P48E | |
| MSI Titan GT77 12UHS (dGPU, Extreme Leistung) | |
| MSI Titan GT77 12UHS | |
| Schenker XMG Ultra 17 Rocket Lake | |
| Genomsnitt av klass Gaming (8810 - 11935, n=97, senaste 2 åren) | |
| Genomsnitt Intel Core i9-12900HX, NVIDIA GeForce RTX 3080 Ti Laptop GPU (9598 - 11192, n=6) | |
| Razer Blade 17 Early 2022 | |
| MSI Titan GT77 12UHS 4k | |
| PCMark 10 / Productivity | |
| Genomsnitt av klass Gaming (6845 - 25323, n=95, senaste 2 åren) | |
| MSI Titan GT77 12UHS (dGPU, Extreme Leistung) | |
| Genomsnitt Intel Core i9-12900HX, NVIDIA GeForce RTX 3080 Ti Laptop GPU (9365 - 10932, n=6) | |
| MSI Titan GT77 12UHS | |
| Alienware x17 R2 P48E | |
| Schenker XMG Ultra 17 Rocket Lake | |
| MSI Titan GT77 12UHS 4k | |
| Razer Blade 17 Early 2022 | |
| PCMark 10 / Digital Content Creation | |
| Genomsnitt av klass Gaming (7602 - 19954, n=95, senaste 2 åren) | |
| MSI Titan GT77 12UHS (dGPU, Extreme Leistung) | |
| MSI Titan GT77 12UHS | |
| Alienware x17 R2 P48E | |
| Genomsnitt Intel Core i9-12900HX, NVIDIA GeForce RTX 3080 Ti Laptop GPU (9543 - 14291, n=6) | |
| Schenker XMG Ultra 17 Rocket Lake | |
| Razer Blade 17 Early 2022 | |
| MSI Titan GT77 12UHS 4k | |
| CrossMark / Overall | |
| MSI Titan GT77 12UHS 4k | |
| Genomsnitt Intel Core i9-12900HX, NVIDIA GeForce RTX 3080 Ti Laptop GPU (2108 - 2170, n=5) | |
| MSI Titan GT77 12UHS | |
| Genomsnitt av klass Gaming (1366 - 2409, n=94, senaste 2 åren) | |
| Alienware x17 R2 P48E | |
| Razer Blade 17 Early 2022 | |
| CrossMark / Productivity | |
| MSI Titan GT77 12UHS 4k | |
| Genomsnitt Intel Core i9-12900HX, NVIDIA GeForce RTX 3080 Ti Laptop GPU (1978 - 2047, n=5) | |
| MSI Titan GT77 12UHS | |
| Genomsnitt av klass Gaming (1386 - 2254, n=94, senaste 2 åren) | |
| Alienware x17 R2 P48E | |
| Razer Blade 17 Early 2022 | |
| CrossMark / Creativity | |
| MSI Titan GT77 12UHS 4k | |
| Genomsnitt Intel Core i9-12900HX, NVIDIA GeForce RTX 3080 Ti Laptop GPU (2288 - 2366, n=5) | |
| MSI Titan GT77 12UHS | |
| Genomsnitt av klass Gaming (1343 - 2786, n=94, senaste 2 åren) | |
| Alienware x17 R2 P48E | |
| Razer Blade 17 Early 2022 | |
| CrossMark / Responsiveness | |
| MSI Titan GT77 12UHS 4k | |
| Genomsnitt Intel Core i9-12900HX, NVIDIA GeForce RTX 3080 Ti Laptop GPU (1991 - 2090, n=5) | |
| MSI Titan GT77 12UHS | |
| Genomsnitt av klass Gaming (1226 - 2334, n=94, senaste 2 åren) | |
| Alienware x17 R2 P48E | |
| Razer Blade 17 Early 2022 | |
| PCMark 8 Home Score Accelerated v2 | 4166 poäng | |
| PCMark 8 Creative Score Accelerated v2 | 6677 poäng | |
| PCMark 8 Work Score Accelerated v2 | 5165 poäng | |
| PCMark 10 Score | 6812 poäng | |
Hjälp | ||
| AIDA64 / Memory Copy | |
| Genomsnitt av klass Gaming (21750 - 129946, n=102, senaste 2 åren) | |
| Genomsnitt Intel Core i9-12900HX (62852 - 70863, n=7) | |
| MSI Titan GT77 12UHS | |
| MSI Titan GT77 12UHS 4k | |
| Razer Blade 17 Early 2022 | |
| Alienware x17 R2 P48E | |
| Schenker XMG Ultra 17 Rocket Lake | |
| AIDA64 / Memory Read | |
| Genomsnitt av klass Gaming (22956 - 118858, n=102, senaste 2 åren) | |
| Genomsnitt Intel Core i9-12900HX (62140 - 72930, n=7) | |
| MSI Titan GT77 12UHS 4k | |
| Razer Blade 17 Early 2022 | |
| MSI Titan GT77 12UHS | |
| Alienware x17 R2 P48E | |
| Schenker XMG Ultra 17 Rocket Lake | |
| AIDA64 / Memory Write | |
| Genomsnitt av klass Gaming (22297 - 135096, n=102, senaste 2 åren) | |
| Genomsnitt Intel Core i9-12900HX (60001 - 68782, n=7) | |
| MSI Titan GT77 12UHS 4k | |
| MSI Titan GT77 12UHS | |
| Razer Blade 17 Early 2022 | |
| Alienware x17 R2 P48E | |
| Schenker XMG Ultra 17 Rocket Lake | |
| AIDA64 / Memory Latency | |
| Genomsnitt av klass Gaming (75.3 - 165.4, n=102, senaste 2 åren) | |
| Alienware x17 R2 P48E | |
| MSI Titan GT77 12UHS 4k | |
| MSI Titan GT77 12UHS | |
| Genomsnitt Intel Core i9-12900HX (83.9 - 93.4, n=7) | |
| Schenker XMG Ultra 17 Rocket Lake | |
* ... mindre är bättre
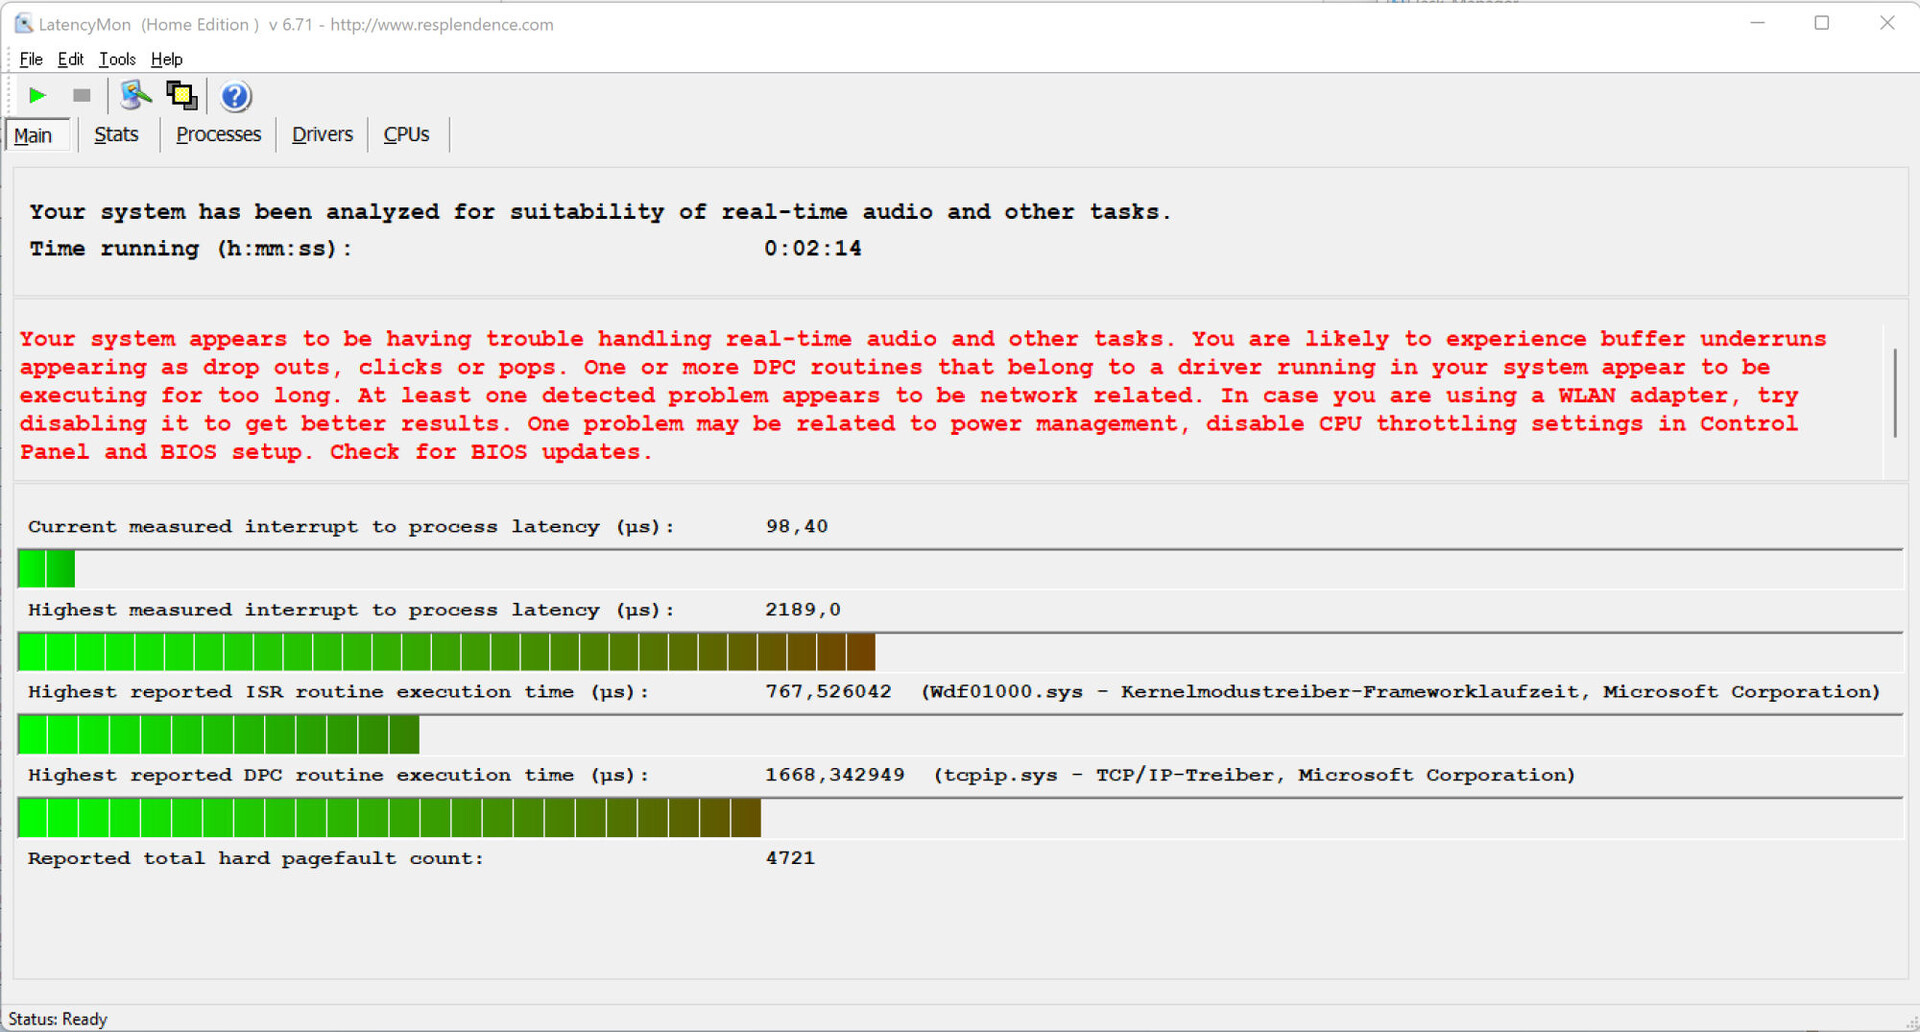
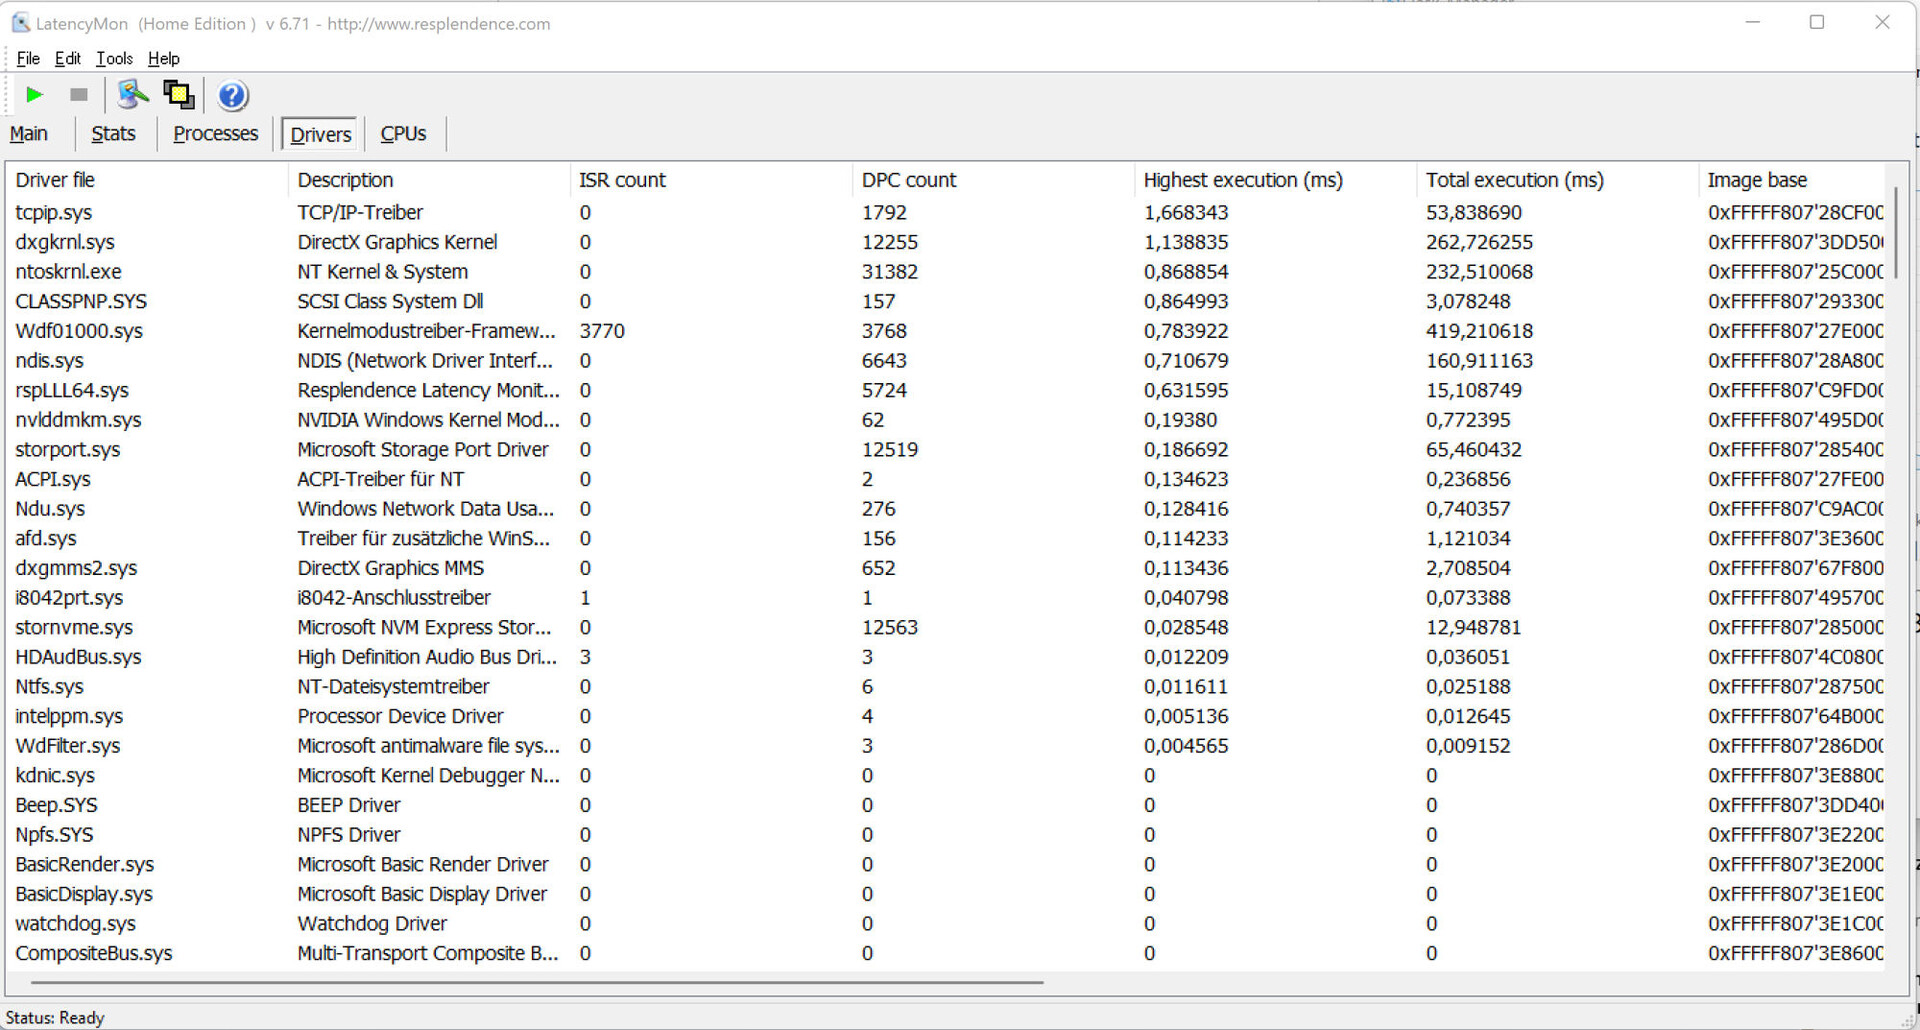
DPC-fördröjning
Vårt standardiserade test för övervakning av latens (surfning på Internet, uppspelning av 4K-video, Prime95 hög belastning) avslöjade vissa problem med DPC-latens. Systemet verkar inte vara väl lämpat för video- och ljudbearbetning i realtid. Framtida programuppdateringar kan förbättra eller till och med förvärra detta problem.
| DPC Latencies / LatencyMon - interrupt to process latency (max), Web, Youtube, Prime95 | |
| MSI Titan GT77 12UHS | |
| MSI Titan GT77 12UHS | |
| MSI Titan GT77 12UHS 4k | |
| Alienware x17 R2 P48E | |
| Schenker XMG Ultra 17 Rocket Lake | |
| Razer Blade 17 Early 2022 | |
* ... mindre är bättre
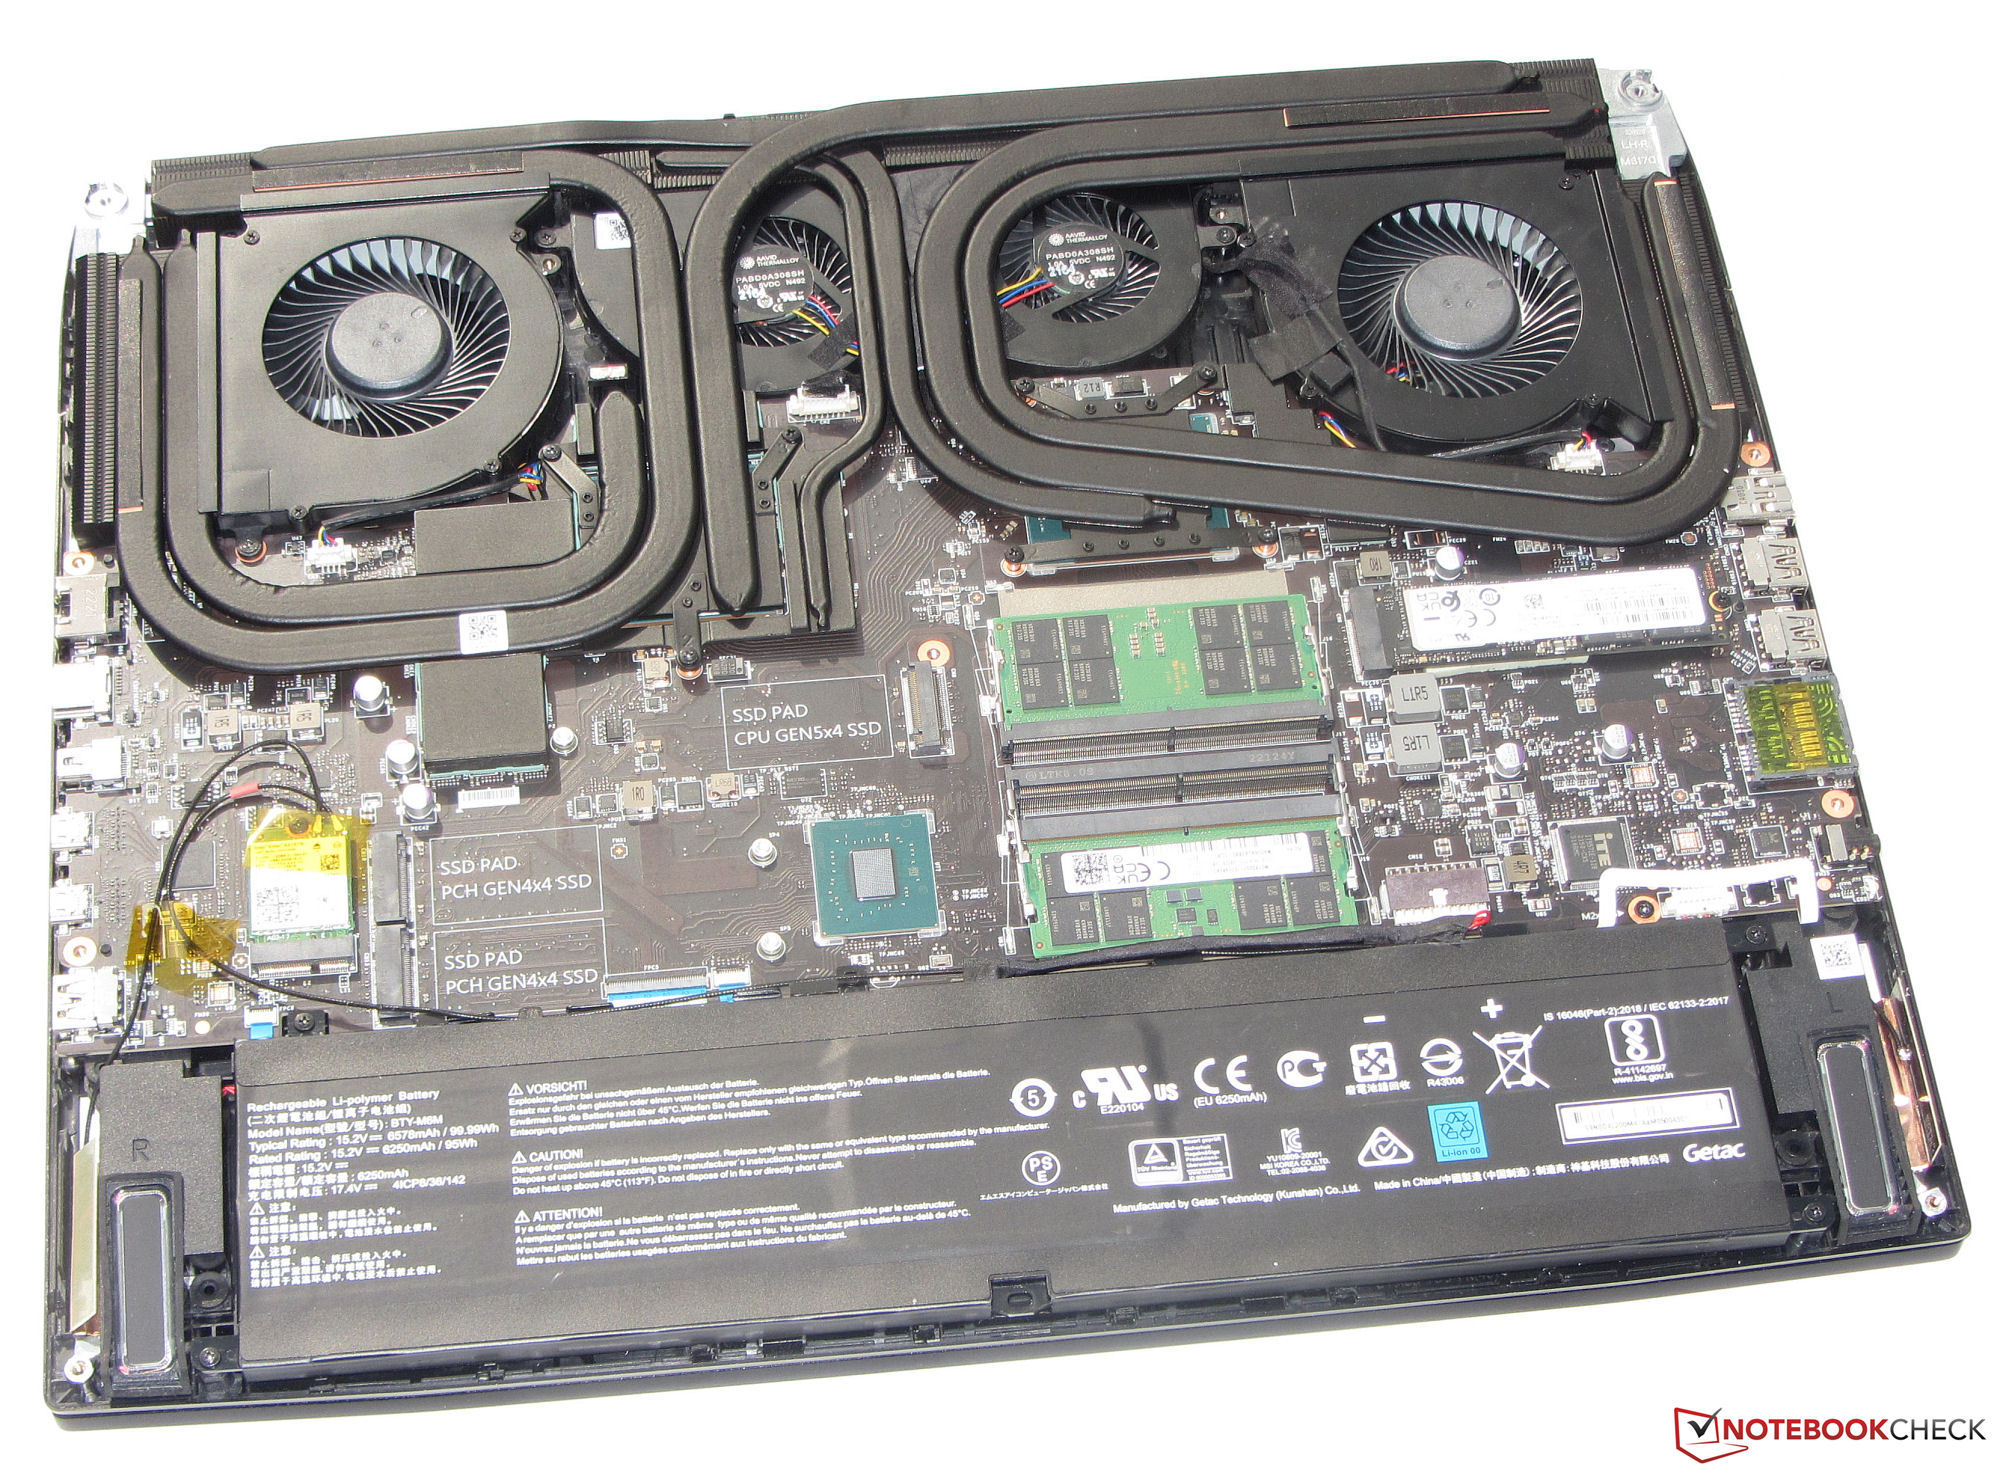
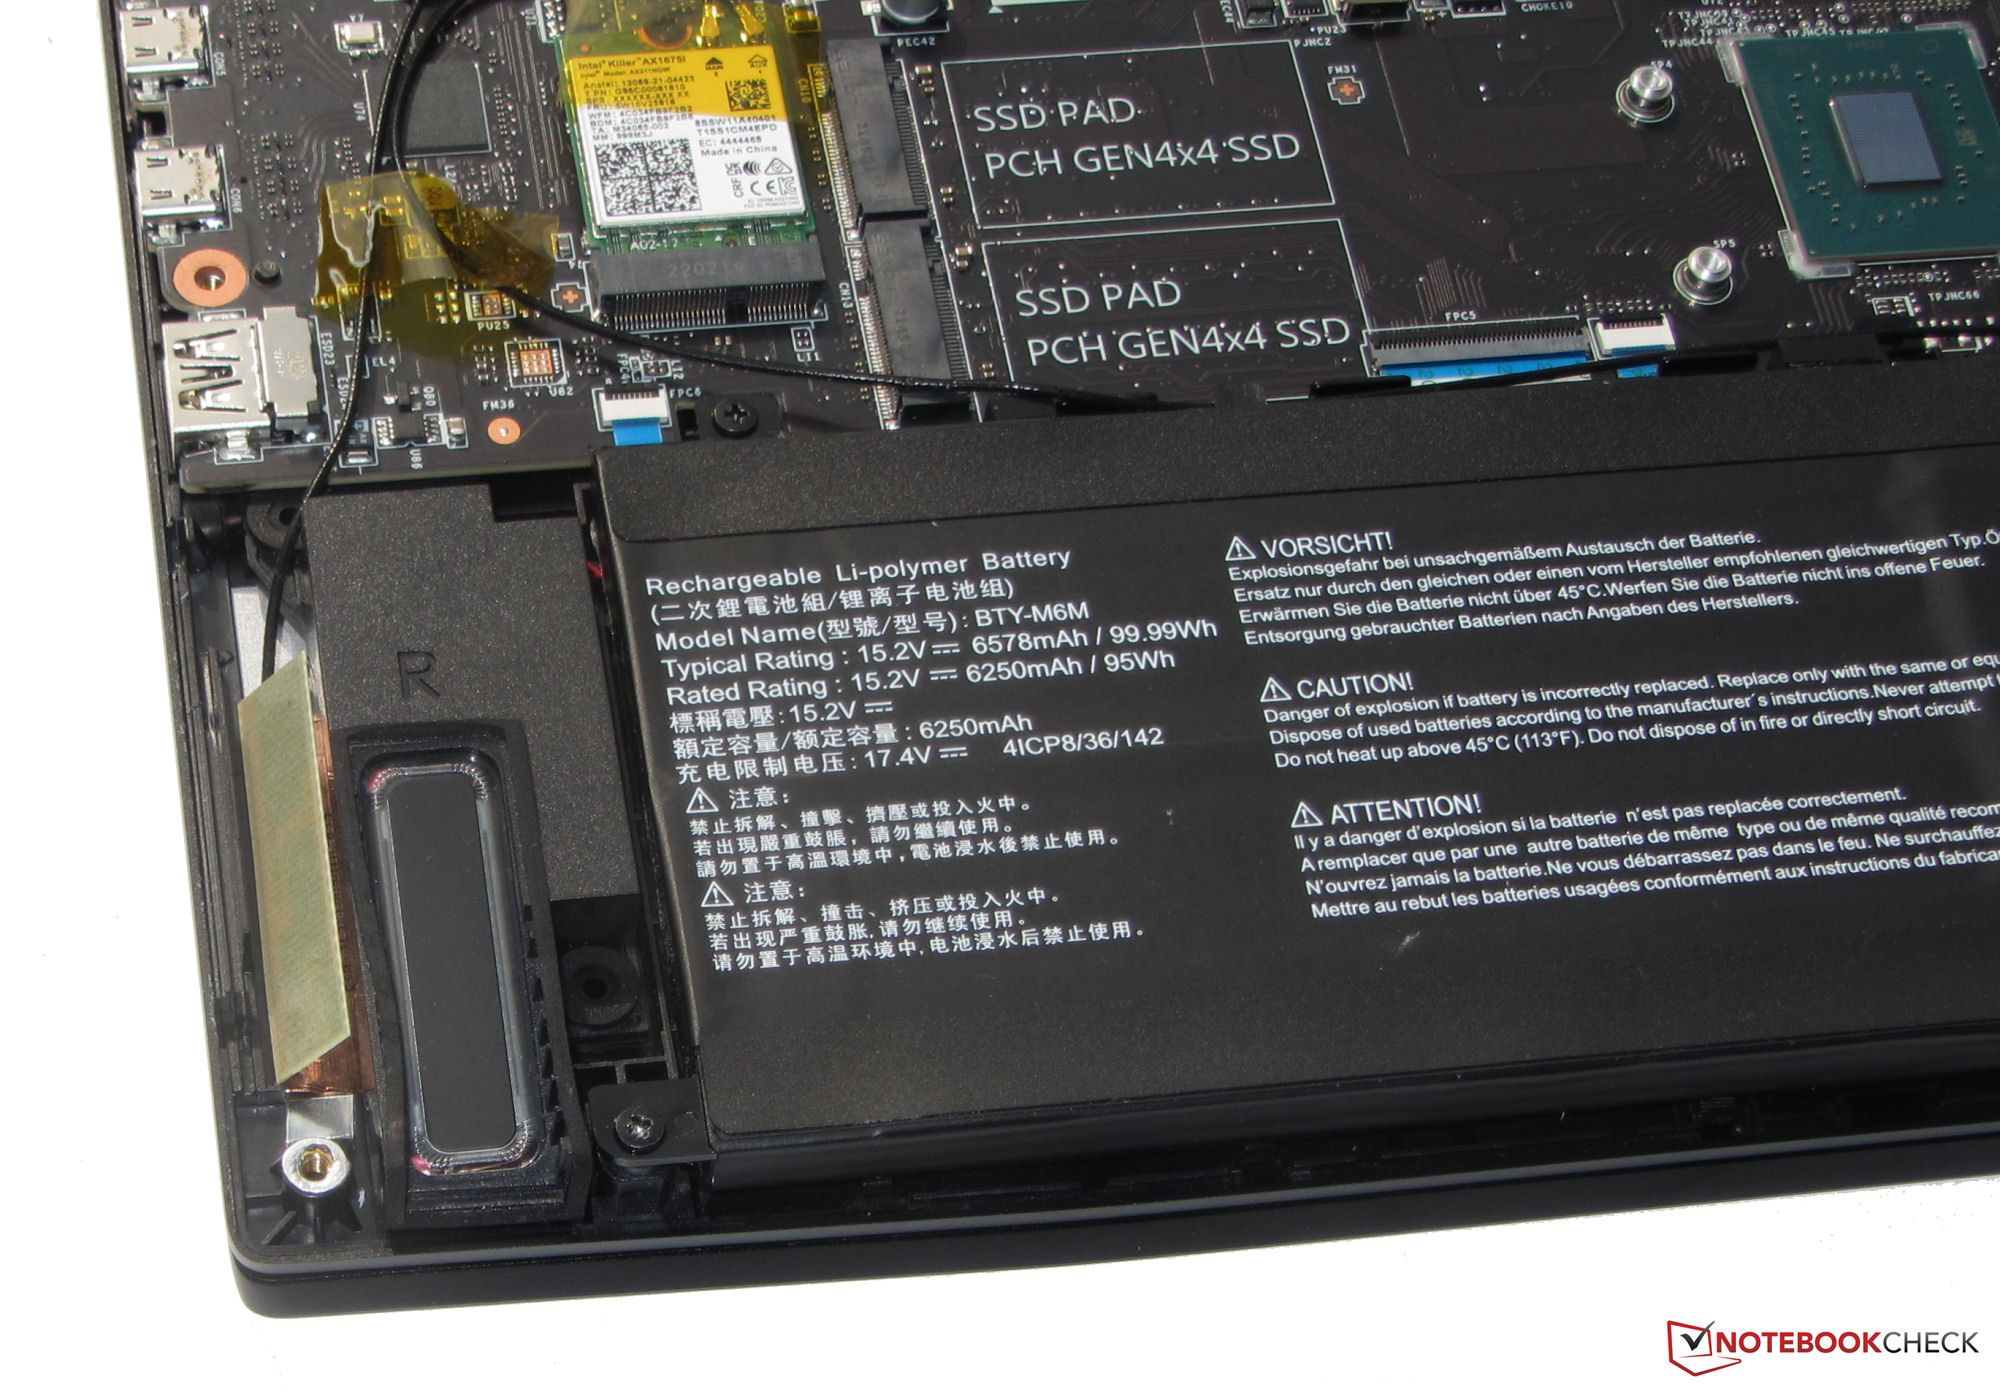
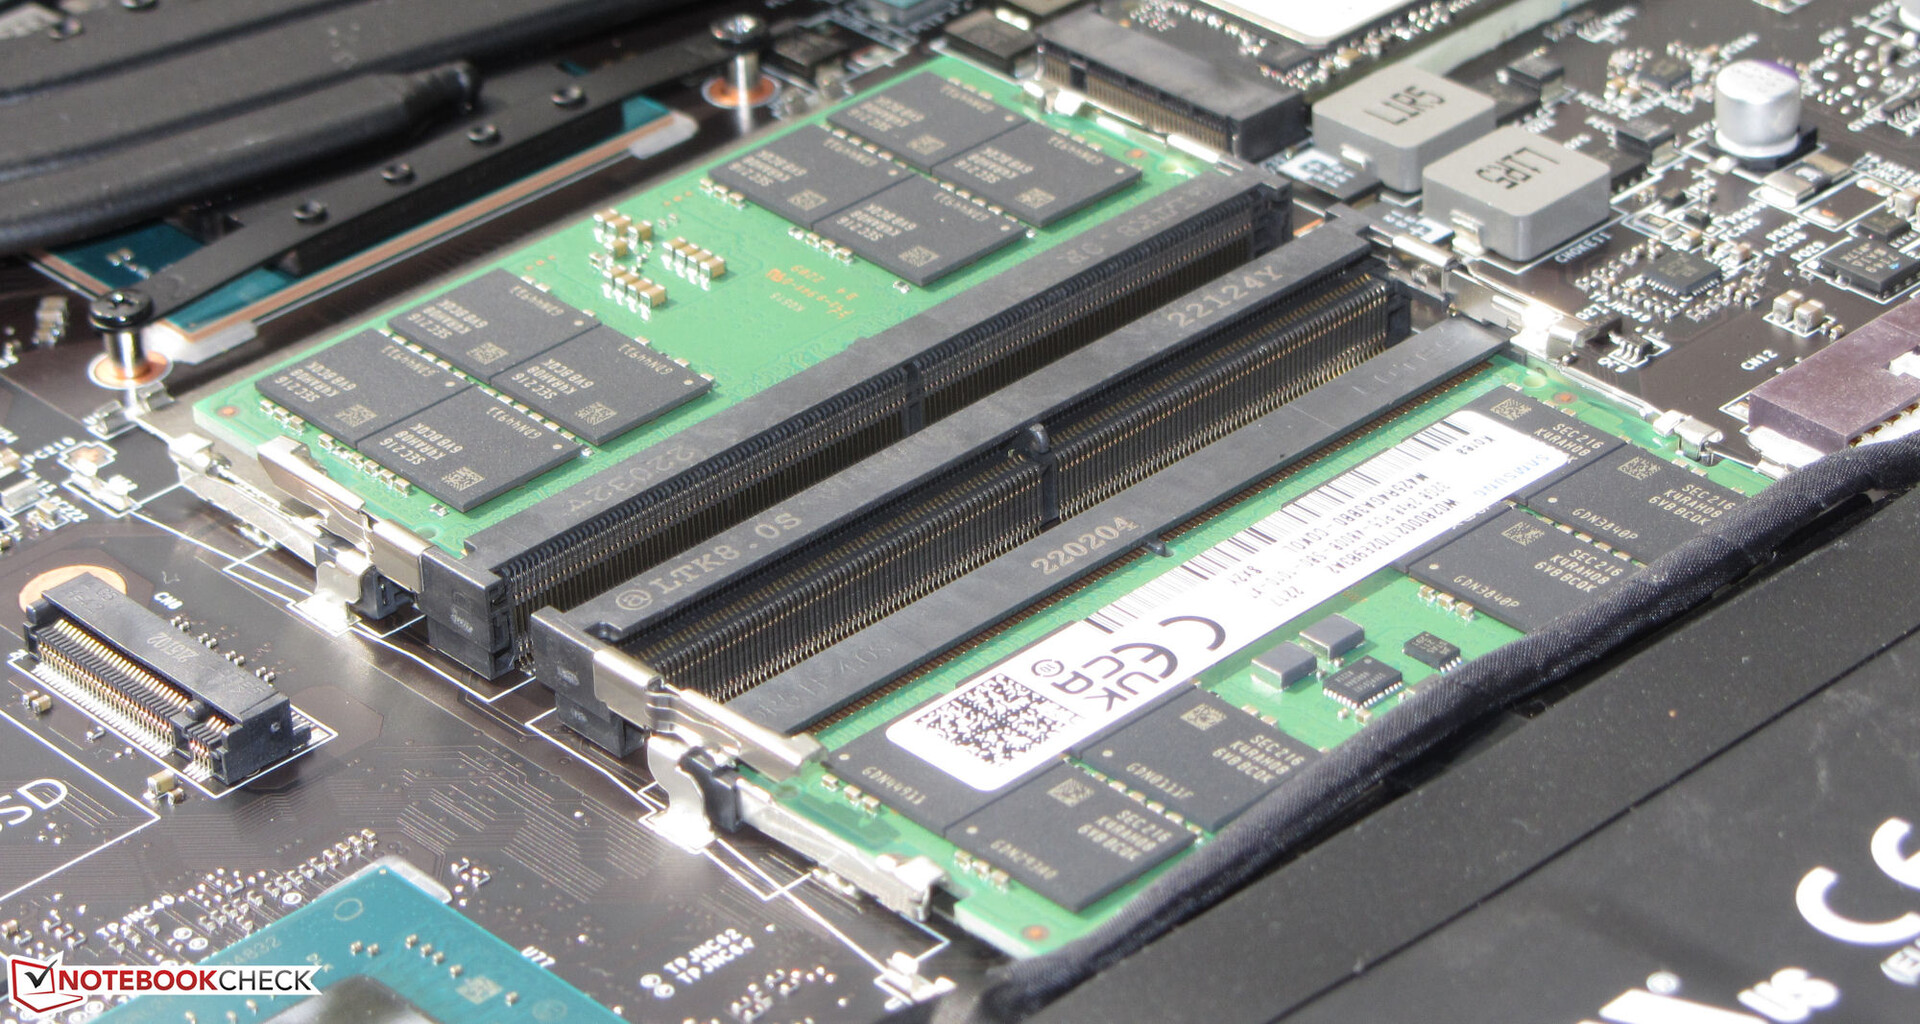
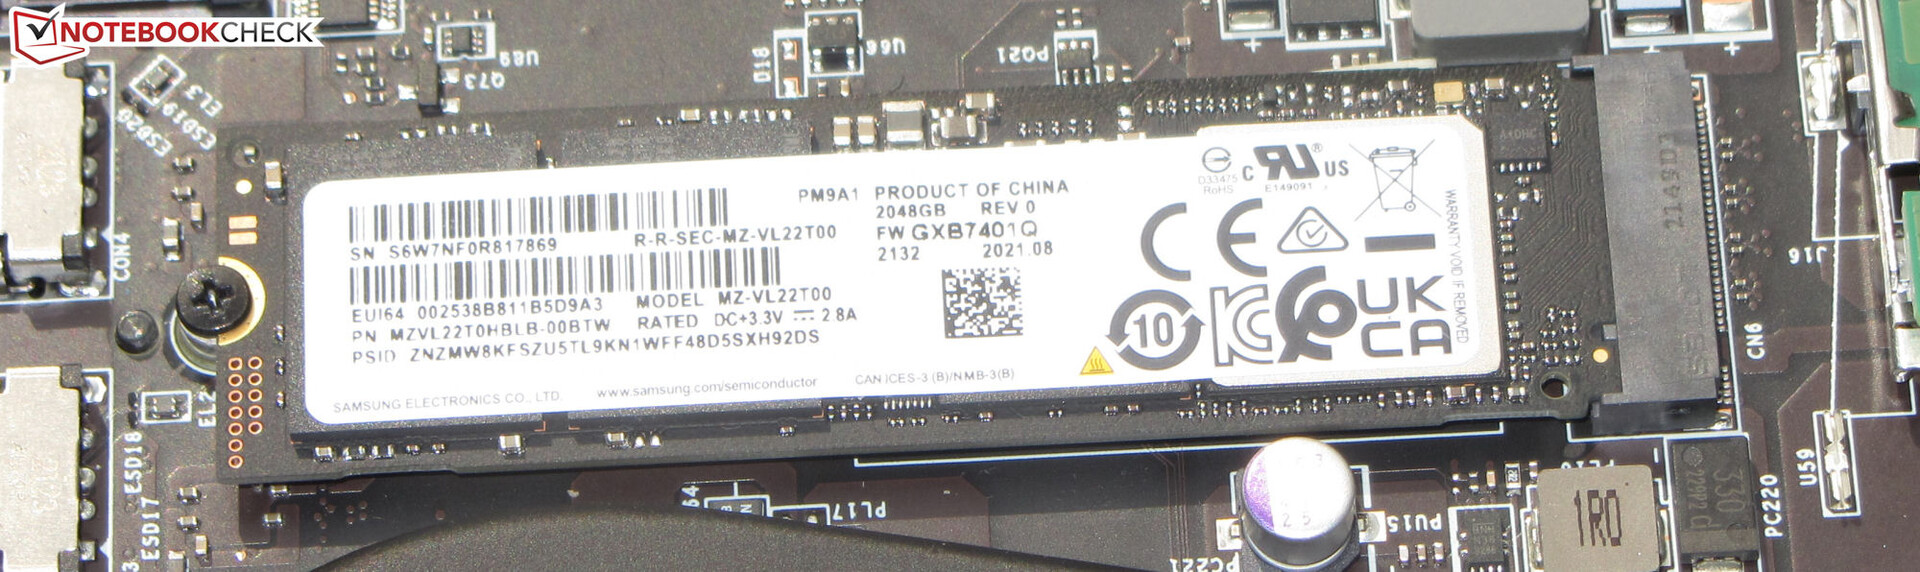
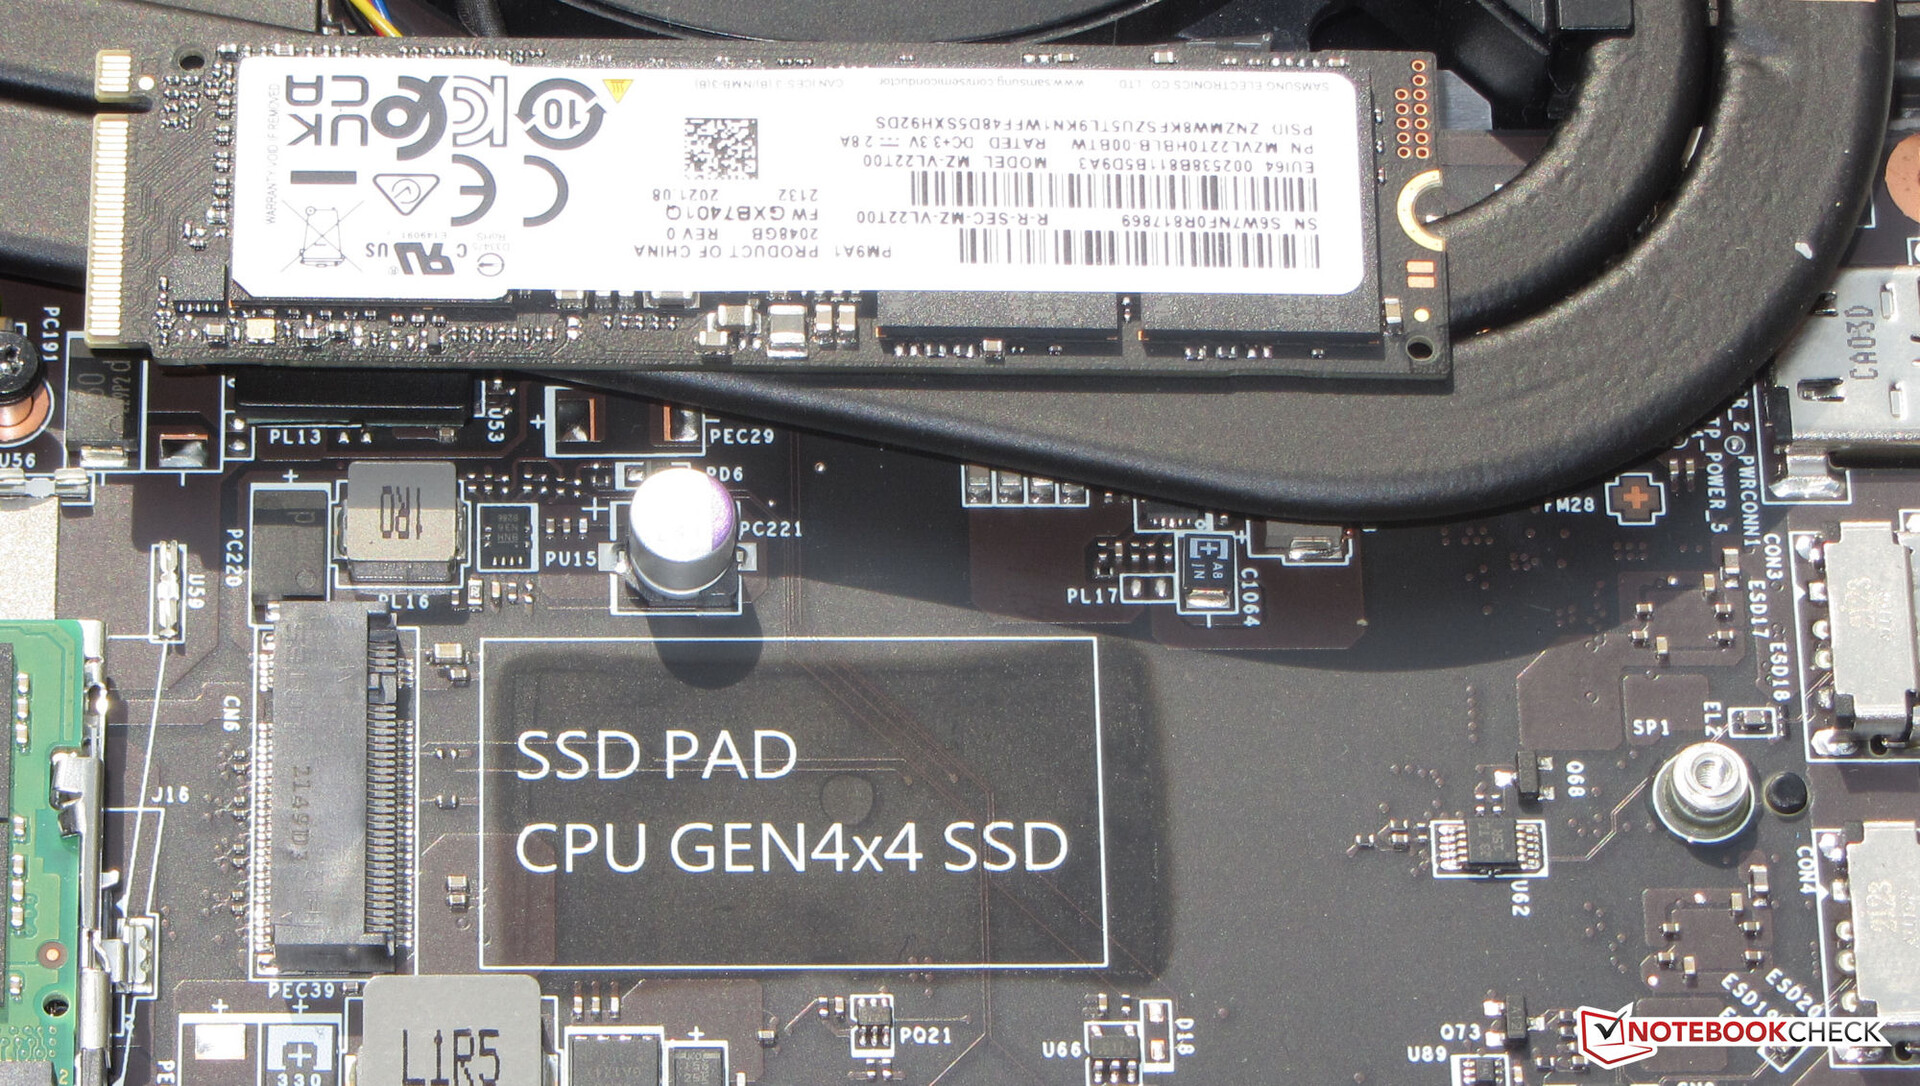
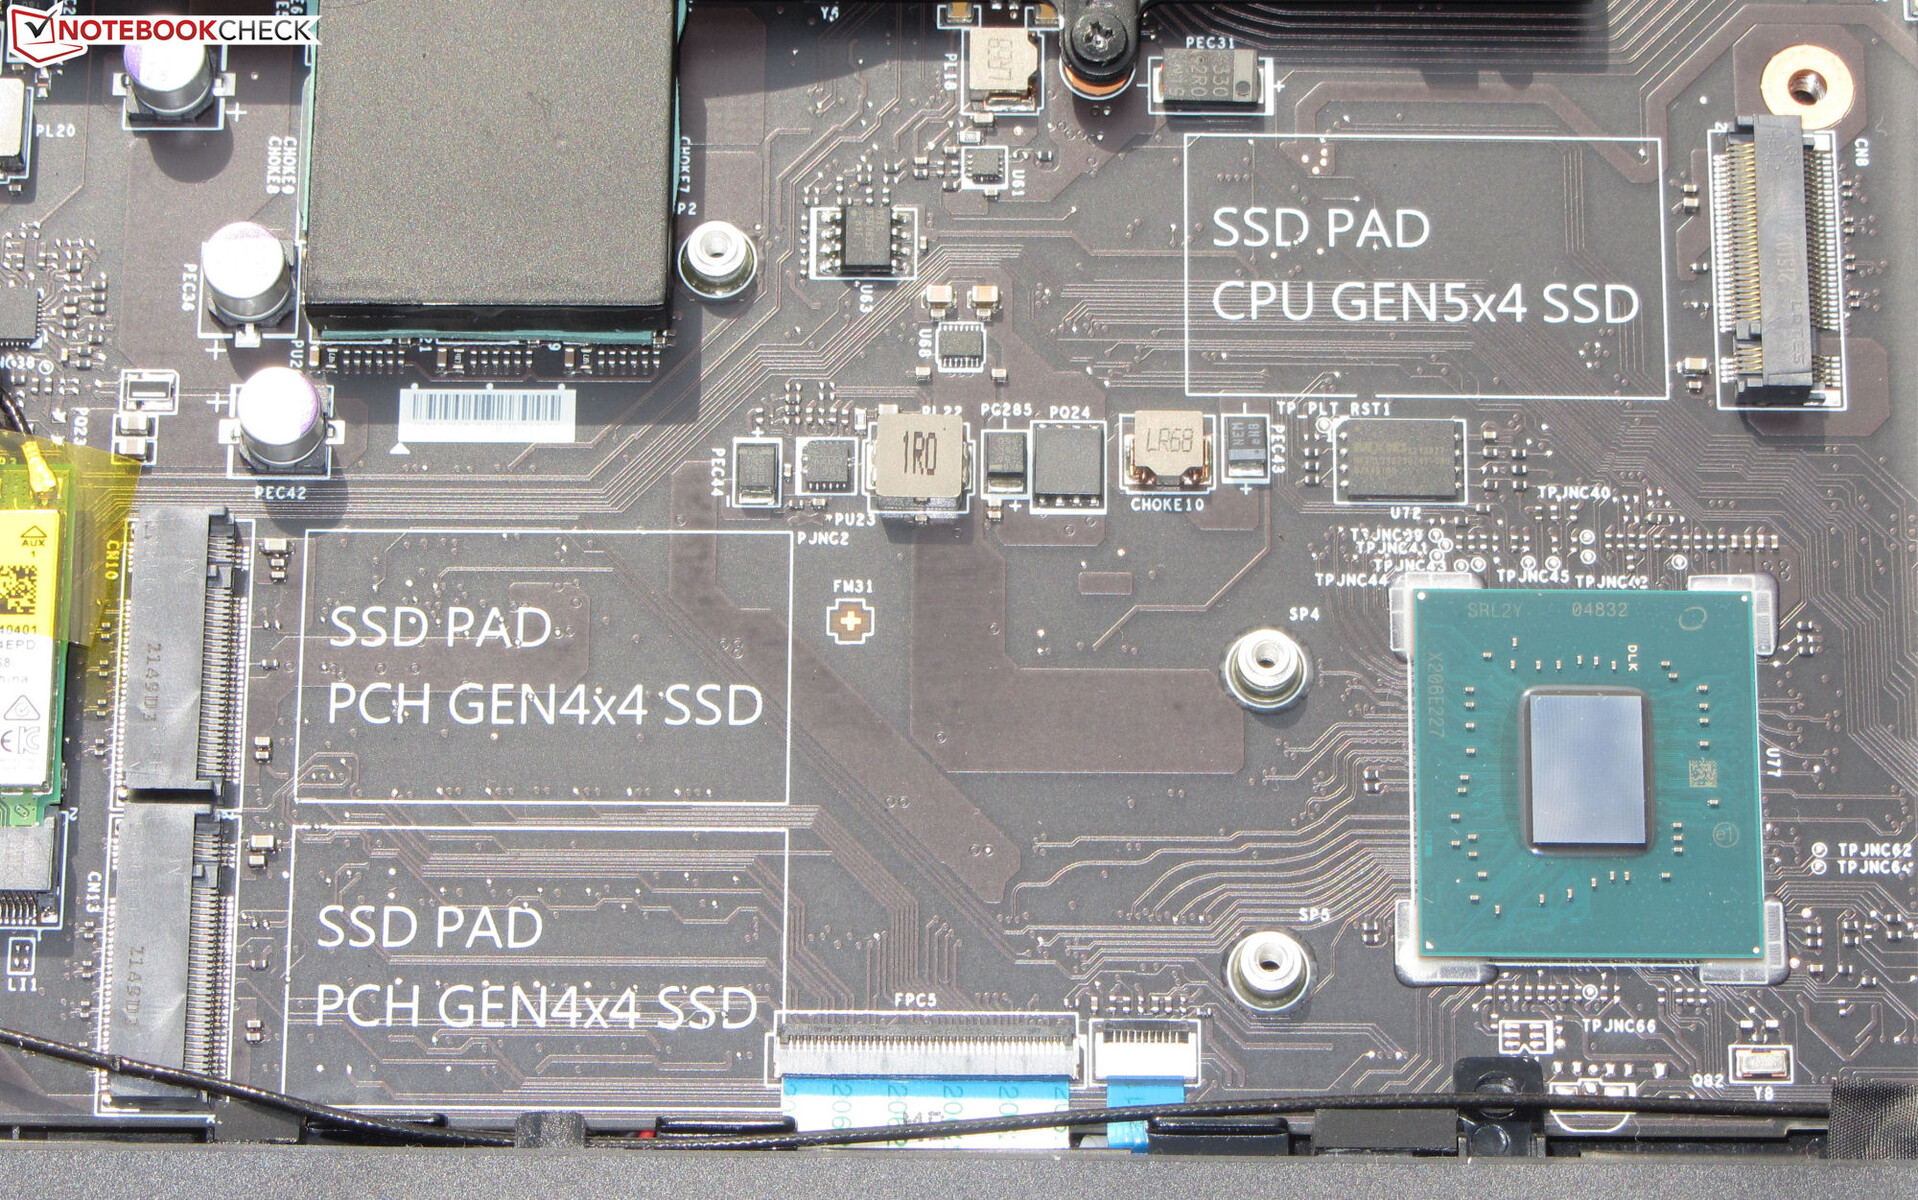
Masslagring
Titan kan rymma upp till fyra M.2 2280 SSD-enheter (3x PCIe 4, 1x PCIe 5). Den medföljande 2 TB Samsung SSD (PCIe 4) kan ge utmärkta överföringshastigheter
IFHD-modellenlider SSD:n med operativsystemet (även den tillverkad av Samsung) av prestandadoppar på grund av termisk strypning. Kanske förhindrar de tre andra SSD-enheterna som installerats i den bärbara datorn ett optimalt luftflöde. SSD-enheten i vår aktuella granskningsenhet uppvisar inga prestandadips.

| Drive Performance rating - Percent | |
| MSI Titan GT77 12UHS 4k | |
| MSI Titan GT77 12UHS | |
| Razer Blade 17 Early 2022 | |
| Schenker XMG Ultra 17 Rocket Lake | |
| Genomsnitt Samsung PM9A1 MZVL22T0HBLB | |
| Genomsnitt av klass Gaming | |
| Alienware x17 R2 P48E | |
* ... mindre är bättre
Continuous read: DiskSpd Read Loop, Queue Depth 8
Grafikkort
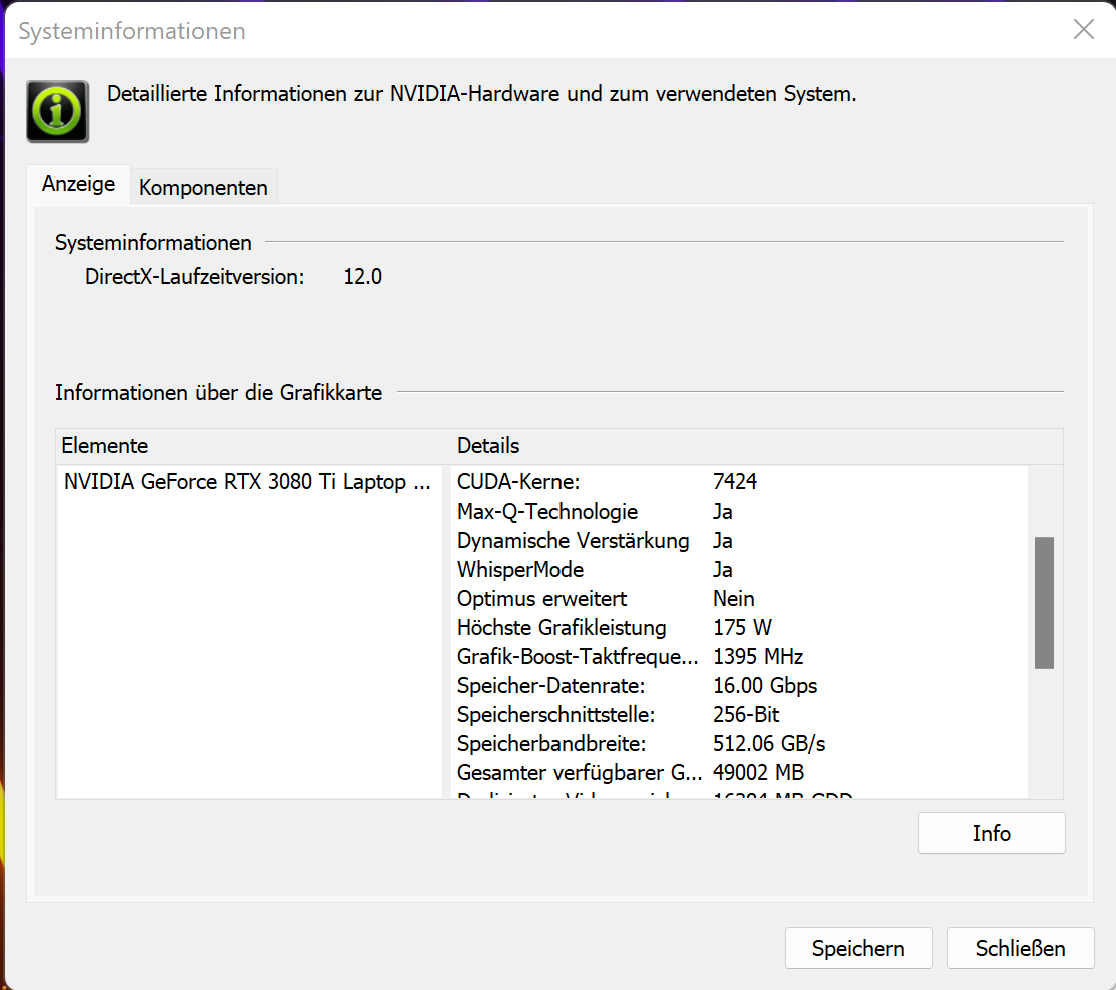
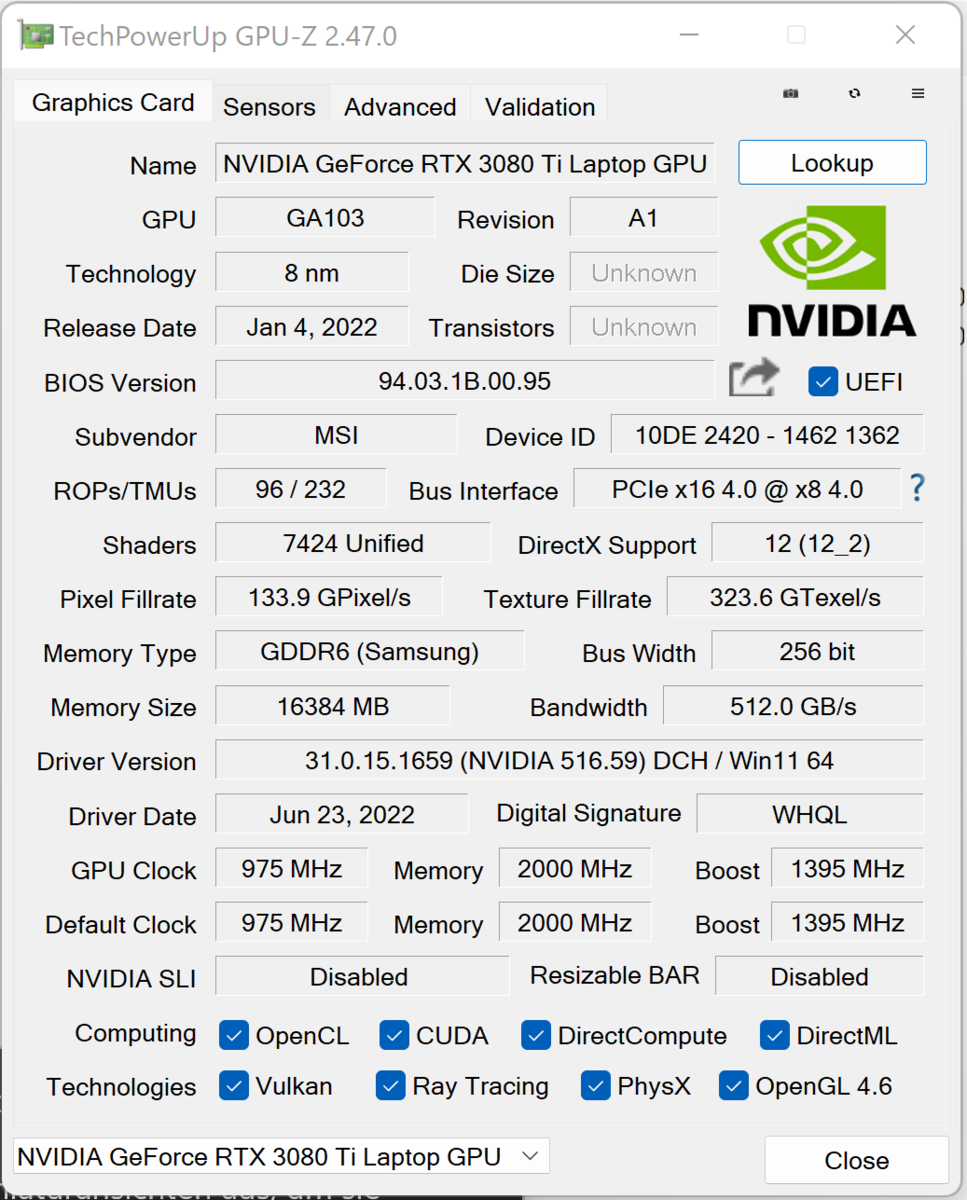
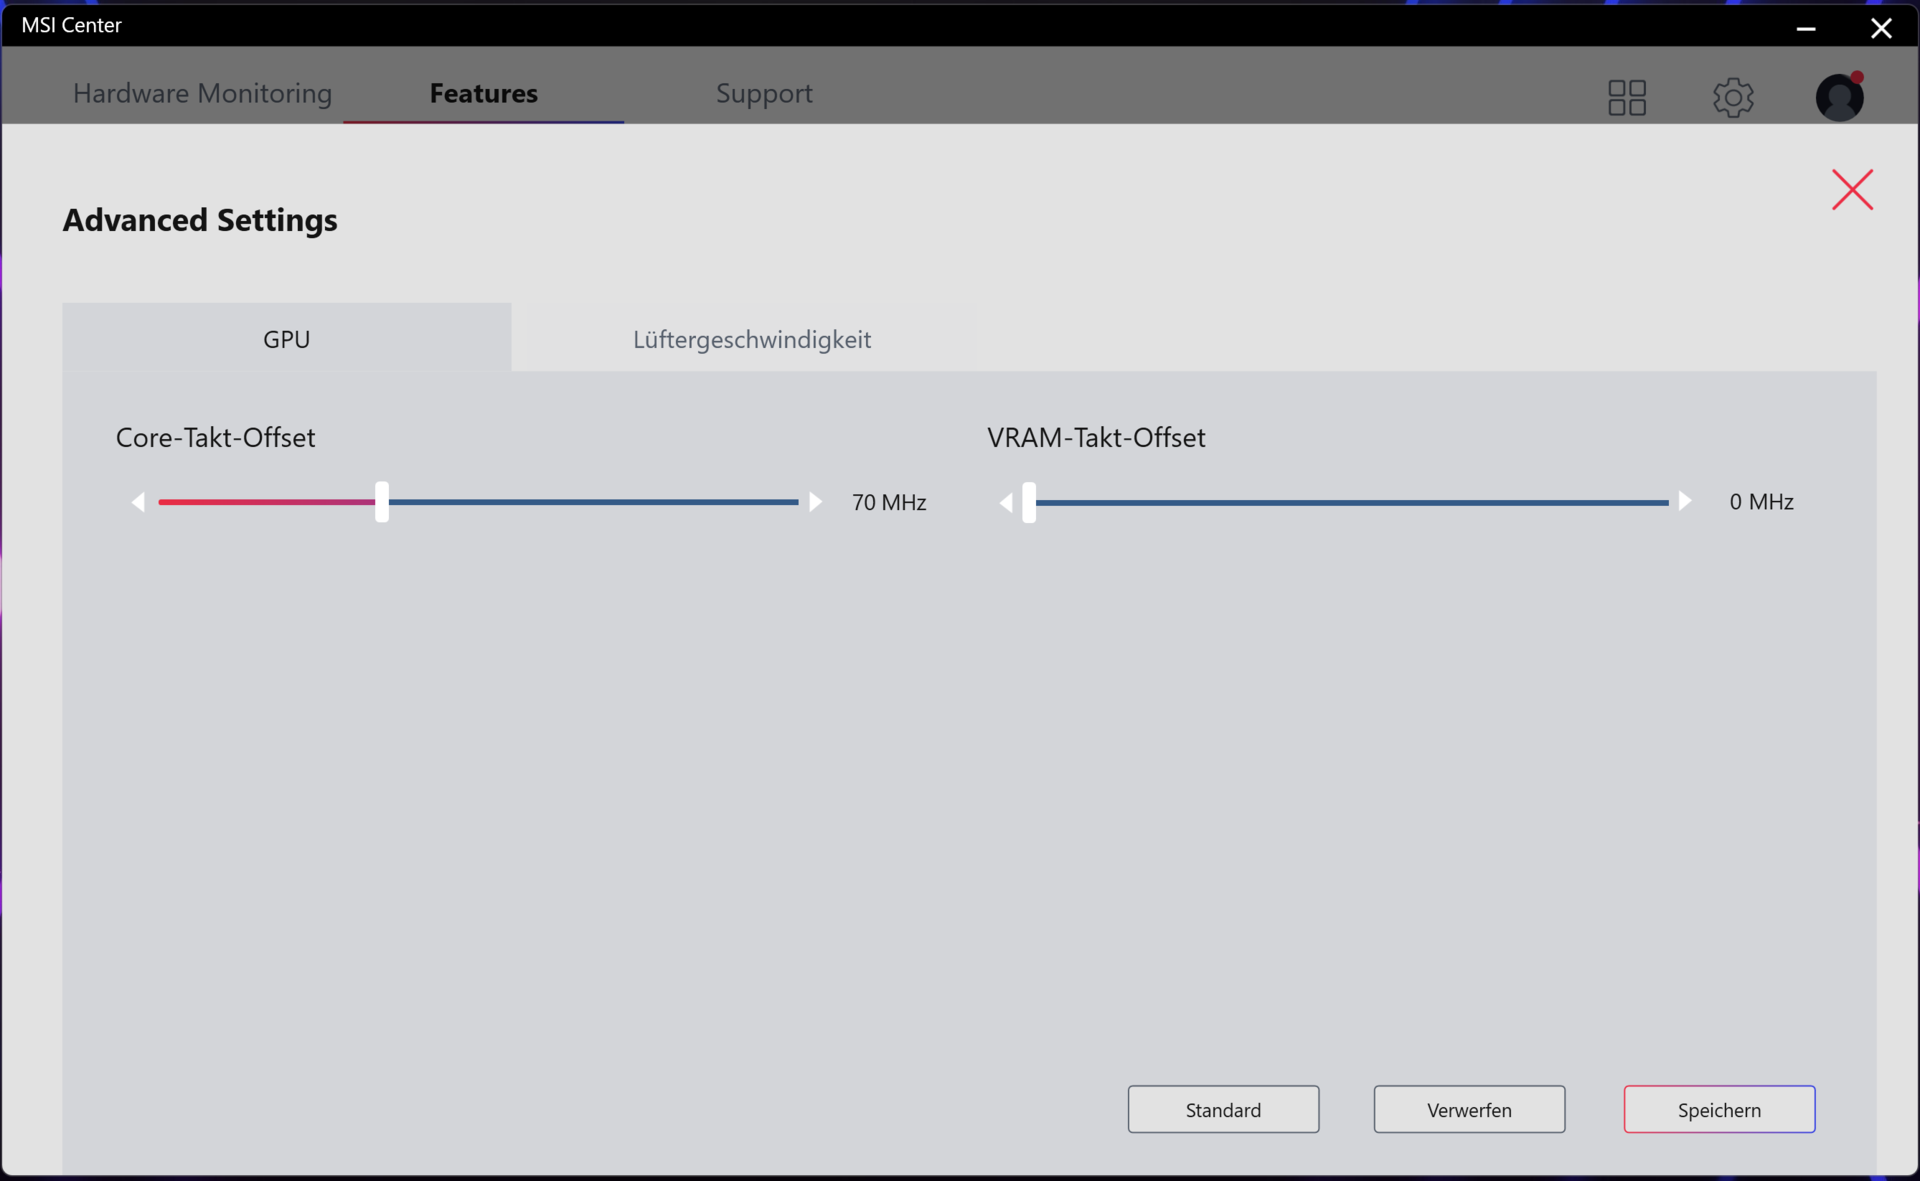
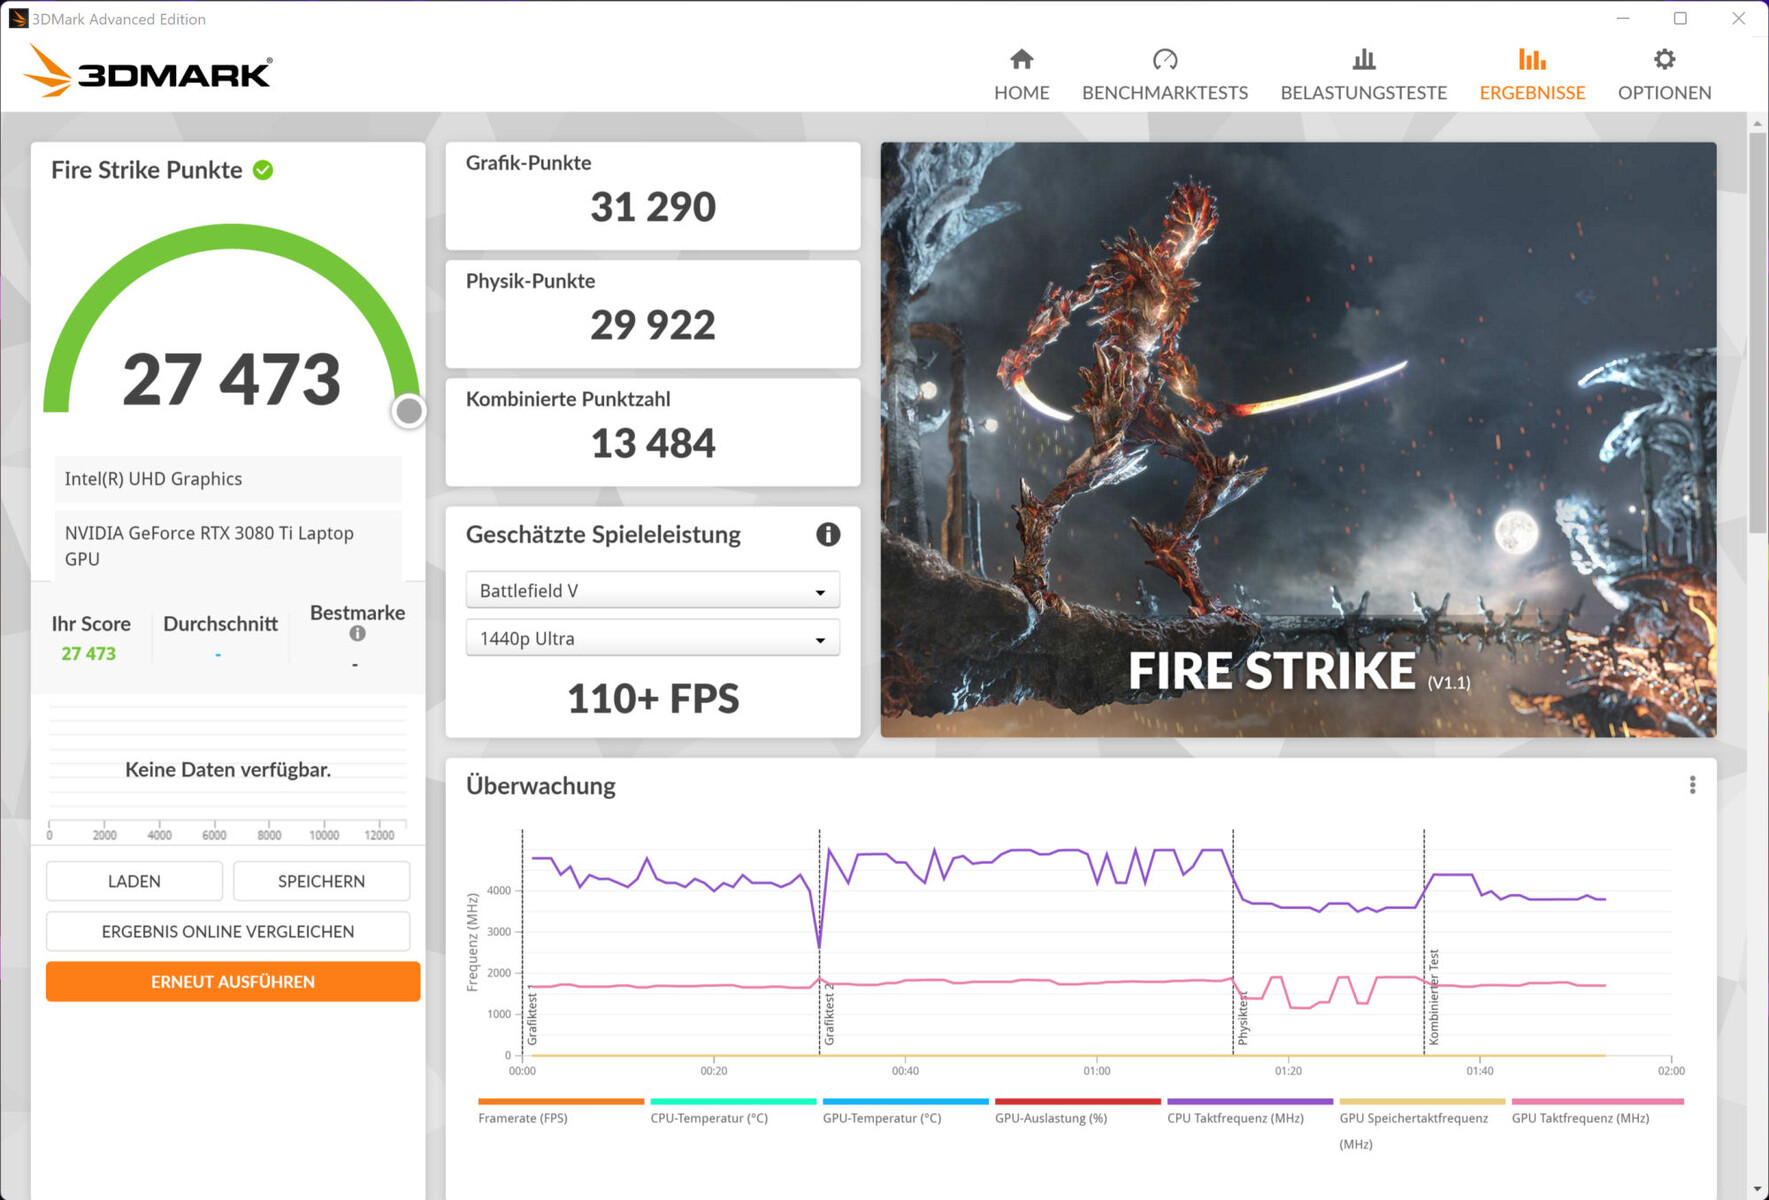
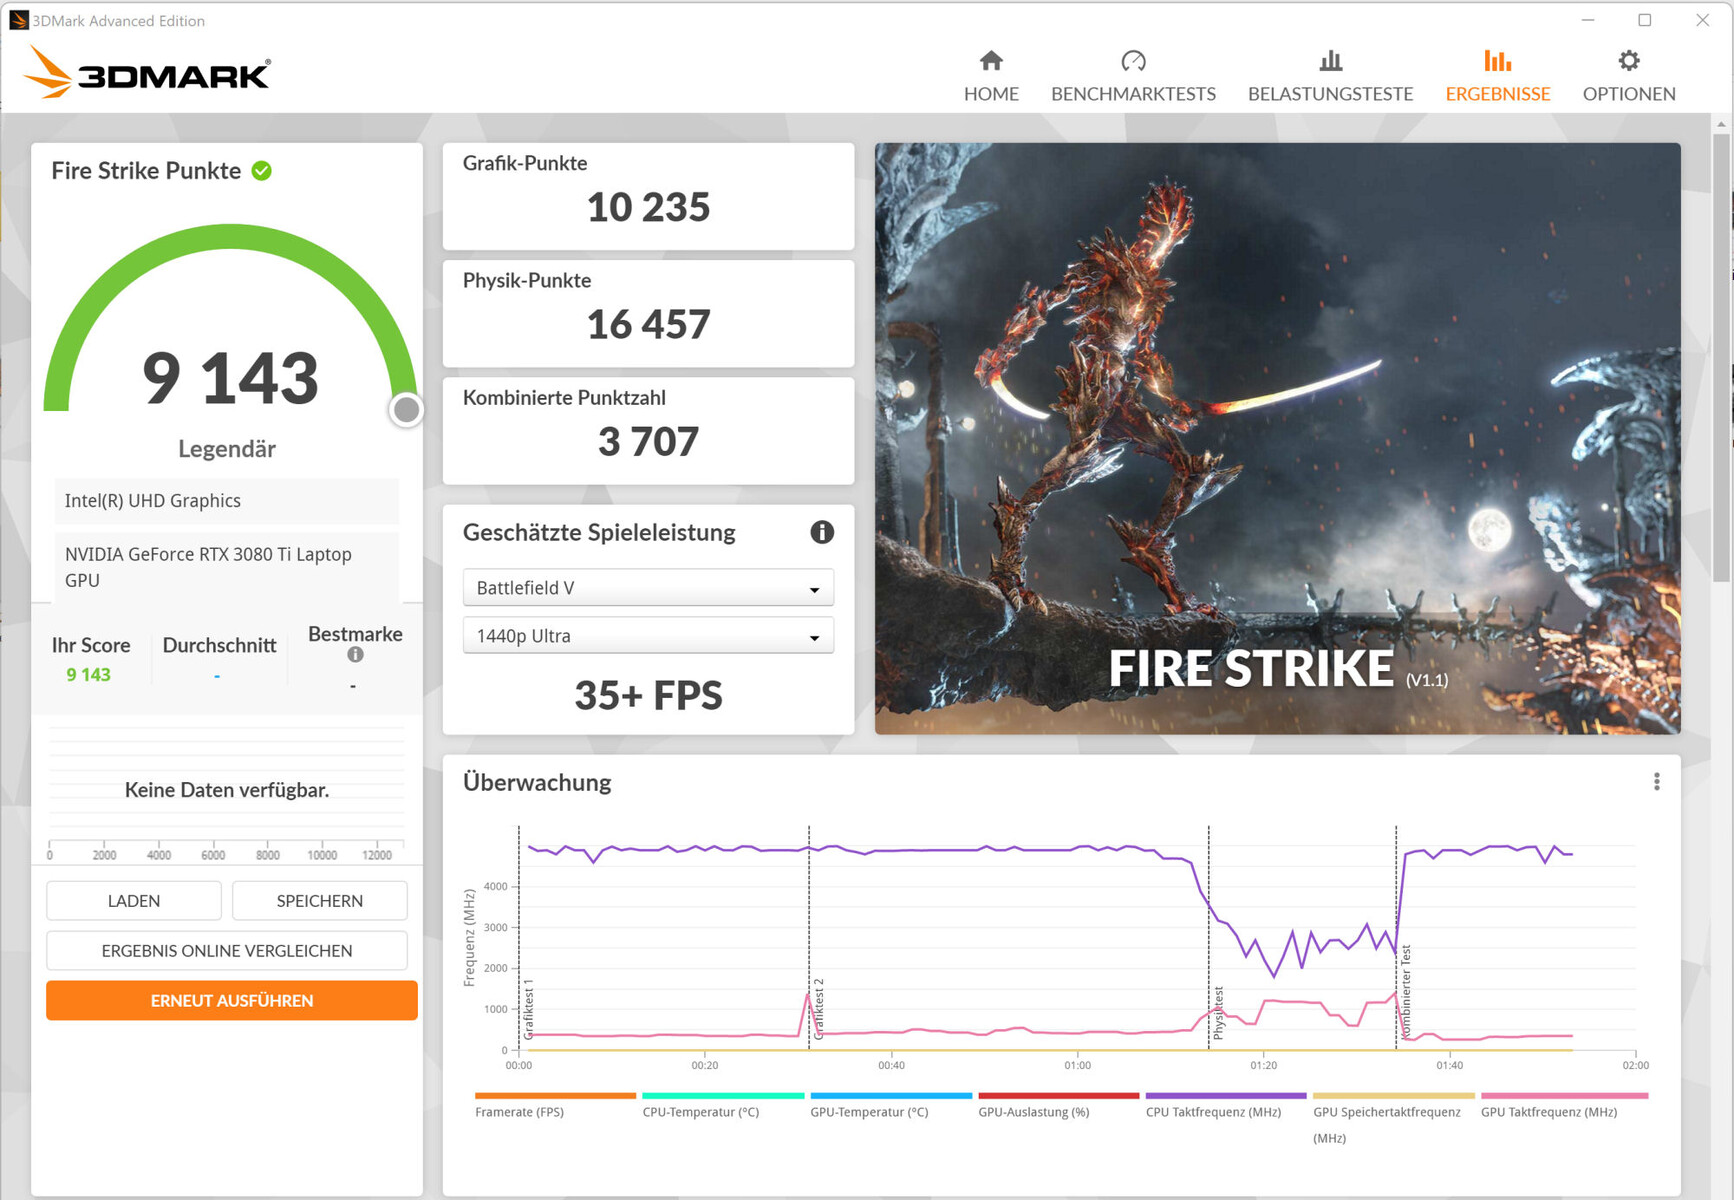
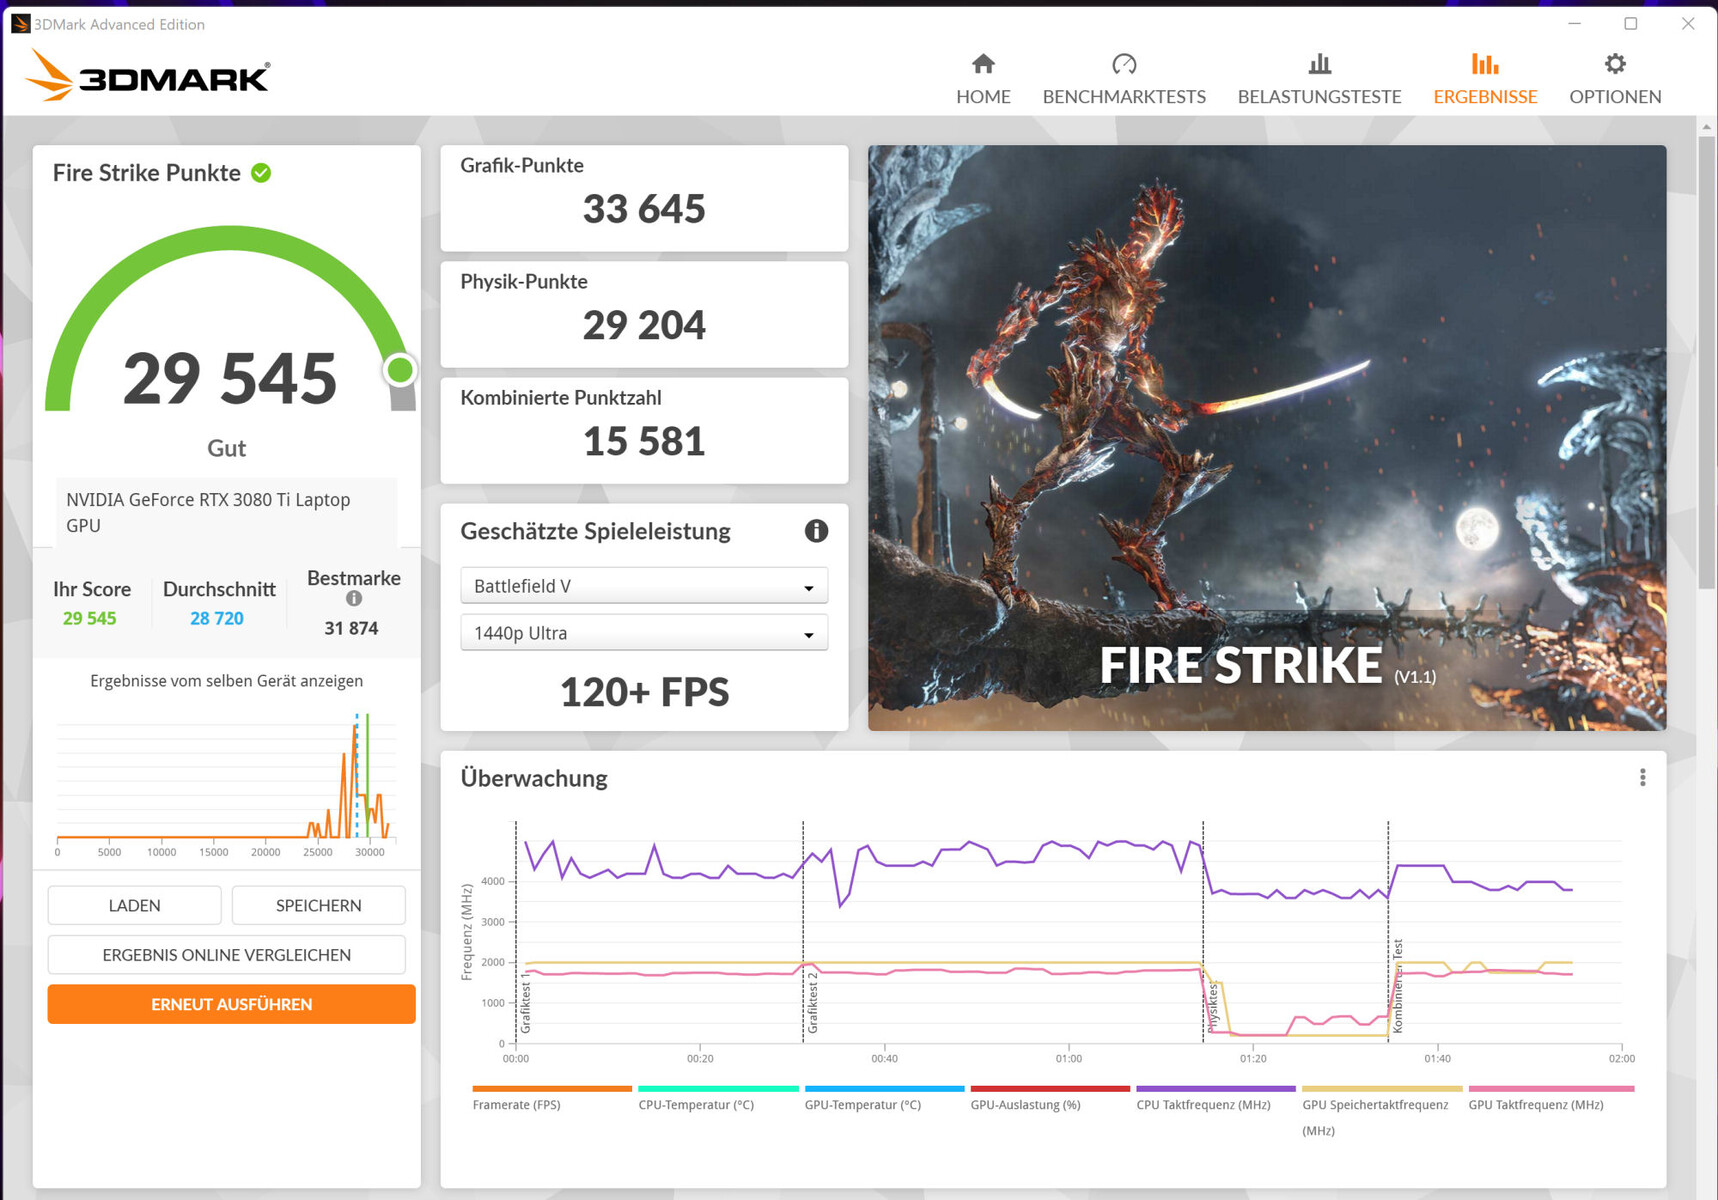
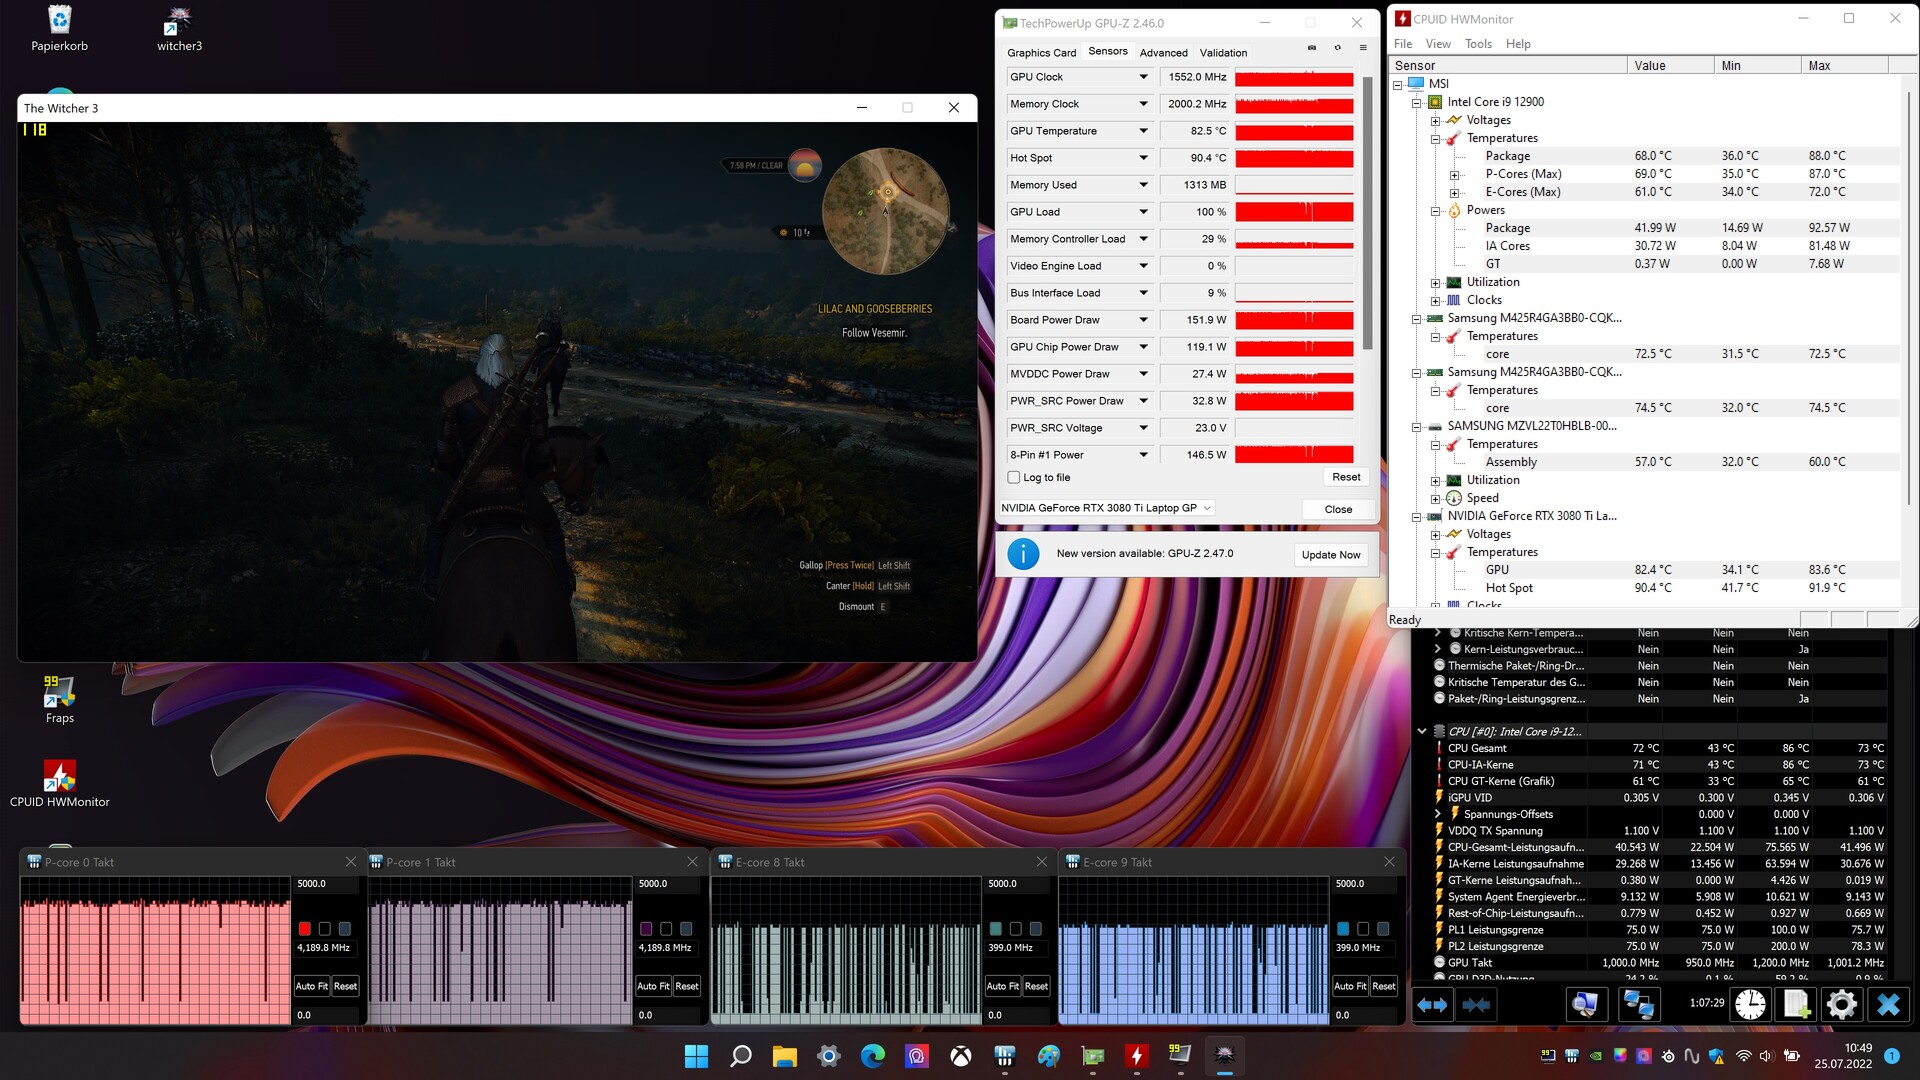
GeForce RTX 3080 Ti bärbar dator (TGP: 175 watt, 16 GB GDDR6 VRAM) i MSI Titan GT77 gav några av de bästa resultat vi sett från denna GPU hittills. TGP utnyttjas dock inte fullt ut, vilket framgår av testet Witcher 3. Profilen "Extreme Performance" erbjuder alternativ för överklockning av GPU:n och grafikminnet. Advanced Optimus stöds inte. För att växla mellan dGPU och Optimus krävs alltid att datorn startas om
| 3DMark Performance rating - Percent | |
| Genomsnitt av klass Gaming | |
| MSI Titan GT77 12UHS | |
| Alienware x17 R2 P48E | |
| MSI Titan GT77 12UHS | |
| MSI Titan GT77 12UHS 4k -1! | |
| Razer Blade 17 Early 2022 | |
| Schenker XMG Ultra 17 Rocket Lake | |
| Genomsnitt NVIDIA GeForce RTX 3080 Ti Laptop GPU | |
| 3DMark 11 - 1280x720 Performance GPU | |
| Genomsnitt av klass Gaming (21841 - 80022, n=103, senaste 2 åren) | |
| MSI Titan GT77 12UHS | |
| Alienware x17 R2 P48E | |
| MSI Titan GT77 12UHS 4k | |
| Razer Blade 17 Early 2022 | |
| MSI Titan GT77 12UHS (dGPU, Extreme Leistung) | |
| Schenker XMG Ultra 17 Rocket Lake | |
| Genomsnitt NVIDIA GeForce RTX 3080 Ti Laptop GPU (13920 - 45841, n=45) | |
| 3DMark | |
| 1920x1080 Fire Strike Graphics | |
| Genomsnitt av klass Gaming (18629 - 62849, n=112, senaste 2 åren) | |
| MSI Titan GT77 12UHS | |
| MSI Titan GT77 12UHS (dGPU, Extreme Leistung) | |
| Alienware x17 R2 P48E | |
| MSI Titan GT77 12UHS 4k | |
| Razer Blade 17 Early 2022 | |
| Schenker XMG Ultra 17 Rocket Lake | |
| Genomsnitt NVIDIA GeForce RTX 3080 Ti Laptop GPU (6928 - 34439, n=43) | |
| 2560x1440 Time Spy Graphics | |
| Genomsnitt av klass Gaming (6387 - 26212, n=112, senaste 2 åren) | |
| MSI Titan GT77 12UHS | |
| Alienware x17 R2 P48E | |
| MSI Titan GT77 12UHS (dGPU, Extreme Leistung) | |
| Schenker XMG Ultra 17 Rocket Lake | |
| MSI Titan GT77 12UHS 4k | |
| Razer Blade 17 Early 2022 | |
| Genomsnitt NVIDIA GeForce RTX 3080 Ti Laptop GPU (4921 - 13835, n=43) | |
| 2560x1440 Port Royal Graphics | |
| Genomsnitt av klass Gaming (4395 - 17286, n=71, senaste 2 åren) | |
| Alienware x17 R2 P48E | |
| MSI Titan GT77 12UHS | |
| MSI Titan GT77 12UHS (dGPU, Extreme Leistung) | |
| Razer Blade 17 Early 2022 | |
| Schenker XMG Ultra 17 Rocket Lake | |
| Genomsnitt NVIDIA GeForce RTX 3080 Ti Laptop GPU (6423 - 8462, n=28) | |
| Geekbench 5.5 - OpenCL Score | |
| Genomsnitt av klass Gaming (80702 - 277970, n=98, senaste 2 åren) | |
| Alienware x17 R2 P48E | |
| MSI Titan GT77 12UHS (dGPU, Extreme Leistung) | |
| MSI Titan GT77 12UHS 4k | |
| Asus ROG Zephyrus Duo 16 GX650RX | |
| Schenker XMG Ultra 17 Rocket Lake | |
| Genomsnitt NVIDIA GeForce RTX 3080 Ti Laptop GPU (88580 - 151633, n=41) | |
| MSI Titan GT77 12UHS | |
| Razer Blade 17 Early 2022 | |
| Gigabyte Aero 16 YE5 | |
| V-Ray Benchmark Next 4.10 | |
| GPU | |
| Genomsnitt av klass Gaming (427 - 1627, n=96, senaste 2 åren) | |
| MSI Titan GT77 12UHS (v4.10.07, dGPU, Extreme Leistung) | |
| MSI Titan GT77 12UHS (v4.10.07 ) | |
| Asus ROG Zephyrus Duo 16 GX650RX (v4.10.07 ) | |
| MSI Titan GT77 12UHS 4k (v4.10.07 ) | |
| Genomsnitt NVIDIA GeForce RTX 3080 Ti Laptop GPU (311 - 552, n=35) | |
| Razer Blade 17 Early 2022 (v4.10.07 ) | |
| Gigabyte Aero 16 YE5 (v4.10.07 ) | |
| Schenker XMG Ultra 17 Rocket Lake (v4.10.07 ) | |
| CPU | |
| Genomsnitt av klass Gaming (10048 - 45327, n=94, senaste 2 åren) | |
| MSI Titan GT77 12UHS 4k (v4.10.07 ) | |
| MSI Titan GT77 12UHS (v4.10.07, dGPU, Extreme Leistung) | |
| MSI Titan GT77 12UHS (v4.10.07 ) | |
| Genomsnitt NVIDIA GeForce RTX 3080 Ti Laptop GPU (5564 - 23947, n=35) | |
| Gigabyte Aero 16 YE5 (v4.10.07 ) | |
| Schenker XMG Ultra 17 Rocket Lake (v4.10.07 ) | |
| Asus ROG Zephyrus Duo 16 GX650RX (v4.10.07 ) | |
| Razer Blade 17 Early 2022 (v4.10.07 ) | |
| Blender | |
| v3.3 Classroom CUDA | |
| MSI Titan GT77 12UHS 4k | |
| MSI Titan GT77 12UHS (dGPU, Extreme Leistung) | |
| Genomsnitt NVIDIA GeForce RTX 3080 Ti Laptop GPU (32 - 41, n=13) | |
| Genomsnitt av klass Gaming (15 - 228, n=103, senaste 2 åren) | |
| MSI Titan GT77 12UHS | |
| v3.3 Classroom OPTIX/RTX | |
| MSI Titan GT77 12UHS 4k | |
| Genomsnitt NVIDIA GeForce RTX 3080 Ti Laptop GPU (20 - 28, n=13) | |
| MSI Titan GT77 12UHS | |
| MSI Titan GT77 12UHS (dGPU, Extreme Leistung) | |
| Genomsnitt av klass Gaming (9 - 32, n=103, senaste 2 åren) | |
* ... mindre är bättre
| 3DMark 11 Performance | 35867 poäng | |
| 3DMark Cloud Gate Standard Score | 53629 poäng | |
| 3DMark Fire Strike Score | 27273 poäng | |
| 3DMark Fire Strike Extreme Score | 15613 poäng | |
| 3DMark Time Spy Score | 12865 poäng | |
Hjälp | ||
Spelprestanda
Hårdvaran är utformad för 4K-spel med höga till maximala inställningar. Bildfrekvensen är högre än vad en RTX 3080 Ti i genomsnitt klarar av. När GeForce GPU:n drev skärmen direkt gav den ofta de bästa bildfrekvenser vi hittills sett från ett RTX 3080 Ti. I vilket fall som helst, som Witcher 3 -testet visar, levererar den bärbara datorn bra och stabila resultat.
| The Witcher 3 | |
| 1920x1080 Ultra Graphics & Postprocessing (HBAO+) | |
| Genomsnitt av klass Gaming (104.7 - 240, n=7, senaste 2 åren) | |
| MSI Titan GT77 12UHS (dGPU, Extreme Leistung) | |
| MSI Titan GT77 12UHS | |
| Alienware x17 R2 P48E | |
| MSI Titan GT77 12UHS 4k | |
| Schenker XMG Ultra 17 Rocket Lake | |
| Razer Blade 17 Early 2022 | |
| Genomsnitt NVIDIA GeForce RTX 3080 Ti Laptop GPU (30 - 130.6, n=43) | |
| 3840x2160 Ultra Graphics & Postprocessing (HBAO+) | |
| Genomsnitt av klass Gaming (112.4 - 114.8, n=2, senaste 2 åren) | |
| MSI Titan GT77 12UHS (dGPU, Extreme Leistung) | |
| MSI Titan GT77 12UHS 4k | |
| Razer Blade 17 Early 2022 | |
| Genomsnitt NVIDIA GeForce RTX 3080 Ti Laptop GPU (44.8 - 62.7, n=5) | |
| Dota 2 Reborn | |
| 1920x1080 ultra (3/3) best looking | |
| MSI Titan GT77 12UHS | |
| MSI Titan GT77 12UHS (dGPU, Extreme Leistung) | |
| MSI Titan GT77 12UHS 4k | |
| Alienware x17 R2 P48E | |
| Schenker XMG Ultra 17 Rocket Lake | |
| Genomsnitt av klass Gaming (84.8 - 252, n=104, senaste 2 åren) | |
| Genomsnitt NVIDIA GeForce RTX 3080 Ti Laptop GPU (29.9 - 170.5, n=45) | |
| Razer Blade 17 Early 2022 | |
| 3840x2160 ultra (3/3) best looking | |
| Genomsnitt av klass Gaming (114.9 - 199.2, n=32, senaste 2 åren) | |
| MSI Titan GT77 12UHS (dGPU, Extreme Leistung) | |
| MSI Titan GT77 12UHS 4k | |
| Genomsnitt NVIDIA GeForce RTX 3080 Ti Laptop GPU (70.8 - 155.6, n=19) | |
| Razer Blade 17 Early 2022 | |
| X-Plane 11.11 | |
| 3840x2160 high (fps_test=3) | |
| MSI Titan GT77 12UHS (dGPU, Extreme Leistung) | |
| MSI Titan GT77 12UHS 4k | |
| Genomsnitt av klass Gaming (60 - 124.1, n=32, senaste 2 åren) | |
| Genomsnitt NVIDIA GeForce RTX 3080 Ti Laptop GPU (32.9 - 109.5, n=20) | |
| Razer Blade 17 Early 2022 | |
| 1920x1080 high (fps_test=3) | |
| MSI Titan GT77 12UHS | |
| MSI Titan GT77 12UHS (dGPU, Extreme Leistung) | |
| MSI Titan GT77 12UHS 4k | |
| Schenker XMG Ultra 17 Rocket Lake | |
| Alienware x17 R2 P48E | |
| Genomsnitt NVIDIA GeForce RTX 3080 Ti Laptop GPU (32.6 - 127, n=45) | |
| Genomsnitt av klass Gaming (55.5 - 148.5, n=106, senaste 2 åren) | |
| Razer Blade 17 Early 2022 | |
| Final Fantasy XV Benchmark | |
| 3840x2160 High Quality | |
| Genomsnitt av klass Gaming (49.1 - 111.8, n=33, senaste 2 åren) | |
| MSI Titan GT77 12UHS (1.3, dGPU, Extreme Leistung) | |
| MSI Titan GT77 12UHS 4k (1.3) | |
| Razer Blade 17 Early 2022 (1.3) | |
| Genomsnitt NVIDIA GeForce RTX 3080 Ti Laptop GPU (35.1 - 61.2, n=18) | |
| 1920x1080 High Quality | |
| Genomsnitt av klass Gaming (64.2 - 215, n=91, senaste 2 åren) | |
| MSI Titan GT77 12UHS (1.3, dGPU, Extreme Leistung) | |
| MSI Titan GT77 12UHS (1.3) | |
| MSI Titan GT77 12UHS 4k (1.3) | |
| Alienware x17 R2 P48E (1.3) | |
| Genomsnitt NVIDIA GeForce RTX 3080 Ti Laptop GPU (30.7 - 140.6, n=42) | |
| Razer Blade 17 Early 2022 (1.3) | |
| GTA V | |
| 3840x2160 Highest AA:4xMSAA + FX AF:16x | |
| Genomsnitt av klass Gaming (53.9 - 123.2, n=25, senaste 2 åren) | |
| MSI Titan GT77 12UHS (dGPU, Extreme Leistung) | |
| MSI Titan GT77 12UHS 4k | |
| Razer Blade 17 Early 2022 | |
| Genomsnitt NVIDIA GeForce RTX 3080 Ti Laptop GPU (37.7 - 67.2, n=14) | |
| 1920x1080 Highest AA:4xMSAA + FX AF:16x | |
| MSI Titan GT77 12UHS 4k | |
| Genomsnitt av klass Gaming (67.1 - 186.9, n=90, senaste 2 åren) | |
| MSI Titan GT77 12UHS (dGPU, Extreme Leistung) | |
| MSI Titan GT77 12UHS | |
| Alienware x17 R2 P48E | |
| Genomsnitt NVIDIA GeForce RTX 3080 Ti Laptop GPU (30 - 139.2, n=42) | |
| Razer Blade 17 Early 2022 | |
| Strange Brigade | |
| 3840x2160 ultra AA:ultra AF:16 | |
| Genomsnitt av klass Gaming (83 - 187.2, n=34, senaste 2 åren) | |
| MSI Titan GT77 12UHS (1.47.22.14 D3D12, dGPU, Extreme Leistung) | |
| MSI Titan GT77 12UHS 4k (1.47.22.14 D3D12) | |
| Razer Blade 17 Early 2022 (1.47.22.14 D3D12) | |
| Genomsnitt NVIDIA GeForce RTX 3080 Ti Laptop GPU (61.7 - 100.7, n=15) | |
| 1920x1080 ultra AA:ultra AF:16 | |
| Genomsnitt av klass Gaming (113.6 - 458, n=83, senaste 2 åren) | |
| MSI Titan GT77 12UHS (1.47.22.14 D3D12) | |
| MSI Titan GT77 12UHS (1.47.22.14 D3D12, dGPU, Extreme Leistung) | |
| Alienware x17 R2 P48E (1.47.22.14 D3D12) | |
| MSI Titan GT77 12UHS 4k (1.47.22.14 D3D12) | |
| Razer Blade 17 Early 2022 (1.47.22.14 D3D12) | |
| Genomsnitt NVIDIA GeForce RTX 3080 Ti Laptop GPU (42.3 - 224, n=41) | |
| F1 2021 | |
| 3840x2160 Ultra High Preset + Raytracing AA:T AF:16x | |
| MSI Titan GT77 12UHS (874931, dGPU, Extreme Leistung) | |
| MSI Titan GT77 12UHS 4k (874931) | |
| Razer Blade 17 Early 2022 (874931) | |
| Genomsnitt NVIDIA GeForce RTX 3080 Ti Laptop GPU (41.1 - 70.2, n=18) | |
| 1920x1080 Ultra High Preset + Raytracing AA:T AF:16x | |
| MSI Titan GT77 12UHS (874931) | |
| MSI Titan GT77 12UHS (874931, dGPU, Extreme Leistung) | |
| Razer Blade 17 Early 2022 (874931) | |
| MSI Titan GT77 12UHS 4k (874931) | |
| Genomsnitt NVIDIA GeForce RTX 3080 Ti Laptop GPU (30.2 - 160.6, n=30) | |
| Far Cry 5 | |
| 3840x2160 Ultra Preset AA:T | |
| Genomsnitt av klass Gaming (n=1senaste 2 åren) | |
| MSI Titan GT77 12UHS 4k | |
| MSI Titan GT77 12UHS (dGPU, Extreme Leistung) | |
| Razer Blade 17 Early 2022 | |
| Genomsnitt NVIDIA GeForce RTX 3080 Ti Laptop GPU (45 - 76, n=9) | |
| 1920x1080 Ultra Preset AA:T | |
| MSI Titan GT77 12UHS (dGPU, Extreme Leistung) | |
| MSI Titan GT77 12UHS | |
| MSI Titan GT77 12UHS 4k | |
| Schenker XMG Ultra 17 Rocket Lake | |
| Genomsnitt NVIDIA GeForce RTX 3080 Ti Laptop GPU (111 - 162, n=24) | |
| Razer Blade 17 Early 2022 | |
| Genomsnitt av klass Gaming (70 - 151, n=6, senaste 2 åren) | |
Witcher 3 FPS graph
| låg | med. | hög | ultra | QHD | 4K | |
|---|---|---|---|---|---|---|
| GTA V (2015) | 187.3 | 186.6 | 182.3 | 134.4 | 117.8 | 121.7 |
| The Witcher 3 (2015) | 480 | 379 | 240 | 123.7 | 91.9 | |
| Dota 2 Reborn (2015) | 199.9 | 180.7 | 169.7 | 162.7 | 139.9 | |
| Final Fantasy XV Benchmark (2018) | 220 | 174.1 | 131 | 100.3 | 58.3 | |
| X-Plane 11.11 (2018) | 170.8 | 150.8 | 118.3 | 100.9 | ||
| Far Cry 5 (2018) | 199 | 169 | 161 | 151 | 134 | 76 |
| Strange Brigade (2018) | 519 | 286 | 233 | 206 | 156.2 | 93.7 |
| F1 2021 (2021) | 348 | 237 | 205 | 130.4 | 103.4 | 62.8 |
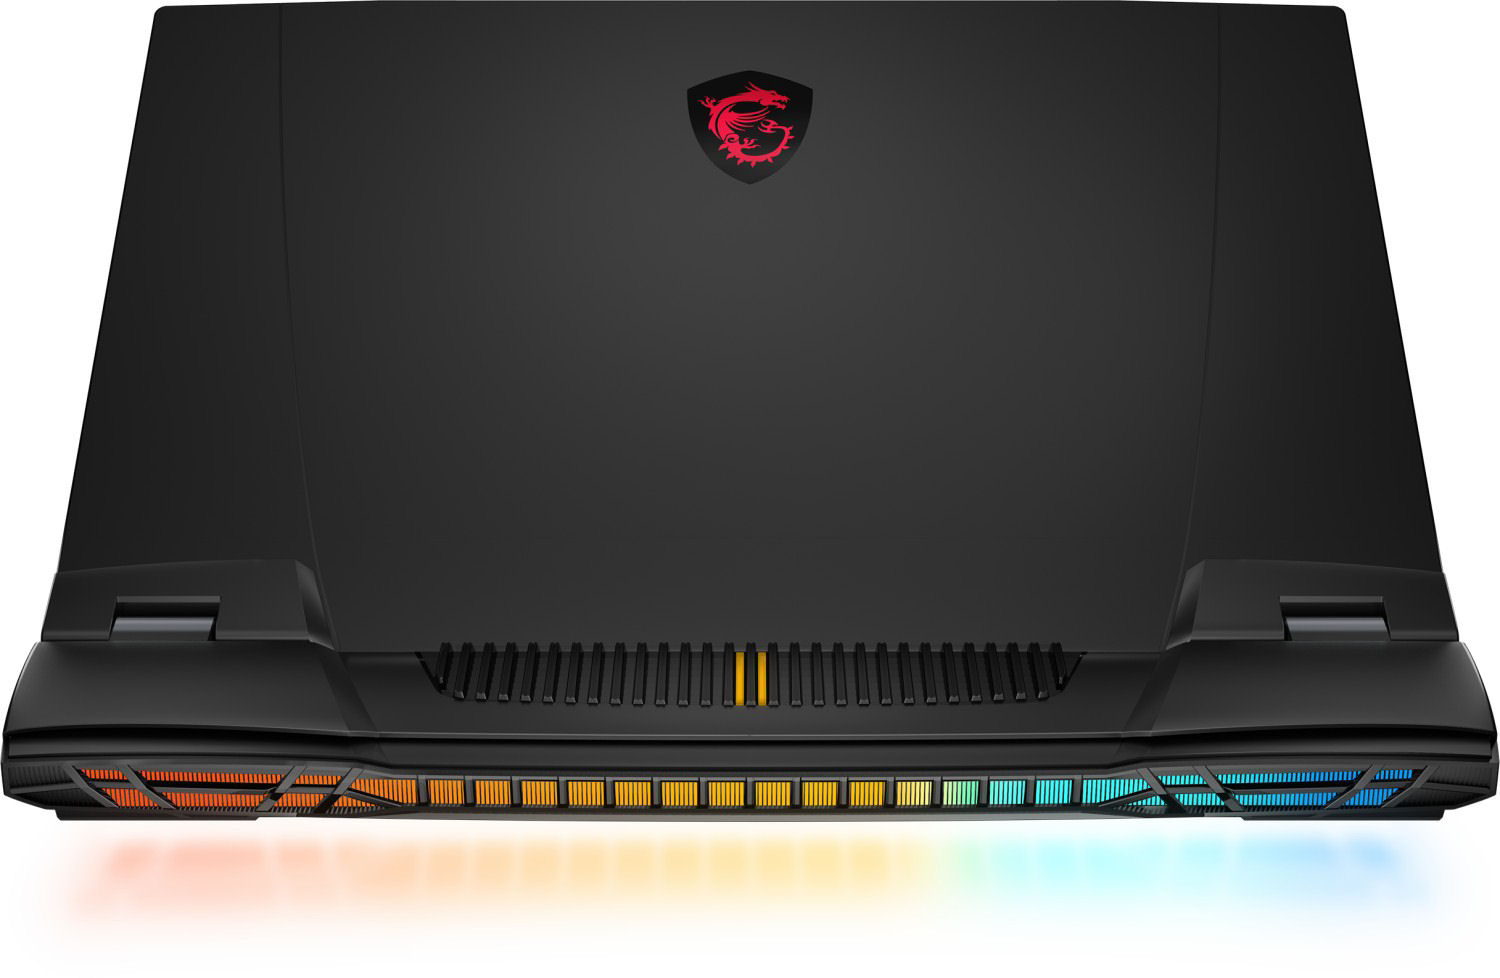
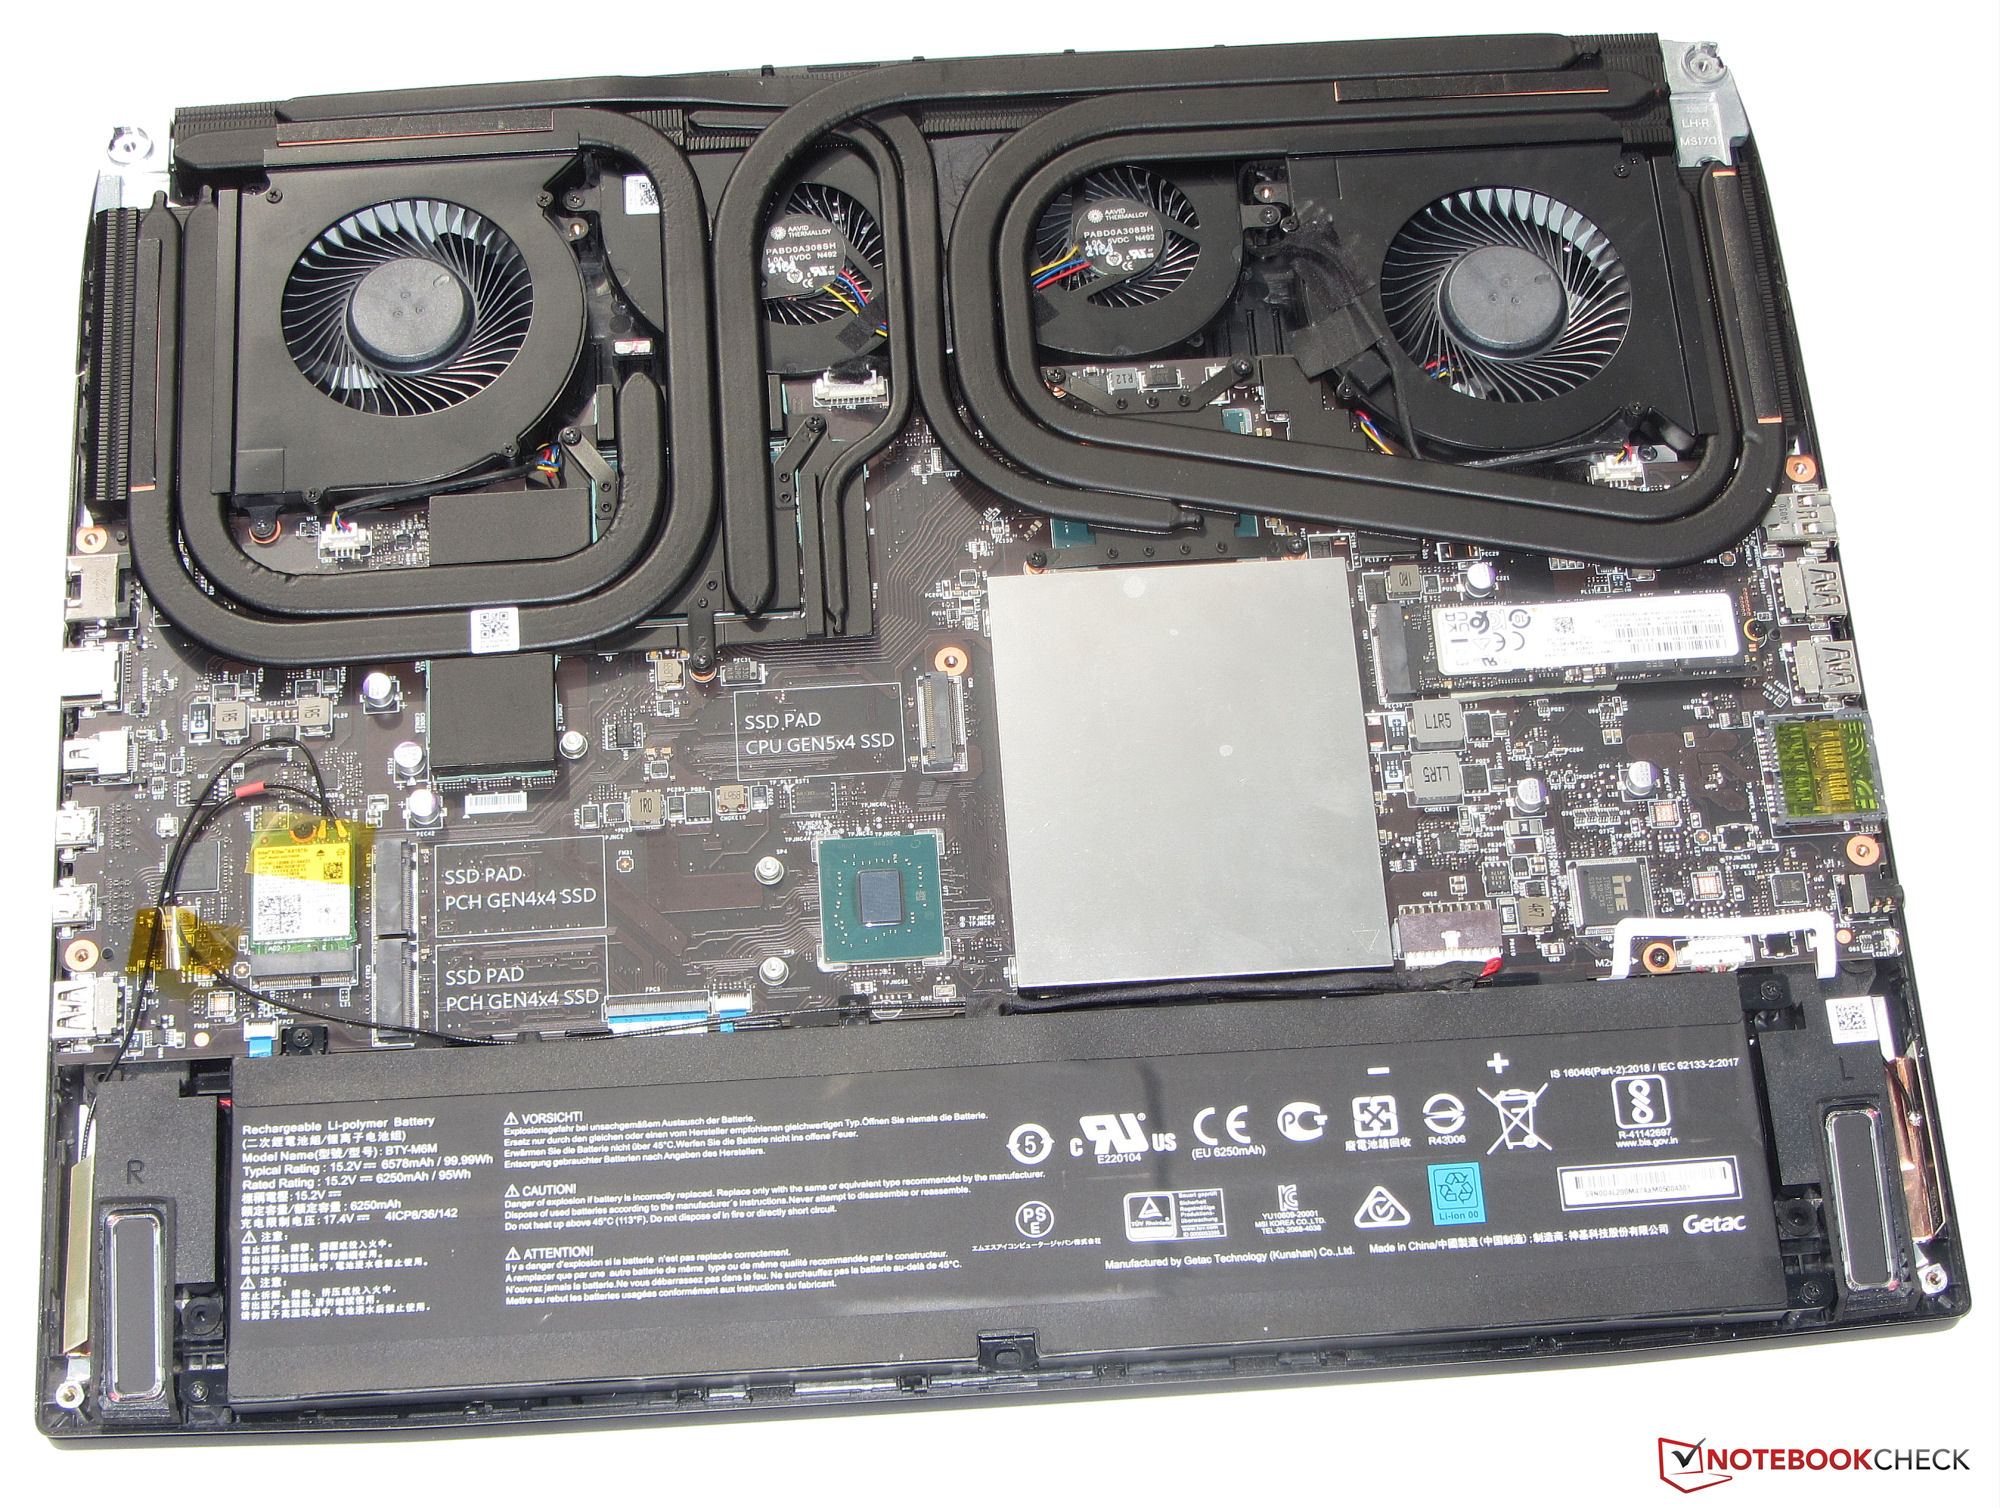
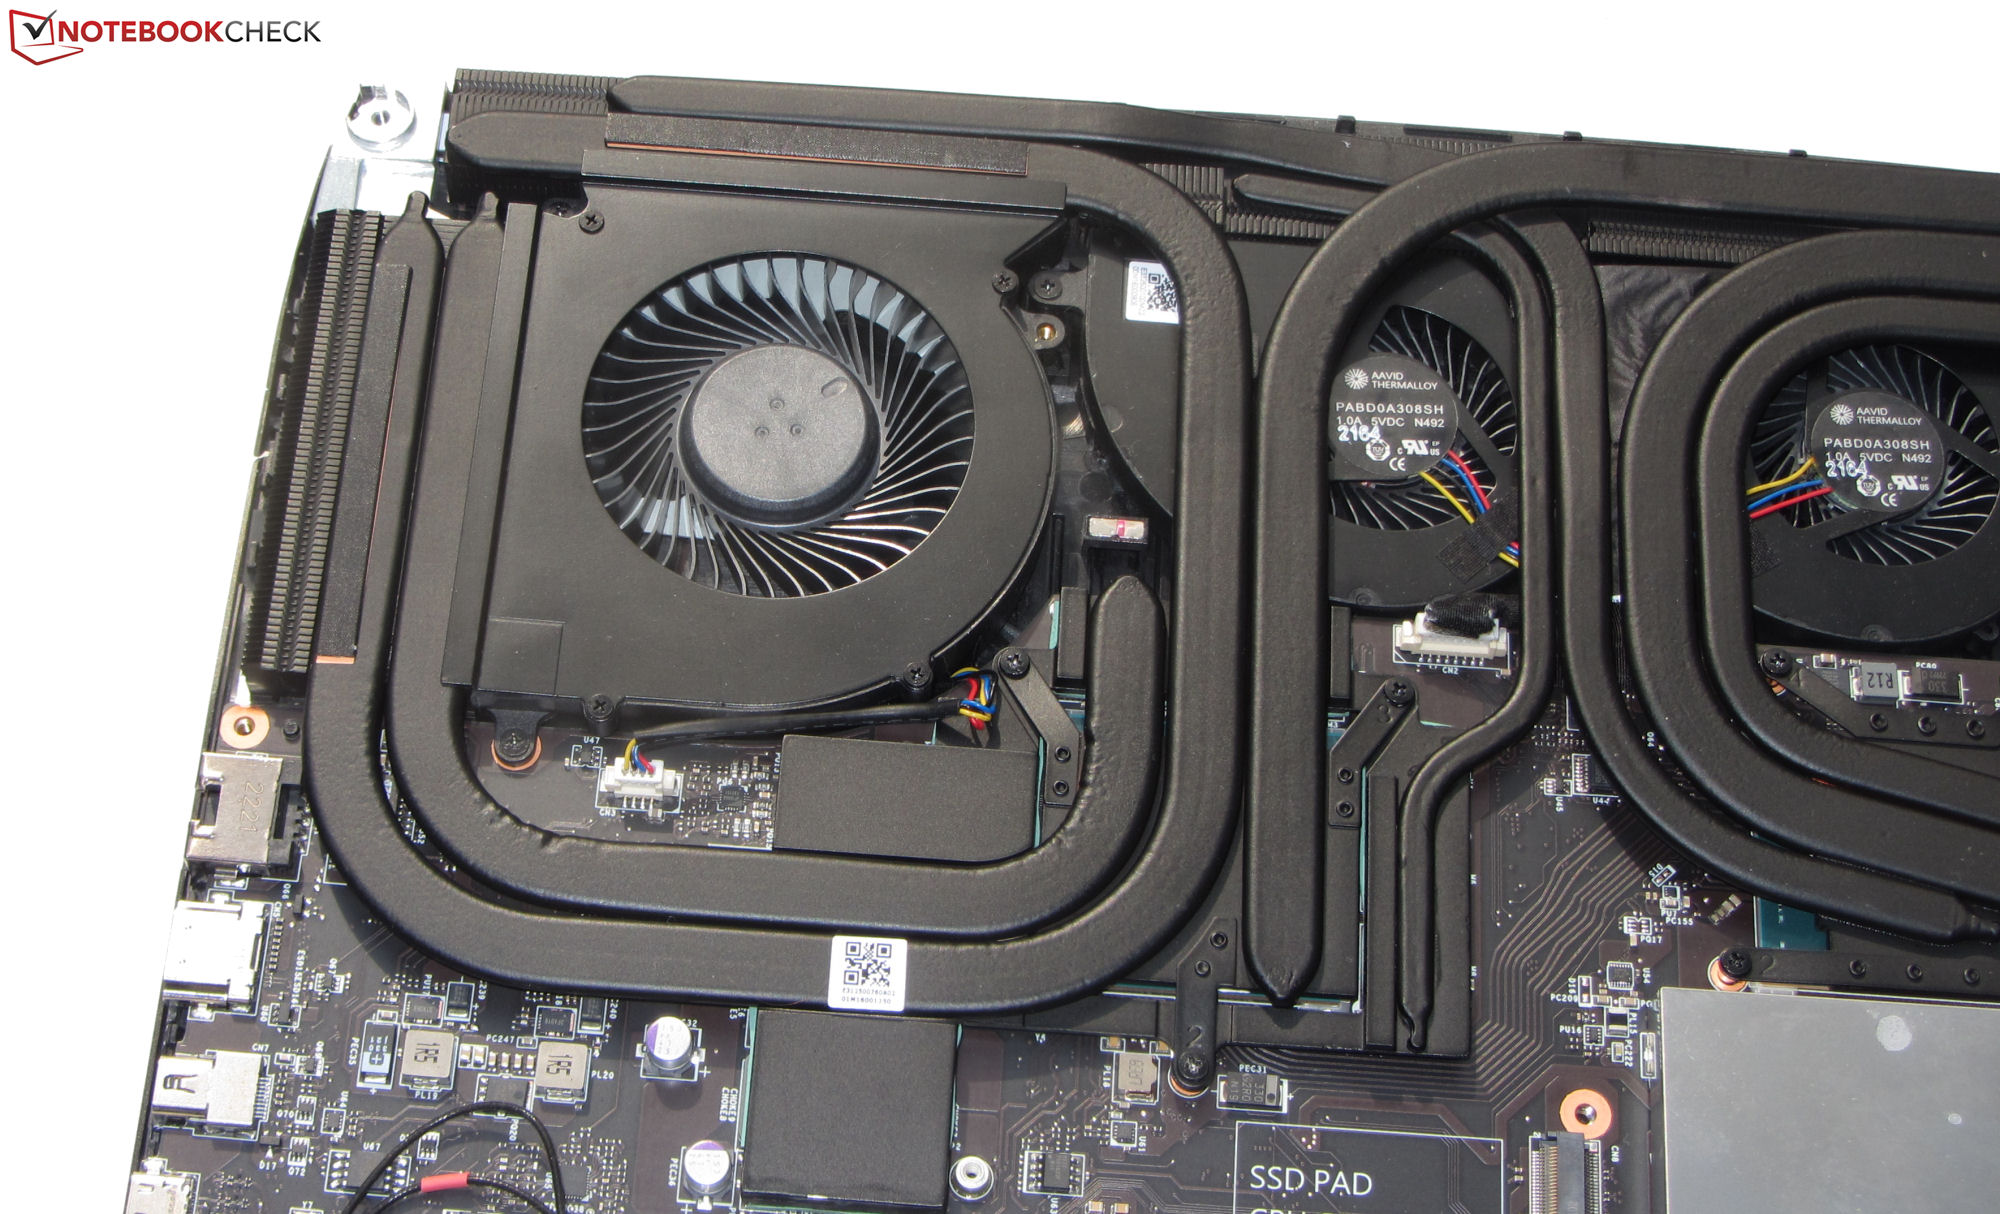
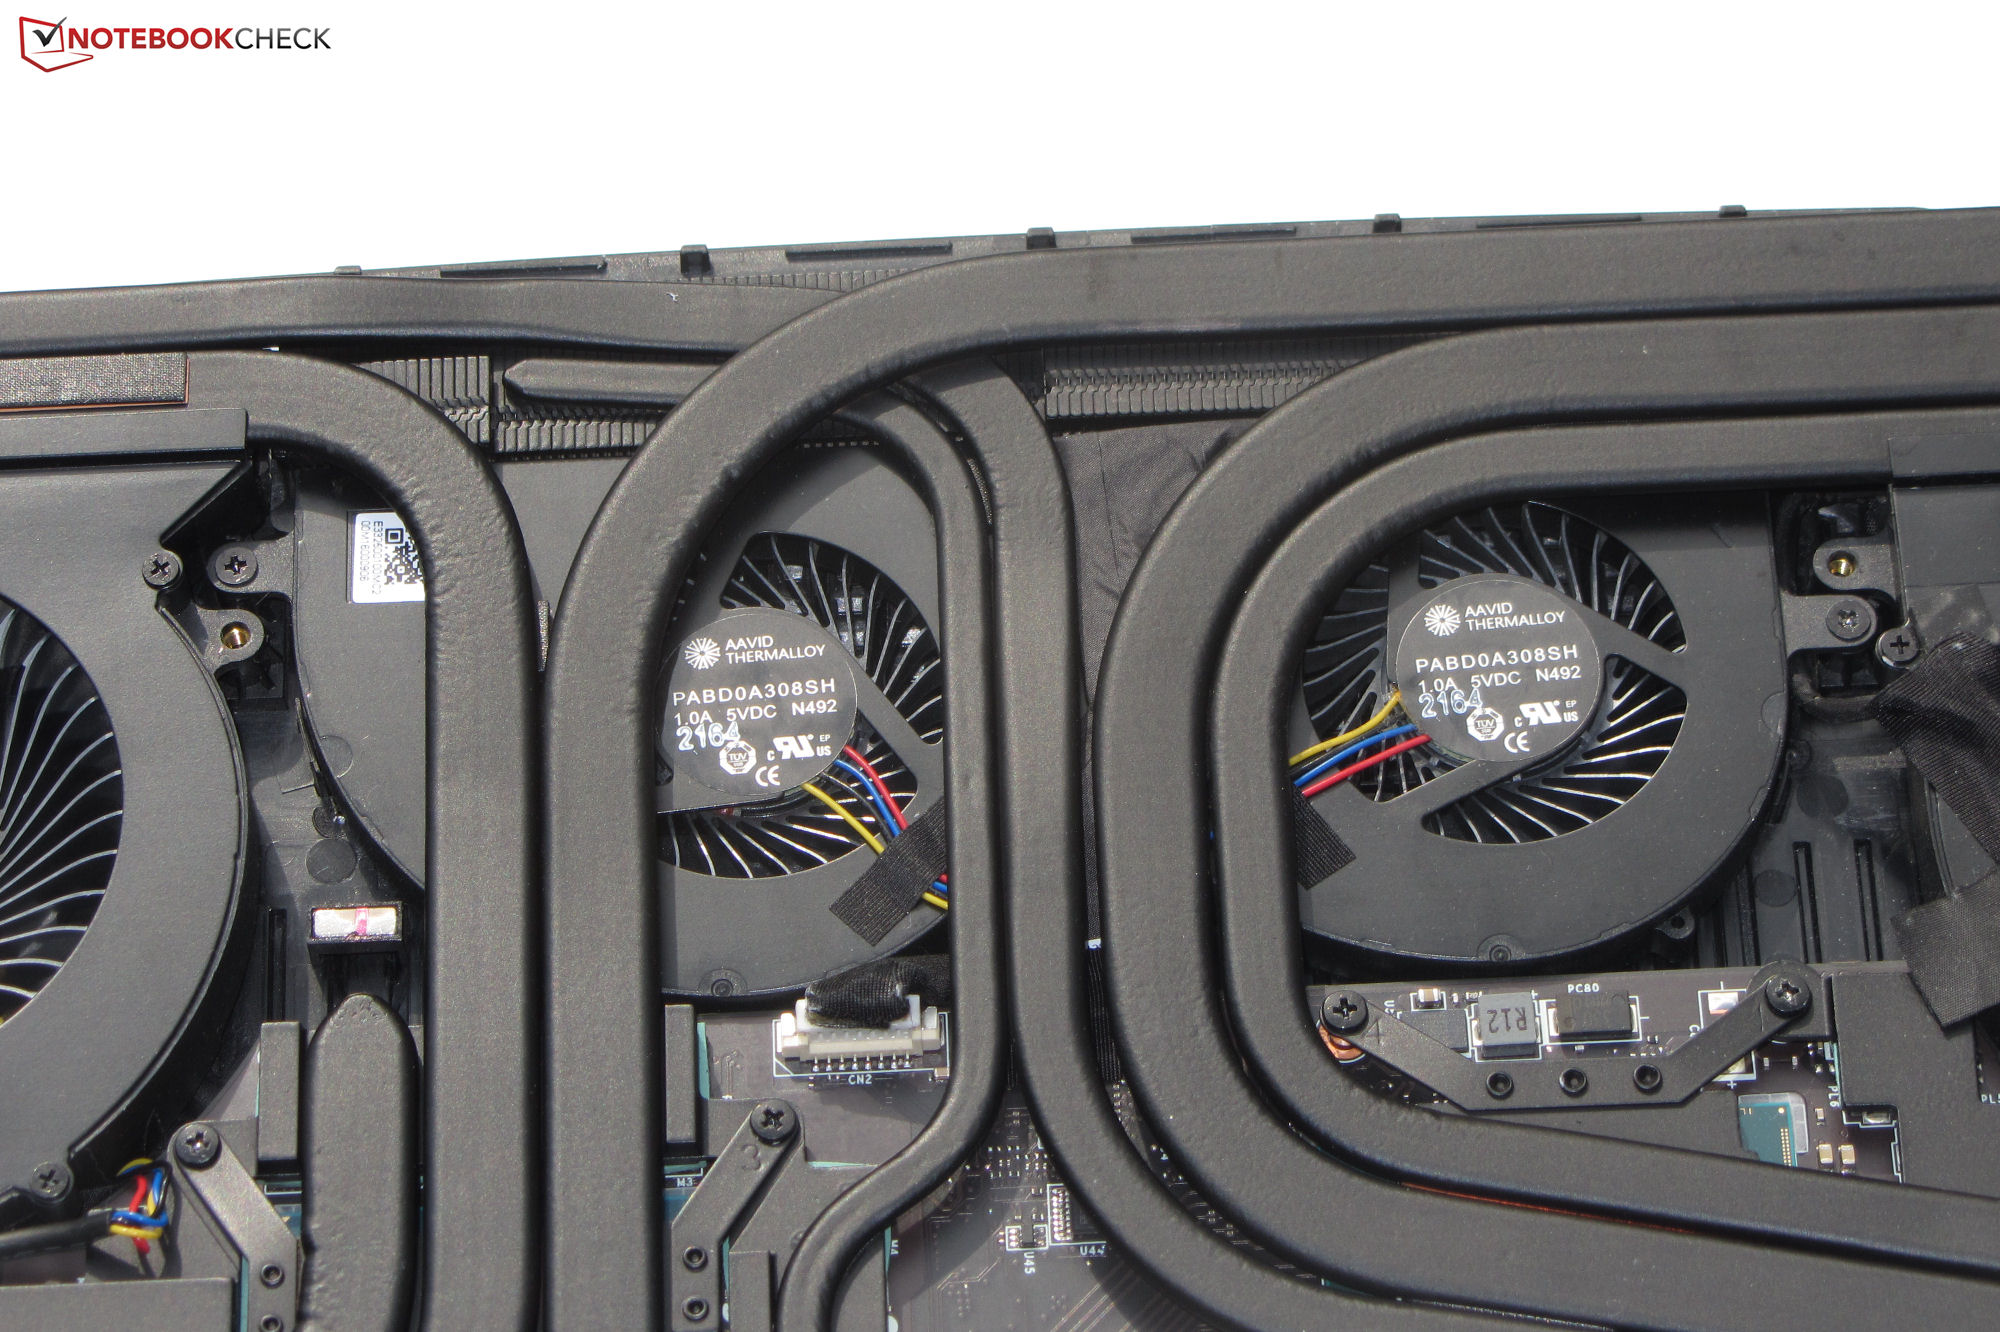
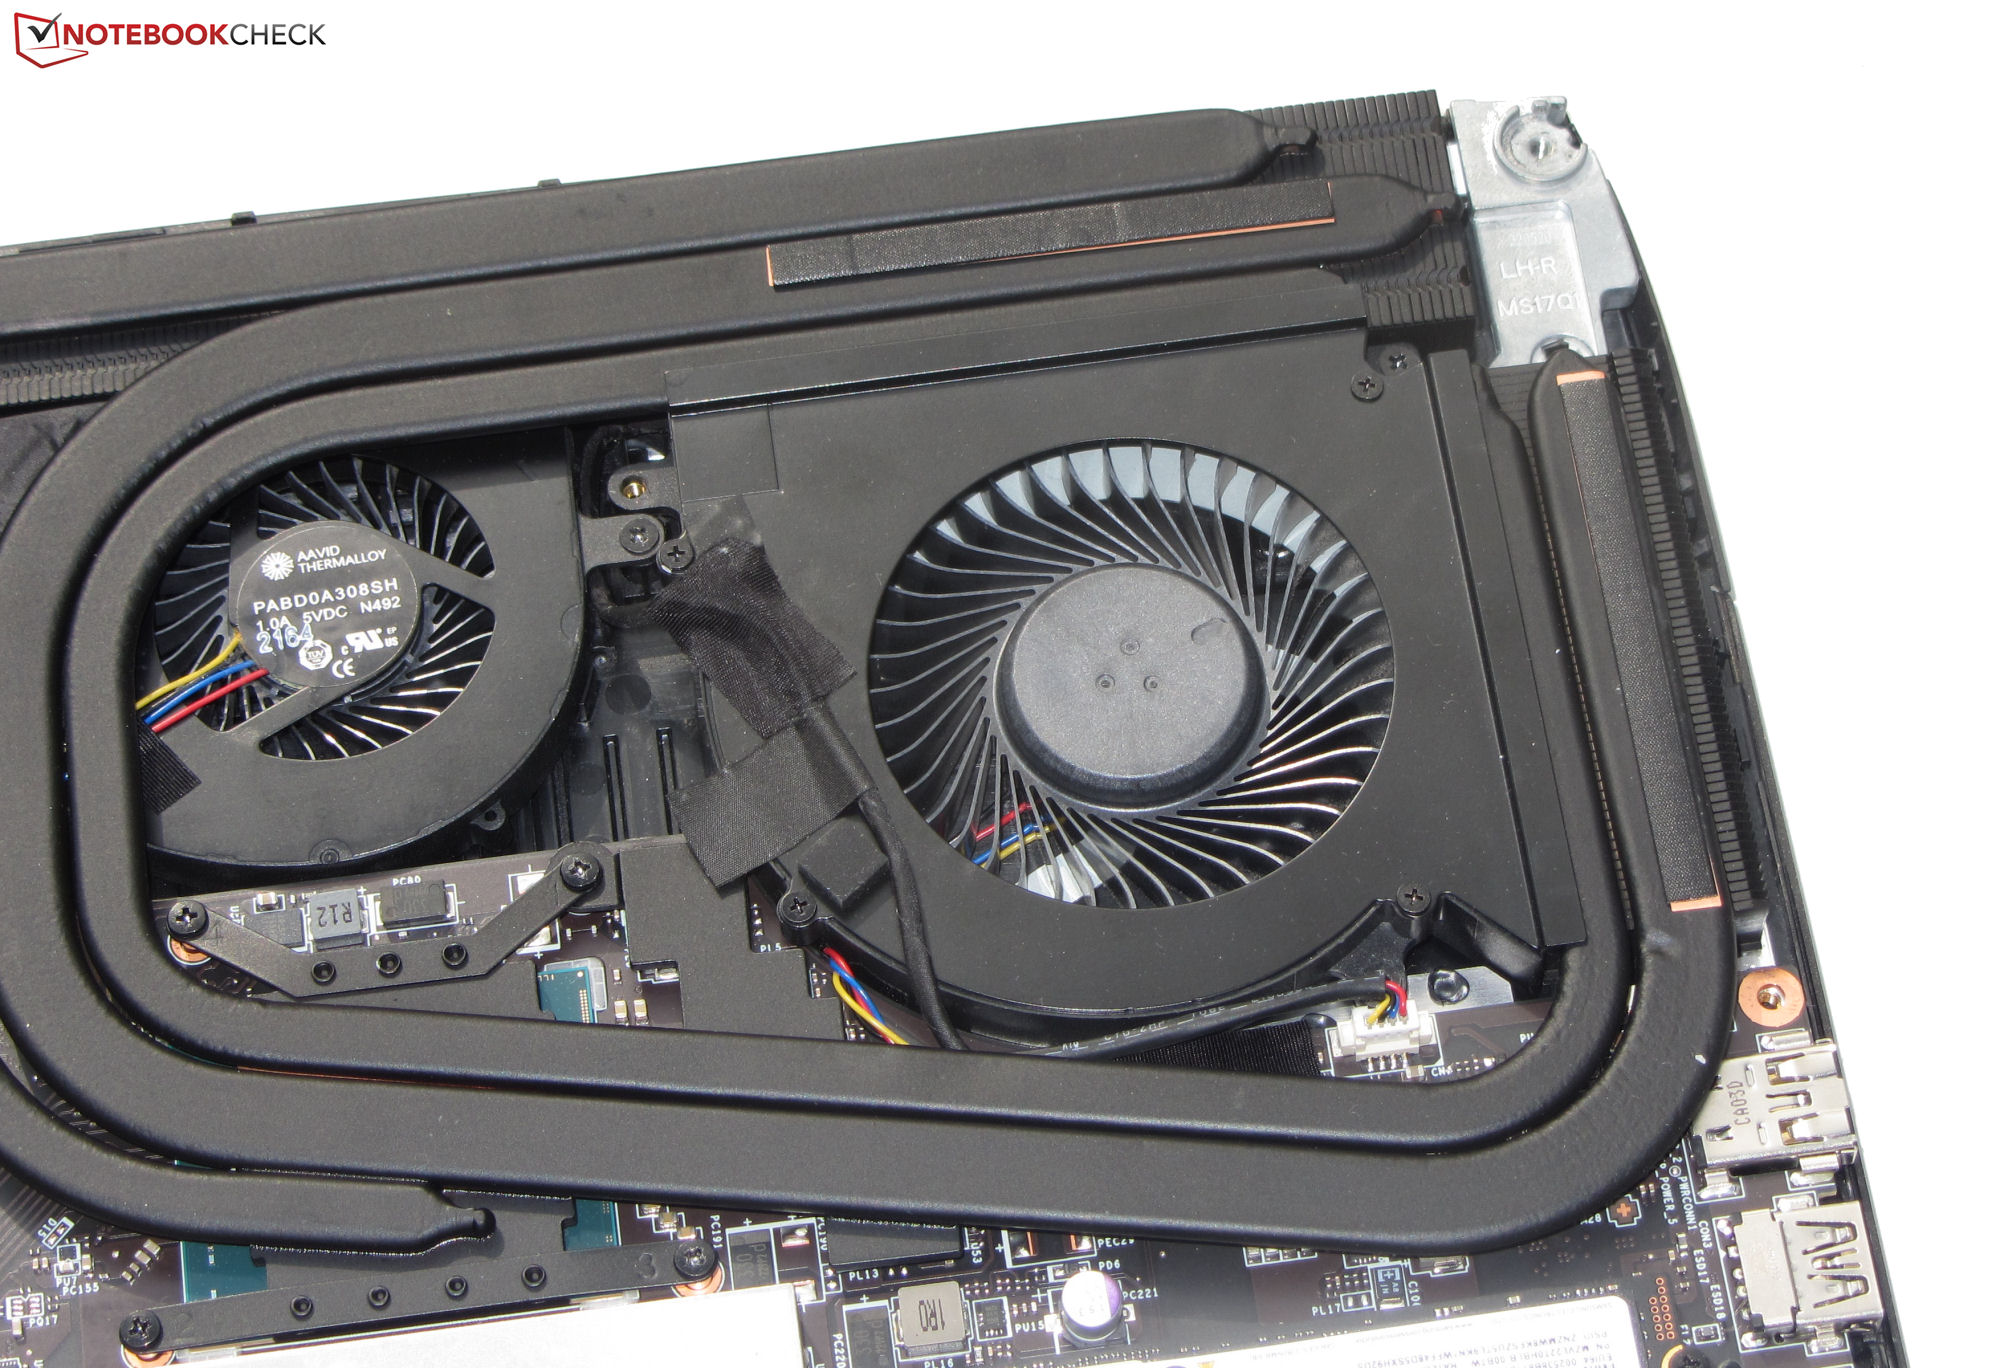
Utsläpp - MSI GT77 har fyra fläktar
Bullerutsläpp
De fyra fläktarna kan generera en hel del ljud: under belastning nådde ljudnivåerna 53 dB(A) under Witcher 3 -testet och 56 dB(A) under stresstestet. Vid tomgång eller låg belastning snurrar vanligtvis minst en av fläktarna och fläktljudet kan stiga till 42 dB(A). FHD Titan påverkas dock inte av detta. En möjlig förklaring är att fläktkontrollen på 4K-modellen kan vara något mer orolig på grund av den aktiva funktionen "Smart Auto". Profilen "Silent Mode" hjälper till att minska mängden buller när systemet är igång - på bekostnad av beräkningskraften
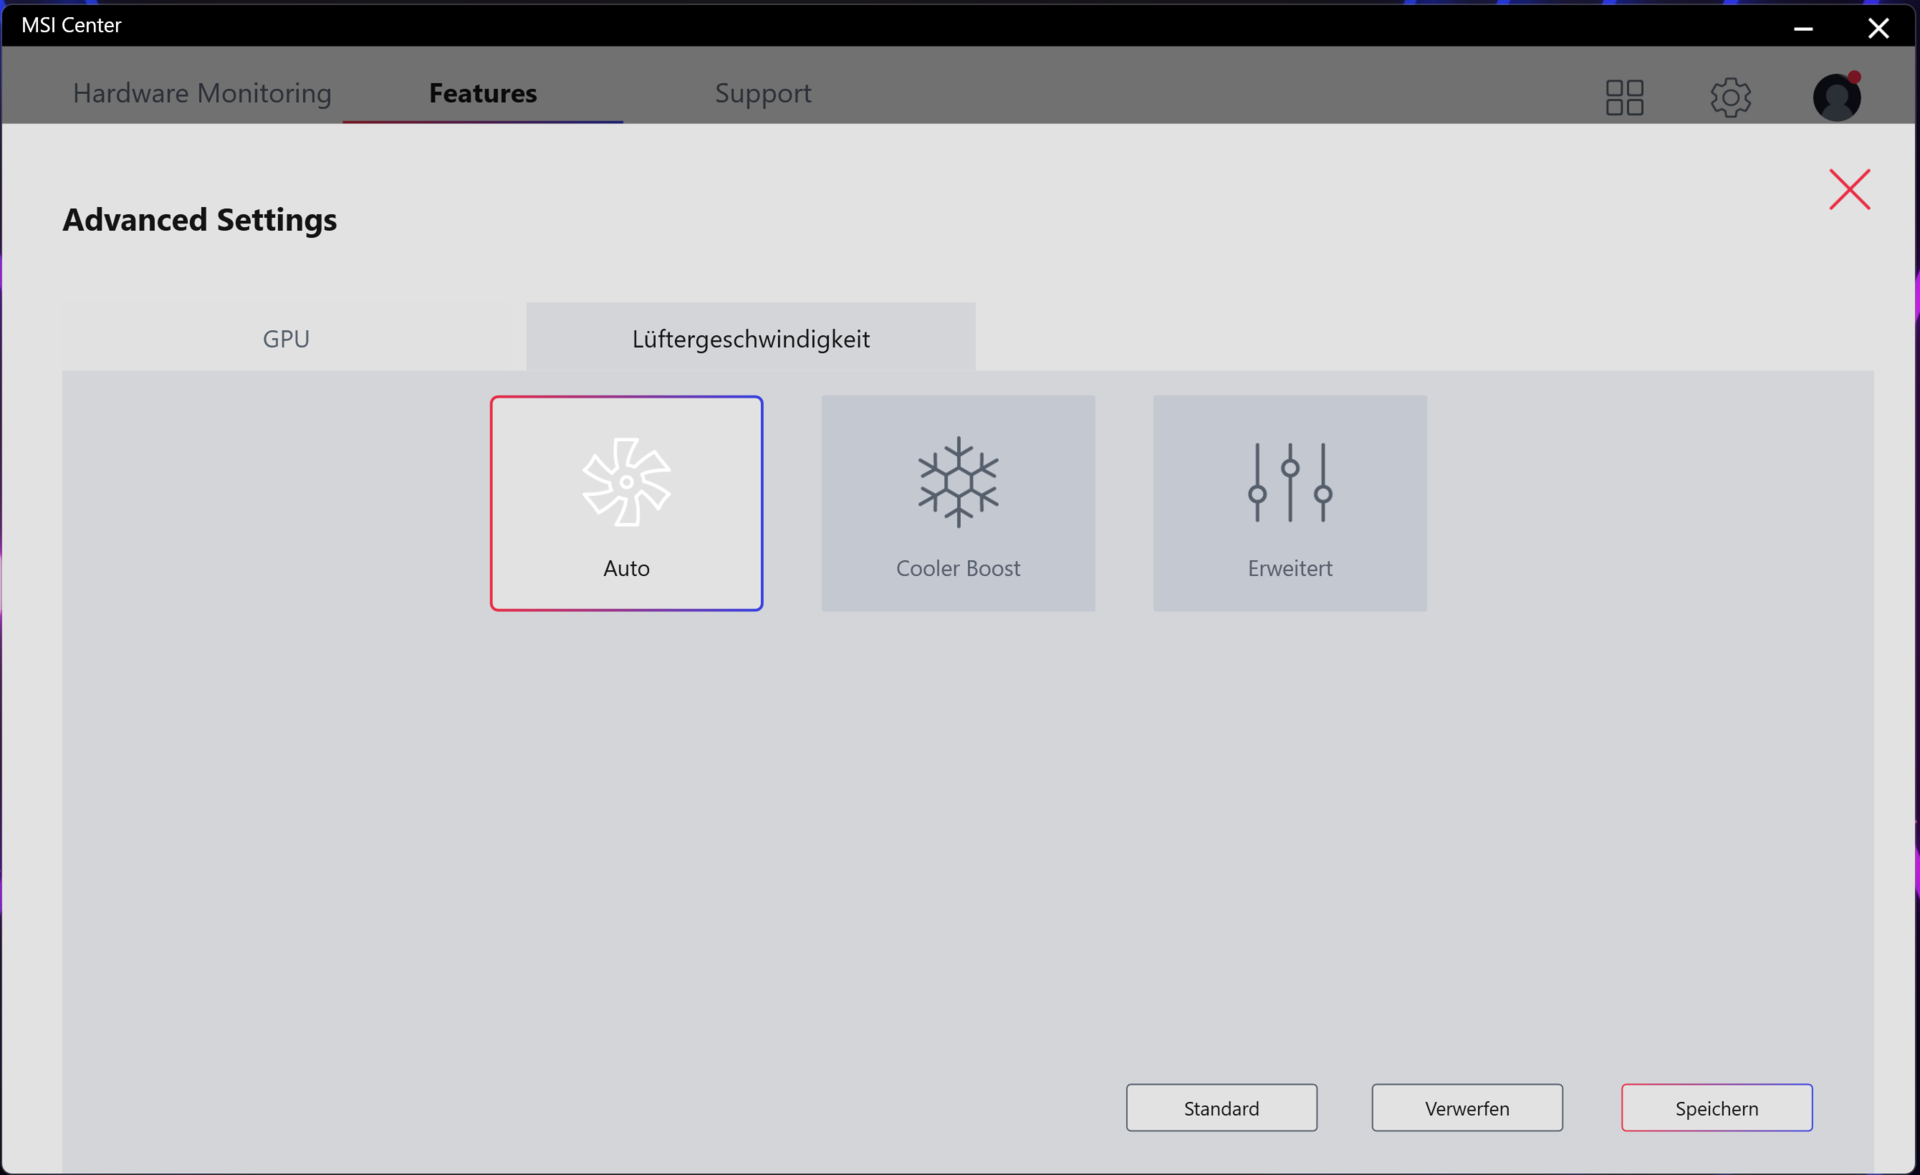
Med profilen "Extreme Performance" kan du ändra fläktkontrollen. Bland de tillgängliga alternativen finns "Auto", "Cooler Boost" (fläktarna körs på maxhastighet) och "Advanced" (anpassning av fläktkurvorna).
Ljudnivå
| Låg belastning |
| 29 / 30 / 42 dB(A) |
| Hög belastning |
| 54 / 56 dB(A) |
 | ||
30 dB tyst 40 dB(A) hörbar 50 dB(A) högt ljud |
||
min: | ||
| MSI Titan GT77 12UHS 4k i9-12900HX, GeForce RTX 3080 Ti Laptop GPU | Razer Blade 17 Early 2022 i9-12900H, GeForce RTX 3080 Ti Laptop GPU | Alienware x17 R2 P48E i9-12900HK, GeForce RTX 3080 Ti Laptop GPU | Schenker XMG Ultra 17 Rocket Lake i9-11900K, GeForce RTX 3080 Laptop GPU | MSI Titan GT77 12UHS i9-12900HX, GeForce RTX 3080 Ti Laptop GPU | |
|---|---|---|---|---|---|
| Noise | 9% | 21% | -12% | 14% | |
| av / miljö * (dB) | 26 | 26 -0% | 22.7 13% | 24 8% | 21.9 16% |
| Idle Minimum * (dB) | 29 | 26 10% | 23.1 20% | 30 -3% | 24.53 15% |
| Idle Average * (dB) | 30 | 27 10% | 23.1 23% | 31 -3% | 24.53 18% |
| Idle Maximum * (dB) | 42 | 32 24% | 23.1 45% | 57 -36% | 24.53 42% |
| Load Average * (dB) | 54 | 50 7% | 31.9 41% | 63 -17% | 46.25 14% |
| Witcher 3 ultra * (dB) | 52 | 51 2% | 52.5 -1% | 61 -17% | 56.86 -9% |
| Load Maximum * (dB) | 56 | 51 9% | 52.5 6% | 63 -13% | 54.25 3% |
* ... mindre är bättre
Temperatur
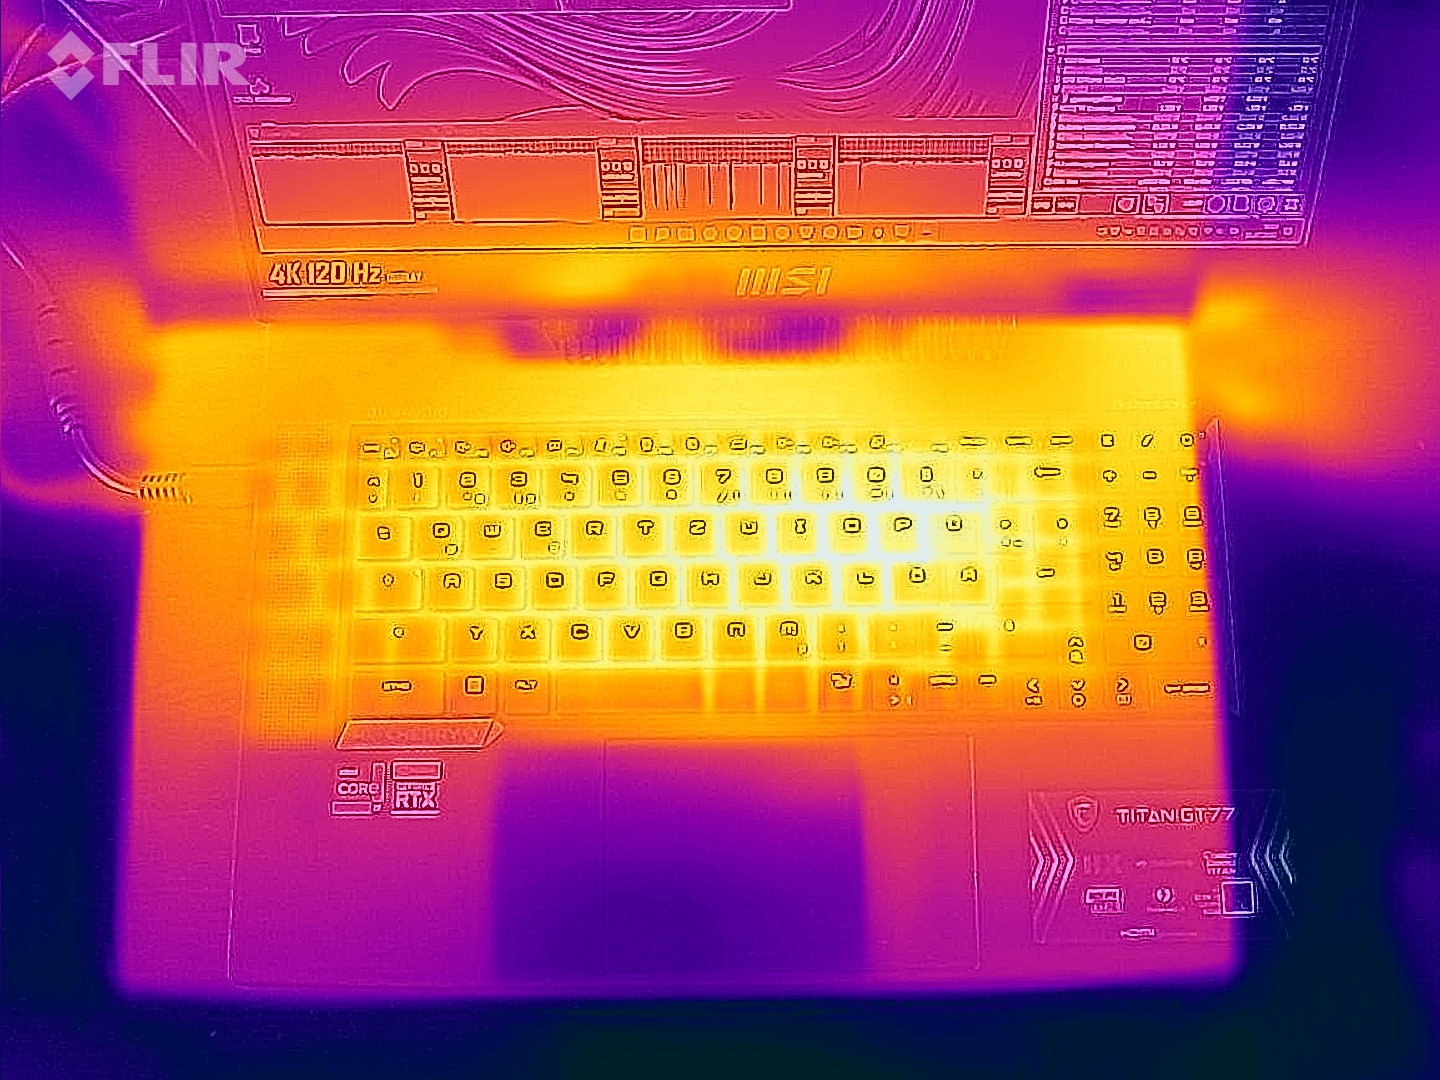
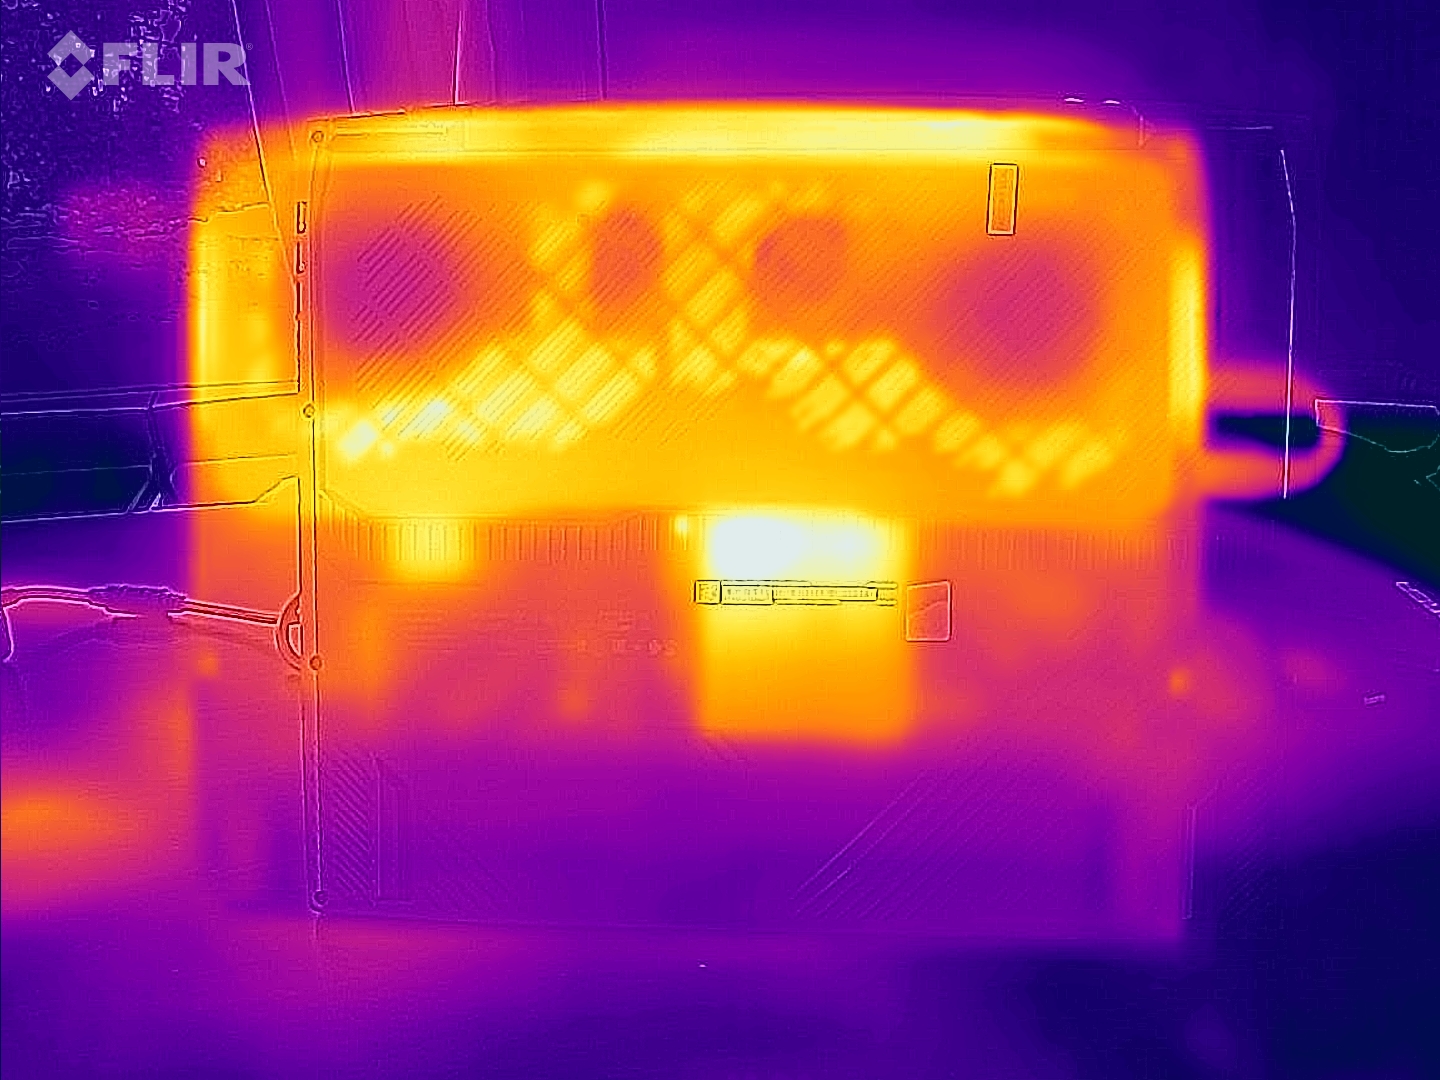
Vid daglig användning (kontorsarbete, surfning på Internet) höll sig chassitemperaturerna inom ett acceptabelt intervall. Under belastning (stresstest, Witcher 3 test) blev den bärbara datorn betydligt varmare, men inte för varm. Det finns ingen anledning till oro när det gäller CPU-temperaturer.
(-) Den maximala temperaturen på ovansidan är 49 °C / 120 F, jämfört med genomsnittet av 40.4 °C / 105 F , allt från 21.2 till 68.8 °C för klassen Gaming.
(-) Botten värms upp till maximalt 50 °C / 122 F, jämfört med genomsnittet av 43.2 °C / 110 F
(±) Vid tomgångsbruk är medeltemperaturen för ovansidan 33.2 °C / 92 F, jämfört med enhetsgenomsnittet på 33.9 °C / ### class_avg_f### F.
(-) När du spelar The Witcher 3 är medeltemperaturen för ovansidan 48.1 °C / 119 F, jämfört med enhetsgenomsnittet på 33.9 °C / ## #class_avg_f### F.
(-) Handledsstöden och pekplattan kan bli väldigt varma vid beröring med maximalt 43 °C / 109.4 F.
(-) Medeltemperaturen för handledsstödsområdet på liknande enheter var 28.8 °C / 83.8 F (-14.2 °C / -25.6 F).
| MSI Titan GT77 12UHS 4k Intel Core i9-12900HX, NVIDIA GeForce RTX 3080 Ti Laptop GPU | Razer Blade 17 Early 2022 Intel Core i9-12900H, NVIDIA GeForce RTX 3080 Ti Laptop GPU | Alienware x17 R2 P48E Intel Core i9-12900HK, NVIDIA GeForce RTX 3080 Ti Laptop GPU | Schenker XMG Ultra 17 Rocket Lake Intel Core i9-11900K, NVIDIA GeForce RTX 3080 Laptop GPU | MSI Titan GT77 12UHS Intel Core i9-12900HX, NVIDIA GeForce RTX 3080 Ti Laptop GPU | |
|---|---|---|---|---|---|
| Heat | -5% | 11% | 8% | 2% | |
| Maximum Upper Side * (°C) | 49 | 50 -2% | 49.6 -1% | 34 31% | 40.8 17% |
| Maximum Bottom * (°C) | 50 | 56 -12% | 42.4 15% | 43 14% | 52.4 -5% |
| Idle Upper Side * (°C) | 34 | 36 -6% | 29.2 14% | 38 -12% | 34.6 -2% |
| Idle Bottom * (°C) | 38 | 38 -0% | 32 16% | 39 -3% | 38.4 -1% |
* ... mindre är bättre
Stresstest
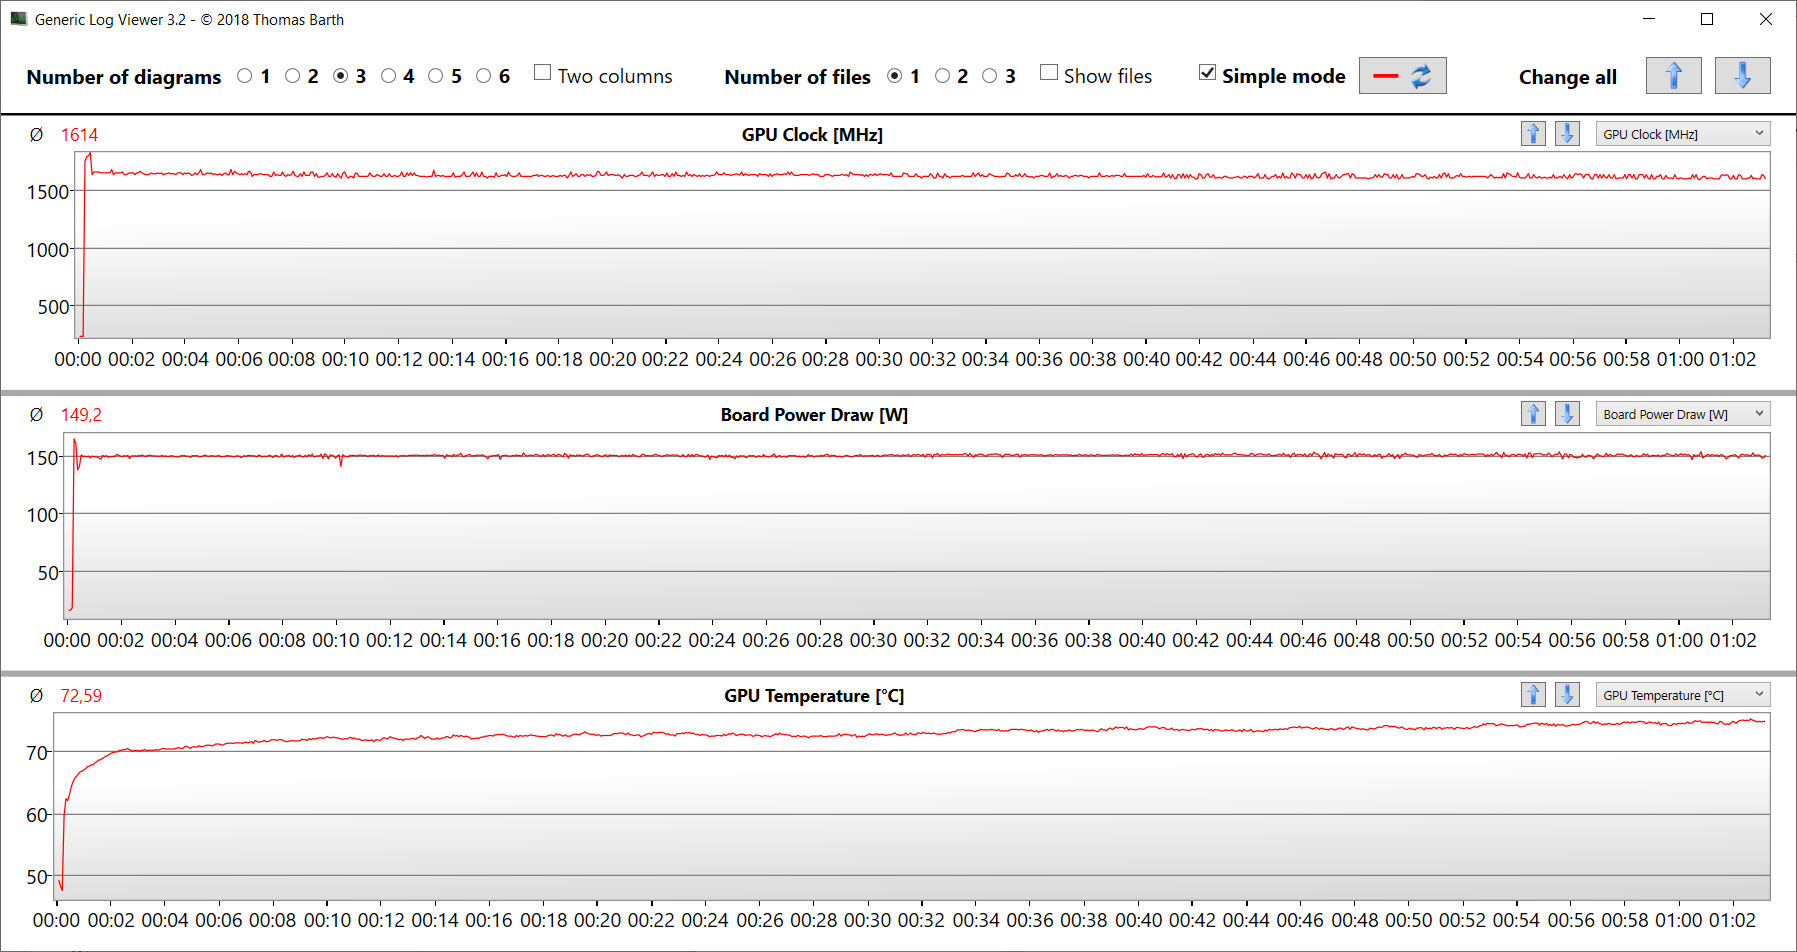
Processorn klarade stresstestet (Prime95 och FurMark i minst en timme) med medelhög bearbetningshastighet, medan GPU:n kunde nå sin maximala klockfrekvens. Stresstestet representerar en extrem situation. Vi utför detta test för att kontrollera om systemet är stabilt när det körs med full belastning.
Högtalare
MSI Titan GT77 12UHS ljudanalys
(+) | högtalare kan spela relativt högt (91 dB)
Bas 100 - 315 Hz
(±) | reducerad bas - i genomsnitt 13.9% lägre än medianen
(±) | linjäriteten för basen är genomsnittlig (9.7% delta till föregående frekvens)
Mellan 400 - 2000 Hz
(+) | balanserad mellan - endast 4% från medianen
(+) | mids är linjära (3.6% delta till föregående frekvens)
Högsta 2 - 16 kHz
(+) | balanserade toppar - endast 1.8% från medianen
(+) | toppar är linjära (3.9% delta till föregående frekvens)
Totalt 100 - 16 000 Hz
(+) | det totala ljudet är linjärt (11.4% skillnad mot median)
Jämfört med samma klass
» 9% av alla testade enheter i den här klassen var bättre, 3% liknande, 88% sämre
» Den bästa hade ett delta på 6%, genomsnittet var 18%, sämst var 132%
Jämfört med alla testade enheter
» 7% av alla testade enheter var bättre, 2% liknande, 90% sämre
» Den bästa hade ett delta på 4%, genomsnittet var 23%, sämst var 134%
Alienware x17 R2 P48E ljudanalys
(+) | högtalare kan spela relativt högt (84.3 dB)
Bas 100 - 315 Hz
(±) | reducerad bas - i genomsnitt 9.7% lägre än medianen
(+) | basen är linjär (5.5% delta till föregående frekvens)
Mellan 400 - 2000 Hz
(+) | balanserad mellan - endast 1.6% från medianen
(+) | mids är linjära (3% delta till föregående frekvens)
Högsta 2 - 16 kHz
(±) | högre toppar - i genomsnitt 5% högre än medianen
(±) | linjäriteten för toppar är genomsnittlig (7.6% delta till föregående frekvens)
Totalt 100 - 16 000 Hz
(+) | det totala ljudet är linjärt (9.3% skillnad mot median)
Jämfört med samma klass
» 3% av alla testade enheter i den här klassen var bättre, 2% liknande, 95% sämre
» Den bästa hade ett delta på 6%, genomsnittet var 18%, sämst var 132%
Jämfört med alla testade enheter
» 3% av alla testade enheter var bättre, 1% liknande, 96% sämre
» Den bästa hade ett delta på 4%, genomsnittet var 23%, sämst var 134%
Energihantering - MSI:s bärbara dator har en hygglig batteritid
Effektförbrukning
Den bärbara datorns strömförbrukning ligger inom det normala för hårdvaran i den. Under Witcher 3 -testet och stresstestet ökade strömförbrukningen till i genomsnitt 236 watt och som mest 309 watt. Enheten använde en konstant mängd ström under båda testerna
Anmärkning: Den FHD-modellentestades med dGPU-läget aktivt. Detta förklarar varför den förbrukade mer ström vid tomgång.
| Av/Standby | |
| Låg belastning | |
| Hög belastning |
|
Förklaring:
min: | |
| MSI Titan GT77 12UHS i9-12900HX, GeForce RTX 3080 Ti Laptop GPU | Razer Blade 17 Early 2022 i9-12900H, GeForce RTX 3080 Ti Laptop GPU | Alienware x17 R2 P48E i9-12900HK, GeForce RTX 3080 Ti Laptop GPU | Schenker XMG Ultra 17 Rocket Lake i9-11900K, GeForce RTX 3080 Laptop GPU | MSI Titan GT77 12UHS i9-12900HX, GeForce RTX 3080 Ti Laptop GPU | Genomsnitt NVIDIA GeForce RTX 3080 Ti Laptop GPU | Genomsnitt av klass Gaming | |
|---|---|---|---|---|---|---|---|
| Power Consumption | -7% | -44% | -146% | -41% | -10% | 8% | |
| Idle Minimum * (Watt) | 12 | 17 -42% | 24.1 -101% | 62 -417% | 30.21 -152% | 17.2 ? -43% | 13.1 ? -9% |
| Idle Average * (Watt) | 18 | 23 -28% | 28.5 -58% | 64 -256% | 32.42 -80% | 23.3 ? -29% | 19 ? -6% |
| Idle Maximum * (Watt) | 30 | 34 -13% | 60 -100% | 69 -130% | 33.7 -12% | 30.8 ? -3% | 24.6 ? 18% |
| Load Average * (Watt) | 141 | 120 15% | 128.7 9% | 183 -30% | 125.09 11% | 121.2 ? 14% | 111.3 ? 21% |
| Witcher 3 ultra * (Watt) | 236 | 229 3% | 254 -8% | 297 -26% | 256 -8% | ||
| Load Maximum * (Watt) | 309 | 243 21% | 323 -5% | 368 -19% | 321.88 -4% | 276 ? 11% | 260 ? 16% |
* ... mindre är bättre
Power consumption Witcher 3 / stress test
Power consumption with external monitor
Batteriets livslängd
I vårt Wi-Fi-test (besök på webbplatser automatiskt med hjälp av ett skript) och vårt videotest (uppspelning av kortfilmen Big Buck Bunny (H.264-kodning, FHD) i en slinga) klarade den bärbara 17,3-tumsdatorn av att köra i 5:52 timmar respektive 6:50 timmar. FHD-syskonmodellenhöll något längre på grund av den lägre skärmupplösningen.
| MSI Titan GT77 12UHS 4k i9-12900HX, GeForce RTX 3080 Ti Laptop GPU, 99.99 Wh | Razer Blade 17 Early 2022 i9-12900H, GeForce RTX 3080 Ti Laptop GPU, 82 Wh | Alienware x17 R2 P48E i9-12900HK, GeForce RTX 3080 Ti Laptop GPU, 87 Wh | Schenker XMG Ultra 17 Rocket Lake i9-11900K, GeForce RTX 3080 Laptop GPU, 97 Wh | MSI Titan GT77 12UHS i9-12900HX, GeForce RTX 3080 Ti Laptop GPU, 99.9 Wh | Genomsnitt av klass Gaming | |
|---|---|---|---|---|---|---|
| Batteridrifttid | -16% | -55% | -58% | 5% | 10% | |
| Reader / Idle (h) | 8.2 | 7.1 -13% | 3.9 -52% | 3 -63% | 7.84 ? -4% | |
| H.264 (h) | 6.8 | 4.8 -29% | 1.9 -72% | 7.2 6% | 8.27 ? 22% | |
| WiFi v1.3 (h) | 5.9 | 3.8 -36% | 2 -66% | 1.8 -69% | 6.9 17% | 7.08 ? 20% |
| Load (h) | 1.5 | 1.7 13% | 0.8 -47% | 1.1 -27% | 1.4 -7% | 1.496 ? 0% |
| Witcher 3 ultra (h) | 1.5 |
För
Emot
Omdöme - Ännu bättre med en 4K-skärm
Med Titan GT77 levererar MSI en av de mest högpresterande bärbara DTR-datorer som finns just nu. Den är utformad för användningsscenarier som kräver intensiv beräkningskraft och en stor mängd RAM-minne, till exempel rendering och spel.
MSI Titan GT77 - en av de för tillfället bäst prestanderande bärbara speldatorerna.
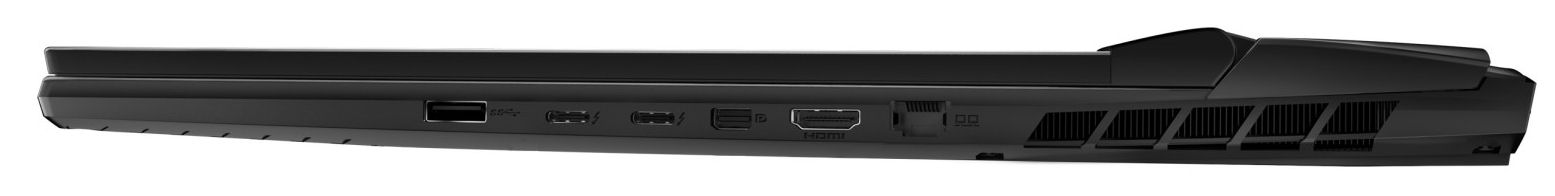
Core i9-12900HX och GeForce Bärbar dator med RTX 3080 Ti (175 watt TGP, 16 GB VRAM) kan köras konsekvent vid höga klockfrekvenser. Den bärbara datorn genererar en hel del värme och buller, vilket är typiskt för den här klassen av hårdvara. De två Thunderbolt 4-portarna ger expansionsmöjligheter (t.ex. extern GPU, dockningslösningar). Dessutom har den bärbara datorn ett väldesignat mekaniskt tangentbord och en mycket hygglig batteritid. Detta är alla saker som den här aktuella varianten delar med sin syskonmodell som vi tidigare recenserat.
Skärmen är den största skillnaden mellan de två Titan-modellerna: 4K-panelen (120 Hz) på den aktuella recensionsenheten är överlägsen FHD-panelen (360 Hz) på den andra modellen när det gäller upplösning, toppljusstyrka och färgtäckning (nästan 100 % DCI-P3). Det är därför det bästa alternativet om färgprecisionen är viktig för dig. FHD-skärmen erbjuder å andra sidan en mycket hög uppdateringsfrekvens och borde kunna göra många spelare nöjda. Tyvärr saknar båda skärmarna kontrast.
Alienware x17 R2 är ett värdigt alternativ till Titan när det gäller prestanda. Den erbjuder dock färre expansionsmöjligheter och levererar sämre batteritid
Pris och tillgänglighet
MSI Titan GT77 12UHS är tillgänglig hos återförsäljare som Amazon.com. Den konfiguration vi granskade kostar cirka 5 600 euro (5 980 USD).
MSI Titan GT77 12UHS
- 08/28/2022 v7 (old)
Sascha Mölck
Price comparison

