Test: Lenovo ThinkPad T15p Gen 1 - Kraftfull men ineffektiv (Sammanfattning)
Testgrupp
Gradering | Datum | Modell | Vikt | Höjd | Storlek | Upplösning | Pris |
|---|---|---|---|---|---|---|---|
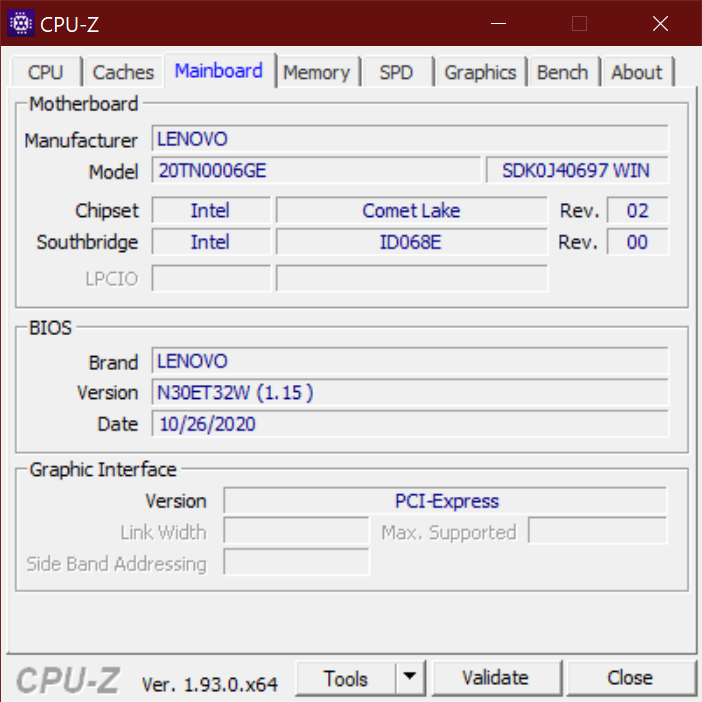
| 86.6 % v7 (old) | 02/2021 | Lenovo ThinkPad T15p-20TN0006GE i7-10750H, GeForce GTX 1050 Mobile | 2.2 kg | 22.7 mm | 15.60" | 3840x2160 | |
| 87.2 % v7 (old) | Lenovo ThinkPad T15 Gen1-20S7S02U00 i7-10510U, GeForce MX330 | 1.8 kg | 19.95 mm | 15.60" | 3840x2160 | ||
| 85.9 % v7 (old) | HP EliteBook 855 G7-23Y52EA R5 PRO 4650U, Vega 6 | 1.7 kg | 19.2 mm | 15.60" | 1920x1080 | ||
| 90.1 % v7 (old) | Lenovo ThinkPad X1 Extreme Gen3-20TLS0UV00 i7-10750H, GeForce GTX 1650 Ti Max-Q | 1.7 kg | 18.7 mm | 15.60" | 1920x1080 | ||
| 83.6 % v7 (old) | 01/2021 | Dell Latitude 15 5511-VNJNW i5-10400H, UHD Graphics 630 | 1.9 kg | 25 mm | 15.60" | 1920x1080 |
| SD Card Reader | |
| average JPG Copy Test (av. of 3 runs) | |
| Dell Latitude 15 5511-VNJNW (Toshiba Exceria Pro M501 microSDXC 64GB) | |
| Genomsnitt av klass Multimedia (23 - 531, n=43, senaste 2 åren) | |
| Lenovo ThinkPad X1 Extreme Gen3-20TLS0UV00 (Toshiba Exceria Pro SDXC 64 GB UHS-II) | |
| Lenovo ThinkPad T15p-20TN0006GE (Toshiba Exceria Pro SDXC 64 GB UHS-II) | |
| Lenovo ThinkPad T15 Gen1-20S7S02U00 (Toshiba Exceria Pro M501 64 GB UHS-II) | |
| maximum AS SSD Seq Read Test (1GB) | |
| Lenovo ThinkPad X1 Extreme Gen3-20TLS0UV00 (Toshiba Exceria Pro SDXC 64 GB UHS-II) | |
| Dell Latitude 15 5511-VNJNW (Toshiba Exceria Pro M501 microSDXC 64GB) | |
| Genomsnitt av klass Multimedia (27.9 - 1455, n=42, senaste 2 åren) | |
| Lenovo ThinkPad T15p-20TN0006GE (Toshiba Exceria Pro SDXC 64 GB UHS-II) | |
| Lenovo ThinkPad T15 Gen1-20S7S02U00 (Toshiba Exceria Pro M501 64 GB UHS-II) | |
| Networking | |
| iperf3 transmit AX12 | |
| Lenovo ThinkPad T15p-20TN0006GE | |
| Dell Latitude 15 5511-VNJNW | |
| Lenovo ThinkPad X1 Extreme Gen3-20TLS0UV00 | |
| Genomsnitt Intel Wi-Fi 6 AX201 (49.8 - 1775, n=324) | |
| Lenovo ThinkPad T15 Gen1-20S7S02U00 | |
| HP EliteBook 855 G7-23Y52EA | |
| iperf3 receive AX12 | |
| Lenovo ThinkPad T15 Gen1-20S7S02U00 | |
| Dell Latitude 15 5511-VNJNW | |
| Lenovo ThinkPad X1 Extreme Gen3-20TLS0UV00 | |
| Lenovo ThinkPad T15p-20TN0006GE | |
| Genomsnitt Intel Wi-Fi 6 AX201 (136 - 1743, n=324) | |
| HP EliteBook 855 G7-23Y52EA | |


| |||||||||||||||||||||||||
Distribution av ljusstyrkan: 94 %
Mitt på batteriet: 591 cd/m²
Kontrast: 1859:1 (Svärta: 0.32 cd/m²)
ΔE ColorChecker Calman: 1.2 | ∀{0.5-29.43 Ø4.73}
calibrated: 1
ΔE Greyscale Calman: 1.4 | ∀{0.09-98 Ø4.97}
99.2% sRGB (Argyll 1.6.3 3D)
85.3% AdobeRGB 1998 (Argyll 1.6.3 3D)
98.5% AdobeRGB 1998 (Argyll 3D)
99.3% sRGB (Argyll 3D)
86.8% Display P3 (Argyll 3D)
Gamma: 2.1
CCT: 6492 K
| Lenovo ThinkPad T15p-20TN0006GE MNF601EA1-1, IPS LED, 3840x2160, 15.6" | Lenovo ThinkPad T15 Gen1-20S7S02U00 NE156QUM-N66, IPS LED, 3840x2160, 15.6" | Dell Latitude 15 5511-VNJNW BOE0869, IPS, 1920x1080, 15.6" | HP EliteBook 855 G7-23Y52EA ChiMei CMN1512, IPS, 1920x1080, 15.6" | Lenovo ThinkPad X1 Extreme Gen3-20TLS0UV00 N156HCE-GN1, IPS, 1920x1080, 15.6" | |
|---|---|---|---|---|---|
| Display | -4% | -51% | -48% | -25% | |
| Display P3 Coverage (%) | 86.8 | 80.7 -7% | 39.56 -54% | 41.73 -52% | 61 -30% |
| sRGB Coverage (%) | 99.3 | 98.1 -1% | 58.3 -41% | 62.3 -37% | 89.9 -9% |
| AdobeRGB 1998 Coverage (%) | 98.5 | 95.5 -3% | 40.87 -59% | 43.18 -56% | 62.2 -37% |
| Response Times | -2% | -29% | 0% | 7% | |
| Response Time Grey 50% / Grey 80% * (ms) | 41.6 ? | 42 ? -1% | 48 ? -15% | 36 ? 13% | 33.6 ? 19% |
| Response Time Black / White * (ms) | 21.2 ? | 21.6 ? -2% | 30 ? -42% | 24 ? -13% | 22.4 ? -6% |
| PWM Frequency (Hz) | 1000 ? | 26040 ? | |||
| Screen | -45% | -104% | -137% | -36% | |
| Brightness middle (cd/m²) | 595 | 489 -18% | 268 -55% | 265 -55% | 518 -13% |
| Brightness (cd/m²) | 594 | 501 -16% | 241 -59% | 234 -61% | 513 -14% |
| Brightness Distribution (%) | 94 | 91 -3% | 79 -16% | 83 -12% | 88 -6% |
| Black Level * (cd/m²) | 0.32 | 0.35 -9% | 0.34 -6% | 0.33 -3% | 0.38 -19% |
| Contrast (:1) | 1859 | 1397 -25% | 788 -58% | 803 -57% | 1363 -27% |
| Colorchecker dE 2000 * | 1.2 | 3 -150% | 4.64 -287% | 4.46 -272% | 2.1 -75% |
| Colorchecker dE 2000 max. * | 2.5 | 5.1 -104% | 7.11 -184% | 18.23 -629% | 4.5 -80% |
| Colorchecker dE 2000 calibrated * | 1 | 0.8 20% | 3.67 -267% | 4.12 -312% | 1.3 -30% |
| Greyscale dE 2000 * | 1.4 | 4 -186% | 2.96 -111% | 1.59 -14% | 2.7 -93% |
| Gamma | 2.1 105% | 2.24 98% | 2.37 93% | 2.27 97% | 2.35 94% |
| CCT | 6492 100% | 7400 88% | 6343 102% | 6496 100% | 7042 92% |
| Color Space (Percent of AdobeRGB 1998) (%) | 85.3 | 84.7 -1% | 37 -57% | 40 -53% | 57.7 -32% |
| Color Space (Percent of sRGB) (%) | 99.2 | 98.1 -1% | 52 -48% | 62 -37% | 90.4 -9% |
| Totalt genomsnitt (program/inställningar) | -17% /
-32% | -61% /
-85% | -62% /
-103% | -18% /
-29% |
* ... mindre är bättre
Visa svarstider
| ↔ Svarstid svart till vitt | ||
|---|---|---|
| 21.2 ms ... stiga ↗ och falla ↘ kombinerat | ↗ 8.4 ms stiga | 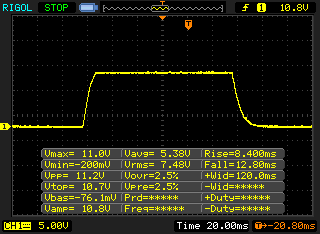 |
| ↘ 12.8 ms hösten | ||
| Skärmen visar bra svarsfrekvens i våra tester, men kan vara för långsam för konkurrenskraftiga spelare. I jämförelse sträcker sig alla testade enheter från 0.1 (minst) till 240 (maximalt) ms. » 47 % av alla enheter är bättre. Det betyder att den uppmätta svarstiden liknar genomsnittet av alla testade enheter (19.9 ms). | ||
| ↔ Svarstid 50 % grått till 80 % grått | ||
| 41.6 ms ... stiga ↗ och falla ↘ kombinerat | ↗ 19.6 ms stiga | 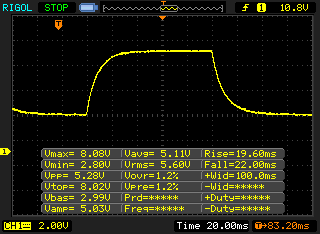 |
| ↘ 22 ms hösten | ||
| Skärmen visar långsamma svarsfrekvenser i våra tester och kommer att vara otillfredsställande för spelare. I jämförelse sträcker sig alla testade enheter från 0.165 (minst) till 636 (maximalt) ms. » 67 % av alla enheter är bättre. Detta innebär att den uppmätta svarstiden är sämre än genomsnittet av alla testade enheter (31.1 ms). | ||
Skärmflimmer / PWM (Puls-Width Modulation)
| Skärmflimmer / PWM upptäcktes inte | 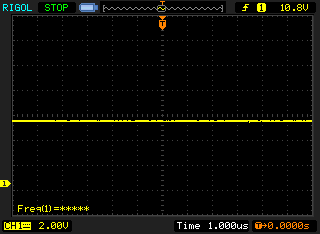 | ||
Som jämförelse: 52 % av alla testade enheter använder inte PWM för att dämpa skärmen. Om PWM upptäcktes mättes ett medelvärde av 7798 (minst: 5 - maximum: 343500) Hz. | |||
Cinebench R23: Multi Core | Single Core
Cinebench R15: CPU Multi 64Bit | CPU Single 64Bit
Blender: v2.79 BMW27 CPU
7-Zip 18.03: 7z b 4 -mmt1 | 7z b 4
Geekbench 5.5: Single-Core | Multi-Core
HWBOT x265 Benchmark v2.2: 4k Preset
LibreOffice : 20 Documents To PDF
R Benchmark 2.5: Overall mean
| Cinebench R20 / CPU (Multi Core) | |
| Genomsnitt av klass Multimedia (1887 - 12912, n=64, senaste 2 åren) | |
| Lenovo ThinkPad T15p-20TN0006GE | |
| Genomsnitt Intel Core i7-10750H (1749 - 3325, n=43) | |
| Lenovo ThinkPad X1 Extreme Gen3-20TLS0UV00 | |
| HP EliteBook 855 G7-23Y52EA | |
| Dell Latitude 15 5511-VNJNW | |
| Lenovo ThinkPad T15 Gen1-20S7S02U00 | |
| Cinebench R20 / CPU (Single Core) | |
| Genomsnitt av klass Multimedia (425 - 853, n=64, senaste 2 åren) | |
| Lenovo ThinkPad X1 Extreme Gen3-20TLS0UV00 | |
| Lenovo ThinkPad T15 Gen1-20S7S02U00 | |
| Genomsnitt Intel Core i7-10750H (431 - 504, n=43) | |
| Dell Latitude 15 5511-VNJNW | |
| Lenovo ThinkPad T15p-20TN0006GE | |
| HP EliteBook 855 G7-23Y52EA | |
| Cinebench R23 / Multi Core | |
| Genomsnitt av klass Multimedia (4861 - 33362, n=81, senaste 2 åren) | |
| Lenovo ThinkPad T15p-20TN0006GE | |
| Lenovo ThinkPad X1 Extreme Gen3-20TLS0UV00 | |
| Genomsnitt Intel Core i7-10750H (4807 - 8585, n=16) | |
| Cinebench R23 / Single Core | |
| Genomsnitt av klass Multimedia (1128 - 2459, n=73, senaste 2 åren) | |
| Lenovo ThinkPad X1 Extreme Gen3-20TLS0UV00 | |
| Genomsnitt Intel Core i7-10750H (1136 - 1271, n=16) | |
| Lenovo ThinkPad T15p-20TN0006GE | |
| Cinebench R15 / CPU Multi 64Bit | |
| Genomsnitt av klass Multimedia (856 - 5224, n=68, senaste 2 åren) | |
| Lenovo ThinkPad T15p-20TN0006GE | |
| Genomsnitt Intel Core i7-10750H (804 - 1418, n=50) | |
| Lenovo ThinkPad X1 Extreme Gen3-20TLS0UV00 | |
| HP EliteBook 855 G7-23Y52EA | |
| Dell Latitude 15 5511-VNJNW | |
| Lenovo ThinkPad T15 Gen1-20S7S02U00 | |
| Cinebench R15 / CPU Single 64Bit | |
| Genomsnitt av klass Multimedia (184.8 - 326, n=66, senaste 2 åren) | |
| Lenovo ThinkPad X1 Extreme Gen3-20TLS0UV00 | |
| Lenovo ThinkPad T15p-20TN0006GE | |
| Genomsnitt Intel Core i7-10750H (184 - 213, n=45) | |
| Dell Latitude 15 5511-VNJNW | |
| Lenovo ThinkPad T15 Gen1-20S7S02U00 | |
| HP EliteBook 855 G7-23Y52EA | |
| Blender / v2.79 BMW27 CPU | |
| Lenovo ThinkPad T15 Gen1-20S7S02U00 | |
| Dell Latitude 15 5511-VNJNW | |
| HP EliteBook 855 G7-23Y52EA | |
| Genomsnitt Intel Core i7-10750H (322 - 587, n=43) | |
| Lenovo ThinkPad X1 Extreme Gen3-20TLS0UV00 | |
| Lenovo ThinkPad T15p-20TN0006GE | |
| Genomsnitt av klass Multimedia (100 - 557, n=65, senaste 2 åren) | |
| 7-Zip 18.03 / 7z b 4 -mmt1 | |
| Genomsnitt av klass Multimedia (3666 - 7545, n=63, senaste 2 åren) | |
| Lenovo ThinkPad X1 Extreme Gen3-20TLS0UV00 | |
| Genomsnitt Intel Core i7-10750H (4504 - 5470, n=43) | |
| Lenovo ThinkPad T15p-20TN0006GE | |
| Lenovo ThinkPad T15 Gen1-20S7S02U00 | |
| Dell Latitude 15 5511-VNJNW | |
| HP EliteBook 855 G7-23Y52EA | |
| 7-Zip 18.03 / 7z b 4 | |
| Genomsnitt av klass Multimedia (29095 - 130368, n=62, senaste 2 åren) | |
| Lenovo ThinkPad X1 Extreme Gen3-20TLS0UV00 | |
| Lenovo ThinkPad T15p-20TN0006GE | |
| Genomsnitt Intel Core i7-10750H (26040 - 37345, n=43) | |
| HP EliteBook 855 G7-23Y52EA | |
| Dell Latitude 15 5511-VNJNW | |
| Lenovo ThinkPad T15 Gen1-20S7S02U00 | |
| Geekbench 5.5 / Single-Core | |
| Genomsnitt av klass Multimedia (805 - 2974, n=62, senaste 2 åren) | |
| Lenovo ThinkPad X1 Extreme Gen3-20TLS0UV00 | |
| Genomsnitt Intel Core i7-10750H (1114 - 1333, n=43) | |
| Dell Latitude 15 5511-VNJNW | |
| Lenovo ThinkPad T15p-20TN0006GE | |
| Lenovo ThinkPad T15 Gen1-20S7S02U00 | |
| HP EliteBook 855 G7-23Y52EA | |
| Geekbench 5.5 / Multi-Core | |
| Genomsnitt av klass Multimedia (4652 - 20422, n=62, senaste 2 åren) | |
| Genomsnitt Intel Core i7-10750H (4443 - 6674, n=43) | |
| Lenovo ThinkPad T15p-20TN0006GE | |
| Lenovo ThinkPad X1 Extreme Gen3-20TLS0UV00 | |
| HP EliteBook 855 G7-23Y52EA | |
| Dell Latitude 15 5511-VNJNW | |
| Lenovo ThinkPad T15 Gen1-20S7S02U00 | |
| HWBOT x265 Benchmark v2.2 / 4k Preset | |
| Genomsnitt av klass Multimedia (5.26 - 36.1, n=63, senaste 2 åren) | |
| Genomsnitt Intel Core i7-10750H (5.54 - 11.6, n=43) | |
| Lenovo ThinkPad T15p-20TN0006GE | |
| Lenovo ThinkPad X1 Extreme Gen3-20TLS0UV00 | |
| HP EliteBook 855 G7-23Y52EA | |
| Dell Latitude 15 5511-VNJNW | |
| Lenovo ThinkPad T15 Gen1-20S7S02U00 | |
| LibreOffice / 20 Documents To PDF | |
| HP EliteBook 855 G7-23Y52EA | |
| Lenovo ThinkPad T15 Gen1-20S7S02U00 | |
| Genomsnitt Intel Core i7-10750H (43.1 - 99.2, n=43) | |
| Genomsnitt av klass Multimedia (23.9 - 146.7, n=64, senaste 2 åren) | |
| Dell Latitude 15 5511-VNJNW | |
| Lenovo ThinkPad X1 Extreme Gen3-20TLS0UV00 | |
| Lenovo ThinkPad T15p-20TN0006GE | |
| R Benchmark 2.5 / Overall mean | |
| HP EliteBook 855 G7-23Y52EA | |
| Lenovo ThinkPad T15 Gen1-20S7S02U00 | |
| Dell Latitude 15 5511-VNJNW | |
| Lenovo ThinkPad T15p-20TN0006GE | |
| Genomsnitt Intel Core i7-10750H (0.578 - 0.708, n=42) | |
| Lenovo ThinkPad X1 Extreme Gen3-20TLS0UV00 | |
| Genomsnitt av klass Multimedia (0.3604 - 0.947, n=63, senaste 2 åren) | |
* ... mindre är bättre
| PCMark 8 | |
| Home Score Accelerated v2 | |
| Genomsnitt av klass Multimedia (n=1senaste 2 åren) | |
| Lenovo ThinkPad T15 Gen1-20S7S02U00 | |
| Work Score Accelerated v2 | |
| Lenovo ThinkPad T15 Gen1-20S7S02U00 | |
| PCMark 10 Score | 5130 poäng | |
Hjälp | ||
| DPC Latencies / LatencyMon - interrupt to process latency (max), Web, Youtube, Prime95 | |
| Lenovo ThinkPad T15p-20TN0006GE | |
* ... mindre är bättre
| Lenovo ThinkPad T15p-20TN0006GE WDC PC SN730 SDBQNTY-512GB | Lenovo ThinkPad T15 Gen1-20S7S02U00 Toshiba XG6 KXG6AZNV1T02 | Dell Latitude 15 5511-VNJNW Micron 2200S 256GB | HP EliteBook 855 G7-23Y52EA SK hynix BC511 HFM256GDJTNI-82A0 | Lenovo ThinkPad X1 Extreme Gen3-20TLS0UV00 Toshiba XG6 KXG6AZNV1T02 | Genomsnitt WDC PC SN730 SDBQNTY-512GB | |
|---|---|---|---|---|---|---|
| CrystalDiskMark 5.2 / 6 | -6% | -30% | -40% | 2% | -7% | |
| Write 4K (MB/s) | 141.8 | 159.1 12% | 72.6 -49% | 72 -49% | 159.5 12% | 140.9 ? -1% |
| Read 4K (MB/s) | 47.39 | 55.6 17% | 43.41 -8% | 34.01 -28% | 53.1 12% | 45.6 ? -4% |
| Write Seq (MB/s) | 2404 | 1435 -40% | 1098 -54% | 1723 -28% | 2066 ? -14% | |
| Read Seq (MB/s) | 2124 | 1435 -32% | 1770 -17% | 2164 2% | 2014 ? -5% | |
| Write 4K Q32T1 (MB/s) | 637 | 512 -20% | 465.8 -27% | 390.2 -39% | 469.2 -26% | 472 ? -26% |
| Read 4K Q32T1 (MB/s) | 414.8 | 541 30% | 374.9 -10% | 347.7 -16% | 543 31% | 453 ? 9% |
| Write Seq Q32T1 (MB/s) | 2706 | 2682 -1% | 1104 -59% | 793 -71% | 3055 13% | 2433 ? -10% |
| Read Seq Q32T1 (MB/s) | 3319 | 2902 -13% | 2921 -12% | 2143 -35% | 3296 -1% | 3237 ? -2% |

DiskSpd Read Loop, Queue Depth 8
| 3DMark 11 - 1280x720 Performance GPU | |
| Genomsnitt av klass Multimedia (3765 - 60002, n=62, senaste 2 åren) | |
| Lenovo ThinkPad X1 Extreme Gen3-20TLS0UV00 | |
| Genomsnitt NVIDIA GeForce GTX 1050 Mobile (6744 - 8903, n=42) | |
| Lenovo ThinkPad T15p-20TN0006GE | |
| Lenovo ThinkPad T15 Gen1-20S7S02U00 | |
| Dell Latitude 15 5511-VNJNW | |
| 3DMark | |
| 1280x720 Cloud Gate Standard Graphics | |
| Genomsnitt av klass Multimedia (16765 - 143501, n=34, senaste 2 åren) | |
| Genomsnitt NVIDIA GeForce GTX 1050 Mobile (14979 - 40201, n=40) | |
| Lenovo ThinkPad T15 Gen1-20S7S02U00 | |
| 1920x1080 Fire Strike Graphics | |
| Genomsnitt av klass Multimedia (2328 - 48907, n=66, senaste 2 åren) | |
| Lenovo ThinkPad X1 Extreme Gen3-20TLS0UV00 | |
| Genomsnitt NVIDIA GeForce GTX 1050 Mobile (4935 - 6651, n=43) | |
| Lenovo ThinkPad T15p-20TN0006GE | |
| Lenovo ThinkPad T15 Gen1-20S7S02U00 | |
| HP EliteBook 855 G7-23Y52EA | |
| 2560x1440 Time Spy Graphics | |
| Genomsnitt av klass Multimedia (696 - 19403, n=67, senaste 2 åren) | |
| Lenovo ThinkPad X1 Extreme Gen3-20TLS0UV00 | |
| Lenovo ThinkPad T15p-20TN0006GE | |
| Genomsnitt NVIDIA GeForce GTX 1050 Mobile (1416 - 2130, n=11) | |
| Lenovo ThinkPad T15 Gen1-20S7S02U00 | |
| HP EliteBook 855 G7-23Y52EA | |
| 3DMark 11 Performance | 7791 poäng | |
| 3DMark Fire Strike Score | 5447 poäng | |
| 3DMark Time Spy Score | 2074 poäng | |
Hjälp | ||
| The Witcher 3 - 1366x768 Medium Graphics & Postprocessing | |
| Lenovo ThinkPad X1 Extreme Gen3-20TLS0UV00 | |
| Lenovo ThinkPad T15p-20TN0006GE | |
| Genomsnitt NVIDIA GeForce GTX 1050 Mobile (46.7 - 77.3, n=25) | |
| Genomsnitt av klass Multimedia (41 - 93, n=4, senaste 2 åren) | |
| Lenovo ThinkPad T15 Gen1-20S7S02U00 | |
| HP EliteBook 855 G7-23Y52EA | |
| låg | med. | hög | ultra | 4K | |
|---|---|---|---|---|---|
| The Witcher 3 (2015) | 118 | 70 | 39.2 | 22.1 | 14 |
| Dota 2 Reborn (2015) | 124 | 113 | 103 | 96.9 | 38.3 |
| X-Plane 11.11 (2018) | 94.9 | 77.8 | 66.7 | 35.7 | |
| Shadow of the Tomb Raider (2018) | 85.5 | 37.2 | 33.8 | 29 | 9.08 |
| Total War: Three Kingdoms (2019) | 124 | 36.8 | 24.4 | 15.2 | 2.81 |
Ljudnivå
| Låg belastning |
| 29.3 / 29.3 / 30.6 dB(A) |
| Hög belastning |
| 42.7 / 42.7 dB(A) |
 | ||
30 dB tyst 40 dB(A) hörbar 50 dB(A) högt ljud |
||
min: | ||
(-) Den maximala temperaturen på ovansidan är 53.8 °C / 129 F, jämfört med genomsnittet av 36.8 °C / 98 F , allt från 21 till 71 °C för klassen Multimedia.
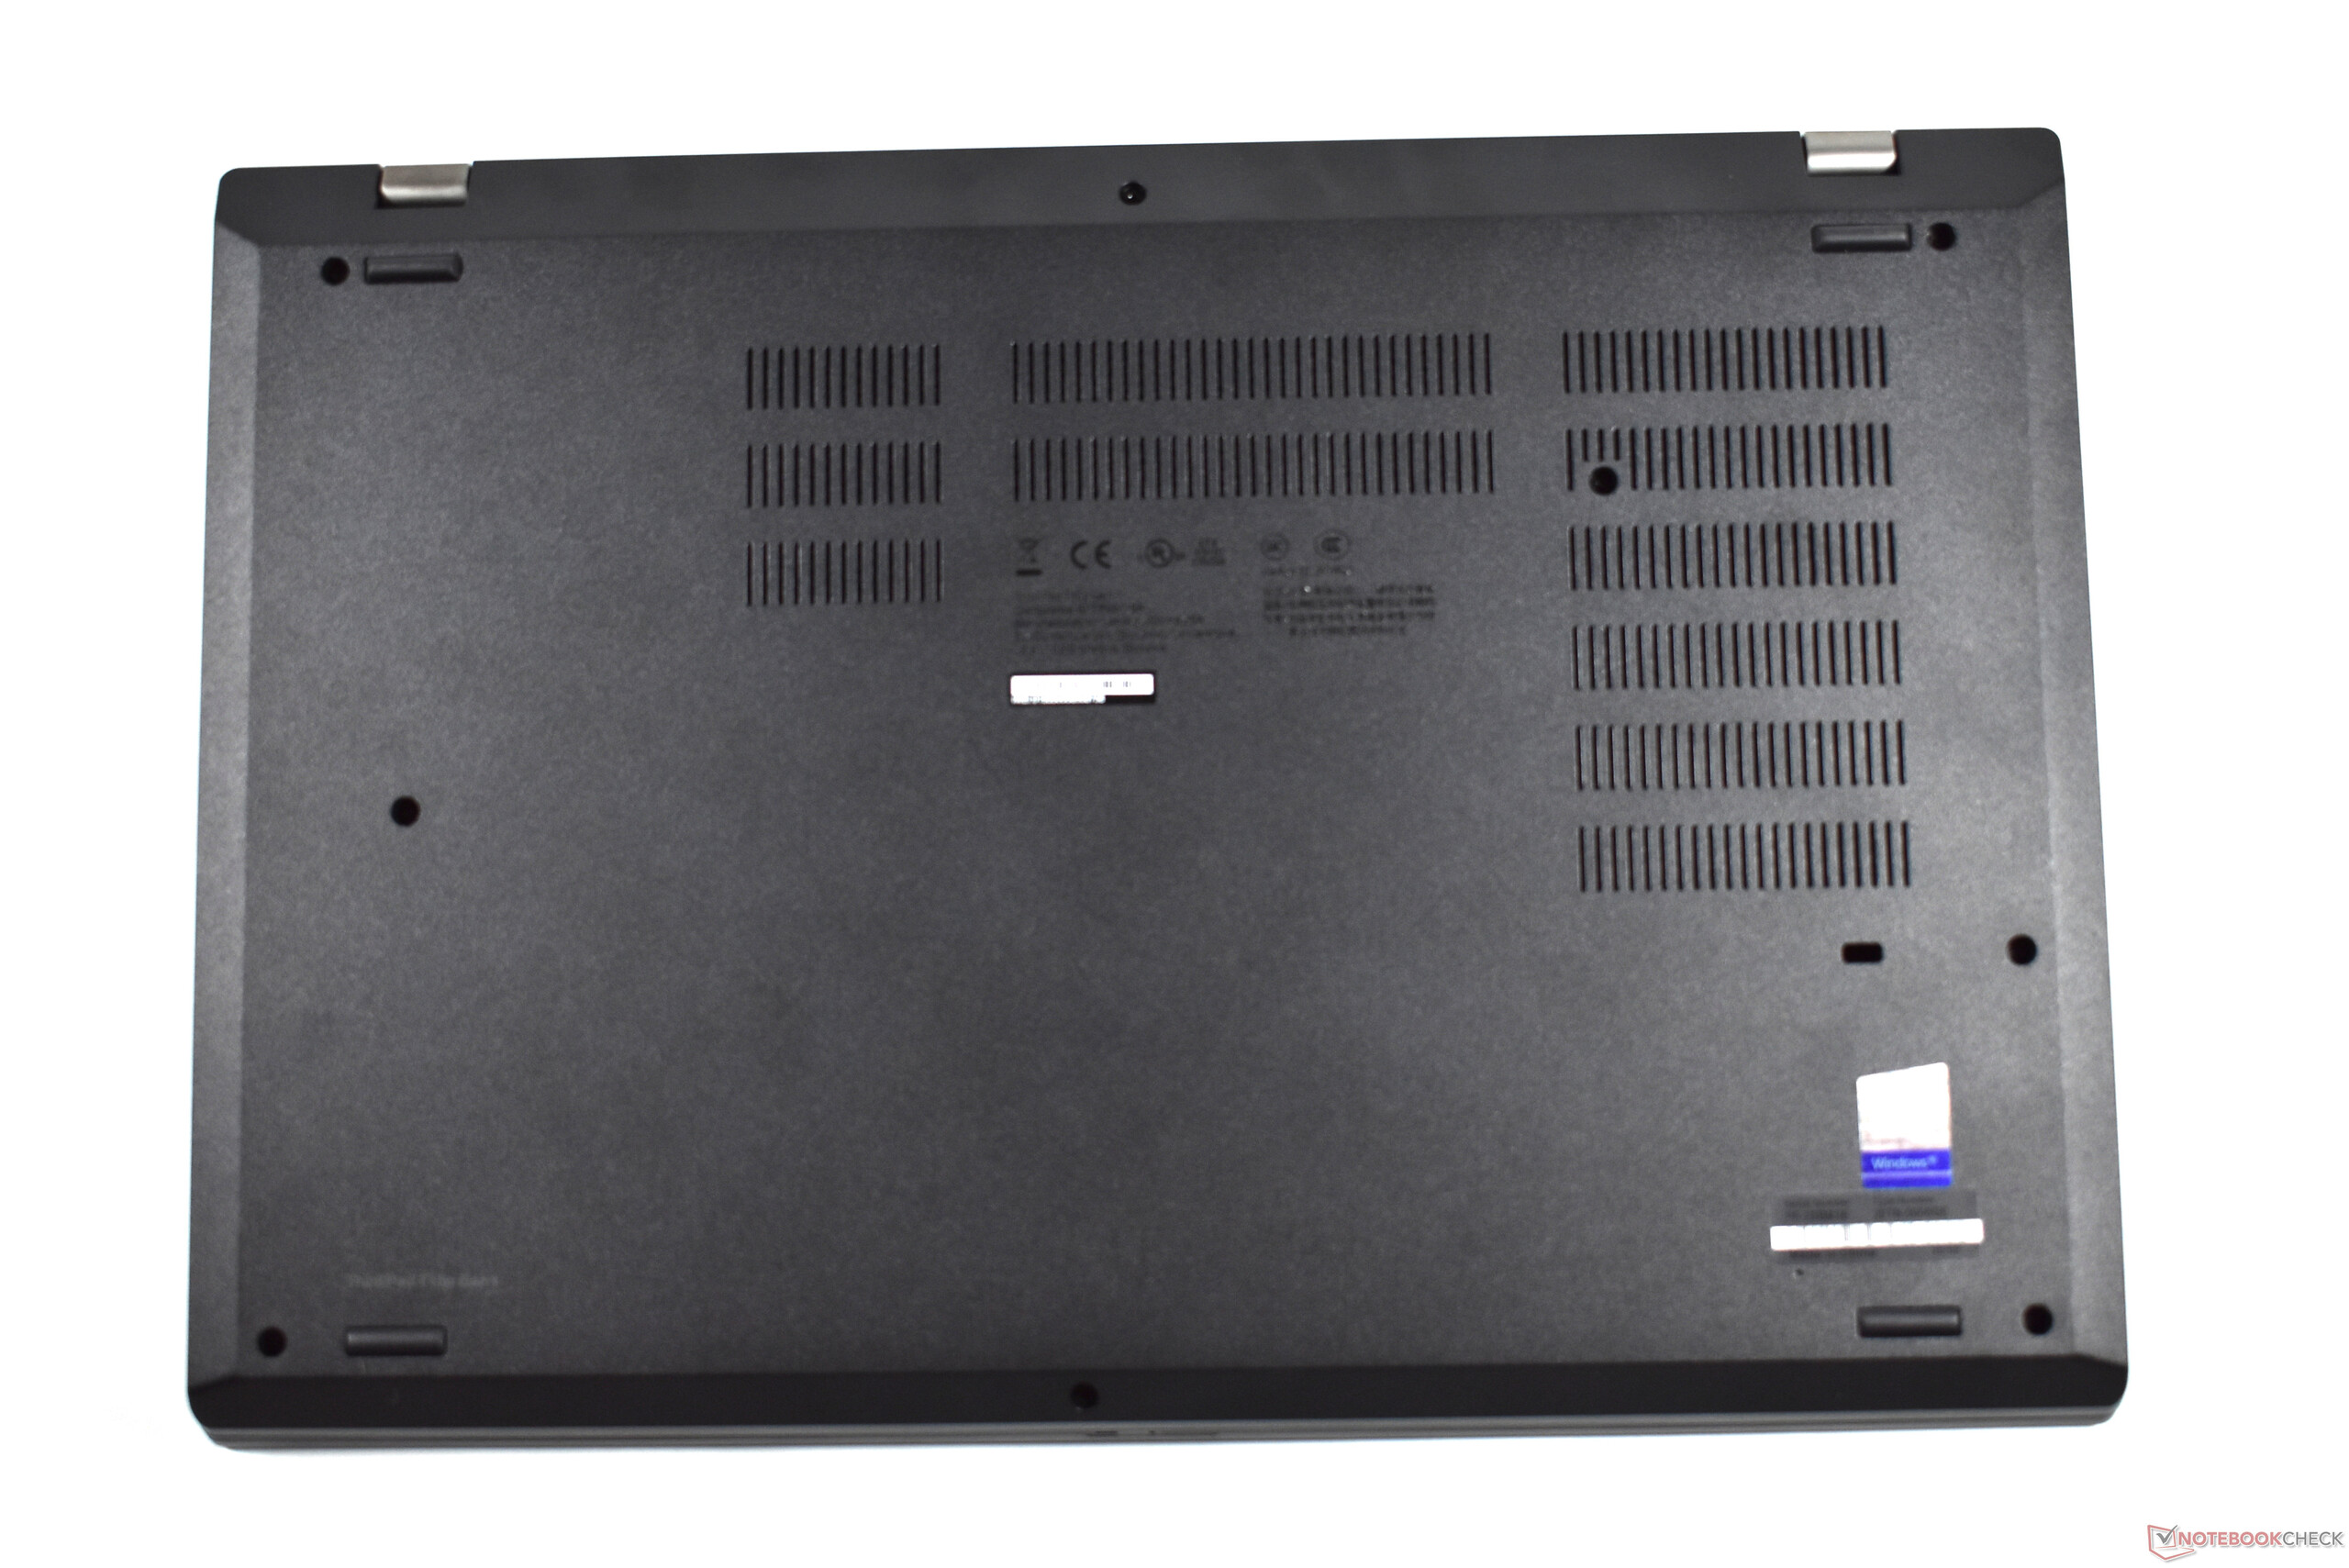
(-) Botten värms upp till maximalt 56.6 °C / 134 F, jämfört med genomsnittet av 39.1 °C / 102 F
(+) Vid tomgångsbruk är medeltemperaturen för ovansidan 23.9 °C / 75 F, jämfört med enhetsgenomsnittet på 31.3 °C / ### class_avg_f### F.
(±) När du spelar The Witcher 3 är medeltemperaturen för ovansidan 37.1 °C / 99 F, jämfört med enhetsgenomsnittet på 31.3 °C / ## #class_avg_f### F.
(±) Handledsstöden och pekplattan kan bli väldigt varma vid beröring med maximalt 38.6 °C / 101.5 F.
(-) Medeltemperaturen för handledsstödsområdet på liknande enheter var 28.7 °C / 83.7 F (-9.9 °C / -17.8 F).
Lenovo ThinkPad T15p-20TN0006GE ljudanalys
(±) | högtalarljudstyrkan är genomsnittlig men bra (74.7 dB)
Bas 100 - 315 Hz
(-) | nästan ingen bas - i genomsnitt 22.8% lägre än medianen
(±) | linjäriteten för basen är genomsnittlig (12.2% delta till föregående frekvens)
Mellan 400 - 2000 Hz
(±) | högre mellan - i genomsnitt 6.4% högre än median
(±) | linjäriteten för mids är genomsnittlig (8.5% delta till föregående frekvens)
Högsta 2 - 16 kHz
(+) | balanserade toppar - endast 3.6% från medianen
(+) | toppar är linjära (6.3% delta till föregående frekvens)
Totalt 100 - 16 000 Hz
(±) | linjäriteten för det totala ljudet är genomsnittlig (29.3% skillnad mot median)
Jämfört med samma klass
» 95% av alla testade enheter i den här klassen var bättre, 2% liknande, 3% sämre
» Den bästa hade ett delta på 5%, genomsnittet var 17%, sämst var 45%
Jämfört med alla testade enheter
» 87% av alla testade enheter var bättre, 3% liknande, 10% sämre
» Den bästa hade ett delta på 4%, genomsnittet var 24%, sämst var 134%
HP EliteBook 855 G7-23Y52EA ljudanalys
(-) | inte särskilt höga högtalare (67.1 dB)
Bas 100 - 315 Hz
(-) | nästan ingen bas - i genomsnitt 20.2% lägre än medianen
(±) | linjäriteten för basen är genomsnittlig (13.7% delta till föregående frekvens)
Mellan 400 - 2000 Hz
(+) | balanserad mellan - endast 2% från medianen
(±) | linjäriteten för mids är genomsnittlig (7.1% delta till föregående frekvens)
Högsta 2 - 16 kHz
(+) | balanserade toppar - endast 3.6% från medianen
(+) | toppar är linjära (3.8% delta till föregående frekvens)
Totalt 100 - 16 000 Hz
(±) | linjäriteten för det totala ljudet är genomsnittlig (17.1% skillnad mot median)
Jämfört med samma klass
» 24% av alla testade enheter i den här klassen var bättre, 7% liknande, 69% sämre
» Den bästa hade ett delta på 7%, genomsnittet var 21%, sämst var 53%
Jämfört med alla testade enheter
» 31% av alla testade enheter var bättre, 8% liknande, 61% sämre
» Den bästa hade ett delta på 4%, genomsnittet var 24%, sämst var 134%
| Av/Standby | |
| Låg belastning | |
| Hög belastning |
|
Förklaring:
min: | |
| Lenovo ThinkPad T15p-20TN0006GE i7-10750H, GeForce GTX 1050 Mobile, WDC PC SN730 SDBQNTY-512GB, IPS LED, 3840x2160, 15.6" | Lenovo ThinkPad T15 Gen1-20S7S02U00 i7-10510U, GeForce MX330, Toshiba XG6 KXG6AZNV1T02, IPS LED, 3840x2160, 15.6" | Dell Latitude 15 5511-VNJNW i5-10400H, UHD Graphics 630, Micron 2200S 256GB, IPS, 1920x1080, 15.6" | HP EliteBook 855 G7-23Y52EA R5 PRO 4650U, Vega 6, SK hynix BC511 HFM256GDJTNI-82A0, IPS, 1920x1080, 15.6" | Lenovo ThinkPad X1 Extreme Gen3-20TLS0UV00 i7-10750H, GeForce GTX 1650 Ti Max-Q, Toshiba XG6 KXG6AZNV1T02, IPS, 1920x1080, 15.6" | Genomsnitt NVIDIA GeForce GTX 1050 Mobile | Genomsnitt av klass Multimedia | |
|---|---|---|---|---|---|---|---|
| Power Consumption | 23% | 47% | 54% | 11% | 9% | 19% | |
| Idle Minimum * (Watt) | 6 | 4.3 28% | 3 50% | 3.6 40% | 5 17% | 6.99 ? -17% | 5.71 ? 5% |
| Idle Average * (Watt) | 12.8 | 13.8 -8% | 5.9 54% | 6.6 48% | 9 30% | 10.7 ? 16% | 10.1 ? 21% |
| Idle Maximum * (Watt) | 16.1 | 16.2 -1% | 8.8 45% | 9.5 41% | 12.2 24% | 12.7 ? 21% | 12.4 ? 23% |
| Load Average * (Watt) | 95.6 | 66 31% | 39 59% | 27.6 71% | 94.4 1% | 82.9 ? 13% | 65 ? 32% |
| Witcher 3 ultra * (Watt) | 84 | 53 37% | 89 -6% | ||||
| Load Maximum * (Watt) | 131.1 | 67.4 49% | 95 28% | 36.4 72% | 133.9 -2% | 115.3 ? 12% | 112.2 ? 14% |
* ... mindre är bättre
| Lenovo ThinkPad T15p-20TN0006GE i7-10750H, GeForce GTX 1050 Mobile, 68 Wh | Lenovo ThinkPad T15 Gen1-20S7S02U00 i7-10510U, GeForce MX330, 57 Wh | Dell Latitude 15 5511-VNJNW i5-10400H, UHD Graphics 630, 68 Wh | HP EliteBook 855 G7-23Y52EA R5 PRO 4650U, Vega 6, 56 Wh | Lenovo ThinkPad X1 Extreme Gen3-20TLS0UV00 i7-10750H, GeForce GTX 1650 Ti Max-Q, 80 Wh | Genomsnitt av klass Multimedia | |
|---|---|---|---|---|---|---|
| Batteridrifttid | 4% | 57% | 65% | 48% | 76% | |
| H.264 (h) | 7.7 | 8.1 5% | 13.4 74% | 12.2 58% | 16.4 ? 113% | |
| WiFi v1.3 (h) | 7.3 | 7.1 -3% | 12.9 77% | 12.2 67% | 11.6 59% | 12 ? 64% |
| Load (h) | 1.1 | 1.2 9% | 1.5 36% | 1.7 55% | 1.4 27% | 1.675 ? 52% |
För
Emot
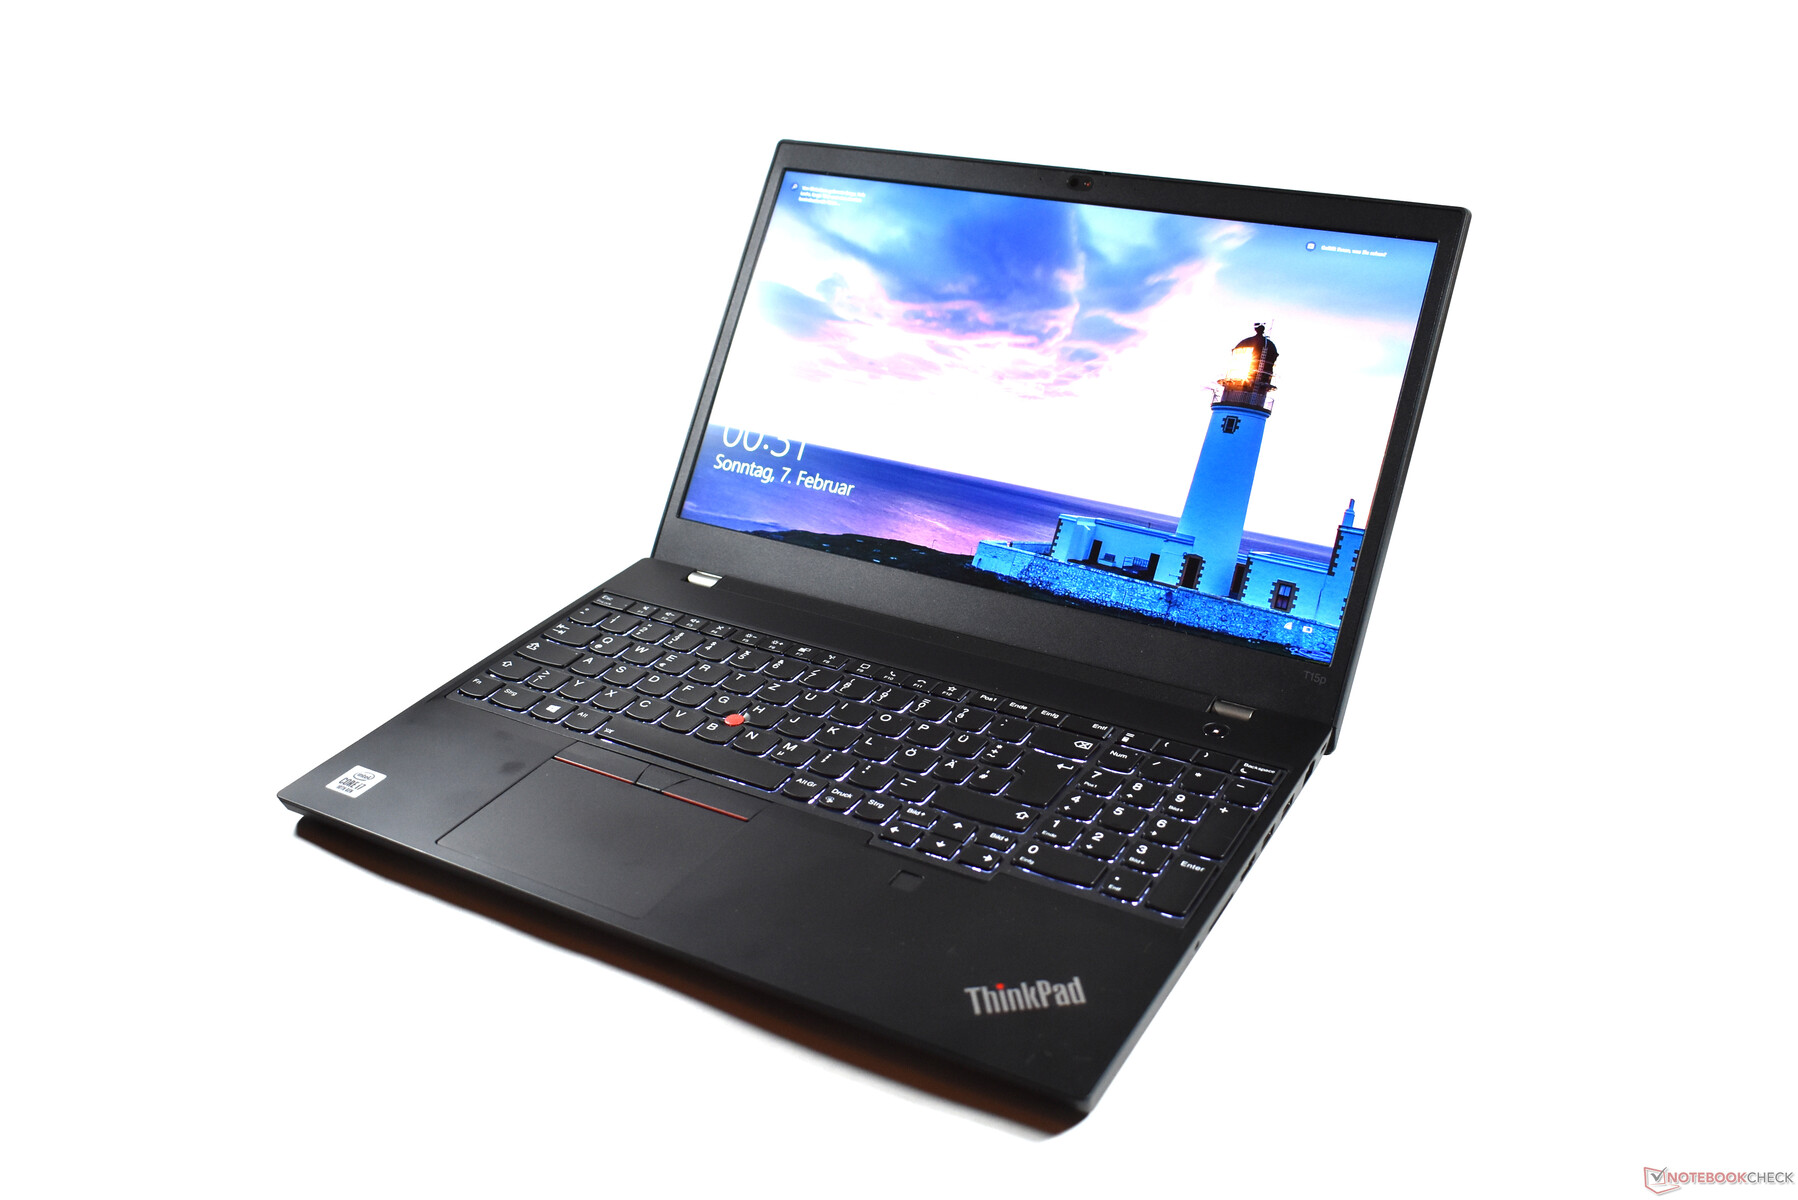
Omdöme: ThinkPad T15p är en bra laptop, men vem är den till för?

Läs den fullständiga versionen av den här recensionen på engelska här.
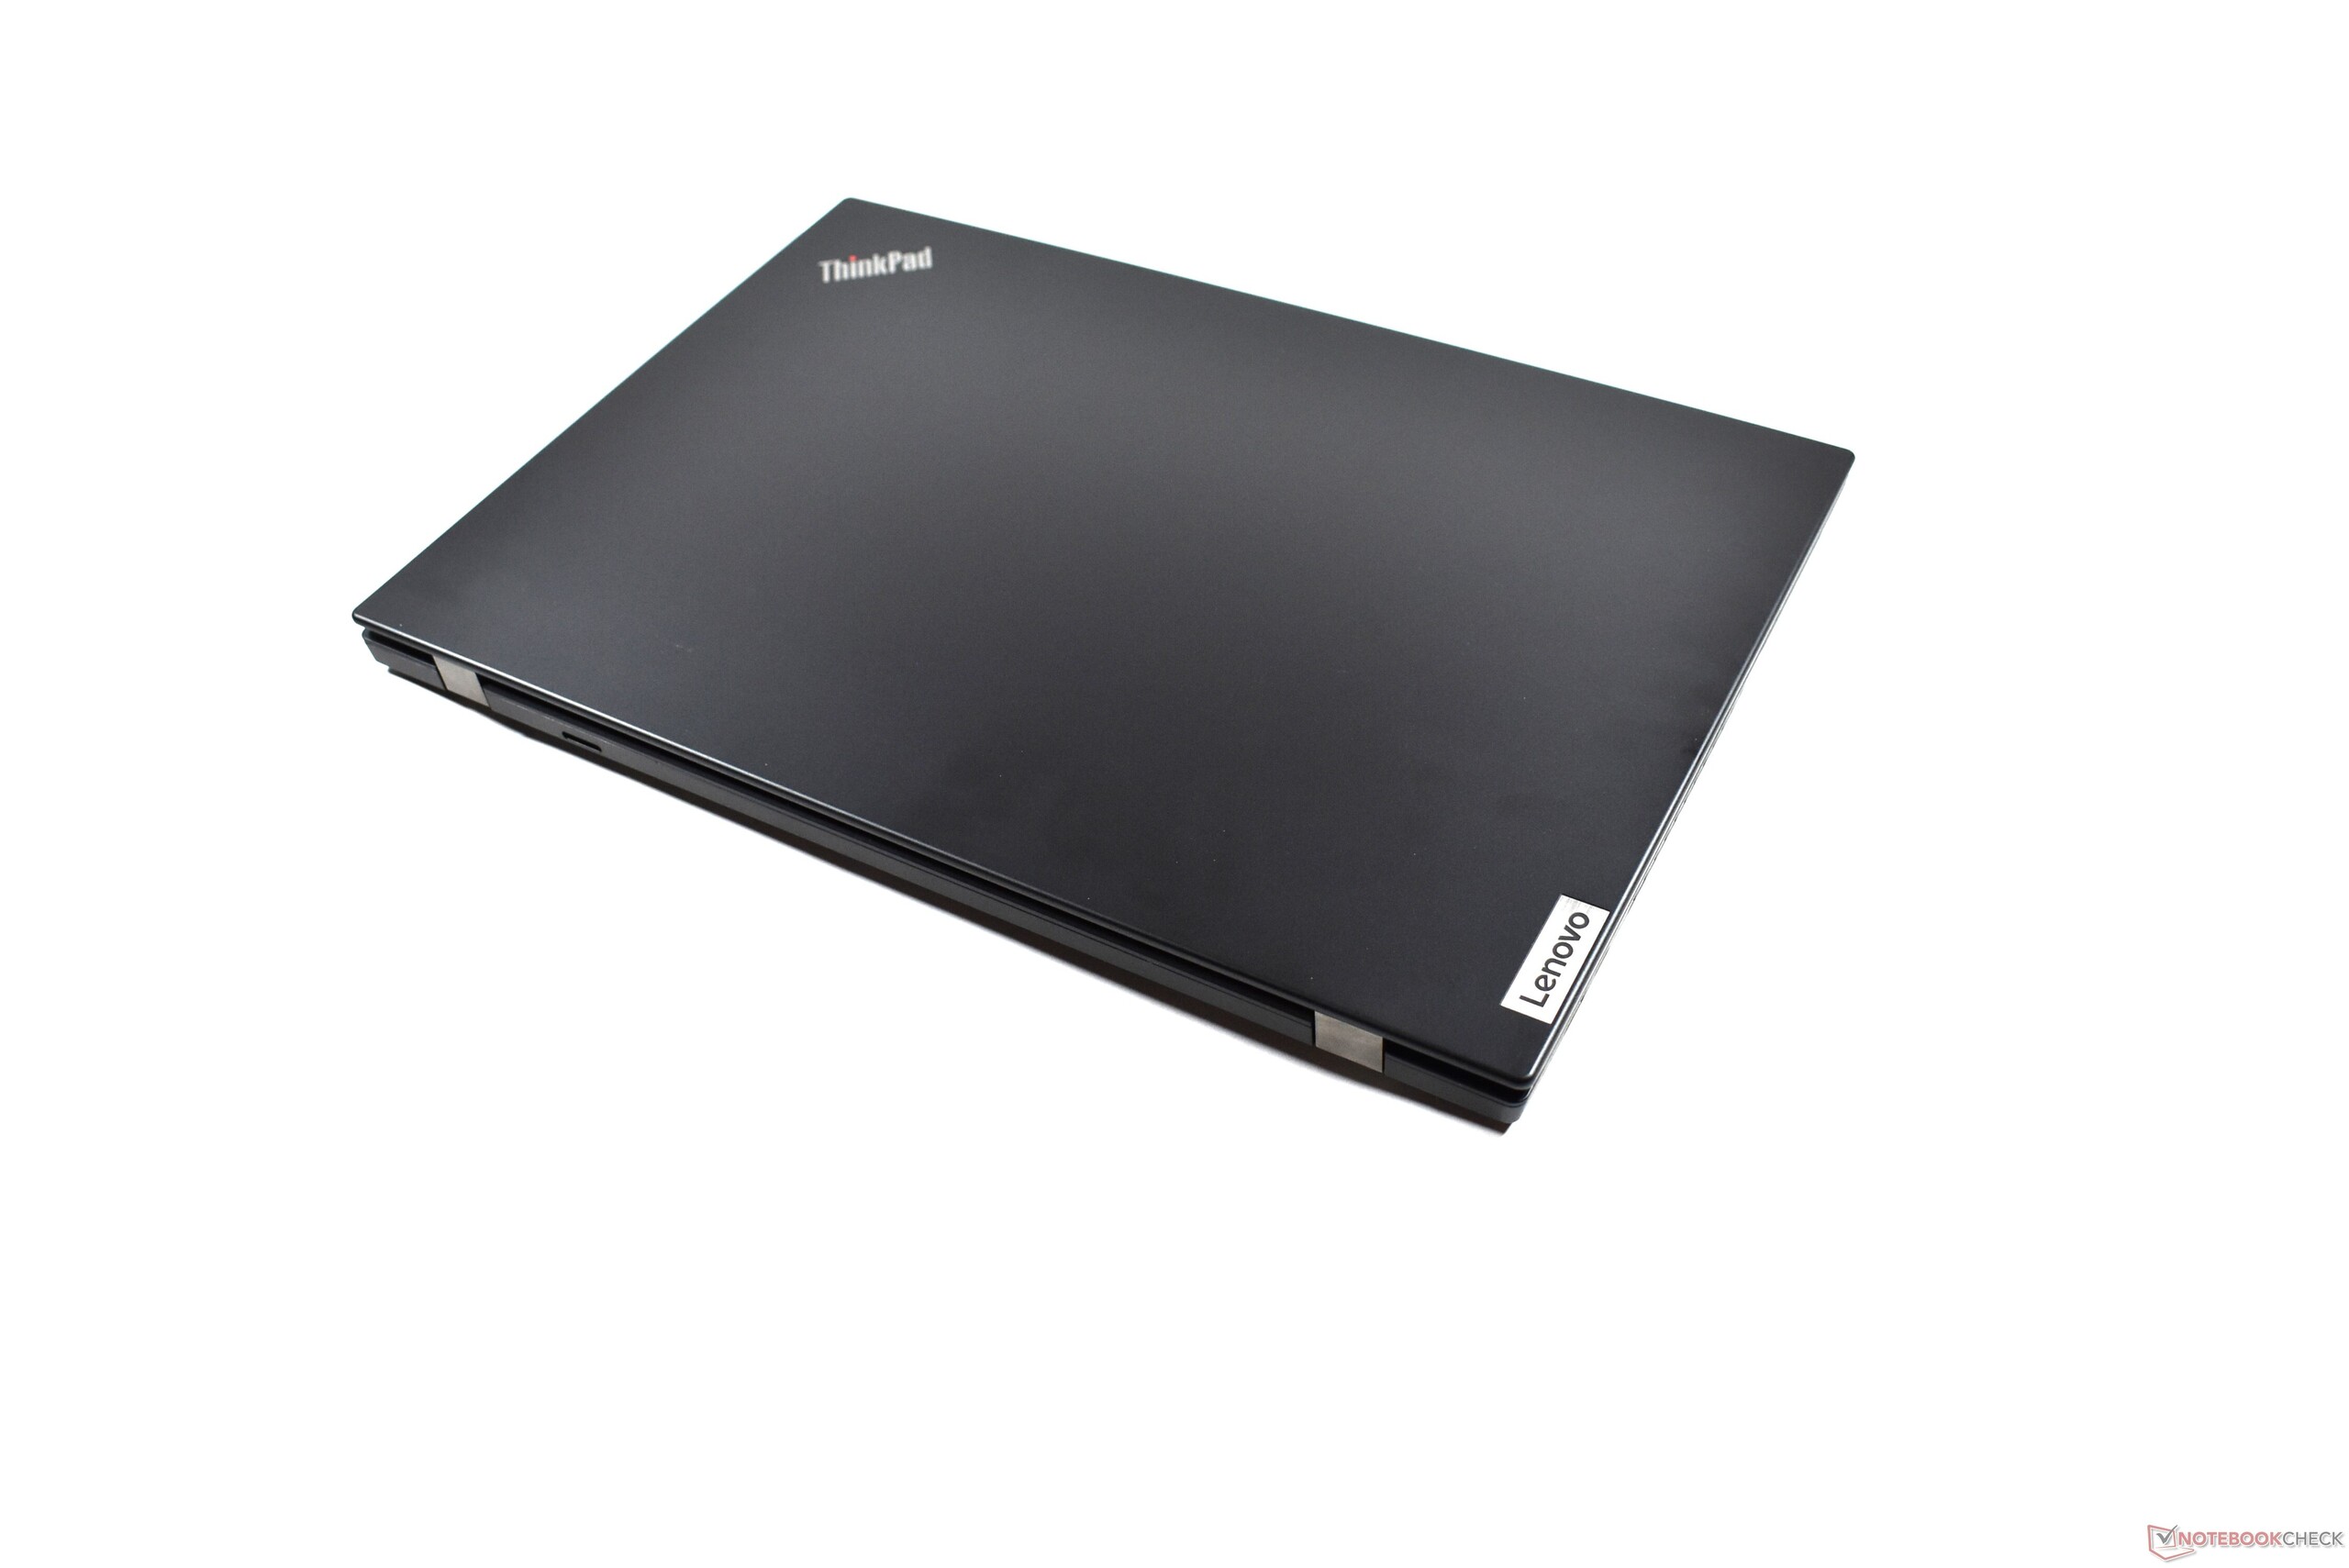
Lenovo ThinkPad T15p är varken den tunnaste eller den mest kraftfulla ThinkPad-enheten i sin klass. Den må vara tunnare och lättare än den rejäla ThinkPad P15, men Lenovo ThinkPad X1 Extreme Gen 3 är ännu kompaktare. Och den kan heller inte tävla med dessa modeller när det kommer till grafikprestanda.
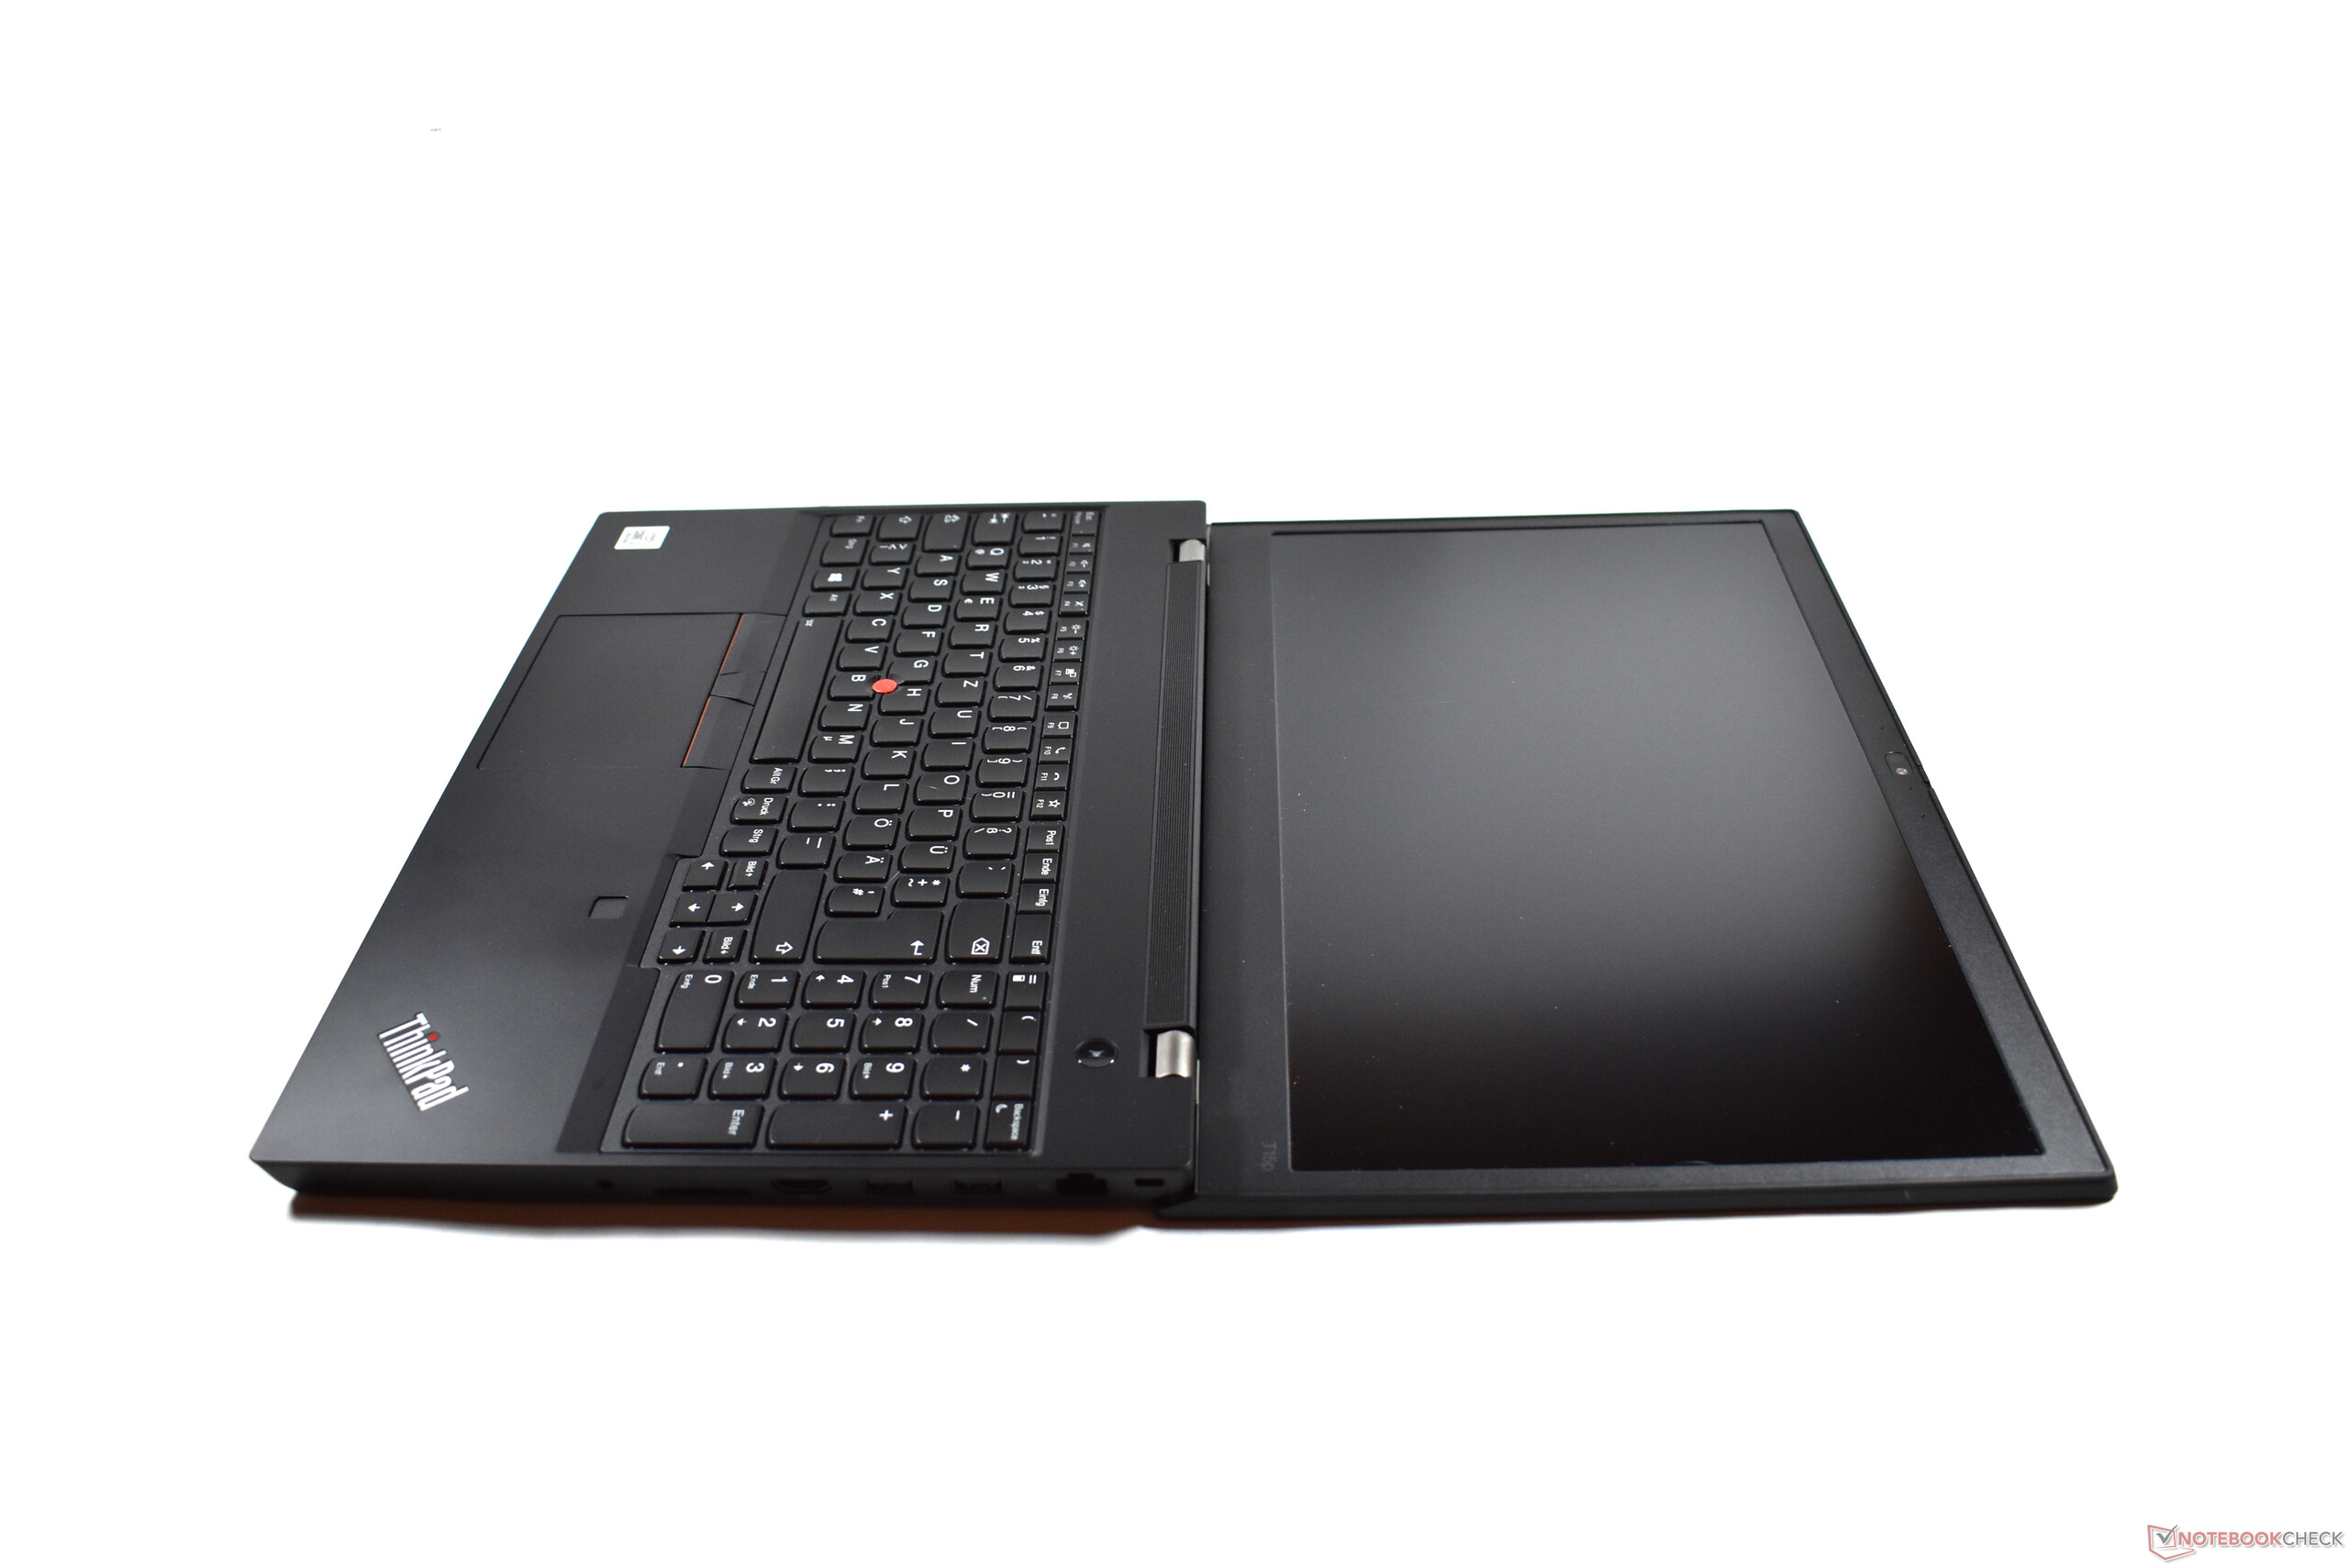
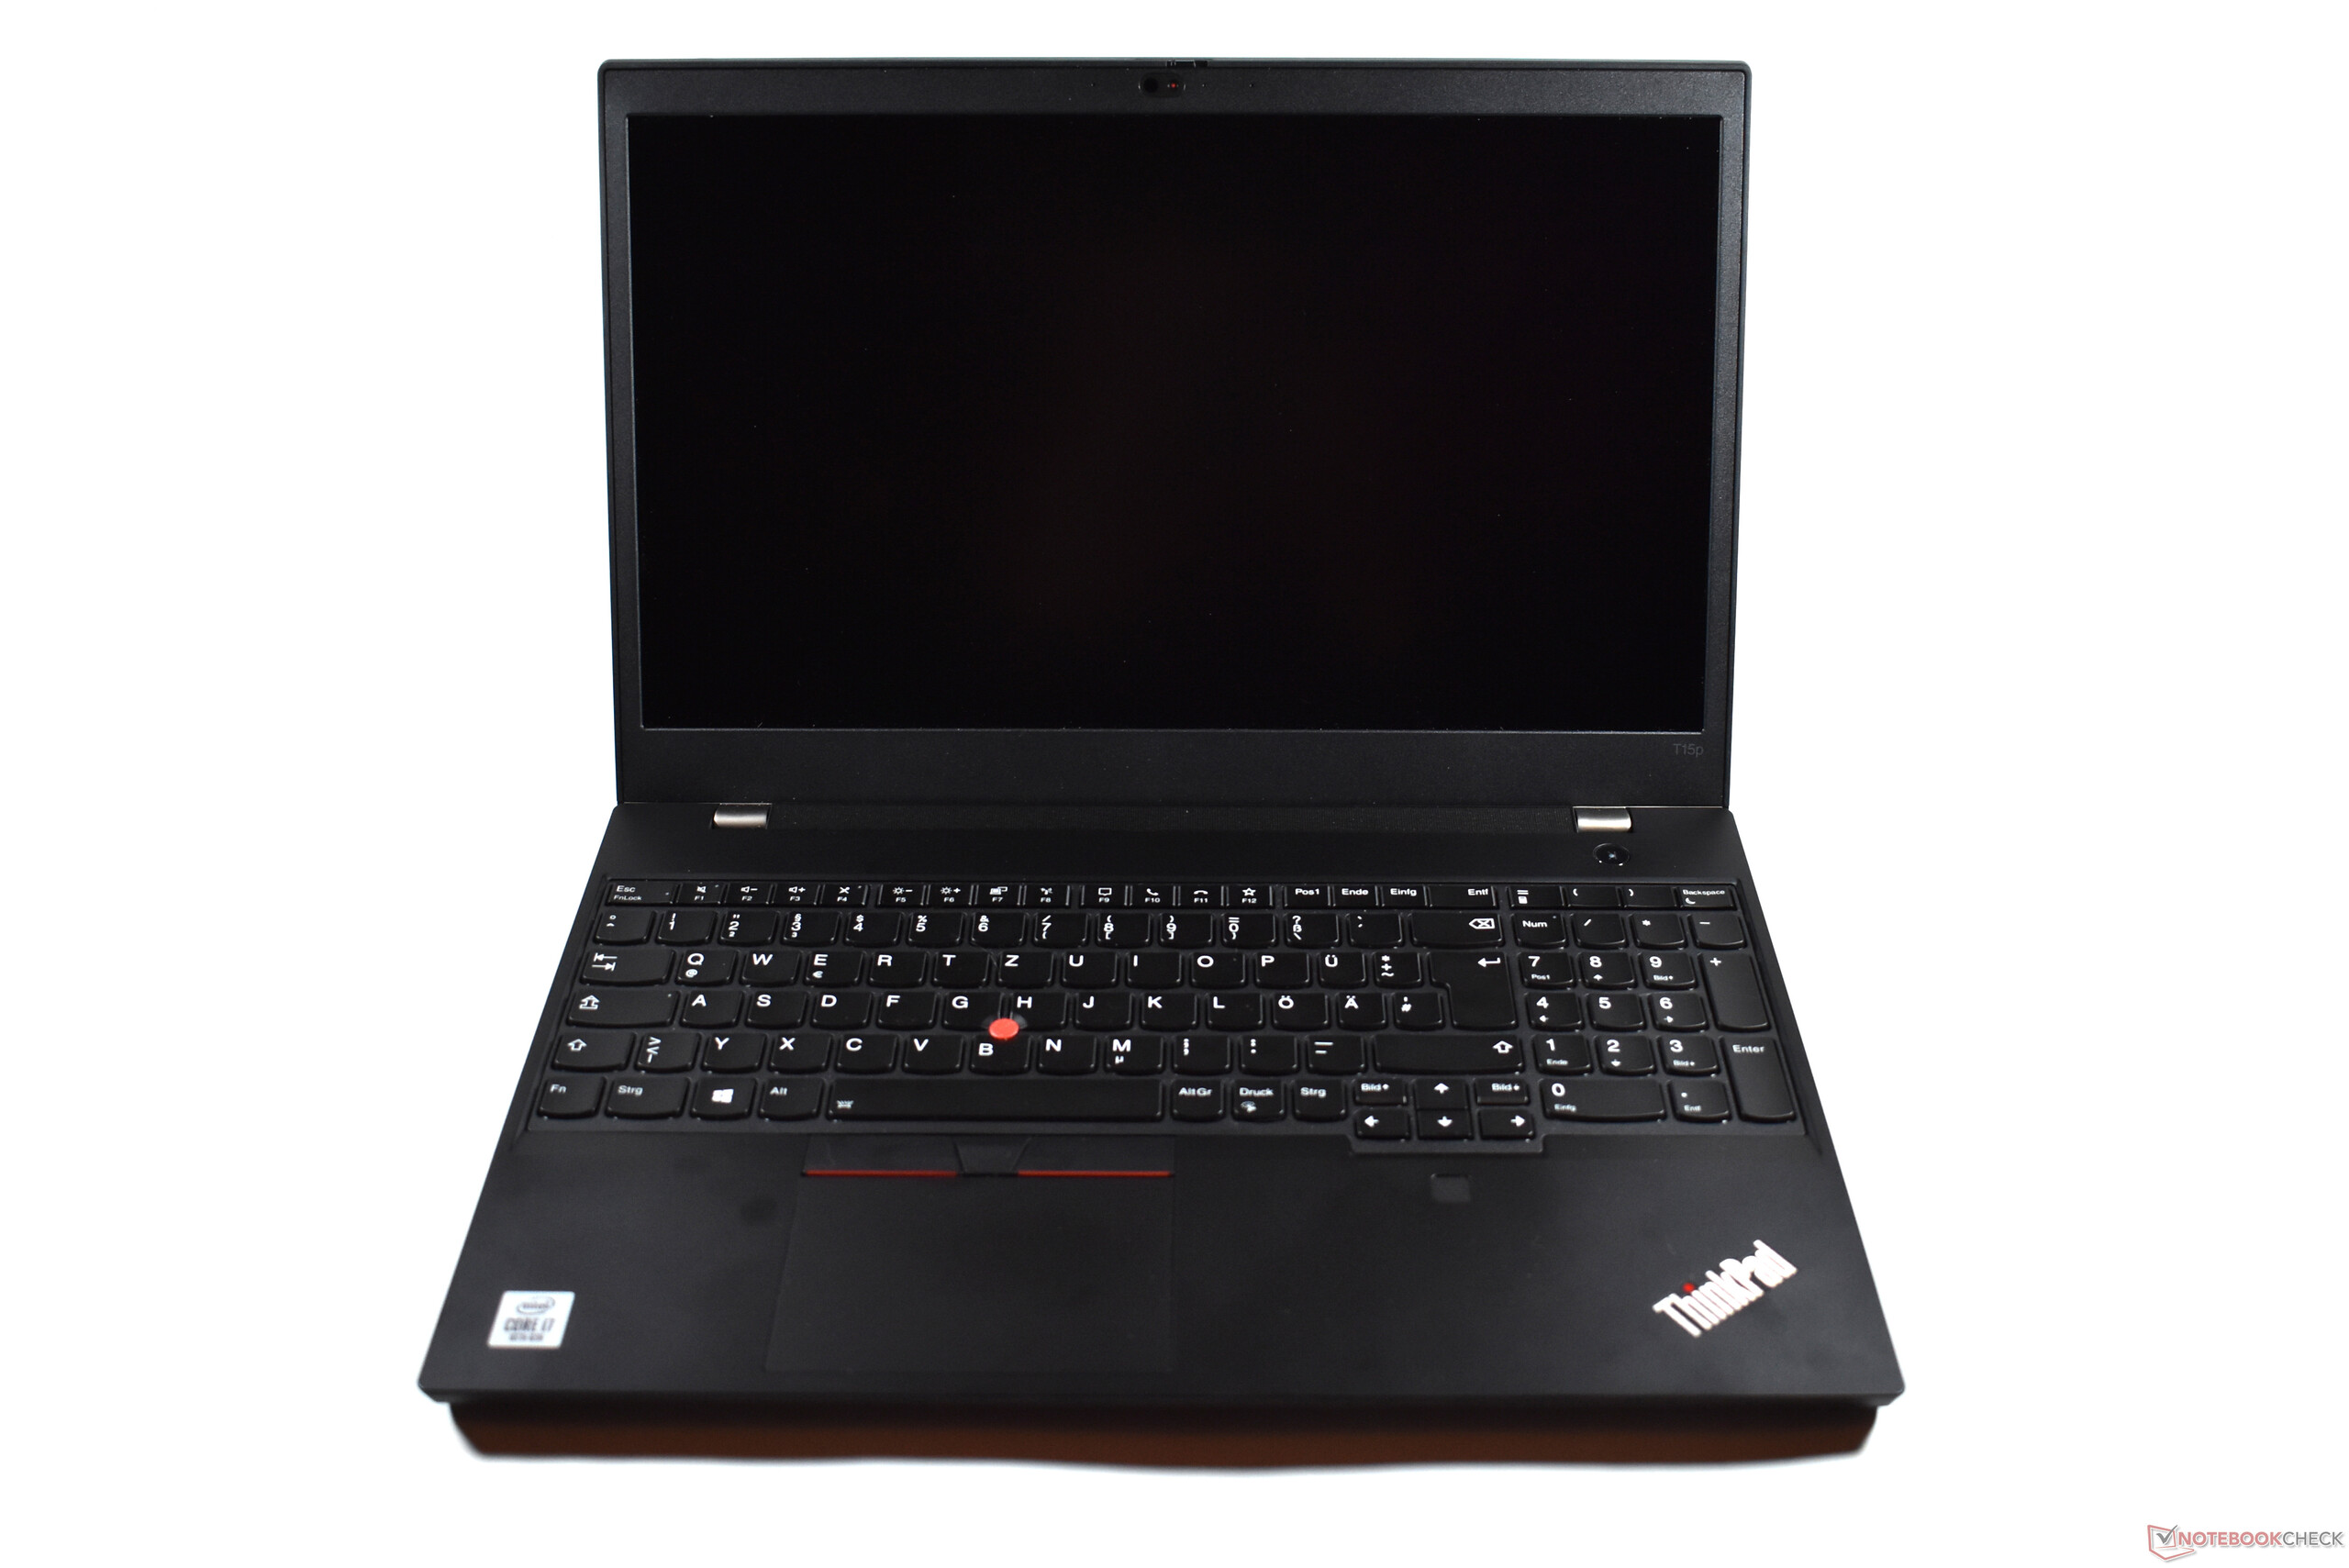
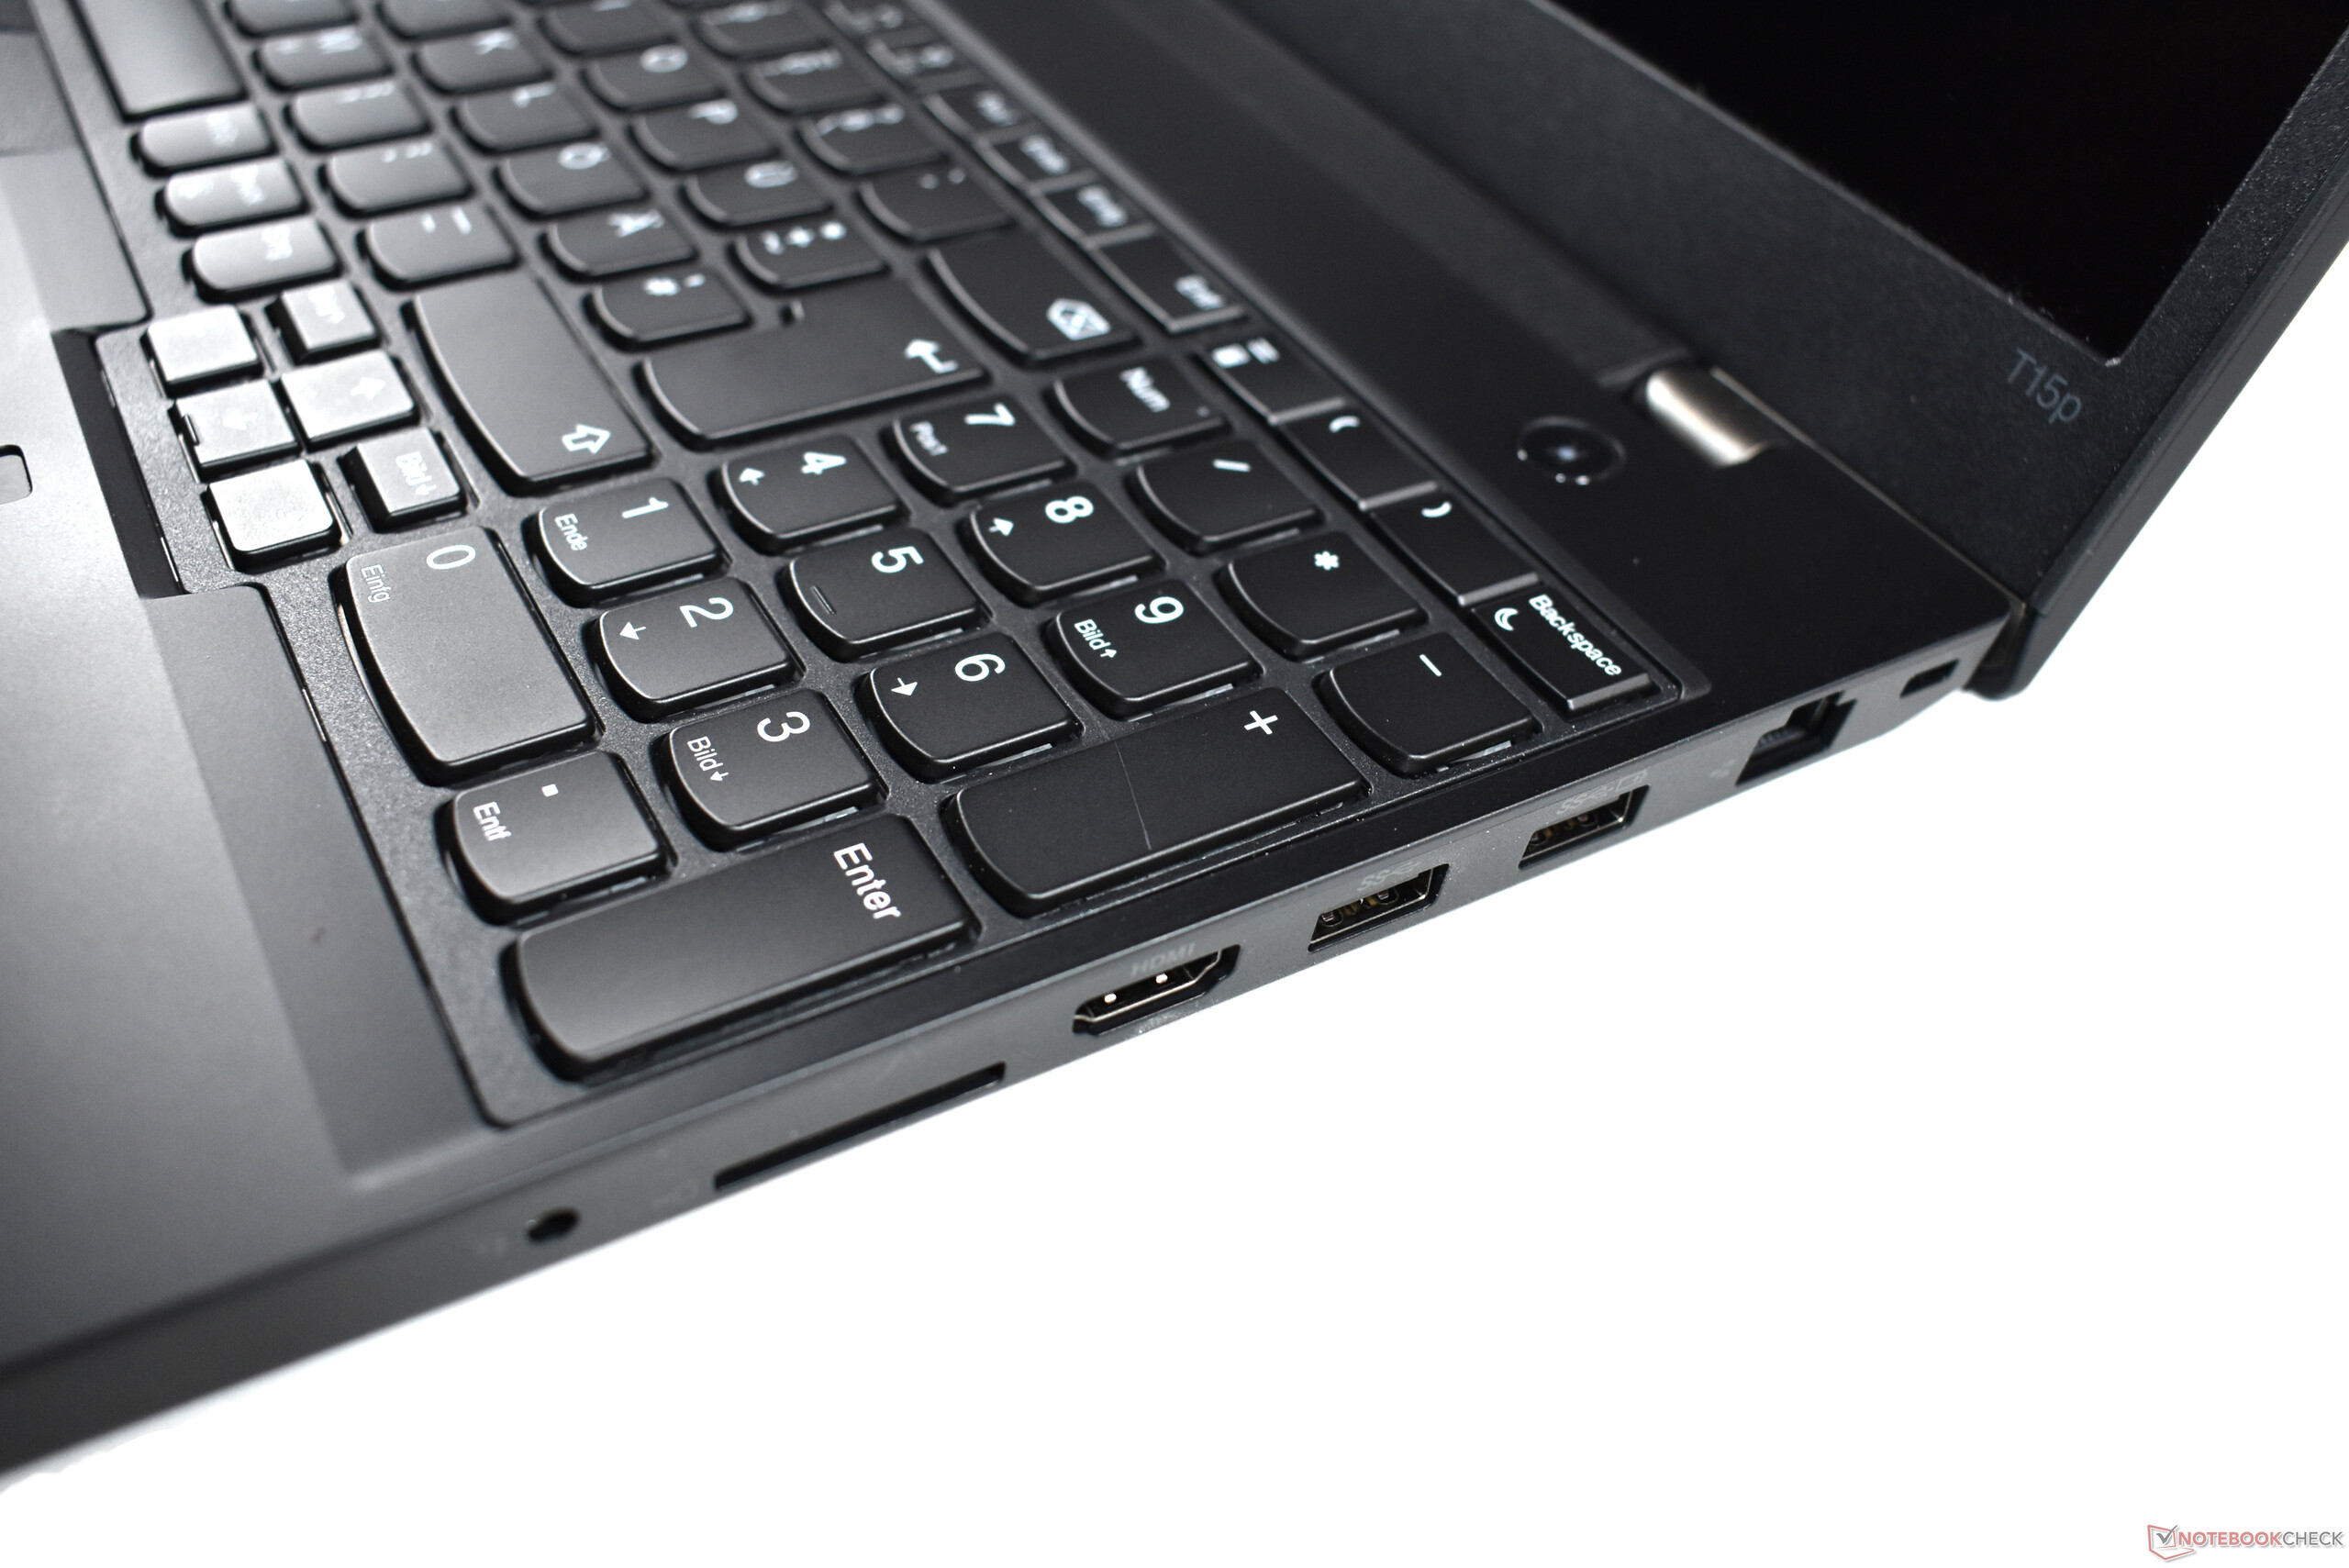
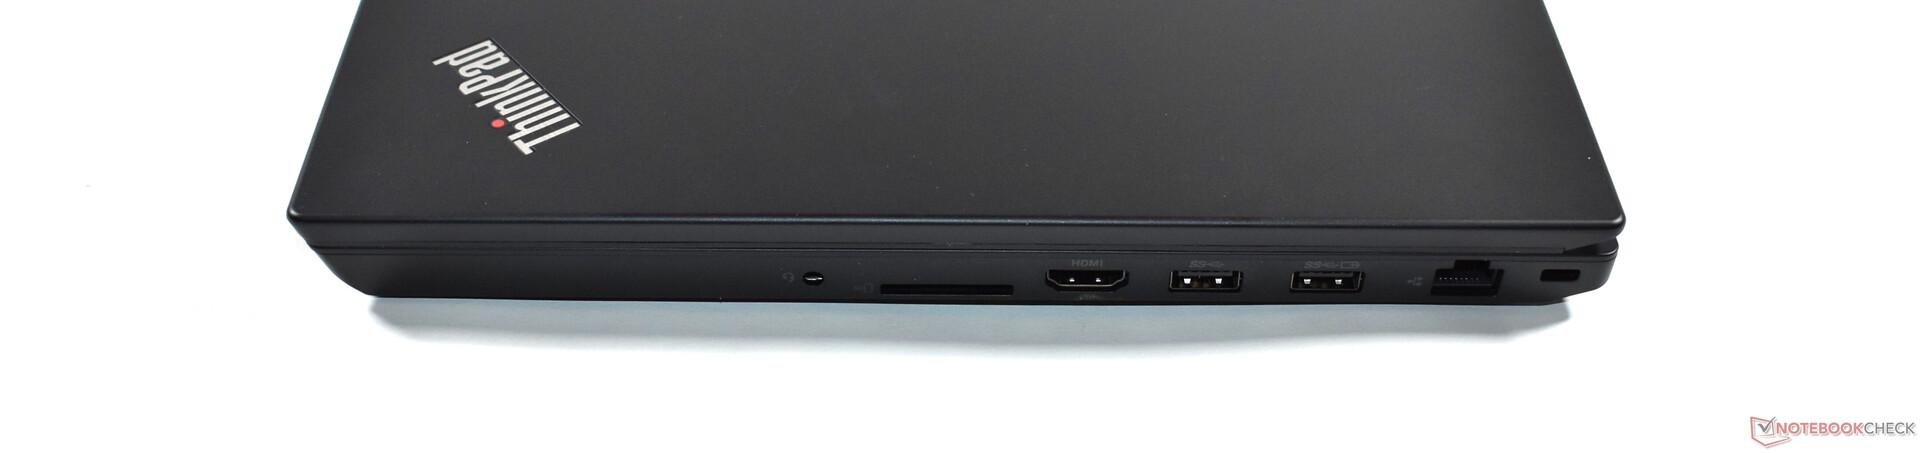
ThinkPad T15p har dock sina styrkor. Jämfört med vanliga Lenovo ThinkPad T15 har den rejält uppgraderad prestanda. Den har också en SD-kortläsare i full storlek. Vi kan inte kritisera tangentbordet, styrplattan eller TrackPoint-enheten och den har ordentligt med anslutningsmöjligheter och säkerhetsfunktioner, vilket inkluderar LTE redan från start. Lenovo har heller inte sparat in på skärmen: 4K UHD-skärmen presterar bra på alla sätt. Det går också att uppgradera ThinkPad T15p och modellen med "p"-suffixet har fler expansionsmöjligheter än T15. När det kommer till höljet känner vi oss lite ambivalenta: Även om det är robust känns det relativt billigt jämfört med andra ThinkPad-modeller.
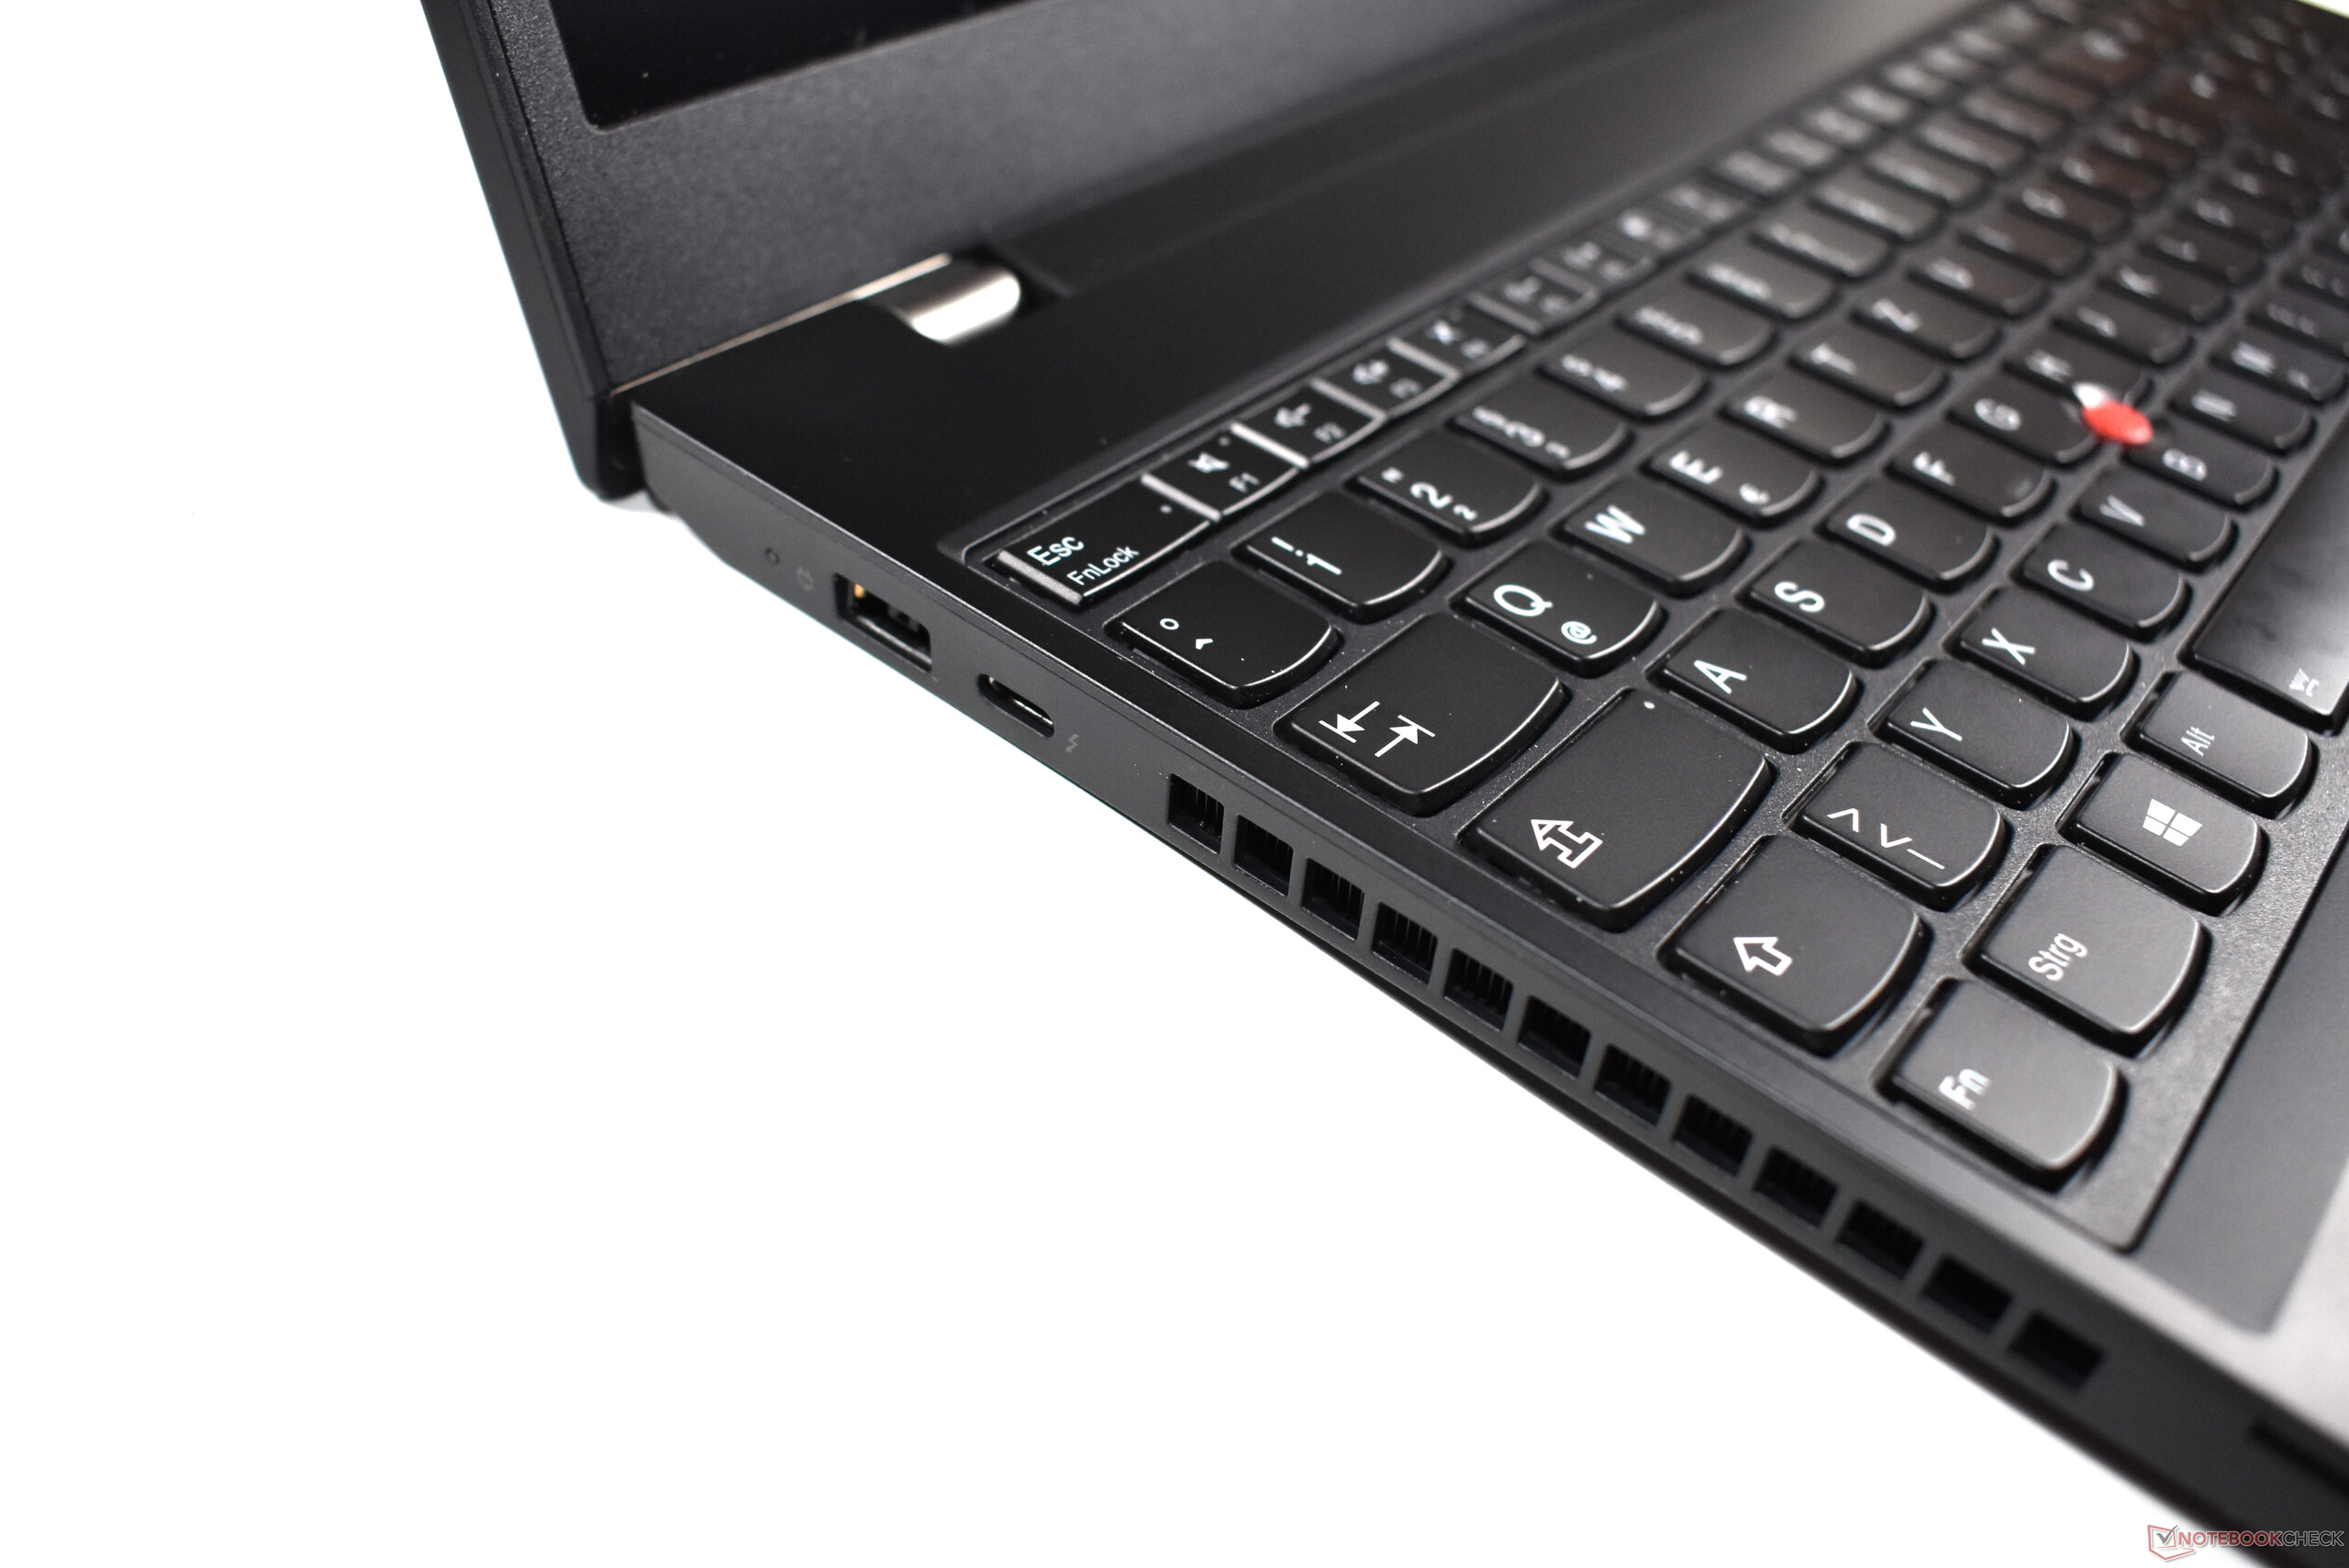
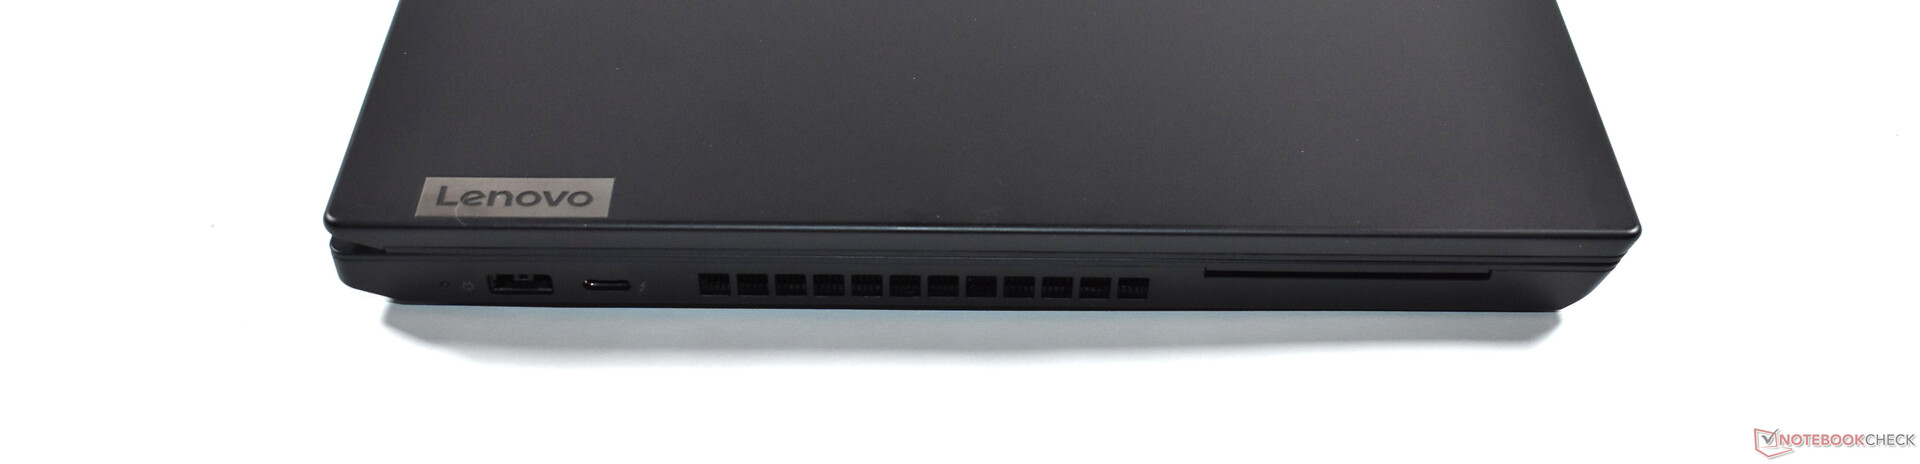
Den har ganska svag batteritid. Här märks verkligen de ineffektiva komponenterna och 4K-skärmen. ThinkPad T15p står också ut från mängden med en kombination av höga temperaturer och hög ljudnivå vid belastning. Kylsystemet känns ganska underdimensionerat. Det är också märkligt att Lenovo helt och hållet har uteslutit möjligheten att ladda datorn via USB-C. Vi kan inte se någon anledning att inte ha med den funktionen.
Ett svårt fall: Tittar vi bara på Lenovo ThinkPad T15p Gen 1 ser vi en bra och kraftfull arbetslaptop att ha hemma på skrivbordet. Men konkurrens från Lenovos andra modeller gör det svårt för den.
Vi kan inte avråda dig från ThinkPad T15p, men det är också svårt att rekommendera den. Den saknar ett tydligt syfte och konkurrensen från Lenovos andra modeller är för stark. T15p är heller inte billig, och kan du tänka dig att betala över 20.000 kronor kan du lika gärna köpa ThinkPad X1 Extreme Gen 3. Den är utan många av de svaga punkterna som T15p lider av. Bortsett från en RJ45 Ethernet-port och ett numeriskt tangentbord har T15p inga egentliga fördelar framför X1 Extreme Gen 3.
Lenovo ThinkPad T15p-20TN0006GE
- 02/09/2021 v7 (old)
Benjamin Herzig
Price comparison
