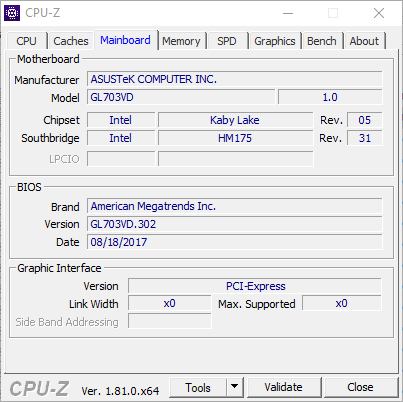
Test: Asus ROG Strix GL703VD-DB74 (7700HQ, GTX 1050, FHD) Laptop (Sammanfattning)
| SD Card Reader | |
| average JPG Copy Test (av. of 3 runs) | |
| Acer Predator Helios 300 | |
| HP Omen 17-w206ng | |
| Asus ROG Strix GL703VD-DB74 | |
| MSI GS73VR 7RF | |
| MSI GL72 7RDX-602 | |
| Acer Aspire V17 Nitro BE VN7-793G-52XN | |
| maximum AS SSD Seq Read Test (1GB) | |
| HP Omen 17-w206ng | |
| Asus ROG Strix GL703VD-DB74 | |
| Acer Predator Helios 300 | |
| MSI GS73VR 7RF | |
| Acer Aspire V17 Nitro BE VN7-793G-52XN | |
| MSI GL72 7RDX-602 | |
| Networking | |
| iperf3 transmit AX12 | |
| Acer Aspire V17 Nitro BE VN7-793G-52XN | |
| MSI GS73VR 7RF | |
| Acer Predator Helios 300 | |
| HP Omen 17-w206ng | |
| Asus ROG Strix GL703VD-DB74 | |
| MSI GL72 7RDX-602 | |
| iperf3 receive AX12 | |
| Acer Predator Helios 300 | |
| HP Omen 17-w206ng | |
| Asus ROG Strix GL703VD-DB74 | |
| MSI GS73VR 7RF | |
| Acer Aspire V17 Nitro BE VN7-793G-52XN | |
| MSI GL72 7RDX-602 | |
| |||||||||||||||||||||||||
Distribution av ljusstyrkan: 85 %
Mitt på batteriet: 421.2 cd/m²
Kontrast: 957:1 (Svärta: 0.44 cd/m²)
ΔE ColorChecker Calman: 5 | ∀{0.5-29.43 Ø4.72}
ΔE Greyscale Calman: 5 | ∀{0.09-98 Ø4.97}
86.1% sRGB (Argyll 1.6.3 3D)
62.94% AdobeRGB 1998 (Argyll 1.6.3 3D)
62.9% AdobeRGB 1998 (Argyll 3D)
86.1% sRGB (Argyll 3D)
67.6% Display P3 (Argyll 3D)
Gamma: 2.18
CCT: 6882 K
| Asus ROG Strix GL703VD-DB74 LG Philips LP173WF4-SPF5, IPS, 17.3", 1920x1080 | Acer Predator Helios 300 LG LP173WF4-SPF5 (LGD056D), AH-IPS, WLED, 17.3", 1920x1080 | Acer Aspire V17 Nitro BE VN7-793G-52XN AUO B173HAN01.0, a-Si TFT-LCD, WLED, 17.3", 1920x1080 | HP Omen 17-w206ng Chi Mei CMN1738, IPS, 17.3", 1920x1080 | MSI GL72 7RDX-602 Chi Mei CMN1735 N173HGE-E11, TN LED, 17.3", 1920x1080 | MSI GS73VR 7RF AU Optronics AUO109B, IPS, 17.3", 3840x2160 | Acer Aspire V17 Nitro BE VN7-793-738J AU Optronics B173ZAN01.0, IPS, 17.3", 3840x2160 | |
|---|---|---|---|---|---|---|---|
| Display | -0% | 1% | 5% | 3% | 4% | 32% | |
| Display P3 Coverage (%) | 67.6 | 66.8 -1% | 64 -5% | 67.2 -1% | 65.2 -4% | 64.2 -5% | 85.4 26% |
| sRGB Coverage (%) | 86.1 | 85.8 0% | 90.2 5% | 93.1 8% | 94.3 10% | 96.8 12% | 100 16% |
| AdobeRGB 1998 Coverage (%) | 62.9 | 62.8 0% | 65.4 4% | 67.4 7% | 65.6 4% | 66.4 6% | 97.8 55% |
| Response Times | -8% | -22% | -25% | -11% | -25% | -13% | |
| Response Time Grey 50% / Grey 80% * (ms) | 30.8 ? | 36 ? -17% | 36 ? -17% | 38 ? -23% | 29 ? 6% | 38 ? -23% | 29 ? 6% |
| Response Time Black / White * (ms) | 20.4 ? | 20 ? 2% | 26 ? -27% | 26 ? -27% | 26 ? -27% | 26 ? -27% | 27 ? -32% |
| PWM Frequency (Hz) | 119000 ? | 119000 ? | 200 ? | 961 | |||
| Screen | 2% | 5% | 3% | -44% | 2% | 9% | |
| Brightness middle (cd/m²) | 421.2 | 384 -9% | 346 -18% | 318 -25% | 299 -29% | 371.1 -12% | 380 -10% |
| Brightness (cd/m²) | 393 | 373 -5% | 307 -22% | 295 -25% | 274 -30% | 343 -13% | 336 -15% |
| Brightness Distribution (%) | 85 | 93 9% | 84 -1% | 79 -7% | 80 -6% | 86 1% | 81 -5% |
| Black Level * (cd/m²) | 0.44 | 0.35 20% | 0.26 41% | 0.25 43% | 0.25 43% | 0.42 5% | 0.32 27% |
| Contrast (:1) | 957 | 1097 15% | 1331 39% | 1272 33% | 1196 25% | 884 -8% | 1188 24% |
| Colorchecker dE 2000 * | 5 | 4.81 4% | 4.32 14% | 4.7 6% | 12.92 -158% | 4.5 10% | 5.32 -6% |
| Colorchecker dE 2000 max. * | 8.8 | 8.69 1% | 8.05 9% | 8.8 -0% | 19.91 -126% | 9.7 -10% | 7.63 13% |
| Greyscale dE 2000 * | 5 | 5.33 -7% | 5.76 -15% | 5 -0% | 13.16 -163% | 3.1 38% | 4.9 2% |
| Gamma | 2.18 101% | 2.45 90% | 2.35 94% | 2.28 96% | 2.36 93% | 2.17 101% | 2.61 84% |
| CCT | 6882 94% | 7137 91% | 6447 101% | 7374 88% | 15046 43% | 7120 91% | 6558 99% |
| Color Space (Percent of AdobeRGB 1998) (%) | 62.94 | 56 -11% | 59 -6% | 61 -3% | 60 -5% | 61 -3% | 87.2 39% |
| Color Space (Percent of sRGB) (%) | 86.1 | 86 0% | 90 5% | 93 8% | 94 9% | 97 13% | 100 16% |
| Totalt genomsnitt (program/inställningar) | -2% /
0% | -5% /
0% | -6% /
-0% | -17% /
-30% | -6% /
-1% | 9% /
10% |
* ... mindre är bättre
Visa svarstider
| ↔ Svarstid svart till vitt | ||
|---|---|---|
| 20.4 ms ... stiga ↗ och falla ↘ kombinerat | ↗ 12 ms stiga | 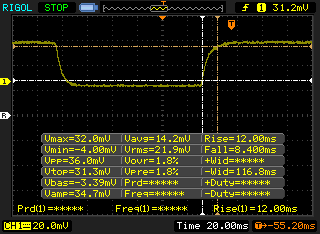 |
| ↘ 8.4 ms hösten | ||
| Skärmen visar bra svarsfrekvens i våra tester, men kan vara för långsam för konkurrenskraftiga spelare. I jämförelse sträcker sig alla testade enheter från 0.1 (minst) till 240 (maximalt) ms. » 46 % av alla enheter är bättre. Det betyder att den uppmätta svarstiden liknar genomsnittet av alla testade enheter (19.8 ms). | ||
| ↔ Svarstid 50 % grått till 80 % grått | ||
| 30.8 ms ... stiga ↗ och falla ↘ kombinerat | ↗ 18 ms stiga | 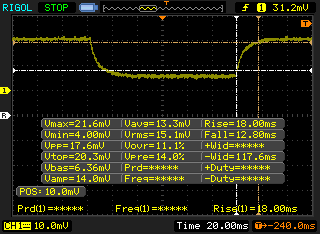 |
| ↘ 12.8 ms hösten | ||
| Skärmen visar långsamma svarsfrekvenser i våra tester och kommer att vara otillfredsställande för spelare. I jämförelse sträcker sig alla testade enheter från 0.165 (minst) till 636 (maximalt) ms. » 41 % av alla enheter är bättre. Det betyder att den uppmätta svarstiden liknar genomsnittet av alla testade enheter (31 ms). | ||
Skärmflimmer / PWM (Puls-Width Modulation)
| Skärmflimmer / PWM upptäckt | 119000 Hz | ≤ 99 % ljusstyrka inställning | 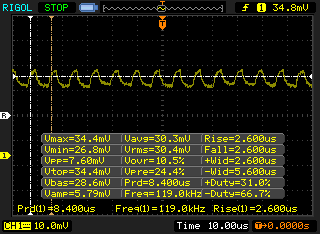 |
Displayens bakgrundsbelysning flimrar vid 119000 Hz (i värsta fall, t.ex. med PWM) Flimrande upptäckt vid en ljusstyrkeinställning på 99 % och lägre. Det ska inte finnas något flimmer eller PWM över denna ljusstyrkeinställning. Frekvensen för 119000 Hz är ganska hög, så de flesta användare som är känsliga för PWM bör inte märka något flimmer. Som jämförelse: 52 % av alla testade enheter använder inte PWM för att dämpa skärmen. Om PWM upptäcktes mättes ett medelvärde av 7772 (minst: 5 - maximum: 343500) Hz. | |||
| Cinebench R15 | |
| CPU Single 64Bit | |
| Acer Aspire V17 Nitro BE VN7-793-738J | |
| MSI GS73VR 7RF | |
| Acer Predator Helios 300 | |
| HP Omen 17-w206ng | |
| MSI GL72 7RDX-602 | |
| Asus ROG Strix GL703VD-DB74 | |
| Acer Aspire V17 Nitro BE VN7-793G-52XN | |
| CPU Multi 64Bit | |
| Acer Predator Helios 300 | |
| Acer Aspire V17 Nitro BE VN7-793-738J | |
| MSI GS73VR 7RF | |
| MSI GL72 7RDX-602 | |
| HP Omen 17-w206ng | |
| Asus ROG Strix GL703VD-DB74 | |
| Acer Aspire V17 Nitro BE VN7-793G-52XN | |
| Cinebench R11.5 | |
| CPU Single 64Bit | |
| MSI GS73VR 7RF | |
| Acer Predator Helios 300 | |
| HP Omen 17-w206ng | |
| Asus ROG Strix GL703VD-DB74 | |
| Acer Aspire V17 Nitro BE VN7-793G-52XN | |
| CPU Multi 64Bit | |
| MSI GS73VR 7RF | |
| Acer Predator Helios 300 | |
| HP Omen 17-w206ng | |
| Asus ROG Strix GL703VD-DB74 | |
| Acer Aspire V17 Nitro BE VN7-793G-52XN | |
| Cinebench R10 | |
| Rendering Multiple CPUs 32Bit | |
| Acer Aspire V17 Nitro BE VN7-793-738J | |
| Acer Predator Helios 300 | |
| Asus ROG Strix GL703VD-DB74 | |
| Acer Aspire V17 Nitro BE VN7-793G-52XN | |
| Rendering Single 32Bit | |
| Acer Aspire V17 Nitro BE VN7-793-738J | |
| Acer Predator Helios 300 | |
| Asus ROG Strix GL703VD-DB74 | |
| Acer Aspire V17 Nitro BE VN7-793G-52XN | |
| wPrime 2.10 - 1024m | |
| Asus ROG Strix GL703VD-DB74 | |
| MSI GS73VR 7RF | |
* ... mindre är bättre
| PCMark 8 | |
| Home Score Accelerated v2 | |
| Acer Predator Helios 300 | |
| HP Omen 17-w206ng | |
| Acer Aspire V17 Nitro BE VN7-793G-52XN | |
| Asus ROG Strix GL703VD-DB74 | |
| MSI GS73VR 7RF | |
| Acer Aspire V17 Nitro BE VN7-793-738J | |
| MSI GL72 7RDX-602 | |
| Work Score Accelerated v2 | |
| Acer Predator Helios 300 | |
| Asus ROG Strix GL703VD-DB74 | |
| Acer Aspire V17 Nitro BE VN7-793G-52XN | |
| MSI GL72 7RDX-602 | |
| MSI GS73VR 7RF | |
| Acer Aspire V17 Nitro BE VN7-793-738J | |
| Creative Score Accelerated v2 | |
| Acer Predator Helios 300 | |
| MSI GS73VR 7RF | |
| Acer Aspire V17 Nitro BE VN7-793-738J | |
| Asus ROG Strix GL703VD-DB74 | |
| Acer Aspire V17 Nitro BE VN7-793G-52XN | |
| MSI GL72 7RDX-602 | |
| PCMark 8 Home Score Accelerated v2 | 3868 poäng | |
| PCMark 8 Creative Score Accelerated v2 | 4967 poäng | |
| PCMark 8 Work Score Accelerated v2 | 4998 poäng | |
| PCMark 10 Score | 4309 poäng | |
Hjälp | ||
| Asus ROG Strix GL703VD-DB74 SanDisk SD8SN8U256G1002 | Acer Predator Helios 300 Intel SSD 600p SSDPEKKW512G7 | Acer Aspire V17 Nitro BE VN7-793G-52XN SK Hynix HFS256G39TND-N210A | HP Omen 17-w206ng Samsung PM961 MZVLW256HEHP | MSI GL72 7RDX-602 HGST Travelstar 7K1000 HTS721010A9E630 | MSI GS73VR 7RF Samsung SM961 MZVKW512HMJP m.2 PCI-e | |
|---|---|---|---|---|---|---|
| CrystalDiskMark 3.0 | 67% | 5% | 157% | -88% | 149% | |
| Write 4k QD32 (MB/s) | 214.2 | 404.5 89% | 267 25% | 505 136% | 1.102 -99% | 355.3 66% |
| Read 4k QD32 (MB/s) | 327.3 | 457.7 40% | 344.6 5% | 588 80% | 1.068 -100% | 454.1 39% |
| Write 4k (MB/s) | 49.93 | 125.5 151% | 76.2 53% | 155.6 212% | 1.022 -98% | 131.5 163% |
| Read 4k (MB/s) | 26.18 | 34.29 31% | 28.4 8% | 59.9 129% | 0.582 -98% | 48.5 85% |
| Write 512 (MB/s) | 339 | 425.9 26% | 267.8 -21% | 805 137% | 58.3 -83% | 748 121% |
| Read 512 (MB/s) | 321.5 | 580 80% | 325.8 1% | 846 163% | 45.57 -86% | 445.2 38% |
| Write Seq (MB/s) | 444.4 | 569 28% | 270.2 -39% | 1176 165% | 127 -71% | 1609 262% |
| Read Seq (MB/s) | 476 | 899 89% | 493.1 4% | 1606 237% | 135.3 -72% | 2459 417% |

| 3DMark 11 | |
| 1280x720 Performance GPU | |
| Acer Predator Helios 300 | |
| Acer Aspire V17 Nitro BE VN7-793G-52XN | |
| MSI GS73VR 7RF | |
| Acer Aspire V17 Nitro BE VN7-793-738J | |
| HP Omen 17-w206ng | |
| Asus ROG Strix GL703VD-DB74 | |
| MSI GL72 7RDX-602 | |
| 1280x720 Performance Combined | |
| Acer Aspire V17 Nitro BE VN7-793-738J | |
| MSI GS73VR 7RF | |
| Acer Predator Helios 300 | |
| HP Omen 17-w206ng | |
| Asus ROG Strix GL703VD-DB74 | |
| MSI GL72 7RDX-602 | |
| Acer Aspire V17 Nitro BE VN7-793G-52XN | |
| 3DMark | |
| 1280x720 Cloud Gate Standard Graphics | |
| Acer Predator Helios 300 | |
| Acer Aspire V17 Nitro BE VN7-793G-52XN | |
| MSI GS73VR 7RF | |
| Asus ROG Strix GL703VD-DB74 | |
| MSI GL72 7RDX-602 | |
| 1920x1080 Fire Strike Graphics | |
| Acer Predator Helios 300 | |
| Acer Aspire V17 Nitro BE VN7-793-738J | |
| MSI GS73VR 7RF | |
| Acer Aspire V17 Nitro BE VN7-793G-52XN | |
| Asus ROG Strix GL703VD-DB74 | |
| MSI GL72 7RDX-602 | |
| 3DMark 11 Performance | 7751 poäng | |
| 3DMark Cloud Gate Standard Score | 20414 poäng | |
| 3DMark Fire Strike Score | 5642 poäng | |
| 3DMark Fire Strike Extreme Score | 2765 poäng | |
Hjälp | ||
| Rise of the Tomb Raider | |
| 1920x1080 Very High Preset AA:FX AF:16x (sortera efter värde) | |
| Asus ROG Strix GL703VD-DB74 | |
| Acer Predator Helios 300 | |
| Acer Aspire V17 Nitro BE VN7-793G-52XN | |
| MSI GL72 7RDX-602 | |
| MSI GS73VR 7RF | |
| 1920x1080 High Preset AA:FX AF:4x (sortera efter värde) | |
| Asus ROG Strix GL703VD-DB74 | |
| Acer Predator Helios 300 | |
| Acer Aspire V17 Nitro BE VN7-793G-52XN | |
| MSI GL72 7RDX-602 | |
| 1366x768 Medium Preset AF:2x (sortera efter värde) | |
| Asus ROG Strix GL703VD-DB74 | |
| Acer Predator Helios 300 | |
| Acer Aspire V17 Nitro BE VN7-793G-52XN | |
| MSI GL72 7RDX-602 | |
| 1024x768 Lowest Preset (sortera efter värde) | |
| Asus ROG Strix GL703VD-DB74 | |
| Acer Predator Helios 300 | |
| Acer Aspire V17 Nitro BE VN7-793G-52XN | |
| MSI GL72 7RDX-602 | |
| låg | med. | hög | ultra | |
|---|---|---|---|---|
| Dirt 3 (2011) | 208.6 | 178.2 | 168 | 110.8 |
| Sleeping Dogs (2012) | 186.4 | 159.1 | 154.1 | 69 |
| Hitman: Absolution (2012) | 100.7 | 92.4 | 81.4 | 41.5 |
| Tomb Raider (2013) | 358 | 257.7 | 169 | 77.7 |
| BioShock Infinite (2013) | 237.6 | 178.3 | 158.8 | 64.8 |
| Metro: Last Light (2013) | 103.7 | 95.1 | 60.4 | 50 |
| GRID 2 (2013) | 150 | 111.8 | 101.4 | 74.4 |
| Company of Heroes 2 (2013) | 52.2 | 48 | 45.8 | 25.1 |
| Thief (2014) | 77.3 | 71.2 | 69.2 | 44.1 |
| The Witcher 3 (2015) | 119.2 | 73 | 41.2 | 23 |
| Rise of the Tomb Raider (2016) | 117 | 73 | 43 | 35 |
| Ashes of the Singularity (2016) | 46.4 | 37.9 | 34.3 |
Ljudnivå
| Låg belastning |
| 30.4 / 30.4 / 30.4 dB(A) |
| Hög belastning |
| 36.4 / 53 dB(A) |
 | ||
30 dB tyst 40 dB(A) hörbar 50 dB(A) högt ljud |
||
min: | ||
| Asus ROG Strix GL703VD-DB74 GeForce GTX 1050 Mobile, i7-7700HQ, SanDisk SD8SN8U256G1002 | Acer Predator Helios 300 GeForce GTX 1060 Mobile, i7-7700HQ, Intel SSD 600p SSDPEKKW512G7 | Acer Aspire V17 Nitro BE VN7-793G-52XN GeForce GTX 1060 Mobile, i5-7300HQ, SK Hynix HFS256G39TND-N210A | HP Omen 17-w206ng GeForce GTX 1050 Ti Mobile, i7-7700HQ, Samsung PM961 MZVLW256HEHP | MSI GL72 7RDX-602 GeForce GTX 1050 Mobile, i7-7700HQ, HGST Travelstar 7K1000 HTS721010A9E630 | MSI GS73VR 7RF GeForce GTX 1060 Mobile, i7-7700HQ, Samsung SM961 MZVKW512HMJP m.2 PCI-e | |
|---|---|---|---|---|---|---|
| Noise | -6% | 3% | -12% | -4% | -1% | |
| av / miljö * (dB) | 27.9 | 31 -11% | 30.7 -10% | 30 -8% | 30.8 -10% | 28.1 -1% |
| Idle Minimum * (dB) | 30.4 | 31 -2% | 30.7 -1% | 34 -12% | 32.4 -7% | 30.8 -1% |
| Idle Average * (dB) | 30.4 | 32 -5% | 30.7 -1% | 35 -15% | 32.4 -7% | 30.8 -1% |
| Idle Maximum * (dB) | 30.4 | 33 -9% | 31.4 -3% | 36 -18% | 32.8 -8% | 30.9 -2% |
| Load Average * (dB) | 36.4 | 44 -21% | 32.1 12% | 47 -29% | 40.9 -12% | 42.2 -16% |
| Witcher 3 ultra * (dB) | 46 | 46 -0% | 42.8 7% | 48 -4% | 44.4 3% | |
| Load Maximum * (dB) | 53 | 50 6% | 42.8 19% | 52 2% | 43.6 18% | 48.6 8% |
* ... mindre är bättre
(-) Den maximala temperaturen på ovansidan är 68.8 °C / 156 F, jämfört med genomsnittet av 40.4 °C / 105 F , allt från 21.2 till 68.8 °C för klassen Gaming.
(-) Botten värms upp till maximalt 62 °C / 144 F, jämfört med genomsnittet av 43.2 °C / 110 F
(+) Vid tomgångsbruk är medeltemperaturen för ovansidan 28.8 °C / 84 F, jämfört med enhetsgenomsnittet på 33.9 °C / ### class_avg_f### F.
(-) När du spelar The Witcher 3 är medeltemperaturen för ovansidan 39 °C / 102 F, jämfört med enhetsgenomsnittet på 33.9 °C / ## #class_avg_f### F.
(+) Handledsstöden och pekplattan är kallare än hudtemperaturen med maximalt 31.4 °C / 88.5 F och är därför svala att ta på.
(-) Medeltemperaturen för handledsstödsområdet på liknande enheter var 28.8 °C / 83.8 F (-2.6 °C / -4.7 F).
Asus ROG Strix GL703VD-DB74 ljudanalys
(-) | inte särskilt höga högtalare (66.2 dB)
Bas 100 - 315 Hz
(±) | reducerad bas - i genomsnitt 11% lägre än medianen
(±) | linjäriteten för basen är genomsnittlig (14.5% delta till föregående frekvens)
Mellan 400 - 2000 Hz
(+) | balanserad mellan - endast 3.5% från medianen
(±) | linjäriteten för mids är genomsnittlig (7.1% delta till föregående frekvens)
Högsta 2 - 16 kHz
(+) | balanserade toppar - endast 3.3% från medianen
(±) | linjäriteten för toppar är genomsnittlig (9% delta till föregående frekvens)
Totalt 100 - 16 000 Hz
(±) | linjäriteten för det totala ljudet är genomsnittlig (19.7% skillnad mot median)
Jämfört med samma klass
» 69% av alla testade enheter i den här klassen var bättre, 6% liknande, 25% sämre
» Den bästa hade ett delta på 6%, genomsnittet var 18%, sämst var 132%
Jämfört med alla testade enheter
» 50% av alla testade enheter var bättre, 7% liknande, 43% sämre
» Den bästa hade ett delta på 4%, genomsnittet var 24%, sämst var 134%
Apple MacBook 12 (Early 2016) 1.1 GHz ljudanalys
(+) | högtalare kan spela relativt högt (83.6 dB)
Bas 100 - 315 Hz
(±) | reducerad bas - i genomsnitt 11.3% lägre än medianen
(±) | linjäriteten för basen är genomsnittlig (14.2% delta till föregående frekvens)
Mellan 400 - 2000 Hz
(+) | balanserad mellan - endast 2.4% från medianen
(+) | mids är linjära (5.5% delta till föregående frekvens)
Högsta 2 - 16 kHz
(+) | balanserade toppar - endast 2% från medianen
(+) | toppar är linjära (4.5% delta till föregående frekvens)
Totalt 100 - 16 000 Hz
(+) | det totala ljudet är linjärt (10.2% skillnad mot median)
Jämfört med samma klass
» 7% av alla testade enheter i den här klassen var bättre, 2% liknande, 91% sämre
» Den bästa hade ett delta på 5%, genomsnittet var 18%, sämst var 53%
Jämfört med alla testade enheter
» 5% av alla testade enheter var bättre, 1% liknande, 94% sämre
» Den bästa hade ett delta på 4%, genomsnittet var 24%, sämst var 134%
| Av/Standby | |
| Låg belastning | |
| Hög belastning |
|
Förklaring:
min: | |
| Asus ROG Strix GL703VD-DB74 i7-7700HQ, GeForce GTX 1050 Mobile, SanDisk SD8SN8U256G1002, IPS, 1920x1080, 17.3" | Acer Predator Helios 300 i7-7700HQ, GeForce GTX 1060 Mobile, Intel SSD 600p SSDPEKKW512G7, AH-IPS, WLED, 1920x1080, 17.3" | Acer Aspire V17 Nitro BE VN7-793G-52XN i5-7300HQ, GeForce GTX 1060 Mobile, SK Hynix HFS256G39TND-N210A, a-Si TFT-LCD, WLED, 1920x1080, 17.3" | HP Omen 17-w206ng i7-7700HQ, GeForce GTX 1050 Ti Mobile, Samsung PM961 MZVLW256HEHP, IPS, 1920x1080, 17.3" | MSI GL72 7RDX-602 i7-7700HQ, GeForce GTX 1050 Mobile, HGST Travelstar 7K1000 HTS721010A9E630, TN LED, 1920x1080, 17.3" | MSI GS73VR 7RF i7-7700HQ, GeForce GTX 1060 Mobile, Samsung SM961 MZVKW512HMJP m.2 PCI-e, IPS, 3840x2160, 17.3" | Acer Aspire V17 Nitro BE VN7-793-738J i7-7700HQ, GeForce GTX 1060 Mobile, Intel SSD 600p SSDPEKKW512G7, IPS, 3840x2160, 17.3" | |
|---|---|---|---|---|---|---|---|
| Power Consumption | -24% | -16% | -42% | -30% | -66% | -52% | |
| Idle Minimum * (Watt) | 5.8 | 7 -21% | 7.8 -34% | 11 -90% | 9.6 -66% | 14.2 -145% | 10.5 -81% |
| Idle Average * (Watt) | 11.6 | 13 -12% | 13.3 -15% | 18 -55% | 15 -29% | 23.5 -103% | 20.5 -77% |
| Idle Maximum * (Watt) | 12.3 | 20 -63% | 16.6 -35% | 24 -95% | 16.5 -34% | 23.8 -93% | 22 -79% |
| Load Average * (Watt) | 82.4 | 81 2% | 73 11% | 84 -2% | 104 -26% | 90.9 -10% | 91 -10% |
| Witcher 3 ultra * (Watt) | 97 | 127 -31% | 118 -22% | 101 -4% | 116 -20% | ||
| Load Maximum * (Watt) | 135.5 | 162 -20% | 140 -3% | 146 -8% | 129 5% | 171.6 -27% | 155 -14% |
* ... mindre är bättre
| Asus ROG Strix GL703VD-DB74 i7-7700HQ, GeForce GTX 1050 Mobile, 64 Wh | Acer Predator Helios 300 i7-7700HQ, GeForce GTX 1060 Mobile, 48 Wh | Acer Aspire V17 Nitro BE VN7-793G-52XN i5-7300HQ, GeForce GTX 1060 Mobile, 69 Wh | HP Omen 17-w206ng i7-7700HQ, GeForce GTX 1050 Ti Mobile, 62 Wh | MSI GL72 7RDX-602 i7-7700HQ, GeForce GTX 1050 Mobile, 43.2 Wh | MSI GS73VR 7RF i7-7700HQ, GeForce GTX 1060 Mobile, 65 Wh | |
|---|---|---|---|---|---|---|
| Batteridrifttid | -28% | 15% | 7% | -51% | -50% | |
| Reader / Idle (h) | 13.4 | 10.2 -24% | 10.3 -23% | 13.3 -1% | 5.5 -59% | 5 -63% |
| WiFi v1.3 (h) | 7.2 | 4.7 -35% | 6.2 -14% | 6.3 -12% | 3.4 -53% | 2.7 -62% |
| Load (h) | 1.2 | 0.9 -25% | 2.2 83% | 1.6 33% | 0.7 -42% | 0.9 -25% |
För
Emot
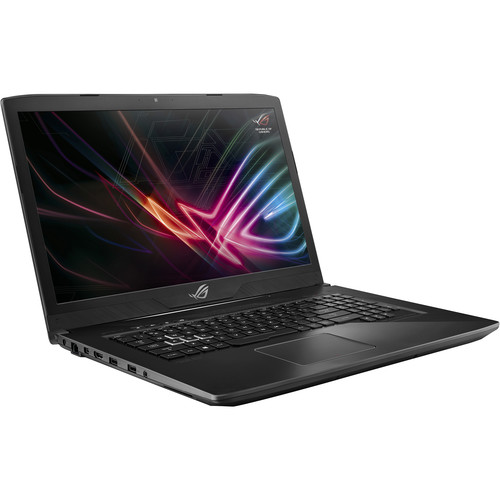

Vi lämnades med blandade känslor: å ena sidan är Asus ROG Strix GL703VD en välbyggd och extremt tunn 17-tums spellaptop med bra prestanda, hyfsad ergonomi och kommer dessutom med en väldigt ljusstark och dugligt exakt matt Full HD-skärm. Kombinationen av primär SSD och skiv-baserad enhet för lagring förbättrar den upplevda prestandan och datorn tävlar med en del Ultrabook-modeller när det kommer till batteritid.
Det finns några betydande nackdelar också: för en dator med en instegs-GPU, mer eller mindre, så är GL703VD helt enkelt för högljudd och blir dessutom alldeles för varm - åtminstone under extrem belastning, för yttemperaturen kommer vara mycket svalare vid spelande. På ett maximum av 53 dB och med temperaturer som närmar sig 70 C kan laptopen bli lika högljudd och varm som en del spelmonster med skrivbords-CPU:er och grafikkort i topklass. Vid det här laget kan vi bara hoppas att Asus fräschar upp sitt kylsystem för de kommande SCAR och Hero-modellerna med kraftigare GTX 1060-grafik.
Som det ser ut nu ser vi ingen lockande anledning att välja Strix GL703VD framför många av dom andra tillgängliga bärbara speldatorerna med GTX 1050.
Användare som söker en portabel, tunn och lätt 17.3-tums laptop med högre prestanda kan vilja överväga Strix GL702-serien istället. Även när den är utrustad med en GTX 1070 förblir GL702 påtagligt svalare och blir inte så högljudd. En version med GeForce GTX 1070, i7-7700HQ, 12GB RAM och 128GB SSD + 1TB HDD säljs för bara ~1 700 SEK ($200) mer än vår recenserade modell i skrivande stund.
Asus ROG Strix GL703VD-DB74
- 10/31/2017 v6 (old)
Bernie Pechlaner
Price comparison
