MSI Crosshair 15 Rainbow Six Extraction Edition recension: Kapabel QHD 165 Hz midranger bortom temat

Bärbara datorer med speltema är svåra att få tag på nuförtiden. Alienware firas lanseringen av Cyberpunk 2077 med en temadator m17 R3 förr i tiden, men det var mer ett skin för att piffa upp designen. Med Crosshair 15 har MSI designat den bärbara datorn från grunden för att ge Ubisofts Rainbow Six: Extraction-vibbar i alla aspekter av designen.
Grejen med bärbara datorer med spel-tema är att de endast tilltalar en nischad publik som investerat i just det spelet. Rainbow Six: Extraction fick blandade recensioner från kritiker och fans, så en bärbar dator med detta spel som tema kanske inte väcker allas intresse vid första anblicken.
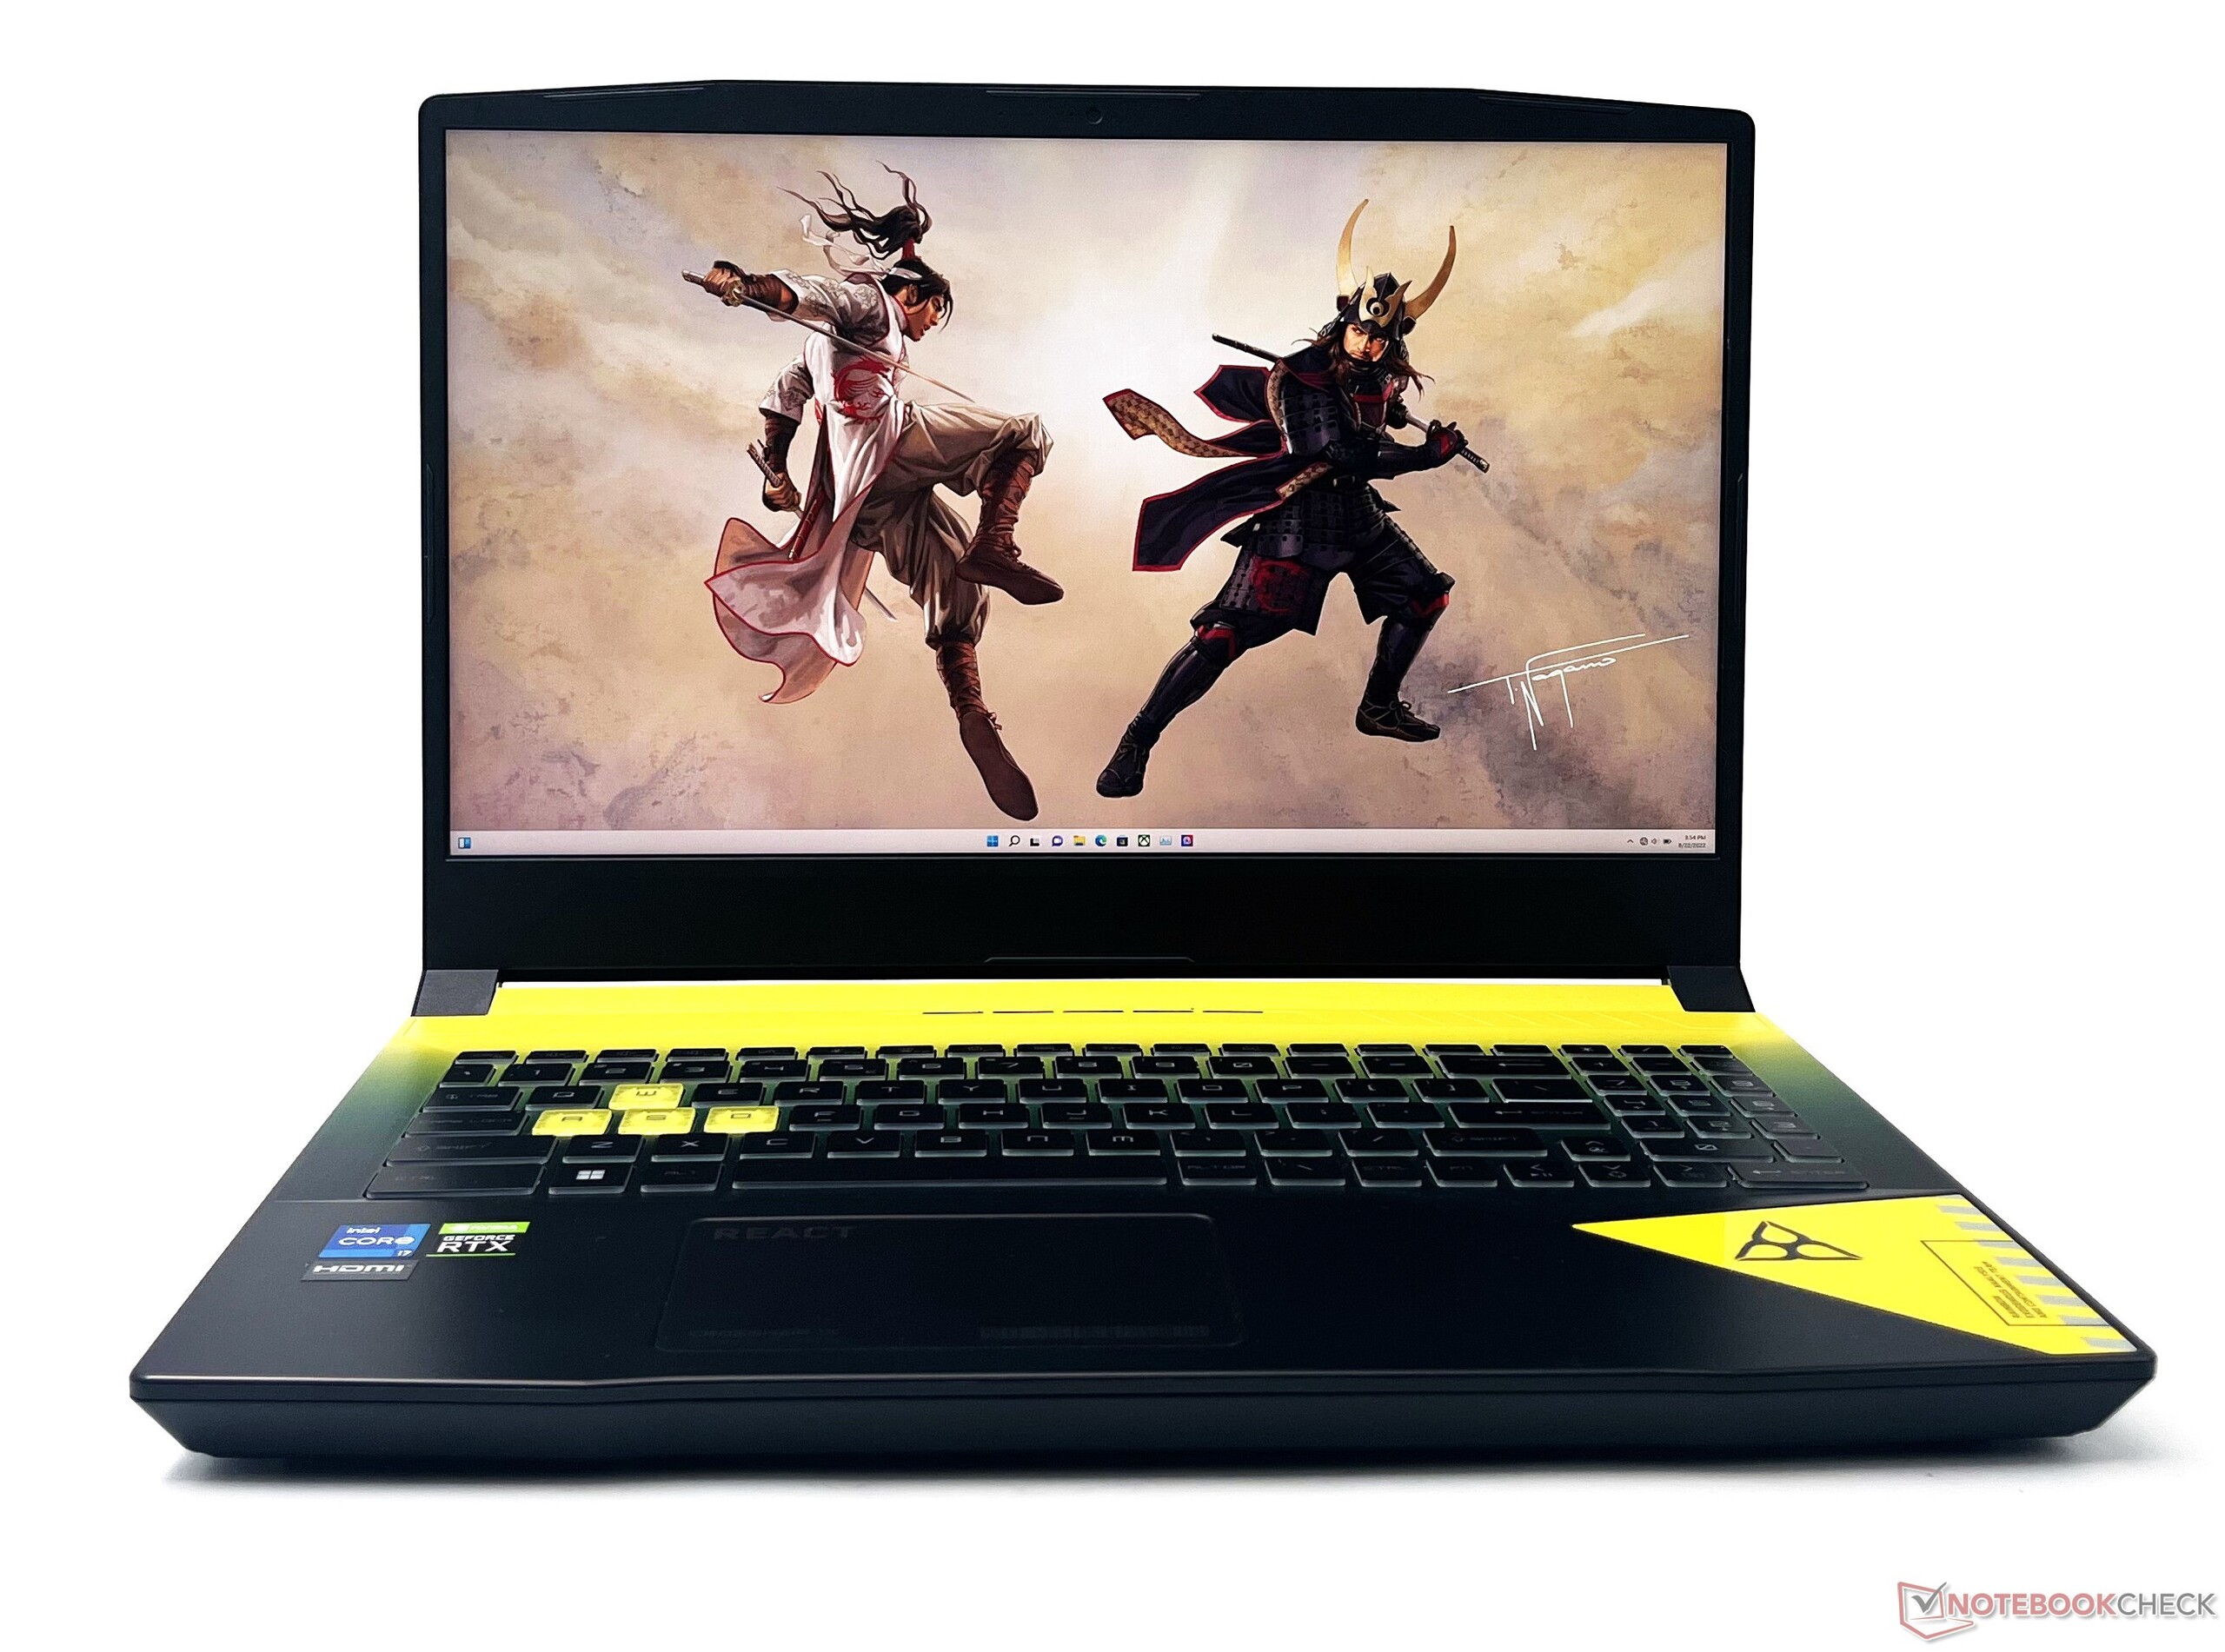
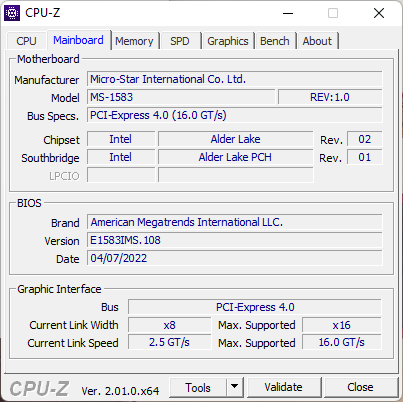
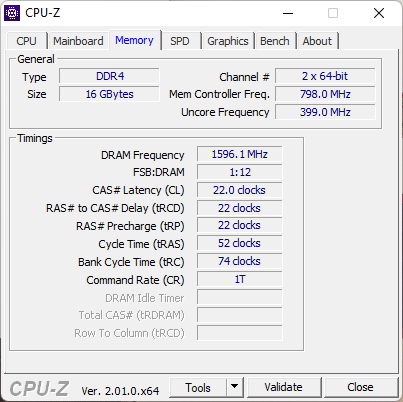
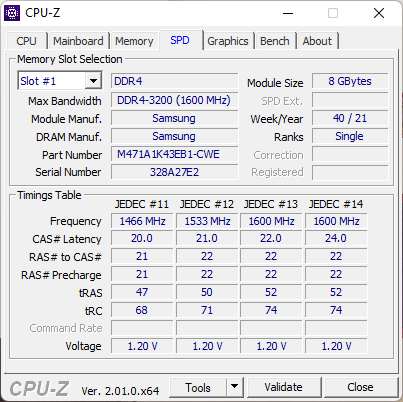
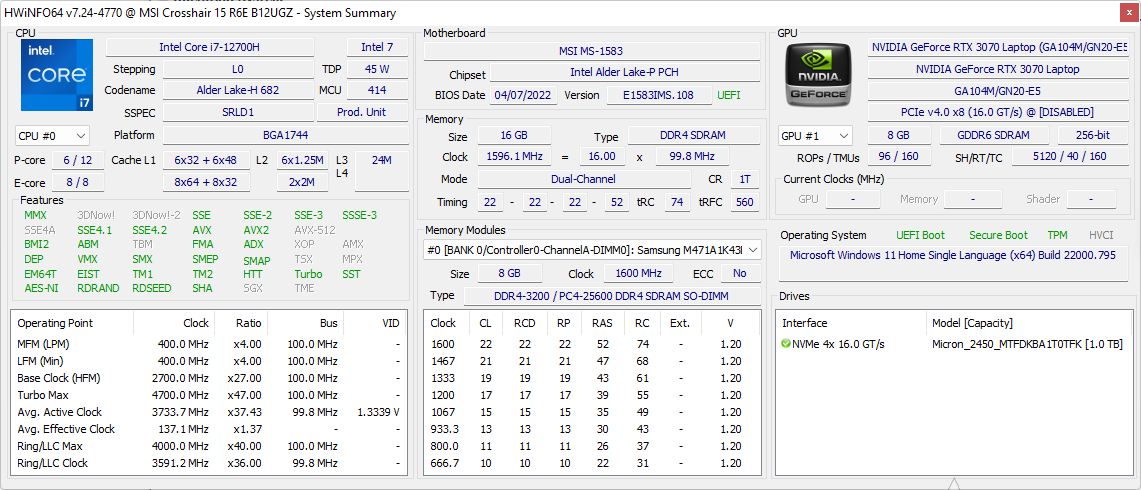
Om vi går bortom temat finner vi dock att MSI har mycket att erbjuda i paketet. Vår MSI Crosshair 15 Rainbow Six: Extraction Edition (R6E) var utrustad med en Intel Core i7-12700H processor, Nvidia GeForce RTX 3070 GPU för bärbar dator, 16 GB DDR4-3200 RAM, en 1 TB NVMe SSD och en 165 Hz QHD-skärm
Kombinationen av en Alder Lake-H CPU och RTX 3070 Laptop GPU är inte ofta förekommande med tanke på att Nvidia har ersatt denna GPU med den RTX 3070 Ti GPU för bärbar dator. Denna Crosshair 15-konfiguration kostar dock 1 90 990 euro (2 312 dollar) i Indien.
I den här recensionen utvärderar vi MSI Crosshair 15 Rainbow Six: Extraction Edition och ser hur den klarar sig mot konkurrenterna som en bärbar dator för spel i övre mellanklassen.
Potentiella konkurrenter i jämförelse
Gradering | Datum | Modell | Vikt | Höjd | Storlek | Upplösning | Pris |
|---|---|---|---|---|---|---|---|
| 85.8 % v7 (old) | 12/2022 | MSI Crosshair 15 R6E B12UGZ-050 i7-12700H, GeForce RTX 3070 Laptop GPU | 2.5 kg | 26.9 mm | 15.60" | 2560x1440 | |
| 84.5 % v7 (old) | 02/2022 | MSI Stealth GS66 12UGS i7-12700H, GeForce RTX 3070 Ti Laptop GPU | 2.2 kg | 19.8 mm | 15.60" | 2560x1440 | |
| 88 % v7 (old) | 03/2022 | Lenovo Legion 5 Pro 16 G7 i7 RTX 3070Ti i7-12700H, GeForce RTX 3070 Ti Laptop GPU | 2.6 kg | 26.6 mm | 16.00" | 2560x1600 | |
| 80.3 % v7 (old) | 06/2022 | MSI Katana GF66 12UGS i7-12700H, GeForce RTX 3070 Ti Laptop GPU | 2.3 kg | 27.5 mm | 15.60" | 1920x1080 | |
| 80.7 % v7 (old) | 04/2022 | MSI Pulse GL66 12UEK i9-12900H, GeForce RTX 3060 Laptop GPU | 2.3 kg | 25 mm | 15.60" | 1920x1080 | |
| 84 % v7 (old) | 06/2022 | Acer Nitro 5 AN515-58-72QR i7-12700H, GeForce RTX 3070 Ti Laptop GPU | 2.5 kg | 26.8 mm | 15.60" | 2560x1440 | |
| 85.5 % v7 (old) | 12/2022 | Aorus 15 XE5 i7-12700H, GeForce RTX 3070 Ti Laptop GPU | 2.3 kg | 24 mm | 15.60" | 2560x1440 | |
| 88.4 % v7 (old) | 07/2022 | Schenker XMG Neo 15 (i7-12700H, RTX 3080 Ti) i7-12700H, GeForce RTX 3080 Ti Laptop GPU | 2.3 kg | 26.6 mm | 15.60" | 2560x1440 | |
| 85.8 % v7 (old) | 07/2022 | Asus TUF Dash F15 FX517ZR i7-12650H, GeForce RTX 3070 Laptop GPU | 2 kg | 20.7 mm | 15.60" | 2560x1440 | |
| 88 % v7 (old) | 11/2022 | Schenker XMG Neo 15 (Ryzen 9 6900HX, RTX 3070 Ti) R9 6900HX, GeForce RTX 3070 Ti Laptop GPU | 2.3 kg | 26.6 mm | 15.60" | 2560x1440 |
Fall: Pulse GL66 målad i Rainbow Six: Extraction färger
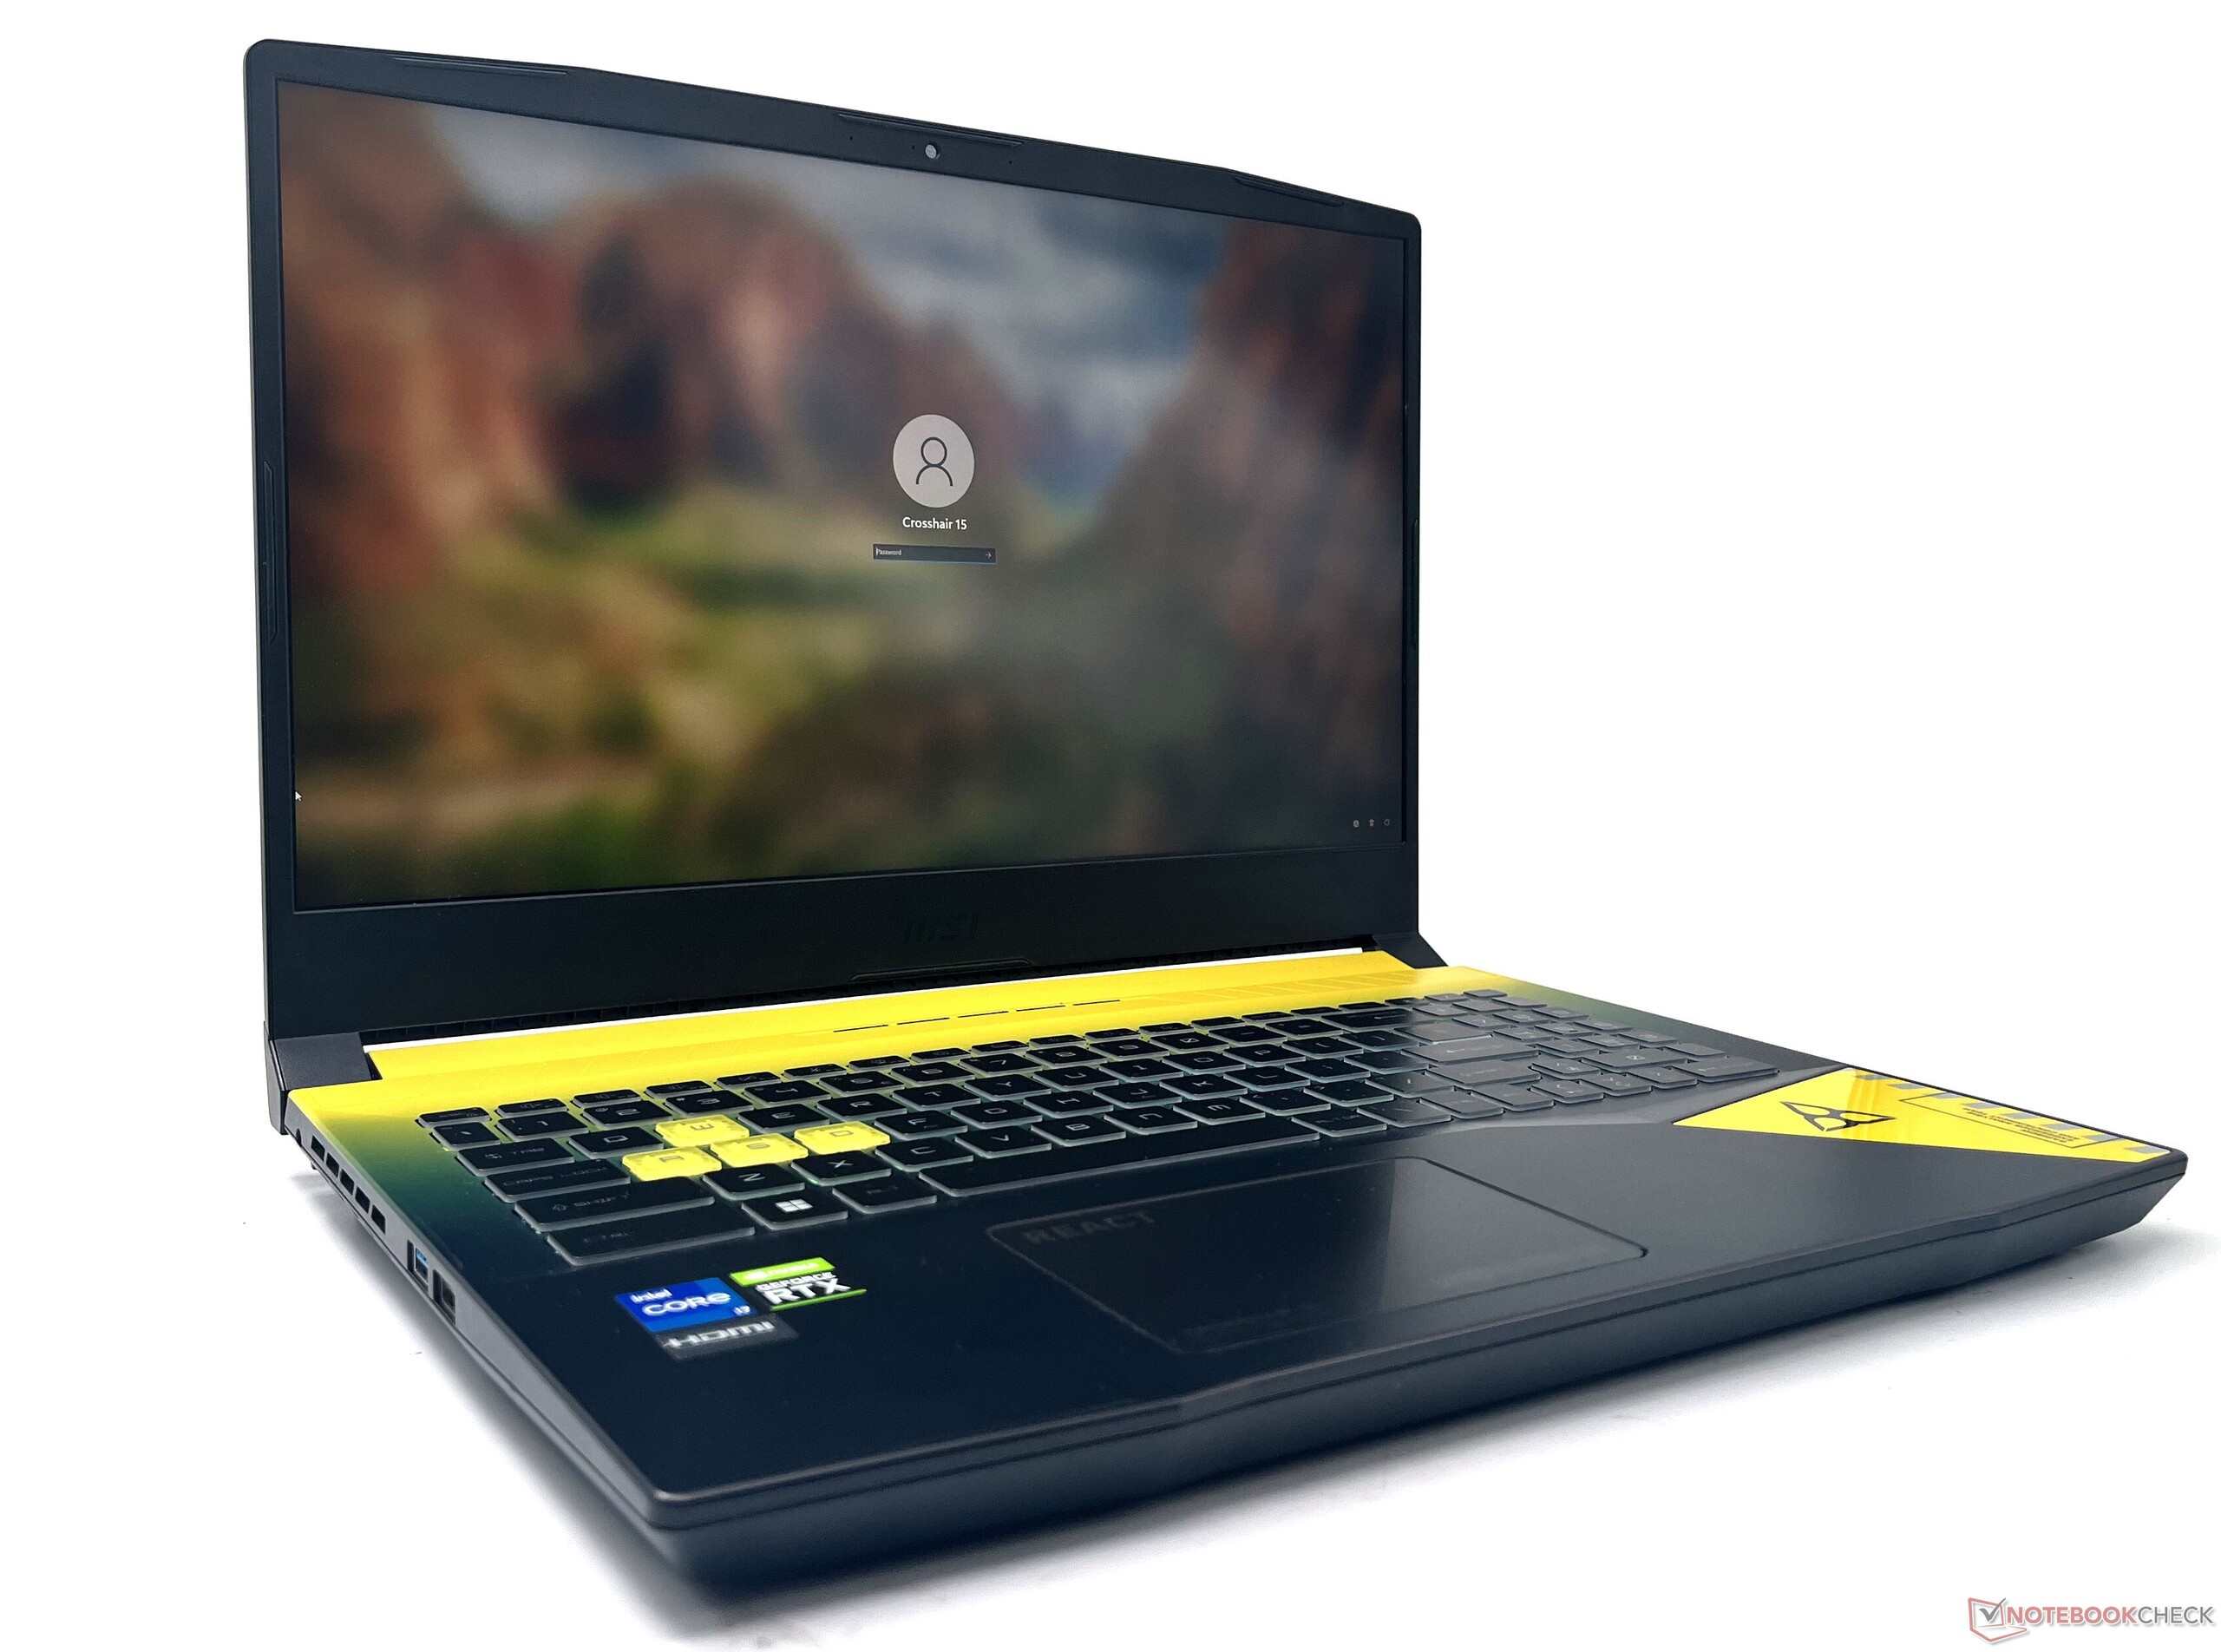
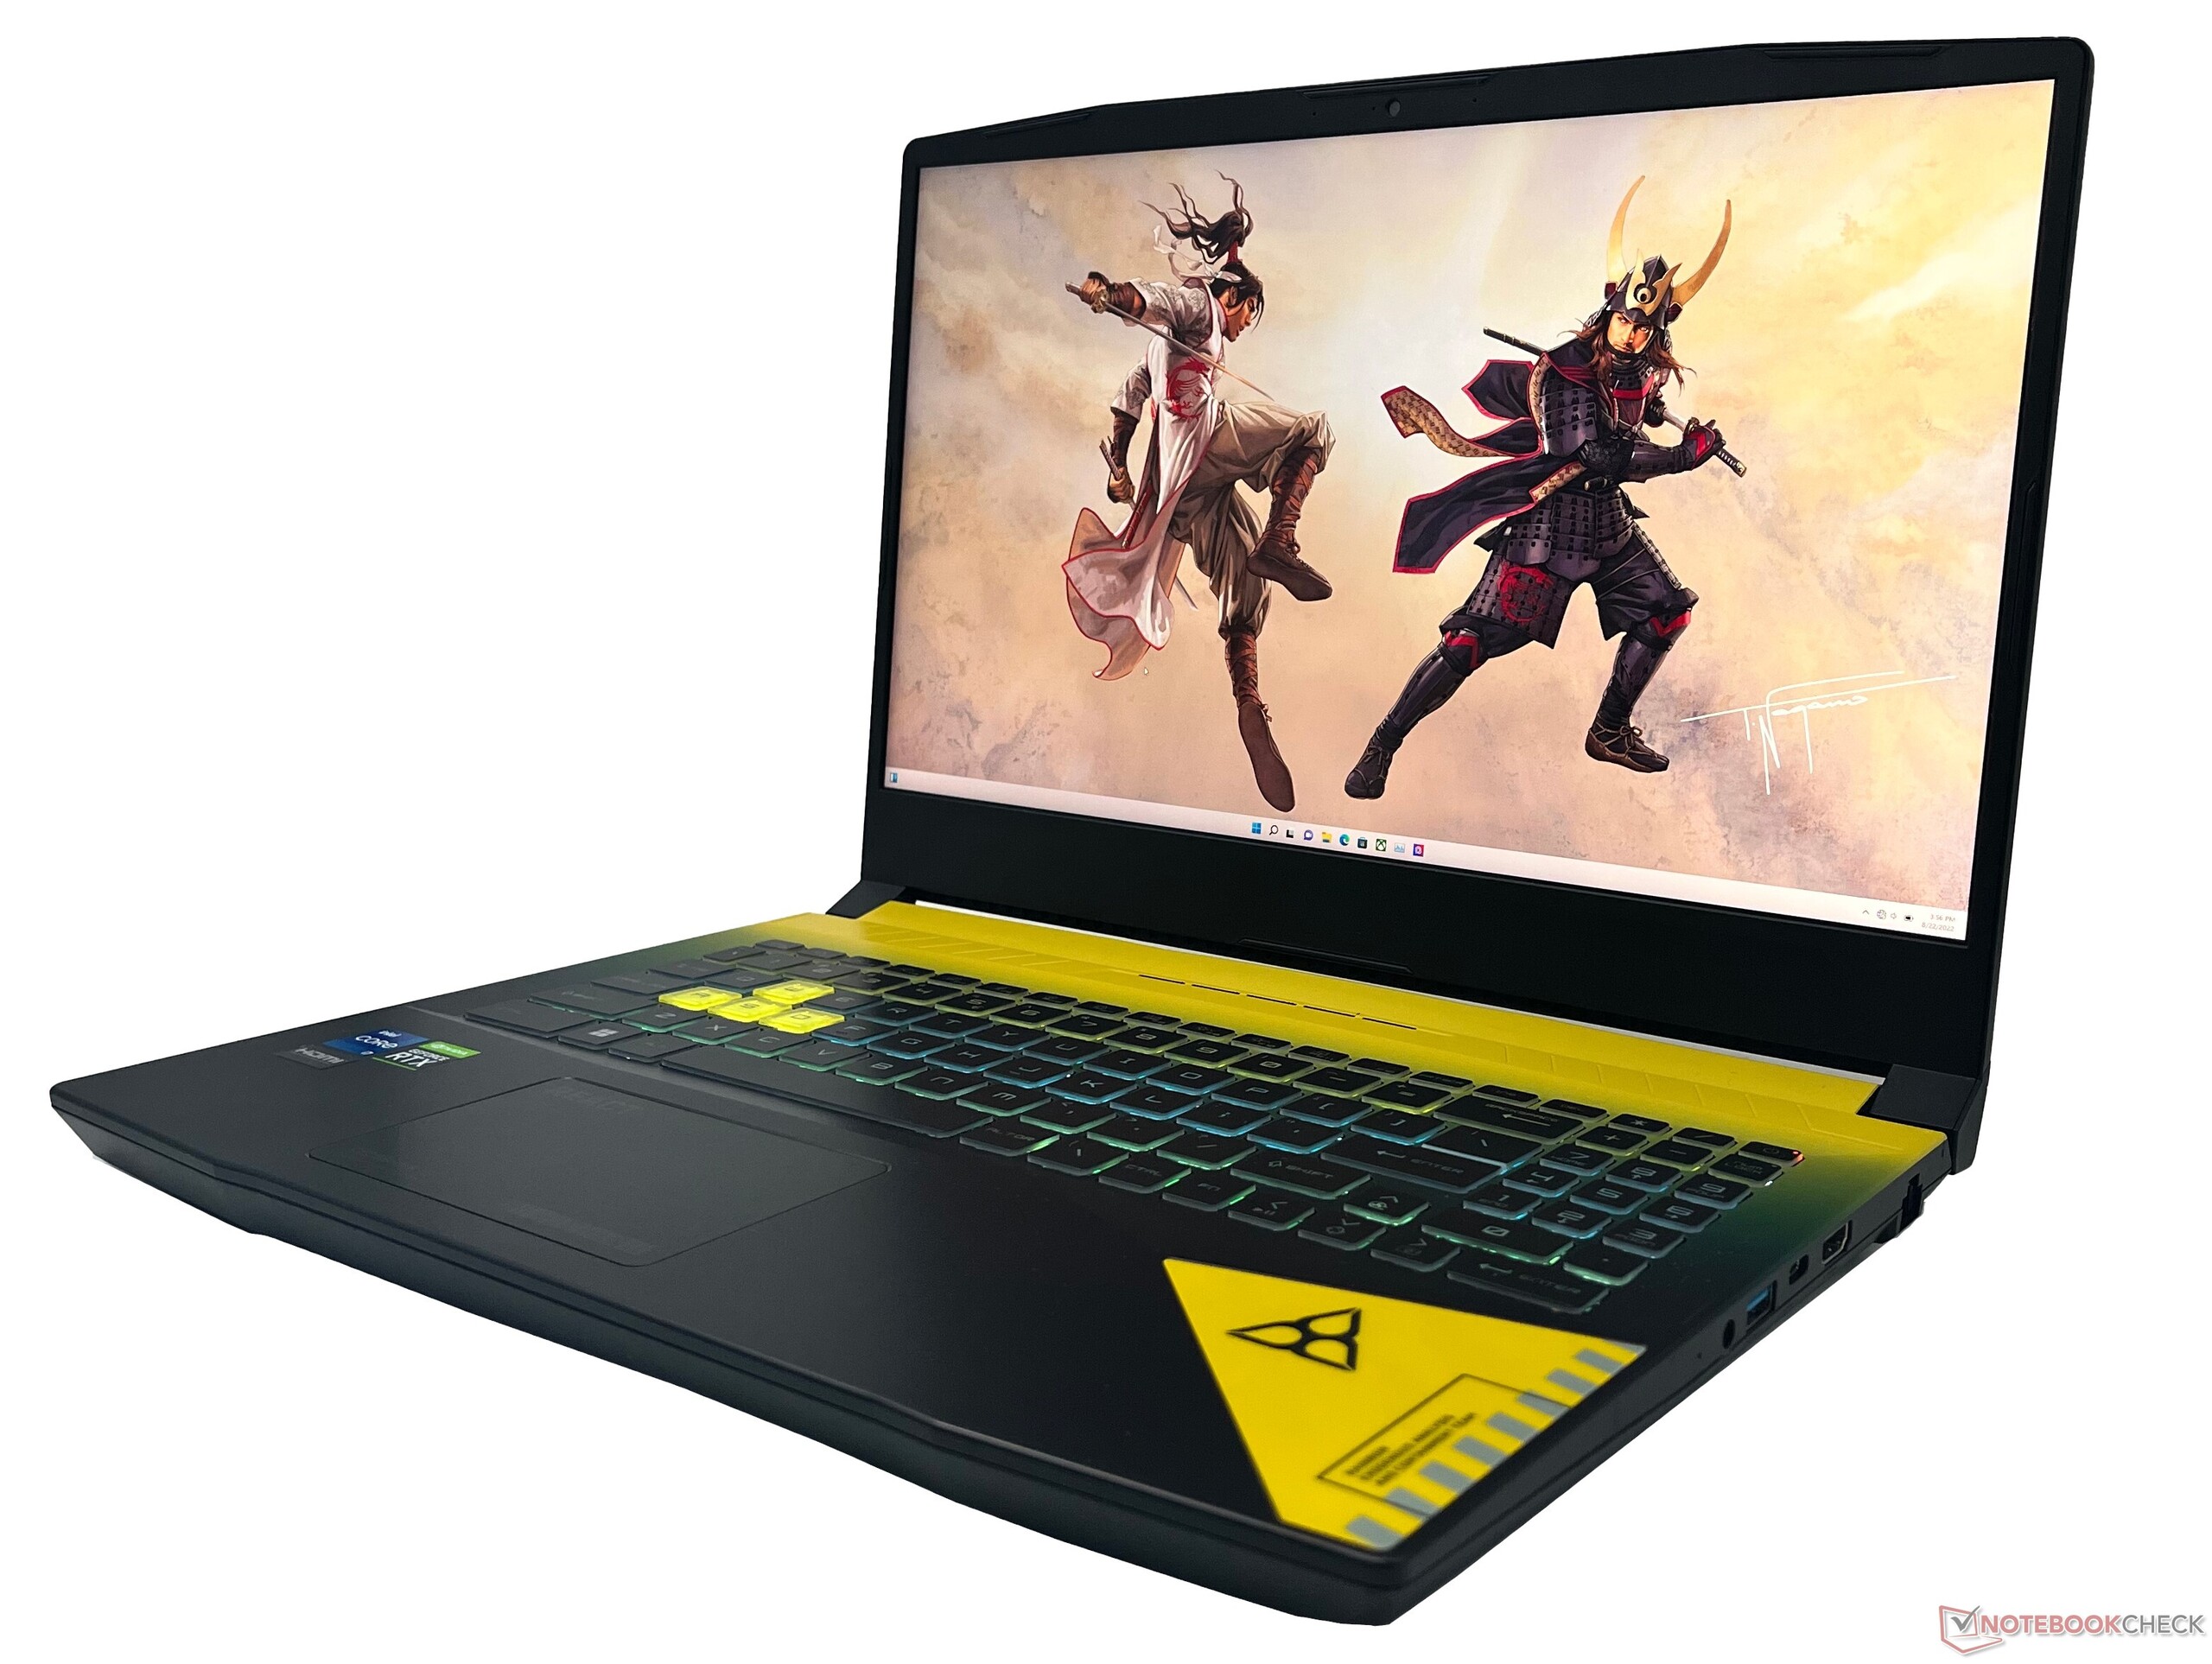
MSI Crosshair 15 R6E:s chassi är huvudsakligen tillverkat av plast. Bygget utstrålar inte riktigt någon premiumkänsla men känns robust nog för daglig användning. Det finns märkbar flex i tangentbordsdäcket, men det hindrade inte regelbunden användning.
Crosshair 15 R6E använder sig i stor utsträckning av en gul-svart tvåfärgad färgskala och spelets REACT-designelement ända från förpackningen till chassit, vilket visar att det är Rainbow Six: Extraction.
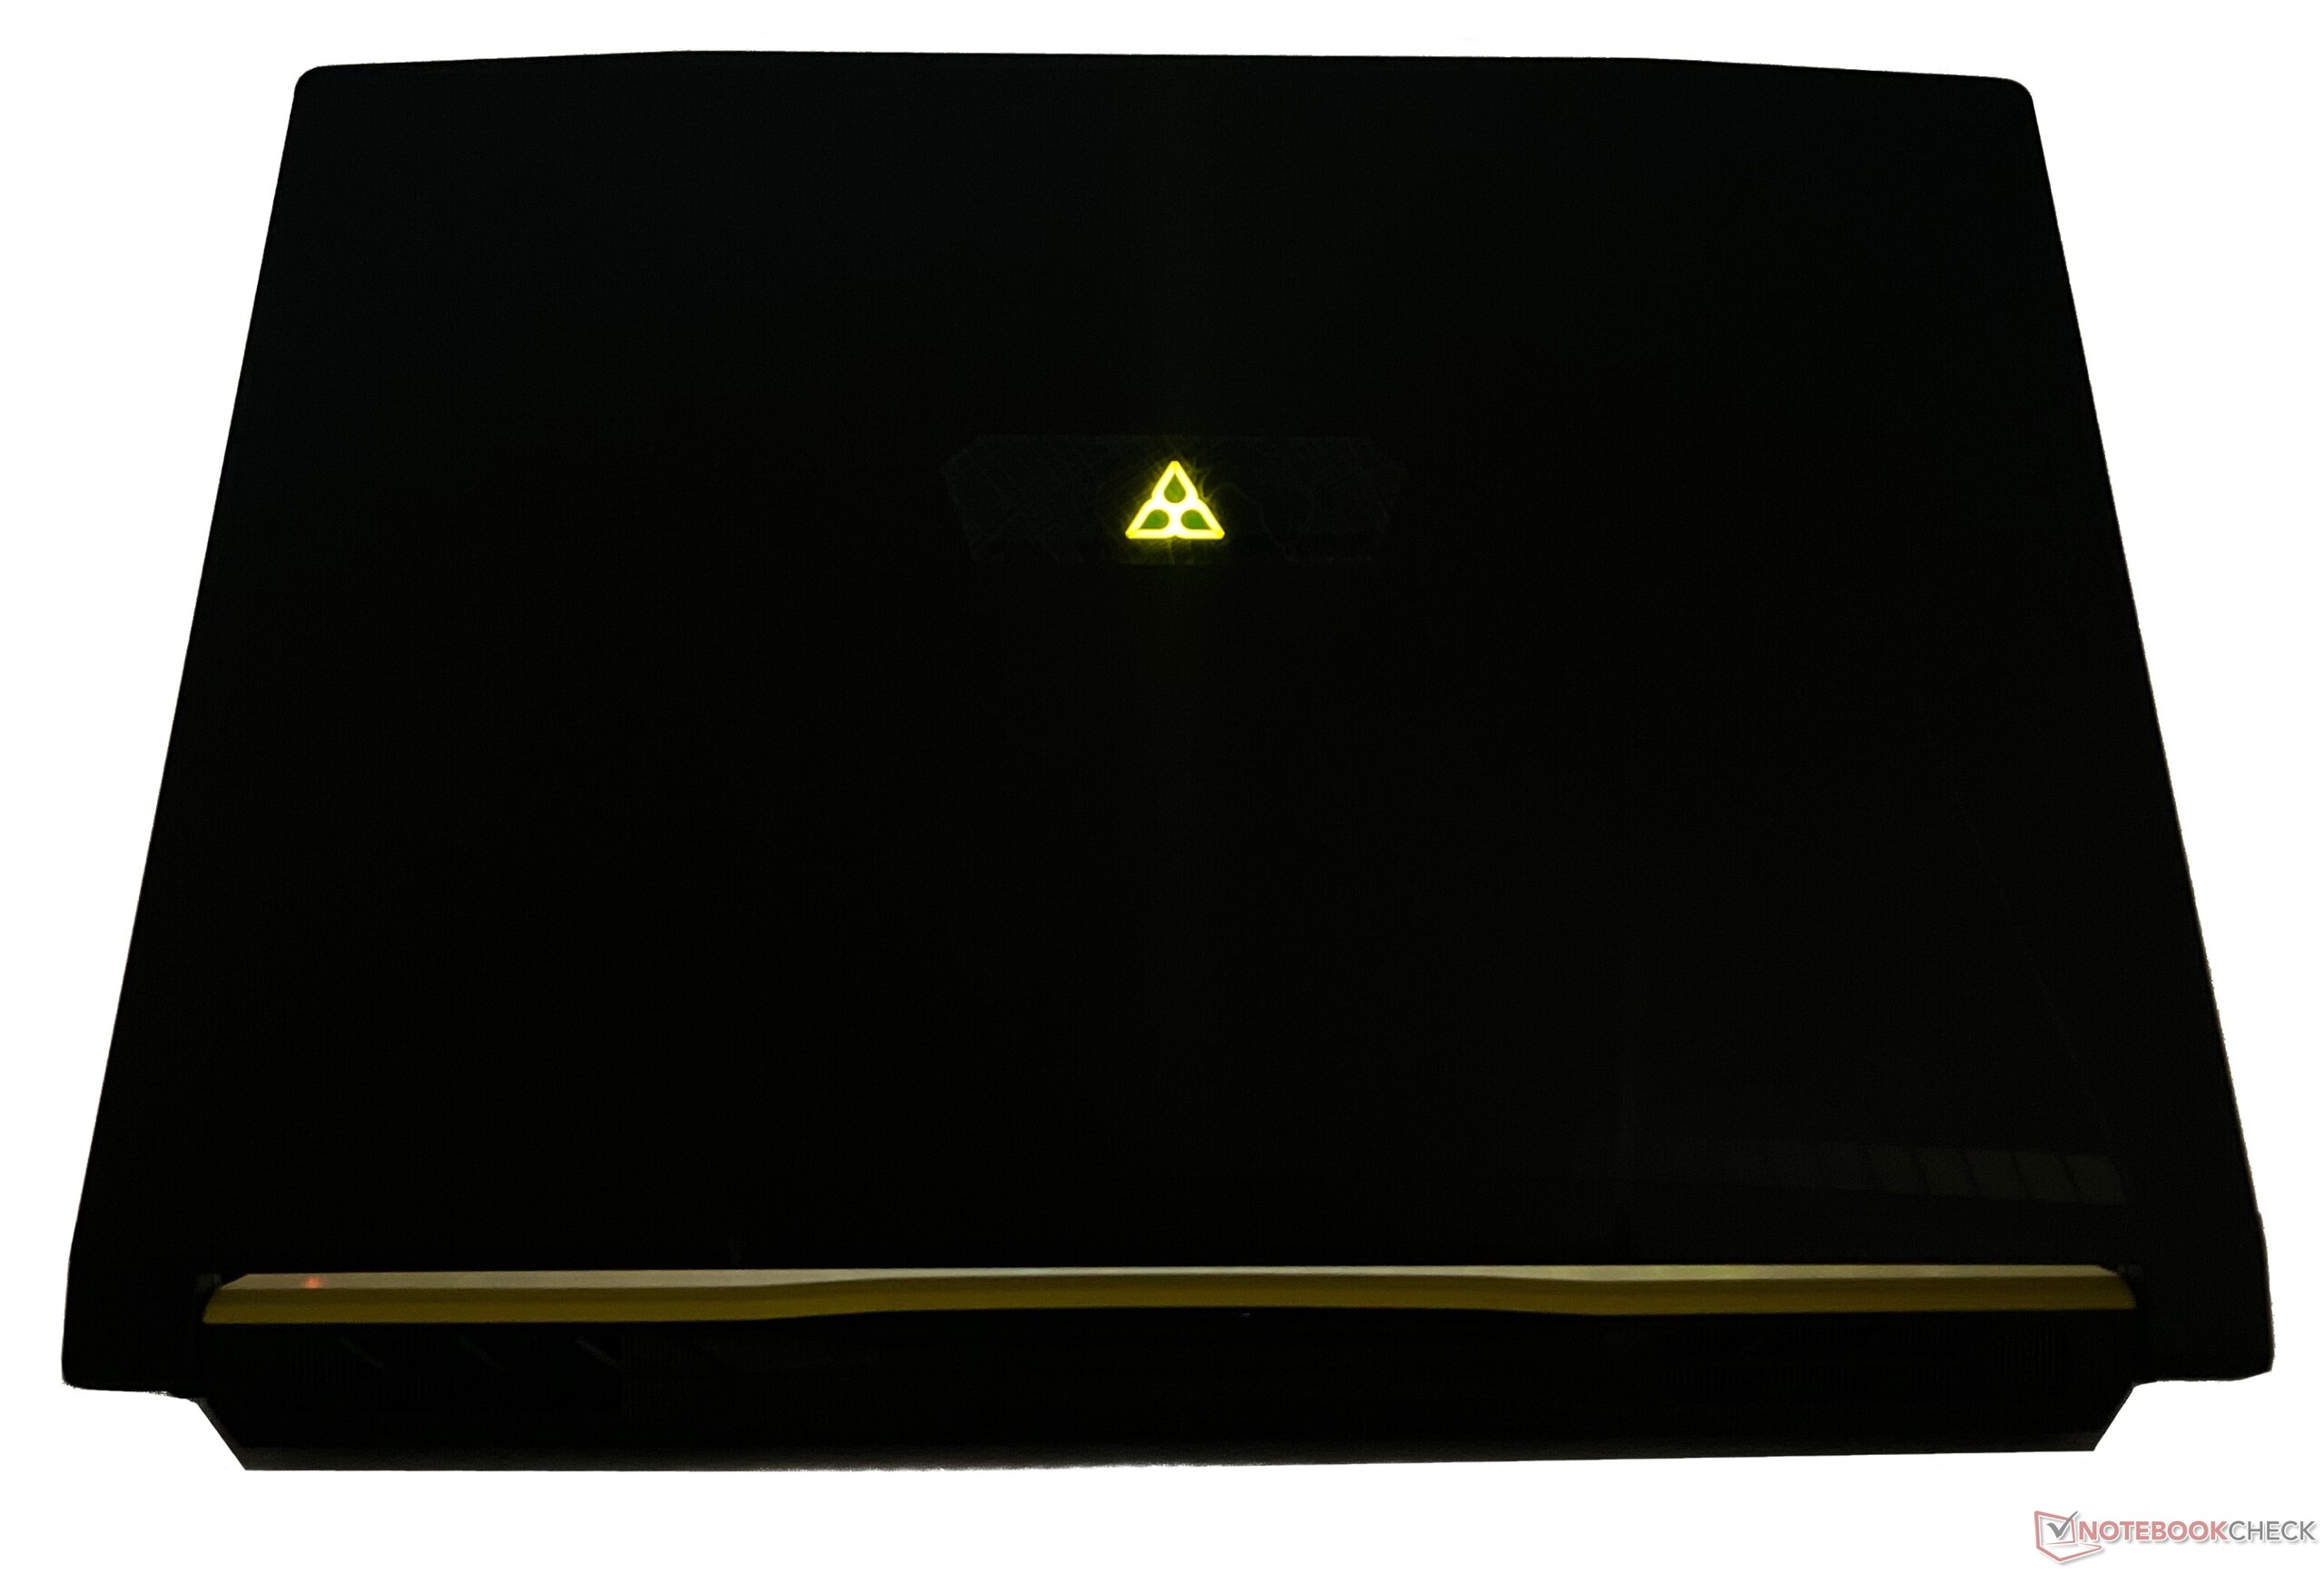
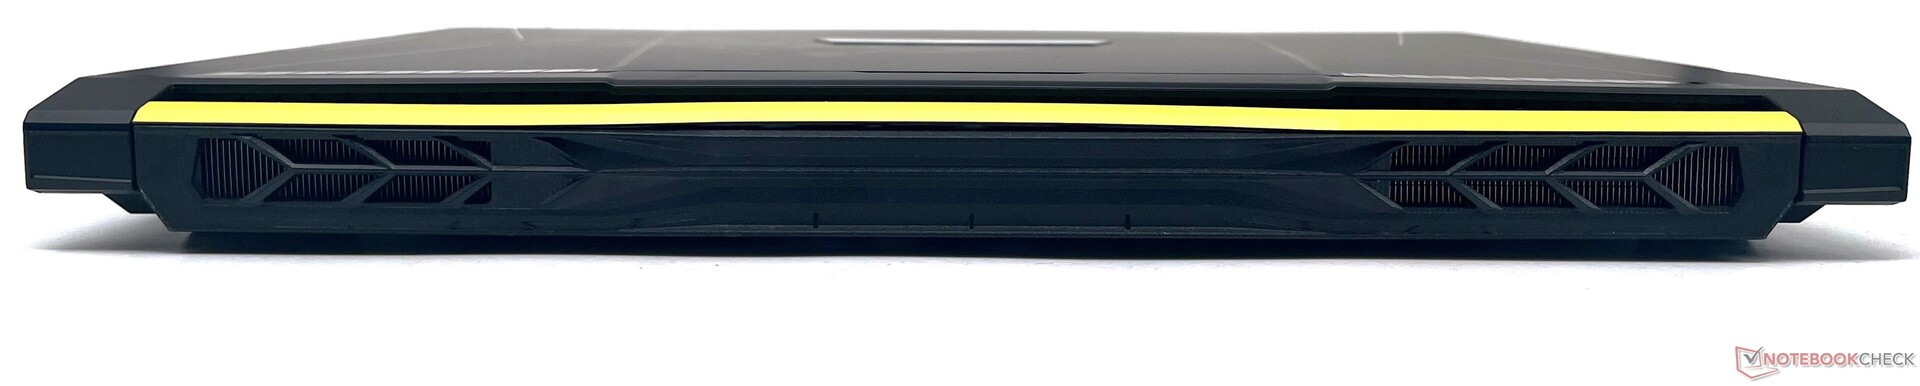
Följaktligen har MSI till och med ersatt sin logotyp med spelets logotyp på baksidan av skärmen. Rainbow Six: Extraction-logotypen är inte alltför stor men tillräckligt iögonfallande och lyser i starkt gult. Det finns inga RGB-belysningsmönster, så du får nöja dig med det färgschema som erbjuds.
Med en tjocklek på 26,9 mm är det inte den tunnaste bärbara datorn i sin klass - den äran går till MSI Stealth GS66 och Razer Blade 15. Ändå är den bärbar nog för att kunna stoppas i en ryggsäck och vikten på 2,5 kg känns inte heller alltför tung.
På det hela taget är MSI Crosshair 15 Rainbow Six: Extraction Edition's chassi är hyfsat byggt för priset och framstår i huvudsak som en upprepning av den Pulse GL66, och på många sätt är Katana GF66, med ett nytt lager färg.
Anslutningsmöjligheter: Täcker bara det nödvändigaste
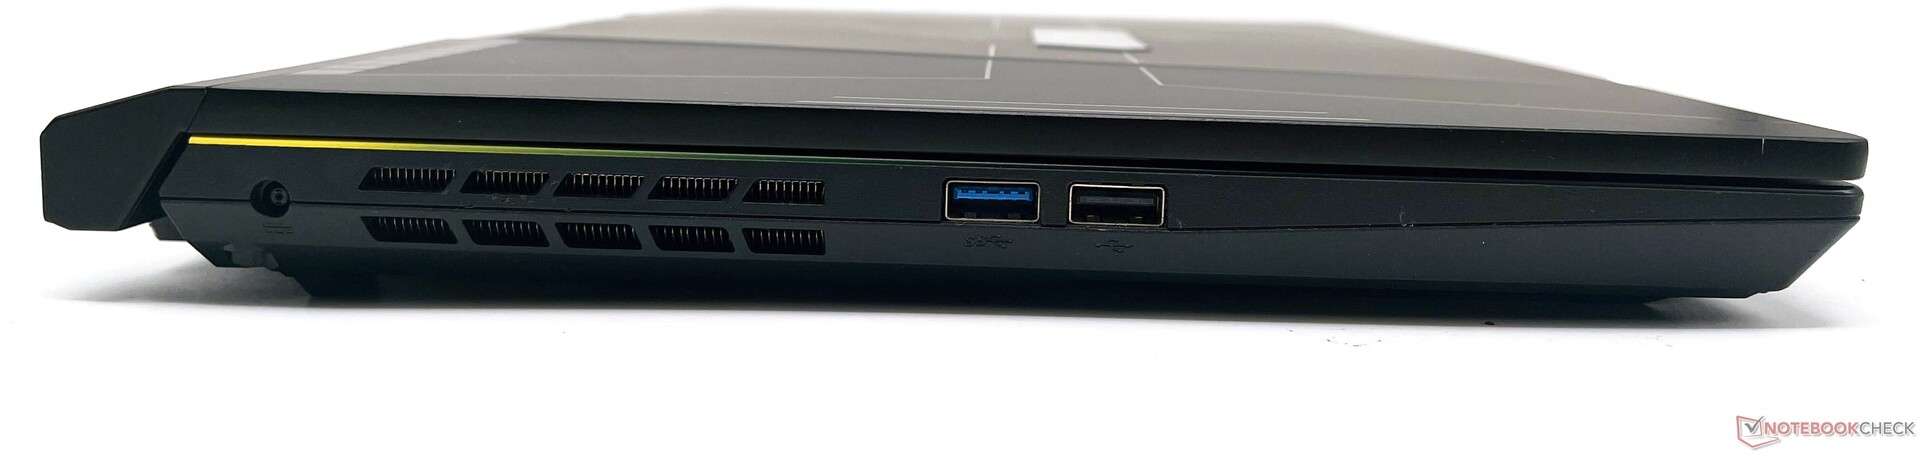
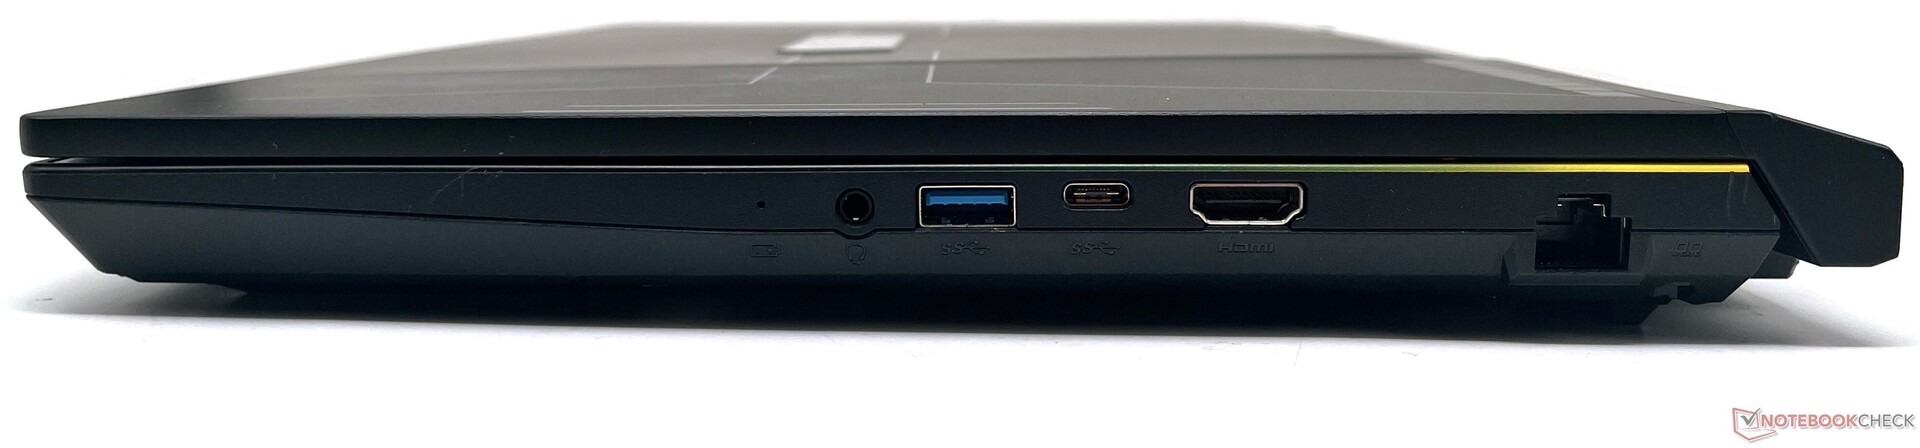
Crosshair 15 R6E har inget omfattande portval, men det viktigaste är täckt. Till vänster har vi USB 3.2 Gen1 Type-A-portar och USB 2.0 Type-A-portar. Till höger har vi ett 3,5 mm kombinationsljuduttag, ytterligare en USB 3.2 Gen1 Type-A-port, en USB 3.2 Gen1 Type-C-port, HDMI-utgång och Gigabit Ethernet
HDMI-porten stöder endast 4K 60 Hz-utgång. Det finns ingen kortläsare, Thunderbolt 4 eller Kensington-låsspår tillgänglig.
Portplaceringen är inte riktigt idealisk, eftersom en majoritet av dem är placerade mot enhetens högra sida. Portarna på vänster sida skulle kunna behöva lite mer utrymme, med tanke på att en hel del utrymme förblir oanvänt. Med det sagt finns det inga hinder när man ansluter flera kringutrustning.
Kommunikation
Crosshair 15 R6E är utrustad med en Intel Wi-Fi 6 AX201 WLAN-modul med Bluetooth 5.2. Den bärbara datorn ligger längst ner i vår Wi-Fi-tabell med referensroutern Asus ROG Rapture GT-AXE11000.
Med det sagt är dess genomströmning fortfarande bättre än Pulse GL66. Mottagningshastigheterna är ganska stabila, men vi noterade dykningar under sändning.
| Networking / iperf3 transmit AXE11000 | |
| Schenker XMG Neo 15 (i7-12700H, RTX 3080 Ti) | |
| Acer Nitro 5 AN515-58-72QR | |
| Schenker XMG Neo 15 (Ryzen 9 6900HX, RTX 3070 Ti) | |
| MSI Katana GF66 12UGS | |
| Asus TUF Dash F15 FX517ZR | |
| Genomsnitt Intel Wi-Fi 6 AX201 (438 - 1715, n=74) | |
| Genomsnitt av klass Gaming (560 - 1862, n=88, senaste 2 åren) | |
| MSI Crosshair 15 R6E B12UGZ-050 | |
| Networking / iperf3 receive AXE11000 | |
| Acer Nitro 5 AN515-58-72QR | |
| MSI Katana GF66 12UGS | |
| Schenker XMG Neo 15 (i7-12700H, RTX 3080 Ti) | |
| Asus TUF Dash F15 FX517ZR | |
| MSI Stealth GS66 12UGS | |
| Schenker XMG Neo 15 (Ryzen 9 6900HX, RTX 3070 Ti) | |
| Genomsnitt av klass Gaming (680 - 1745, n=88, senaste 2 åren) | |
| Genomsnitt Intel Wi-Fi 6 AX201 (390 - 1734, n=79) | |
| MSI Crosshair 15 R6E B12UGZ-050 | |
| Networking / iperf3 transmit AX12 | |
| Lenovo Legion 5 Pro 16 G7 i7 RTX 3070Ti | |
| Genomsnitt Intel Wi-Fi 6 AX201 (49.8 - 1775, n=324) | |
| MSI Pulse GL66 12UEK | |
| Networking / iperf3 receive AX12 | |
| Lenovo Legion 5 Pro 16 G7 i7 RTX 3070Ti | |
| Genomsnitt Intel Wi-Fi 6 AX201 (136 - 1743, n=324) | |
| MSI Pulse GL66 12UEK | |
Webbkamera
Webbkameran med 720p-upplösning är fullt användbar för enstaka videosamtal. Som framgår av våra ColorChecker Passport- och testdiagrambilder nedan visar Crosshair 15:s webbkamera mycket brus och en allmän brist på skärpa.
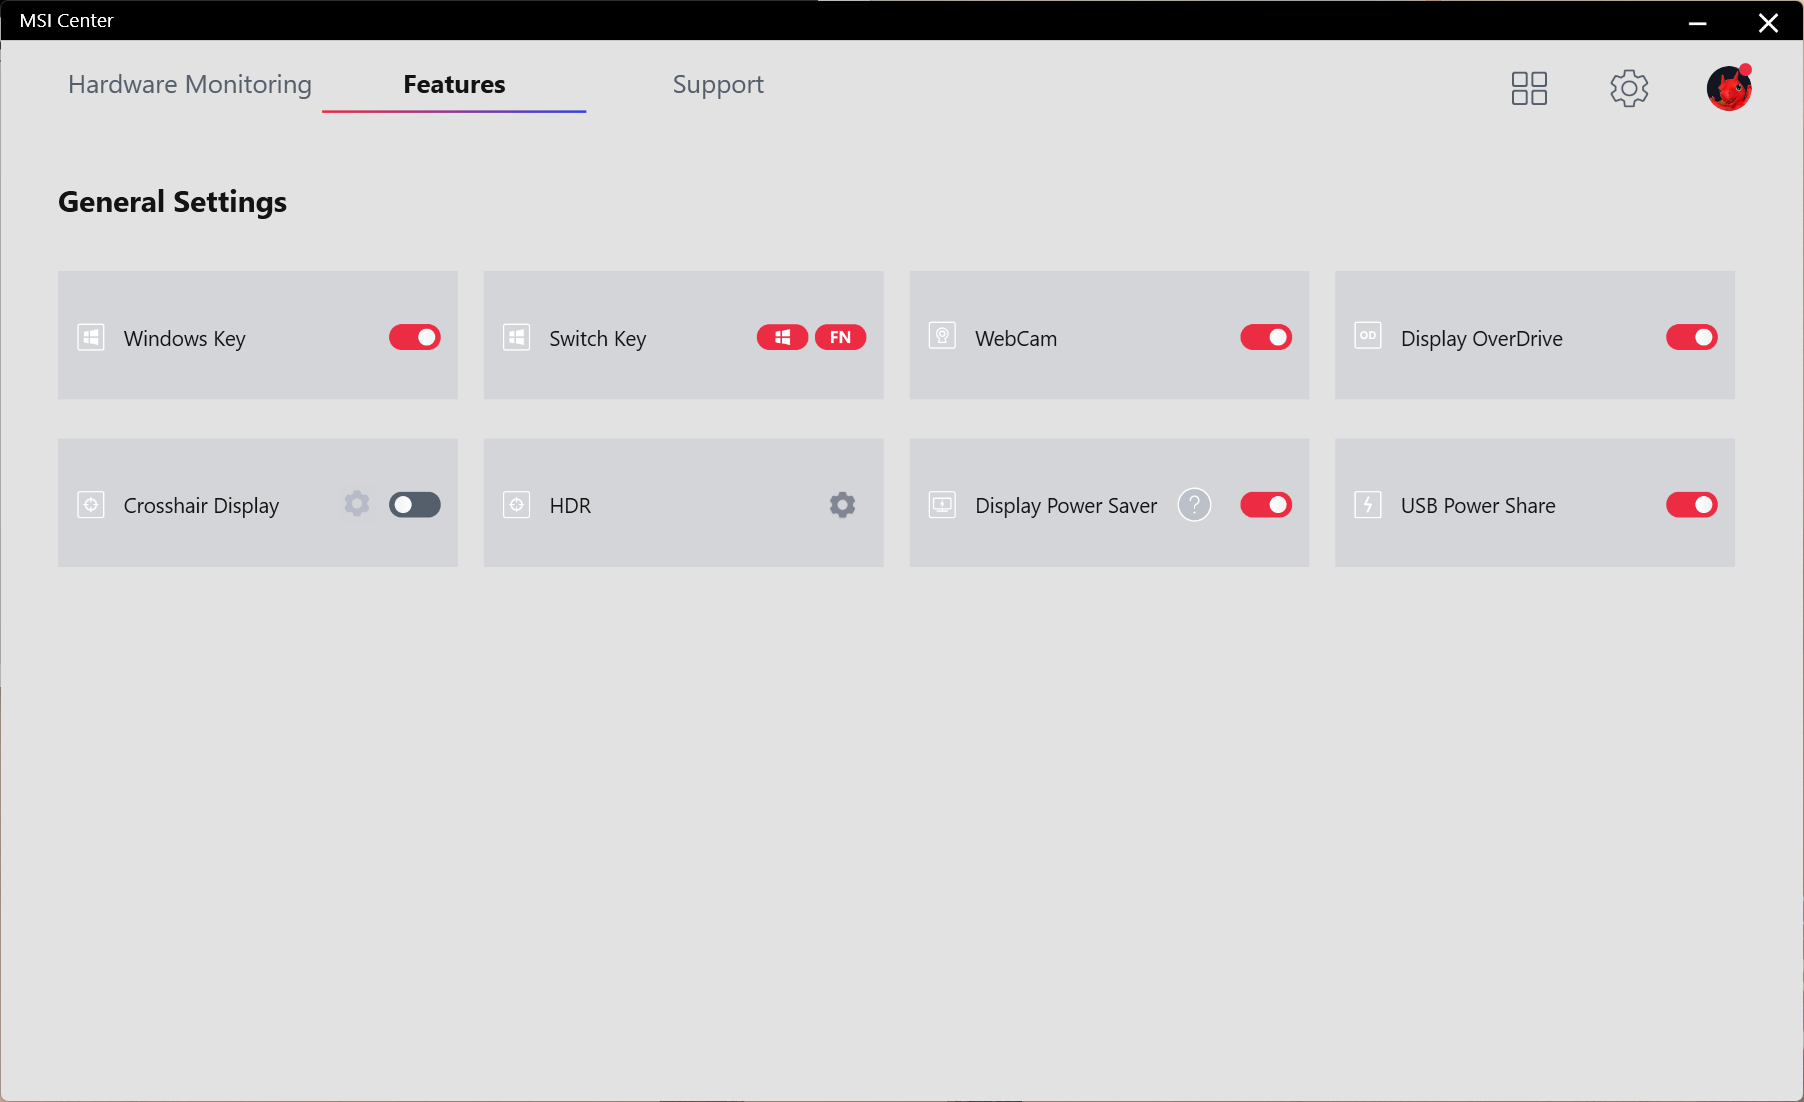
Det finns ingen fysisk sekretessbrytare tillgänglig, men det är möjligt att aktivera eller inaktivera webbkameran med hjälp av genvägen på funktionstangenten F6 eller via MSI Center.


Säkerhet
Det finns ingen biometrisk inloggning på Crosshair 15 R6E. Den enda större säkerhetskomponenten ombord är TPM 2.0-modulen.
Tillbehör
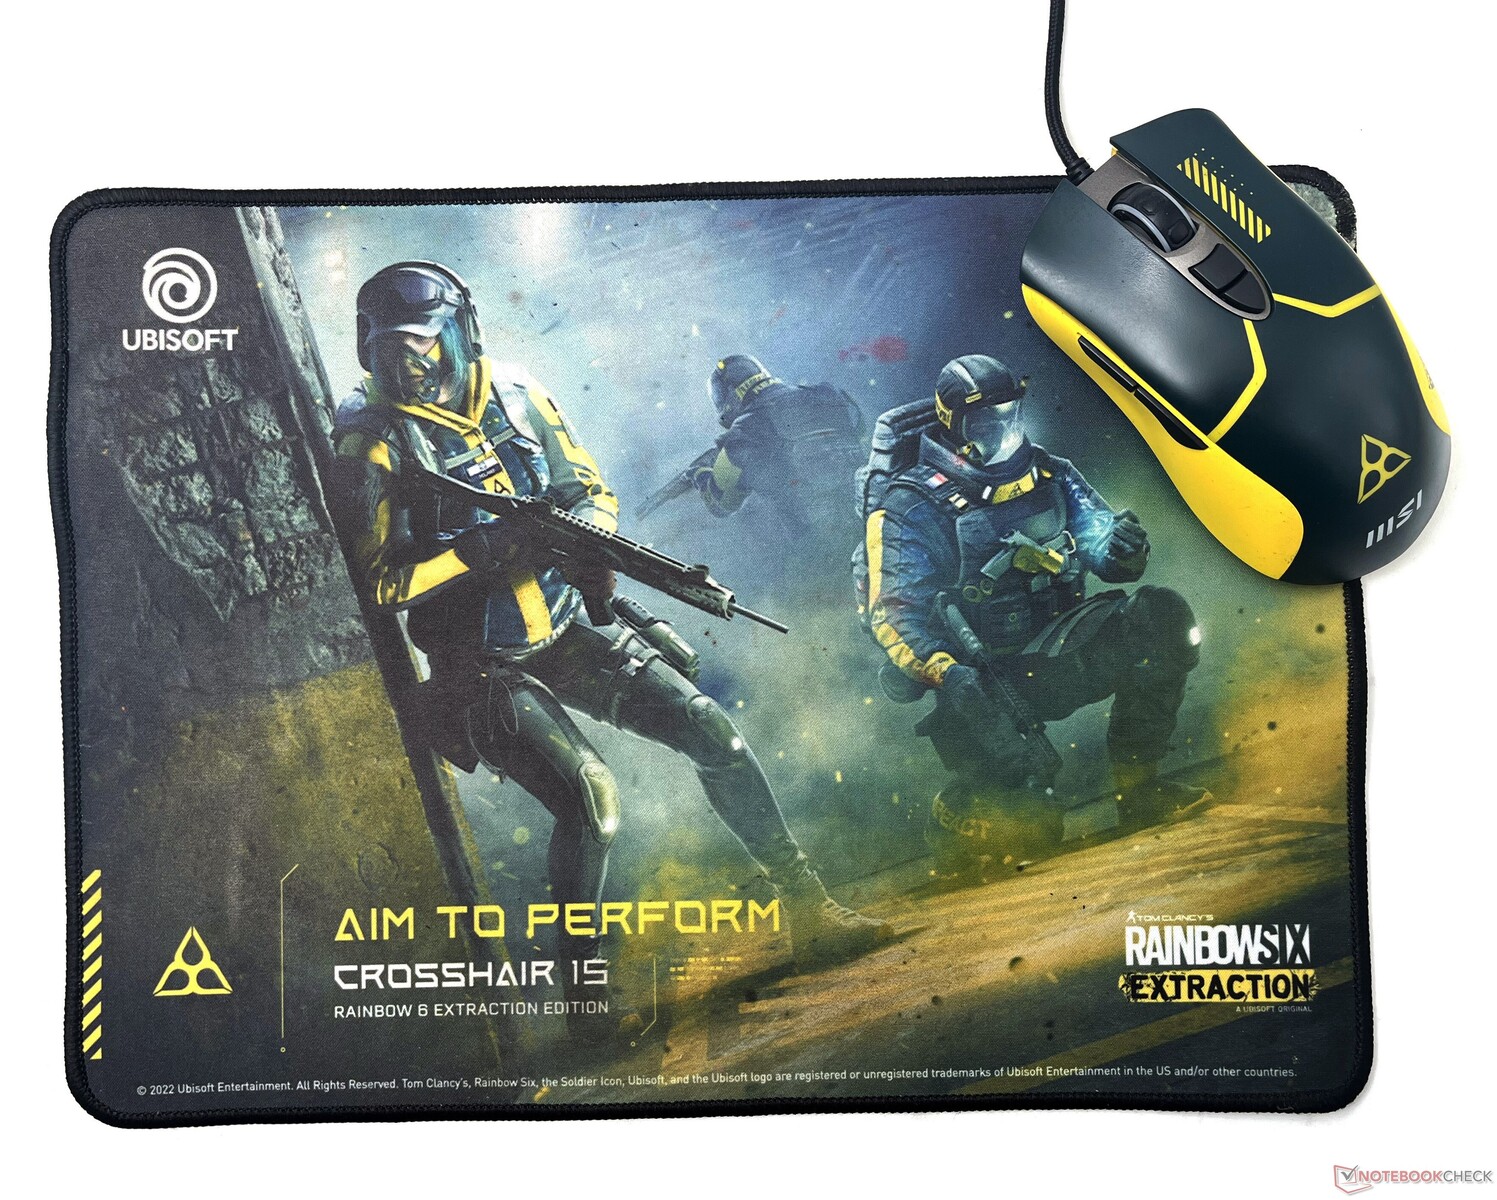
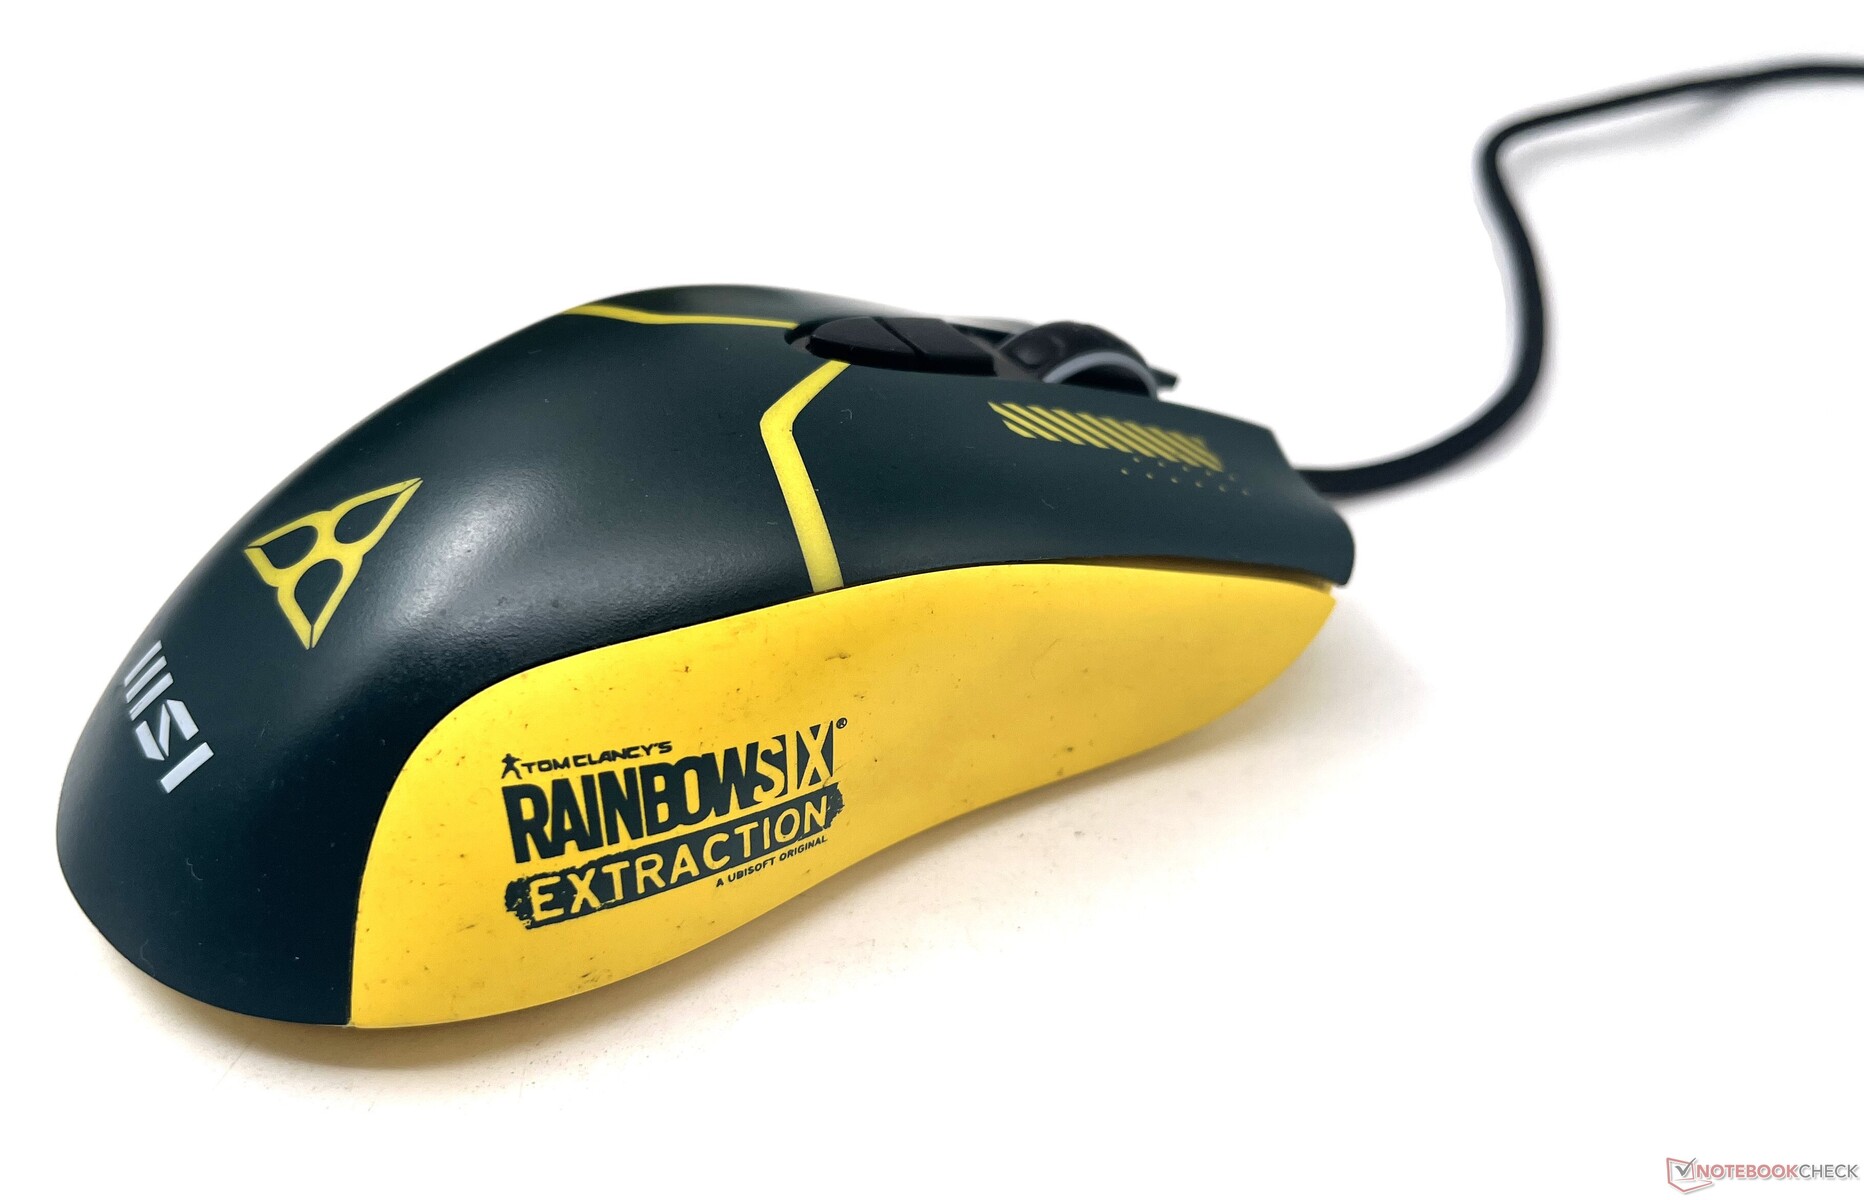
MSI försöker dra in dig ytterligare i Rainbow Six: Extraction-universumet med några extra tillbehör. En musmatta och en spelmus med spelets tema ingår i paketet. Köparna får också lösa in ett gratisexemplar av Rainbow Six: Extraction Deluxe Edition via Ubisoft.
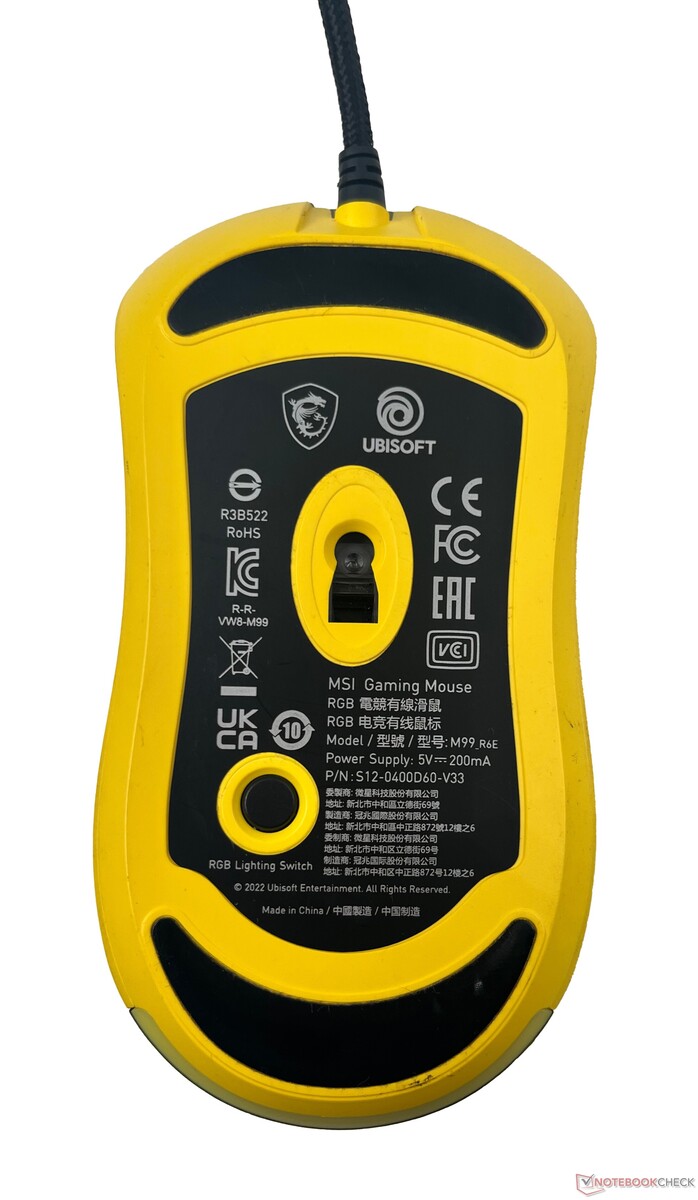
Musen är en anpassad version av MSI M99. Musen använder en Avago 3050-sensor med en upplösning på 4 000 DPI och en pollingfrekvens på 500 Hz. Den är uppenbarligen inte i samma klass som en Corsair IronClaw RGB eller till och med Mad Catz R.A.T. Air, men det är ändå ett hyfsat gratiserbjudande.
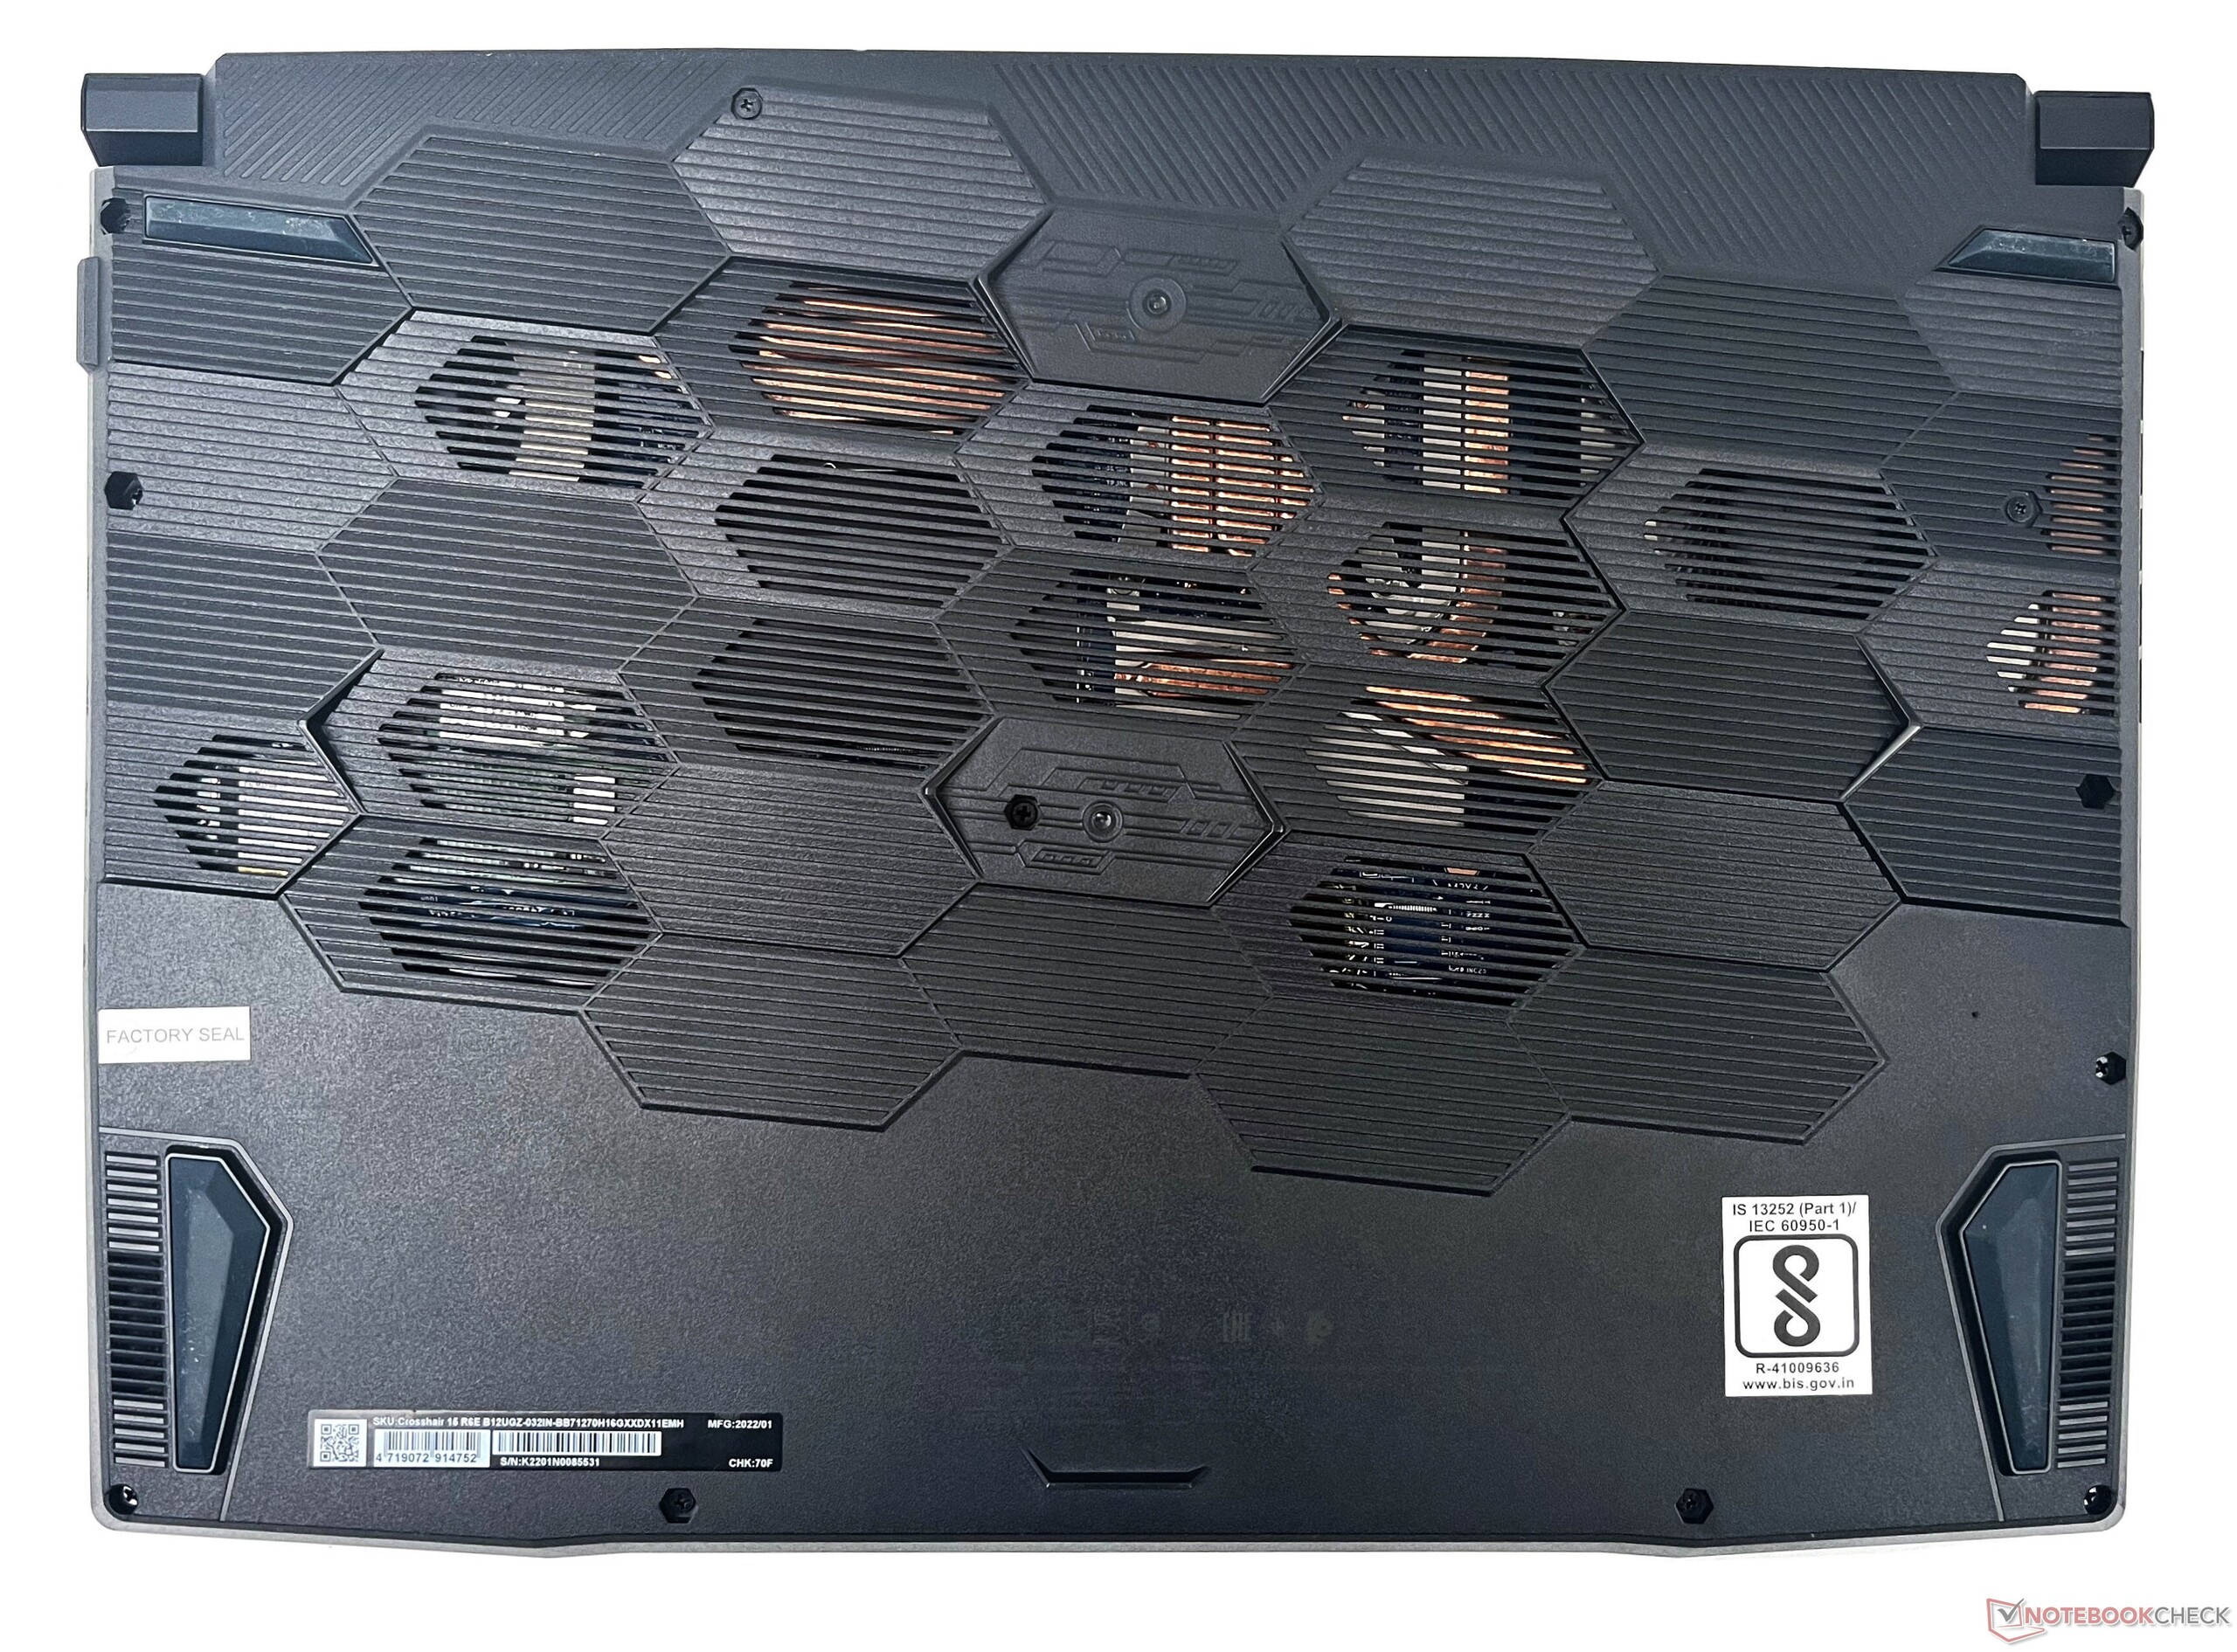
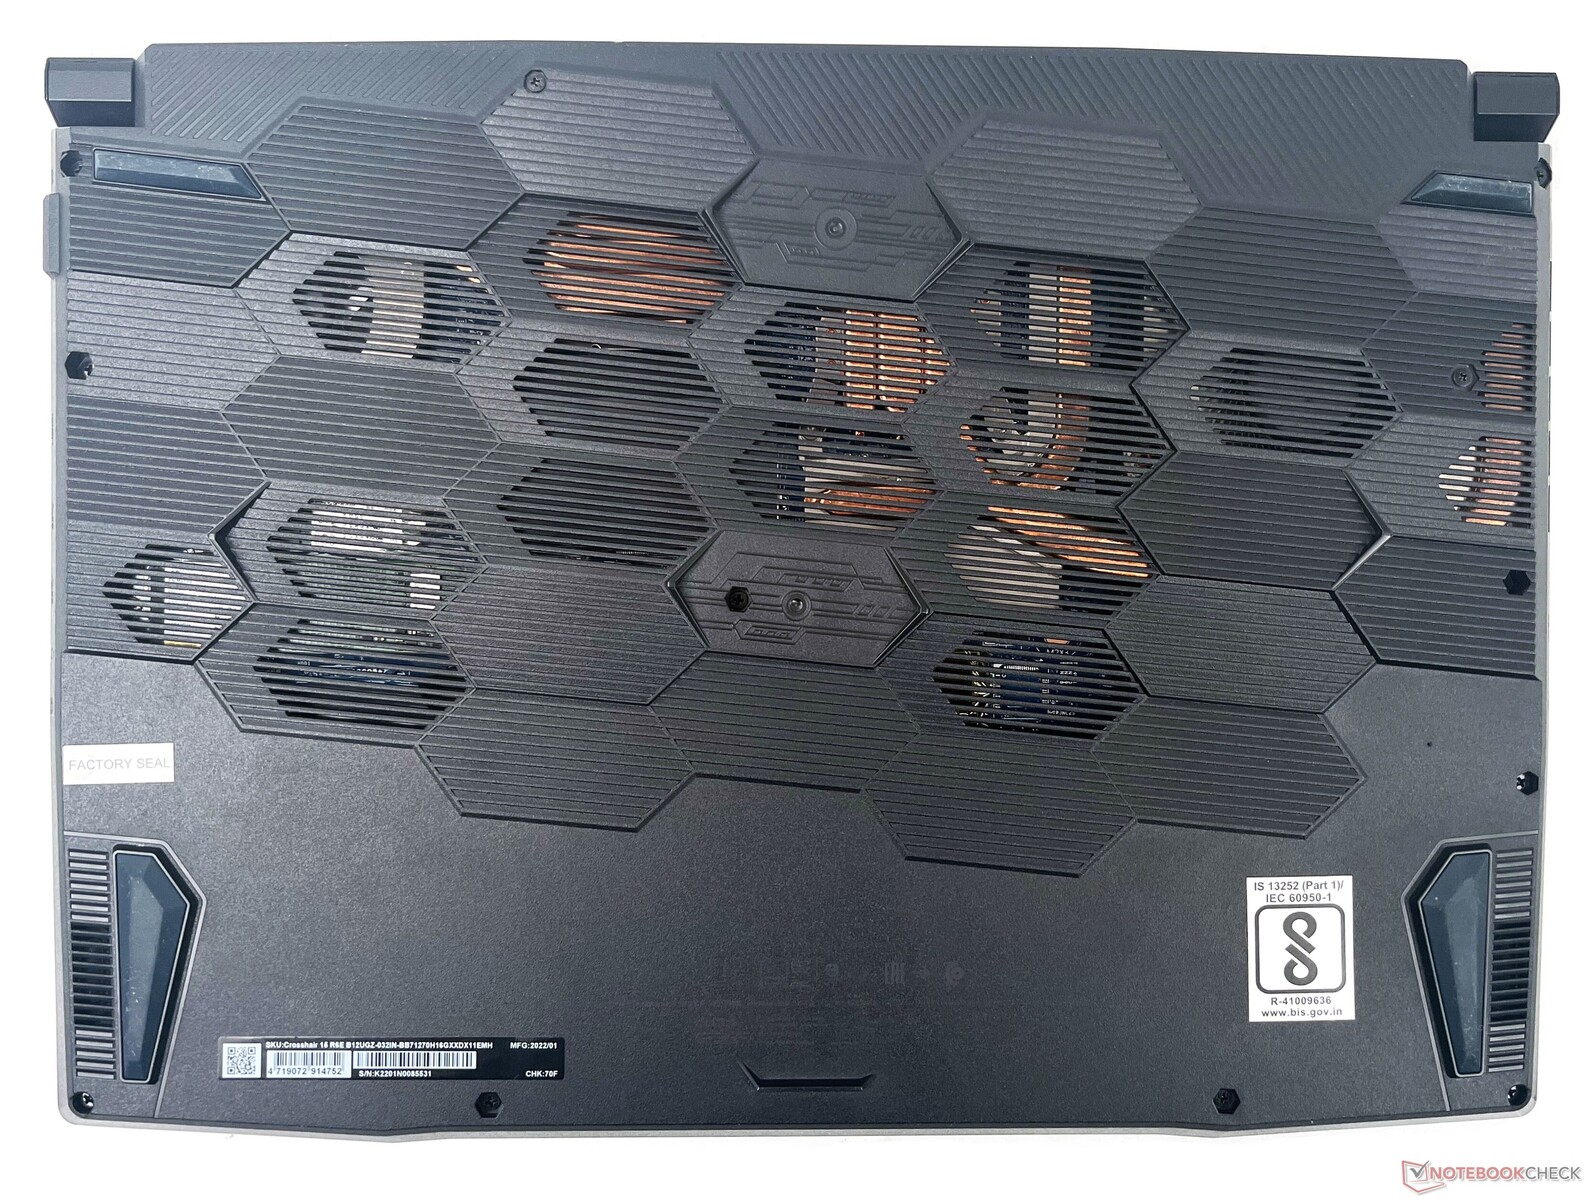
Underhåll
Som vanligt med MSI:s testprover fick vi inte ta bort Factory Seal-klistermärket som döljer en av skruvarna. Med det sagt är det ganska enkelt att öppna bakpanelen och användare bör kunna utföra uppgraderingar utan problem.
Garanti
MSI erbjuder en tvåårig garanti för Crosshair 15 R6E som även inkluderar ett års global reseförsäkring på auktoriserade MSI-servicecenter.
Inmatningsenheter: Fastställda färger för tematisk bakgrundsbelysning
Tangentbord
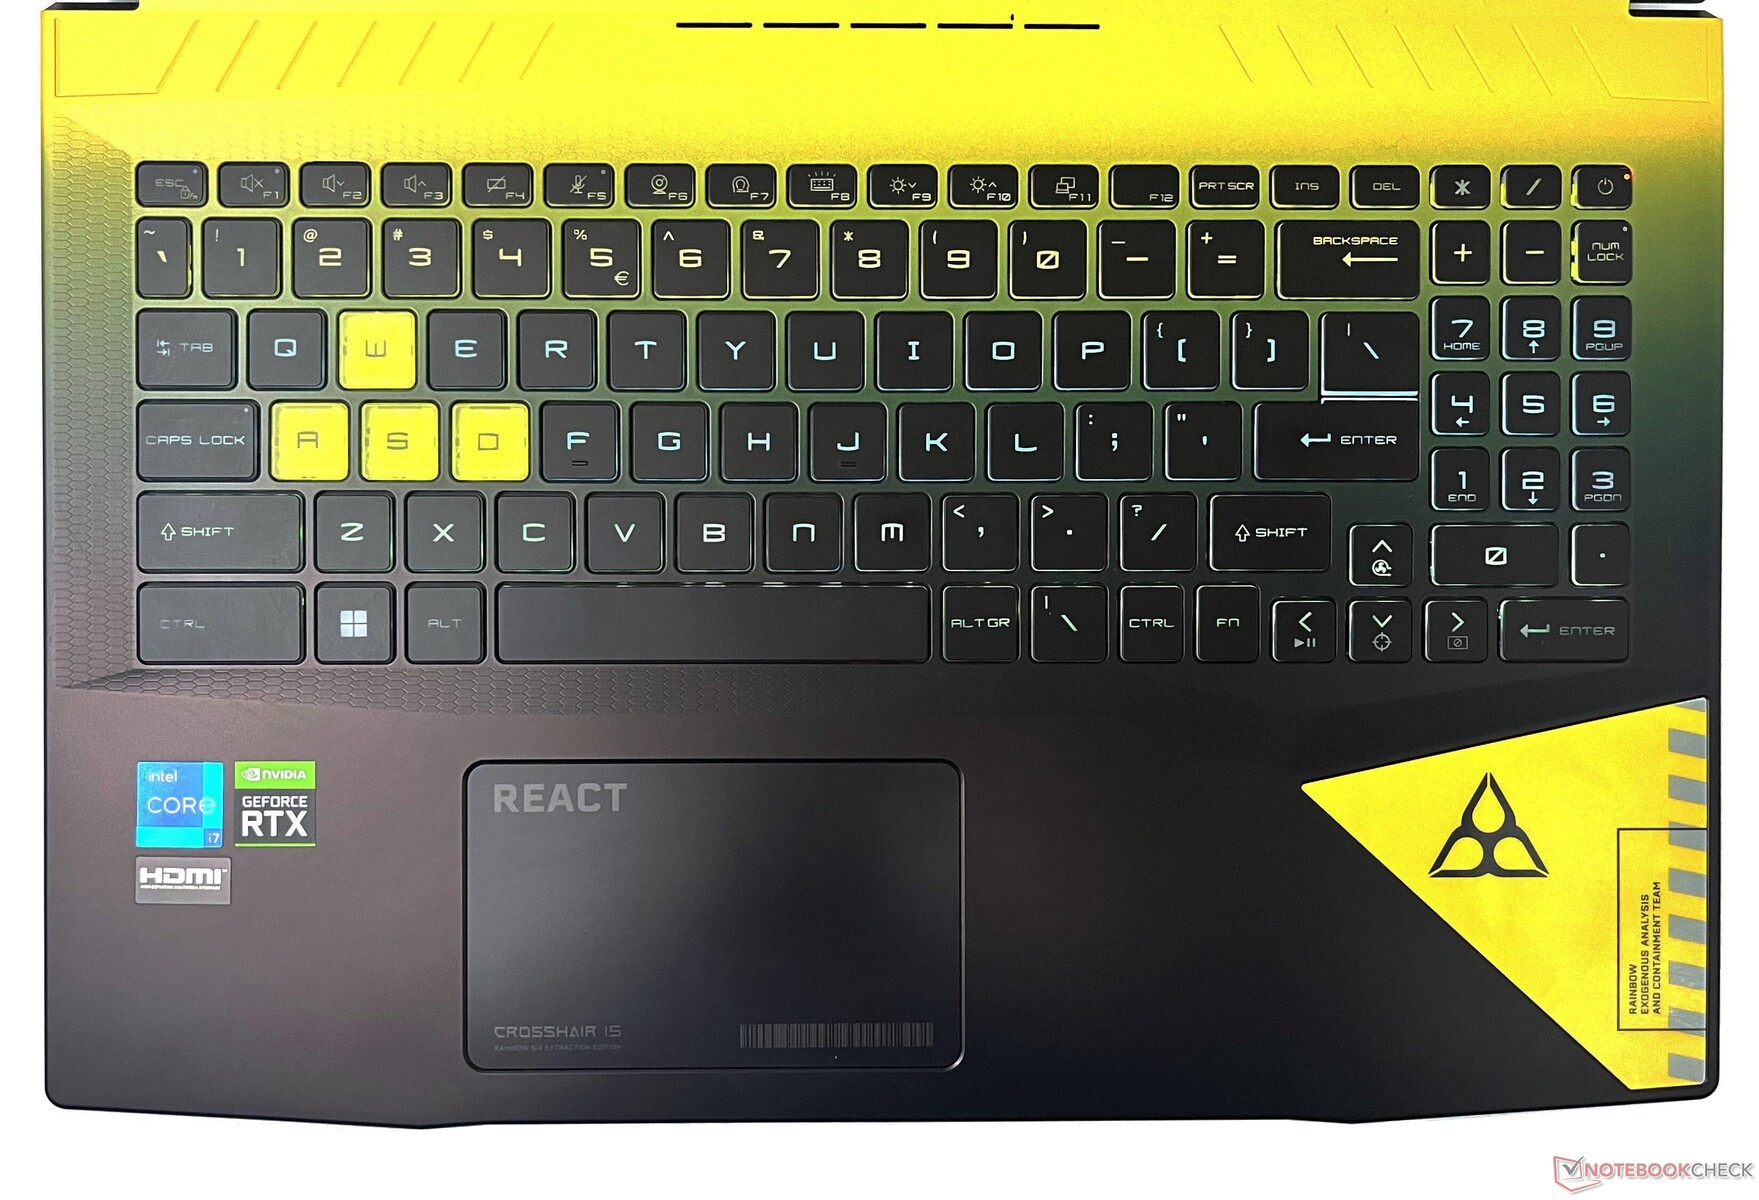
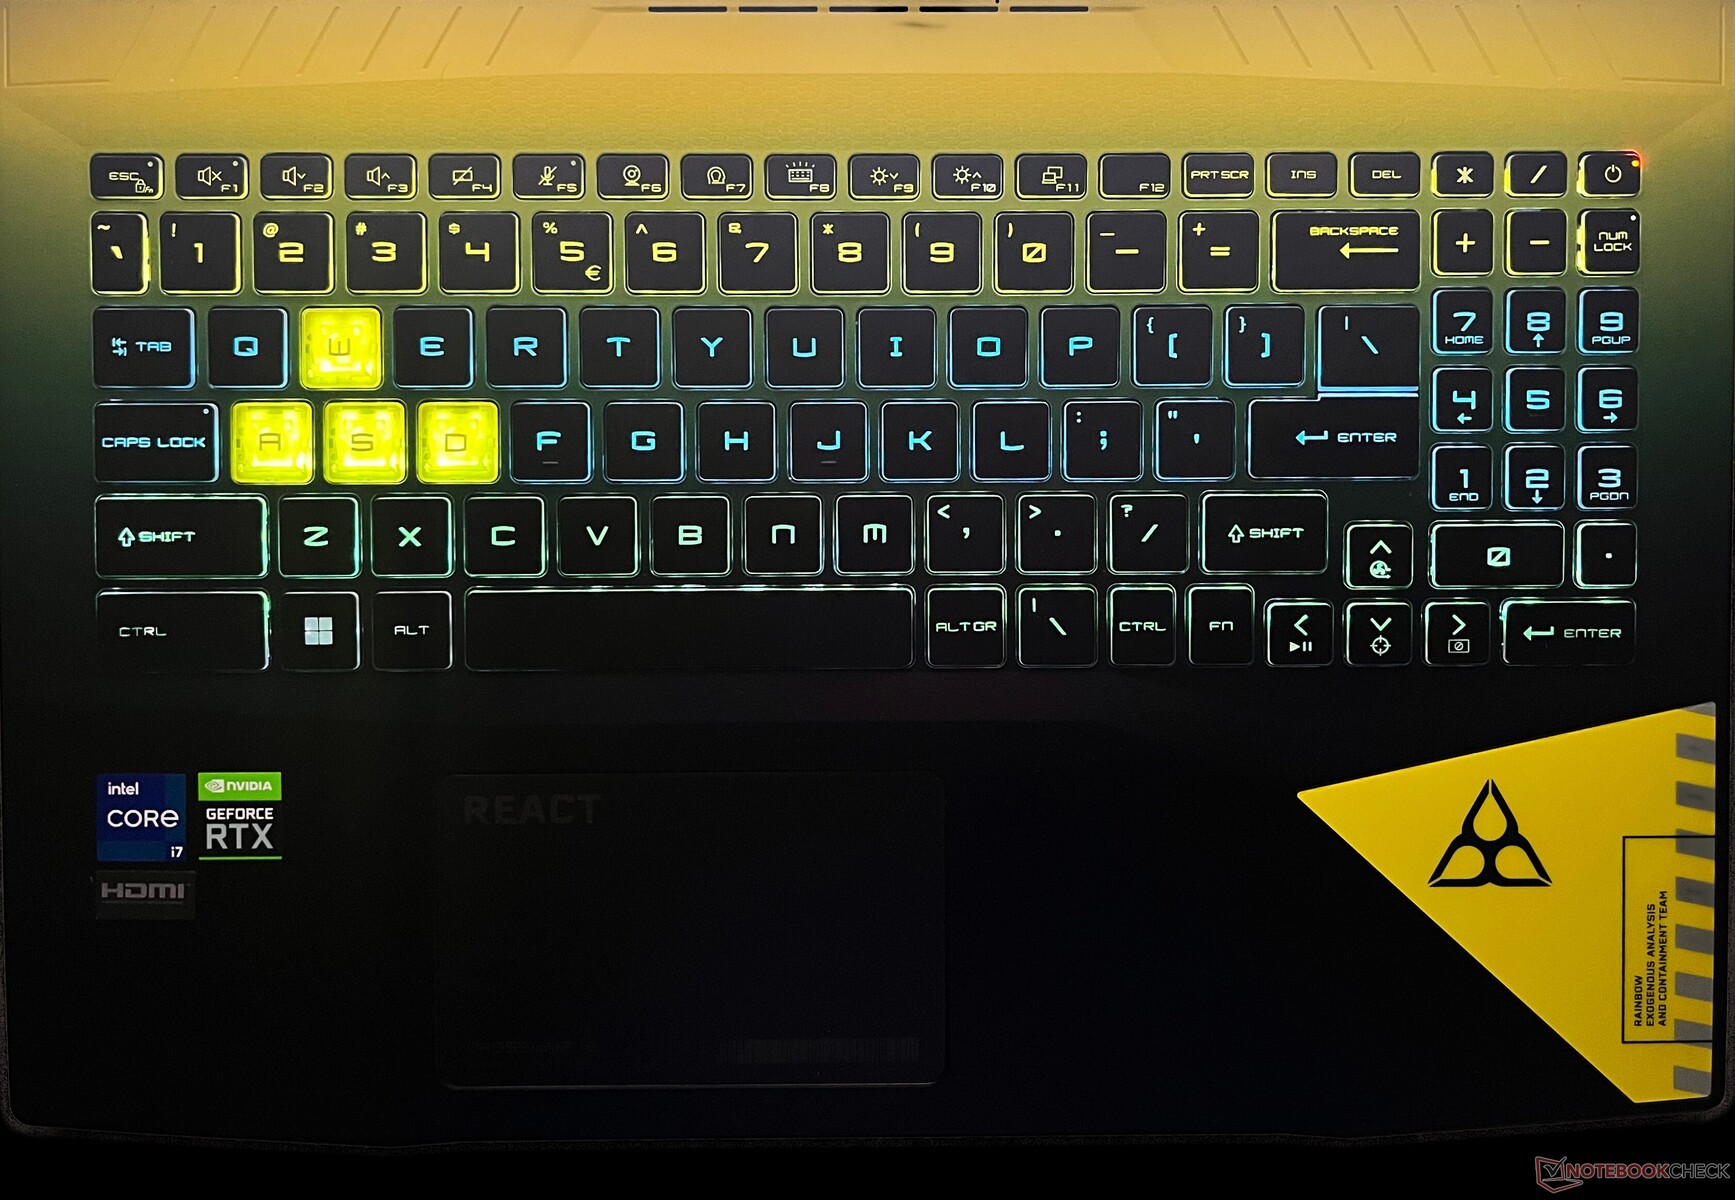
Crosshair 15 R6E:s tangentbord har inte RGB eller någon av SteelSeries-funktionerna, men MSI har integrerat ett tangentbord som kallas Spectrum Backlight. I huvudsak är tangentbordsbelysningen inspirerad av - du gissade det - Rainbow Six: Extraction-spelet med gula och blå färger
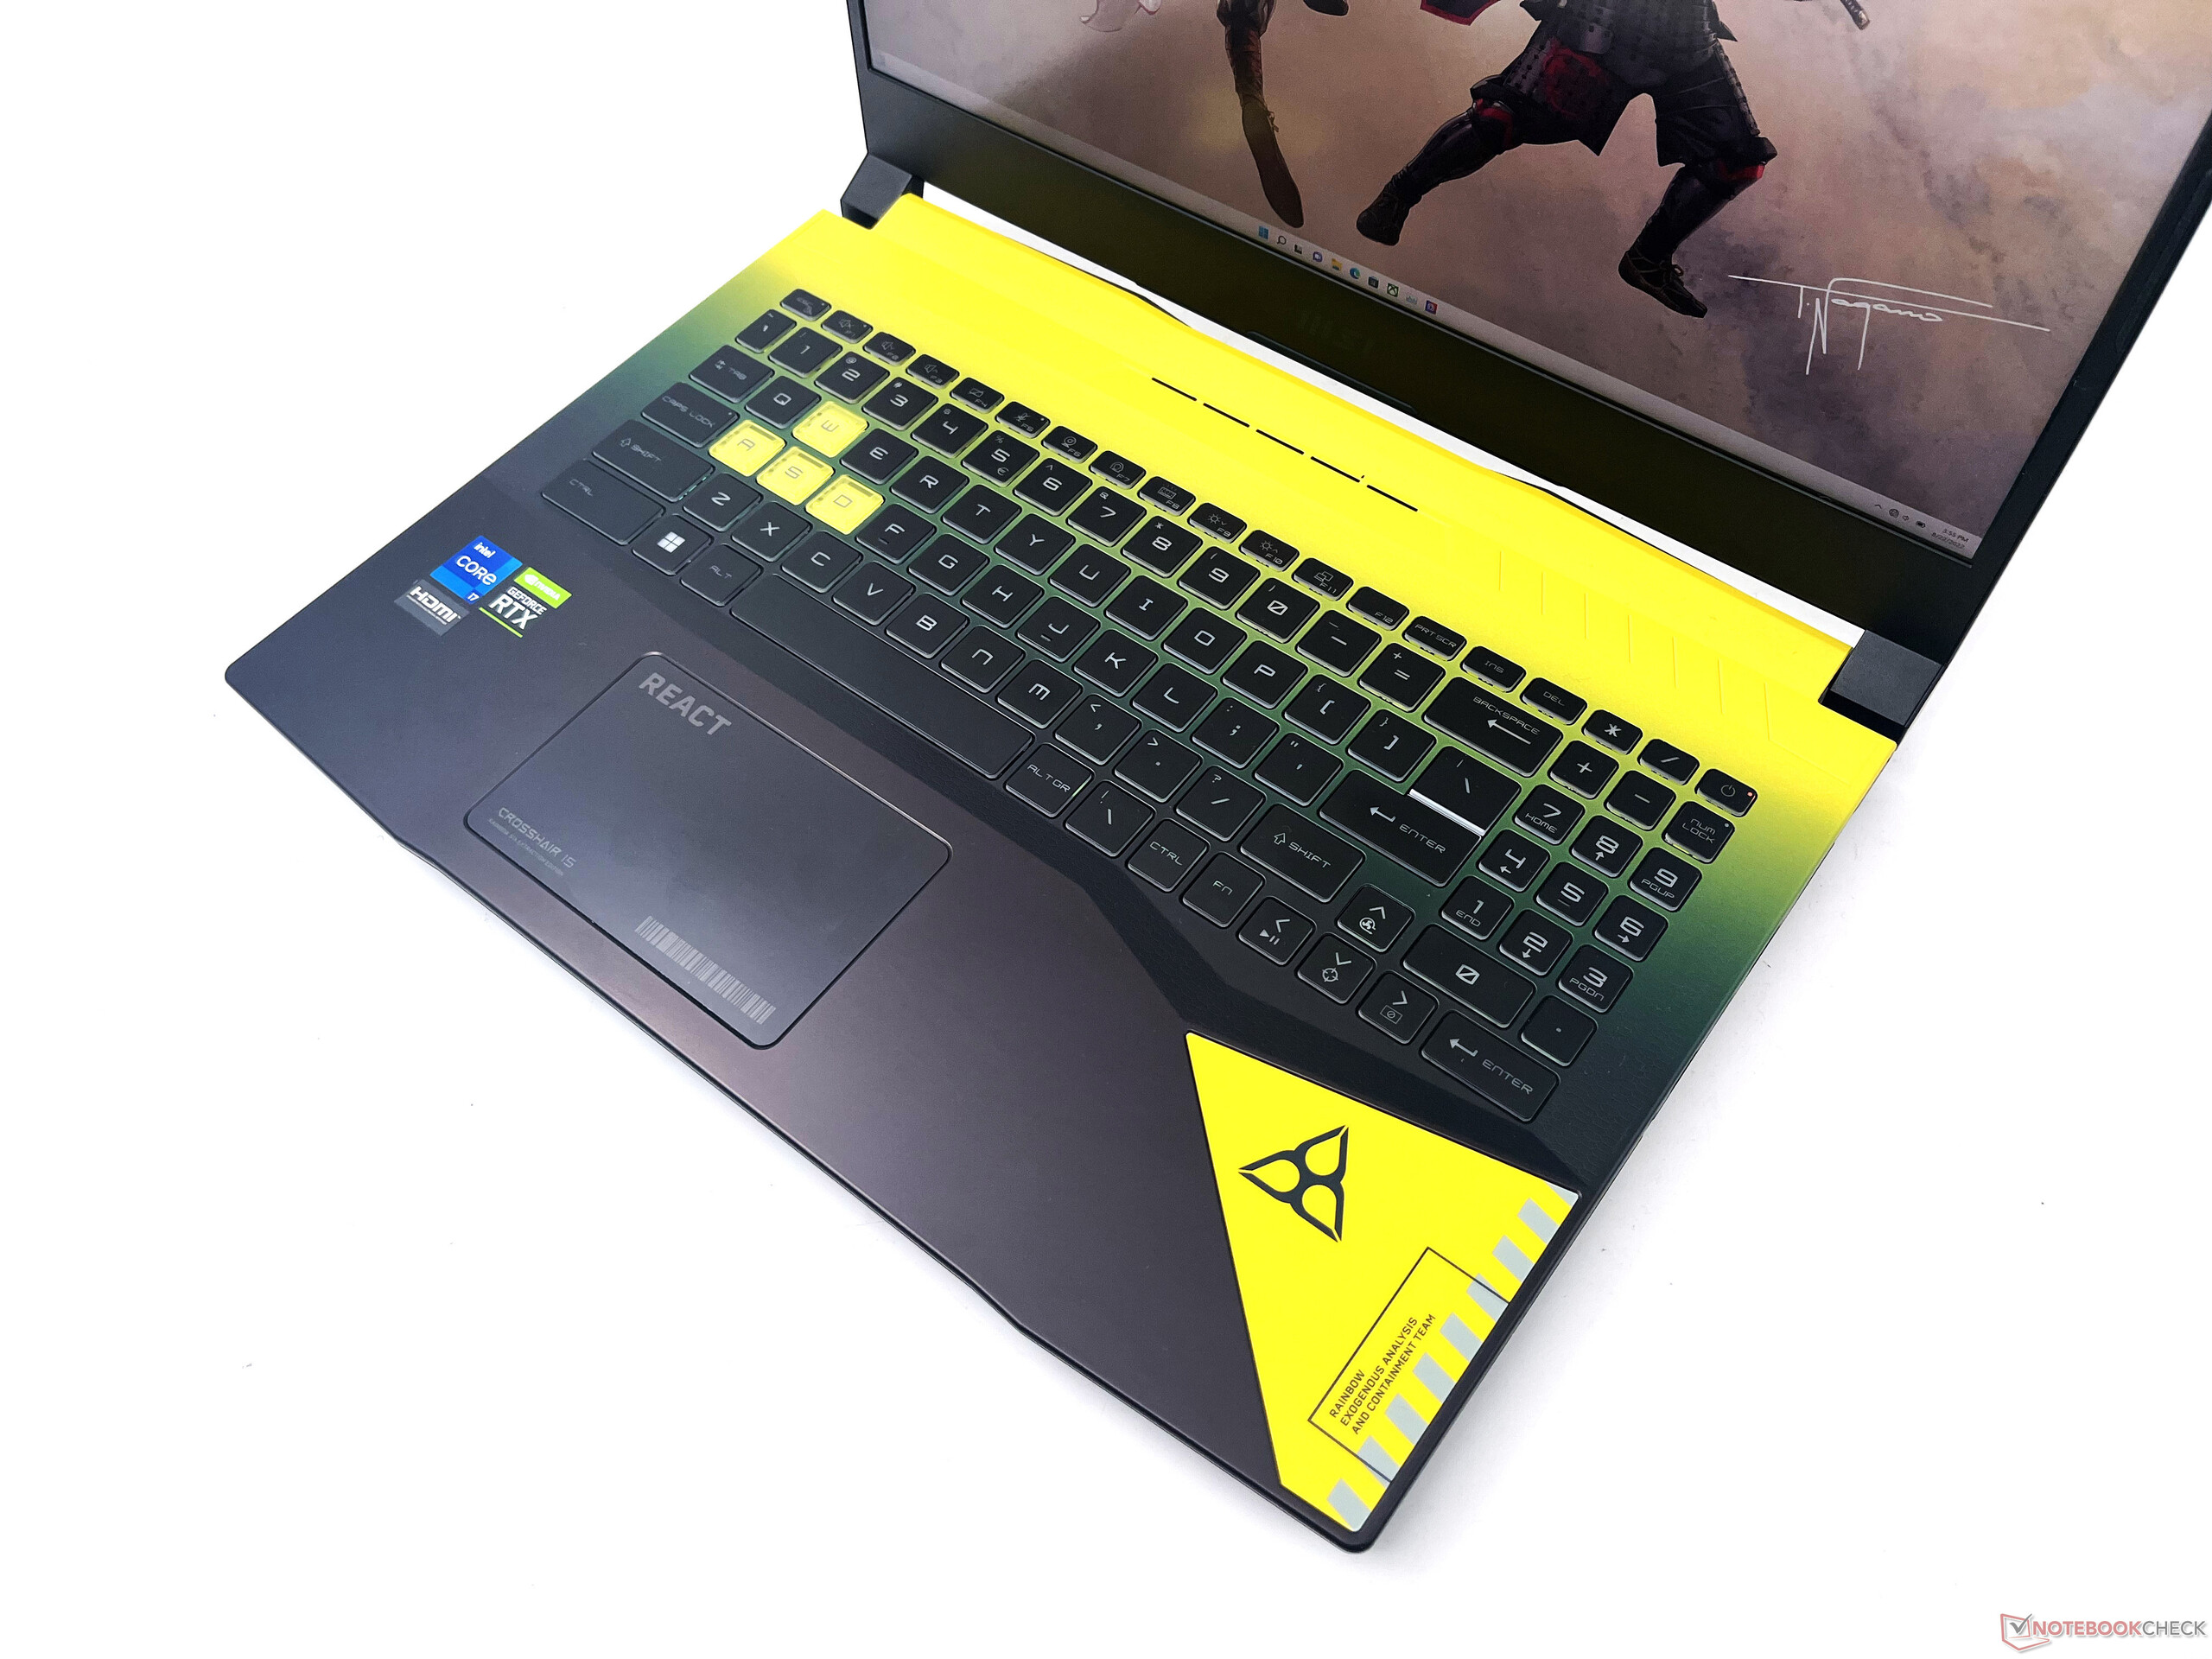
Varje tangent har en fast belysning som inte kan anpassas, även om intensiteten hos själva den övergripande bakgrundsbelysningen kan justeras via en tangentbordsgenväg. Tangenterna har en bra 1,7 mm rörlighet och hyfsad taktil återkoppling
Inkluderandet av numpad är välkommet, och piltangenterna är inte klämda. De sekundära funktionerna är tack och lov upplysta, vilket gör dem lätta att känna igen i mörkret.
Om du är nybörjare på bärbara datorer från MSI bör du notera den besvärliga placeringen av Fn-tangenten till höger i stället för dess vanliga position.
Pekplatta
Pekplattan på 10,5 cm x 6,5 cm har spelets REACT-logotyp och Crosshair 15-märkningen. När det gäller funktionalitet är den lik de pekplattor som vi har sett med dess Pulse- och Katana-kusiner.
Pekplattans respons är bra och gester fungerar bra tack vare Windows Precision -drivrutinerna. Den vänstra och den högra musknappen ligger i nivå med pekplattan och klickar utan ansträngning, om än med visst brus.
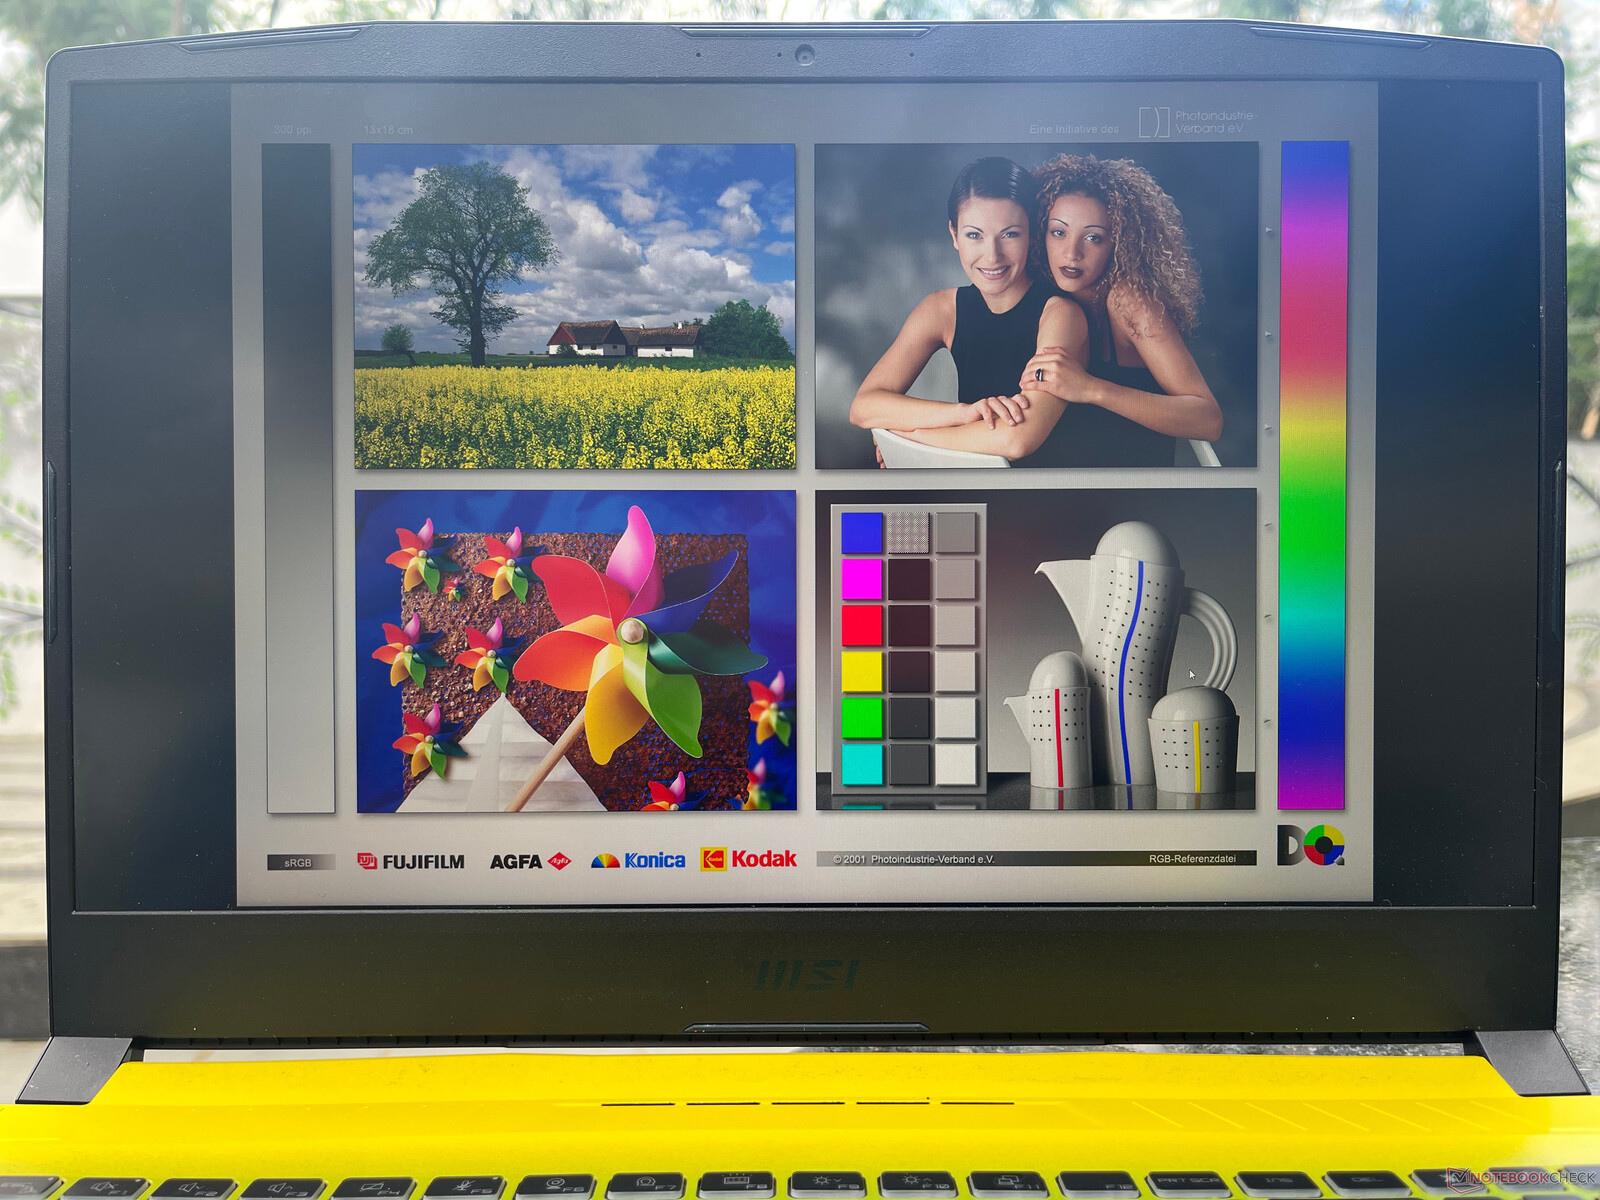
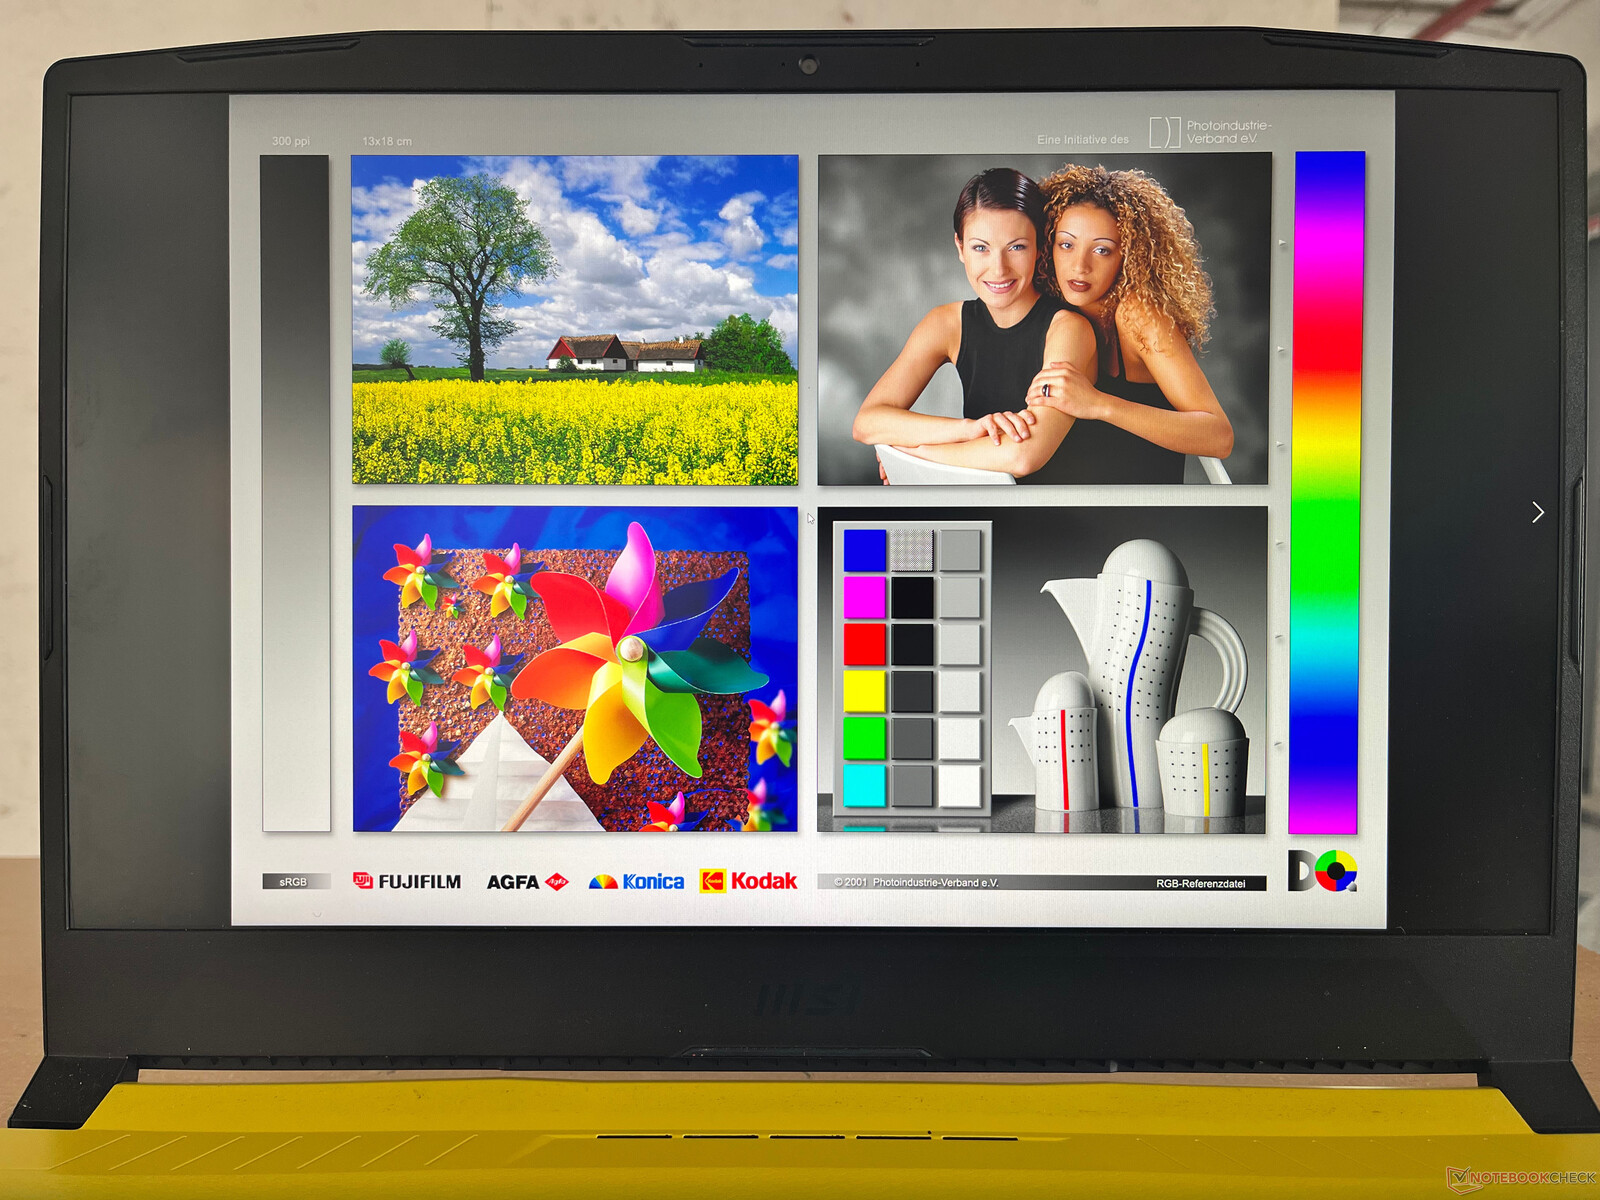
Visa: QHD 165 Hz-panel med bred färgskala och utan PWM
MSI erbjuder en 15,6-tums QHD IPS-panel på QHD-nivå med 165 Hz uppdateringsfrekvens i båda Crosshair 15 R6E-varianterna. Det finns inget stöd för HDR10 eller Dolby Vision. Vi registrerade en maximal ljusstyrka på 342 nits, vilket bör vara lämpligt för inomhusbruk.
En ljusfördelning på 89 % och ett uppmätt kontrastförhållande på 1069:1 ger en hygglig tittarupplevelse. Detta liknar vad vi tidigare har observerat med den Asus ROG Zephyrus G15 och Acer Nitro 5som använder samma panel.
Vi ser dock en betydande bakgrundsbelysningsblödning nära skärmens nedre hörn.


| |||||||||||||||||||||||||
Distribution av ljusstyrkan: 89 %
Mitt på batteriet: 341 cd/m²
Kontrast: 1069:1 (Svärta: 0.32 cd/m²)
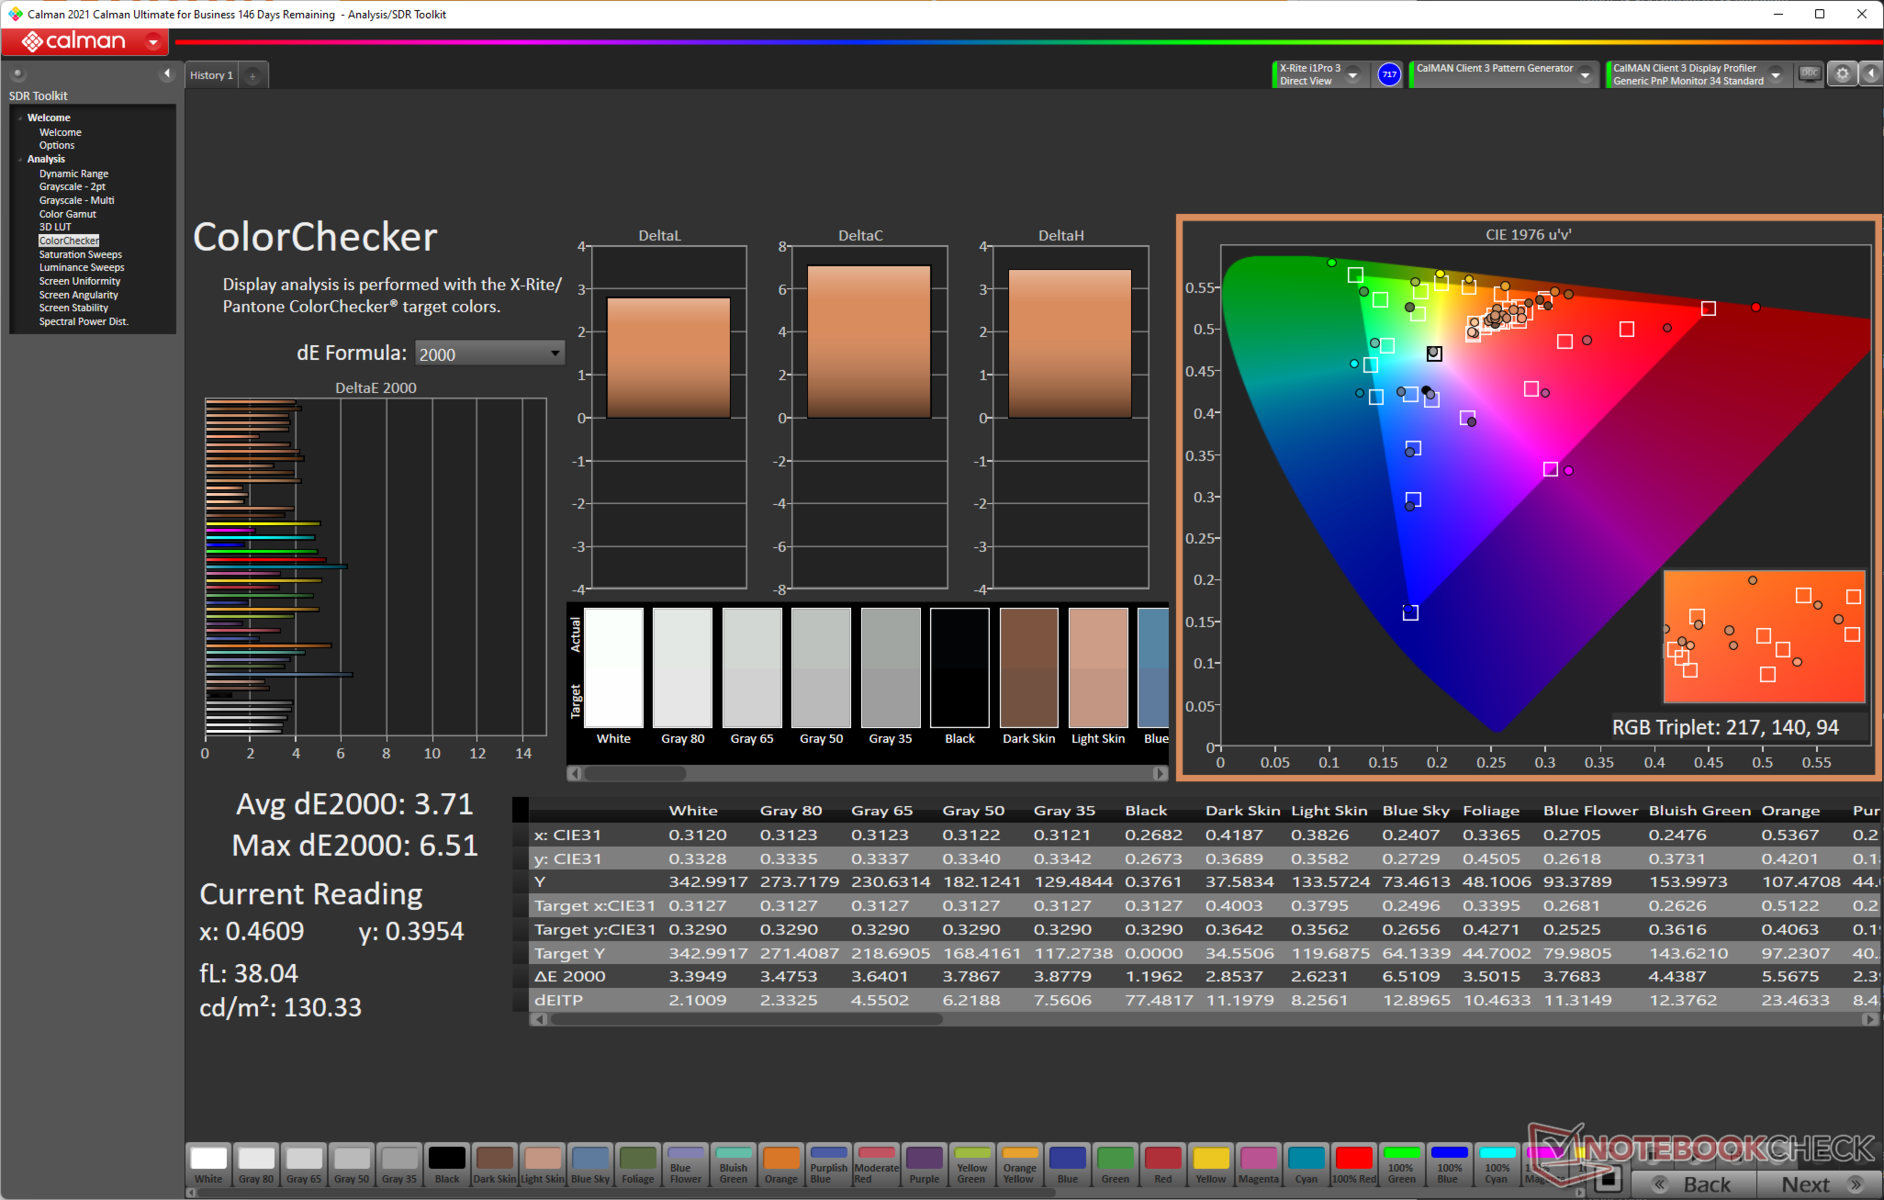
ΔE ColorChecker Calman: 3.71 | ∀{0.5-29.43 Ø4.71}
calibrated: 2.59
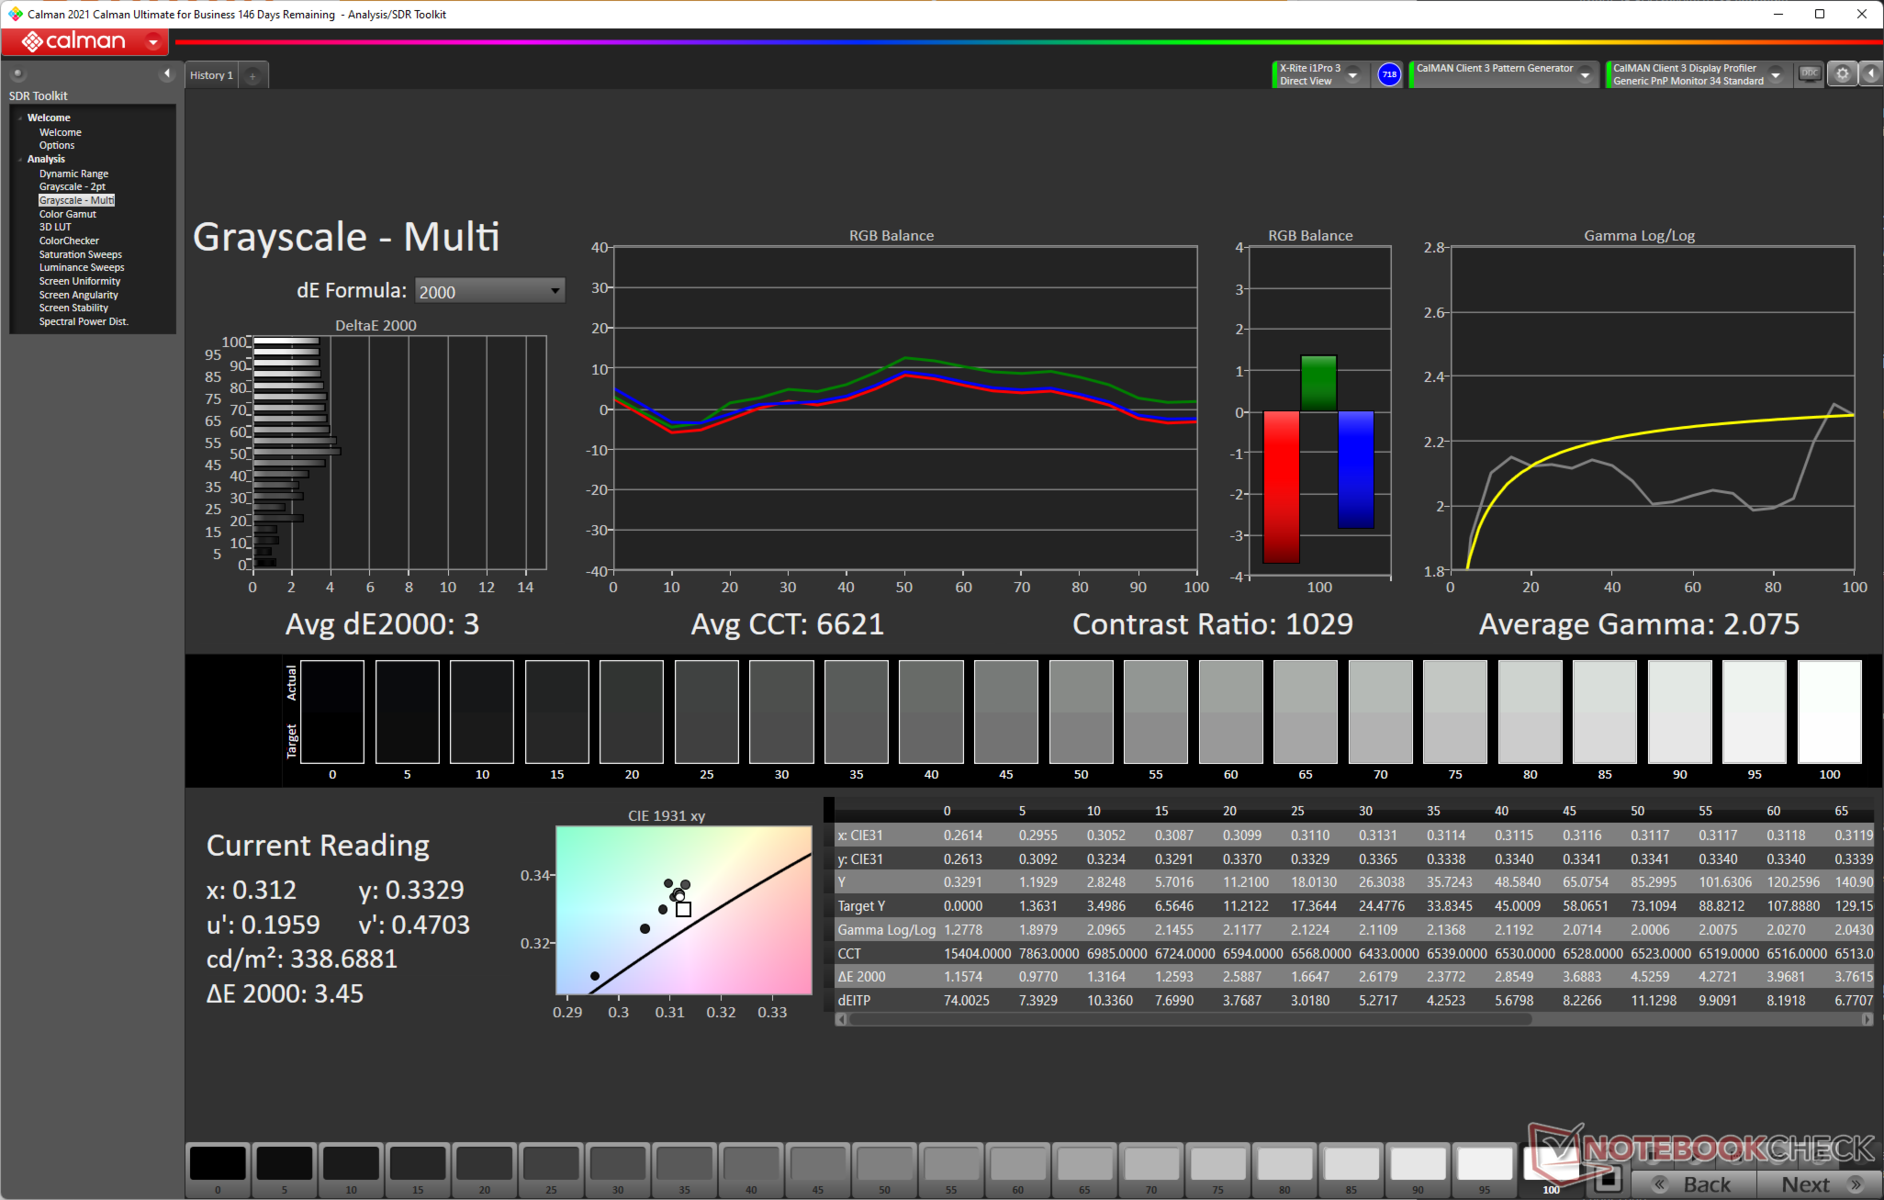
ΔE Greyscale Calman: 3 | ∀{0.09-98 Ø4.96}
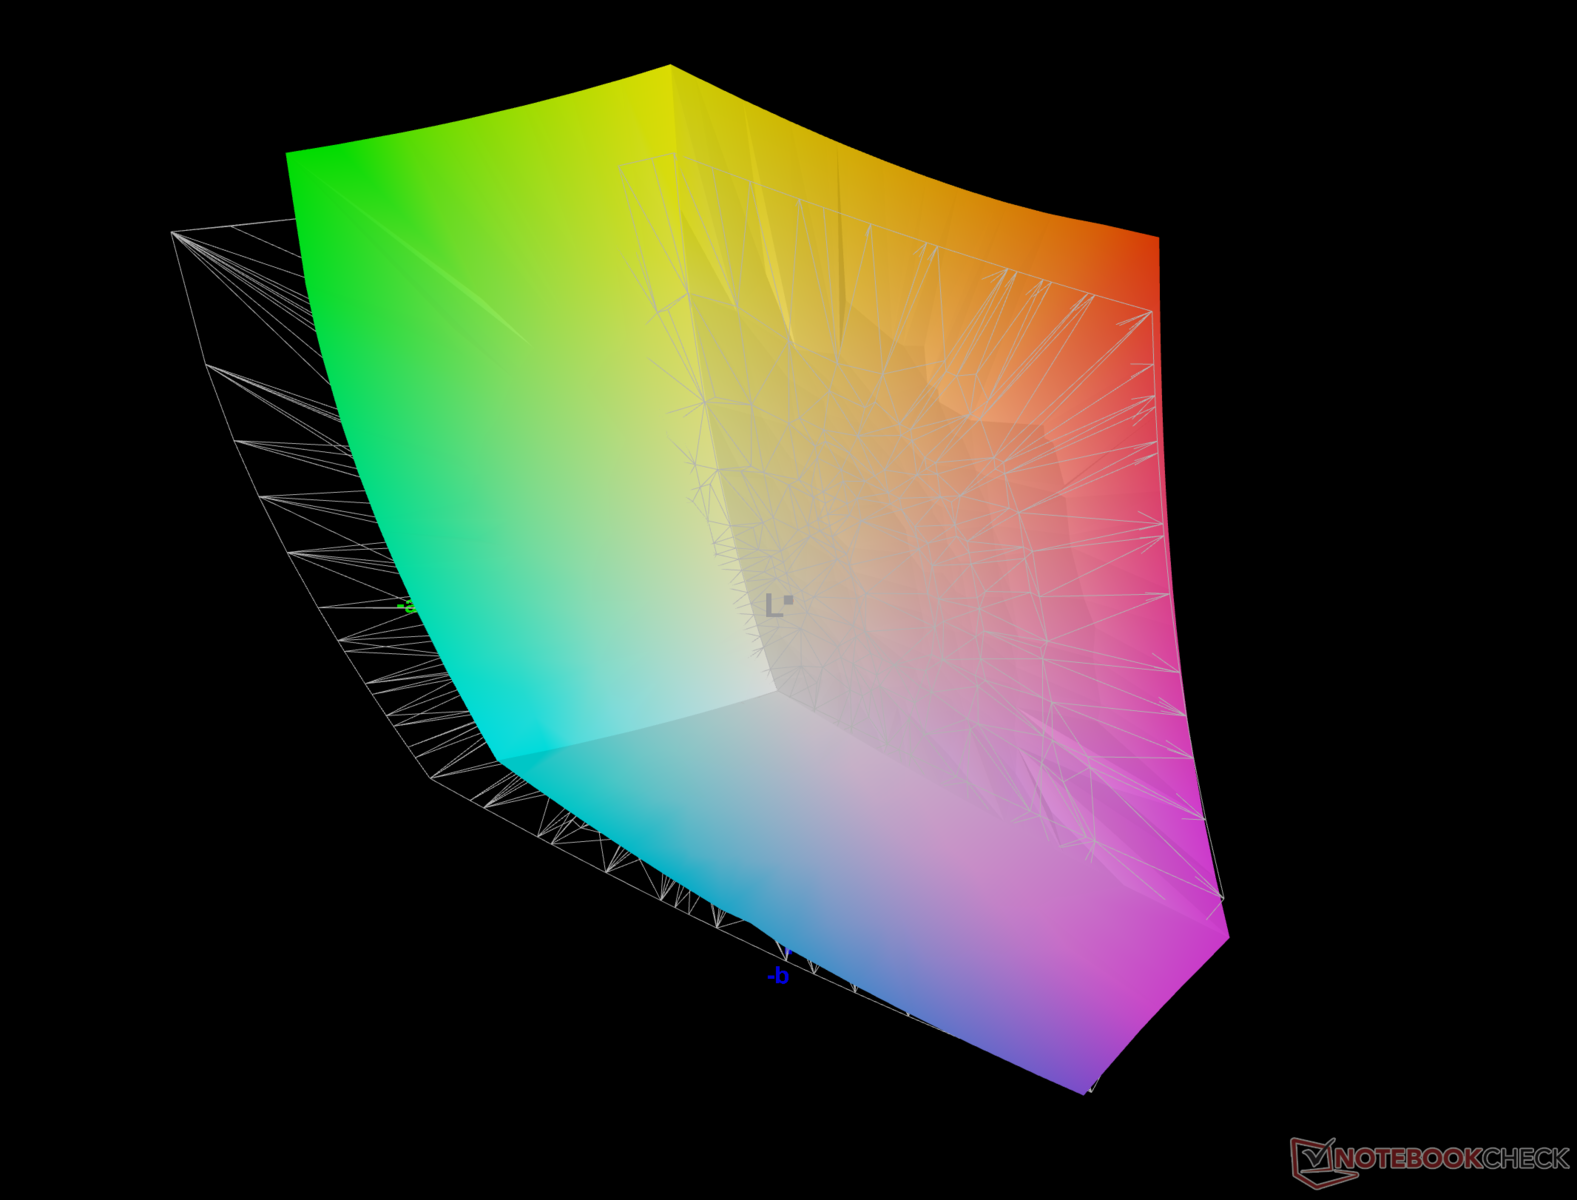
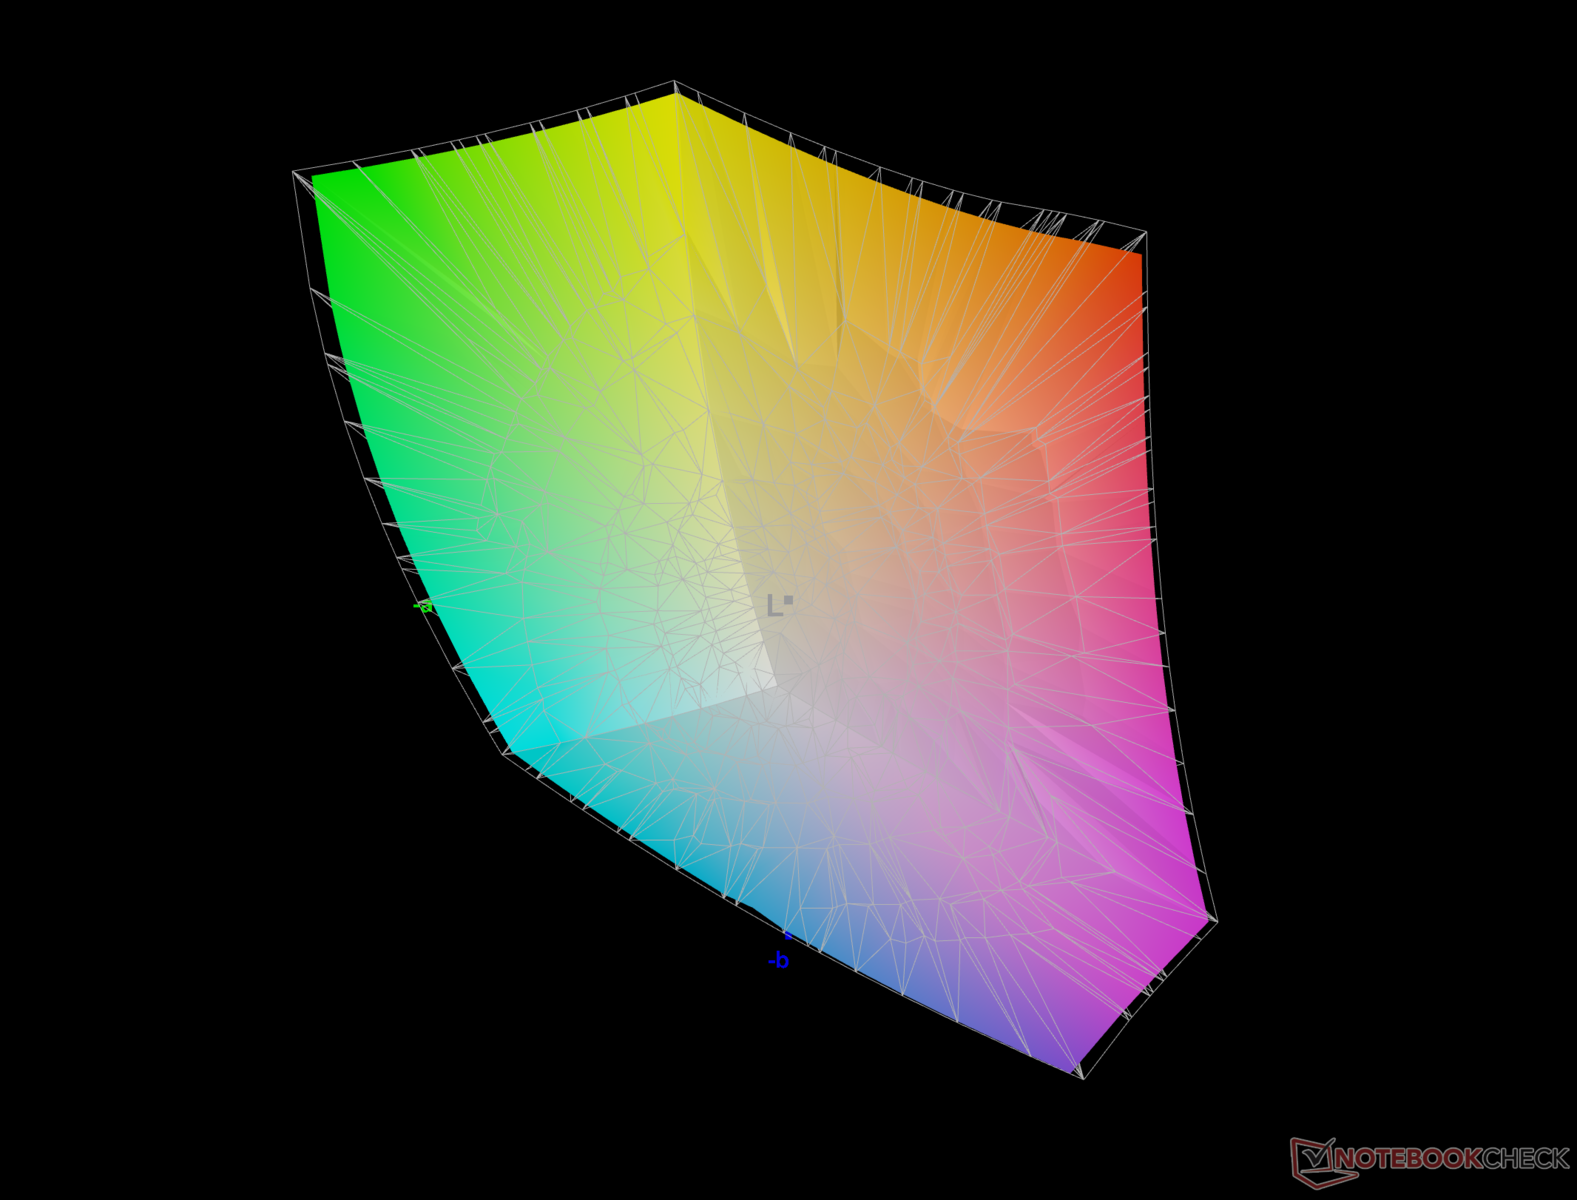
84.7% AdobeRGB 1998 (Argyll 3D)
99.8% sRGB (Argyll 3D)
94.8% Display P3 (Argyll 3D)
Gamma: 2.07
CCT: 6621 K
| MSI Crosshair 15 R6E B12UGZ-050 CMN N156KME-GNA, IPS-Level, 2560x1440, 15.6" | MSI Stealth GS66 12UGS Sharp LQ156T1JW04 (SHP153C), IPS-Level, 2560x1440, 15.6" | Lenovo Legion 5 Pro 16 G7 i7 RTX 3070Ti NE160QDM-NY1, IPS, 2560x1600, 16" | Acer Nitro 5 AN515-58-72QR Chi Mei N156KME-GNA, IPS, 2560x1440, 15.6" | Schenker XMG Neo 15 (Ryzen 9 6900HX, RTX 3070 Ti) BOE0A67, IPS, 2560x1440, 15.6" | |
|---|---|---|---|---|---|
| Display | 1% | -15% | 1% | -15% | |
| Display P3 Coverage (%) | 94.8 | 96.4 2% | 68.7 -28% | 95.6 1% | 68.9 -27% |
| sRGB Coverage (%) | 99.8 | 99.7 0% | 97.6 -2% | 99.8 0% | 97.7 -2% |
| AdobeRGB 1998 Coverage (%) | 84.7 | 85.6 1% | 70.9 -16% | 85.2 1% | 70.4 -17% |
| Response Times | -8% | -112% | -110% | -70% | |
| Response Time Grey 50% / Grey 80% * (ms) | 5.36 ? | 6 ? -12% | 17.6 ? -228% | 15.7 ? -193% | 12.4 ? -131% |
| Response Time Black / White * (ms) | 8.04 ? | 8.4 ? -4% | 7.6 ? 5% | 10.2 ? -27% | 8.8 ? -9% |
| PWM Frequency (Hz) | |||||
| Screen | -13% | 25% | -1% | 14% | |
| Brightness middle (cd/m²) | 342 | 272 -20% | 502 47% | 332 -3% | 370 8% |
| Brightness (cd/m²) | 326 | 253 -22% | 491 51% | 303 -7% | 343 5% |
| Brightness Distribution (%) | 89 | 87 -2% | 91 2% | 86 -3% | 82 -8% |
| Black Level * (cd/m²) | 0.32 | 0.25 22% | 0.37 -16% | 0.29 9% | 0.28 12% |
| Contrast (:1) | 1069 | 1088 2% | 1357 27% | 1145 7% | 1321 24% |
| Colorchecker dE 2000 * | 3.71 | 3.73 -1% | 2.7 27% | 3.61 3% | 2.31 38% |
| Colorchecker dE 2000 max. * | 6.51 | 9.43 -45% | 4.5 31% | 7.71 -18% | 4.03 38% |
| Colorchecker dE 2000 calibrated * | 2.59 | 0.98 62% | 1.4 46% | 0.59 77% | |
| Greyscale dE 2000 * | 3 | 6.5 -117% | 2.7 10% | 5.2 -73% | 3.28 -9% |
| Gamma | 2.07 106% | 2.172 101% | 2.44 90% | 2.155 102% | 2.47 89% |
| CCT | 6621 98% | 6485 100% | 6326 103% | 6724 97% | 6206 105% |
| Totalt genomsnitt (program/inställningar) | -7% /
-10% | -34% /
-3% | -37% /
-16% | -24% /
-6% |
* ... mindre är bättre
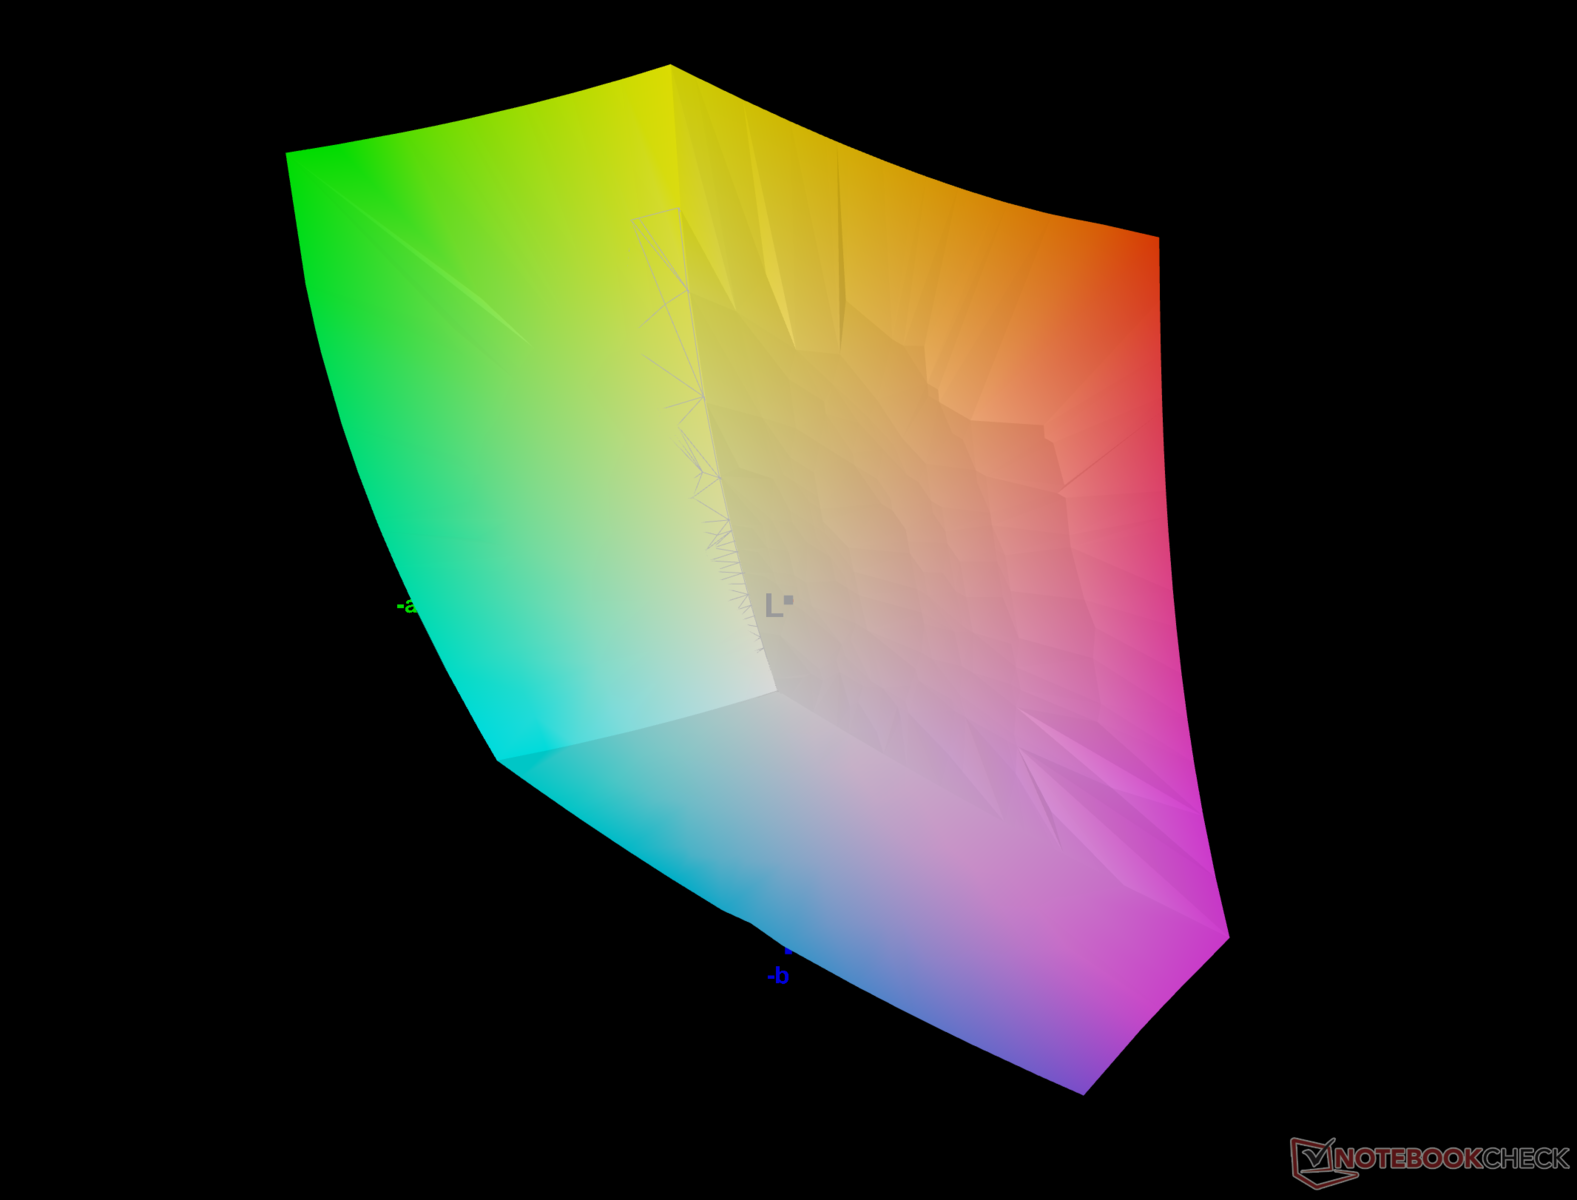
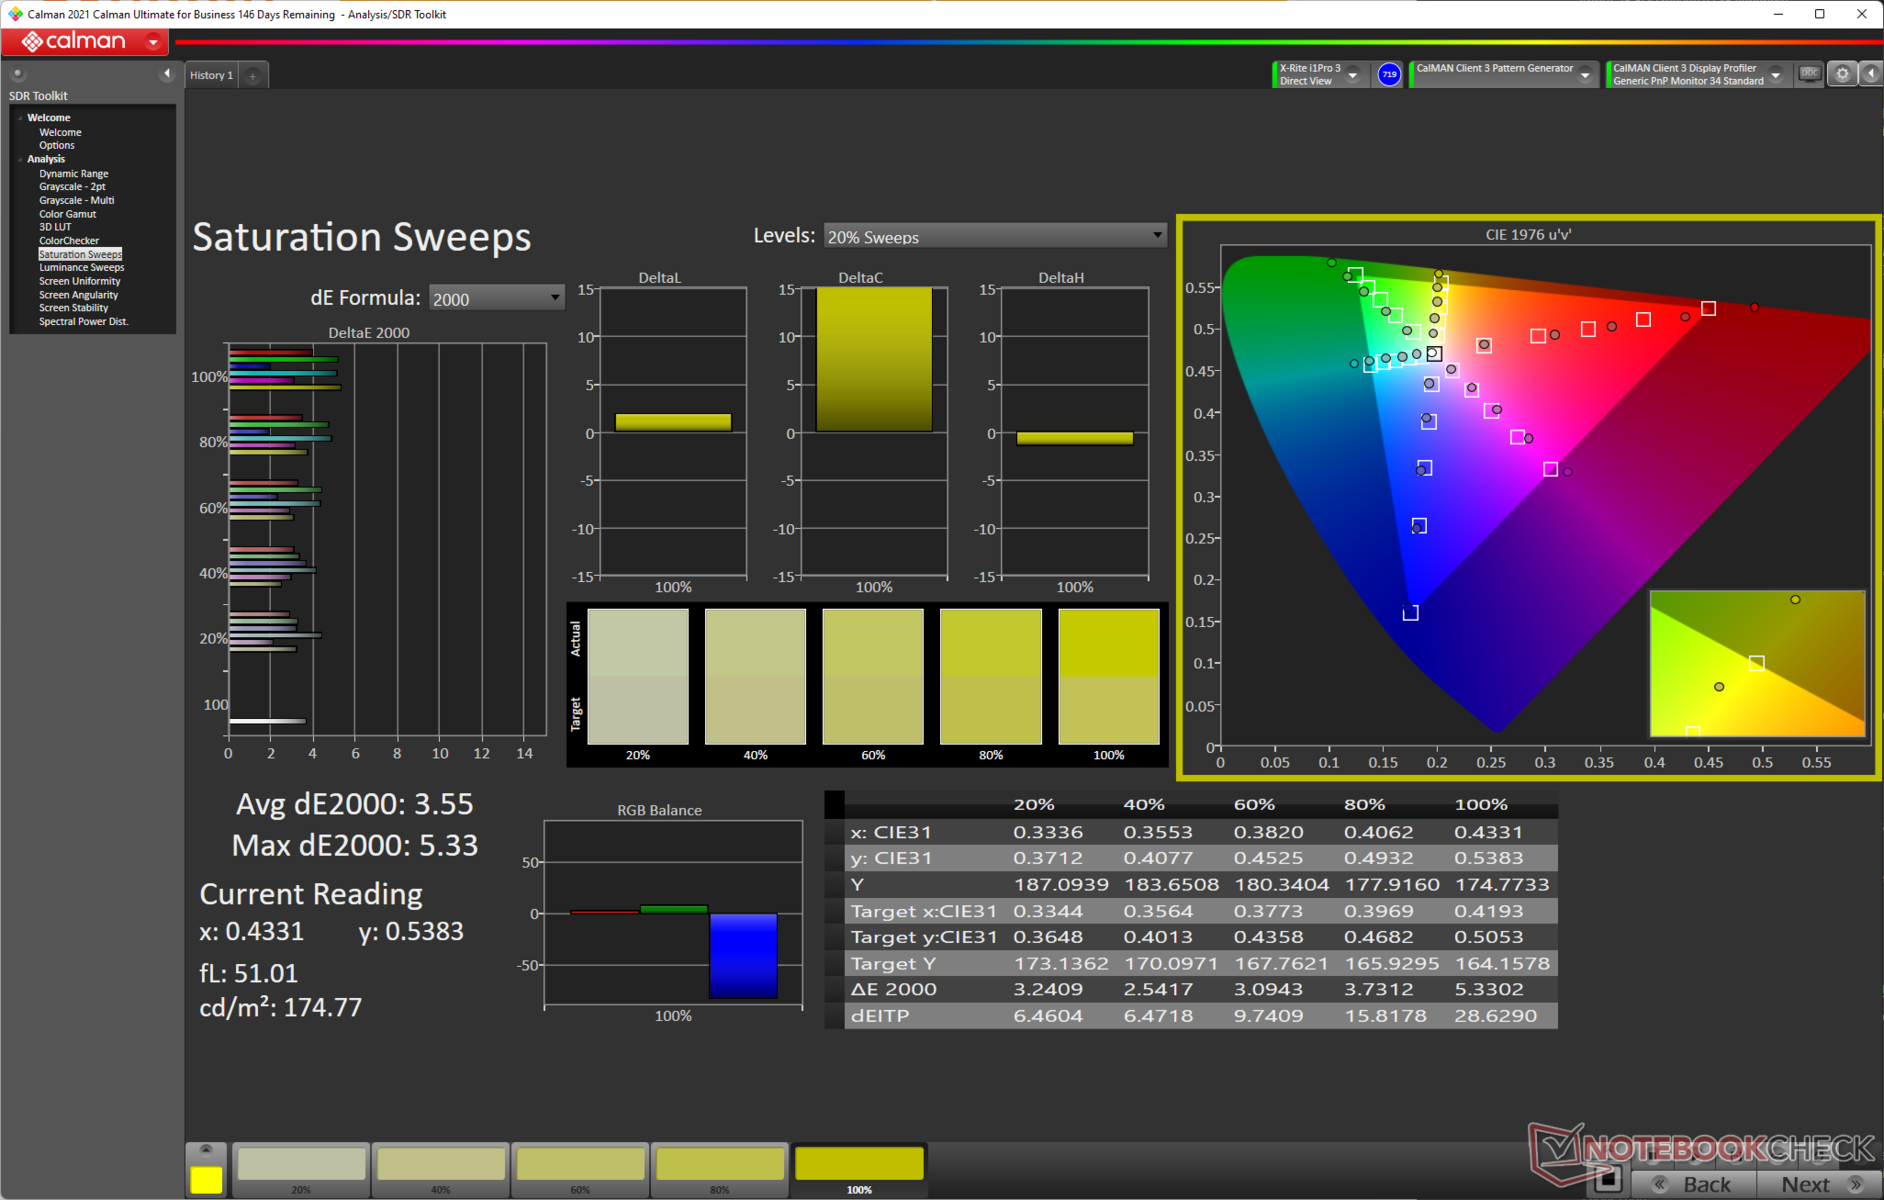
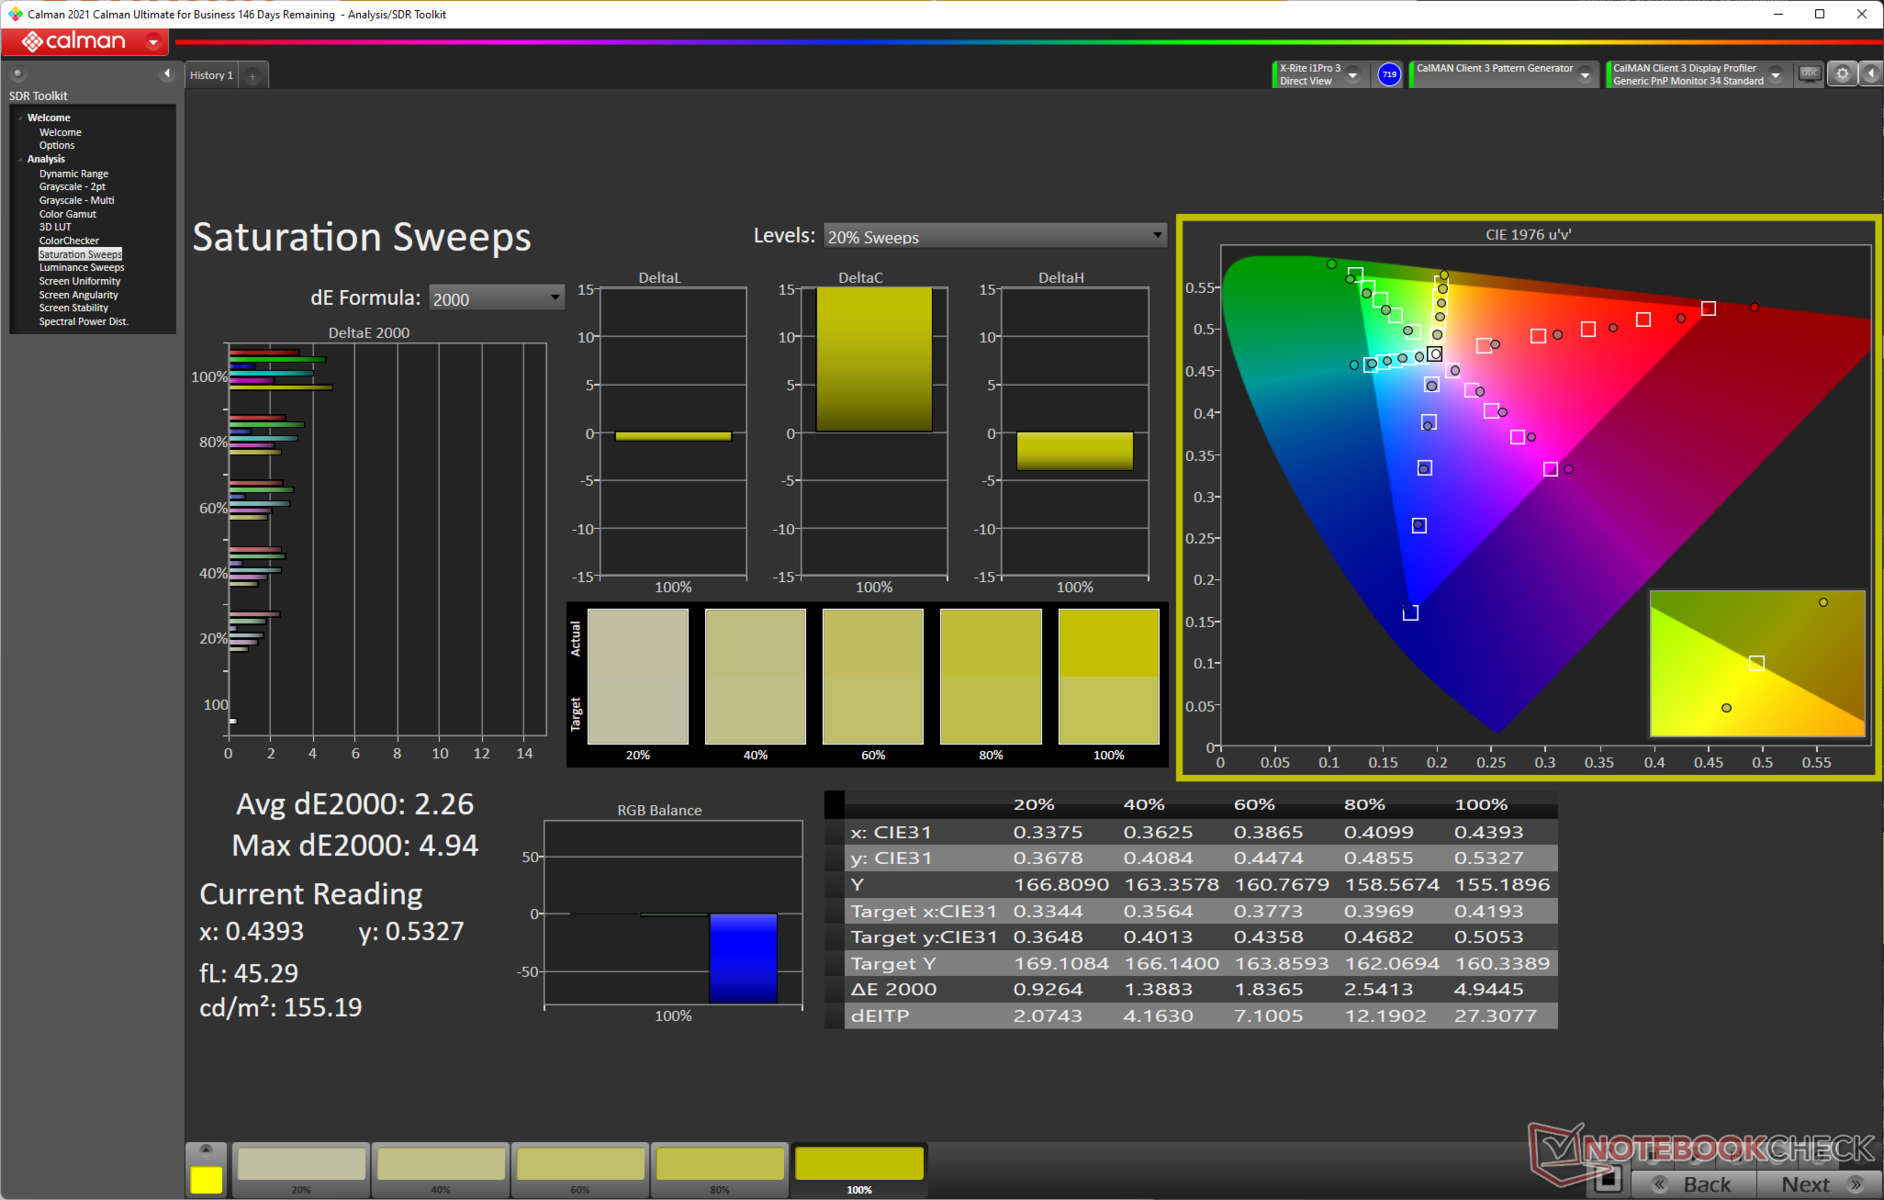
MSI hävdar att Crosshair 15:s panel kan täcka 100 % DCI-P3-färgrymd. I våra tester fann vi att den klarar nästan 95 % av Display P3, vilket borde väcka intresset hos innehållsskapare. Panelen täcker hela sRGB-färgområdet. Adobe RGB-täckningen är också ganska hygglig med nästan 85 %.
Vi konstaterar att täckningen av färgomfånget är jämförbar med Acer Nitro 5 och Acer Nitro 5 Aorus 15 XE5som också har samma Chi Mei N156KME-GNA-panel. Det är bra att se att tillverkarna äntligen överväger bra färgprestanda till dessa priser.
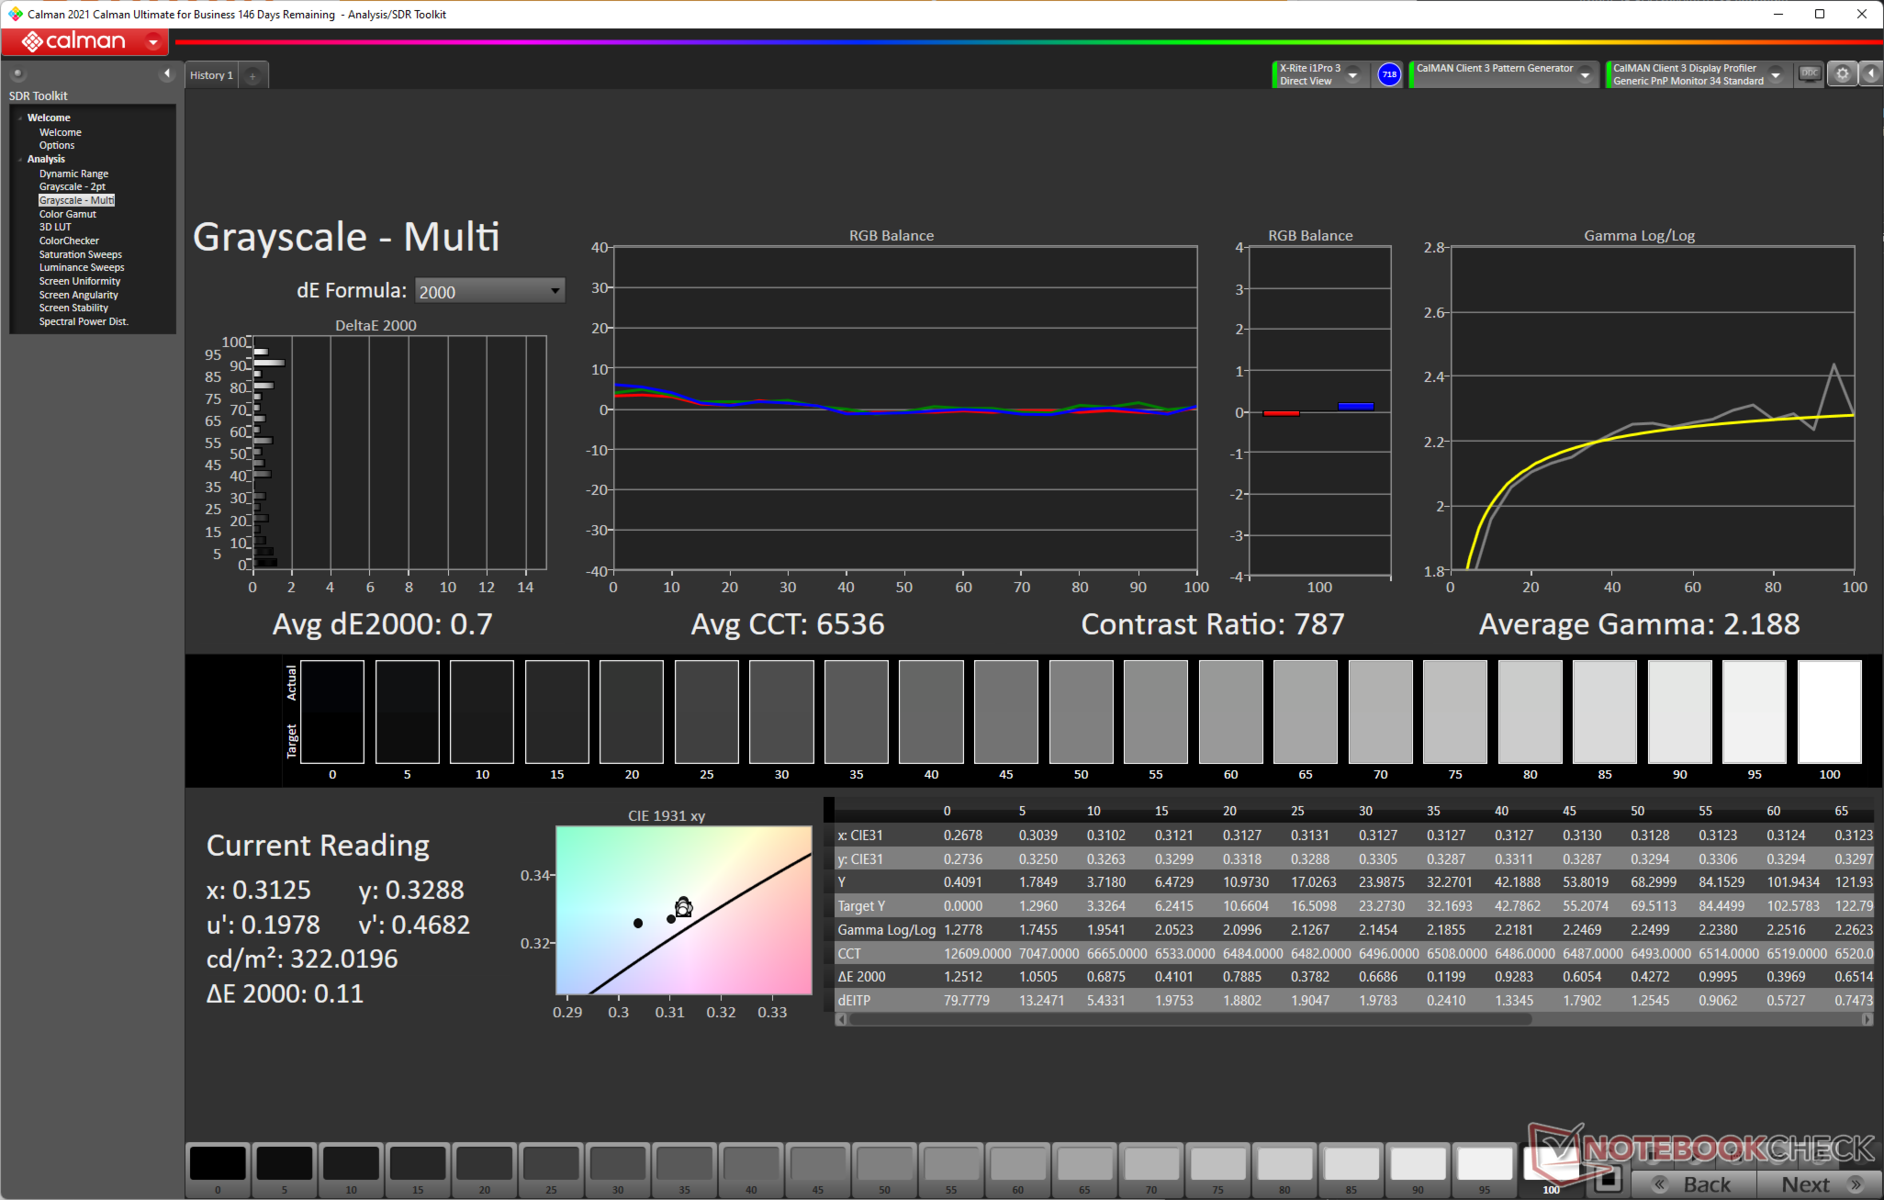
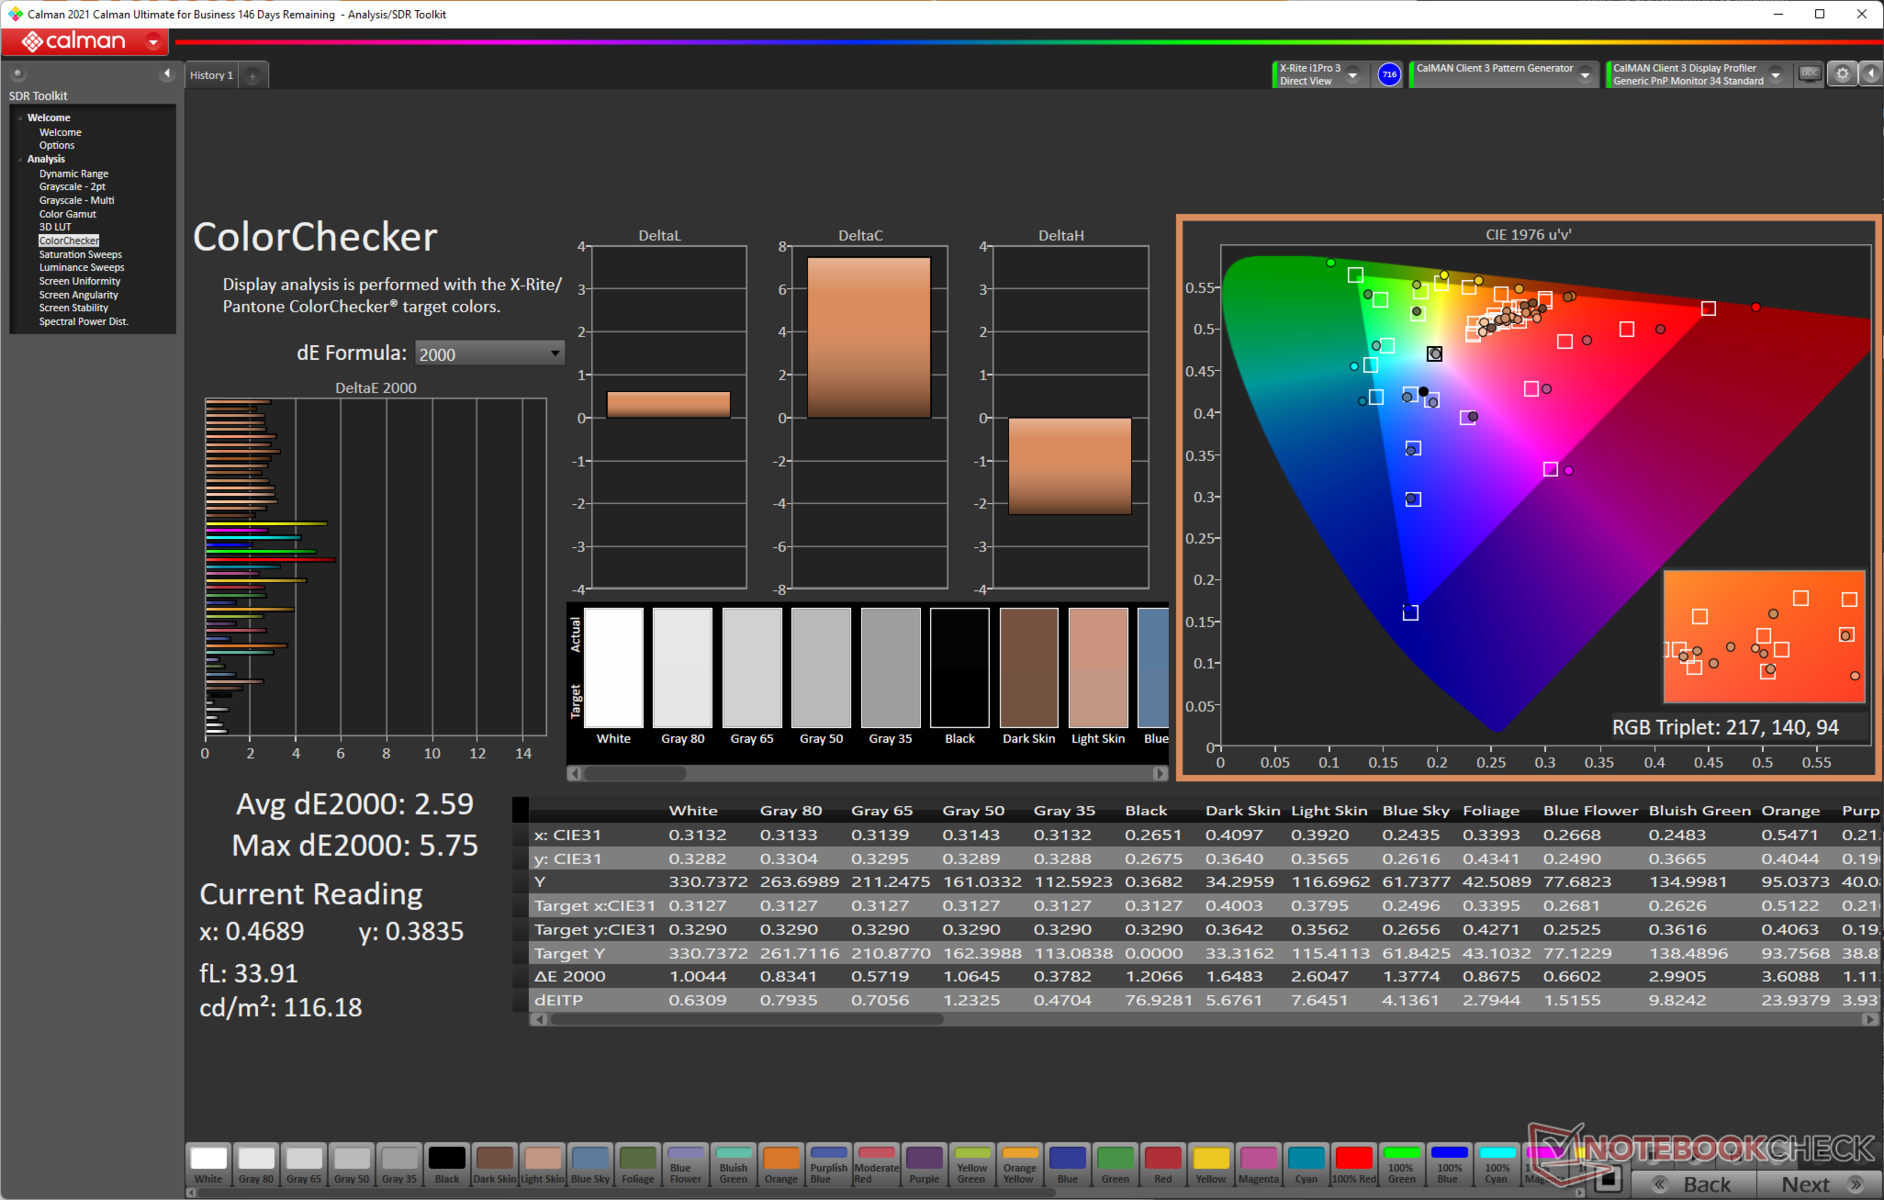
Färgnoggrannheten är definitivt tjänlig med en Delta E i gråskala på 3 och en genomsnittlig Delta E i ColorChecker på 3,71
Vår kalibreringsrutin med spektrofotometern X-rite i1Basic Pro 3 och Calman Ultimate färgkalibreringsprogramvara från Portrait Displays resulterar i en betydligt minskad Delta E i gråskala på 0,7 och en märkbar förbättring av den genomsnittliga Delta E till 2,59 i ColorChecker. Högre avvikelser ses med den röda färgen.
Den kalibrerade ICC-filen kan laddas ner från länken ovan.
Visa svarstider
| ↔ Svarstid svart till vitt | ||
|---|---|---|
| 8.04 ms ... stiga ↗ och falla ↘ kombinerat | ↗ 4.72 ms stiga | 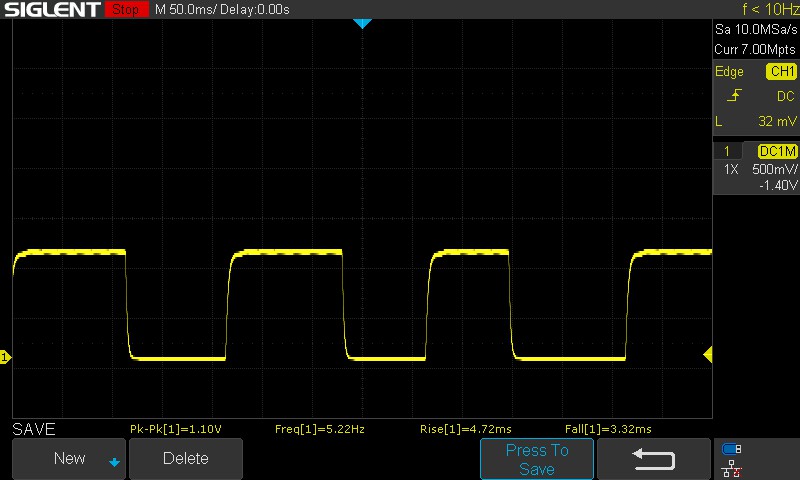 |
| ↘ 3.32 ms hösten | ||
| Skärmen visar snabba svarsfrekvenser i våra tester och bör passa för spel. I jämförelse sträcker sig alla testade enheter från 0.1 (minst) till 240 (maximalt) ms. » 24 % av alla enheter är bättre. Det betyder att den uppmätta svarstiden är bättre än genomsnittet av alla testade enheter (19.8 ms). | ||
| ↔ Svarstid 50 % grått till 80 % grått | ||
| 5.36 ms ... stiga ↗ och falla ↘ kombinerat | ↗ 2.71 ms stiga | 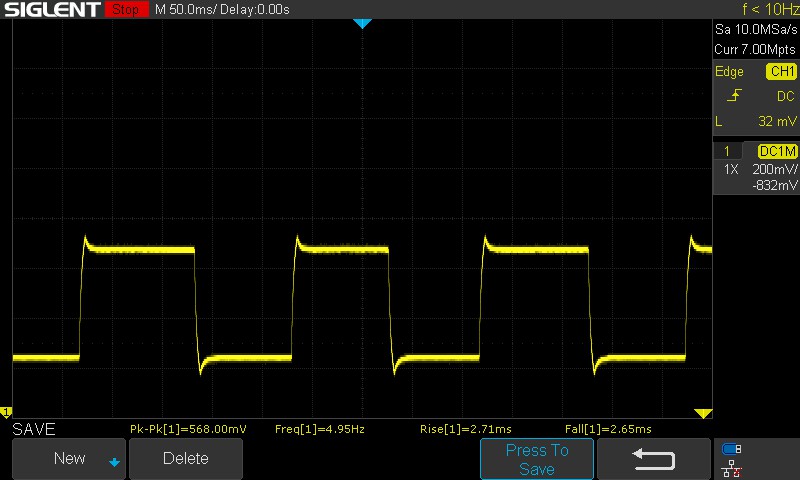 |
| ↘ 2.65 ms hösten | ||
| Skärmen visar väldigt snabba svarsfrekvenser i våra tester och borde vara mycket väl lämpad för fartfyllt spel. I jämförelse sträcker sig alla testade enheter från 0.165 (minst) till 636 (maximalt) ms. » 18 % av alla enheter är bättre. Det betyder att den uppmätta svarstiden är bättre än genomsnittet av alla testade enheter (31 ms). | ||
Svarstiderna är hyfsade, även om vi hade velat se lägre värden för övergången från 100 % svart till 100 % vitt
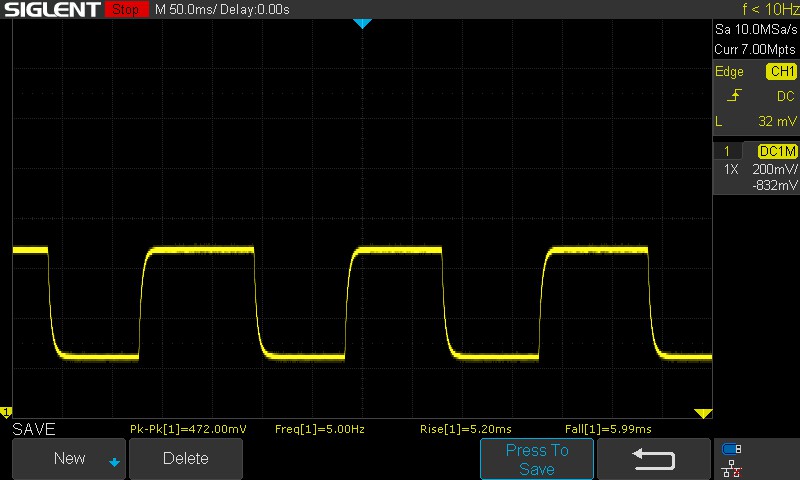
Panelen använder överstyrning som standard, vilket syns som ett "horn" i oscilloskopmönstret från 50 % grått till 80 % grått.
Utan överstyrning aktiverad kan detta värde öka till 11,19 ms.
Skärmflimmer / PWM (Puls-Width Modulation)
| Skärmflimmer / PWM upptäcktes inte | ≤ 100 % ljusstyrka inställning | 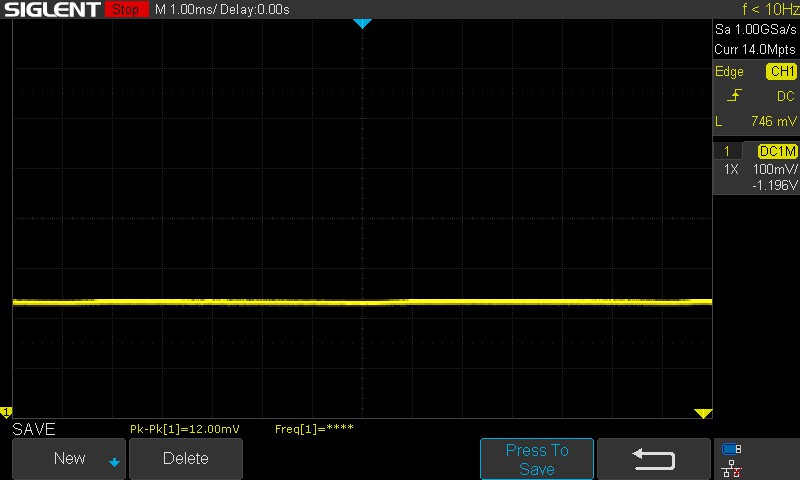 | |
Som jämförelse: 52 % av alla testade enheter använder inte PWM för att dämpa skärmen. Om PWM upptäcktes mättes ett medelvärde av 7757 (minst: 5 - maximum: 343500) Hz. | |||
Vi observerade inget PWM-flimmer vid alla testade ljusstyrkor, så det är en sak mindre att oroa sig för under långa arbetstimmar eller spelsessioner.
Kolla in vår artikel om "Varför PWM (Pulse Width Modulation) är en sådan huvudvärk", och även vår PWM-rankingtabell för jämförelser mellan alla granskade enheter.
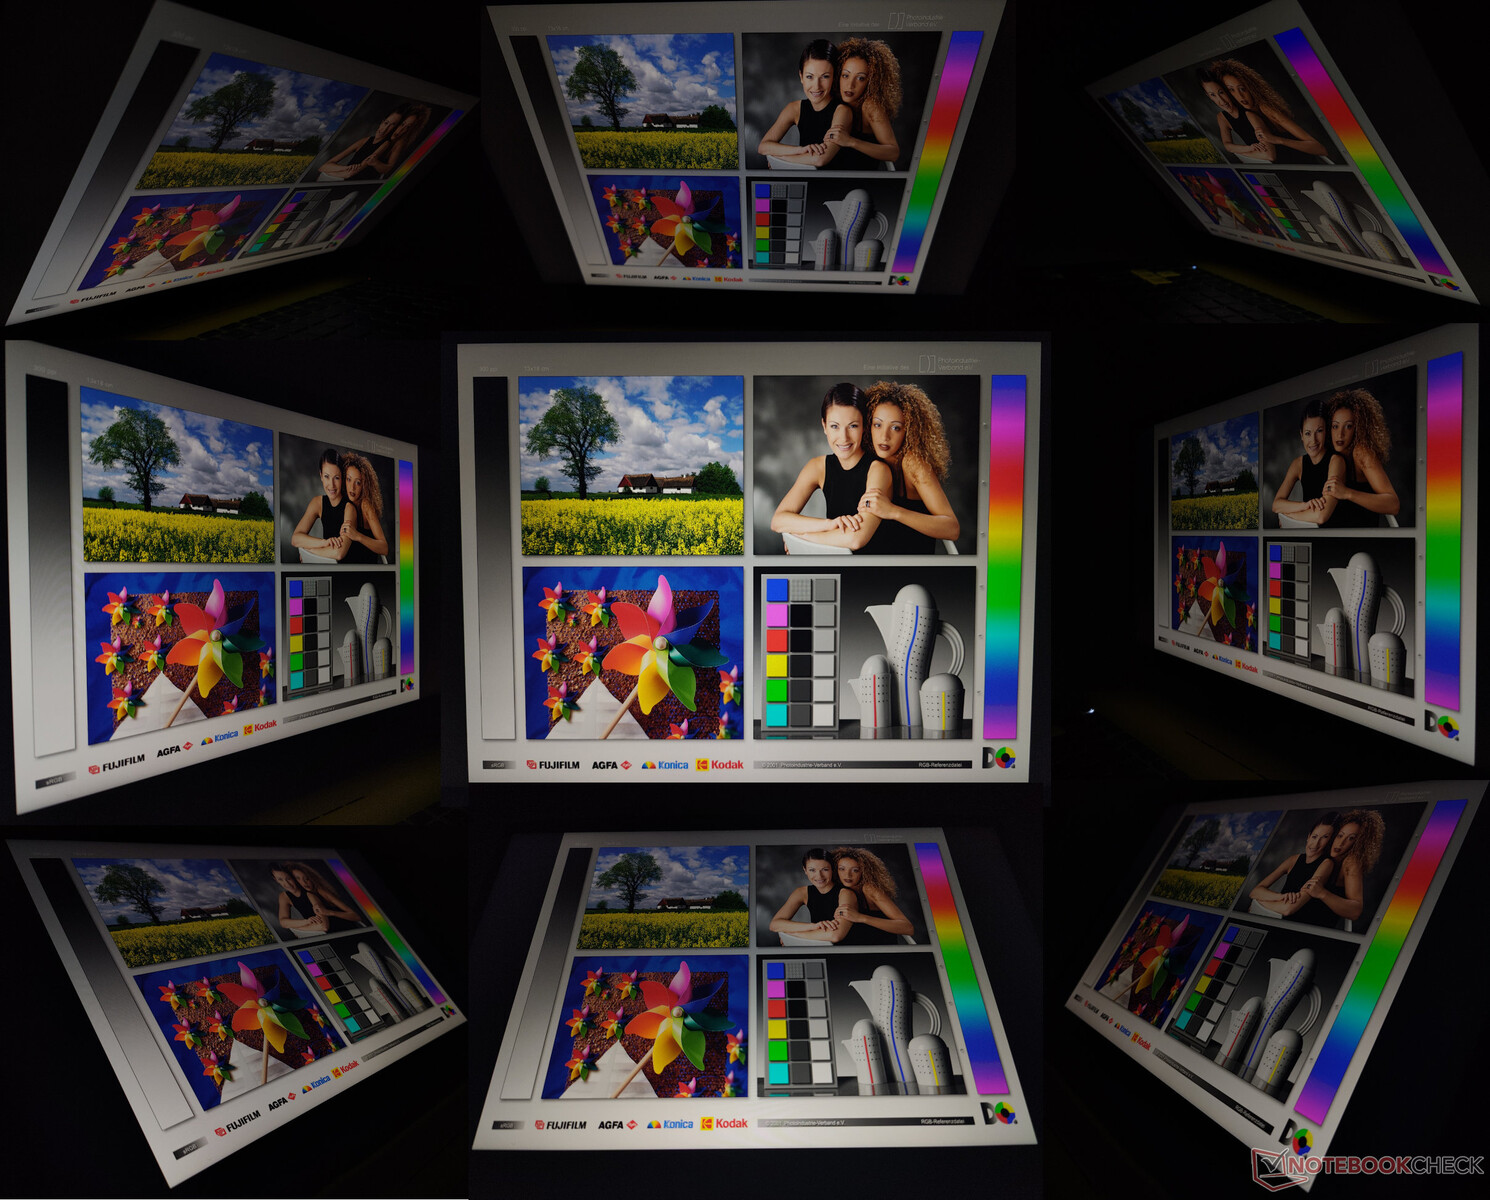
Utomhus kan du läsa så länge som det inte finns något solljus som faller direkt på skärmen. Visningsvinklarna är dock inte särskilt imponerande. Vi observerade förlust av ljusstyrka och färg vid extrema betraktningsvinklar.
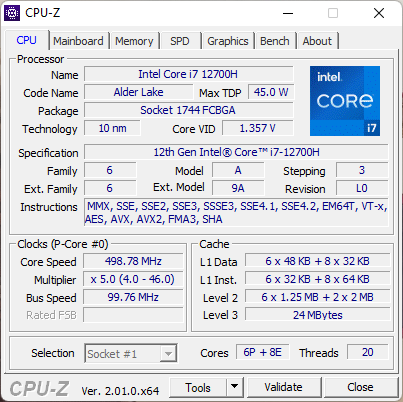
Prestanda: Inte den snabbaste Core i7-12700H vi sett
Vår Crosshair 15 R6E-enhet drivs av en Intel Core i7-12700H processor och en 140 W Nvidia GeForce RTX 3070 GPU för bärbar dator. Köpare har också möjlighet att konfigurera den bärbara datorn med en RTX 3060 GPU för bärbar dator eller CPU-alternativ upp till Alder Lake Core i9.
Provningsförhållanden
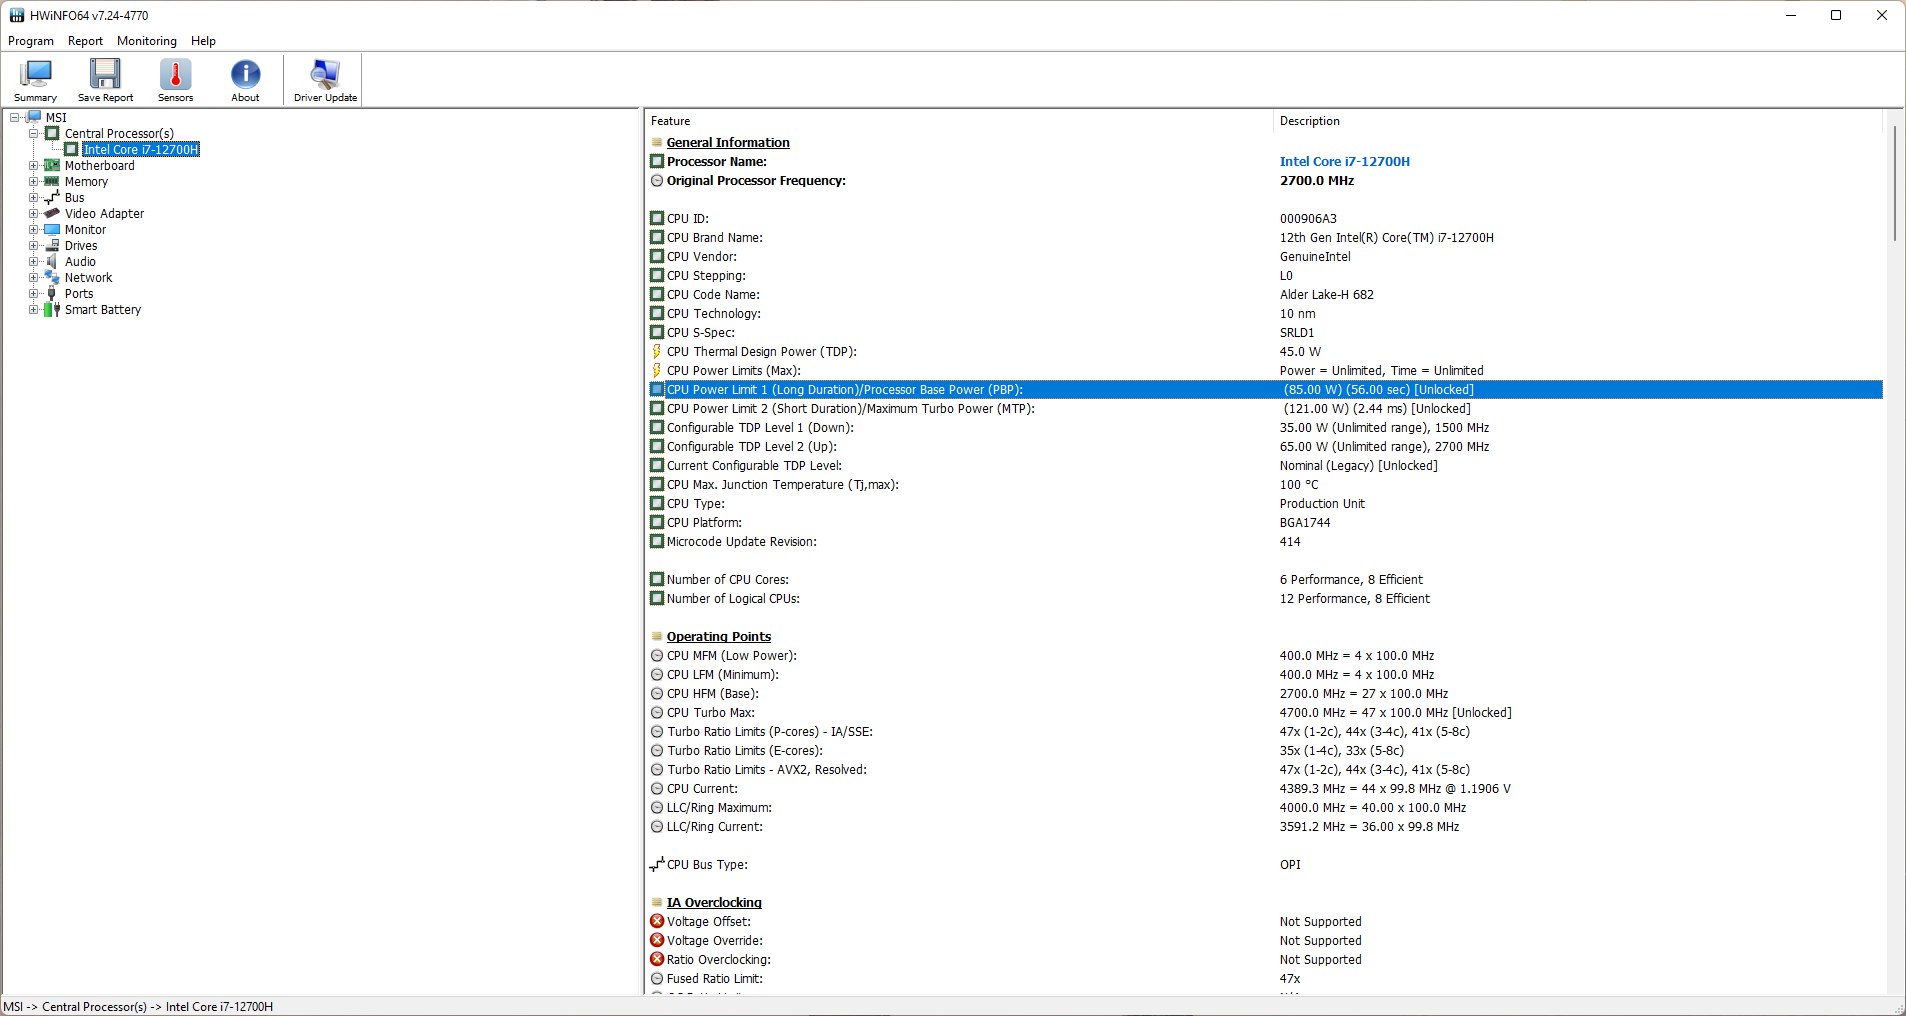
MSI Center erbjuder en enda kontaktpunkt för att justera olika prestandaparametrar för Crosshair 15 R6E. Vi använde förinställningen Extreme Performance för att låta Core i7-12700H visa sina muskler fullt ut. Detta gör det möjligt för processorn att arbeta med en uthållig PL1 på 85 W och en kortvarig PL2 på 121 W. Det finns inget MUX-omkopplingsalternativ tillgängligt för dGPU.
Alla tester utfördes i profilen Extreme Performance om inget annat anges.
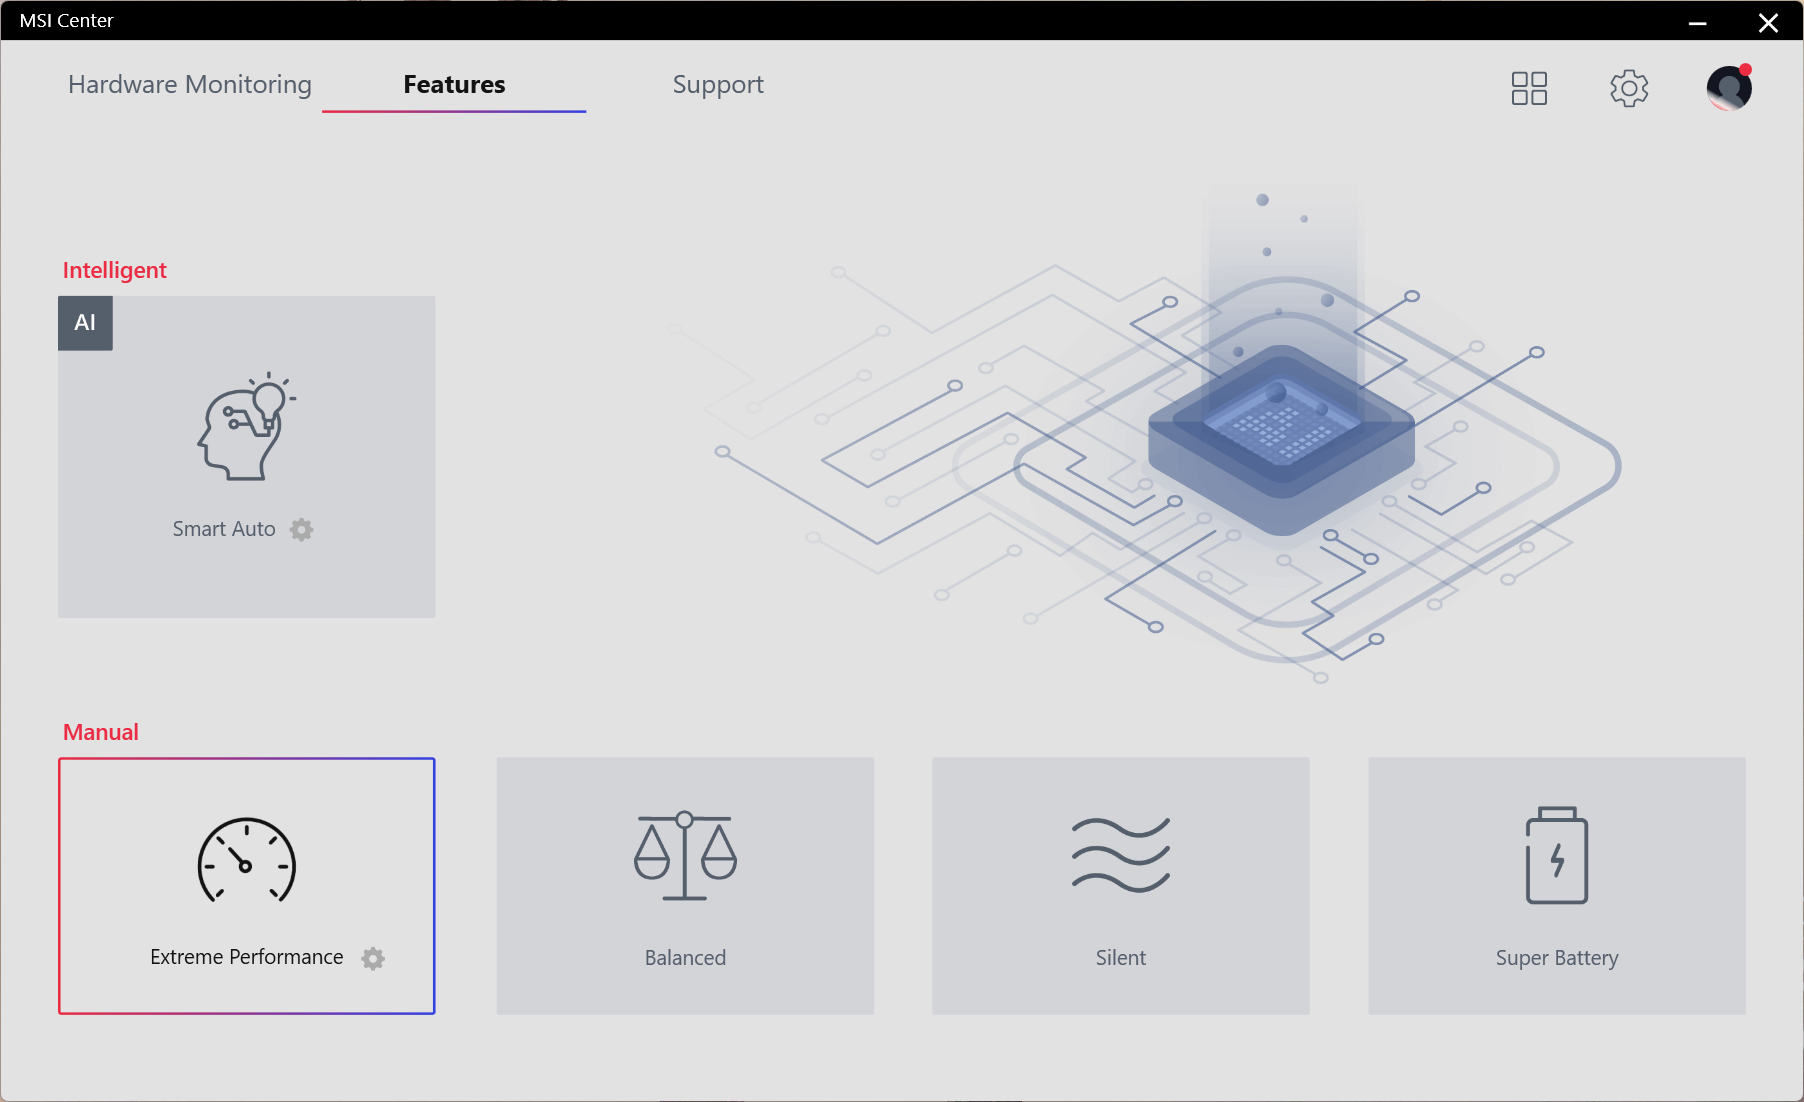
I tabellen nedan visas hur processorbaseffekt (PBP, PL1) och maximal turboeffekt (MTP, PL2) ändras med varje prestandaläge. Den balanserade profilen bör tillgodose de flesta behov. De som vill få ut maximal prestanda från Core i7-12700H kan välja läget Extreme Performance.
| Prestandaläge | PL1 (PBP) / Tau | PL2 (MTP) / Tau |
|---|---|---|
| Super Battery | 13 W / 56 s | 121 W / 2,44 ms |
| Tyst | 23 W / 56 s | 121 W / 2,44 ms |
| Balanserad | 38 W / 56 s | 121 W / 2,44 ms |
| Extrem prestanda | 85 W / 56 s | 121 W / 2,44 ms |
Processor
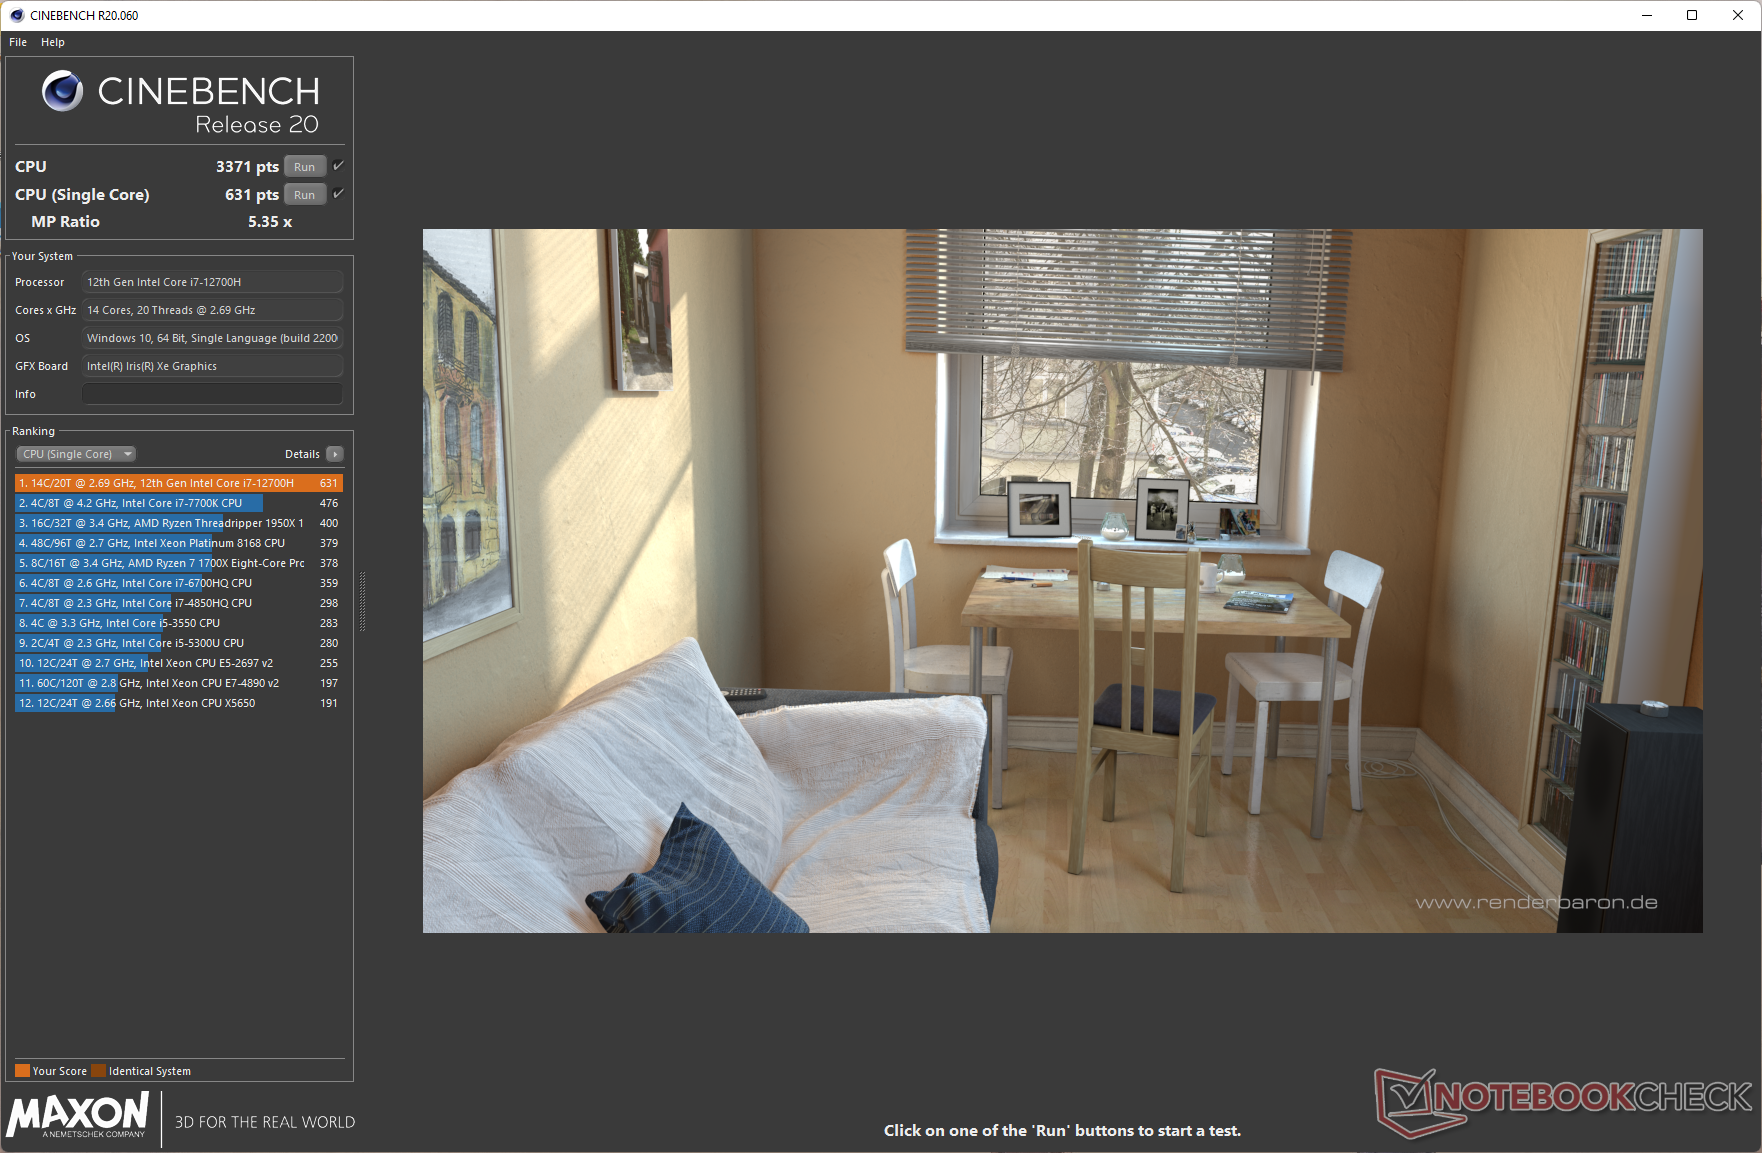
Core i7-12700H är en Alder Lake-H-processor med sex P-kärnor och åtta E-kärnor. Crosshair 15 R6E kan tillåta en hyfsad uthållig prestanda för den här processorn i vårt flerkärniga loop-test Cinebench R15, vilket matchar den för AMD Ryzen 9 6900HX i Schenker XMG Neo 15.
Detta är dock inte den snabbaste Core i7-12700H vi sett. Processorns implementering i MSI Stealth GS66 och Lenovo Legion 5i Pro 16 G7 får bättre poäng på grund av högre PL1- och PL2-värden.
Cinebench R15 Multi Loop
Följande diagram illustrerar hur CPU-parametrarna varierar under ett Cinebench R15-slingtest med flera kärnor. Eftersom 121 W PL2 förblir oförändrad i alla tre prestandalägena kan Core i7-12700H öka upp till nära 3,8 GHz om man tar hänsyn till både P- och E-kärnorna. P- och E-kärnorna kan individuellt öka upp till 4,6 GHz respektive 3,5 GHz.
Medan toppeffekten i paketet och kärnornas temperatur är mer eller mindre likartade i de testade prestandalägena, visar medelvärdena på tydliga skillnader. Den genomsnittliga paketeffekten under körningen är nära 75 W i läget Extreme Performance med temperaturer runt 84 °C. I inställningen Balanced ligger medeltemperaturerna kring 69 °C för en genomsnittlig paketeffekt på 40,5 W
Läget Silent har de lägsta utsläppen i jämförelsen med en genomsnittlig paketeffekt på knappt 25 W och en genomsnittlig kärntemperatur på nära 57 °C.
Även om prestandan för flera kärnor minskar med 15 % jämfört med Core i7-12700H i Lenovo Legion 5i Pro 16 G7, ligger Crosshair 15 R6E bara cirka 8 % efter när det gäller den totala CPU-prestandan.
Crosshair 15 R6E är 13 % snabbare än den Ryzen 9 6900HX-drivna XMG Neo 15, men den sistnämnda får 32 % högre prestanda i AIDA64-testerna.
Cinebench R20:s flerkärniga prestanda sjunker med hela 45 % på batteri, även om resultaten för enstaka kärnor endast minskar med 10 %.
Cinebench R23: Multi Core | Single Core
Cinebench R20: CPU (Multi Core) | CPU (Single Core)
Cinebench R15: CPU Multi 64Bit | CPU Single 64Bit
Blender: v2.79 BMW27 CPU
7-Zip 18.03: 7z b 4 | 7z b 4 -mmt1
Geekbench 5.5: Multi-Core | Single-Core
HWBOT x265 Benchmark v2.2: 4k Preset
LibreOffice : 20 Documents To PDF
R Benchmark 2.5: Overall mean
| CPU Performance rating | |
| Genomsnitt av klass Gaming | |
| Lenovo Legion 5 Pro 16 G7 i7 RTX 3070Ti | |
| MSI Pulse GL66 12UEK | |
| MSI Stealth GS66 12UGS | |
| Schenker XMG Neo 15 (i7-12700H, RTX 3080 Ti) | |
| MSI Crosshair 15 R6E B12UGZ-050 | |
| Acer Nitro 5 AN515-58-72QR | |
| Aorus 15 XE5 | |
| MSI Katana GF66 12UGS | |
| Genomsnitt Intel Core i7-12700H | |
| Asus TUF Dash F15 FX517ZR | |
| Schenker XMG Neo 15 (Ryzen 9 6900HX, RTX 3070 Ti) | |
| Cinebench R23 / Multi Core | |
| Genomsnitt av klass Gaming (10488 - 42661, n=107, senaste 2 åren) | |
| Lenovo Legion 5 Pro 16 G7 i7 RTX 3070Ti | |
| MSI Stealth GS66 12UGS | |
| MSI Pulse GL66 12UEK | |
| Schenker XMG Neo 15 (i7-12700H, RTX 3080 Ti) | |
| MSI Katana GF66 12UGS | |
| Acer Nitro 5 AN515-58-72QR | |
| MSI Crosshair 15 R6E B12UGZ-050 | |
| Aorus 15 XE5 | |
| Genomsnitt Intel Core i7-12700H (4032 - 19330, n=64) | |
| Schenker XMG Neo 15 (Ryzen 9 6900HX, RTX 3070 Ti) | |
| Asus TUF Dash F15 FX517ZR | |
| Cinebench R23 / Single Core | |
| Genomsnitt av klass Gaming (1166 - 2415, n=107, senaste 2 åren) | |
| MSI Pulse GL66 12UEK | |
| MSI Katana GF66 12UGS | |
| Lenovo Legion 5 Pro 16 G7 i7 RTX 3070Ti | |
| Acer Nitro 5 AN515-58-72QR | |
| Schenker XMG Neo 15 (i7-12700H, RTX 3080 Ti) | |
| Asus TUF Dash F15 FX517ZR | |
| MSI Stealth GS66 12UGS | |
| MSI Crosshair 15 R6E B12UGZ-050 | |
| Aorus 15 XE5 | |
| Genomsnitt Intel Core i7-12700H (778 - 1826, n=63) | |
| Schenker XMG Neo 15 (Ryzen 9 6900HX, RTX 3070 Ti) | |
| Cinebench R20 / CPU (Multi Core) | |
| Genomsnitt av klass Gaming (4029 - 16433, n=106, senaste 2 åren) | |
| Lenovo Legion 5 Pro 16 G7 i7 RTX 3070Ti | |
| Schenker XMG Neo 15 (i7-12700H, RTX 3080 Ti) | |
| MSI Pulse GL66 12UEK | |
| MSI Stealth GS66 12UGS | |
| Acer Nitro 5 AN515-58-72QR | |
| MSI Katana GF66 12UGS | |
| MSI Crosshair 15 R6E B12UGZ-050 | |
| Aorus 15 XE5 | |
| Genomsnitt Intel Core i7-12700H (1576 - 7407, n=64) | |
| Schenker XMG Neo 15 (Ryzen 9 6900HX, RTX 3070 Ti) | |
| Asus TUF Dash F15 FX517ZR | |
| Cinebench R20 / CPU (Single Core) | |
| Genomsnitt av klass Gaming (442 - 913, n=106, senaste 2 åren) | |
| MSI Pulse GL66 12UEK | |
| MSI Katana GF66 12UGS | |
| Lenovo Legion 5 Pro 16 G7 i7 RTX 3070Ti | |
| Asus TUF Dash F15 FX517ZR | |
| MSI Crosshair 15 R6E B12UGZ-050 | |
| Acer Nitro 5 AN515-58-72QR | |
| MSI Stealth GS66 12UGS | |
| Schenker XMG Neo 15 (i7-12700H, RTX 3080 Ti) | |
| Aorus 15 XE5 | |
| Genomsnitt Intel Core i7-12700H (300 - 704, n=64) | |
| Schenker XMG Neo 15 (Ryzen 9 6900HX, RTX 3070 Ti) | |
| Cinebench R15 / CPU Multi 64Bit | |
| Genomsnitt av klass Gaming (1578 - 6330, n=105, senaste 2 åren) | |
| Lenovo Legion 5 Pro 16 G7 i7 RTX 3070Ti | |
| MSI Stealth GS66 12UGS | |
| Acer Nitro 5 AN515-58-72QR | |
| MSI Pulse GL66 12UEK | |
| MSI Katana GF66 12UGS | |
| MSI Katana GF66 12UGS | |
| Schenker XMG Neo 15 (i7-12700H, RTX 3080 Ti) | |
| Aorus 15 XE5 | |
| MSI Crosshair 15 R6E B12UGZ-050 | |
| Genomsnitt Intel Core i7-12700H (1379 - 2916, n=70) | |
| Schenker XMG Neo 15 (Ryzen 9 6900HX, RTX 3070 Ti) | |
| Asus TUF Dash F15 FX517ZR | |
| Cinebench R15 / CPU Single 64Bit | |
| Genomsnitt av klass Gaming (188.8 - 350, n=106, senaste 2 åren) | |
| MSI Pulse GL66 12UEK | |
| Lenovo Legion 5 Pro 16 G7 i7 RTX 3070Ti | |
| MSI Katana GF66 12UGS | |
| MSI Katana GF66 12UGS | |
| Acer Nitro 5 AN515-58-72QR | |
| Schenker XMG Neo 15 (i7-12700H, RTX 3080 Ti) | |
| MSI Crosshair 15 R6E B12UGZ-050 | |
| Asus TUF Dash F15 FX517ZR | |
| MSI Stealth GS66 12UGS | |
| Aorus 15 XE5 | |
| Genomsnitt Intel Core i7-12700H (113 - 263, n=65) | |
| Schenker XMG Neo 15 (Ryzen 9 6900HX, RTX 3070 Ti) | |
| Blender / v2.79 BMW27 CPU | |
| MSI Katana GF66 12UGS | |
| Aorus 15 XE5 | |
| Asus TUF Dash F15 FX517ZR | |
| Genomsnitt Intel Core i7-12700H (168 - 732, n=63) | |
| Schenker XMG Neo 15 (Ryzen 9 6900HX, RTX 3070 Ti) | |
| Acer Nitro 5 AN515-58-72QR | |
| MSI Crosshair 15 R6E B12UGZ-050 | |
| MSI Stealth GS66 12UGS | |
| MSI Pulse GL66 12UEK | |
| Schenker XMG Neo 15 (i7-12700H, RTX 3080 Ti) | |
| Lenovo Legion 5 Pro 16 G7 i7 RTX 3070Ti | |
| Genomsnitt av klass Gaming (79 - 330, n=104, senaste 2 åren) | |
| 7-Zip 18.03 / 7z b 4 -mmt1 | |
| Genomsnitt av klass Gaming (4199 - 7436, n=105, senaste 2 åren) | |
| MSI Pulse GL66 12UEK | |
| Schenker XMG Neo 15 (i7-12700H, RTX 3080 Ti) | |
| MSI Katana GF66 12UGS | |
| Lenovo Legion 5 Pro 16 G7 i7 RTX 3070Ti | |
| Schenker XMG Neo 15 (Ryzen 9 6900HX, RTX 3070 Ti) | |
| Acer Nitro 5 AN515-58-72QR | |
| MSI Stealth GS66 12UGS | |
| Asus TUF Dash F15 FX517ZR | |
| MSI Crosshair 15 R6E B12UGZ-050 | |
| Aorus 15 XE5 | |
| Genomsnitt Intel Core i7-12700H (2743 - 5972, n=63) | |
| Geekbench 5.5 / Multi-Core | |
| Genomsnitt av klass Gaming (6460 - 28263, n=105, senaste 2 åren) | |
| Schenker XMG Neo 15 (i7-12700H, RTX 3080 Ti) | |
| MSI Stealth GS66 12UGS | |
| Lenovo Legion 5 Pro 16 G7 i7 RTX 3070Ti | |
| Aorus 15 XE5 | |
| MSI Pulse GL66 12UEK | |
| MSI Katana GF66 12UGS | |
| Genomsnitt Intel Core i7-12700H (5144 - 13745, n=64) | |
| MSI Crosshair 15 R6E B12UGZ-050 | |
| Asus TUF Dash F15 FX517ZR | |
| Schenker XMG Neo 15 (Ryzen 9 6900HX, RTX 3070 Ti) | |
| Acer Nitro 5 AN515-58-72QR | |
| Geekbench 5.5 / Single-Core | |
| Genomsnitt av klass Gaming (986 - 2474, n=105, senaste 2 åren) | |
| MSI Pulse GL66 12UEK | |
| MSI Crosshair 15 R6E B12UGZ-050 | |
| Asus TUF Dash F15 FX517ZR | |
| Acer Nitro 5 AN515-58-72QR | |
| MSI Katana GF66 12UGS | |
| Schenker XMG Neo 15 (i7-12700H, RTX 3080 Ti) | |
| Lenovo Legion 5 Pro 16 G7 i7 RTX 3070Ti | |
| Genomsnitt Intel Core i7-12700H (803 - 1851, n=64) | |
| Aorus 15 XE5 | |
| MSI Stealth GS66 12UGS | |
| Schenker XMG Neo 15 (Ryzen 9 6900HX, RTX 3070 Ti) | |
| HWBOT x265 Benchmark v2.2 / 4k Preset | |
| Genomsnitt av klass Gaming (11.5 - 44.4, n=105, senaste 2 åren) | |
| Lenovo Legion 5 Pro 16 G7 i7 RTX 3070Ti | |
| Schenker XMG Neo 15 (i7-12700H, RTX 3080 Ti) | |
| MSI Stealth GS66 12UGS | |
| MSI Pulse GL66 12UEK | |
| Acer Nitro 5 AN515-58-72QR | |
| MSI Crosshair 15 R6E B12UGZ-050 | |
| Schenker XMG Neo 15 (Ryzen 9 6900HX, RTX 3070 Ti) | |
| Asus TUF Dash F15 FX517ZR | |
| Genomsnitt Intel Core i7-12700H (4.67 - 21.8, n=64) | |
| Aorus 15 XE5 | |
| MSI Katana GF66 12UGS | |
| LibreOffice / 20 Documents To PDF | |
| Schenker XMG Neo 15 (Ryzen 9 6900HX, RTX 3070 Ti) | |
| Genomsnitt av klass Gaming (33.2 - 88.8, n=105, senaste 2 åren) | |
| Schenker XMG Neo 15 (i7-12700H, RTX 3080 Ti) | |
| Genomsnitt Intel Core i7-12700H (34.2 - 95.3, n=63) | |
| MSI Crosshair 15 R6E B12UGZ-050 | |
| Lenovo Legion 5 Pro 16 G7 i7 RTX 3070Ti | |
| MSI Pulse GL66 12UEK | |
| Acer Nitro 5 AN515-58-72QR | |
| MSI Stealth GS66 12UGS | |
| Asus TUF Dash F15 FX517ZR | |
| Aorus 15 XE5 | |
| MSI Katana GF66 12UGS | |
| R Benchmark 2.5 / Overall mean | |
| Schenker XMG Neo 15 (Ryzen 9 6900HX, RTX 3070 Ti) | |
| Genomsnitt Intel Core i7-12700H (0.4441 - 1.052, n=63) | |
| Aorus 15 XE5 | |
| Asus TUF Dash F15 FX517ZR | |
| Schenker XMG Neo 15 (i7-12700H, RTX 3080 Ti) | |
| Acer Nitro 5 AN515-58-72QR | |
| MSI Katana GF66 12UGS | |
| Lenovo Legion 5 Pro 16 G7 i7 RTX 3070Ti | |
| MSI Stealth GS66 12UGS | |
| MSI Crosshair 15 R6E B12UGZ-050 | |
| Genomsnitt av klass Gaming (0.3439 - 0.759, n=106, senaste 2 åren) | |
| MSI Pulse GL66 12UEK | |
* ... mindre är bättre
AIDA64: FP32 Ray-Trace | FPU Julia | CPU SHA3 | CPU Queen | FPU SinJulia | FPU Mandel | CPU AES | CPU ZLib | FP64 Ray-Trace | CPU PhotoWorxx
| Performance rating | |
| Genomsnitt av klass Gaming | |
| Schenker XMG Neo 15 (Ryzen 9 6900HX, RTX 3070 Ti) | |
| Aorus 15 XE5 | |
| Lenovo Legion 5 Pro 16 G7 i7 RTX 3070Ti | |
| MSI Stealth GS66 12UGS | |
| Asus TUF Dash F15 FX517ZR | |
| Genomsnitt Intel Core i7-12700H | |
| MSI Pulse GL66 12UEK | |
| Schenker XMG Neo 15 (i7-12700H, RTX 3080 Ti) | |
| MSI Katana GF66 12UGS | |
| MSI Crosshair 15 R6E B12UGZ-050 | |
| Acer Nitro 5 AN515-58-72QR | |
| AIDA64 / FP32 Ray-Trace | |
| Genomsnitt av klass Gaming (10227 - 85542, n=105, senaste 2 åren) | |
| Schenker XMG Neo 15 (Ryzen 9 6900HX, RTX 3070 Ti) | |
| Asus TUF Dash F15 FX517ZR | |
| Aorus 15 XE5 | |
| Genomsnitt Intel Core i7-12700H (2585 - 17957, n=64) | |
| Lenovo Legion 5 Pro 16 G7 i7 RTX 3070Ti | |
| Schenker XMG Neo 15 (i7-12700H, RTX 3080 Ti) | |
| MSI Stealth GS66 12UGS | |
| MSI Pulse GL66 12UEK | |
| MSI Katana GF66 12UGS | |
| MSI Crosshair 15 R6E B12UGZ-050 | |
| Acer Nitro 5 AN515-58-72QR | |
| AIDA64 / FP64 Ray-Trace | |
| Genomsnitt av klass Gaming (5509 - 45446, n=105, senaste 2 åren) | |
| Schenker XMG Neo 15 (Ryzen 9 6900HX, RTX 3070 Ti) | |
| Asus TUF Dash F15 FX517ZR | |
| Aorus 15 XE5 | |
| Genomsnitt Intel Core i7-12700H (1437 - 9692, n=64) | |
| Lenovo Legion 5 Pro 16 G7 i7 RTX 3070Ti | |
| Schenker XMG Neo 15 (i7-12700H, RTX 3080 Ti) | |
| MSI Stealth GS66 12UGS | |
| MSI Pulse GL66 12UEK | |
| Acer Nitro 5 AN515-58-72QR | |
| MSI Katana GF66 12UGS | |
| MSI Crosshair 15 R6E B12UGZ-050 | |
| AIDA64 / CPU PhotoWorxx | |
| Genomsnitt av klass Gaming (12271 - 89891, n=105, senaste 2 åren) | |
| Schenker XMG Neo 15 (i7-12700H, RTX 3080 Ti) | |
| MSI Stealth GS66 12UGS | |
| Aorus 15 XE5 | |
| Asus TUF Dash F15 FX517ZR | |
| Lenovo Legion 5 Pro 16 G7 i7 RTX 3070Ti | |
| Genomsnitt Intel Core i7-12700H (12863 - 52207, n=64) | |
| Schenker XMG Neo 15 (Ryzen 9 6900HX, RTX 3070 Ti) | |
| MSI Katana GF66 12UGS | |
| MSI Pulse GL66 12UEK | |
| MSI Crosshair 15 R6E B12UGZ-050 | |
| Acer Nitro 5 AN515-58-72QR | |
Kolla in vår dedikerade Intel Core i7-12700H sida för mer information och jämförelser av prestanda.
Systemets prestanda
Konkurrerande enheter kan slå Crosshair 15 R6E i PCMark 10-poängen, men inte med mycket. I CrossMark får Crosshair 15 R6E en mycket bättre prestanda
I AIDA64-testerna ser man att Crosshair 15 R6E släpar efter andra bärbara datorer med Core i7-12700H-drift. Vi upplevde inga särskilda prestandaproblem med dagliga produktivitetsuppgifter eller webbsurfning
CrossMark: Overall | Productivity | Creativity | Responsiveness
| PCMark 10 / Score | |
| Genomsnitt av klass Gaming (5828 - 12414, n=93, senaste 2 åren) | |
| Aorus 15 XE5 | |
| MSI Stealth GS66 12UGS | |
| Schenker XMG Neo 15 (i7-12700H, RTX 3080 Ti) | |
| Lenovo Legion 5 Pro 16 G7 i7 RTX 3070Ti | |
| MSI Katana GF66 12UGS | |
| Genomsnitt Intel Core i7-12700H, NVIDIA GeForce RTX 3070 Laptop GPU (7082 - 7647, n=2) | |
| Schenker XMG Neo 15 (Ryzen 9 6900HX, RTX 3070 Ti) | |
| MSI Pulse GL66 12UEK | |
| MSI Crosshair 15 R6E B12UGZ-050 | |
| Acer Nitro 5 AN515-58-72QR | |
| Asus TUF Dash F15 FX517ZR | |
| PCMark 10 / Essentials | |
| MSI Stealth GS66 12UGS | |
| Aorus 15 XE5 | |
| Genomsnitt av klass Gaming (8810 - 11935, n=97, senaste 2 åren) | |
| Schenker XMG Neo 15 (i7-12700H, RTX 3080 Ti) | |
| Genomsnitt Intel Core i7-12700H, NVIDIA GeForce RTX 3070 Laptop GPU (10076 - 10926, n=2) | |
| Schenker XMG Neo 15 (Ryzen 9 6900HX, RTX 3070 Ti) | |
| MSI Pulse GL66 12UEK | |
| MSI Katana GF66 12UGS | |
| MSI Crosshair 15 R6E B12UGZ-050 | |
| Asus TUF Dash F15 FX517ZR | |
| Lenovo Legion 5 Pro 16 G7 i7 RTX 3070Ti | |
| Acer Nitro 5 AN515-58-72QR | |
| PCMark 10 / Productivity | |
| Genomsnitt av klass Gaming (6845 - 25323, n=95, senaste 2 åren) | |
| Aorus 15 XE5 | |
| MSI Katana GF66 12UGS | |
| Lenovo Legion 5 Pro 16 G7 i7 RTX 3070Ti | |
| MSI Pulse GL66 12UEK | |
| Genomsnitt Intel Core i7-12700H, NVIDIA GeForce RTX 3070 Laptop GPU (9460 - 9877, n=2) | |
| Schenker XMG Neo 15 (Ryzen 9 6900HX, RTX 3070 Ti) | |
| Asus TUF Dash F15 FX517ZR | |
| MSI Stealth GS66 12UGS | |
| MSI Crosshair 15 R6E B12UGZ-050 | |
| Schenker XMG Neo 15 (i7-12700H, RTX 3080 Ti) | |
| Acer Nitro 5 AN515-58-72QR | |
| PCMark 10 / Digital Content Creation | |
| Genomsnitt av klass Gaming (7602 - 19954, n=95, senaste 2 åren) | |
| Schenker XMG Neo 15 (i7-12700H, RTX 3080 Ti) | |
| Lenovo Legion 5 Pro 16 G7 i7 RTX 3070Ti | |
| MSI Stealth GS66 12UGS | |
| Aorus 15 XE5 | |
| MSI Katana GF66 12UGS | |
| Genomsnitt Intel Core i7-12700H, NVIDIA GeForce RTX 3070 Laptop GPU (10113 - 11245, n=2) | |
| Acer Nitro 5 AN515-58-72QR | |
| MSI Crosshair 15 R6E B12UGZ-050 | |
| Schenker XMG Neo 15 (Ryzen 9 6900HX, RTX 3070 Ti) | |
| MSI Pulse GL66 12UEK | |
| Asus TUF Dash F15 FX517ZR | |
| CrossMark / Overall | |
| MSI Pulse GL66 12UEK | |
| MSI Crosshair 15 R6E B12UGZ-050 | |
| Genomsnitt av klass Gaming (1366 - 2409, n=94, senaste 2 åren) | |
| Lenovo Legion 5 Pro 16 G7 i7 RTX 3070Ti | |
| Aorus 15 XE5 | |
| MSI Katana GF66 12UGS | |
| Genomsnitt Intel Core i7-12700H, NVIDIA GeForce RTX 3070 Laptop GPU (1844 - 2003, n=2) | |
| Asus TUF Dash F15 FX517ZR | |
| Schenker XMG Neo 15 (i7-12700H, RTX 3080 Ti) | |
| Acer Nitro 5 AN515-58-72QR | |
| Schenker XMG Neo 15 (Ryzen 9 6900HX, RTX 3070 Ti) | |
| CrossMark / Productivity | |
| MSI Pulse GL66 12UEK | |
| MSI Crosshair 15 R6E B12UGZ-050 | |
| MSI Katana GF66 12UGS | |
| Aorus 15 XE5 | |
| Genomsnitt Intel Core i7-12700H, NVIDIA GeForce RTX 3070 Laptop GPU (1785 - 1971, n=2) | |
| Lenovo Legion 5 Pro 16 G7 i7 RTX 3070Ti | |
| Genomsnitt av klass Gaming (1386 - 2254, n=94, senaste 2 åren) | |
| Acer Nitro 5 AN515-58-72QR | |
| Asus TUF Dash F15 FX517ZR | |
| Schenker XMG Neo 15 (i7-12700H, RTX 3080 Ti) | |
| Schenker XMG Neo 15 (Ryzen 9 6900HX, RTX 3070 Ti) | |
| CrossMark / Creativity | |
| Genomsnitt av klass Gaming (1343 - 2786, n=94, senaste 2 åren) | |
| MSI Pulse GL66 12UEK | |
| Lenovo Legion 5 Pro 16 G7 i7 RTX 3070Ti | |
| Schenker XMG Neo 15 (i7-12700H, RTX 3080 Ti) | |
| Asus TUF Dash F15 FX517ZR | |
| Aorus 15 XE5 | |
| MSI Crosshair 15 R6E B12UGZ-050 | |
| Genomsnitt Intel Core i7-12700H, NVIDIA GeForce RTX 3070 Laptop GPU (1912 - 1979, n=2) | |
| MSI Katana GF66 12UGS | |
| Acer Nitro 5 AN515-58-72QR | |
| Schenker XMG Neo 15 (Ryzen 9 6900HX, RTX 3070 Ti) | |
| CrossMark / Responsiveness | |
| MSI Pulse GL66 12UEK | |
| MSI Crosshair 15 R6E B12UGZ-050 | |
| MSI Katana GF66 12UGS | |
| Aorus 15 XE5 | |
| Genomsnitt Intel Core i7-12700H, NVIDIA GeForce RTX 3070 Laptop GPU (1824 - 2182, n=2) | |
| Lenovo Legion 5 Pro 16 G7 i7 RTX 3070Ti | |
| Genomsnitt av klass Gaming (1226 - 2334, n=94, senaste 2 åren) | |
| Acer Nitro 5 AN515-58-72QR | |
| Asus TUF Dash F15 FX517ZR | |
| Schenker XMG Neo 15 (i7-12700H, RTX 3080 Ti) | |
| Schenker XMG Neo 15 (Ryzen 9 6900HX, RTX 3070 Ti) | |
| PCMark 8 Home Score Accelerated v2 | 6083 poäng | |
| PCMark 8 Creative Score Accelerated v2 | 9960 poäng | |
| PCMark 8 Work Score Accelerated v2 | 6346 poäng | |
| PCMark 10 Score | 7082 poäng | |
Hjälp | ||
| AIDA64 / Memory Latency | |
| Genomsnitt av klass Gaming (75.3 - 259, n=105, senaste 2 åren) | |
| Lenovo Legion 5 Pro 16 G7 i7 RTX 3070Ti | |
| MSI Katana GF66 12UGS | |
| Asus TUF Dash F15 FX517ZR | |
| Aorus 15 XE5 | |
| MSI Stealth GS66 12UGS | |
| MSI Crosshair 15 R6E B12UGZ-050 | |
| MSI Pulse GL66 12UEK | |
| Schenker XMG Neo 15 (Ryzen 9 6900HX, RTX 3070 Ti) | |
| Genomsnitt Intel Core i7-12700H (76.2 - 133.9, n=62) | |
| Acer Nitro 5 AN515-58-72QR | |
| Acer Nitro 5 AN515-58-72QR | |
* ... mindre är bättre
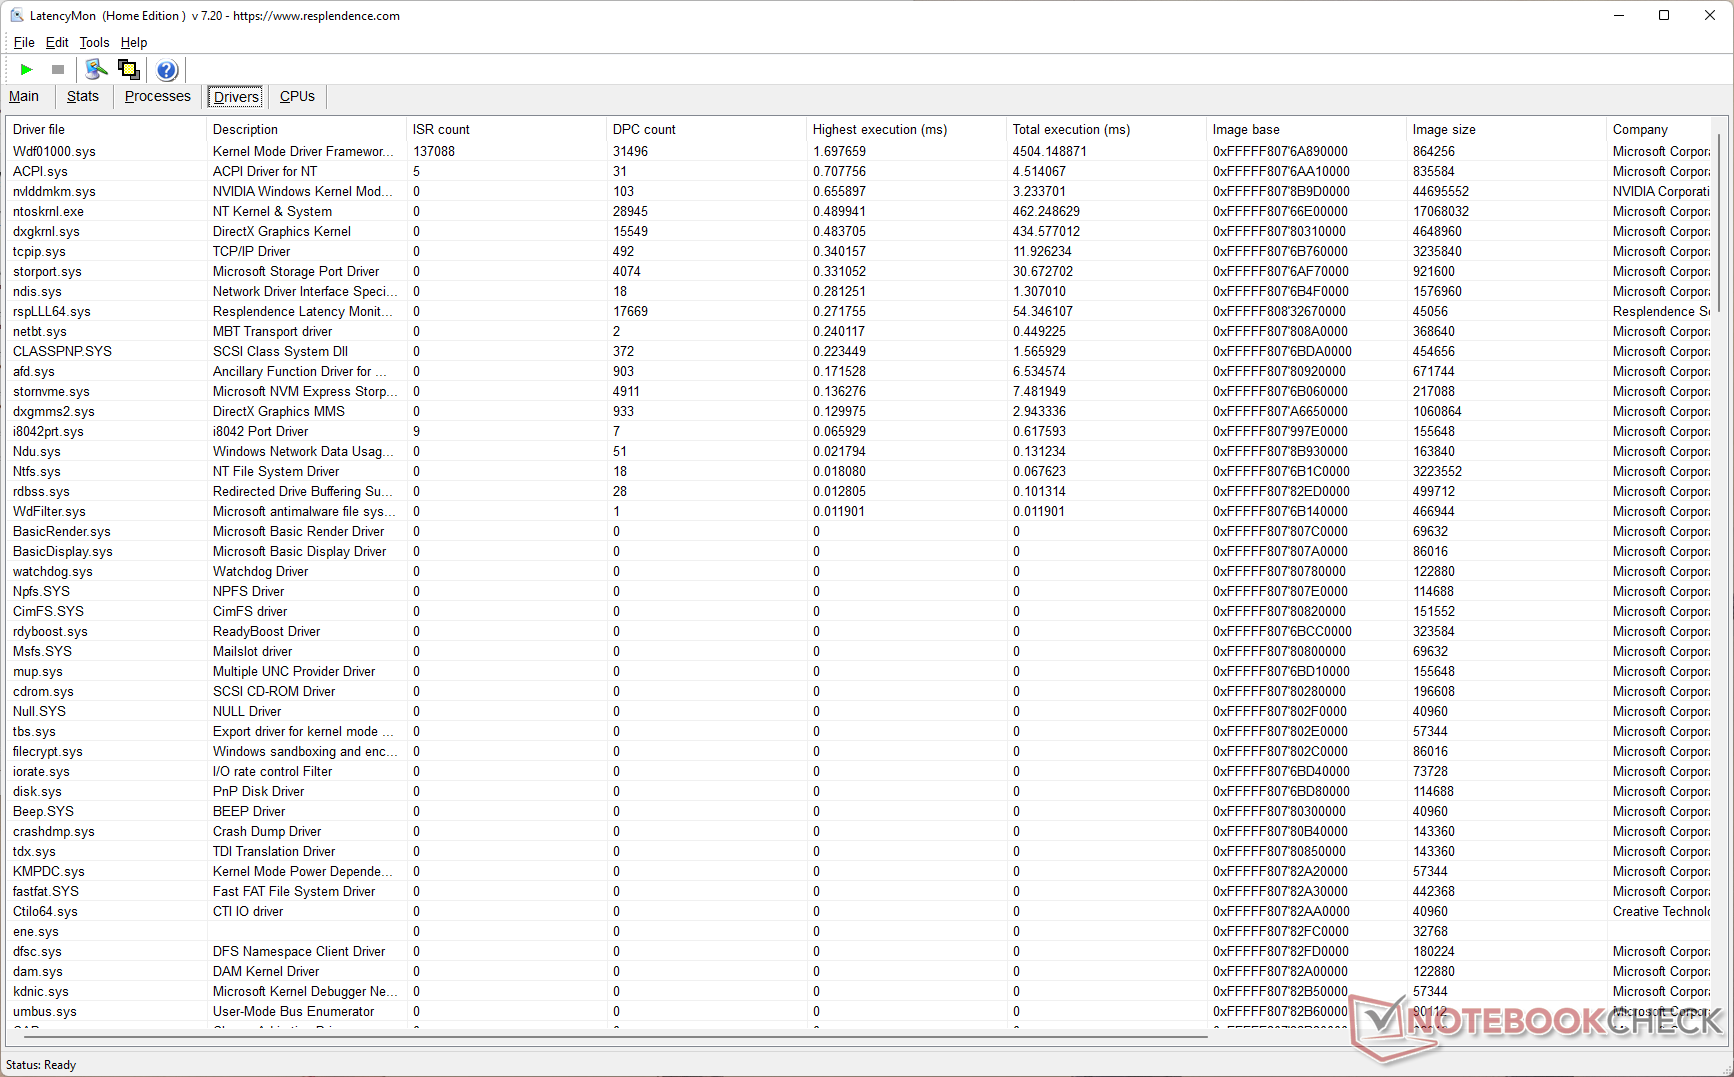
DPC-latenstid
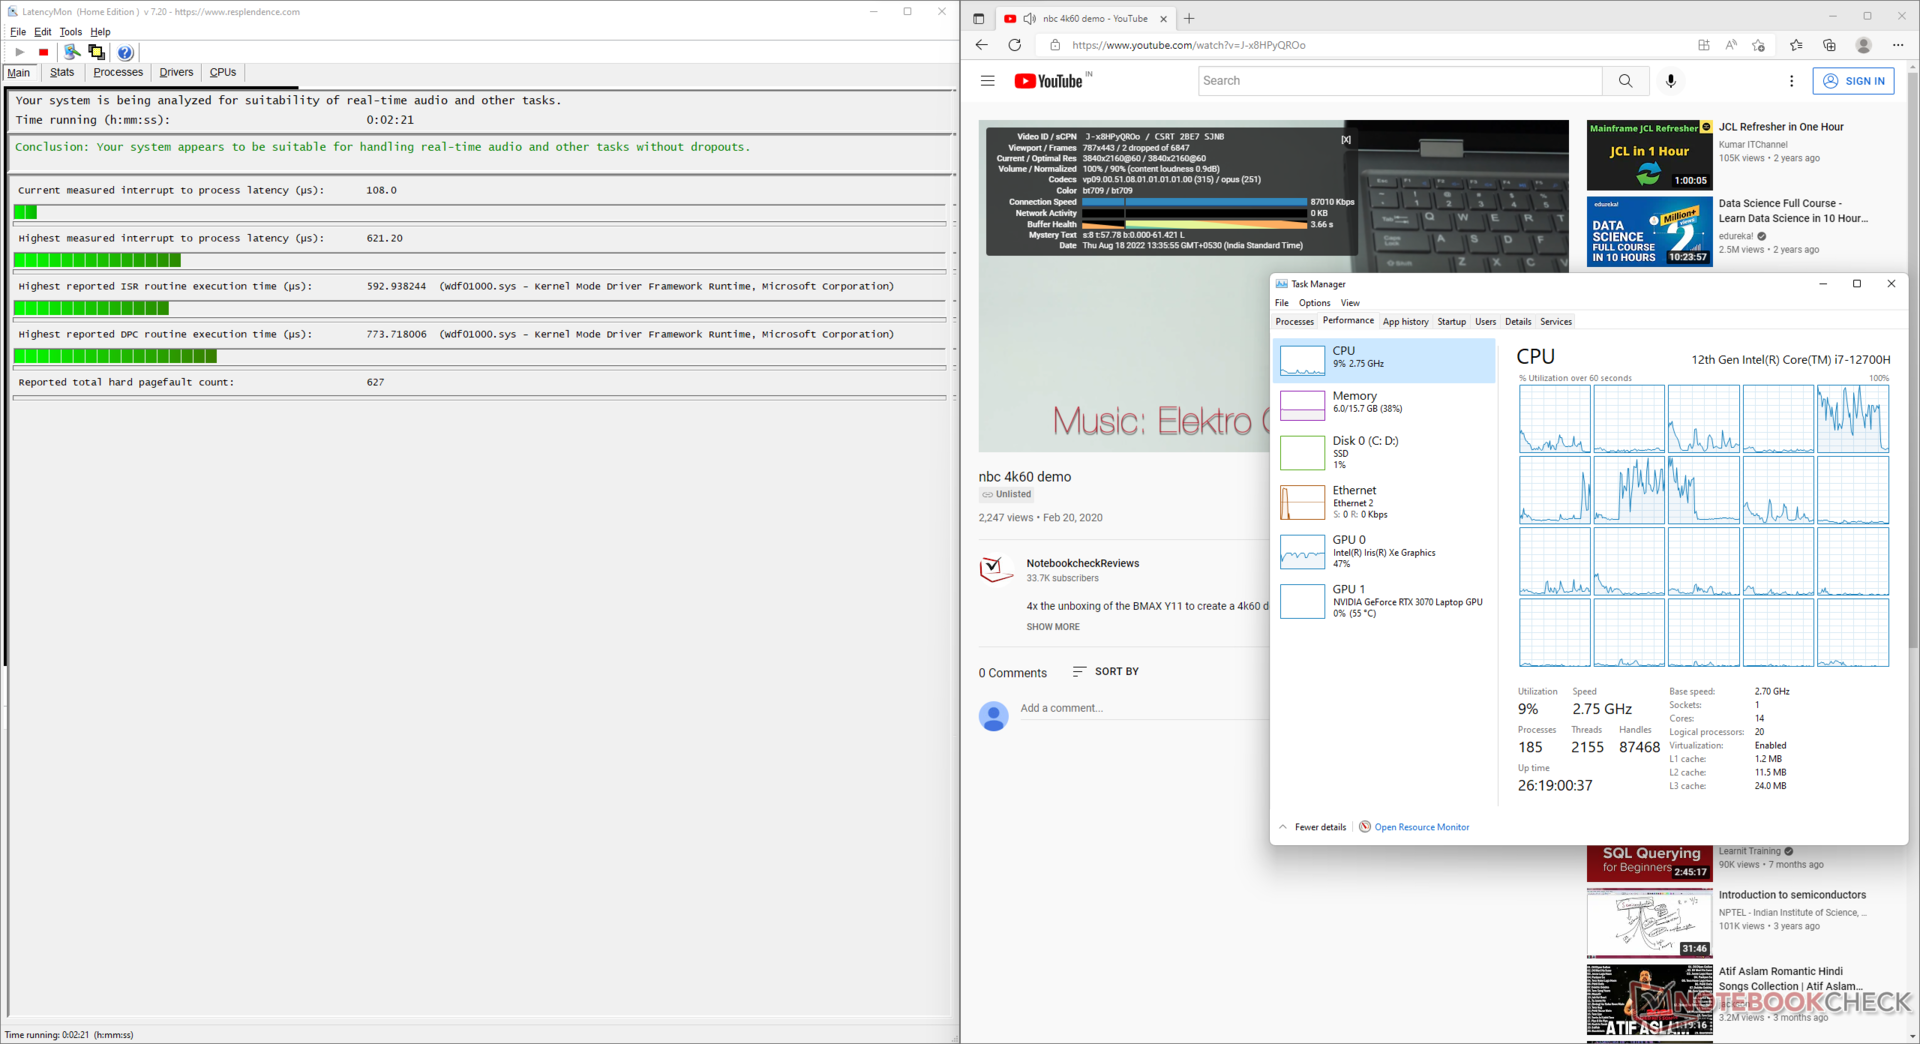
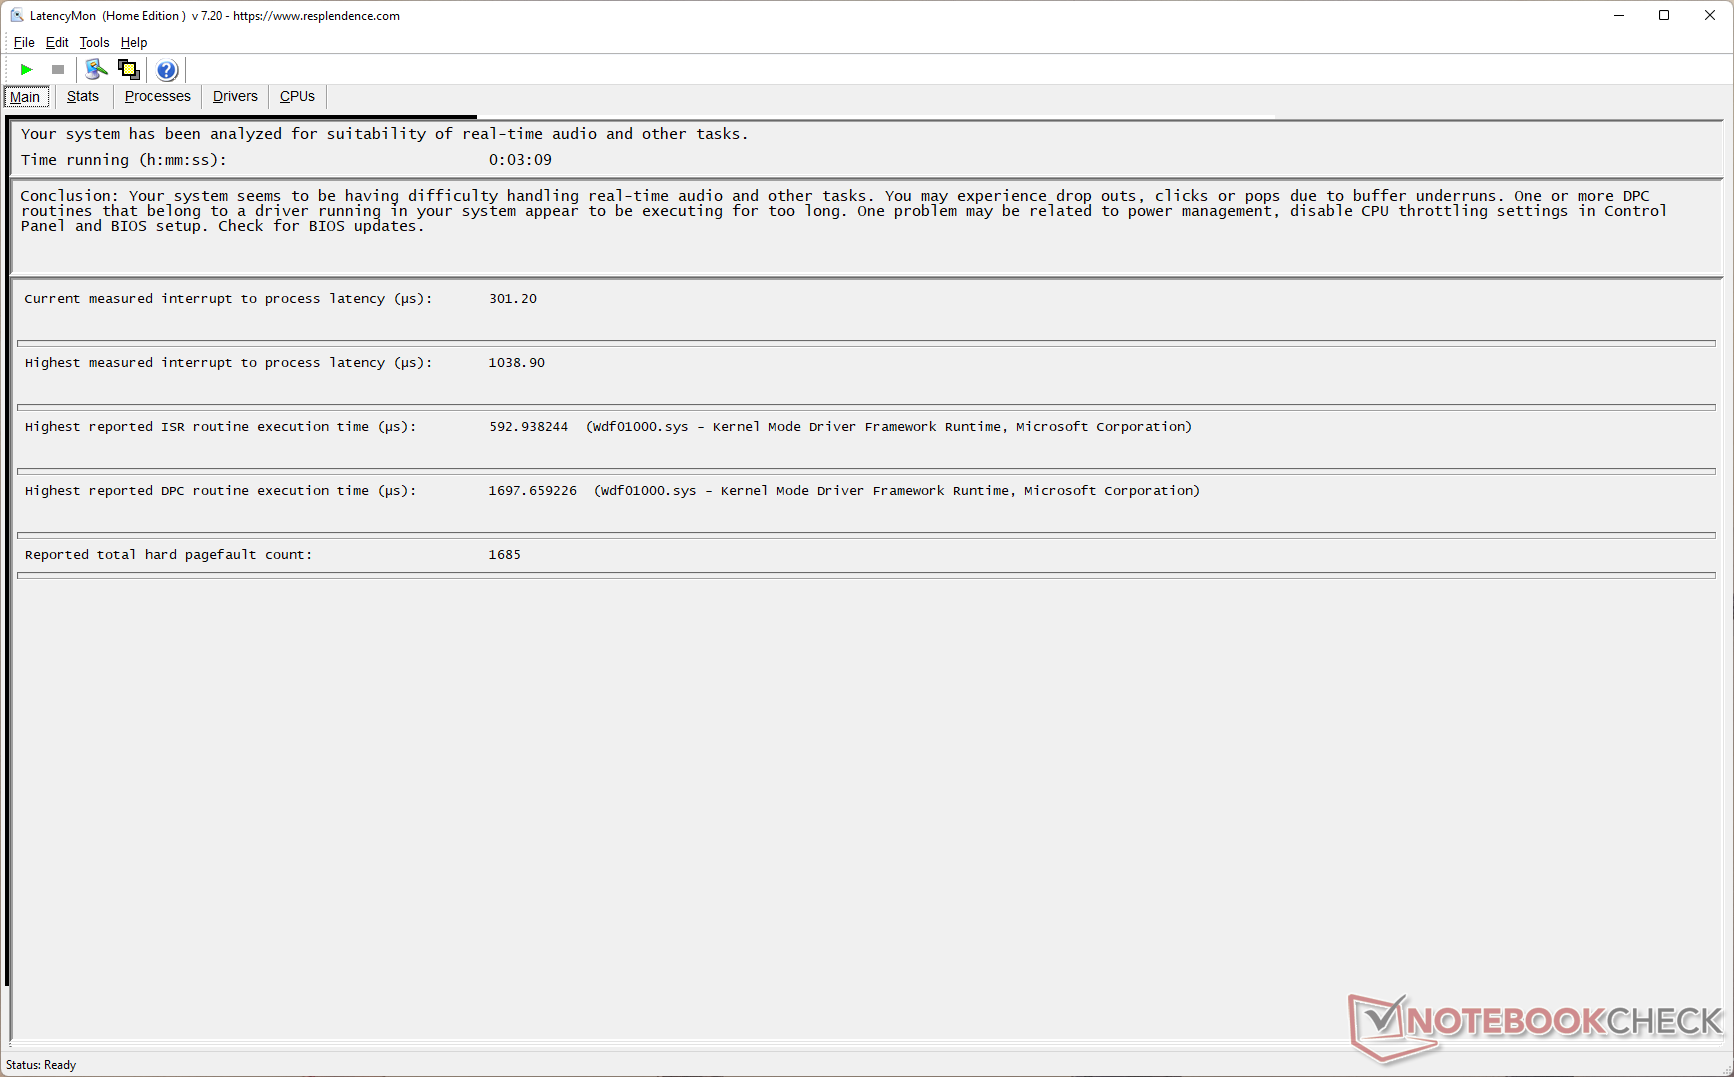
I vårt standardiserade LatencyMon-test har Crosshair 15 R6E en något högre DPC-latenstid än andra bärbara datorer med Core i7-12700H-drift. Vi observerade ökad latens efter att ha kört Prime95-testet för stora FFTs på plats efter vårt YouTube-benchmark
Windows Kernel Mode Driver Framework verkar vara orsaken till de ökade latensvärdena.
| DPC Latencies / LatencyMon - interrupt to process latency (max), Web, Youtube, Prime95 | |
| Schenker XMG Neo 15 (i7-12700H, RTX 3080 Ti) | |
| MSI Stealth GS66 12UGS | |
| Schenker XMG Neo 15 (Ryzen 9 6900HX, RTX 3070 Ti) | |
| Aorus 15 XE5 | |
| MSI Crosshair 15 R6E B12UGZ-050 | |
| MSI Pulse GL66 12UEK | |
| Acer Nitro 5 AN515-58-72QR | |
| Lenovo Legion 5 Pro 16 G7 i7 RTX 3070Ti | |
| MSI Katana GF66 12UGS | |
| Asus TUF Dash F15 FX517ZR | |
* ... mindre är bättre
Fler jämförelser av latenstider mellan granskade enheter finns i vår DPC-rankning av latenstider sida.
Lagringsenheter
Micron 2450 1 TB NVMe PCIe SSD slår inga hastighetsrekord. Crosshair 15 R6E:s två NVMe M.2-platser och Micron-enheten i sig stöder PCIe Gen 4, men prestandan är mer i linje med PCIe Gen 3-hastigheter. Med det sagt kan enheten komma nära sina nominella I/O-specifikationer för det mesta.
Enheten uppvisar ingen strypning i vårt DiskSpd-läsningsloop-test vid ett ködjup på 8. Det finns inget utrymme för att lägga till en 2,5-tums SATA-lagringsutvidgning.

* ... mindre är bättre
Disk Throttling: DiskSpd Read Loop, Queue Depth 8
GPU-prestanda
Vår Crosshair 15 R6E-testenhet använder en 140 W RTX 3070 Laptop GPU med 8 GB GDDR6 VRAM. MSI anger inte den exakta Dynamic Boost för den här GPU:n.
3DMark-prestanda ligger bakom några RTX 3070 Ti-men inte särskilt mycket. Crosshair 15 R6E ligger efter den RTX 3080 Ti-xMG Neo 15 med 11 % och 13 % i 3DMark Fire Strike Graphics och Time Spy Graphics-testerna.
Asus TUF Dash F15 med samma GPU är 19 % långsammare än den i Crosshair 15 R6E tack vare en lägre TGP på 105 W.
| 3DMark 11 Performance | 30240 poäng | |
| 3DMark Ice Storm Standard Score | 158460 poäng | |
| 3DMark Cloud Gate Standard Score | 56797 poäng | |
| 3DMark Fire Strike Score | 24233 poäng | |
| 3DMark Fire Strike Extreme Score | 12959 poäng | |
| 3DMark Time Spy Score | 10496 poäng | |
Hjälp | ||
Crosshair 15 R6E tar 42 % och 33 % mindre tid i Blender Classroom Optix respektive Classroom CUDA jämfört med de genomsnittliga tider som registrerats för RTX 3070 Laptop GPU.
| Blender / v3.3 Classroom OPTIX/RTX | |
| Asus TUF Dash F15 FX517ZR | |
| Genomsnitt NVIDIA GeForce RTX 3070 Laptop GPU (26 - 30, n=8) | |
| MSI Crosshair 15 R6E B12UGZ-050 | |
| Aorus 15 XE5 | |
| Schenker XMG Neo 15 (Ryzen 9 6900HX, RTX 3070 Ti) | |
| Genomsnitt av klass Gaming (9 - 32, n=106, senaste 2 åren) | |
| Blender / v3.3 Classroom CUDA | |
| Asus TUF Dash F15 FX517ZR | |
| Genomsnitt NVIDIA GeForce RTX 3070 Laptop GPU (43 - 51, n=9) | |
| MSI Crosshair 15 R6E B12UGZ-050 | |
| Aorus 15 XE5 | |
| Schenker XMG Neo 15 (Ryzen 9 6900HX, RTX 3070 Ti) | |
| Genomsnitt av klass Gaming (15 - 228, n=106, senaste 2 åren) | |
| Blender / v3.3 Classroom CPU | |
| Genomsnitt NVIDIA GeForce RTX 3070 Laptop GPU (329 - 698, n=12) | |
| Asus TUF Dash F15 FX517ZR | |
| Aorus 15 XE5 | |
| MSI Crosshair 15 R6E B12UGZ-050 | |
| Schenker XMG Neo 15 (Ryzen 9 6900HX, RTX 3070 Ti) | |
| Genomsnitt av klass Gaming (122 - 565, n=102, senaste 2 åren) | |
* ... mindre är bättre
Spelprestanda
Spelprestanda i testade spel vid 1080p Ultra-inställningar ligger endast cirka 8 % bakom XMG Neo 15 med RTX 3080 Ti-drift. Lenovo Legion 5i Pro 16 G7 med RTX 3070 Ti visar märkbara försprång jämfört med Crosshair 15 R6E i de flesta spel, särskilt vid QHD Ultra.
Den RTX 3080 Ti-drivna XMG Neo 15 kan vara upp till 17 % i Far Cry 5 QHD Ultra, men detta delta ökar till 45 % i Witcher 3 vid 1080p High. I Rainbow Six: Extraction visar Crosshair 15 R6E goda försprång i inställningar för 1080p och QHD Ultra jämfört med Stealth GS66 med en RTX 3070 Ti Laptop GPU.
| F1 2021 | |
| 1920x1080 High Preset AA:T AF:16x | |
| Lenovo Legion 5 Pro 16 G7 i7 RTX 3070Ti | |
| MSI Stealth GS66 12UGS | |
| MSI Crosshair 15 R6E B12UGZ-050 | |
| Genomsnitt NVIDIA GeForce RTX 3070 Laptop GPU (66.1 - 256, n=16) | |
| Asus TUF Dash F15 FX517ZR | |
| Acer Nitro 5 AN515-58-72QR | |
| 1920x1080 Ultra High Preset + Raytracing AA:T AF:16x | |
| Lenovo Legion 5 Pro 16 G7 i7 RTX 3070Ti | |
| MSI Crosshair 15 R6E B12UGZ-050 | |
| MSI Stealth GS66 12UGS | |
| Acer Nitro 5 AN515-58-72QR | |
| Genomsnitt NVIDIA GeForce RTX 3070 Laptop GPU (33.1 - 123.1, n=23) | |
| Asus TUF Dash F15 FX517ZR | |
| 2560x1440 Ultra High Preset + Raytracing AA:T AF:16x | |
| Lenovo Legion 5 Pro 16 G7 i7 RTX 3070Ti | |
| MSI Crosshair 15 R6E B12UGZ-050 | |
| Genomsnitt NVIDIA GeForce RTX 3070 Laptop GPU (67.1 - 90.2, n=11) | |
| Acer Nitro 5 AN515-58-72QR | |
| MSI Stealth GS66 12UGS | |
| Asus TUF Dash F15 FX517ZR | |
| Rainbow Six Extraction | |
| 1920x1080 High Preset (with Fixed Resolution Quality) | |
| Genomsnitt NVIDIA GeForce RTX 3070 Laptop GPU (171 - 202, n=4) | |
| MSI Stealth GS66 12UGS | |
| MSI Crosshair 15 R6E B12UGZ-050 | |
| 1920x1080 Ultra Preset (with Fixed Resolution Quality) | |
| MSI Crosshair 15 R6E B12UGZ-050 | |
| Genomsnitt NVIDIA GeForce RTX 3070 Laptop GPU (149 - 157, n=4) | |
| MSI Stealth GS66 12UGS | |
| 2560x1440 Ultra Preset (with Fixed Resolution Quality) | |
| MSI Crosshair 15 R6E B12UGZ-050 | |
| Genomsnitt NVIDIA GeForce RTX 3070 Laptop GPU (97 - 103, n=3) | |
| MSI Stealth GS66 12UGS | |
Witcher 3 FPS-tabell
RTX 3070 GPU för bärbar dator visar bra prestanda i The Witcher 3 i 1080p Ultra med karaktären som står stilla under hela testet. Vi ser visserligen svängningar i bildfrekvensen, men de är inte särskilt drastiska.
| låg | med. | hög | ultra | QHD | 4K | |
|---|---|---|---|---|---|---|
| GTA V (2015) | 184.2 | 182 | 173.8 | 113.7 | 97.1 | |
| The Witcher 3 (2015) | 368 | 294 | 168 | 105.7 | ||
| Dota 2 Reborn (2015) | 177.7 | 161.4 | 150.4 | 142.7 | 127.2 | |
| Final Fantasy XV Benchmark (2018) | 166.6 | 127.5 | 98 | 79 | 46.9 | |
| X-Plane 11.11 (2018) | 150.1 | 133.1 | 106.3 | 98.7 | ||
| Far Cry 5 (2018) | 137 | 125 | 122 | 118 | 99 | |
| Strange Brigade (2018) | 444 | 251 | 211 | 185.5 | 140.5 | |
| F1 2021 (2021) | 319 | 228 | 192.6 | 115.4 | 86.3 | |
| Rainbow Six Extraction (2022) | 225 | 189 | 171 | 155 | 103 | |
| Cyberpunk 2077 1.6 (2022) | 123 | 111.6 | 90.8 | 76.9 | 49.5 |
Kolla in vår dedikerade Nvidia GeForce RTX 3070 GPU för bärbar dator för mer information och jämförelser av prestanda.
Utsläpp: Tolerabla bullernivåer i den balanserade profilen
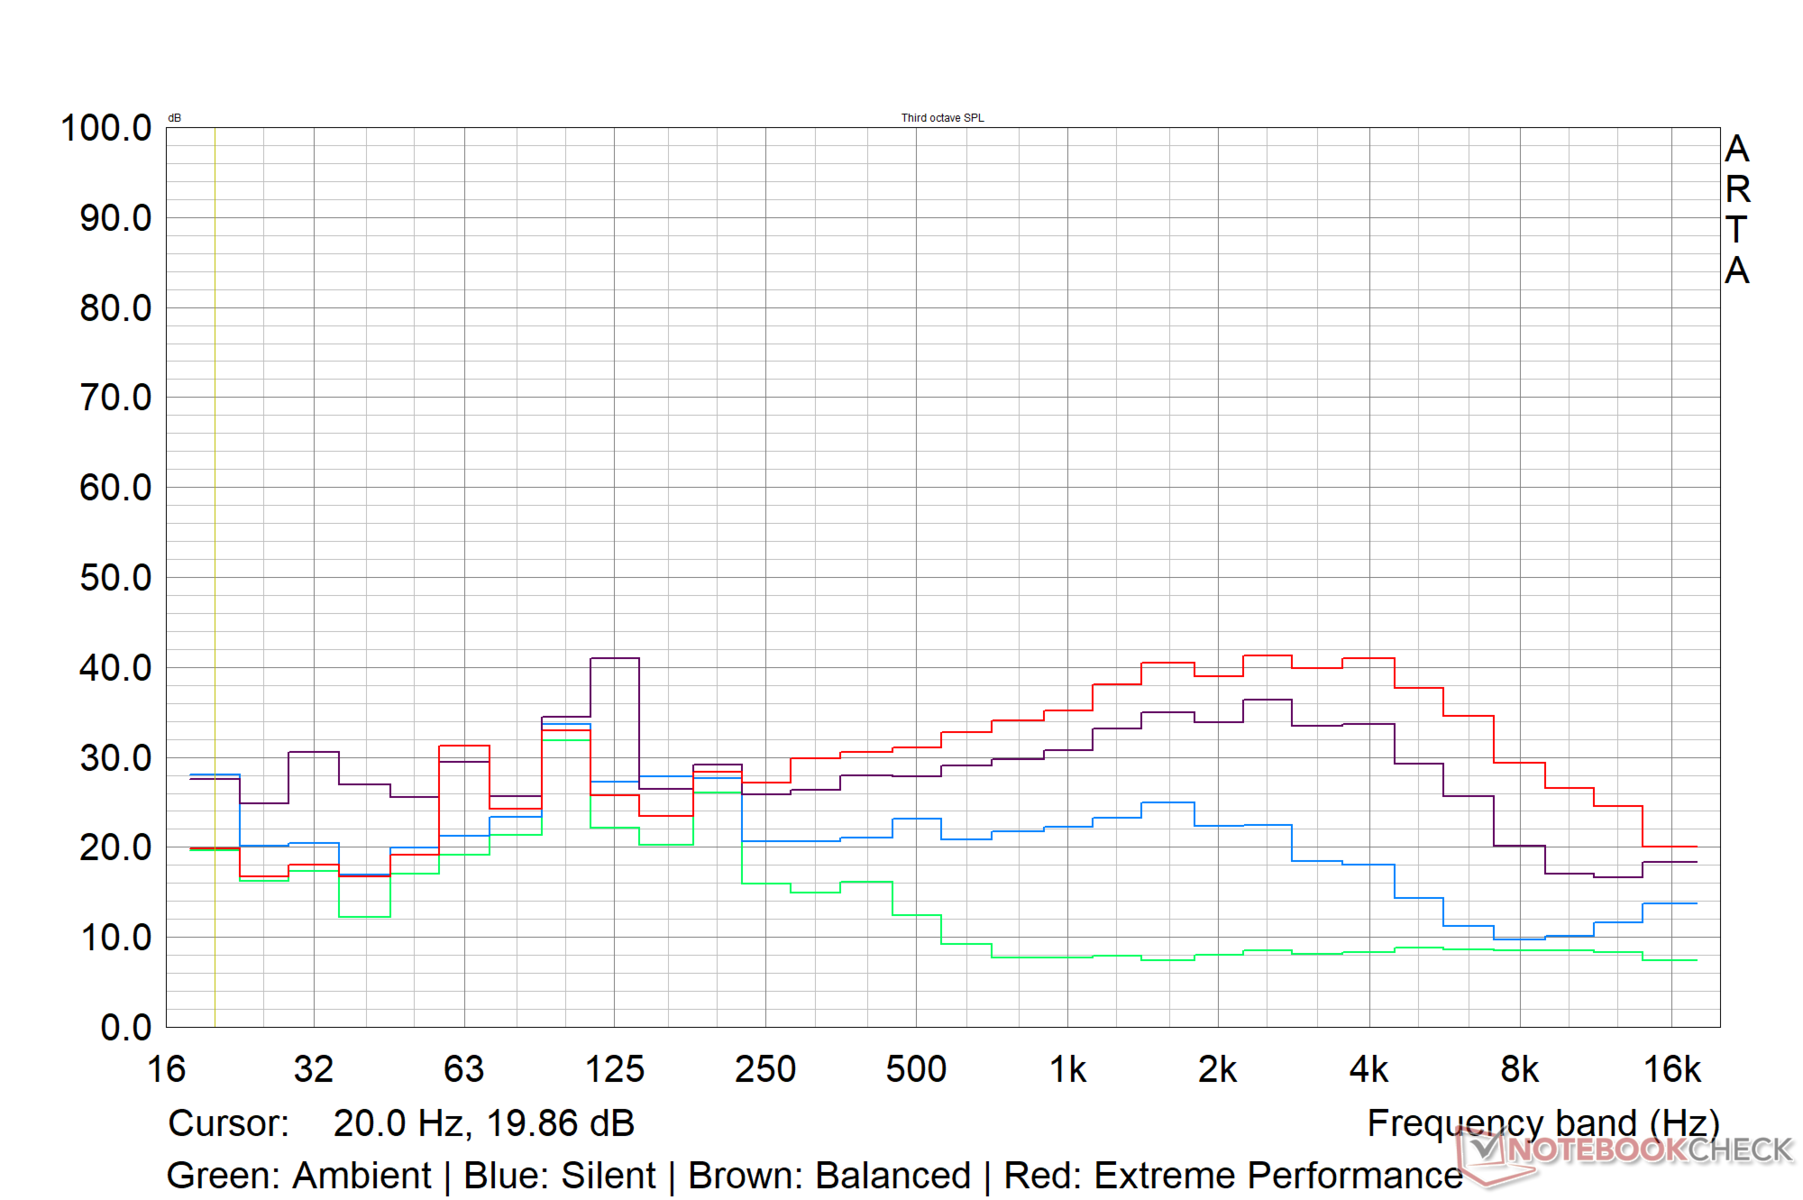
Systembrus
Fläktljudet i standardinställningen Balanced är ganska tolerabelt även under belastning. MSI verkar ha satt ett tak för Crosshair 15 R6E:s maximala fläktljud till cirka 45 db(A) i det här läget.
I inställningen Extreme Performance ökar ljudtrycksnivån (SPL) till 52 dB(A). SPL begränsas till under 40 dB(A) i profilen Silent (tyst).
| Prestandainställning | Idle dB(A) | Belastningsgenomsnitt dB(A) | Belastningsmaximum dB(A) | Witcher 3 dB(A) |
|---|---|---|---|---|
| Tyst | 25.98 | 33.09 | 37.69 | 34 |
| Balanserad | 26.14 | 44.33 | 43.20 | 43.34 |
| Extrem prestanda | 26.14 | 50.07 | 52.66 | 52.43 |
Ljudnivå
| Låg belastning |
| 26.14 / 26.14 / 26.14 dB(A) |
| Hög belastning |
| 44.33 / 43.2 dB(A) |
 | ||
30 dB tyst 40 dB(A) hörbar 50 dB(A) högt ljud |
||
min: | ||
| MSI Crosshair 15 R6E B12UGZ-050 Intel Core i7-12700H, NVIDIA GeForce RTX 3070 Laptop GPU | MSI Stealth GS66 12UGS Intel Core i7-12700H, NVIDIA GeForce RTX 3070 Ti Laptop GPU | Lenovo Legion 5 Pro 16 G7 i7 RTX 3070Ti Intel Core i7-12700H, NVIDIA GeForce RTX 3070 Ti Laptop GPU | Asus TUF Dash F15 FX517ZR Intel Core i7-12650H, NVIDIA GeForce RTX 3070 Laptop GPU | Schenker XMG Neo 15 (Ryzen 9 6900HX, RTX 3070 Ti) AMD Ryzen 9 6900HX, NVIDIA GeForce RTX 3070 Ti Laptop GPU | |
|---|---|---|---|---|---|
| Noise | -14% | -12% | -13% | -7% | |
| av / miljö * (dB) | 22.82 | 24 -5% | 24.6 -8% | 26 -14% | 23 -1% |
| Idle Minimum * (dB) | 26.14 | 31 -19% | 28.4 -9% | 26 1% | 23 12% |
| Idle Average * (dB) | 26.14 | 32 -22% | 28.4 -9% | 32 -22% | 25.82 1% |
| Idle Maximum * (dB) | 26.14 | 35 -34% | 28.4 -9% | 33 -26% | 27.3 -4% |
| Load Average * (dB) | 44.33 | 48 -8% | 49.4 -11% | 48 -8% | 42.7 4% |
| Witcher 3 ultra * (dB) | 43.3 | 43 1% | 49.4 -14% | 47 -9% | 56 -29% |
| Load Maximum * (dB) | 43.2 | 48 -11% | 54.7 -27% | 49 -13% | 56 -30% |
* ... mindre är bättre
Temperatur
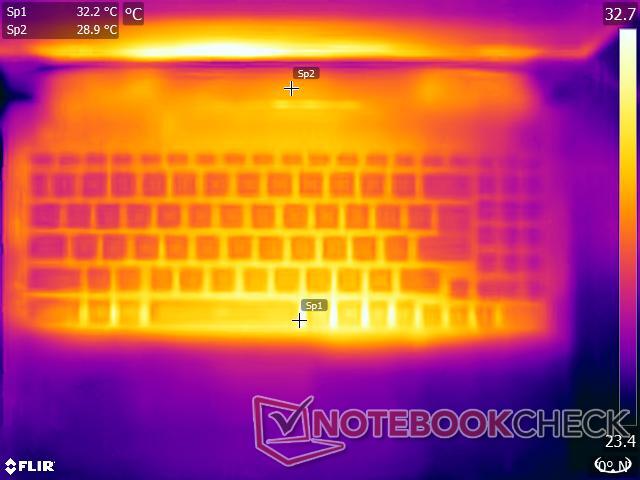
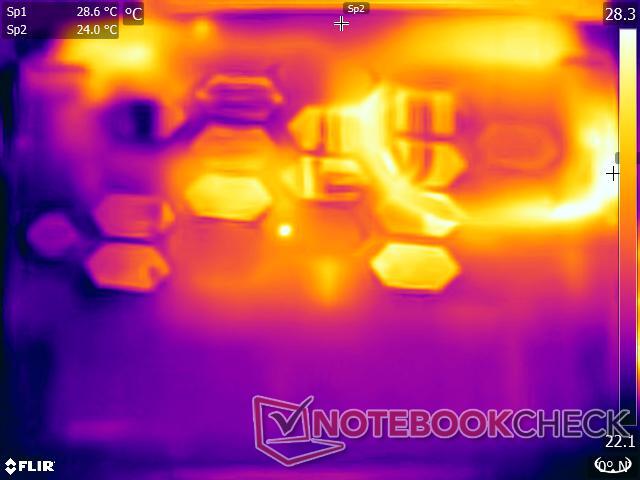
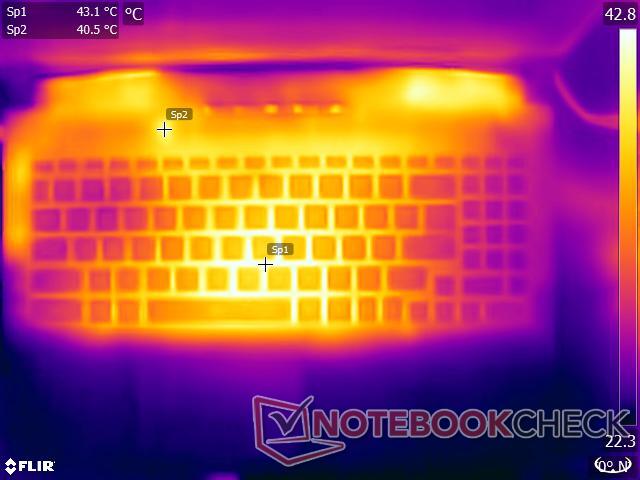
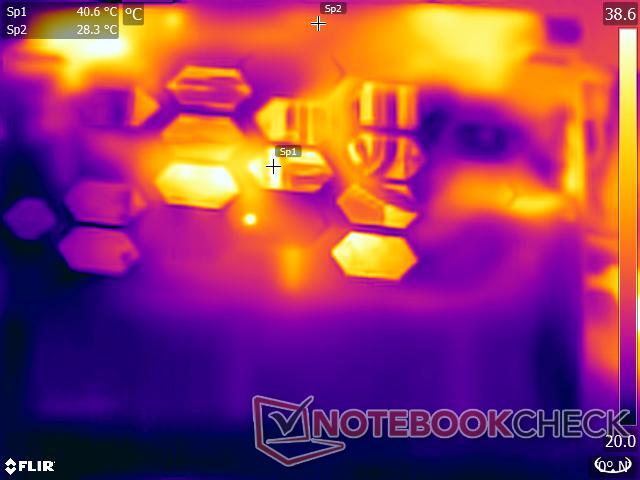
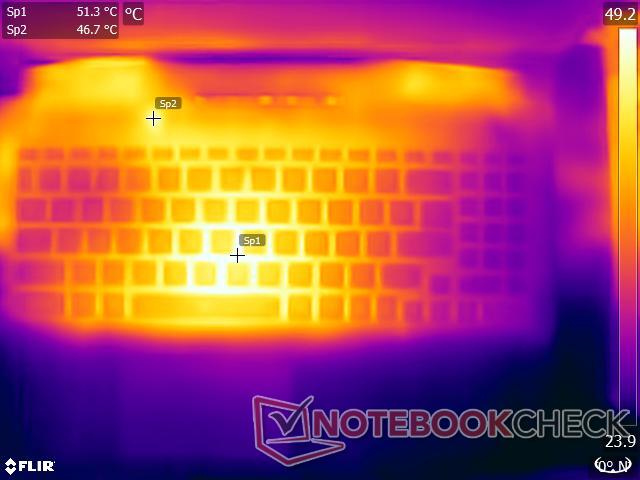
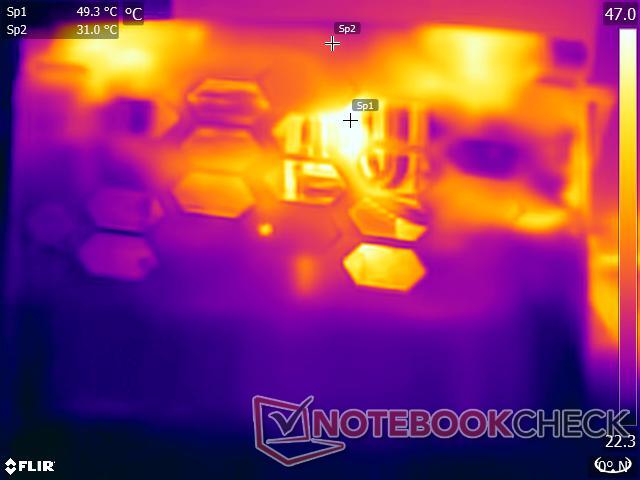
Temperaturen på ytan är acceptabel under de flesta produktivitetsuppgifter som inte pressar CPU och GPU till sina gränser. Under en kombinerad Prime95- och FurMark-belastning registrerade vi yttemperaturer på upp till 48 °C på båda sidor av enheten. Detta ökar till nästan 55 °C när vi stressade med The Witcher 3 i 1080p Ultra
Pekplattan och handflatorna förblir relativt svala under hela testet.
(-) Den maximala temperaturen på ovansidan är 48.4 °C / 119 F, jämfört med genomsnittet av 40.4 °C / 105 F , allt från 21.2 till 68.8 °C för klassen Gaming.
(-) Botten värms upp till maximalt 48.2 °C / 119 F, jämfört med genomsnittet av 43.2 °C / 110 F
(+) Vid tomgångsbruk är medeltemperaturen för ovansidan 30.6 °C / 87 F, jämfört med enhetsgenomsnittet på 33.9 °C / ### class_avg_f### F.
(-) När du spelar The Witcher 3 är medeltemperaturen för ovansidan 43.5 °C / 110 F, jämfört med enhetsgenomsnittet på 33.9 °C / ## #class_avg_f### F.
(+) Handledsstöden och pekplattan når maximal hudtemperatur (32.8 °C / 91 F) och är därför inte varma.
(-) Medeltemperaturen för handledsstödsområdet på liknande enheter var 28.8 °C / 83.8 F (-4 °C / -7.2 F).
Även om våra stresstester representerar extrema scenarier rekommenderar vi att du väljer prestandalägena Silent eller Balanced om du vill använda enheten i knät.
| MSI Crosshair 15 R6E B12UGZ-050 Intel Core i7-12700H, NVIDIA GeForce RTX 3070 Laptop GPU | MSI Stealth GS66 12UGS Intel Core i7-12700H, NVIDIA GeForce RTX 3070 Ti Laptop GPU | Lenovo Legion 5 Pro 16 G7 i7 RTX 3070Ti Intel Core i7-12700H, NVIDIA GeForce RTX 3070 Ti Laptop GPU | Asus TUF Dash F15 FX517ZR Intel Core i7-12650H, NVIDIA GeForce RTX 3070 Laptop GPU | Schenker XMG Neo 15 (Ryzen 9 6900HX, RTX 3070 Ti) AMD Ryzen 9 6900HX, NVIDIA GeForce RTX 3070 Ti Laptop GPU | |
|---|---|---|---|---|---|
| Heat | 2% | -1% | -6% | 6% | |
| Maximum Upper Side * (°C) | 48.4 | 54 -12% | 45.3 6% | 52 -7% | 41 15% |
| Maximum Bottom * (°C) | 48.2 | 59 -22% | 61.2 -27% | 52 -8% | 57 -18% |
| Idle Upper Side * (°C) | 34 | 26 24% | 28.6 16% | 33 3% | 28 18% |
| Idle Bottom * (°C) | 32.4 | 27 17% | 31.4 3% | 36 -11% | 30 7% |
* ... mindre är bättre
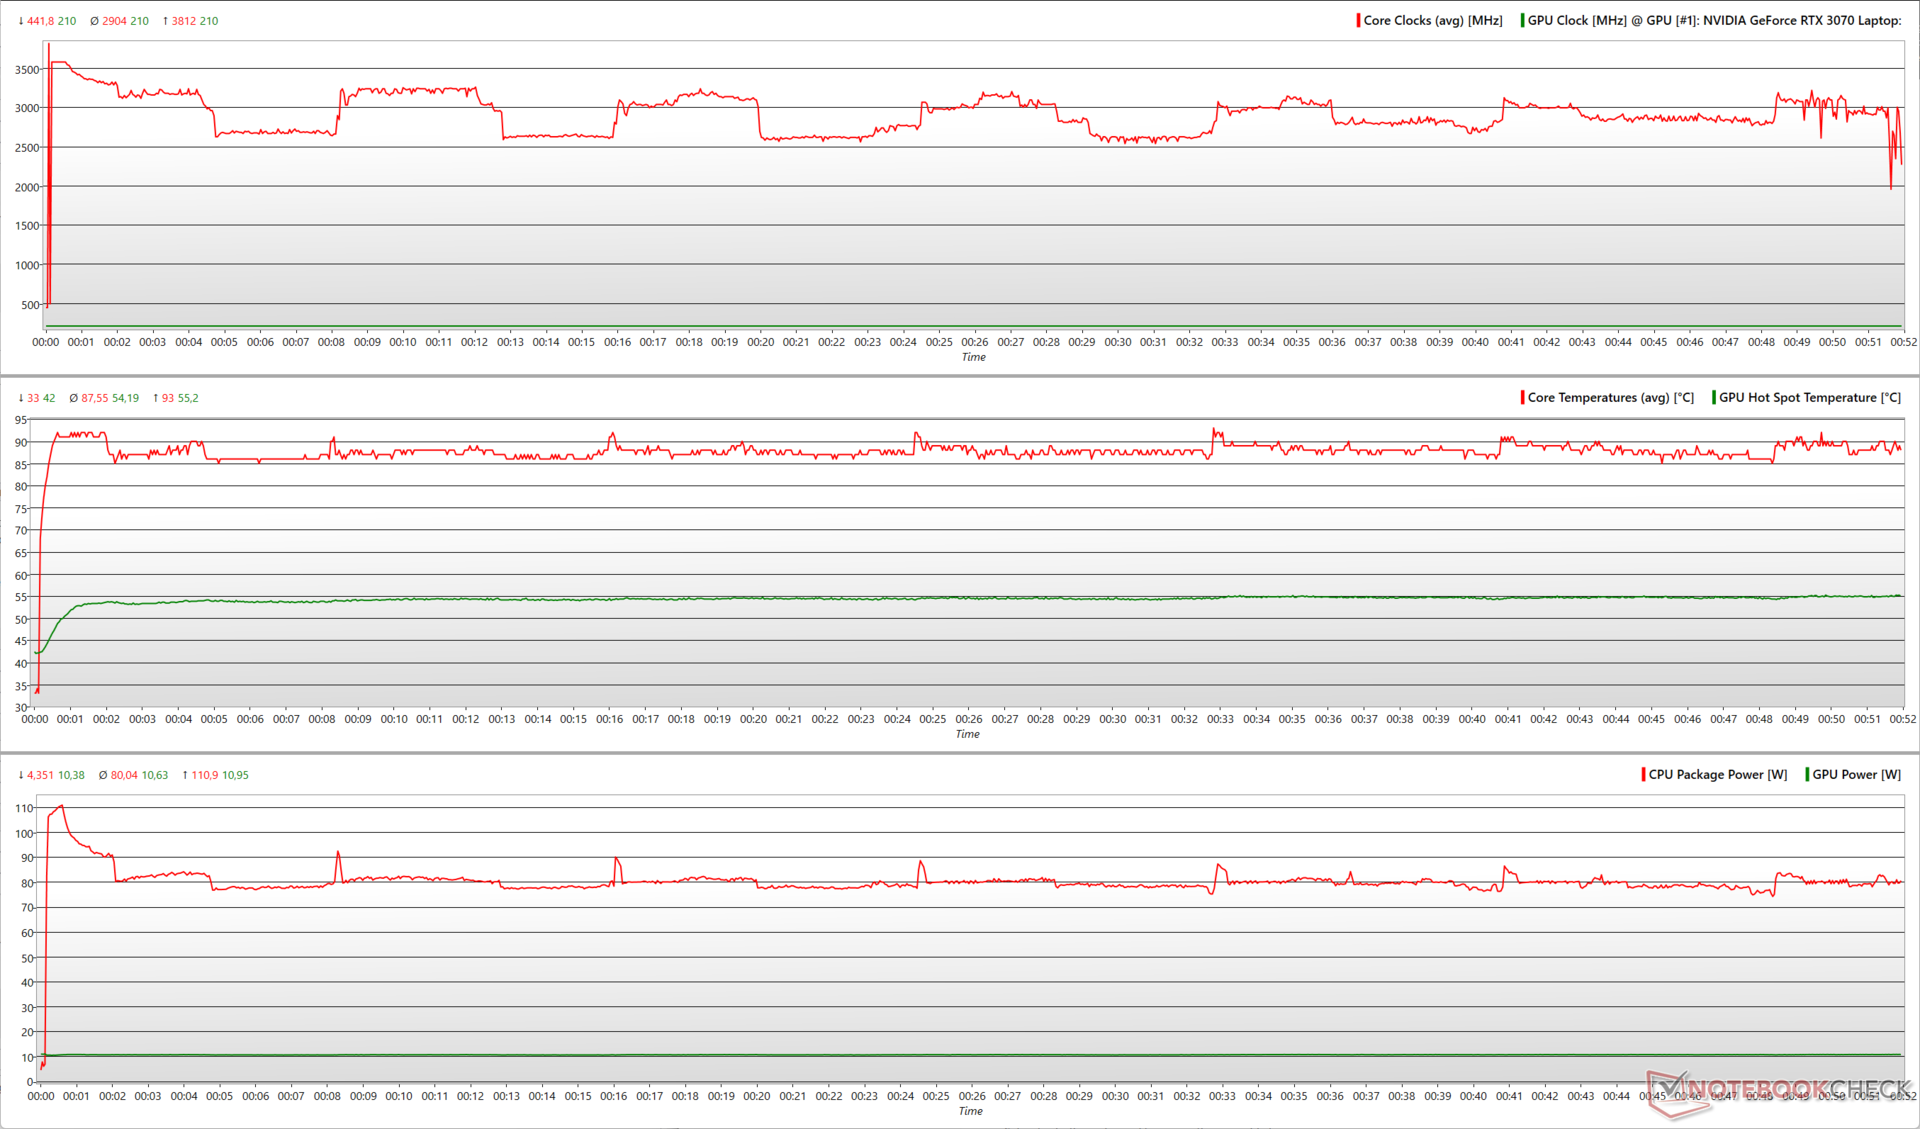
Stresstest
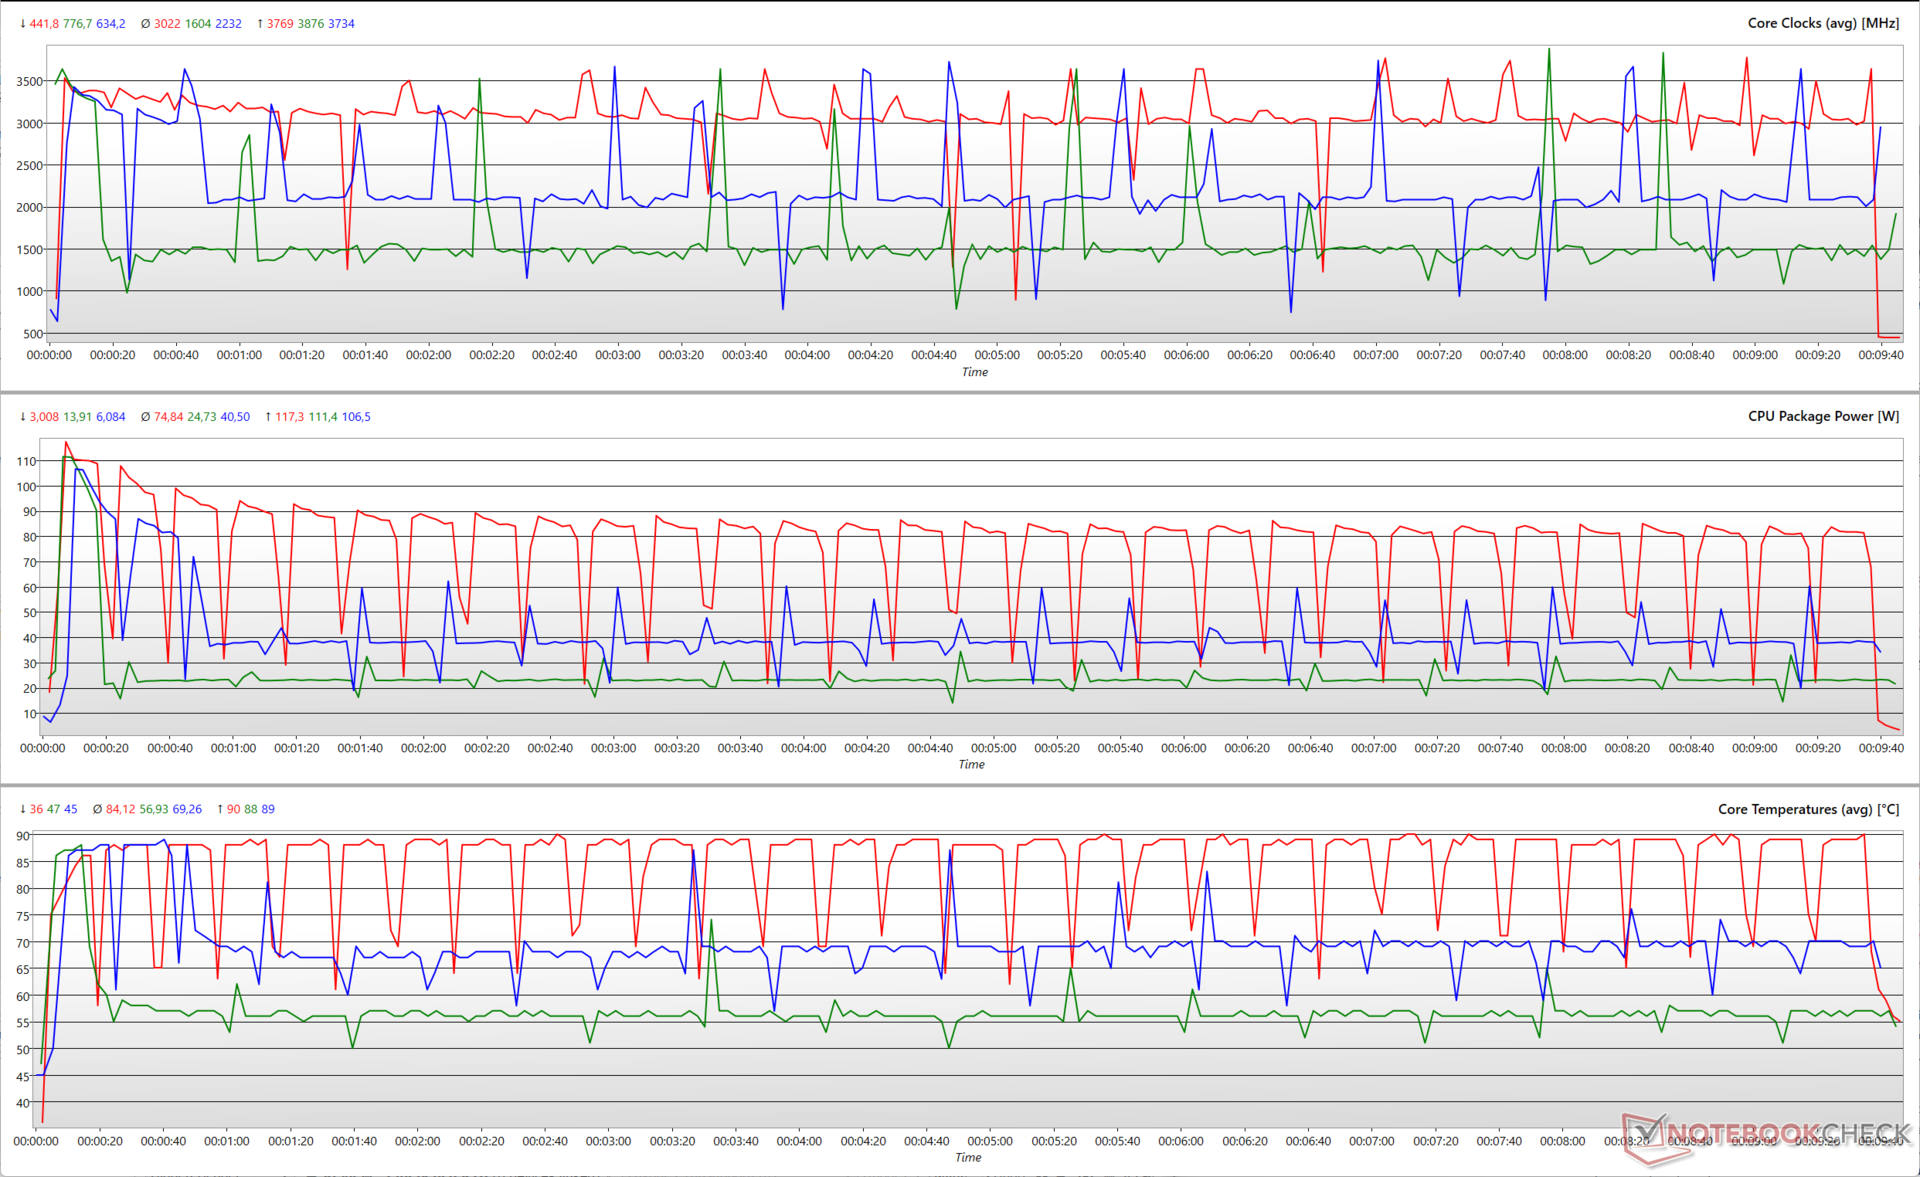
Under Prime95-stressen ser vi att Core i7-12700H kan öka upp till 3,8 GHz samtidigt som den förbrukar 111 W. De genomsnittliga kärnklockorna ligger dock mer i 2,9 GHz-området med en genomsnittlig paketenergi på cirka 80 W. Processorn kan nå upp till 93 °C under denna stress.
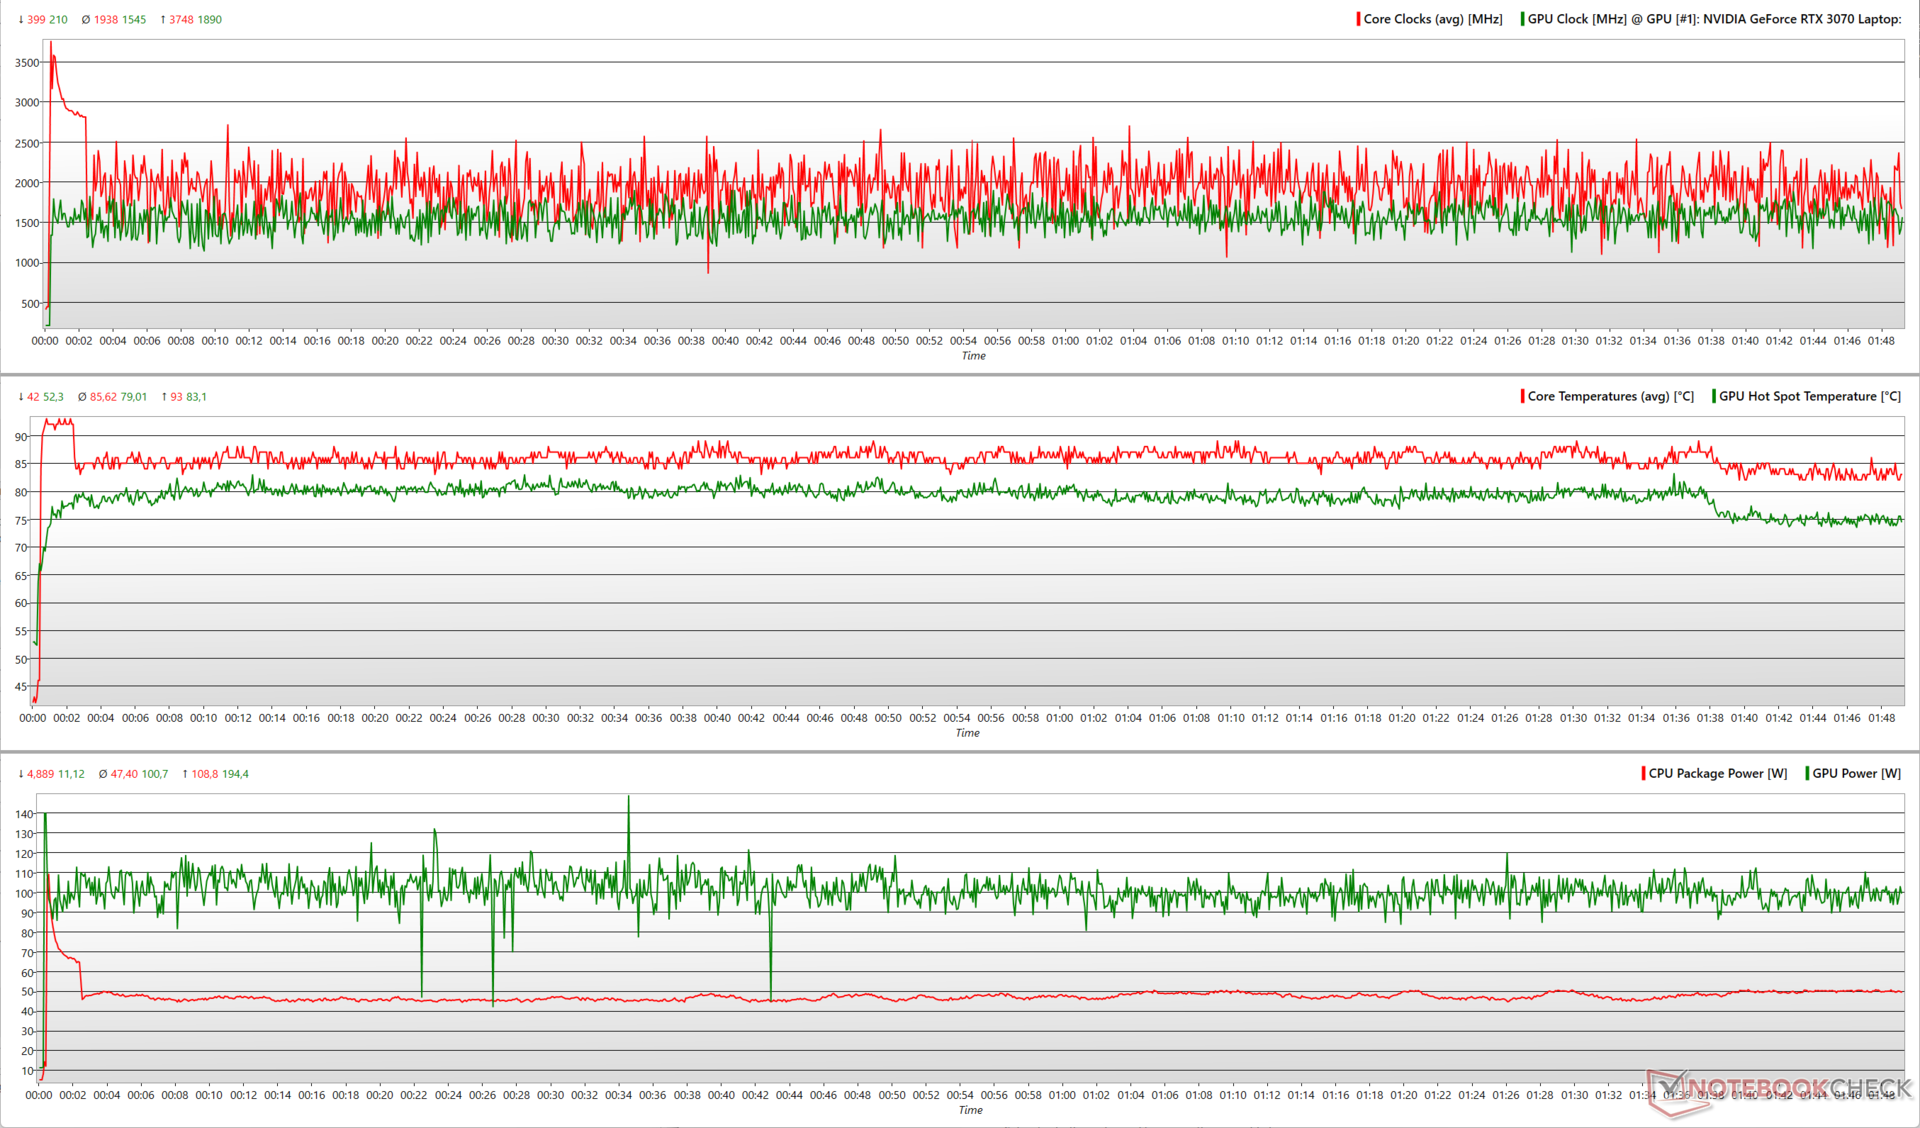
Att lägga till FurMark gör att Crosshair 15 R6E flyttar en del av den totala effektbudgeten till RTX 3070. Detta resulterar i minskade genomsnittliga CPU-kärnklockor till 1,9 GHz med en minskning av den genomsnittliga paketenergin till 47,4 W. RTX 3070 kan nå nära sin toppklockning på 1,9 GHz och hålla sig på 1,54 GHz. Därmed förbrukar GPU:n nära 195 W toppeffekt och i genomsnitt cirka 101 W. Genomsnittliga CPU- och GPU-temperaturer ligger runt 85,6 °C respektive 79 °C.
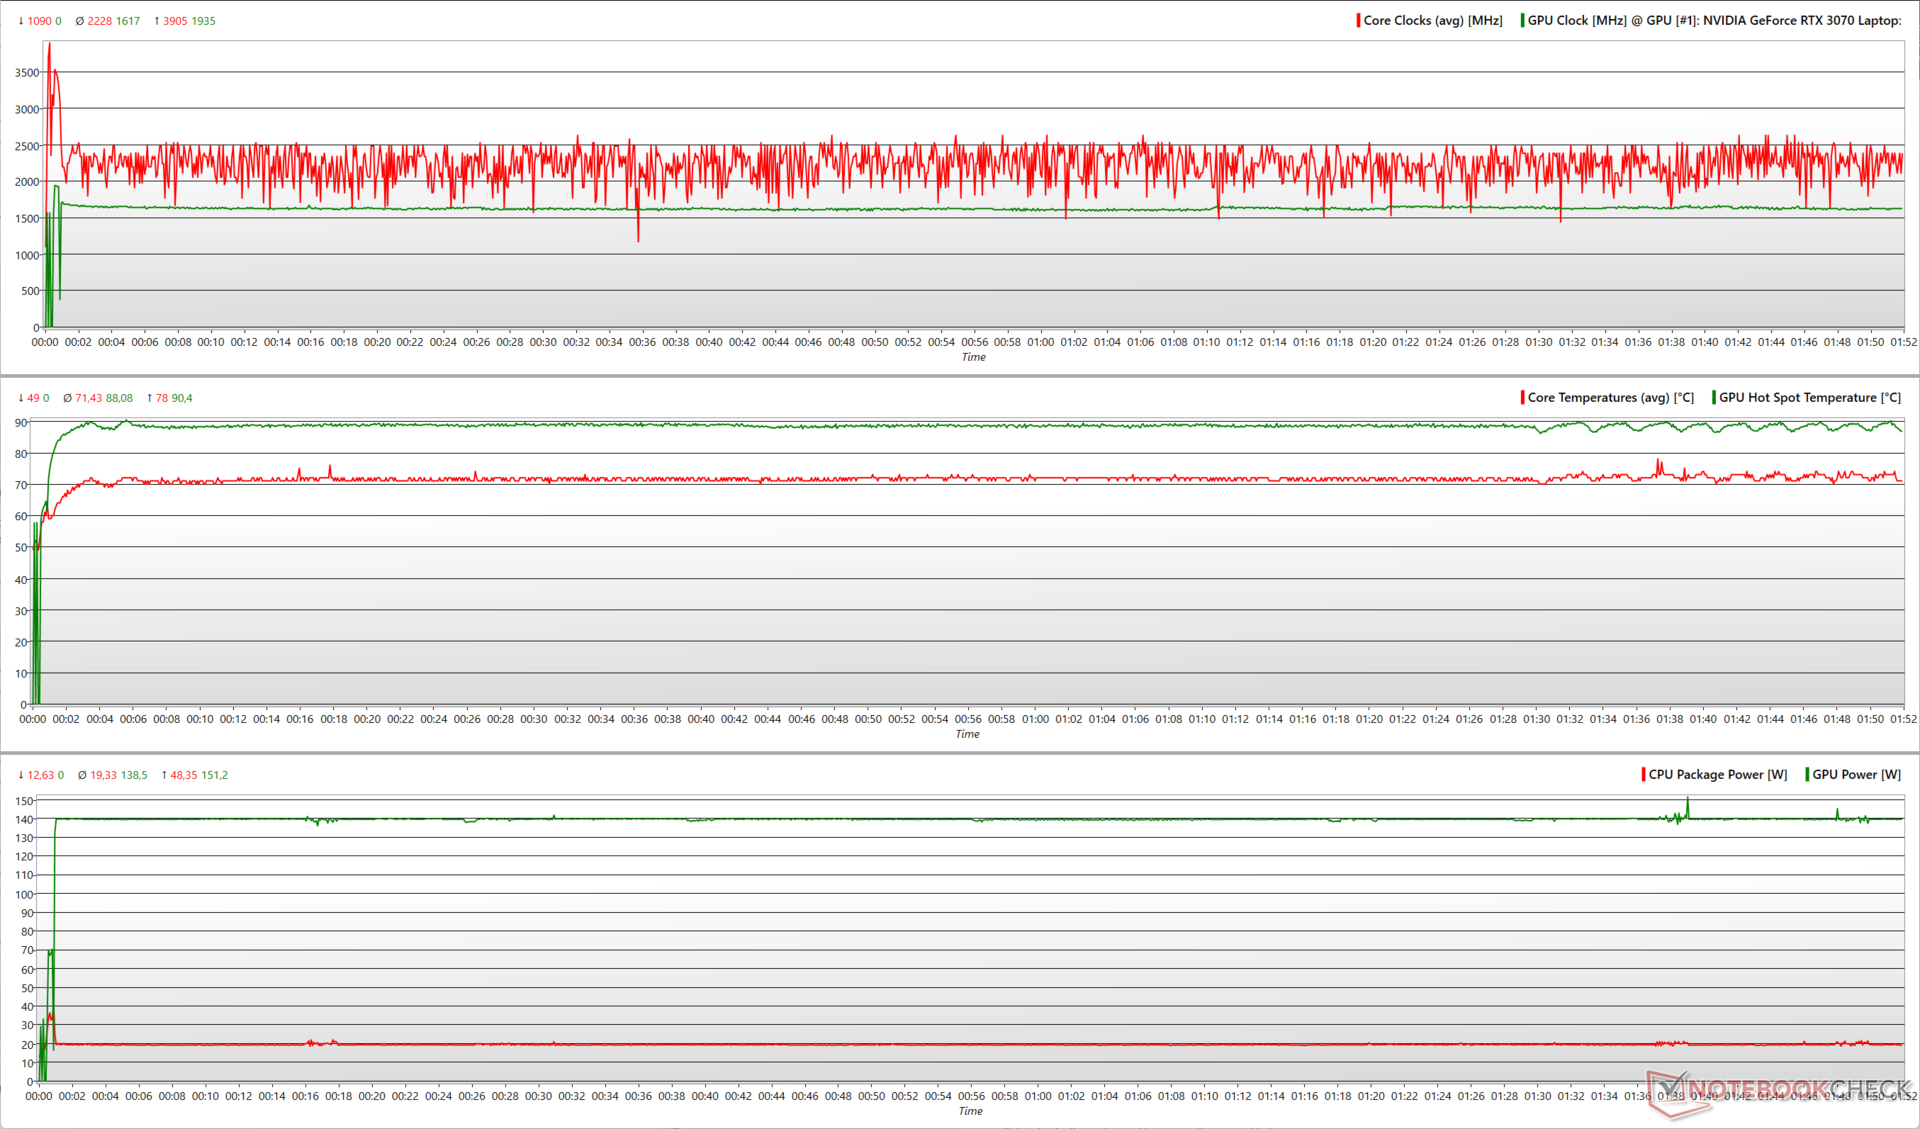
På Witcher 3 stress vid 1080p Ultra ser vi en mer rättvis fördelning av strömmen, där Core i7-12700H nu kan arbeta med genomsnittliga hastigheter på 2,2 GHz och RTX 3070 också ökar något högre till 1,6 GHz. Den högre genomsnittliga GPU-klockan kommer på bekostnad av en högre genomsnittlig strömförbrukning på 138,5 W
Intressant nog observerar vi att Core i7-12700H kan uppnå en högre klockfrekvens med knappt 20 W genomsnittlig paketström. Medeltemperaturerna under The Witcher 3 stress coast runt 71,4 °C och 88 °C för CPU och GPU.
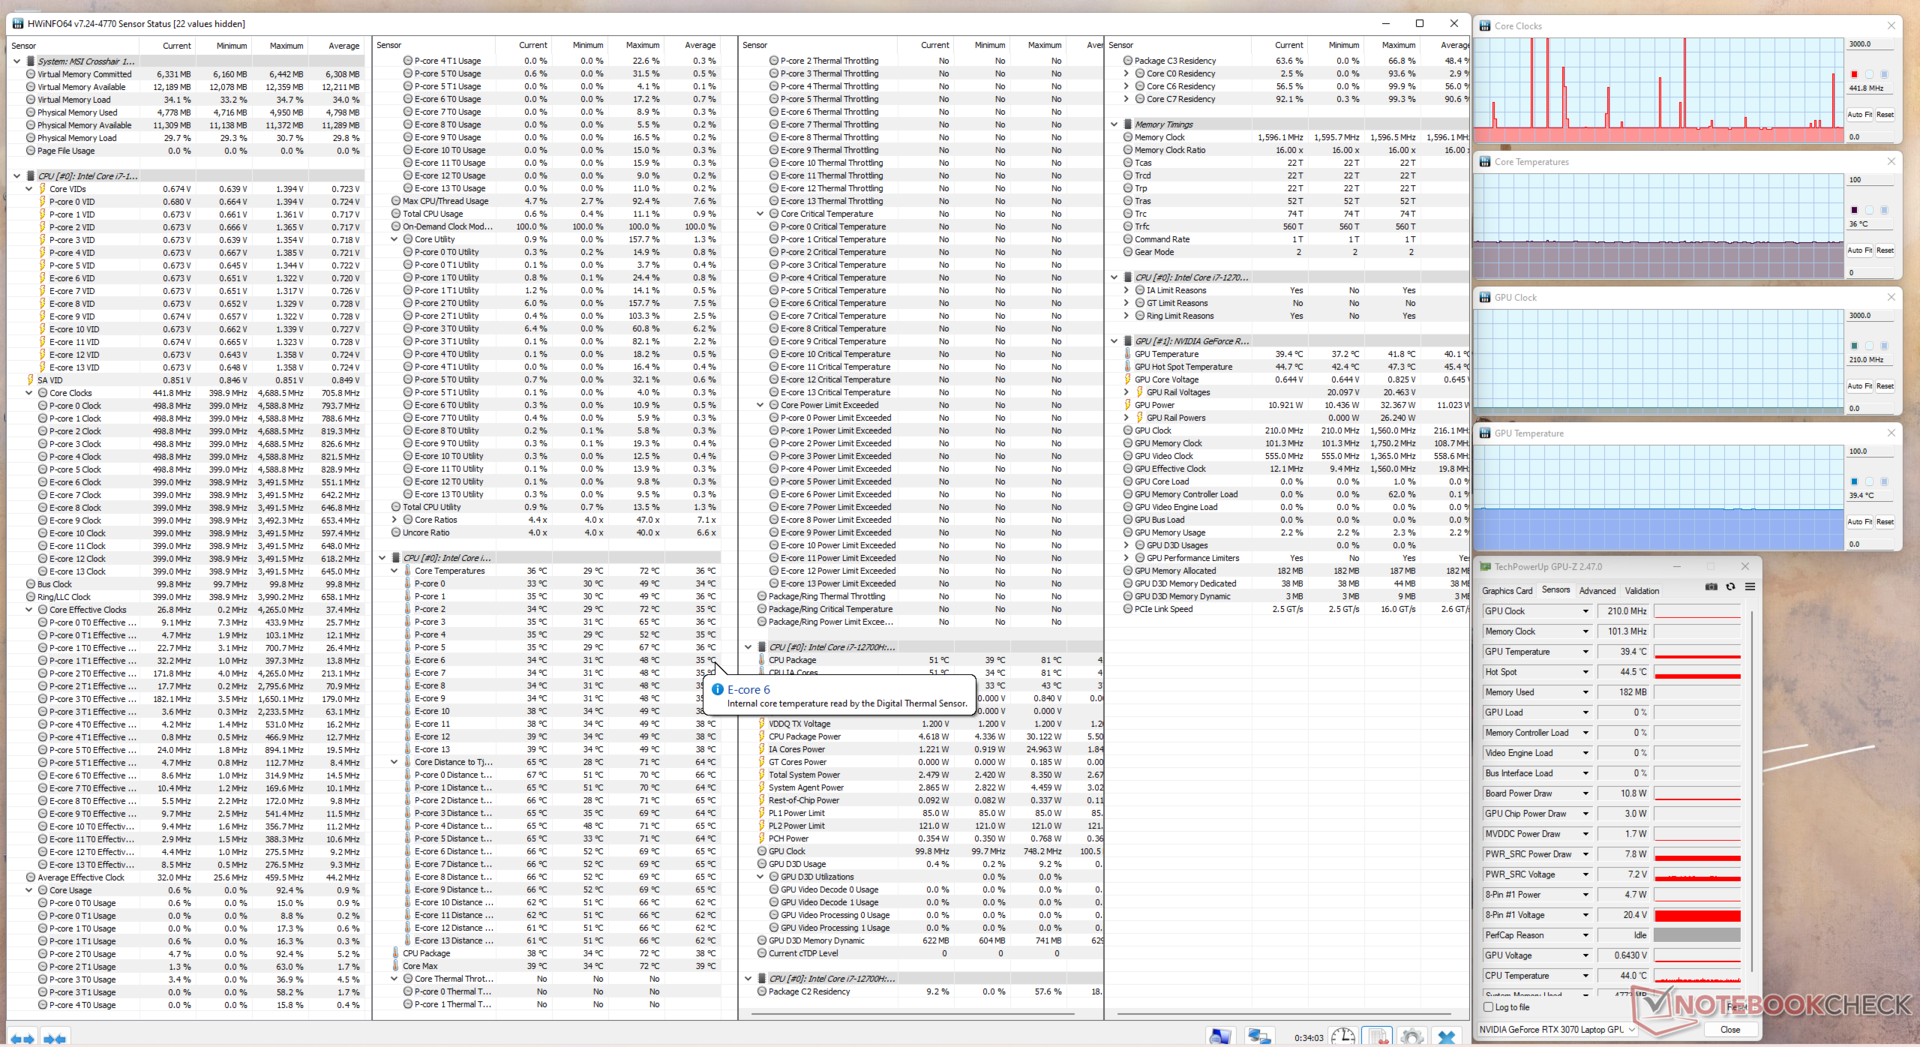
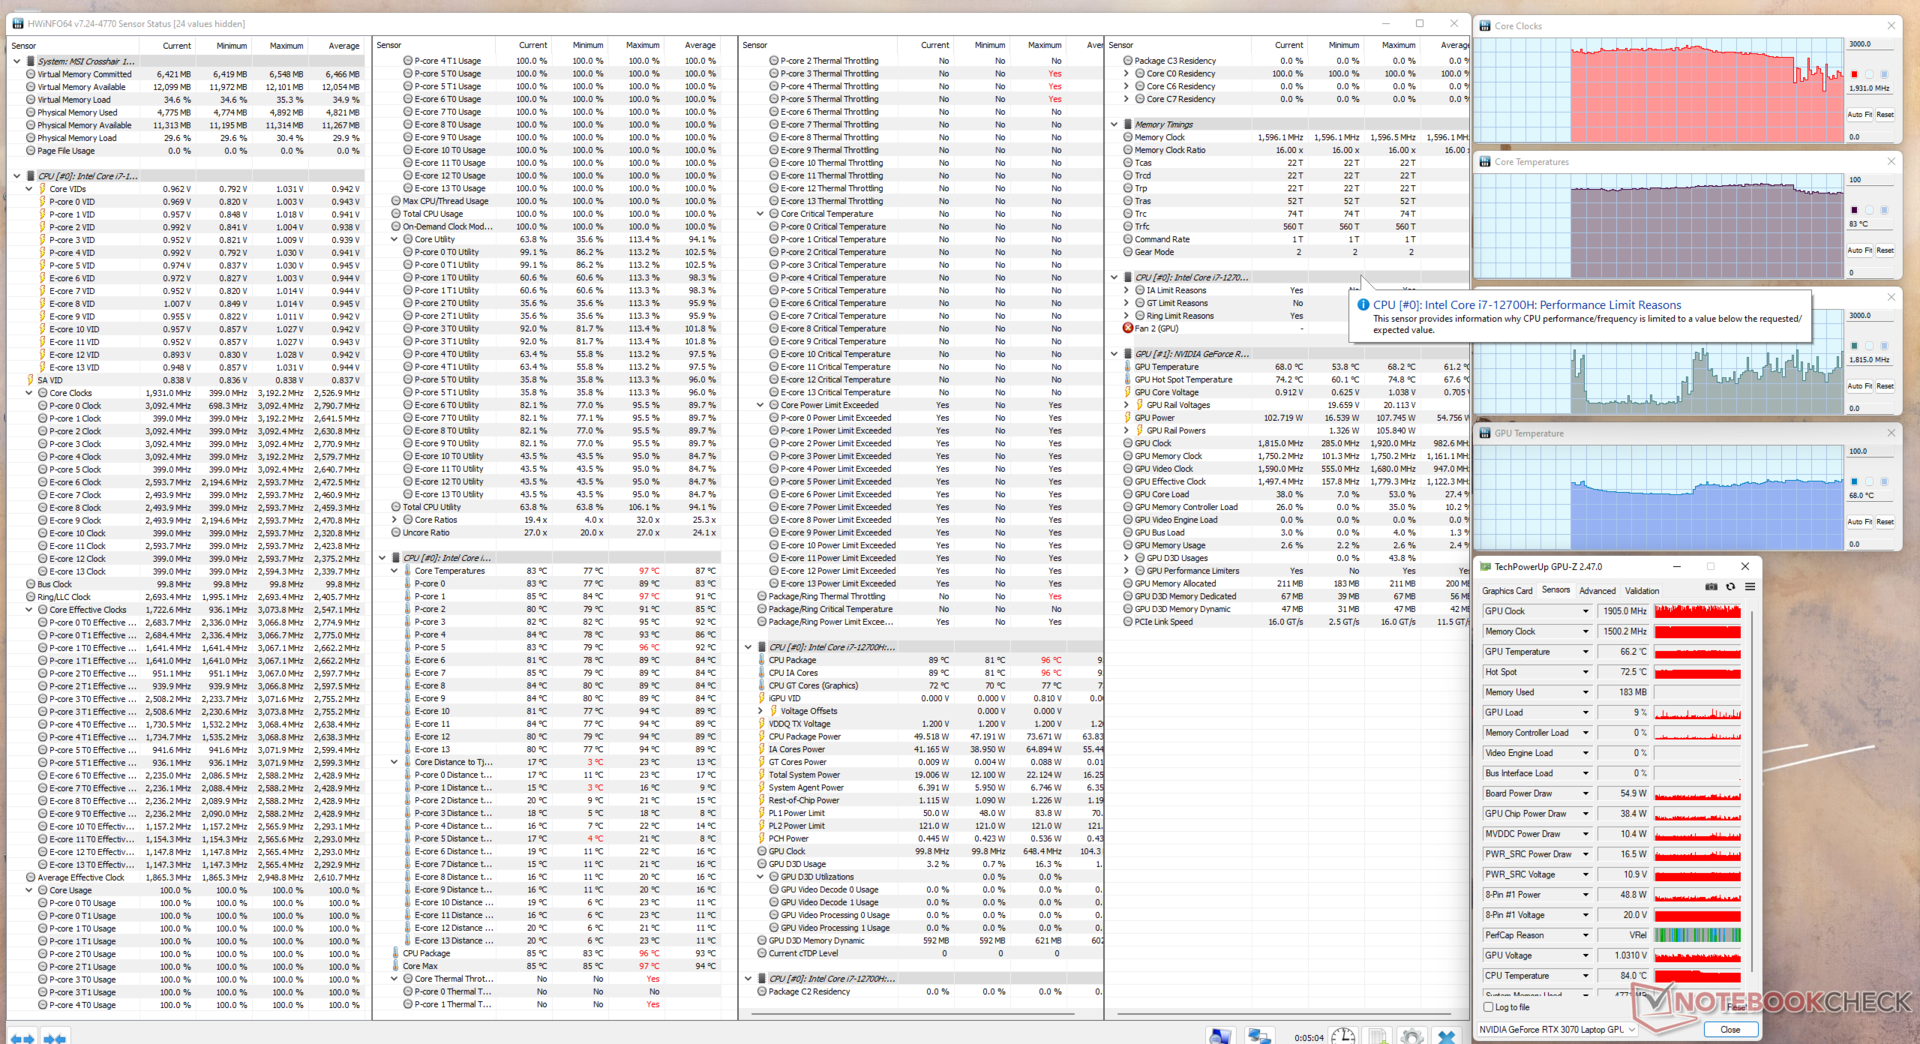
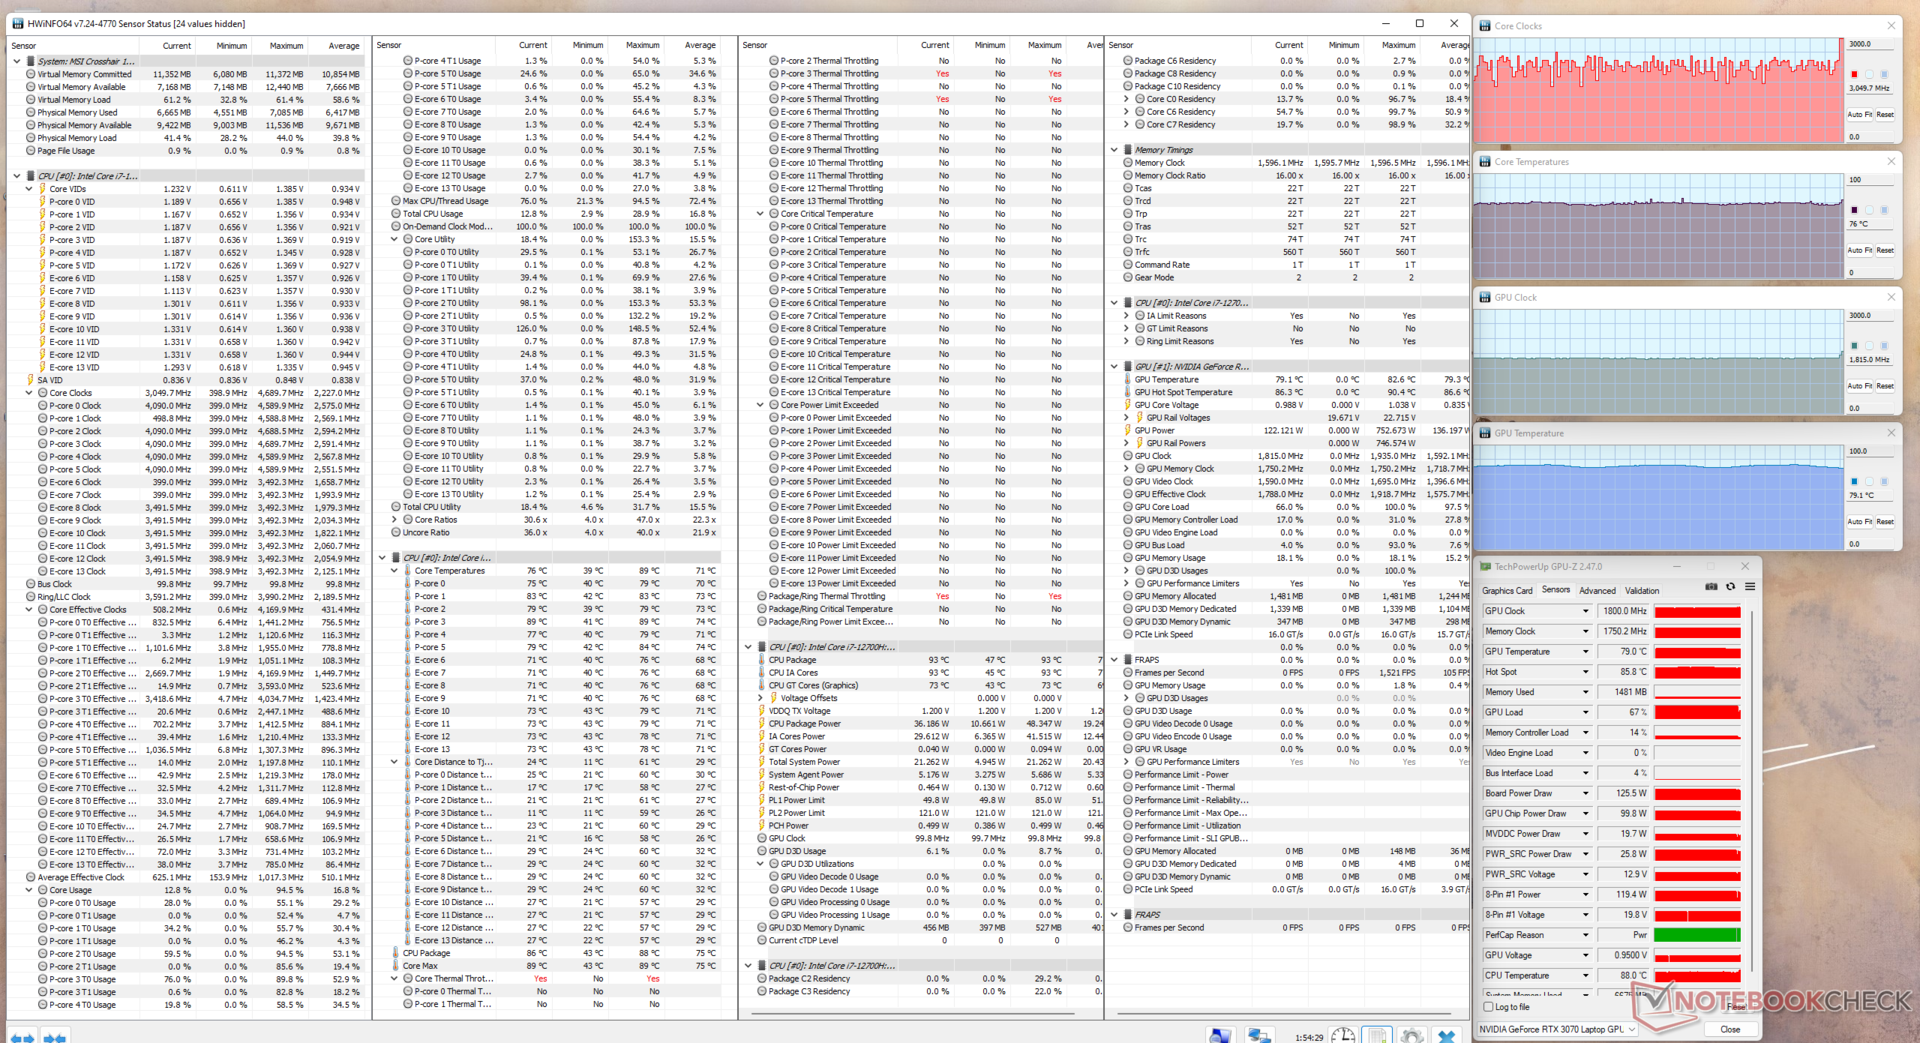
| Stresstest | CPU-klocka (GHz) | GPU-klocka (MHz) | Genomsnittlig CPU-temperatur (°C) | Genomsnittlig GPU-temperatur (°C) |
| System Idle | 0,4 | 210 | 36 | 40,1 |
| Prime95 | 2,53 | 210 | 51 | 41,3 |
| Prime95 + FurMark | 1,93 | 1,81 | 87 | 61,2 |
| Witcher 3 | 3,04 | 1,81 | 71 | 79,3 |
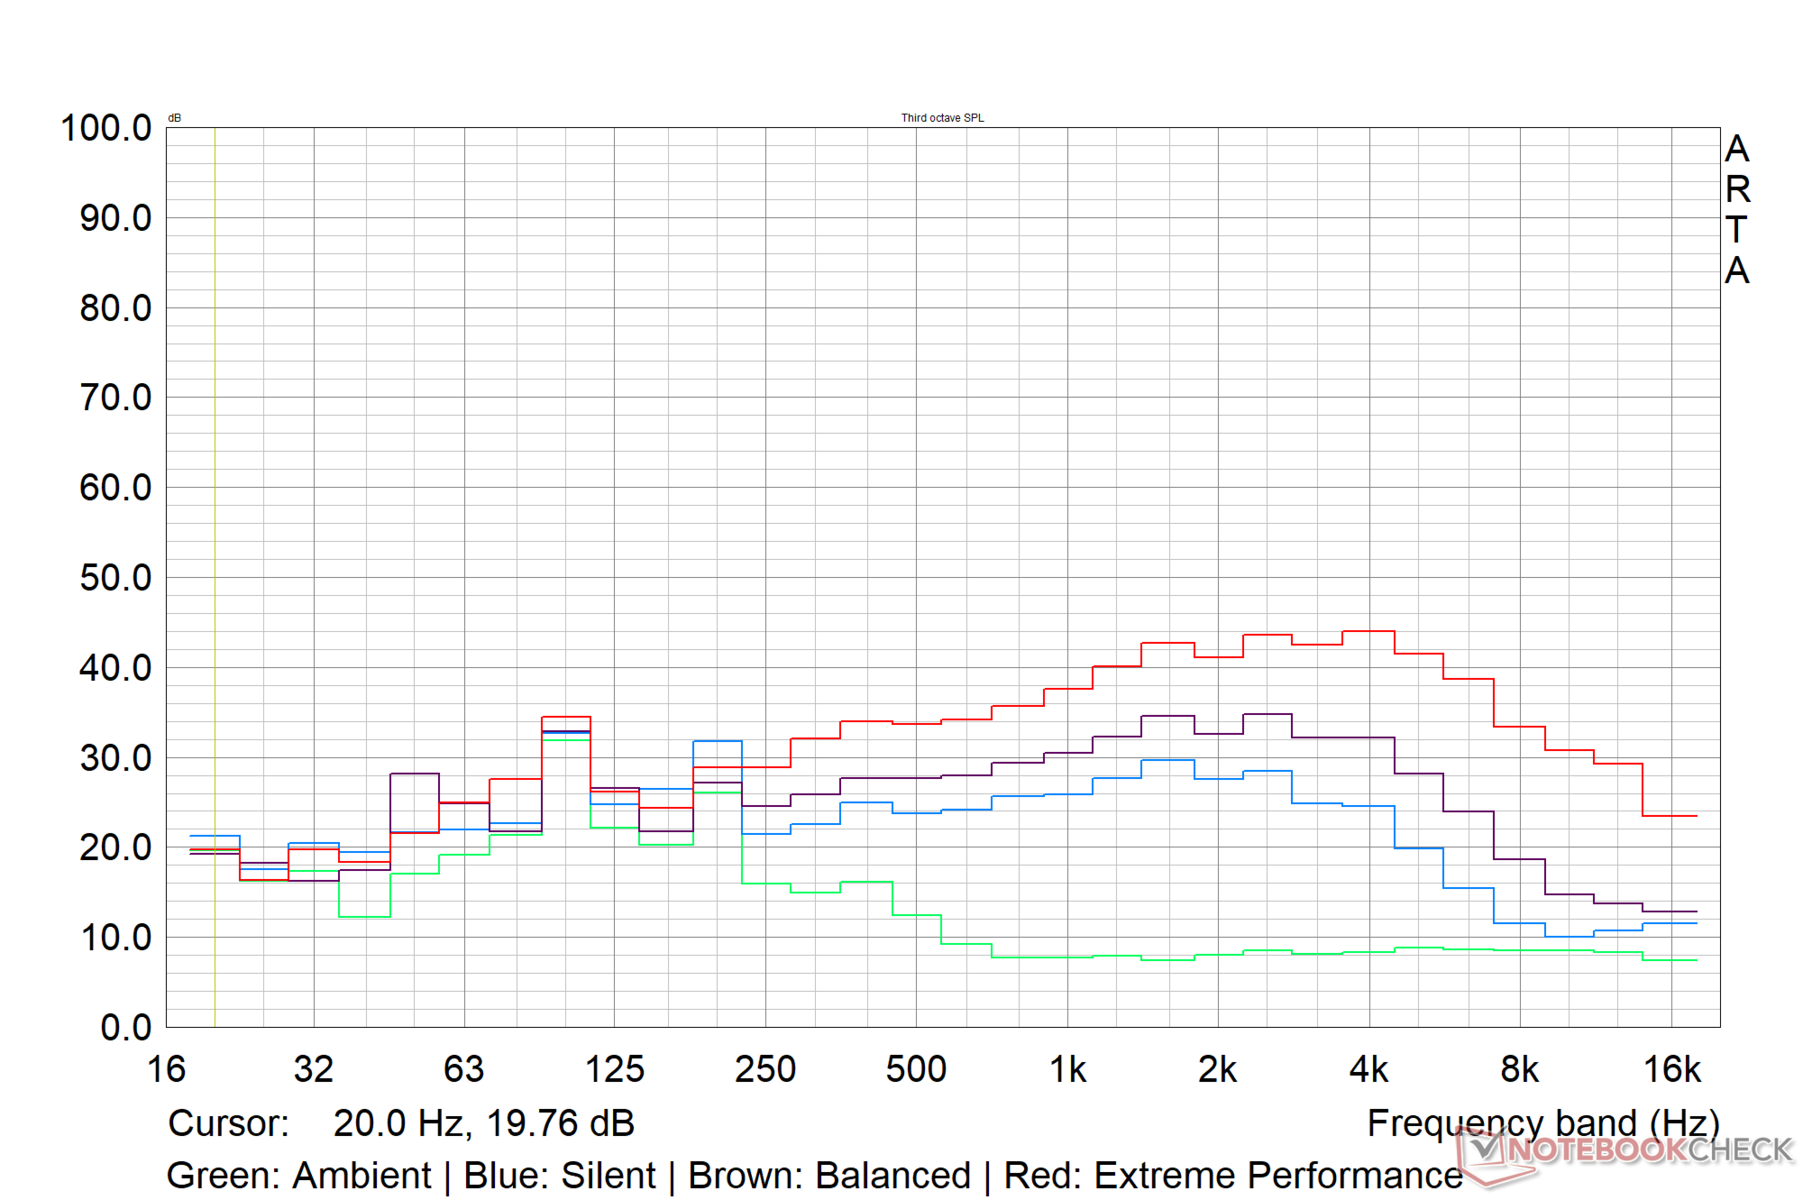
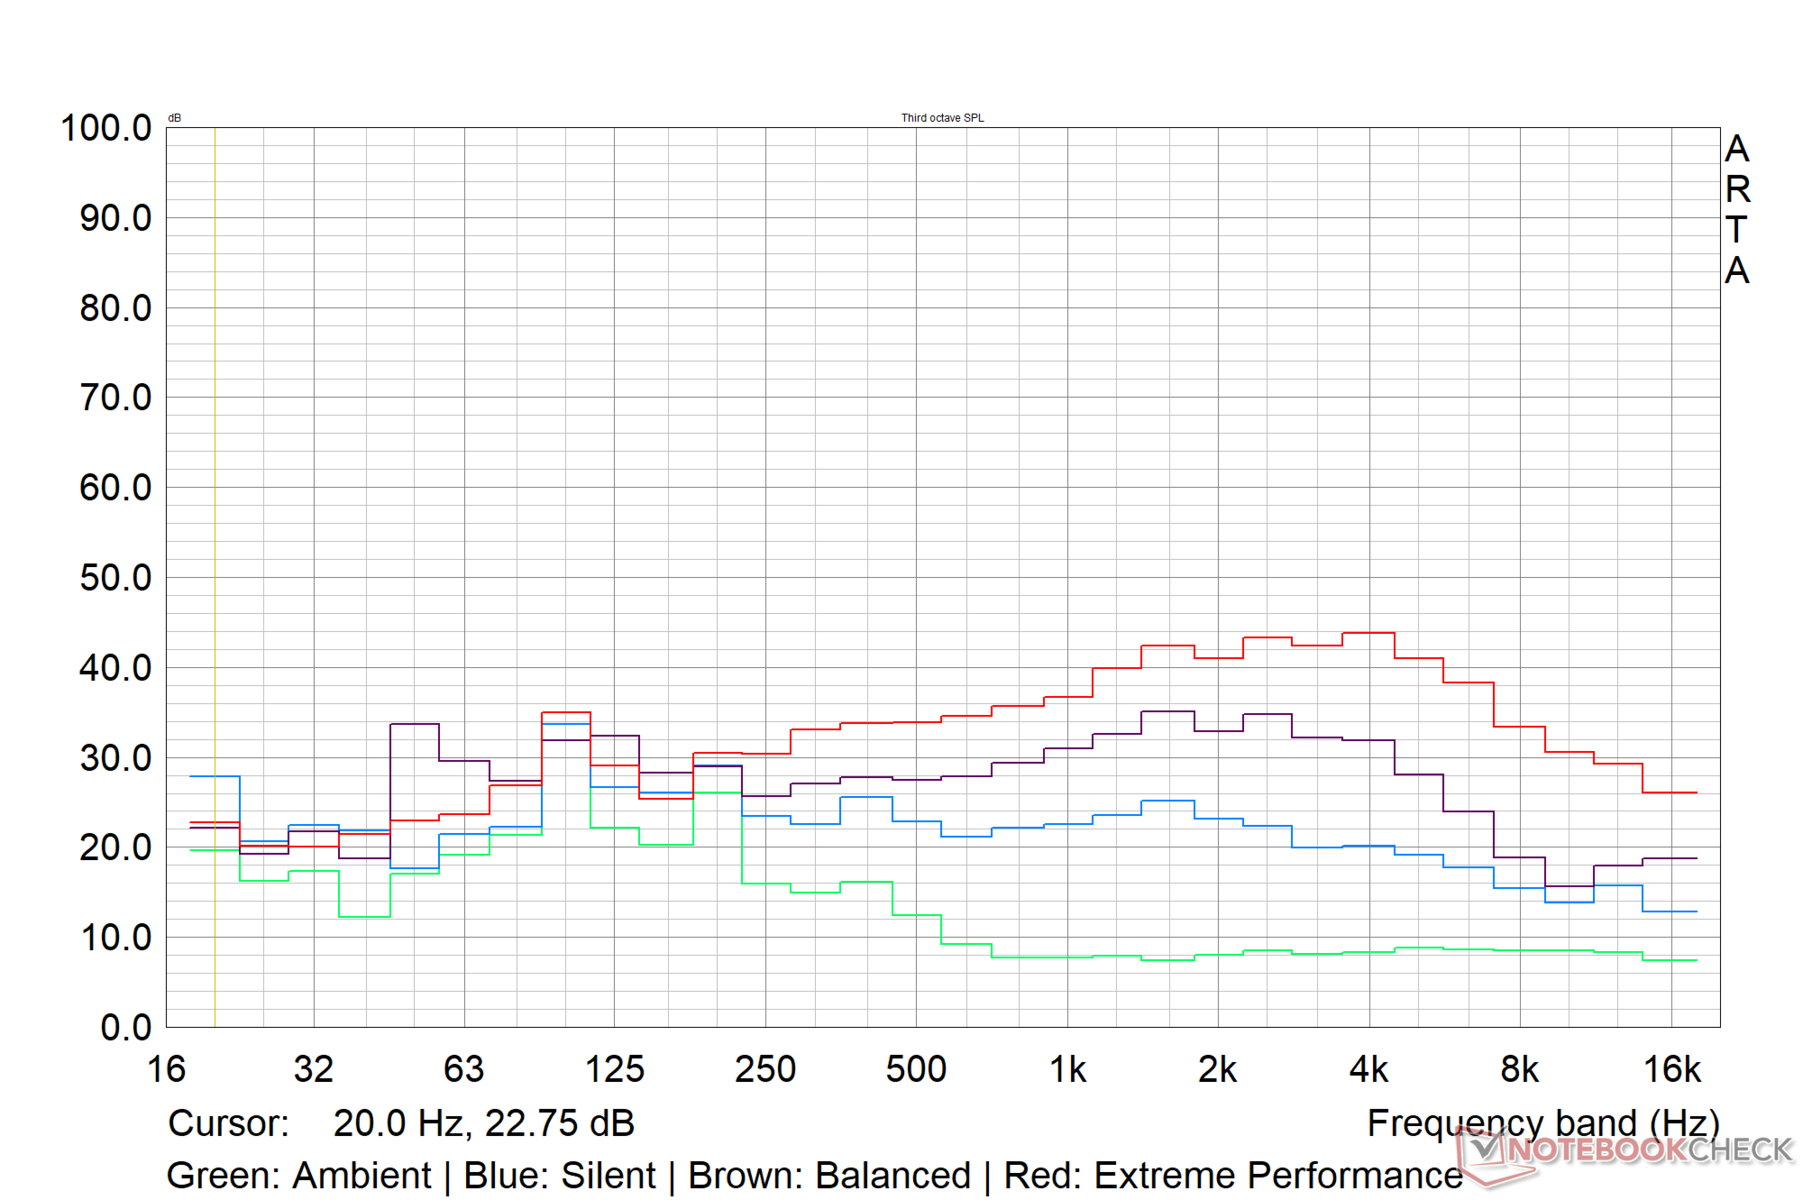
Högtalare
Crosshair 15 R6E har 2 högtalare på 2 W som ger 74,6 dB(A) ljudstyrka. Basresponsen är passabel, men mellan- och högljudda ljud är tydligt urskiljbara utan distorsion. Ljudkvaliteten är precis tjänlig för grundläggande multimediakonsumtion i ett medelstort rum.
Externt ljud kan anslutas via Bluetooth 5.2 eller via 3,5 mm kombo-ljuduttaget.
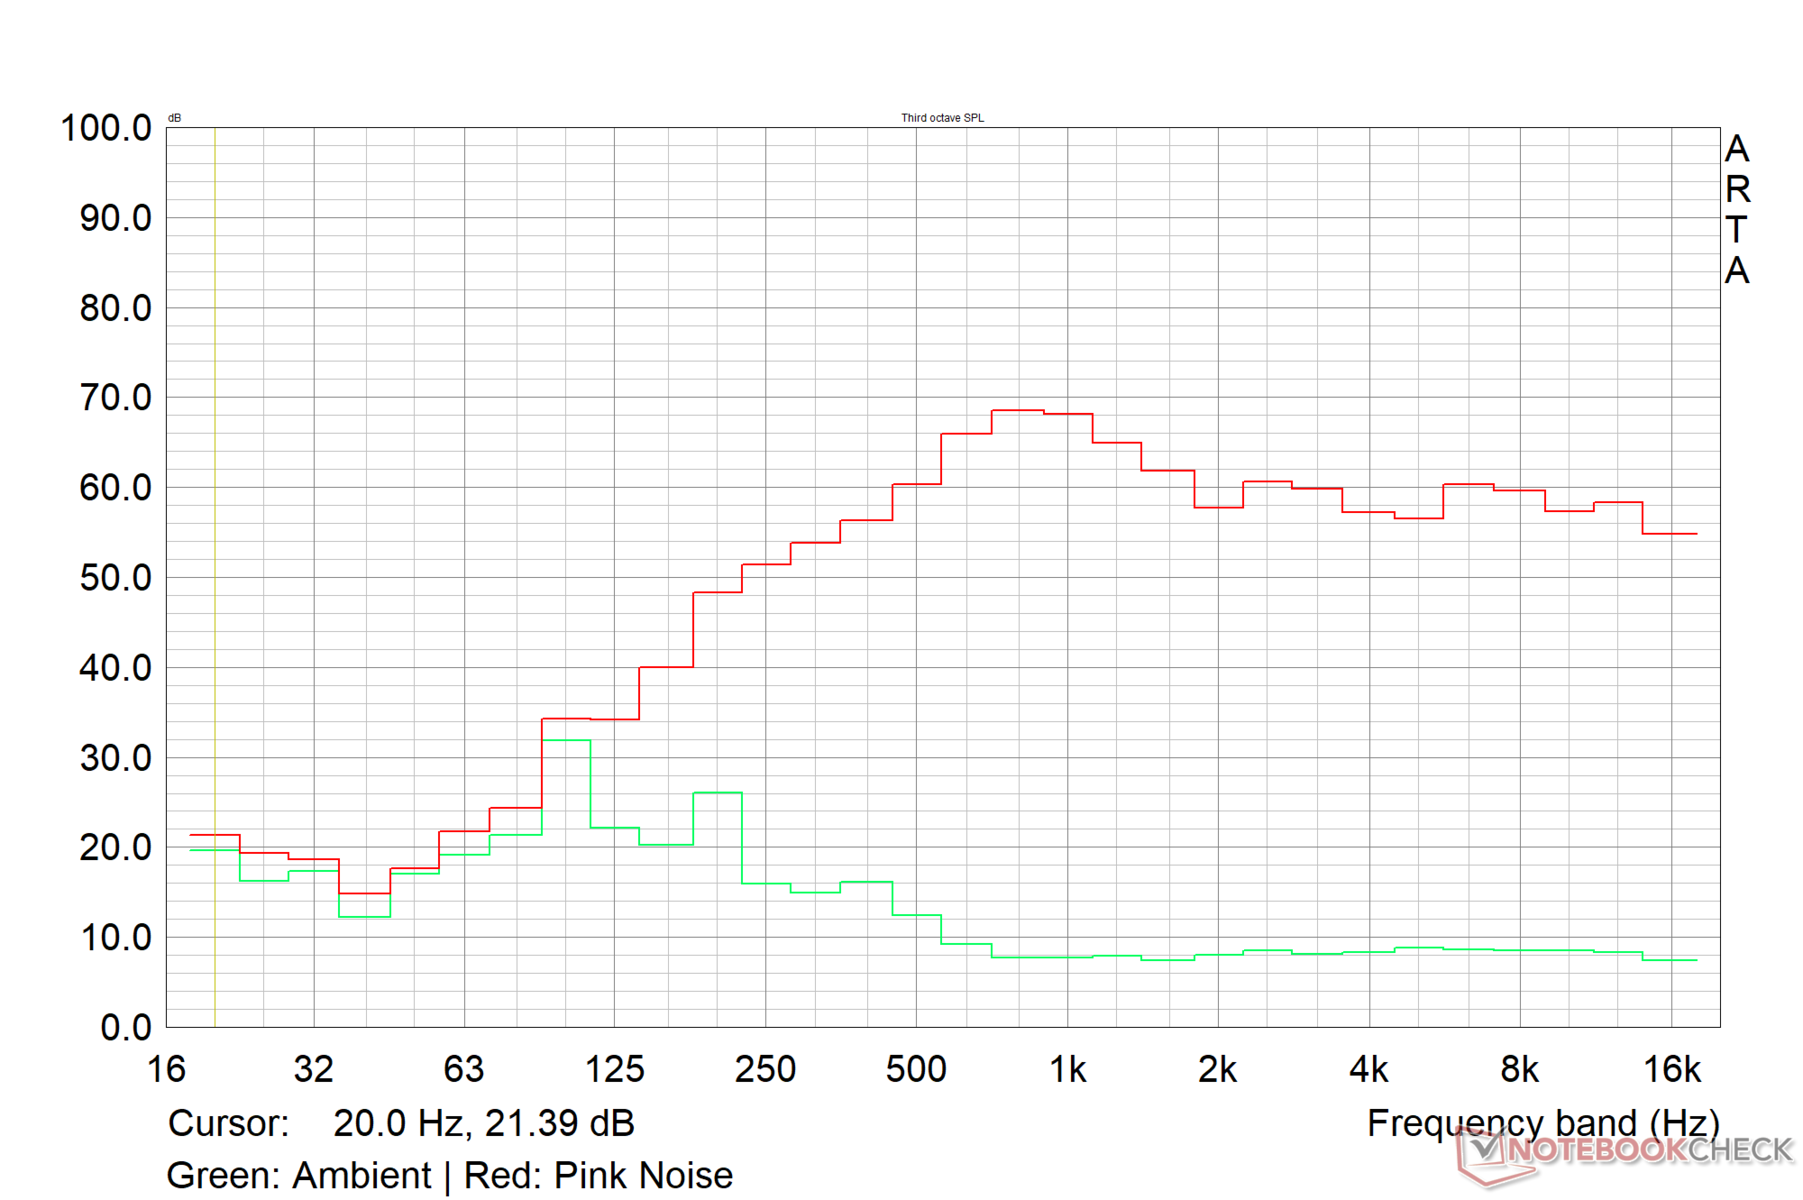
MSI Crosshair 15 R6E B12UGZ-050 ljudanalys
(±) | högtalarljudstyrkan är genomsnittlig men bra (74.6 dB)
Bas 100 - 315 Hz
(±) | reducerad bas - i genomsnitt 14.1% lägre än medianen
(±) | linjäriteten för basen är genomsnittlig (10% delta till föregående frekvens)
Mellan 400 - 2000 Hz
(±) | högre mellan - i genomsnitt 5.6% högre än median
(+) | mids är linjära (6.5% delta till föregående frekvens)
Högsta 2 - 16 kHz
(+) | balanserade toppar - endast 1.7% från medianen
(+) | toppar är linjära (4% delta till föregående frekvens)
Totalt 100 - 16 000 Hz
(±) | linjäriteten för det totala ljudet är genomsnittlig (15.1% skillnad mot median)
Jämfört med samma klass
» 32% av alla testade enheter i den här klassen var bättre, 6% liknande, 62% sämre
» Den bästa hade ett delta på 6%, genomsnittet var 18%, sämst var 132%
Jämfört med alla testade enheter
» 21% av alla testade enheter var bättre, 4% liknande, 75% sämre
» Den bästa hade ett delta på 4%, genomsnittet var 23%, sämst var 134%
Apple MacBook Pro 16 2021 M1 Pro ljudanalys
(+) | högtalare kan spela relativt högt (84.7 dB)
Bas 100 - 315 Hz
(+) | bra bas - bara 3.8% från medianen
(+) | basen är linjär (5.2% delta till föregående frekvens)
Mellan 400 - 2000 Hz
(+) | balanserad mellan - endast 1.3% från medianen
(+) | mids är linjära (2.1% delta till föregående frekvens)
Högsta 2 - 16 kHz
(+) | balanserade toppar - endast 1.9% från medianen
(+) | toppar är linjära (2.7% delta till föregående frekvens)
Totalt 100 - 16 000 Hz
(+) | det totala ljudet är linjärt (4.6% skillnad mot median)
Jämfört med samma klass
» 0% av alla testade enheter i den här klassen var bättre, 0% liknande, 100% sämre
» Den bästa hade ett delta på 5%, genomsnittet var 17%, sämst var 45%
Jämfört med alla testade enheter
» 0% av alla testade enheter var bättre, 0% liknande, 100% sämre
» Den bästa hade ett delta på 4%, genomsnittet var 23%, sämst var 134%
Energiförvaltning: Hög energiförbrukning vid maximal belastning
Effektförbrukning
Även i profilen Extreme Performance verkar strömförbrukningen vara relativt sparsam för den maskinvara som erbjuds. Asus TUF Dash F15 är 30 % mer sparsam än Crosshair 15 R6E i testerna Last max. och Witcher 3 på grund av dess CPU och GPU med lägre wattförbrukning
Strömförsörjningen är dimensionerad för 240 W, men vi observerade strömförbrukningar på upp till 290 W under en kombinerad Prime95- och FurMark-belastning. Den fluktuerande strömförbrukningen under denna körning är i linje med de fluktuerande CPU- och GPU-klockorna som vi hade observerat under stresstestet ovan.
| Av/Standby | |
| Låg belastning | |
| Hög belastning |
|
Förklaring:
min: | |
| MSI Crosshair 15 R6E B12UGZ-050 i7-12700H, GeForce RTX 3070 Laptop GPU, IPS-Level, 2560x1440, 15.6" | MSI Stealth GS66 12UGS i7-12700H, GeForce RTX 3070 Ti Laptop GPU, IPS-Level, 2560x1440, 15.6" | Lenovo Legion 5 Pro 16 G7 i7 RTX 3070Ti i7-12700H, GeForce RTX 3070 Ti Laptop GPU, IPS, 2560x1600, 16" | Asus TUF Dash F15 FX517ZR i7-12650H, GeForce RTX 3070 Laptop GPU, IPS, 2560x1440, 15.6" | Schenker XMG Neo 15 (Ryzen 9 6900HX, RTX 3070 Ti) R9 6900HX, GeForce RTX 3070 Ti Laptop GPU, IPS, 2560x1440, 15.6" | Genomsnitt NVIDIA GeForce RTX 3070 Laptop GPU | Genomsnitt av klass Gaming | |
|---|---|---|---|---|---|---|---|
| Power Consumption | -7% | -10% | 2% | -11% | -36% | -25% | |
| Idle Minimum * (Watt) | 9.6 | 11 -15% | 8.6 10% | 10 -4% | 13 -35% | 15.6 ? -63% | 13 ? -35% |
| Idle Average * (Watt) | 14.1 | 16 -13% | 17.6 -25% | 14 1% | 17 -21% | 20.1 ? -43% | 19 ? -35% |
| Idle Maximum * (Watt) | 14.96 | 23 -54% | 18.5 -24% | 20 -34% | 20 -34% | 29.4 ? -97% | 24.6 ? -64% |
| Load Average * (Watt) | 107.3 | 110 -3% | 110 -3% | 122 -14% | 89 17% | 110.8 ? -3% | 110.7 ? -3% |
| Witcher 3 ultra * (Watt) | 197 | 151 23% | 227 -15% | 138.6 30% | 200 -2% | ||
| Load Maximum * (Watt) | 289.93 | 230 21% | 294.6 -2% | 189 35% | 260 10% | 214 ? 26% | 259 ? 11% |
* ... mindre är bättre
Power Consumption - The Witcher 3 / Stress test
Power Consumption - External monitor
Batteritid
Batteritesterna utfördes i profilen Balanced (balanserad) med skärmens uppdateringsfrekvens inställd på 60 Hz. Vår Crosshair 15 R6E B12UGZ var utrustad med ett 90 WHr-batteri med fyra celler som ger hyfsade körtider i vårt standardiserade Wi-Fi-sökningstest vid 150 nits. Backup för videouppspelning är strax under 9 timmars gränsen vid 150 nits med alla radion avstängd.
MSI erbjuder även varianten Crosshair R6E B12UEZ som levereras med ett 3-cellsbatteri med 56,5 WHr.
| MSI Crosshair 15 R6E B12UGZ-050 i7-12700H, GeForce RTX 3070 Laptop GPU, 90 Wh | MSI Stealth GS66 12UGS i7-12700H, GeForce RTX 3070 Ti Laptop GPU, 99.9 Wh | Lenovo Legion 5 Pro 16 G7 i7 RTX 3070Ti i7-12700H, GeForce RTX 3070 Ti Laptop GPU, 80 Wh | Asus TUF Dash F15 FX517ZR i7-12650H, GeForce RTX 3070 Laptop GPU, 76 Wh | Schenker XMG Neo 15 (Ryzen 9 6900HX, RTX 3070 Ti) R9 6900HX, GeForce RTX 3070 Ti Laptop GPU, 93 Wh | Genomsnitt av klass Gaming | |
|---|---|---|---|---|---|---|
| Batteridrifttid | 4% | -35% | 18% | 34% | 5% | |
| H.264 (h) | 8.9 | 6.3 -29% | 5.8 -35% | 10.7 20% | 8.32 ? -7% | |
| WiFi v1.3 (h) | 7.3 | 5.4 -26% | 5.4 -26% | 7 -4% | 10.9 49% | 7.11 ? -3% |
| Witcher 3 ultra (h) | 1.6 | |||||
| Load (h) | 1.2 | 1.6 33% | 0.6 -50% | 2.3 92% | 1.6 33% | 1.502 ? 25% |
| Reader / Idle (h) | 7.8 | 10.8 | 8.27 ? |
För
Emot
Domslut: Pulse GL66 reskin som gör många saker rätt

Bärbara datorer med tema på specifika spel har i allmänhet en begränsad attraktionskraft utöver fans av spelet i fråga. MSI Crosshair 15 Rainbow Six: Extraction Edition, som har fått sitt namn efter Ubisofts populära FPS-serie för samarbete, är det enda Crosshair 15-modellen som erbjuds i år
Chassit är i huvudsak en upprepning av Pulse GL66 med kraftigt lånade designelement från spelet. MSI har till och med gått så långt som att ersätta sin egen logotyp på displaylocket med Rainbow Six-logotypen: Extraction's. Du får också några godbitar i lådan, bland annat en mus med speltema, en musmatta och ett Deluxe-exemplar av själva spelet
Som sådan ärver Crosshair 15 R6E vissa brister från Pulse GL66:s konstruktion, såsom flex i tangentbordsdäcket och en icke-ideell portfördelning. Den bärbara datorn levereras dock med en mycket funktionell QHD 165 Hz-skärm som borde bjuda på bra resultat för både spel och innehållsskapande.
MSI Crosshair 15 Rainbow Six: Extraction's design kan finna begränsad attraktionskraft, men under skinnet får du en mycket kapabel midranger med bra displayegenskaper och tolerabla utsläpp."
Crosshair 15 R6E:s implementering av Core i7-12700H är inte den snabbaste vi sett. Den MSI Stealth GS66 och Lenovo Legion 5i Pro 16 G7 med samma processor presterar märkbart bättre i flerkärniga tester. Crosshair 15 R6E:s övergripande prestanda i spel kan vara bättre eller likvärdig med vissa bärbara datorer med RTX 3070 Ti-drift som t.ex Schenker XMG Neo 15, Acer Nitro 5, och MSI Katana GF66
Värme- och bulleremissioner är i stort sett tolerabla så länge du klarar av den balanserade prestandaprofilen. Strömförbrukningen är dock på den högre sidan, särskilt när det gäller strömförbrukningen vid maxbelastning och spelande
Även om du inte är ett fan av spelet kan MSI Crosshair 15 Rainbow Six: Extraction Edition förtjänar ett övervägande med tanke på den prestanda som erbjuds och prissättningen i förhållande till konkurrenterna.
Pris och tillgänglighet
MSI Crosshair 15 Rainbow Six: Extraction Edition finns på Amazon US för 2 149 dollar. I Indien säljs den bärbara datorn runt ₹1,90,990, men är för närvarande listad som out-of-stock på Amazon India och Flipkart.
MSI Crosshair 15 R6E B12UGZ-050
- 12/19/2022 v7 (old)
Vaidyanathan Subramaniam
Price comparison

