Debut för prestanda för Nvidia RTX 3500 Ada: Recension av HP ZBook Fury 16 G11 arbetsstation
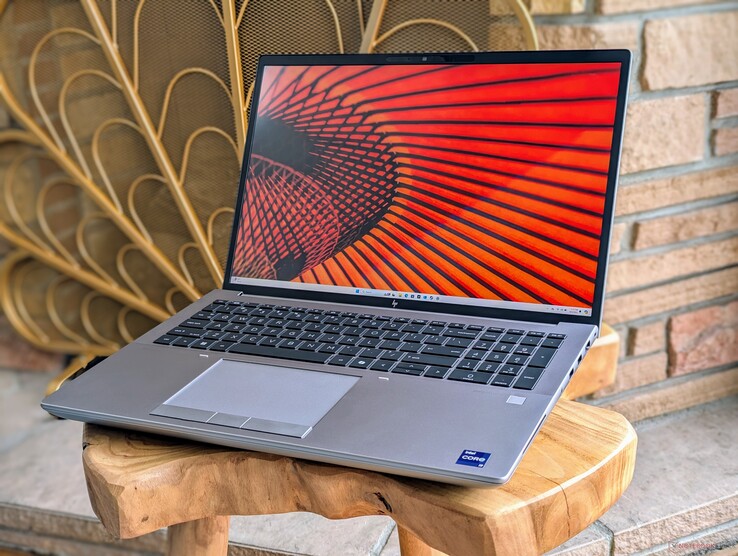
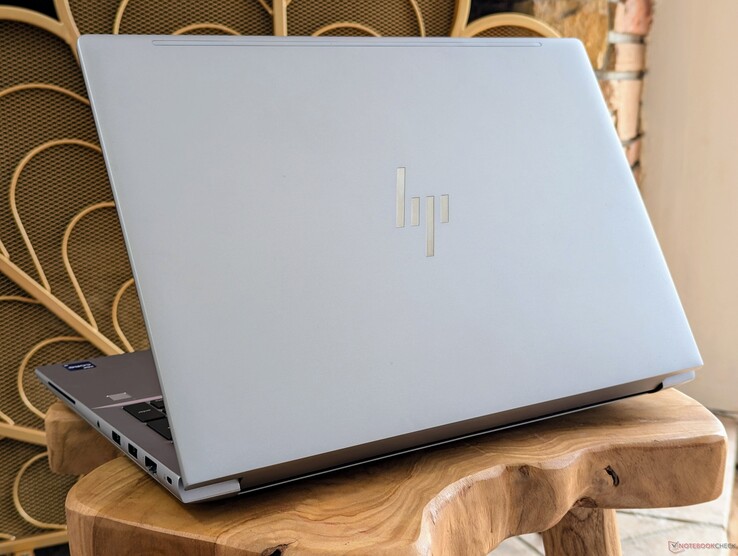
2024 ZBook Fury 16 G11 är en efterföljare till 2023 Fury 16 G10 genom att byta ut Raptor Lake-HX-processorer mot nyare Raptor Lake-HX Refresh-alternativ. Annars förblir chassit identiskt med Fury 16 G10 eller Fury 16 G9, liksom många av de konfigurerbara alternativen. Vi rekommenderar att du kollar in vår recension på Fury 16 G9 för att lära dig mer om de fysiska egenskaperna hos modellen.
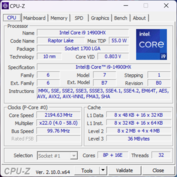
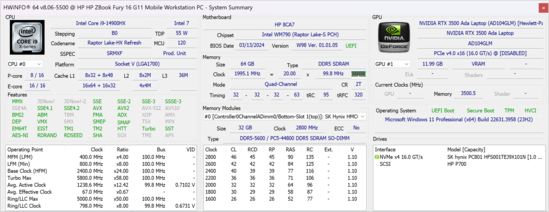
Vår testenhet är en övre mellanklasskonfiguration med Core i9-14900HX CPU, RTX 3500 Ada GPU och 120 Hz 3840 x 2400 IPS-skärm för cirka $ 3300. Andra SKU:er börjar med Core i5-13600HX upp till RTX 5000 Ada och 2400p OLED-pekskärm. Det finns inga Meteor Lake CPU-alternativ.
Konkurrenter till ZBook Fury 16 G11 inkluderar andra 16-tums arbetsstationer som Dell Precision 5690, Lenovo ThinkPad P16 G2eller Asus ProArt Studiobook 16.
Fler HP-recensioner:
Potentiella konkurrenter i jämförelse
Gradering | Version | Datum | Modell | Vikt | Höjd | Storlek | Upplösning | Pris |
|---|---|---|---|---|---|---|---|---|
| 85.9 % | v8 | 08/2024 | HP ZBook Fury 16 G11 i9-14900HX, RTX 3500 Ada Generation Laptop | 2.6 kg | 28.5 mm | 16.00" | 3840x2400 | |
| 92.3 % v7 (old) | v7 (old) | 09/2023 | HP ZBook Fury 16 G10 i9-13950HX, RTX 5000 Ada Generation Laptop | 2.6 kg | 28.5 mm | 16.00" | 3840x2400 | |
| 91 % v7 (old) | v7 (old) | 06/2023 | HP ZBook Fury 16 G9 i9-12950HX, RTX A5500 Laptop GPU | 2.6 kg | 28.5 mm | 16.00" | 3840x2400 | |
| 88.3 % v7 (old) | v7 (old) | 05/2024 | Dell Precision 5690 Ultra 9 185H, RTX 5000 Ada Generation Laptop | 2.3 kg | 22.17 mm | 16.00" | 3840x2400 | |
| 90.2 % v7 (old) | v7 (old) | 03/2024 | Lenovo ThinkPad P16 G2 21FA000FGE i7-13700HX, RTX 2000 Ada Generation Laptop | 3 kg | 30.23 mm | 16.00" | 2560x1600 | |
| 90.1 % v7 (old) | v7 (old) | 12/2023 | Lenovo ThinkPad P1 G6 21FV001KUS i7-13800H, GeForce RTX 4080 Laptop GPU | 1.9 kg | 17.5 mm | 16.00" | 3480x2400 | |
| 86.1 % v7 (old) | v7 (old) | 06/2023 | Asus ProArt Studiobook 16 OLED H7604 i9-13980HX, GeForce RTX 4070 Laptop GPU | 2.4 kg | 23.9 mm | 16.00" | 3200x2000 |
Topp 10...
» Topp 10: Bästa bärbara allround/multimediadatorerna
» Topp 10: Bästa bärbara speldatorerna
» Topp 10: Bärbara budget/kontorsdatorer
» Topp 10: Bästa bärbara kontors/premiumdatorerna
» Topp 10: Bärbara arbetsstationer
» Topp 10: De bästa små/kompakta bärbara datorerna
» Topp 10: Bästa ultrabooks
» Topp 10: Bästa hybriddatorerna
» Topp 10: Bästa surfplattorna
» Topp 10: Marknadens bästa smartphones
Information: Vi har nyligen uppdaterat vårt betygssystem och resultaten från version 8 är inte jämförbara med resultaten från version 7. Ytterligare information om detta finns här tillgänglig.
Obs: Vi har nyligen uppdaterat vårt betygssystem och resultaten från version 8 är inte jämförbara med resultaten från version 7. Mer information finns tillgänglig här .
Fallet
Ett enkelt sätt att skilja ZBook Fury 16 G11 från tidigare iterationer är att leta efter Co-Pilot-tangenten på tangentbordet. I övrigt är chassidesignen densamma som tidigare.
Anslutningsmöjligheter
SD-kortläsare
| SD Card Reader | |
| average JPG Copy Test (av. of 3 runs) | |
| Lenovo ThinkPad P1 G6 21FV001KUS (Toshiba Exceria Pro SDXC 64 GB UHS-II) | |
| HP ZBook Fury 16 G11 (Toshiba Exceria Pro SDXC 64 GB UHS-II) | |
| HP ZBook Fury 16 G10 (Toshiba Exceria Pro SDXC 64 GB UHS-II) | |
| HP ZBook Fury 16 G9 (PNY EliteX-PRO60) | |
| Asus ProArt Studiobook 16 OLED H7604 (Angelibird AV Pro V60) | |
| Lenovo ThinkPad P16 G2 21FA000FGE | |
| maximum AS SSD Seq Read Test (1GB) | |
| HP ZBook Fury 16 G11 (Toshiba Exceria Pro SDXC 64 GB UHS-II) | |
| Lenovo ThinkPad P1 G6 21FV001KUS (Toshiba Exceria Pro SDXC 64 GB UHS-II) | |
| HP ZBook Fury 16 G10 (Toshiba Exceria Pro SDXC 64 GB UHS-II) | |
| HP ZBook Fury 16 G9 (PNY EliteX-PRO60) | |
| Lenovo ThinkPad P16 G2 21FA000FGE | |
| Asus ProArt Studiobook 16 OLED H7604 (Angelibird AV Pro V60) | |
Kommunikation
WLAN har uppgraderats från Intel AX211 till BE200 för korrekt stöd för Wi-Fi 7. I praktiken kommer dock de flesta användare fortfarande att ansluta till Wi-Fi 6 eller 6E accesspunkter.
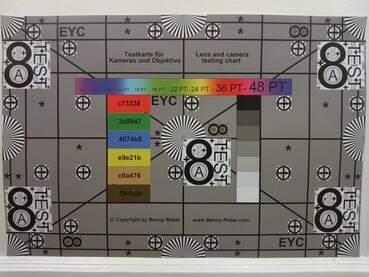
Webbkamera
Underhåll
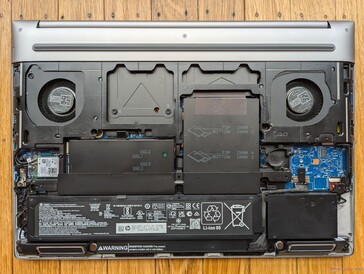
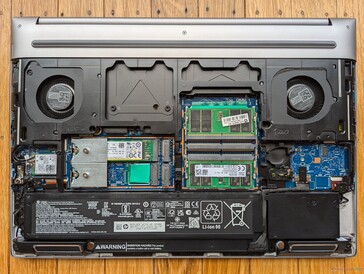
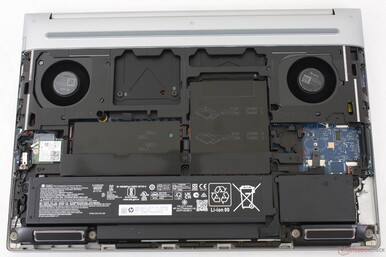
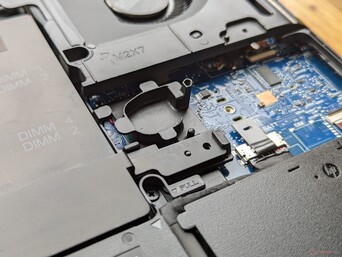
HP har skrytit med verktygslös service för sin Fury 16-serie sedan G9-modellen tidigare förra året. Medan bottenpanelen lätt kunde skjutas av utan verktyg, skyddades RAM- och SODIMM-modulerna fortfarande av ett aluminiumhölje som krävde en skruvmejsel för att avlägsnas. Detta aluminiumskydd har fått en ny design med spärrar istället för skruvar på G11-modellen, vilket innebär att användare nu kan installera RAM-moduler utan några verktyg alls.
SSD-enheterna sitter dock fortfarande fast på moderkortet med skruvar och därför behövs fortfarande en skruvmejsel för att byta ut enheterna. Systemet kan stödja upp till fyra SSD-enheter och fyra RAM-moduler.
Hållbarhet
Förpackningen är helt återvinningsbar och består till största delen av papper. Nätadaptern är det enda objektet som är förpackat i plast.
Tillbehör och garanti
Lådan innehåller inga extra tillbehör utöver nätadapter och papper. En treårig tillverkargaranti ingår som standard om den köps i USA.
Display
Fem olika displayalternativ finns tillgängliga enligt följande. Vår specifika testenhet levereras med den fetmarkerade panelen.
- 3840 x 2400, OLED, pekskärm, blank, 400 nits, 100% DCI-P3, 60 Hz
- 3840 x 2400, IPS, beröringsfri, matt, 500 nits, 100% DCI-P3, 120 Hz
- 1920 x 1200, IPS, beröringsfri, matt, 400 nits, 100 % sRGB, 60 Hz
- 1920 x 1200, IPS, beröringsfri, matt, 1000 nits, 100 % sRGB, 60 Hz, Sure View Integrated
- 1920 x 1200, IPS, pekskärm, blank, 400 nits, 100 % sRGB, 60 Hz
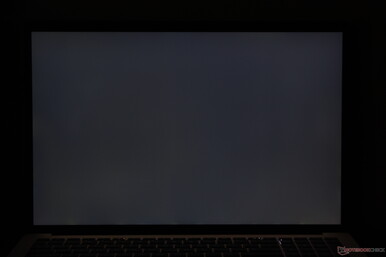
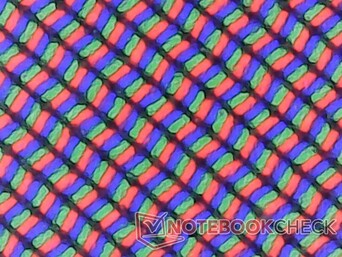
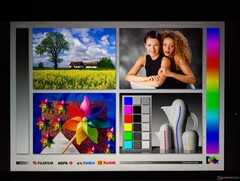
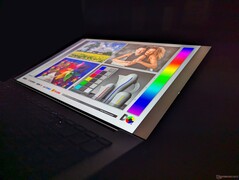
Just den här panelen råkar vara samma som levererades med vår ZBook Fury 16 G10 och den visuella upplevelsen förblir därför identisk. Köpare som avser att använda den bärbara datorn utomhus kanske vill överväga 1000-nit-alternativet, men den här panelen är tyvärr knuten till Sure View som avsevärt begränsar betraktningsvinklarna vilket gör skärmen svårare att dela med andra. Samtidigt erbjuder OLED-alternativet mycket överlägsna svartnivåer för att tillgodose digitala konstnärer och multimediaredigeringsapplikationer, men dess glansiga överlägg och låga uppdateringsfrekvens på 60 Hz kan vara en nackdel.
Windows dynamiska uppdateringsfrekvens stöds endast ner till 60 Hz på vår konfigurerade panel.
| |||||||||||||||||||||||||
Distribution av ljusstyrkan: 83 %
Mitt på batteriet: 457.6 cd/m²
Kontrast: 1064:1 (Svärta: 0.43 cd/m²)
ΔE ColorChecker Calman: 2.78 | ∀{0.5-29.43 Ø4.77}
calibrated: 1.37
ΔE Greyscale Calman: 2 | ∀{0.09-98 Ø5}
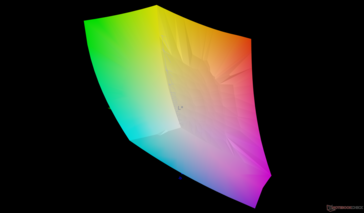
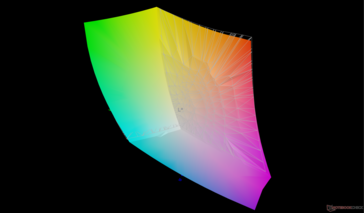
86% AdobeRGB 1998 (Argyll 3D)
99.9% sRGB (Argyll 3D)
98.4% Display P3 (Argyll 3D)
Gamma: 2.28
CCT: 6806 K
| HP ZBook Fury 16 G11 AUO87A8, IPS, 3840x2400, 16", 120 Hz | HP ZBook Fury 16 G10 AUO87A8, IPS, 3840x2400, 16", 120 Hz | HP ZBook Fury 16 G9 BOE0A52, IPS, 3840x2400, 16", 60 Hz | Dell Precision 5690 Samsung 160YV03, OLED, 3840x2400, 16", 60 Hz | Lenovo ThinkPad P16 G2 21FA000FGE MNG007DA1-9, IPS LED, 2560x1600, 16", 165 Hz | Lenovo ThinkPad P1 G6 21FV001KUS Samsung ATNA60YV04-0, OLED, 3480x2400, 16", 60 Hz | Asus ProArt Studiobook 16 OLED H7604 ATNA60BX01-1, OLED, 3200x2000, 16", 120 Hz | |
|---|---|---|---|---|---|---|---|
| Display | 0% | -0% | 4% | -15% | 5% | 2% | |
| Display P3 Coverage (%) | 98.4 | 98 0% | 97.4 -1% | 99.8 1% | 71 -28% | 99.8 1% | 99.6 1% |
| sRGB Coverage (%) | 99.9 | 99.9 0% | 99.9 0% | 100 0% | 99.2 -1% | 100 0% | 100 0% |
| AdobeRGB 1998 Coverage (%) | 86 | 86.2 0% | 86.3 0% | 96.6 12% | 73.2 -15% | 97.9 14% | 89.4 4% |
| Response Times | -9% | -11% | 83% | -16% | 82% | 93% | |
| Response Time Grey 50% / Grey 80% * (ms) | 11.4 ? | 11.9 ? -4% | 13.7 ? -20% | 1.7 ? 85% | 12.8 ? -12% | 1.69 ? 85% | 0.59 ? 95% |
| Response Time Black / White * (ms) | 8.4 ? | 9.6 ? -14% | 8.6 ? -2% | 1.7 ? 80% | 10.1 ? -20% | 1.73 ? 79% | 0.79 ? 91% |
| PWM Frequency (Hz) | 60 ? | 60 ? | 240 ? | ||||
| Screen | 19% | -25% | -8% | -7% | 19% | 179% | |
| Brightness middle (cd/m²) | 457.6 | 514.6 12% | 530.5 16% | 348.1 -24% | 510 11% | 375.1 -18% | 349 -24% |
| Brightness (cd/m²) | 466 | 495 6% | 476 2% | 351 -25% | 517 11% | 379 -19% | 350 -25% |
| Brightness Distribution (%) | 83 | 90 8% | 83 0% | 97 17% | 89 7% | 98 18% | 95 14% |
| Black Level * (cd/m²) | 0.43 | 0.46 -7% | 0.57 -33% | 0.37 14% | 0.02 95% | ||
| Contrast (:1) | 1064 | 1119 5% | 931 -12% | 1378 30% | 17450 1540% | ||
| Colorchecker dE 2000 * | 2.78 | 2.4 14% | 2.26 19% | 4.18 -50% | 2.6 6% | 1.16 58% | 2.1 24% |
| Colorchecker dE 2000 max. * | 5.53 | 4.86 12% | 6.68 -21% | 5.2 6% | 2.94 47% | 5.5 1% | |
| Colorchecker dE 2000 calibrated * | 1.37 | 0.4 71% | 4.73 -245% | 0.97 29% | 2.3 -68% | 2.1 -53% | |
| Greyscale dE 2000 * | 2 | 1 50% | 1 50% | 1.7 15% | 3.6 -80% | 1.4 30% | 1.2 40% |
| Gamma | 2.28 96% | 2.3 96% | 2.28 96% | 2.2 100% | 2.26 97% | 2.2 100% | 2.19 100% |
| CCT | 6806 96% | 6553 99% | 6543 99% | 6198 105% | 5969 109% | 6325 103% | 6545 99% |
| Totalt genomsnitt (program/inställningar) | 3% /
11% | -12% /
-17% | 26% /
10% | -13% /
-10% | 35% /
27% | 91% /
129% |
* ... mindre är bättre
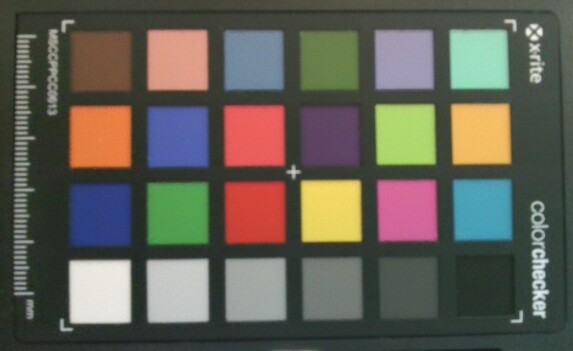
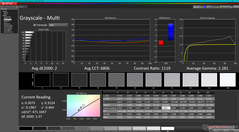
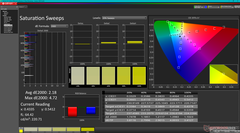
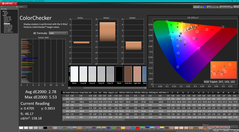
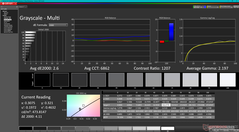
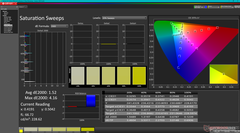
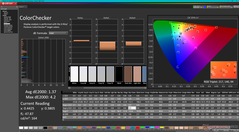
Skärmen är välkalibrerad mot P3-standarden med genomsnittliga deltaE-värden för gråskala och färg på bara 2 respektive 2,18. Att kalibrera panelen ytterligare med vår X-Rite-kolorimeter skulle bara förbättra noggrannheten något och vara onödigt för de flesta användare.
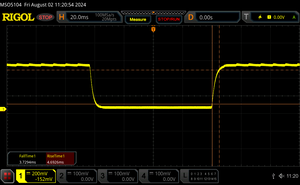
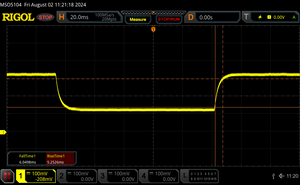
Visa svarstider
| ↔ Svarstid svart till vitt | ||
|---|---|---|
| 8.4 ms ... stiga ↗ och falla ↘ kombinerat | ↗ 4.7 ms stiga | |
| ↘ 3.7 ms hösten | ||
| Skärmen visar snabba svarsfrekvenser i våra tester och bör passa för spel. I jämförelse sträcker sig alla testade enheter från 0.1 (minst) till 240 (maximalt) ms. » 23 % av alla enheter är bättre. Det betyder att den uppmätta svarstiden är bättre än genomsnittet av alla testade enheter (20.2 ms). | ||
| ↔ Svarstid 50 % grått till 80 % grått | ||
| 11.4 ms ... stiga ↗ och falla ↘ kombinerat | ↗ 5.3 ms stiga | |
| ↘ 6.1 ms hösten | ||
| Skärmen visar bra svarsfrekvens i våra tester, men kan vara för långsam för konkurrenskraftiga spelare. I jämförelse sträcker sig alla testade enheter från 0.165 (minst) till 636 (maximalt) ms. » 24 % av alla enheter är bättre. Det betyder att den uppmätta svarstiden är bättre än genomsnittet av alla testade enheter (31.6 ms). | ||
Skärmflimmer / PWM (Puls-Width Modulation)
| Skärmflimmer / PWM upptäcktes inte | |||
Som jämförelse: 53 % av alla testade enheter använder inte PWM för att dämpa skärmen. Om PWM upptäcktes mättes ett medelvärde av 8088 (minst: 5 - maximum: 343500) Hz. | |||
Prestanda - högre potential för turboladdning
Testförhållanden
Processor
Hoppar från Core i9-12950HX i ZBook Fury 16 G9 till Core i9-13950HX i ZBook Fury 16 G10 gav betydande prestandavinster. Tyvärr kan inte samma sak sägas när man hoppar från Core i9-13950HX i Fury 16 G10 till Core i9-14900HX i vår Fury 16 G11-konfiguration. Vinsterna är mycket mindre med cirka 10 till 15 procent innan man tar hänsyn till eventuell strypning. När strypningen har beaktats skulle den totala processorprestandan vara i stort sett identisk med Core i9-13950HX, vilket visas av våra CineBench R15 xT-looptestresultat nedan. Core i9-14900HX använder samma underliggande arkitektur som Core i9-13950HX och kan därför betraktas som en rebrand av förra årets alternativ. Således är det högre Turbo Boost-taket dess främsta fördel jämfört med den utgående processorn, även om de högre Turbo Boost-hastigheterna är kortlivade.
Den Lenovo Legion 9 16IRX9som levereras med samma Core i9-14900HX som vår HP, skulle köra upp till 20 procent snabbare, troligen på grund av dess mer kapabla kyllösning för att upprätthålla högre Turbo Boost-klockfrekvenser.
Cinebench R15 Multi Loop
Cinebench R23: Multi Core | Single Core
Cinebench R20: CPU (Multi Core) | CPU (Single Core)
Cinebench R15: CPU Multi 64Bit | CPU Single 64Bit
Blender: v2.79 BMW27 CPU
7-Zip 18.03: 7z b 4 | 7z b 4 -mmt1
Geekbench 6.5: Multi-Core | Single-Core
Geekbench 5.5: Multi-Core | Single-Core
HWBOT x265 Benchmark v2.2: 4k Preset
LibreOffice : 20 Documents To PDF
R Benchmark 2.5: Overall mean
| Geekbench 6.5 / Multi-Core | |
| Genomsnitt Intel Core i9-14900HX (13158 - 19665, n=37) | |
| HP ZBook Fury 16 G10 | |
| HP ZBook Fury 16 G11 | |
| Dell Precision 5000 5680 | |
| Dell Precision 5690 | |
| Lenovo ThinkPad P1 G6 21FV001KUS | |
| Lenovo ThinkPad P1 G6-21FV000DGE | |
| Lenovo ThinkPad P16v G1 AMD | |
| Geekbench 6.5 / Single-Core | |
| Genomsnitt Intel Core i9-14900HX (2419 - 3129, n=37) | |
| HP ZBook Fury 16 G10 | |
| HP ZBook Fury 16 G11 | |
| Lenovo ThinkPad P1 G6 21FV001KUS | |
| Lenovo ThinkPad P1 G6-21FV000DGE | |
| Dell Precision 5000 5680 | |
| Lenovo ThinkPad P16v G1 AMD | |
| Dell Precision 5690 | |
Cinebench R23: Multi Core | Single Core
Cinebench R20: CPU (Multi Core) | CPU (Single Core)
Cinebench R15: CPU Multi 64Bit | CPU Single 64Bit
Blender: v2.79 BMW27 CPU
7-Zip 18.03: 7z b 4 | 7z b 4 -mmt1
Geekbench 6.5: Multi-Core | Single-Core
Geekbench 5.5: Multi-Core | Single-Core
HWBOT x265 Benchmark v2.2: 4k Preset
LibreOffice : 20 Documents To PDF
R Benchmark 2.5: Overall mean
* ... mindre är bättre
AIDA64: FP32 Ray-Trace | FPU Julia | CPU SHA3 | CPU Queen | FPU SinJulia | FPU Mandel | CPU AES | CPU ZLib | FP64 Ray-Trace | CPU PhotoWorxx
| Performance rating | |
| Asus ProArt Studiobook 16 OLED H7604 | |
| Genomsnitt Intel Core i9-14900HX | |
| HP ZBook Fury 16 G10 | |
| HP ZBook Fury 16 G11 | |
| Dell Precision 5690 | |
| Lenovo ThinkPad P16 G2 21FA000FGE | |
| HP ZBook Fury 16 G9 | |
| Lenovo ThinkPad P1 G6 21FV001KUS | |
| AIDA64 / FP32 Ray-Trace | |
| Asus ProArt Studiobook 16 OLED H7604 | |
| Genomsnitt Intel Core i9-14900HX (13098 - 33474, n=36) | |
| HP ZBook Fury 16 G10 | |
| HP ZBook Fury 16 G11 | |
| Dell Precision 5690 | |
| Lenovo ThinkPad P16 G2 21FA000FGE | |
| HP ZBook Fury 16 G9 | |
| Lenovo ThinkPad P1 G6 21FV001KUS | |
| AIDA64 / FPU Julia | |
| Asus ProArt Studiobook 16 OLED H7604 | |
| Genomsnitt Intel Core i9-14900HX (67573 - 166040, n=36) | |
| HP ZBook Fury 16 G10 | |
| HP ZBook Fury 16 G11 | |
| HP ZBook Fury 16 G9 | |
| Dell Precision 5690 | |
| Lenovo ThinkPad P16 G2 21FA000FGE | |
| Lenovo ThinkPad P1 G6 21FV001KUS | |
| AIDA64 / CPU SHA3 | |
| Asus ProArt Studiobook 16 OLED H7604 | |
| Genomsnitt Intel Core i9-14900HX (3589 - 7979, n=36) | |
| HP ZBook Fury 16 G10 | |
| HP ZBook Fury 16 G11 | |
| Dell Precision 5690 | |
| Lenovo ThinkPad P16 G2 21FA000FGE | |
| HP ZBook Fury 16 G9 | |
| Lenovo ThinkPad P1 G6 21FV001KUS | |
| AIDA64 / CPU Queen | |
| Genomsnitt Intel Core i9-14900HX (118405 - 148966, n=36) | |
| HP ZBook Fury 16 G11 | |
| Asus ProArt Studiobook 16 OLED H7604 | |
| HP ZBook Fury 16 G10 | |
| Lenovo ThinkPad P1 G6 21FV001KUS | |
| Lenovo ThinkPad P16 G2 21FA000FGE | |
| HP ZBook Fury 16 G9 | |
| Dell Precision 5690 | |
| AIDA64 / FPU SinJulia | |
| Asus ProArt Studiobook 16 OLED H7604 | |
| Genomsnitt Intel Core i9-14900HX (10475 - 18517, n=36) | |
| HP ZBook Fury 16 G11 | |
| HP ZBook Fury 16 G10 | |
| Lenovo ThinkPad P16 G2 21FA000FGE | |
| HP ZBook Fury 16 G9 | |
| Dell Precision 5690 | |
| Lenovo ThinkPad P1 G6 21FV001KUS | |
| AIDA64 / FPU Mandel | |
| Asus ProArt Studiobook 16 OLED H7604 | |
| Genomsnitt Intel Core i9-14900HX (32543 - 83662, n=36) | |
| HP ZBook Fury 16 G10 | |
| HP ZBook Fury 16 G11 | |
| Dell Precision 5690 | |
| HP ZBook Fury 16 G9 | |
| Lenovo ThinkPad P16 G2 21FA000FGE | |
| Lenovo ThinkPad P1 G6 21FV001KUS | |
| AIDA64 / CPU AES | |
| Genomsnitt Intel Core i9-14900HX (86964 - 241777, n=36) | |
| Asus ProArt Studiobook 16 OLED H7604 | |
| HP ZBook Fury 16 G10 | |
| HP ZBook Fury 16 G11 | |
| HP ZBook Fury 16 G9 | |
| Dell Precision 5690 | |
| Lenovo ThinkPad P16 G2 21FA000FGE | |
| Lenovo ThinkPad P1 G6 21FV001KUS | |
| AIDA64 / CPU ZLib | |
| Asus ProArt Studiobook 16 OLED H7604 | |
| Genomsnitt Intel Core i9-14900HX (1054 - 2292, n=36) | |
| HP ZBook Fury 16 G11 | |
| HP ZBook Fury 16 G10 | |
| Dell Precision 5690 | |
| HP ZBook Fury 16 G9 | |
| Lenovo ThinkPad P1 G6 21FV001KUS | |
| Lenovo ThinkPad P16 G2 21FA000FGE | |
| AIDA64 / FP64 Ray-Trace | |
| Asus ProArt Studiobook 16 OLED H7604 | |
| Genomsnitt Intel Core i9-14900HX (6809 - 18349, n=36) | |
| HP ZBook Fury 16 G10 | |
| HP ZBook Fury 16 G11 | |
| Lenovo ThinkPad P16 G2 21FA000FGE | |
| Dell Precision 5690 | |
| Lenovo ThinkPad P1 G6 21FV001KUS | |
| HP ZBook Fury 16 G9 | |
| AIDA64 / CPU PhotoWorxx | |
| Dell Precision 5690 | |
| Asus ProArt Studiobook 16 OLED H7604 | |
| Genomsnitt Intel Core i9-14900HX (23903 - 54702, n=36) | |
| HP ZBook Fury 16 G10 | |
| HP ZBook Fury 16 G9 | |
| HP ZBook Fury 16 G11 | |
| Lenovo ThinkPad P16 G2 21FA000FGE | |
| Lenovo ThinkPad P1 G6 21FV001KUS | |
Stresstest
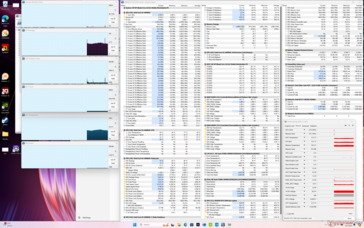
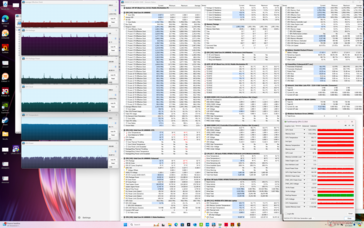
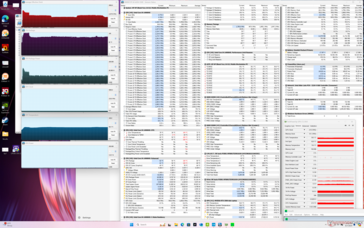
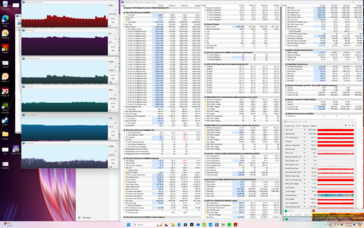
När Prime95 kördes för att stressa processorn ökade kärnklockfrekvenserna och paketets effektuttag till 3,7 GHz respektive 139 W, vilket varade i högst en minut med en kärntemperatur som också ökade till 99 C. Processorn stabiliserades så småningom på 2,3 GHz och 69 W för att bibehålla en mer hanterbar kärntemperatur på 82 C. Den relativt branta prestandaförlusten över tid leder till de gradvis lägre CineBench R15 xT-loopresultaten som nämns ovan.
CPU- och GPU-temperaturer när man kör högre belastningar som spel skulle stabiliseras på nästan samma värden som vi registrerade på förra årets ZBook Fury 16 G10 trots deras prestandaskillnader.
| Genomsnittlig CPU-klocka (GHz) | GPU-klocka (MHz) | Genomsnittlig CPU-temperatur (°C) | Genomsnittlig GPU-temperatur (°C) | |
| System i viloläge | -- | -- | 51 | 42 |
| Prime95 Stress | 2.2 - 2.6 | -- | 82 | 57 |
| Prime95 + FurMark Stress | 1.8 | 1995 | 81 | 65 |
| Cyberpunk 2077 Stress | 1.1 | 1845 | 81 | 69 |
Systemets prestanda
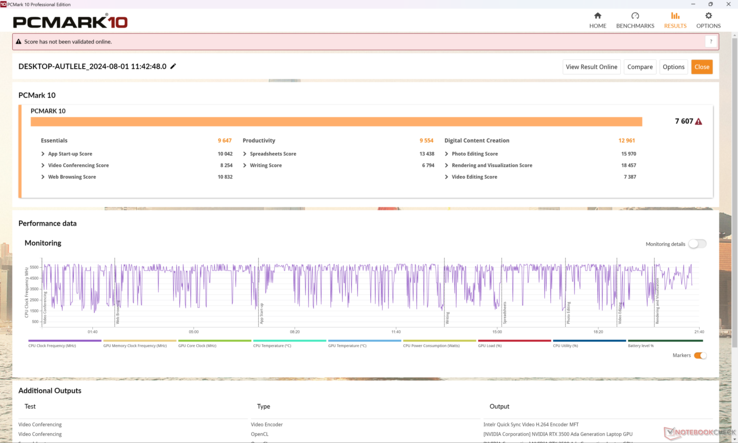
PCMark-resultaten liknar de som vi registrerade på förra årets ZBook Fury 16 G10, vilket tyder på att ZBook Fury 16 G11 inte kommer att köra de flesta dagliga uppgifter snabbare än sin föregångare.
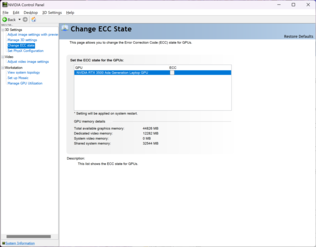
Kom ihåg att maximal RAM-hastighet är begränsad till endast 4000 MT/s om den konfigureras med 128 GB minne på grund av begränsningarna i SODIMM-standarden. Modellen stöder både ECC-RAM och icke-ECC-RAM.
CrossMark: Overall | Productivity | Creativity | Responsiveness
WebXPRT 3: Overall
WebXPRT 4: Overall
Mozilla Kraken 1.1: Total
| PCMark 10 / Score | |
| HP ZBook Fury 16 G10 | |
| Dell Precision 5690 | |
| Lenovo ThinkPad P1 G6 21FV001KUS | |
| HP ZBook Fury 16 G11 | |
| Genomsnitt Intel Core i9-14900HX, NVIDIA RTX 3500 Ada Generation Laptop (n=1) | |
| Asus ProArt Studiobook 16 OLED H7604 | |
| Lenovo ThinkPad P16 G2 21FA000FGE | |
| HP ZBook Fury 16 G9 | |
| PCMark 10 / Essentials | |
| Lenovo ThinkPad P1 G6 21FV001KUS | |
| HP ZBook Fury 16 G10 | |
| Dell Precision 5690 | |
| Lenovo ThinkPad P16 G2 21FA000FGE | |
| HP ZBook Fury 16 G9 | |
| Asus ProArt Studiobook 16 OLED H7604 | |
| HP ZBook Fury 16 G11 | |
| Genomsnitt Intel Core i9-14900HX, NVIDIA RTX 3500 Ada Generation Laptop (n=1) | |
| PCMark 10 / Productivity | |
| Dell Precision 5690 | |
| Lenovo ThinkPad P1 G6 21FV001KUS | |
| Asus ProArt Studiobook 16 OLED H7604 | |
| HP ZBook Fury 16 G11 | |
| Genomsnitt Intel Core i9-14900HX, NVIDIA RTX 3500 Ada Generation Laptop (n=1) | |
| Lenovo ThinkPad P16 G2 21FA000FGE | |
| HP ZBook Fury 16 G10 | |
| HP ZBook Fury 16 G9 | |
| PCMark 10 / Digital Content Creation | |
| HP ZBook Fury 16 G10 | |
| HP ZBook Fury 16 G11 | |
| Genomsnitt Intel Core i9-14900HX, NVIDIA RTX 3500 Ada Generation Laptop (n=1) | |
| Lenovo ThinkPad P1 G6 21FV001KUS | |
| Dell Precision 5690 | |
| Asus ProArt Studiobook 16 OLED H7604 | |
| Lenovo ThinkPad P16 G2 21FA000FGE | |
| HP ZBook Fury 16 G9 | |
| CrossMark / Overall | |
| Asus ProArt Studiobook 16 OLED H7604 | |
| HP ZBook Fury 16 G11 | |
| Genomsnitt Intel Core i9-14900HX, NVIDIA RTX 3500 Ada Generation Laptop (n=1) | |
| HP ZBook Fury 16 G10 | |
| HP ZBook Fury 16 G9 | |
| Lenovo ThinkPad P16 G2 21FA000FGE | |
| Lenovo ThinkPad P1 G6 21FV001KUS | |
| Dell Precision 5690 | |
| CrossMark / Productivity | |
| Asus ProArt Studiobook 16 OLED H7604 | |
| HP ZBook Fury 16 G11 | |
| Genomsnitt Intel Core i9-14900HX, NVIDIA RTX 3500 Ada Generation Laptop (n=1) | |
| HP ZBook Fury 16 G10 | |
| HP ZBook Fury 16 G9 | |
| Dell Precision 5690 | |
| Lenovo ThinkPad P1 G6 21FV001KUS | |
| Lenovo ThinkPad P16 G2 21FA000FGE | |
| CrossMark / Creativity | |
| Asus ProArt Studiobook 16 OLED H7604 | |
| HP ZBook Fury 16 G11 | |
| Genomsnitt Intel Core i9-14900HX, NVIDIA RTX 3500 Ada Generation Laptop (n=1) | |
| Lenovo ThinkPad P16 G2 21FA000FGE | |
| HP ZBook Fury 16 G9 | |
| HP ZBook Fury 16 G10 | |
| Lenovo ThinkPad P1 G6 21FV001KUS | |
| Dell Precision 5690 | |
| CrossMark / Responsiveness | |
| Asus ProArt Studiobook 16 OLED H7604 | |
| HP ZBook Fury 16 G11 | |
| Genomsnitt Intel Core i9-14900HX, NVIDIA RTX 3500 Ada Generation Laptop (n=1) | |
| HP ZBook Fury 16 G10 | |
| HP ZBook Fury 16 G9 | |
| Dell Precision 5690 | |
| Lenovo ThinkPad P1 G6 21FV001KUS | |
| Lenovo ThinkPad P16 G2 21FA000FGE | |
| WebXPRT 3 / Overall | |
| HP ZBook Fury 16 G10 | |
| Asus ProArt Studiobook 16 OLED H7604 | |
| Lenovo ThinkPad P16 G2 21FA000FGE | |
| HP ZBook Fury 16 G11 | |
| Genomsnitt Intel Core i9-14900HX, NVIDIA RTX 3500 Ada Generation Laptop (n=1) | |
| Lenovo ThinkPad P1 G6 21FV001KUS | |
| HP ZBook Fury 16 G9 | |
| Dell Precision 5690 | |
| WebXPRT 4 / Overall | |
| HP ZBook Fury 16 G11 | |
| Genomsnitt Intel Core i9-14900HX, NVIDIA RTX 3500 Ada Generation Laptop (n=1) | |
| HP ZBook Fury 16 G10 | |
| Asus ProArt Studiobook 16 OLED H7604 | |
| Lenovo ThinkPad P1 G6 21FV001KUS | |
| HP ZBook Fury 16 G9 | |
| Dell Precision 5690 | |
| Mozilla Kraken 1.1 / Total | |
| Dell Precision 5690 | |
| HP ZBook Fury 16 G9 | |
| Lenovo ThinkPad P16 G2 21FA000FGE | |
| Lenovo ThinkPad P1 G6 21FV001KUS | |
| HP ZBook Fury 16 G10 | |
| HP ZBook Fury 16 G11 | |
| Genomsnitt Intel Core i9-14900HX, NVIDIA RTX 3500 Ada Generation Laptop (n=1) | |
| Asus ProArt Studiobook 16 OLED H7604 | |
* ... mindre är bättre
| PCMark 10 Score | 7607 poäng | |
Hjälp | ||
| AIDA64 / Memory Copy | |
| Dell Precision 5690 | |
| Genomsnitt Intel Core i9-14900HX (38028 - 83392, n=36) | |
| Asus ProArt Studiobook 16 OLED H7604 | |
| HP ZBook Fury 16 G10 | |
| HP ZBook Fury 16 G9 | |
| HP ZBook Fury 16 G11 | |
| Lenovo ThinkPad P16 G2 21FA000FGE | |
| Lenovo ThinkPad P1 G6 21FV001KUS | |
| AIDA64 / Memory Read | |
| Dell Precision 5690 | |
| Genomsnitt Intel Core i9-14900HX (43306 - 87568, n=36) | |
| Asus ProArt Studiobook 16 OLED H7604 | |
| HP ZBook Fury 16 G10 | |
| HP ZBook Fury 16 G11 | |
| HP ZBook Fury 16 G9 | |
| Lenovo ThinkPad P16 G2 21FA000FGE | |
| Lenovo ThinkPad P1 G6 21FV001KUS | |
| AIDA64 / Memory Write | |
| Dell Precision 5690 | |
| Genomsnitt Intel Core i9-14900HX (37146 - 80589, n=36) | |
| Asus ProArt Studiobook 16 OLED H7604 | |
| HP ZBook Fury 16 G10 | |
| HP ZBook Fury 16 G9 | |
| Lenovo ThinkPad P16 G2 21FA000FGE | |
| HP ZBook Fury 16 G11 | |
| Lenovo ThinkPad P1 G6 21FV001KUS | |
| AIDA64 / Memory Latency | |
| Dell Precision 5690 | |
| HP ZBook Fury 16 G10 | |
| Lenovo ThinkPad P16 G2 21FA000FGE | |
| HP ZBook Fury 16 G11 | |
| HP ZBook Fury 16 G9 | |
| Asus ProArt Studiobook 16 OLED H7604 | |
| Lenovo ThinkPad P1 G6 21FV001KUS | |
| Genomsnitt Intel Core i9-14900HX (76.1 - 105, n=36) | |
* ... mindre är bättre
DPC-fördröjning
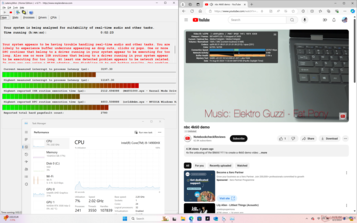
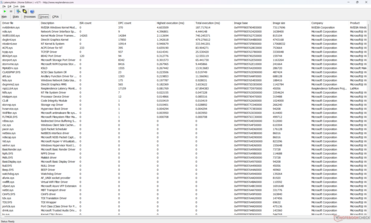
| DPC Latencies / LatencyMon - interrupt to process latency (max), Web, Youtube, Prime95 | |
| HP ZBook Fury 16 G11 | |
| HP ZBook Fury 16 G10 | |
| HP ZBook Fury 16 G9 | |
| Asus ProArt Studiobook 16 OLED H7604 | |
| Lenovo ThinkPad P1 G6 21FV001KUS | |
| Lenovo ThinkPad P16 G2 21FA000FGE | |
| Dell Precision 5690 | |
* ... mindre är bättre
Lagringsenheter
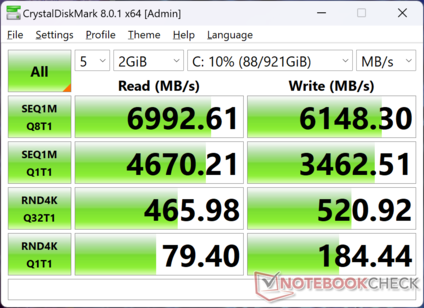
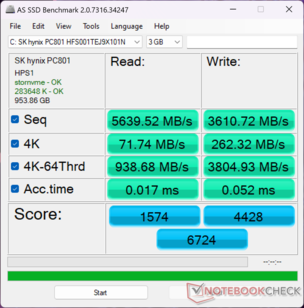
Vår testenhet levereras med samma 1 TB SK Hynix PC801 HFS001TEJ9X101N PCIe4 M.2 SSD som finns på förra årets ZBook Fury 16 G10. Tyvärr lider enheten också av samma problem med prestandastrypning. När DiskSpd kördes i en loop började överföringshastigheterna mycket högt på nästan 7000 MB/s innan de föll till så lågt som 3400 MB/s bara några minuter senare, vilket visas i diagrammet nedan. Detta kan tillskrivas otillräcklig kylning av enheterna, men det är kanske priset man får betala för att stödja fler individuella enheter än de flesta andra bärbara datorer.
* ... mindre är bättre
Disk Throttling: DiskSpd Read Loop, Queue Depth 8
GPU-prestanda
Användare kan förvänta sig RTX 3500 Ada presterar ungefär 20 till 30 procent långsammare än RTX 5000 Ada. Eftersom Nvidia ännu inte har introducerat en ny generation av mobila GPU:er levereras ZBook Fury 16 G11 med samma GPU-alternativ som förra årets modell utan några anmärkningsvärda prestandavinster. RTA 5000 Ada är fortfarande den snabbaste GPU:n för mobila arbetsstationer som finns tillgänglig.
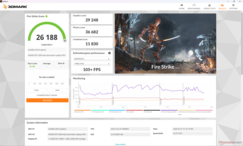
| Kraftprofil | Grafikpoäng | Fysikpoäng | Kombinerad poäng |
| Prestandaläge | 29248 | 36682 | 11830 |
| Balanserat läge | 28214 (-4%) | 33094 (-10%) | 10246 (-13%) |
| Batteridrift | 16618 (-43%) | 25118 (-32%) | 4101 (-65%) |
Om du kör i balanserat läge istället för prestandaläge påverkas prestandan med upp till 10 till 15 procent, vilket framgår av tabellen Fire Strike ovan. Prestandaförlusten blir ännu större om man kör på batteridrift, vilket kan förväntas av de flesta högpresterande bärbara datorer.
| 3DMark Performance rating - Percent | |
| HP ZBook Fury 16 G10 -2! | |
| Dell Precision 5690 -2! | |
| Dell Precision 5000 5680 -2! | |
| HP ZBook Fury 16 G11 | |
| Genomsnitt NVIDIA RTX 3500 Ada Generation Laptop | |
| Lenovo ThinkPad P1 G6 21FV001KUS -2! | |
| Lenovo ThinkPad P1 G6-21FV000DGE -17! | |
| HP ZBook Fury 16 G9 -2! | |
| Lenovo ThinkPad P16 G2 21FA000FGE -17! | |
| MSI CreatorPro Z16P B12UKST -17! | |
| Asus ProArt Studiobook 16 OLED H7604 -17! | |
| Asus ExpertBook B6 Flip B6602FC2 -17! | |
| Lenovo ThinkPad P1 G4-20Y4S0KS00 -10! | |
| Lenovo ThinkPad P16v G1 AMD -17! | |
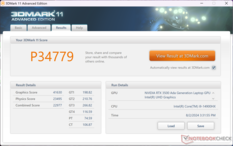
| 3DMark 11 Performance | 34779 poäng | |
| 3DMark Fire Strike Score | 26188 poäng | |
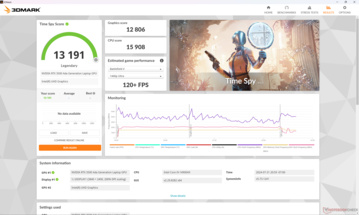
| 3DMark Time Spy Score | 13191 poäng | |
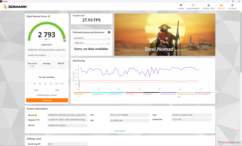
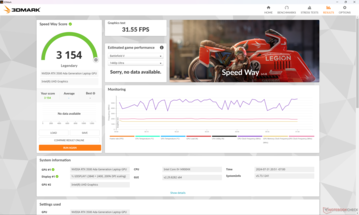
| 3DMark Steel Nomad Score | 2793 poäng | |
Hjälp | ||
* ... mindre är bättre
Prestanda för spel
Även om RTX 3500 Ada inte är utformad för spel presterar den något över mobil GeForce RTX 4070 men under den mobila RTX 4080, särskilt när man tittar på antalet unified pipelines, tensor-kärnor och minnesbandbredd. Prestanda kan ändå gradvis sakta ner över tid när det stressas eftersom GPU-boosthastigheterna inte är obegränsade. Vid tomgångskörning av Cyberpunk 2077 vid 1080p Ultra-inställningar, till exempel, skulle prestandan börja på drygt 70 FPS innan den gradvis minskade till det låga 60 FPS-området efter bara 30 minuter, vilket visas i diagrammet nedan.
| Performance rating - Percent | |
| HP ZBook Fury 16 G10 -2! | |
| Lenovo ThinkPad P1 G6 21FV001KUS -1! | |
| HP ZBook Fury 16 G11 | |
| Asus ProArt Studiobook 16 OLED H7604 -1! | |
| Dell Precision 5690 -1! | |
| HP ZBook Fury 16 G9 -1! | |
| Lenovo ThinkPad P16 G2 21FA000FGE -1! | |
| GTA V - 1920x1080 Highest AA:4xMSAA + FX AF:16x | |
| Asus ProArt Studiobook 16 OLED H7604 | |
| Lenovo ThinkPad P1 G6 21FV001KUS | |
| HP ZBook Fury 16 G9 | |
| HP ZBook Fury 16 G11 | |
| Lenovo ThinkPad P16 G2 21FA000FGE | |
| Final Fantasy XV Benchmark - 1920x1080 High Quality | |
| HP ZBook Fury 16 G10 | |
| Lenovo ThinkPad P1 G6 21FV001KUS | |
| Dell Precision 5690 | |
| HP ZBook Fury 16 G11 | |
| Asus ProArt Studiobook 16 OLED H7604 | |
| HP ZBook Fury 16 G9 | |
| Lenovo ThinkPad P16 G2 21FA000FGE | |
| Strange Brigade - 1920x1080 ultra AA:ultra AF:16 | |
| HP ZBook Fury 16 G10 | |
| Dell Precision 5690 | |
| HP ZBook Fury 16 G11 | |
| HP ZBook Fury 16 G9 | |
| Lenovo ThinkPad P16 G2 21FA000FGE | |
| Asus ProArt Studiobook 16 OLED H7604 | |
| Dota 2 Reborn - 1920x1080 ultra (3/3) best looking | |
| Asus ProArt Studiobook 16 OLED H7604 | |
| HP ZBook Fury 16 G10 | |
| HP ZBook Fury 16 G11 | |
| HP ZBook Fury 16 G9 | |
| Lenovo ThinkPad P16 G2 21FA000FGE | |
| Lenovo ThinkPad P1 G6 21FV001KUS | |
| Dell Precision 5690 | |
| Cyberpunk 2077 - 1920x1080 Ultra Preset (FSR off) | |
| Dell Precision 5690 | |
| Lenovo ThinkPad P1 G6 21FV001KUS | |
| HP ZBook Fury 16 G11 | |
| Baldur's Gate 3 | |
| 1920x1080 Ultra Preset AA:T | |
| Dell Precision 5690 | |
| Lenovo ThinkPad P1 G6 21FV001KUS | |
| HP ZBook Fury 16 G11 | |
| Genomsnitt NVIDIA RTX 3500 Ada Generation Laptop (n=1) | |
| 2560x1440 Ultra Preset AA:T | |
| Dell Precision 5690 | |
| Lenovo ThinkPad P1 G6 21FV001KUS | |
| HP ZBook Fury 16 G11 | |
| Genomsnitt NVIDIA RTX 3500 Ada Generation Laptop (n=1) | |
| 3840x2160 Ultra Preset AA:T | |
| Dell Precision 5690 | |
| Lenovo ThinkPad P1 G6 21FV001KUS | |
| HP ZBook Fury 16 G11 | |
| Genomsnitt NVIDIA RTX 3500 Ada Generation Laptop (n=1) | |
Cyberpunk 2077 ultra FPS Chart
| låg | med. | hög | ultra | QHD | 4K | |
|---|---|---|---|---|---|---|
| GTA V (2015) | 184.3 | 181 | 170.1 | 115.5 | 97.5 | 59.6 |
| Dota 2 Reborn (2015) | 201 | 177.7 | 162.1 | 153.9 | 134.4 | |
| Final Fantasy XV Benchmark (2018) | 200 | 167.6 | 128.9 | 97.5 | 54.2 | |
| X-Plane 11.11 (2018) | 144.6 | 137.8 | 110.9 | 92.7 | ||
| Far Cry 5 (2018) | 133 | 135 | 127 | 109 | 62 | |
| Strange Brigade (2018) | 411 | 296 | 235 | 223 | 159.2 | 78.6 |
| Tiny Tina's Wonderlands (2022) | 232.5 | 195.4 | 137.9 | 109.3 | 74.4 | 41.6 |
| F1 22 (2022) | 228 | 223 | 182.8 | 72.9 | 48.3 | 24 |
| Baldur's Gate 3 (2023) | 164.8 | 136.2 | 118.6 | 117.3 | 80.2 | 41.2 |
| Cyberpunk 2077 (2023) | 121.2 | 113.1 | 101.8 | 90.3 | 60.2 | 21.3 |
Utsläpp
Systembuller
Fläktljudet och fläktbeteendet är ungefär detsamma som på förra årets modell, om inte något högre vid högre belastning. Fläktarna pulserar fortfarande ibland när de går på tomgång på skrivbordet, även när de är inställda på balanserat läge utan några applikationer igång. Ännu värre är att vår specifika enhet lider av märkbart spolgnissel som kvarstår under hela testperioden.
Ljudnivå
| Låg belastning |
| 23.2 / 23.2 / 29.5 dB(A) |
| Hög belastning |
| 43 / 48.2 dB(A) |
 | ||
30 dB tyst 40 dB(A) hörbar 50 dB(A) högt ljud |
||
min: | ||
| HP ZBook Fury 16 G11 RTX 3500 Ada Generation Laptop, i9-14900HX, SK hynix PC801 HFS001TEJ9X101N | HP ZBook Fury 16 G10 RTX 5000 Ada Generation Laptop, i9-13950HX, SK hynix PC801 HFS001TEJ9X101N | HP ZBook Fury 16 G9 RTX A5500 Laptop GPU, i9-12950HX, Micron 3400 1TB MTFDKBA1T0TFH | Dell Precision 5690 RTX 5000 Ada Generation Laptop, Ultra 9 185H, 2x Samsung PM9A1 1TB (RAID 0) | Lenovo ThinkPad P16 G2 21FA000FGE RTX 2000 Ada Generation Laptop, i7-13700HX, SK hynix PC801 HFS001TEJ9X162N | Lenovo ThinkPad P1 G6 21FV001KUS GeForce RTX 4080 Laptop GPU, i7-13800H, Kioxia XG8 KXG8AZNV1T02 | Asus ProArt Studiobook 16 OLED H7604 GeForce RTX 4070 Laptop GPU, i9-13980HX, Phison EM2804TBMTCB47 | |
|---|---|---|---|---|---|---|---|
| Noise | 3% | 4% | -3% | -4% | 9% | -5% | |
| av / miljö * (dB) | 23.2 | 22.9 1% | 22.6 3% | 23.4 -1% | 23.5 -1% | 22.5 3% | 24.5 -6% |
| Idle Minimum * (dB) | 23.2 | 22.9 1% | 22.7 2% | 23.6 -2% | 23.5 -1% | 22.5 3% | 24.5 -6% |
| Idle Average * (dB) | 23.2 | 22.9 1% | 22.7 2% | 24.9 -7% | 29.2 -26% | 22.5 3% | 24.5 -6% |
| Idle Maximum * (dB) | 29.5 | 28.5 3% | 28.8 2% | 30.9 -5% | 29.5 -0% | 22.5 24% | 24.5 17% |
| Load Average * (dB) | 43 | 40.6 6% | 36.2 16% | 40.4 6% | 32.7 24% | 28.7 33% | 47.6 -11% |
| Cyberpunk 2077 ultra * (dB) | 48.2 | ||||||
| Load Maximum * (dB) | 48.2 | 45.8 5% | 49.3 -2% | 51.9 -8% | 56.6 -17% | 54.4 -13% | 56.7 -18% |
| Witcher 3 ultra * (dB) | 44.1 | 49.5 | 48.3 | 50.6 | 47.5 | 55.9 |
* ... mindre är bättre
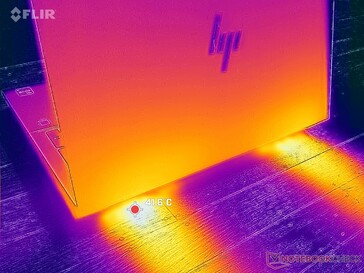
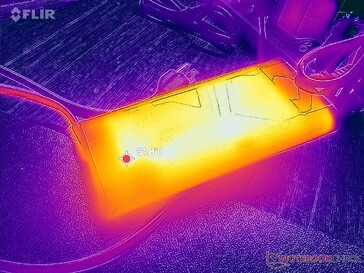
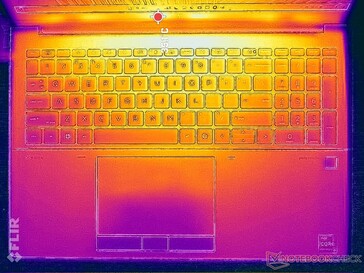
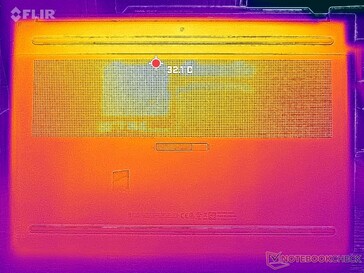
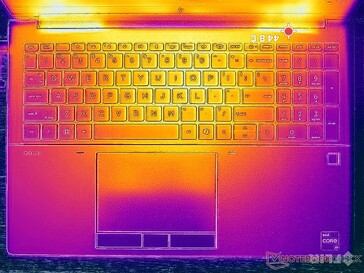
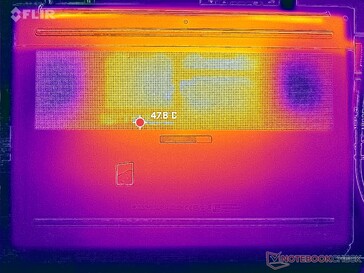
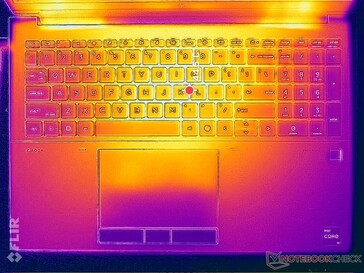
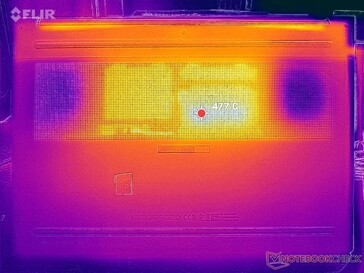
(±) Den maximala temperaturen på ovansidan är 42.2 °C / 108 F, jämfört med genomsnittet av 38.2 °C / 101 F , allt från 22.2 till 69.8 °C för klassen Workstation.
(-) Botten värms upp till maximalt 48 °C / 118 F, jämfört med genomsnittet av 41.1 °C / 106 F
(±) Vid tomgångsbruk är medeltemperaturen för ovansidan 33.8 °C / 93 F, jämfört med enhetsgenomsnittet på 32 °C / ### class_avg_f### F.
(-) 3: The average temperature for the upper side is 38.5 °C / 101 F, compared to the average of 32 °C / 90 F for the class Workstation.
(±) Handledsstöden och pekplattan kan bli väldigt varma vid beröring med maximalt 37.6 °C / 99.7 F.
(-) Medeltemperaturen för handledsstödsområdet på liknande enheter var 27.8 °C / 82 F (-9.8 °C / -17.7 F).
| HP ZBook Fury 16 G11 Intel Core i9-14900HX, NVIDIA RTX 3500 Ada Generation Laptop | HP ZBook Fury 16 G10 Intel Core i9-13950HX, Nvidia RTX 5000 Ada Generation Laptop | HP ZBook Fury 16 G9 Intel Core i9-12950HX, NVIDIA RTX A5500 Laptop GPU | Dell Precision 5690 Intel Core Ultra 9 185H, Nvidia RTX 5000 Ada Generation Laptop | Lenovo ThinkPad P16 G2 21FA000FGE Intel Core i7-13700HX, NVIDIA RTX 2000 Ada Generation Laptop | Lenovo ThinkPad P1 G6 21FV001KUS Intel Core i7-13800H, NVIDIA GeForce RTX 4080 Laptop GPU | Asus ProArt Studiobook 16 OLED H7604 Intel Core i9-13980HX, NVIDIA GeForce RTX 4070 Laptop GPU | |
|---|---|---|---|---|---|---|---|
| Heat | 3% | 10% | 13% | 15% | 4% | 3% | |
| Maximum Upper Side * (°C) | 42.2 | 44.8 -6% | 43.2 -2% | 46.6 -10% | 47.2 -12% | 42 -0% | 44.1 -5% |
| Maximum Bottom * (°C) | 48 | 50 -4% | 50.4 -5% | 33 31% | 39.5 18% | 45.2 6% | 48 -0% |
| Idle Upper Side * (°C) | 37 | 34.4 7% | 28.6 23% | 32.4 12% | 28.1 24% | 33 11% | 32.7 12% |
| Idle Bottom * (°C) | 36.8 | 31.8 14% | 28.2 23% | 29.4 20% | 25.3 31% | 37 -1% | 34.9 5% |
* ... mindre är bättre
HP ZBook Fury 16 G11 ljudanalys
(+) | högtalare kan spela relativt högt (88.9 dB)
Bas 100 - 315 Hz
(±) | reducerad bas - i genomsnitt 13.3% lägre än medianen
(±) | linjäriteten för basen är genomsnittlig (11.2% delta till föregående frekvens)
Mellan 400 - 2000 Hz
(+) | balanserad mellan - endast 2.2% från medianen
(+) | mids är linjära (3.2% delta till föregående frekvens)
Högsta 2 - 16 kHz
(+) | balanserade toppar - endast 3.7% från medianen
(+) | toppar är linjära (4.6% delta till föregående frekvens)
Totalt 100 - 16 000 Hz
(+) | det totala ljudet är linjärt (12.9% skillnad mot median)
Jämfört med samma klass
» 20% av alla testade enheter i den här klassen var bättre, 7% liknande, 73% sämre
» Den bästa hade ett delta på 7%, genomsnittet var 17%, sämst var 35%
Jämfört med alla testade enheter
» 12% av alla testade enheter var bättre, 3% liknande, 86% sämre
» Den bästa hade ett delta på 4%, genomsnittet var 24%, sämst var 134%
Apple MacBook Pro 16 2021 M1 Pro ljudanalys
(+) | högtalare kan spela relativt högt (84.7 dB)
Bas 100 - 315 Hz
(+) | bra bas - bara 3.8% från medianen
(+) | basen är linjär (5.2% delta till föregående frekvens)
Mellan 400 - 2000 Hz
(+) | balanserad mellan - endast 1.3% från medianen
(+) | mids är linjära (2.1% delta till föregående frekvens)
Högsta 2 - 16 kHz
(+) | balanserade toppar - endast 1.9% från medianen
(+) | toppar är linjära (2.7% delta till föregående frekvens)
Totalt 100 - 16 000 Hz
(+) | det totala ljudet är linjärt (4.6% skillnad mot median)
Jämfört med samma klass
» 0% av alla testade enheter i den här klassen var bättre, 0% liknande, 100% sämre
» Den bästa hade ett delta på 5%, genomsnittet var 17%, sämst var 45%
Jämfört med alla testade enheter
» 0% av alla testade enheter var bättre, 0% liknande, 100% sämre
» Den bästa hade ett delta på 4%, genomsnittet var 24%, sämst var 134%
Energiförvaltning
Strömförbrukning
Systemet är mer effektivt när det går på tomgång på skrivbordet jämfört med vår ZBook Fury 16 G10 konfiguration. Annars blir förbrukningen nästan densamma när man kör mer krävande belastningar som spel, trots att de konfigurerade GPU:erna skiljer sig åt mellan våra två exempel. Prestanda per watt ökar därför när man väljer avancerade GPU-konfigurationer jämfört med vår RTX 3500 Ada i mellanklassen.
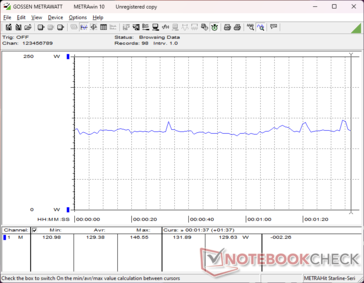
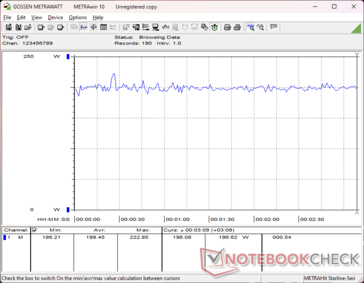
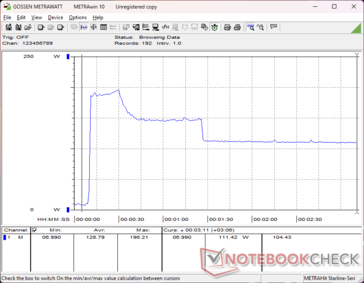
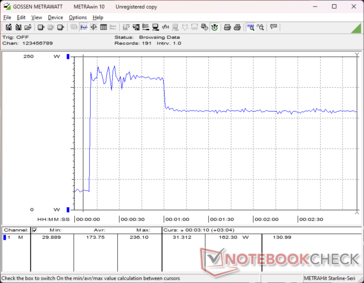
Förbrukningen när vi kör Prime95 eller CineBench R15 xT skulle vara märkbart högre på vår enhet jämfört med förra årets modell på grund av den högre Turbo Boost-potentialen hos vår Core i9-14900HX-processor. Efter ungefär en minut sjönk dock förbrukningen till att vara nästan i linje med vad vi uppmätte på förra årets modell, vilket visas av jämförelsediagrammet nedan som stämmer överens med våra CineBench R15 xT-loopobservationer ovan. Således är vår högre initiala Turbo Boost-potential den viktigaste fördelen mellan den nyare Core i9-14900HX och den äldre Core i9-13950HX.
Vi kan registrera en maximal förbrukning på 236 W från den stora (~18 x 8,8 x 2,5 cm) 230 W AC-adaptern när CPU och GPU vardera utnyttjas till 100 procent.
| Av/Standby | |
| Låg belastning | |
| Hög belastning |
|
Förklaring:
min: | |
| HP ZBook Fury 16 G11 i9-14900HX, RTX 3500 Ada Generation Laptop, SK hynix PC801 HFS001TEJ9X101N, IPS, 3840x2400, 16" | HP ZBook Fury 16 G10 i9-13950HX, RTX 5000 Ada Generation Laptop, SK hynix PC801 HFS001TEJ9X101N, IPS, 3840x2400, 16" | HP ZBook Fury 16 G9 i9-12950HX, RTX A5500 Laptop GPU, Micron 3400 1TB MTFDKBA1T0TFH, IPS, 3840x2400, 16" | Dell Precision 5690 Ultra 9 185H, RTX 5000 Ada Generation Laptop, 2x Samsung PM9A1 1TB (RAID 0), OLED, 3840x2400, 16" | Lenovo ThinkPad P16 G2 21FA000FGE i7-13700HX, RTX 2000 Ada Generation Laptop, SK hynix PC801 HFS001TEJ9X162N, IPS LED, 2560x1600, 16" | Lenovo ThinkPad P1 G6 21FV001KUS i7-13800H, GeForce RTX 4080 Laptop GPU, Kioxia XG8 KXG8AZNV1T02, OLED, 3480x2400, 16" | Asus ProArt Studiobook 16 OLED H7604 i9-13980HX, GeForce RTX 4070 Laptop GPU, Phison EM2804TBMTCB47, OLED, 3200x2000, 16" | |
|---|---|---|---|---|---|---|---|
| Power Consumption | -34% | -77% | -1% | 4% | 7% | -24% | |
| Idle Minimum * (Watt) | 8.6 | 15.3 -78% | 19.5 -127% | 7.9 8% | 9.3 -8% | 8 7% | 12.8 -49% |
| Idle Average * (Watt) | 14.8 | 18.2 -23% | 29 -96% | 12 19% | 14.1 5% | 9.5 36% | 19.9 -34% |
| Idle Maximum * (Watt) | 15.7 | 28 -78% | 40.7 -159% | 28.6 -82% | 15.5 1% | 23.7 -51% | 20.3 -29% |
| Load Average * (Watt) | 129.4 | 137.9 -7% | 142.1 -10% | 98.8 24% | 133.6 -3% | 97.2 25% | 131.4 -2% |
| Cyberpunk 2077 ultra external monitor * (Watt) | 192.6 | ||||||
| Cyberpunk 2077 ultra * (Watt) | 199.4 | ||||||
| Load Maximum * (Watt) | 236.1 | 202 14% | 224.4 5% | 174.8 26% | 179.6 24% | 197.2 16% | 246.8 -5% |
| Witcher 3 ultra * (Watt) | 189.4 | 188.6 | 144.5 | 144.9 | 144 | 196.5 |
* ... mindre är bättre
Power Consumption Cyberpunk / Stress Test
Power Consumption external Monitor
Batteritid
Körtiderna är mycket lika förra årets ZBook Fury 16 G11 om inte något kortare, sannolikt på grund av det högre Turbo Boost-taket för Raptor Lake-HX Refresh-processorn. Konkurrerande modeller som Precision 5690 eller ThinkPad P16 G2 kan var och en hålla minst en timme eller så längre i jämförelse.
Laddning från tom till full kapacitet med den medföljande nätadaptern går relativt snabbt på drygt 60 minuter.
| HP ZBook Fury 16 G11 i9-14900HX, RTX 3500 Ada Generation Laptop, 95 Wh | HP ZBook Fury 16 G10 i9-13950HX, RTX 5000 Ada Generation Laptop, 95 Wh | HP ZBook Fury 16 G9 i9-12950HX, RTX A5500 Laptop GPU, 95 Wh | Dell Precision 5690 Ultra 9 185H, RTX 5000 Ada Generation Laptop, 98 Wh | Lenovo ThinkPad P16 G2 21FA000FGE i7-13700HX, RTX 2000 Ada Generation Laptop, 94 Wh | Lenovo ThinkPad P1 G6 21FV001KUS i7-13800H, GeForce RTX 4080 Laptop GPU, 90 Wh | Asus ProArt Studiobook 16 OLED H7604 i9-13980HX, GeForce RTX 4070 Laptop GPU, 90 Wh | |
|---|---|---|---|---|---|---|---|
| Batteridrifttid | 9% | -10% | 37% | 28% | -37% | -16% | |
| WiFi v1.3 (h) | 6.7 | 7.3 9% | 6 -10% | 9.2 37% | 8.6 28% | 4.2 -37% | 5.6 -16% |
| Reader / Idle (h) | 5.3 | ||||||
| Load (h) | 1.2 | 1.1 | |||||
| H.264 (h) | 6 |
För
Emot
Bedömning - Stark design dras ner av begränsad turbo boost
Vi älskar designen på ZBook Fury 16 G11. Även om den är densamma som Fury 16 G9, har den enkel service, breda konfigurerbara alternativ, ECC RAM-stöd och bekvämt tangentbord och pekplatta alla rätt rutor för användare av arbetsstationer.
Istället ligger de största problemen med ZBook Fury 16 G11 i dess prestanda. När en annan bärbar dator som Lenovo Legion 9 16IRX9 kan köra exakt samma Core i9-14900HX CPU upp till 20 procent snabbare än vår ZBook, då skulle kylningslösningen i HP definitivt behöva en uppgradering för att stödja högre Turbo Boost-hastigheter under längre tid. På samma sätt skulle M.2 SSD-enheterna kunna dra nytta av värmespridare av samma anledning som de också skulle strypas när de stressas. Dessa begränsningar förtar fördelarna med Core i9 CPU och PCIe4 SSD eftersom de potentiellt kan prestera snabbare på konkurrerande maskiner från Dell eller Lenovo.
ZBook Fury 16 G11 är bara en mindre uppdatering jämfört med förra årets ZBook Fury G10. Även om den fortfarande ser bra ut och känns bra, tenderar prestanda att strypas för tyngre användningsscenarier.
Slutligen är det lite olyckligt att modellen inte erbjuder några Meteor Lake-alternativ för ingen lokal AI-acceleration. Visserligen tilltalar en sådan funktion sannolikt bara en liten delmängd av arbetsstationsanvändare, men det skulle ha hjälpt till att ytterligare skilja Fury 16 G11 från Fury 16 G10. Du kan få i stort sett samma prestanda och funktioner från den knappt ett år gamla Fury 16 G10 som du kan på den senaste Fury 16 G11.
Pris och tillgänglighet
ZBook Fury 16 G11 levereras för närvarande för cirka 3400 USD som konfigurerad med Core i9-14900HX och RTX 3500 Ada upp till över 5500 USD om den är fullt konfigurerad med RTX 5000 Ada.
Information: Vi har nyligen uppdaterat vårt betygssystem och resultaten från version 8 är inte jämförbara med resultaten från version 7. Ytterligare information om detta finns här tillgänglig.
Obs: Vi har nyligen uppdaterat vårt betygssystem och resultaten från version 8 är inte jämförbara med resultaten från version 7. Mer information finns tillgänglig här .
HP ZBook Fury 16 G11
- 08/12/2024 v8
Allen Ngo
Genomskinlighet
Valet av enheter som ska granskas görs av vår redaktion. Testprovet gavs till författaren som ett lån av tillverkaren eller återförsäljaren för denna recension. Långivaren hade inget inflytande på denna recension och inte heller fick tillverkaren en kopia av denna recension innan publiceringen. Det fanns ingen skyldighet att publicera denna recension. Som ett oberoende medieföretag är Notebookcheck inte föremål för auktoritet från tillverkare, återförsäljare eller förlag.
This is how Notebookcheck is testingEvery year, Notebookcheck independently reviews hundreds of laptops and smartphones using standardized procedures to ensure that all results are comparable. We have continuously developed our test methods for around 20 years and set industry standards in the process. In our test labs, high-quality measuring equipment is utilized by experienced technicians and editors. These tests involve a multi-stage validation process. Our complex rating system is based on hundreds of well-founded measurements and benchmarks, which maintains objectivity.










 Total Sustainability Score:
