Vätske-kylboxen är tystare än väntat: Uniwell Technology GM7AG8N laptop recension
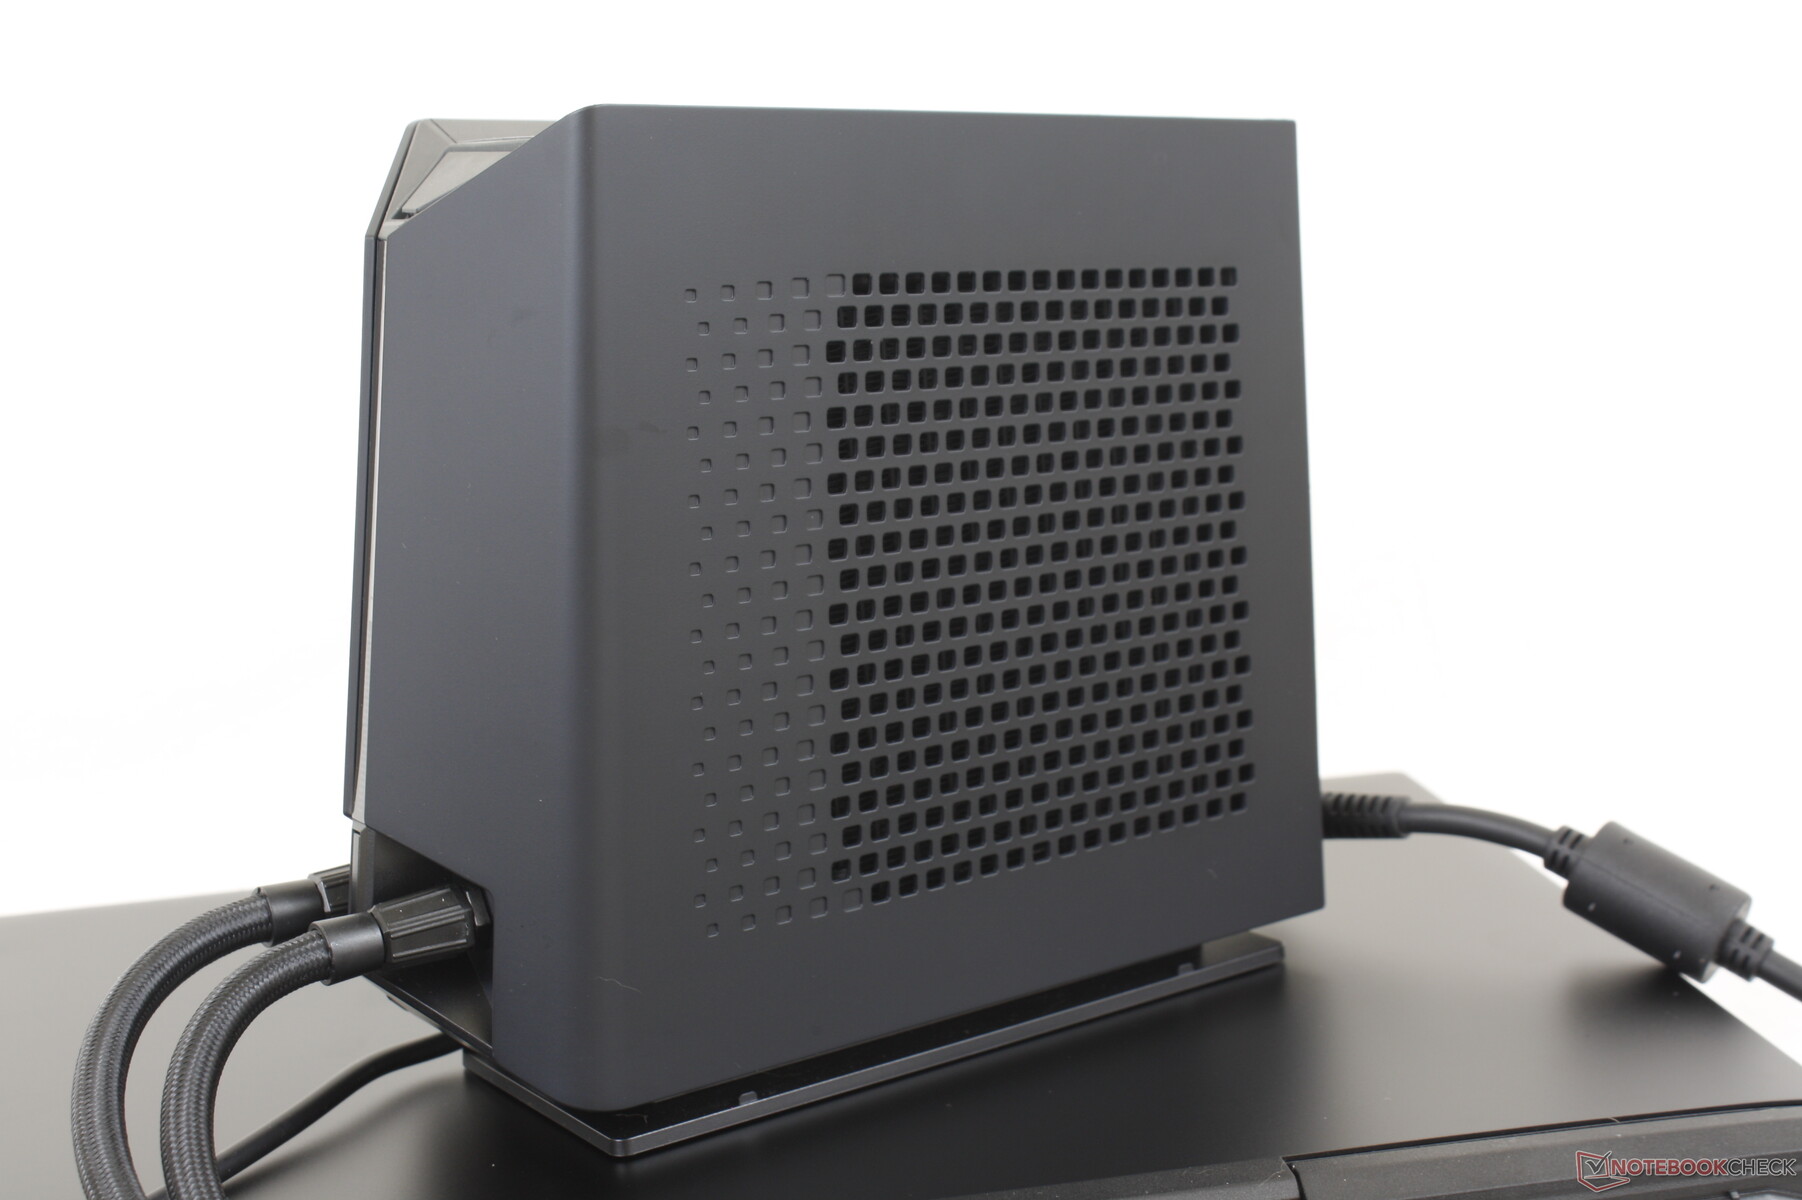
Efter att ha testatvattenkylda 15,6-tums Tongfang GM5AG8W tidigare i år från Schenker är vi nu redo att testa den vattenkylda 17-tums Tongfang GM7AG8N från Uniwell Technology. Externa kylningsdockor kan betraktas som en extrem lösning på de höga kylningskraven hos nyare mobila CPU:er och GPU:er. Medan stationära datorer har lyxen av utrymme måste bärbara datorer för spel passa in allt snabbare processorer i allt tunnare formfaktorer varje år.
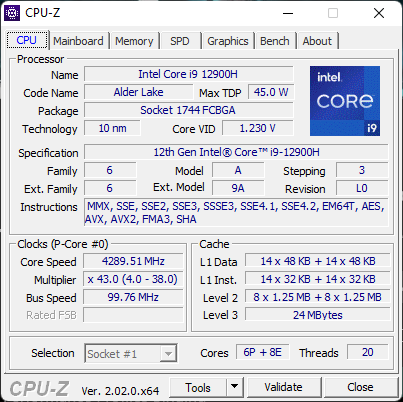
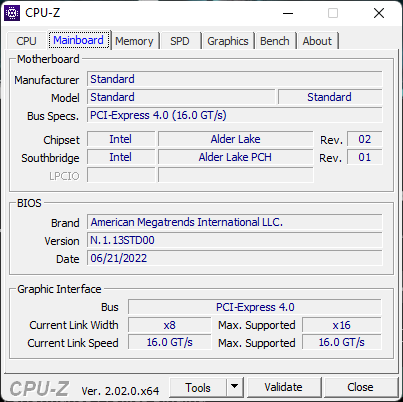
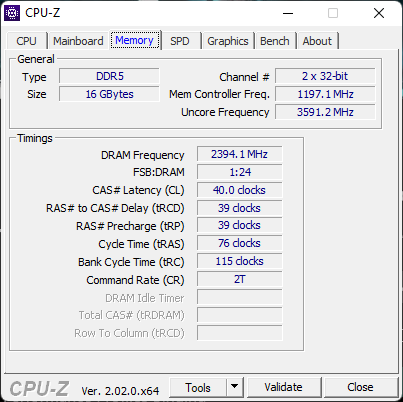
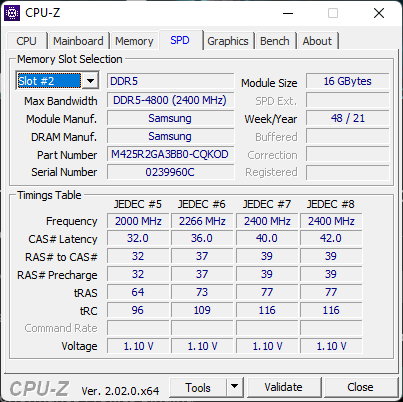
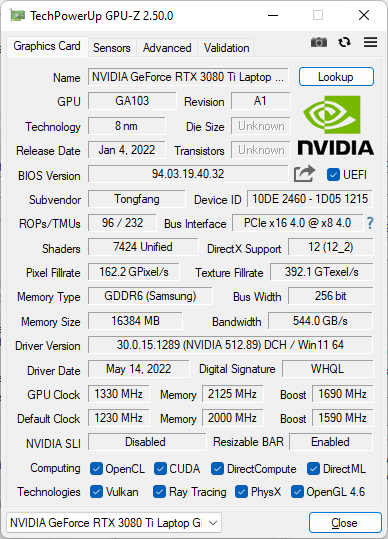
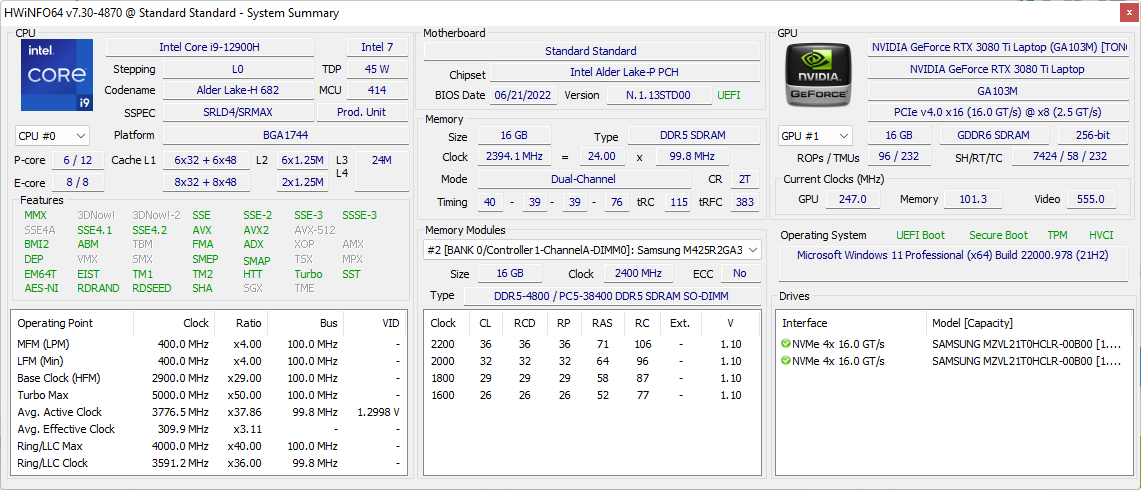
Vår testenhet levereras med 12:e generationens Core i9-12900H CPU, 175 W GeForce RTX 3080 Ti GPU med MUX, 17-tums 240 Hz 1600p IPS-skärm och ett integrerat mekaniskt Cherry MX-tangentbord. Modellen är ännu inte allmänt tillgänglig vid publiceringstillfället.
Uniwell Technology GM7AG8N konkurrerar direkt med mer traditionella bärbara 17-tums gamingdatorer som Razer Blade 17, Asus ROG Zephyrus S17, MSI Stealth GS77 eller Gigabyte Aorus 17X. Uniwell är dock en 16:10-formfaktor medan de flesta andra 17-tumsalternativ fortfarande är 16:9. Kylboxen är densamma som på Schenker GM5AG8W och därför rekommenderar vi att du kollar in våra befintliga recensioner här och här för mer information om hur du ställer in den externa kylaren.
Fler recensioner av Uniwell Technology:
Potentiella konkurrenter i jämförelse
Gradering | Datum | Modell | Vikt | Höjd | Storlek | Upplösning | Pris |
|---|---|---|---|---|---|---|---|
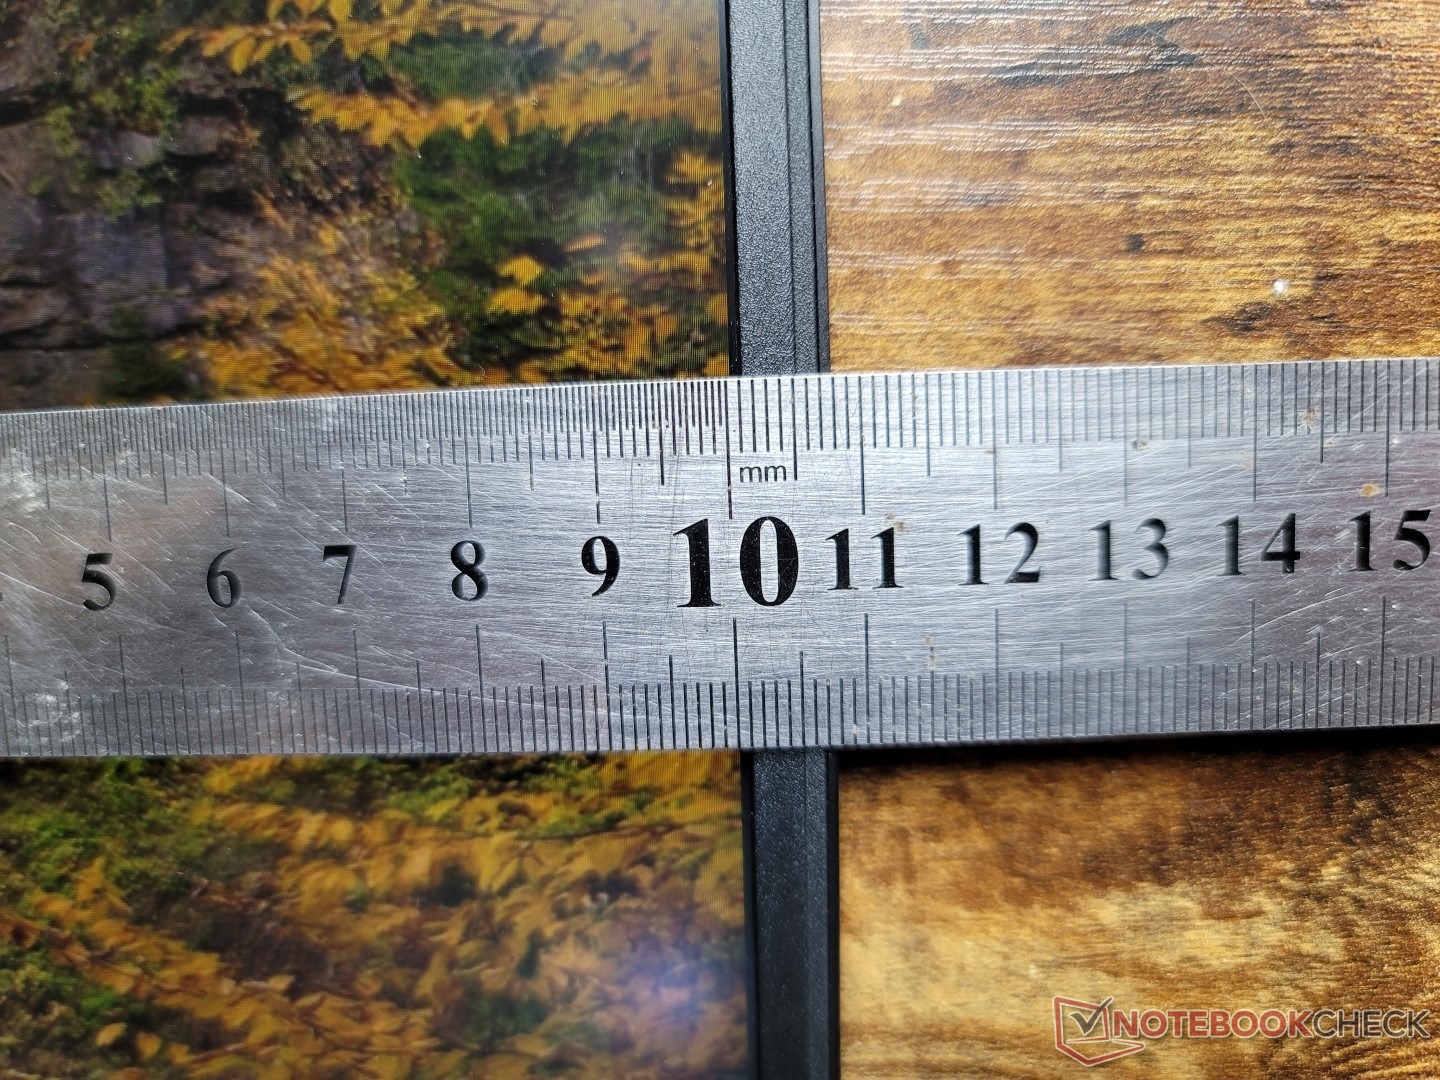
| 88.1 % v7 (old) | 10/2022 | Uniwell Technology GM7AG8N Liquid Cooling Box i9-12900H, GeForce RTX 3080 Ti Laptop GPU | 2.7 kg | 27.6 mm | 17.00" | 2560x1600 | |
| 88.3 % v7 (old) | 08/2022 | MSI Titan GT77 12UHS i9-12900HX, GeForce RTX 3080 Ti Laptop GPU | 3.3 kg | 23 mm | 17.30" | 1920x1080 | |
| 83.7 % v7 (old) | 08/2022 | Aorus 17X XES i9-12900HX, GeForce RTX 3070 Ti Laptop GPU | 2.7 kg | 30 mm | 17.30" | 1920x1080 | |
| 89.9 % v7 (old) | 07/2022 | Razer Blade 17 Early 2022 i9-12900H, GeForce RTX 3080 Ti Laptop GPU | 2.8 kg | 19.9 mm | 17.30" | 3840x2160 | |
| 87.2 % v7 (old) | 04/2022 | MSI Stealth GS77 12UHS-083US i7-12700H, GeForce RTX 3080 Ti Laptop GPU | 2.9 kg | 20.8 mm | 17.30" | 2560x1440 | |
| 90.1 % v7 (old) | 08/2021 | Asus ROG Zephyrus S17 GX703HSD i9-11900H, GeForce RTX 3080 Laptop GPU | 2.8 kg | 19.9 mm | 17.30" | 2560x1440 |
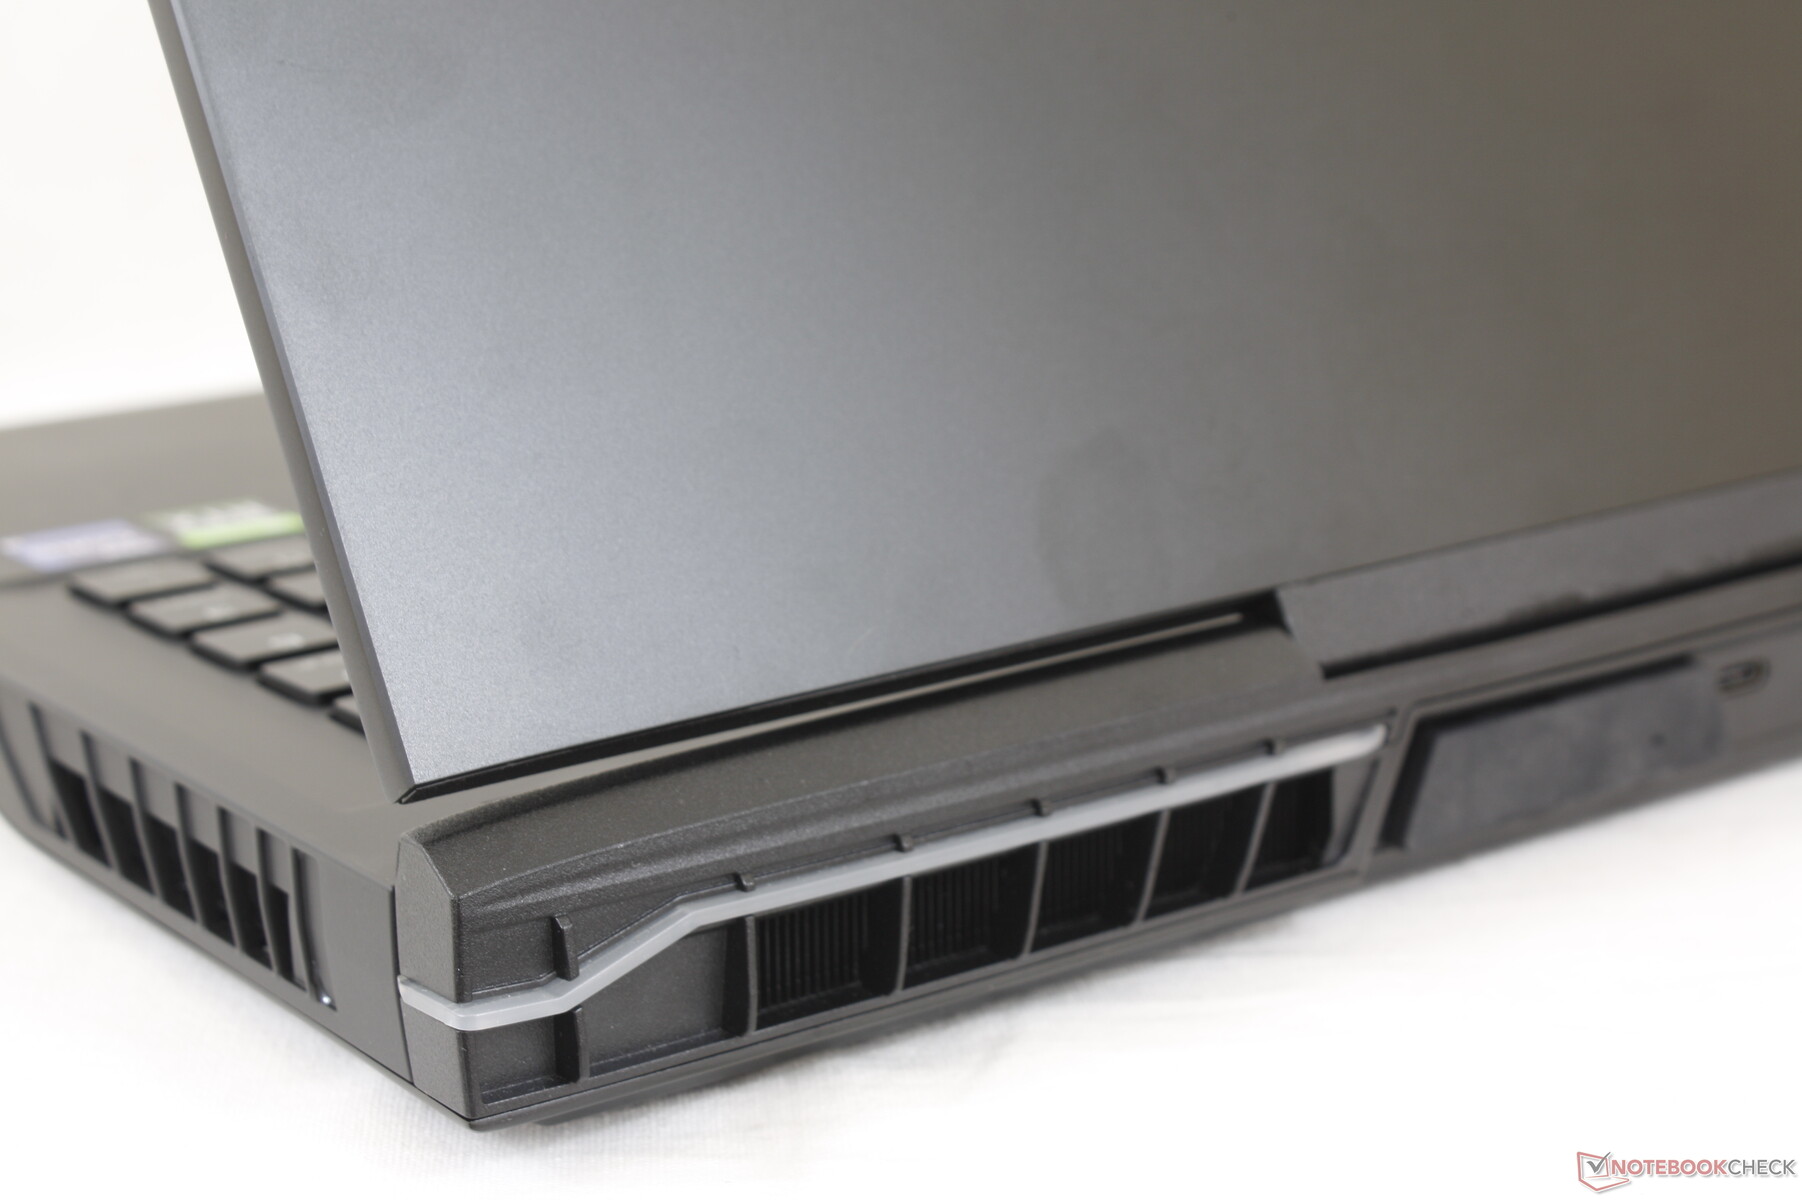
Case - en enorm magnet för fingeravtryck
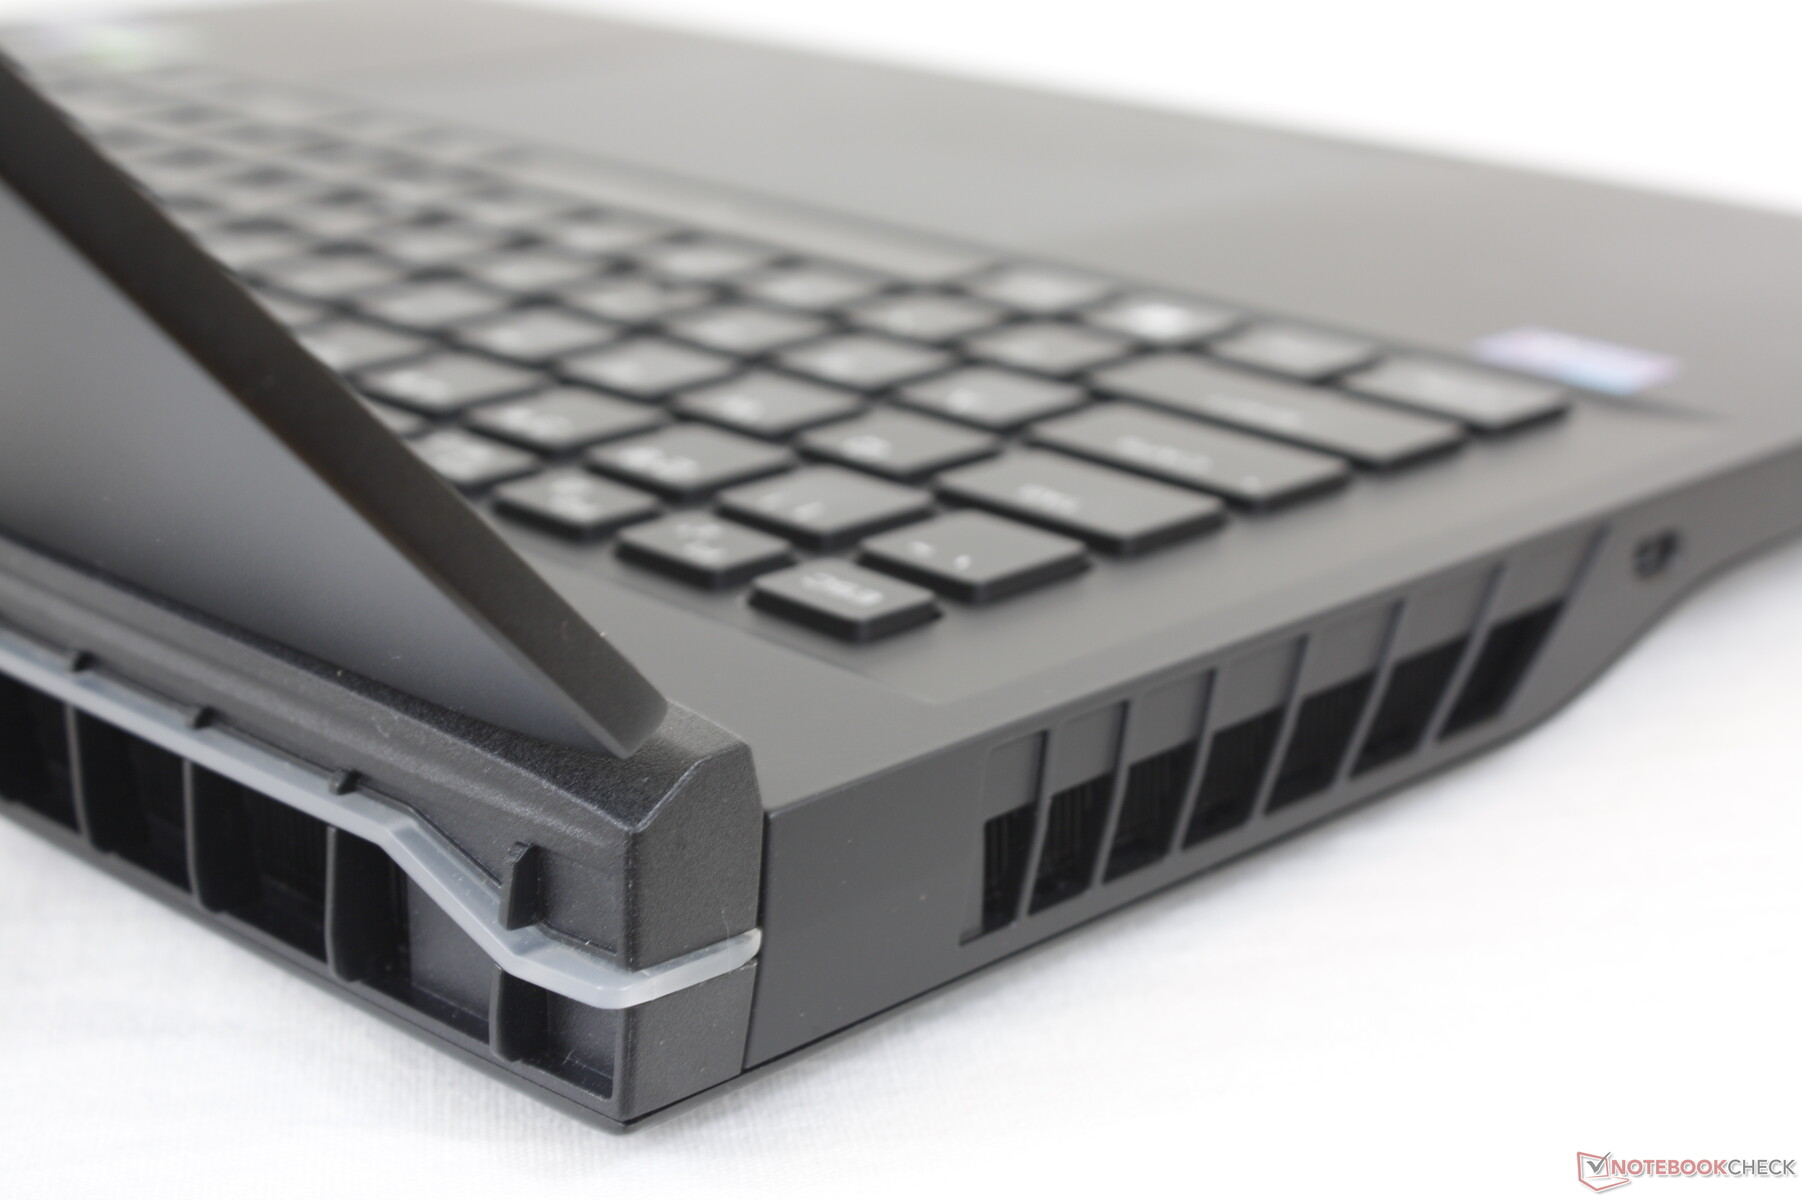
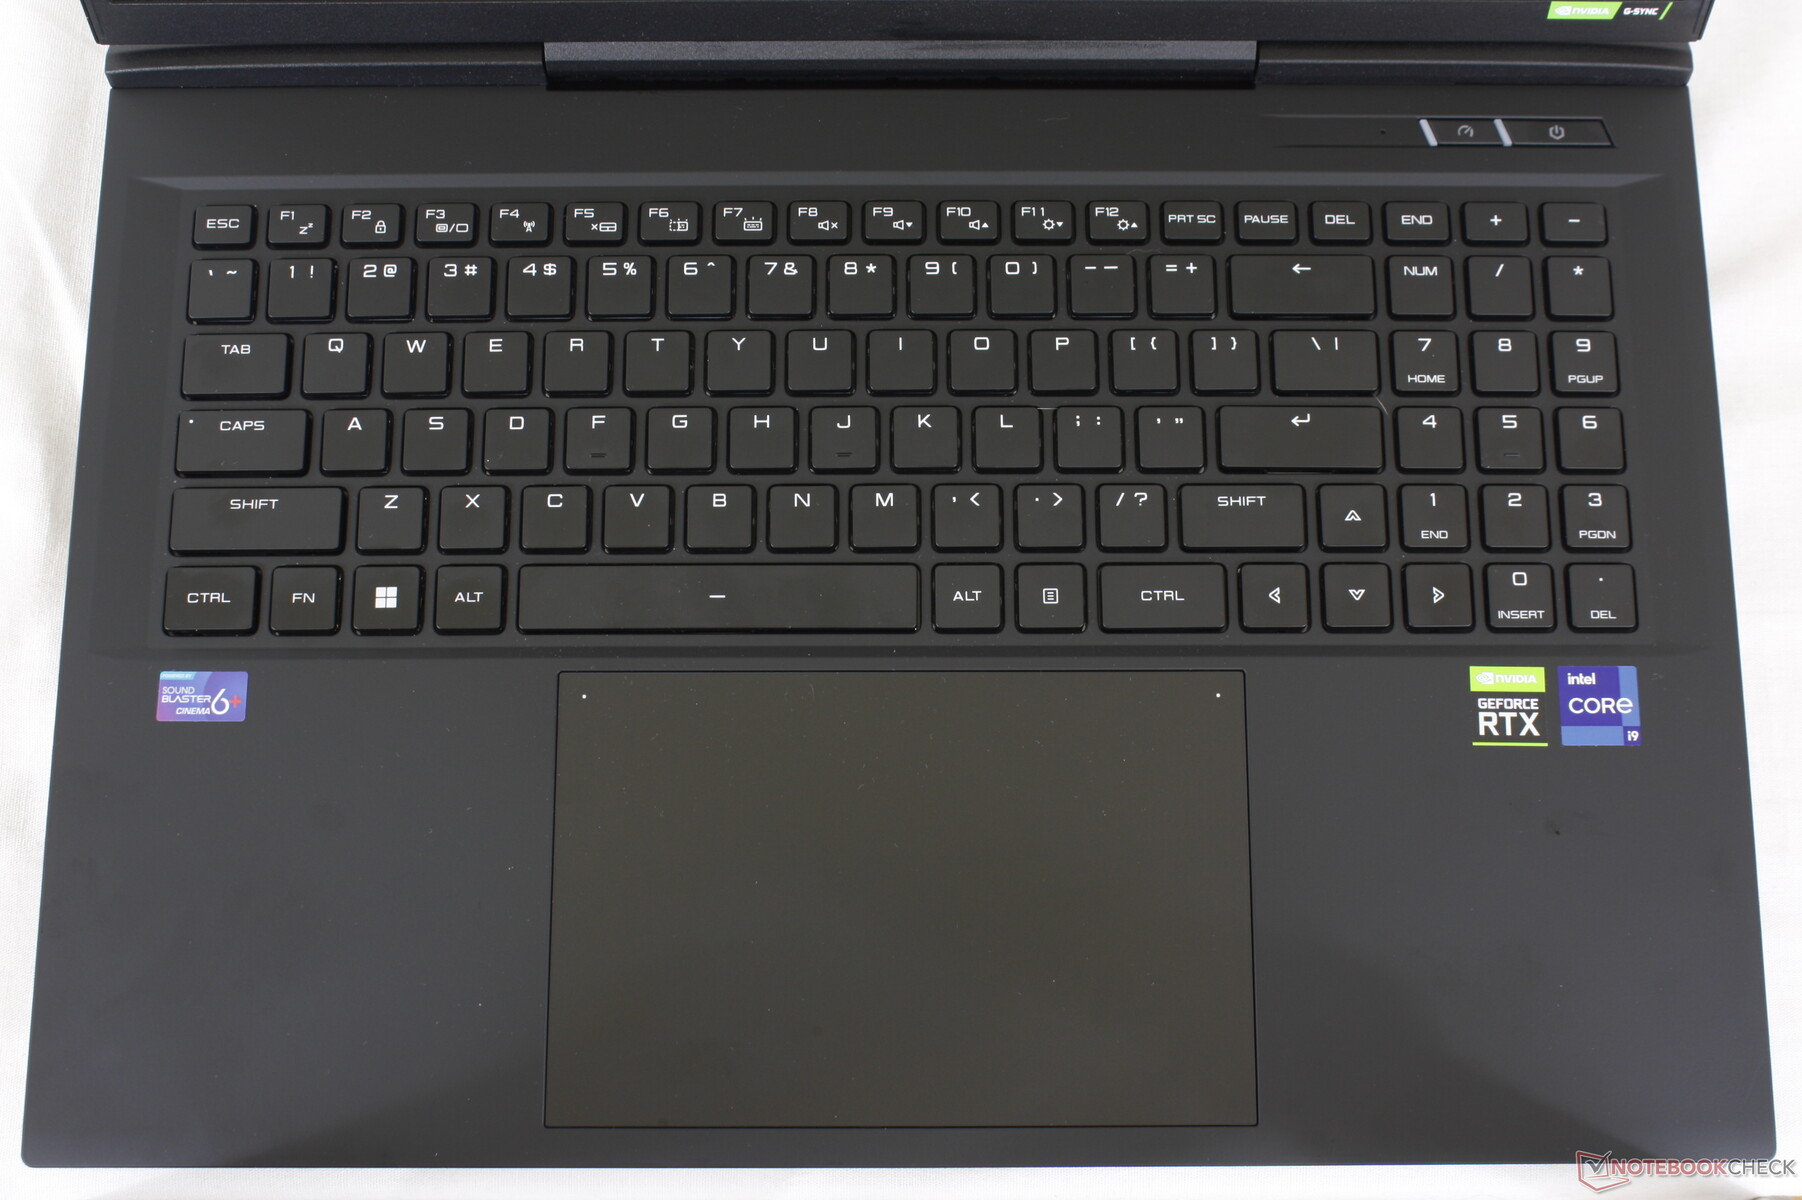
Den 17-tums Uniwell Technology GM7AG8N har liknande funktioner som den 15,6-tums GM5AG8W eftersom båda stöder samma externa vattenkylningsbox. Ändå är de två modellerna mycket olika när det gäller tangentbordsdäcket och bottenplattans utformning. Medan GM5AG8W integrerar ett avfasat tangentbord med massor av ventilationsgaller på undersidan har GM7AG8N ett chiclet-tangentbord med omdesignade ventilationsöppningar. LED-formgivningen skiljer sig också åt mellan dem eftersom GM7AG8N har en LED-stav längs baksidan medan GM5AG8W har en längs framsidan
Chassiets styvhet är utmärkt för basen och tangentbordsdäcket. Försök att vrida basen eller utöva tryck på tangentbordets centrum skulle resultera i bara minimal böjning och inget knarrande. Gångjärnen och locket är också starka, men de är något mer flexibla än på Razer Blade 17-serien.

Uniwell är tjockare och längre än de flesta andra bärbara 17-tums gamingdatorer samtidigt som den väger ungefär lika mycket. Dess något fyrkantigare fotavtryck kan tillskrivas dess bildförhållande 16:10, vilket är ovanligt för en bärbar dator för spel med den här skärmstorleken. Totalvikten är tack och lov genomsnittlig för kategorin innan man räknar med den externa kylboxen
- Vikt för bärbar dator: 2749 g
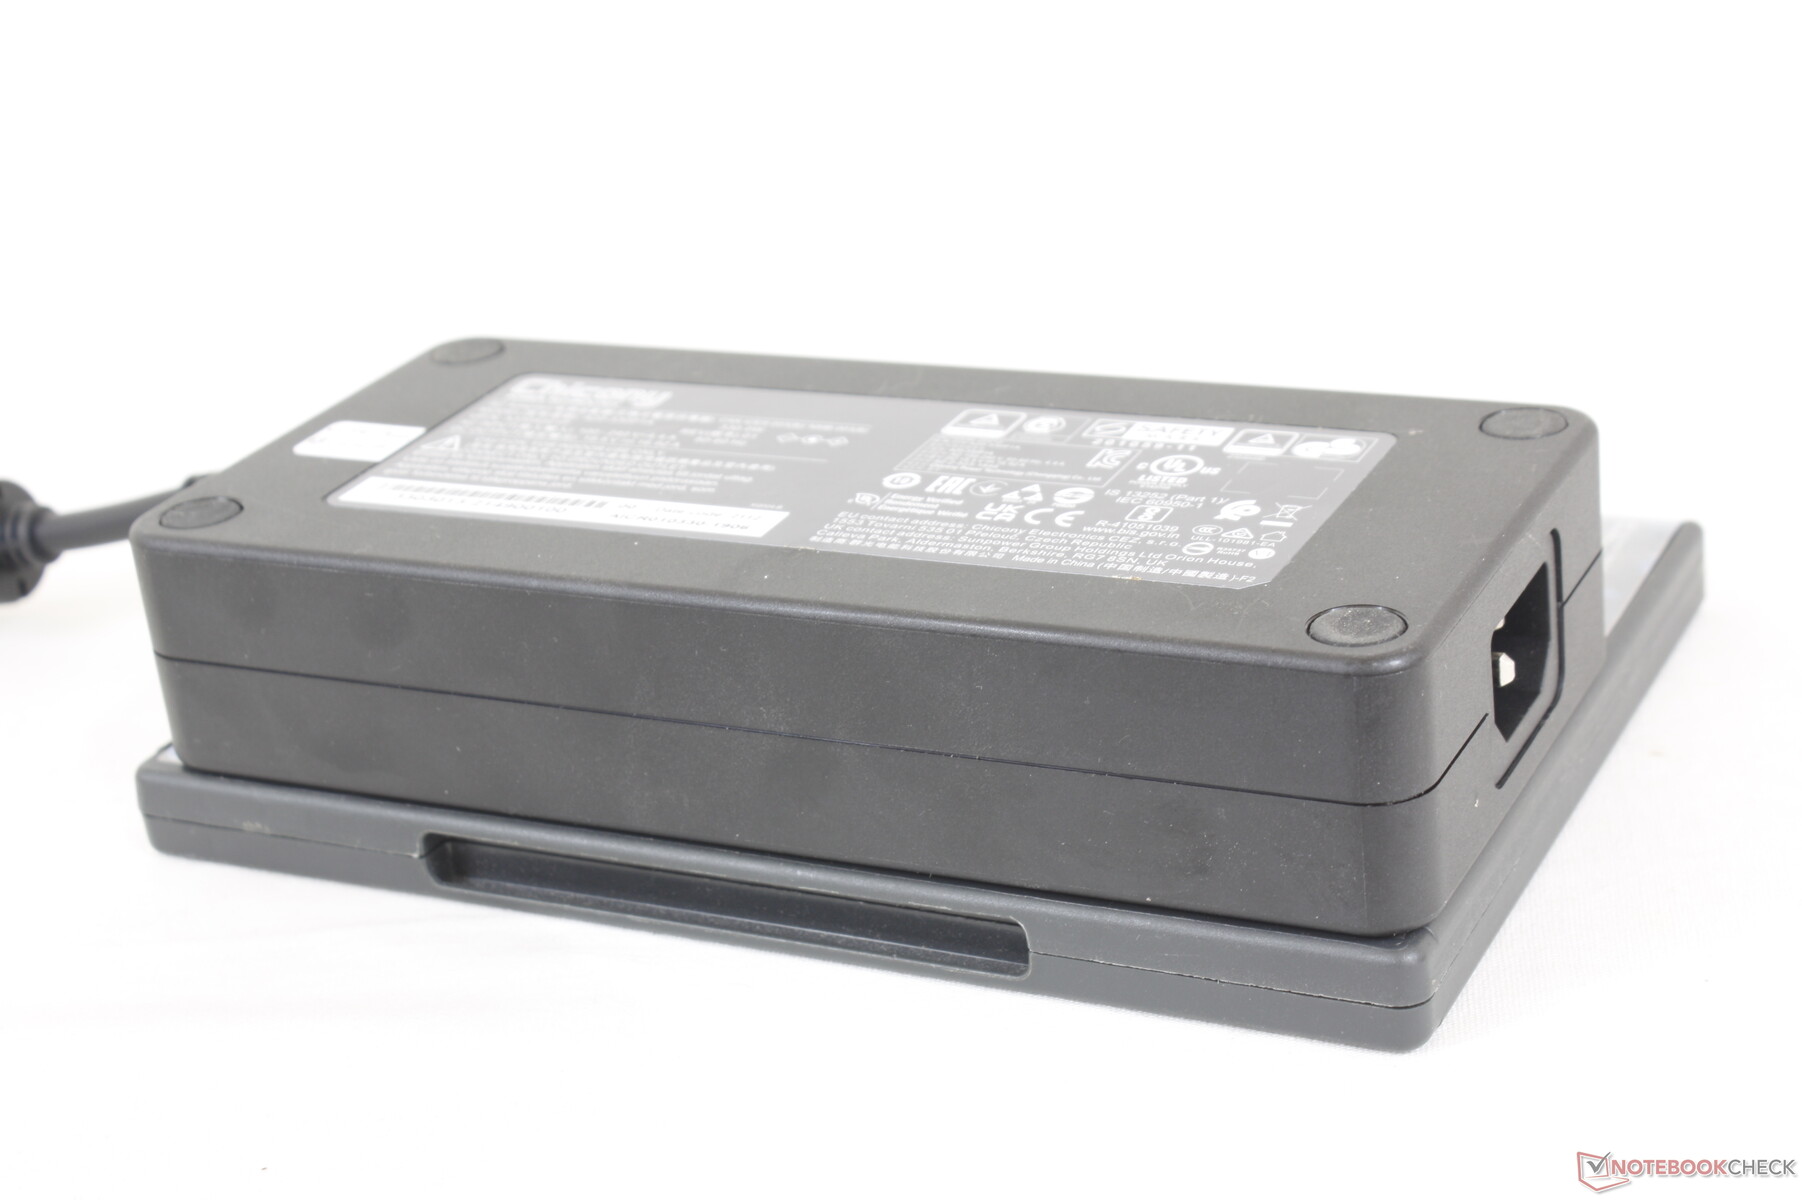
- Vikt för nätadapter: 1057 g
- Extern kylbox med vattenslangar (inget vatten): 1160 g
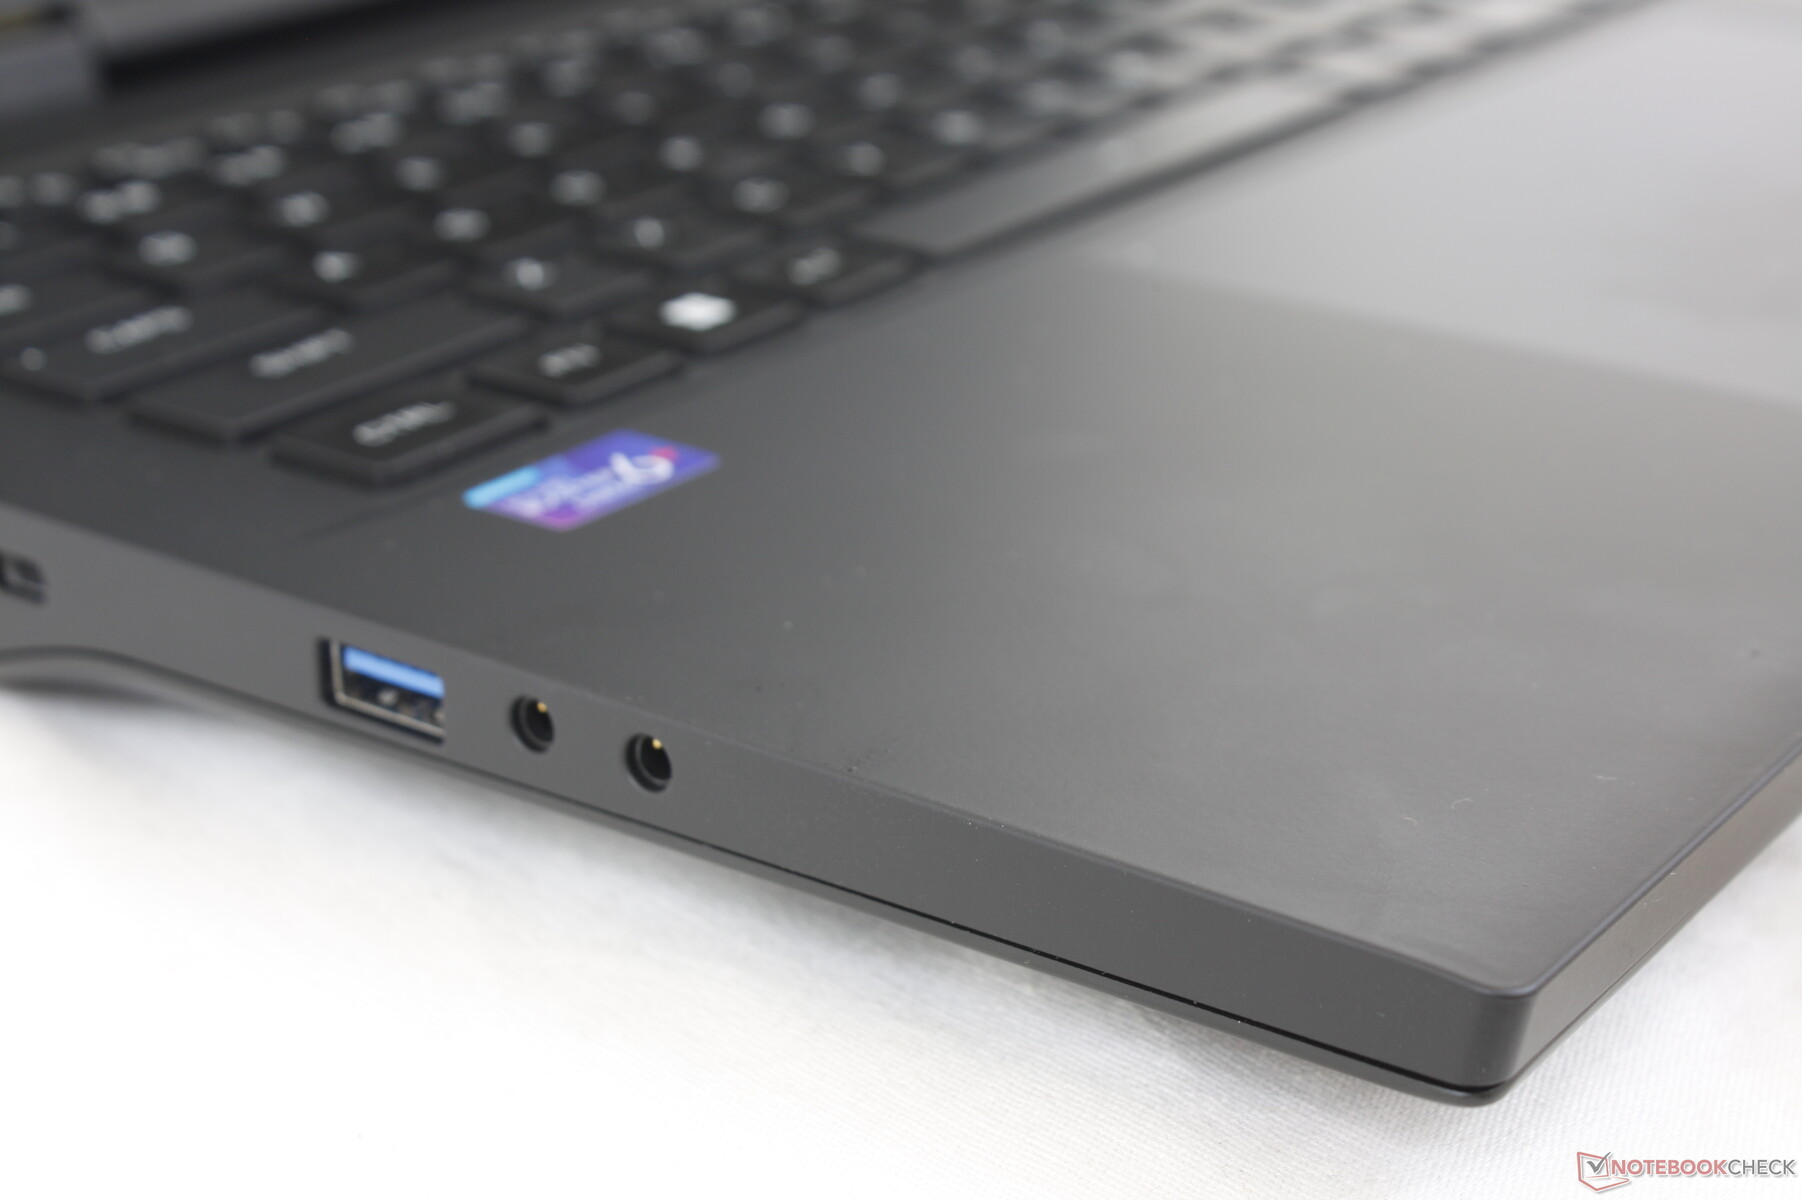
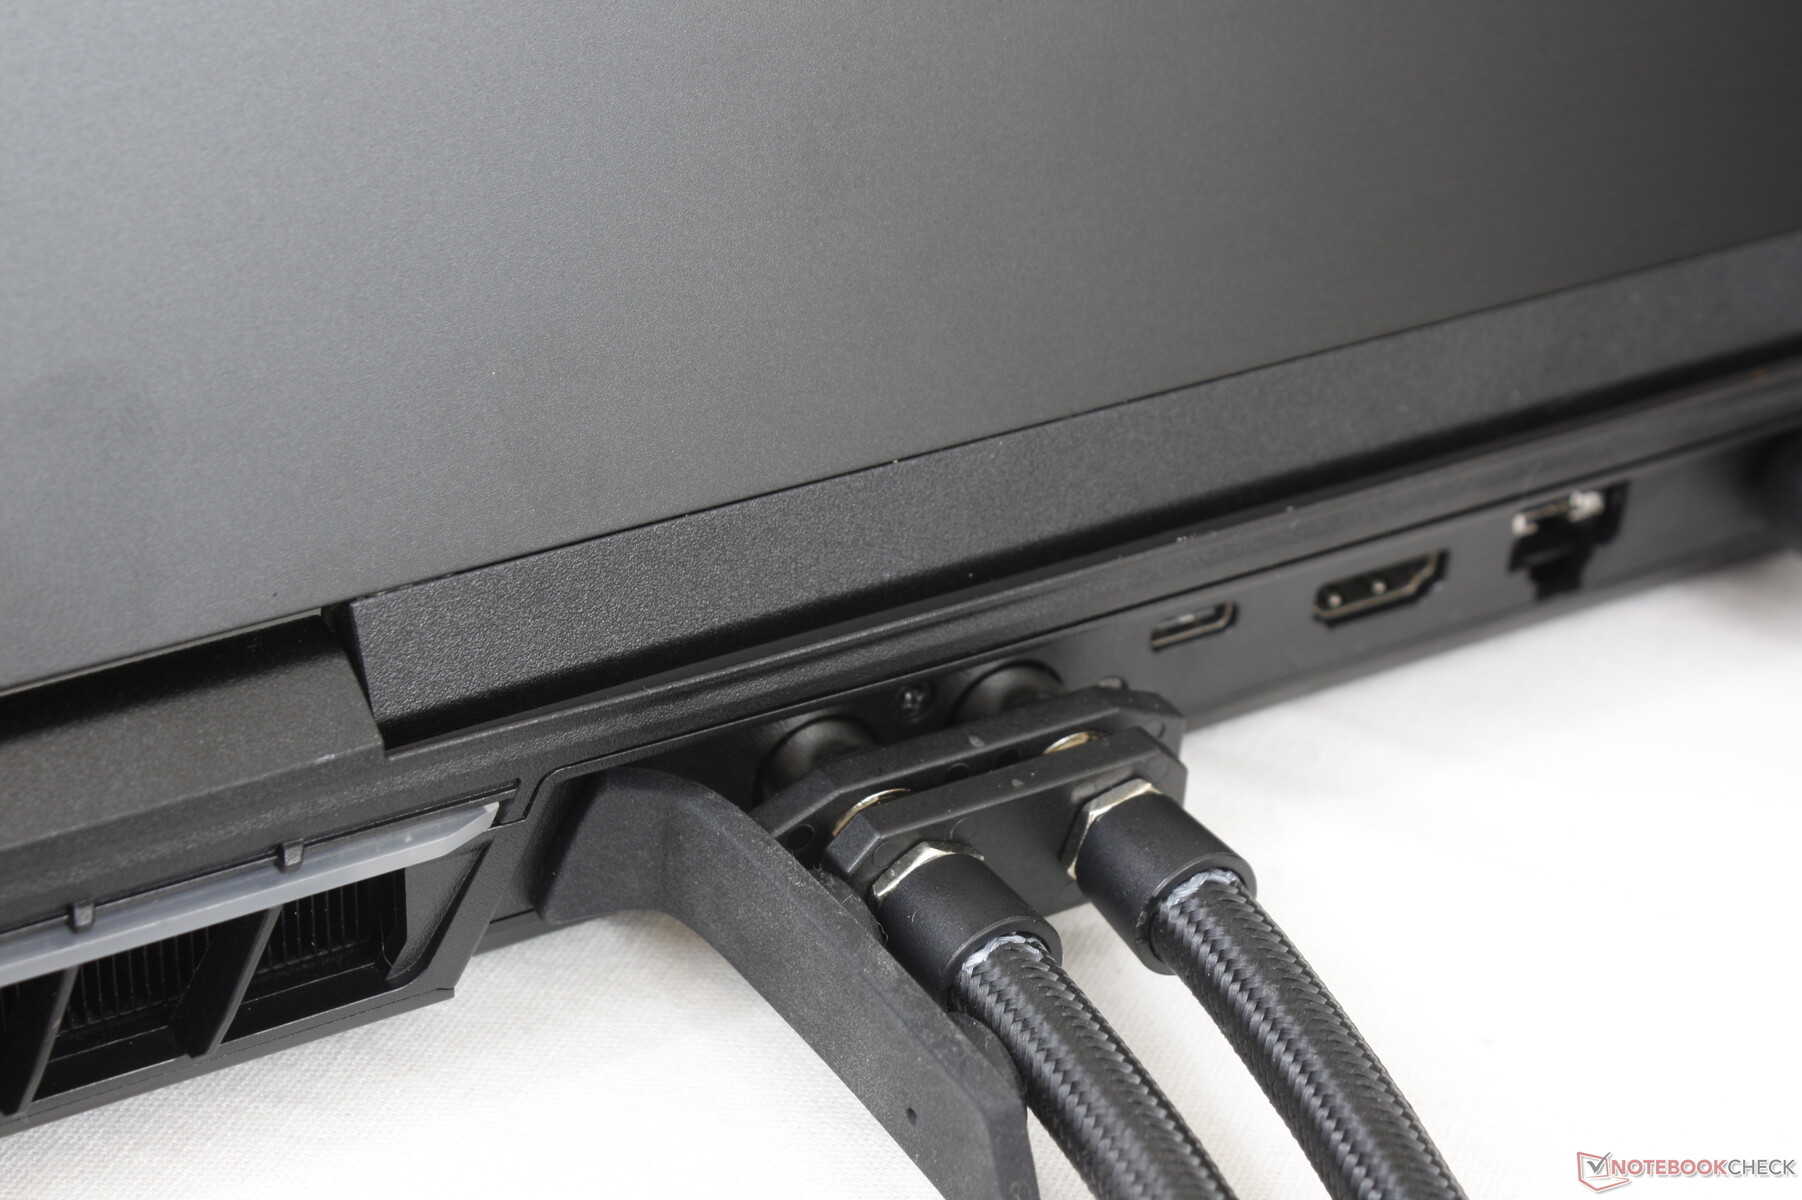
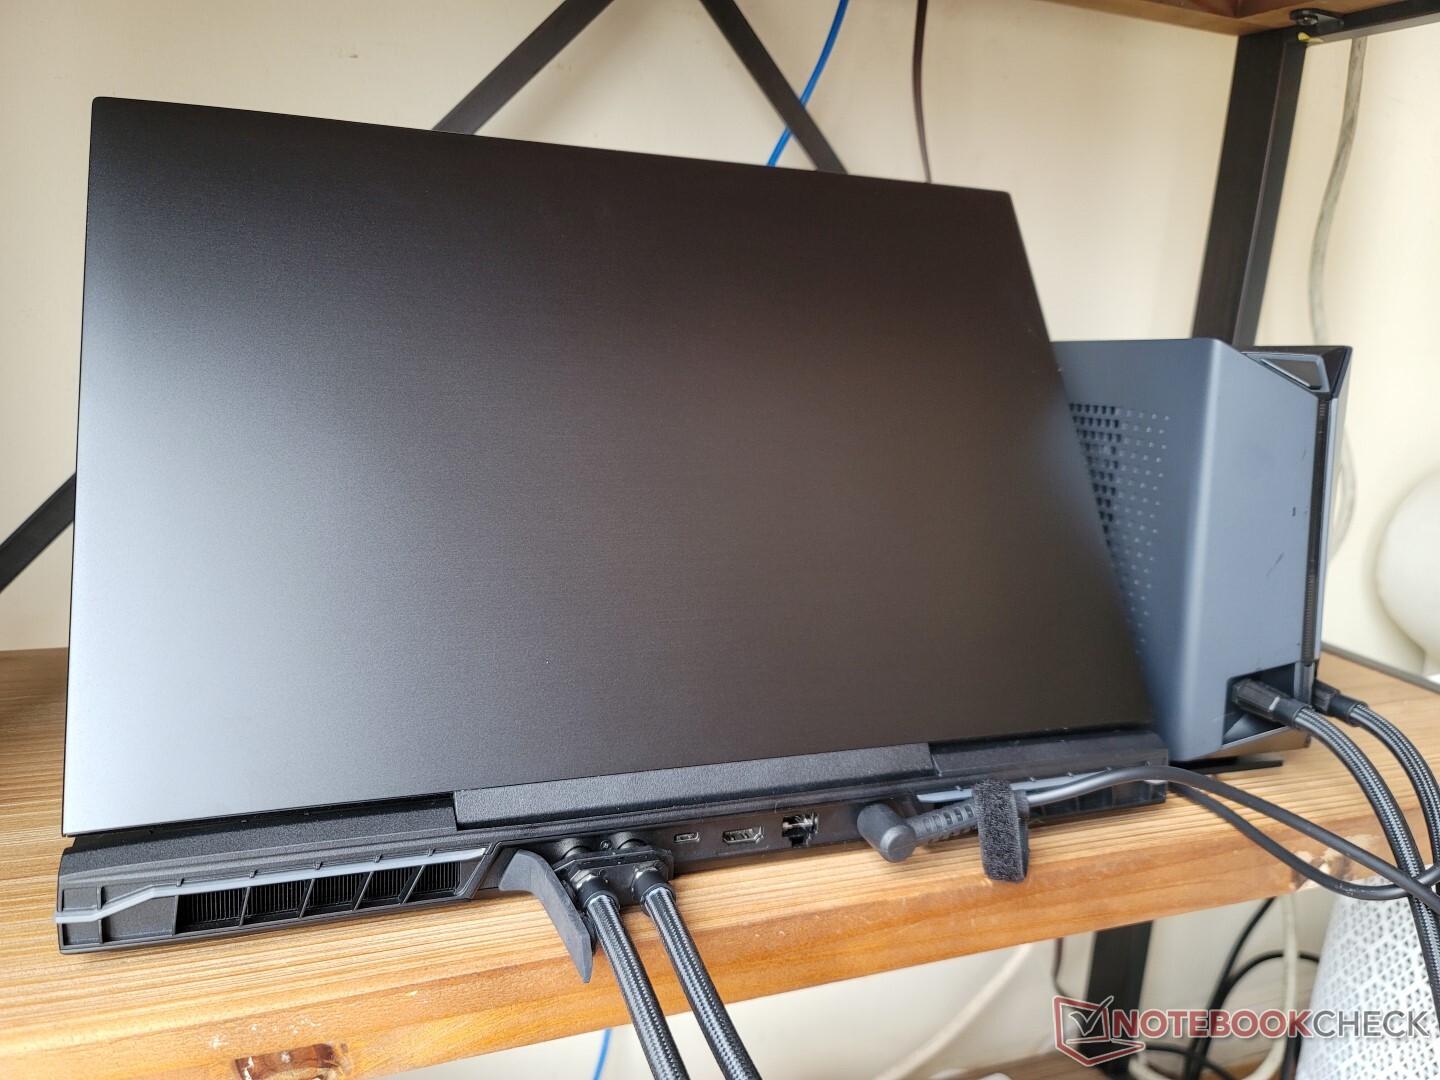
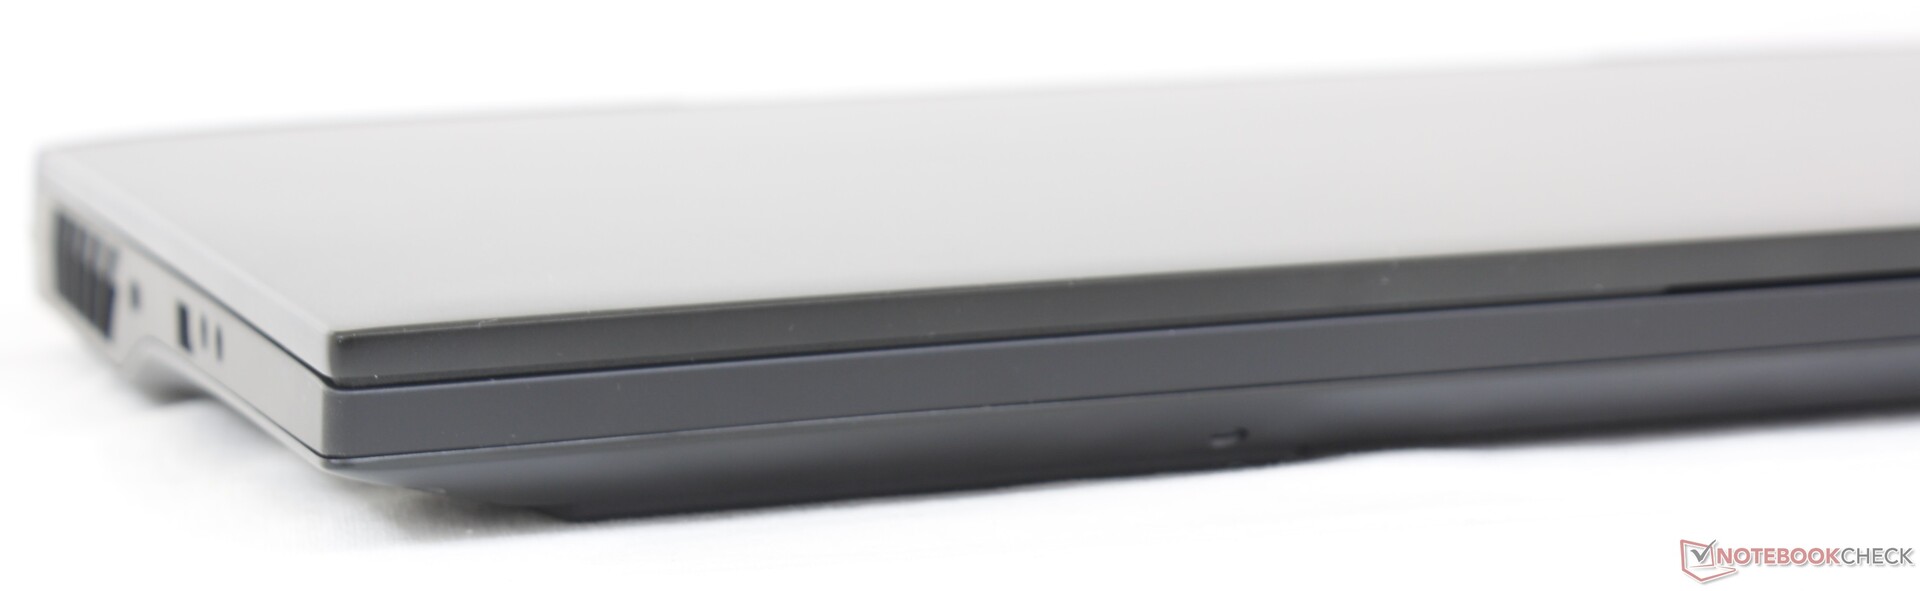
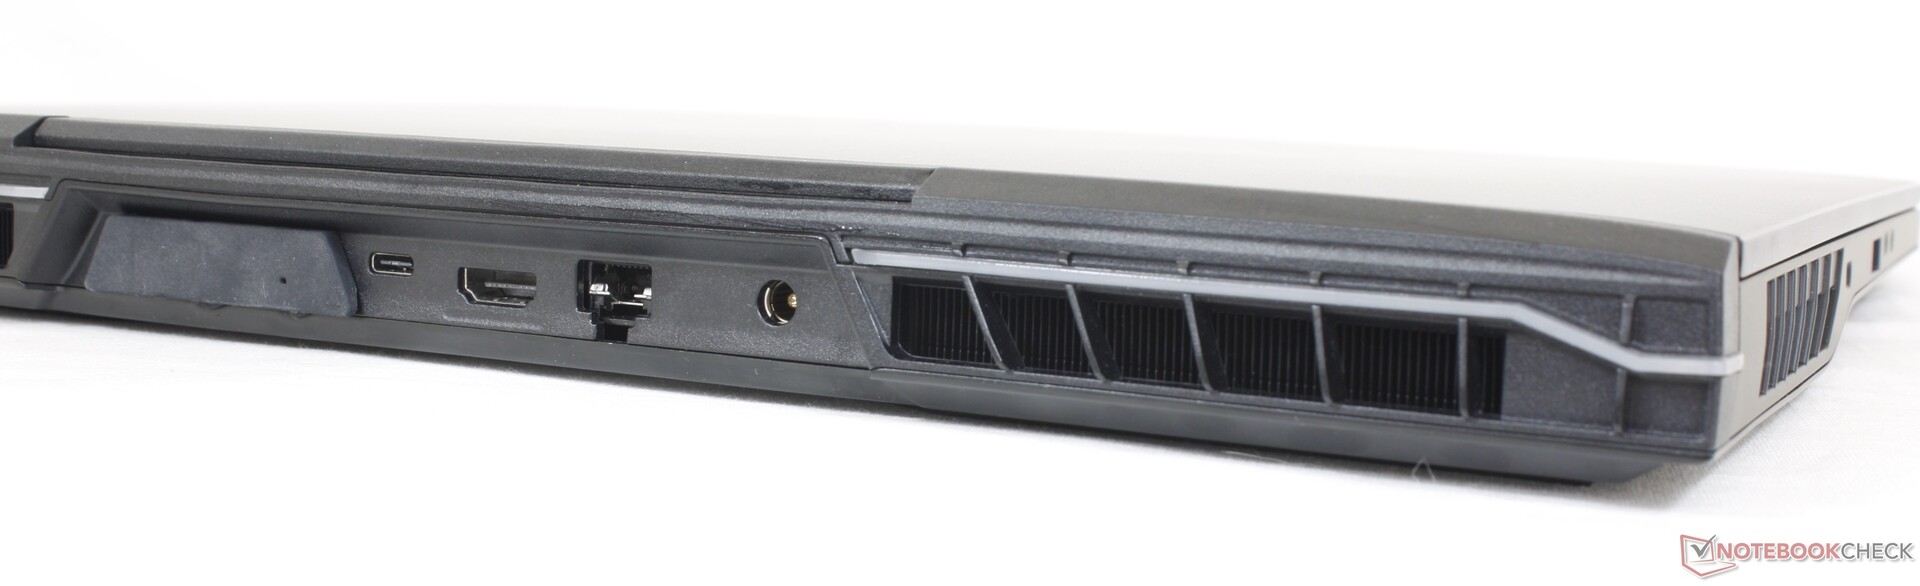
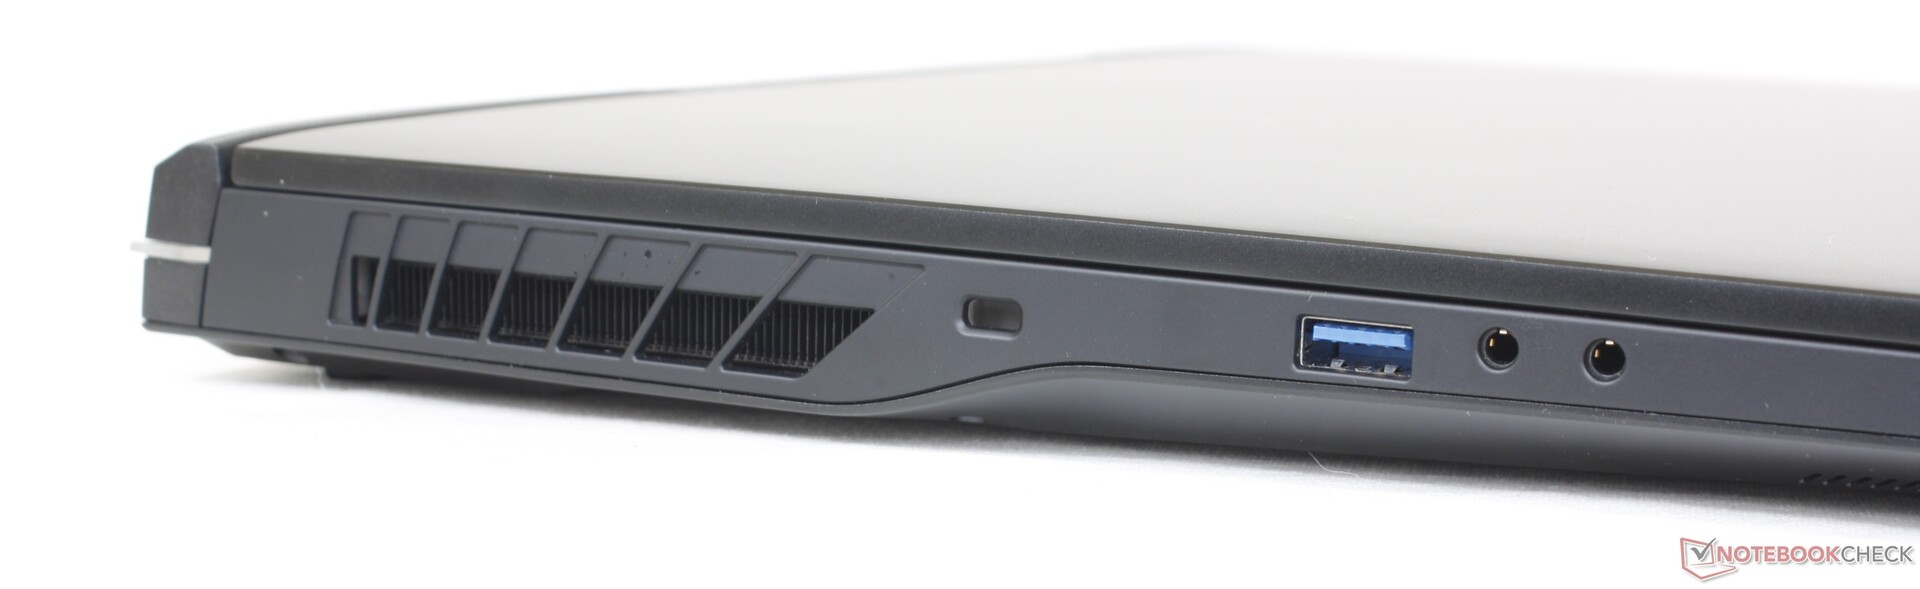
Anslutning - Stöd för Thunderbolt 4
Portalternativ och placering är identiska med Schenker XMG Neo 15 E22 på 15,6 tum, även om vår Uniwell har en större 17-tums formfaktor. Vi skulle vilja se fler USB-C-portar i framtiden eftersom den enda porten känns begränsande.
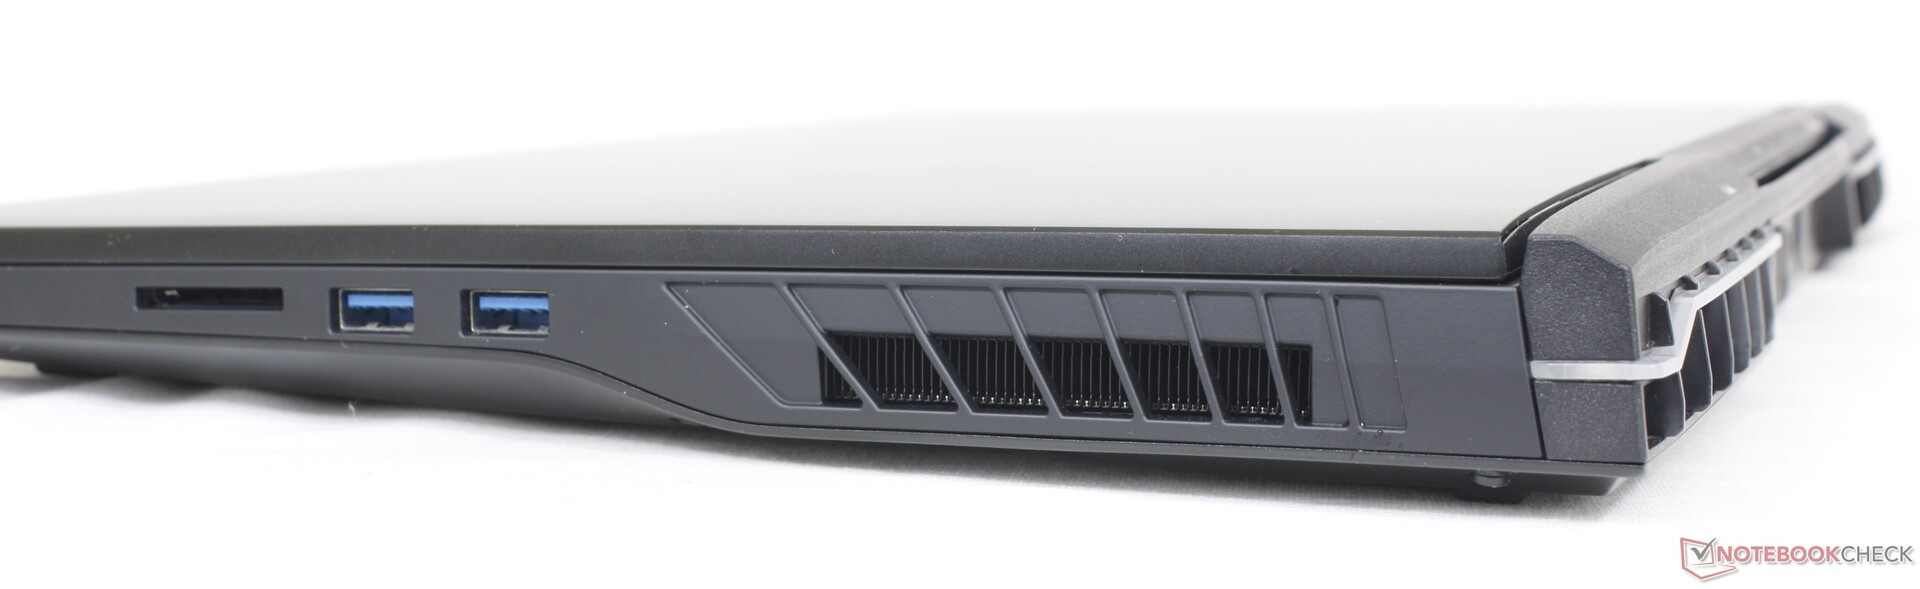
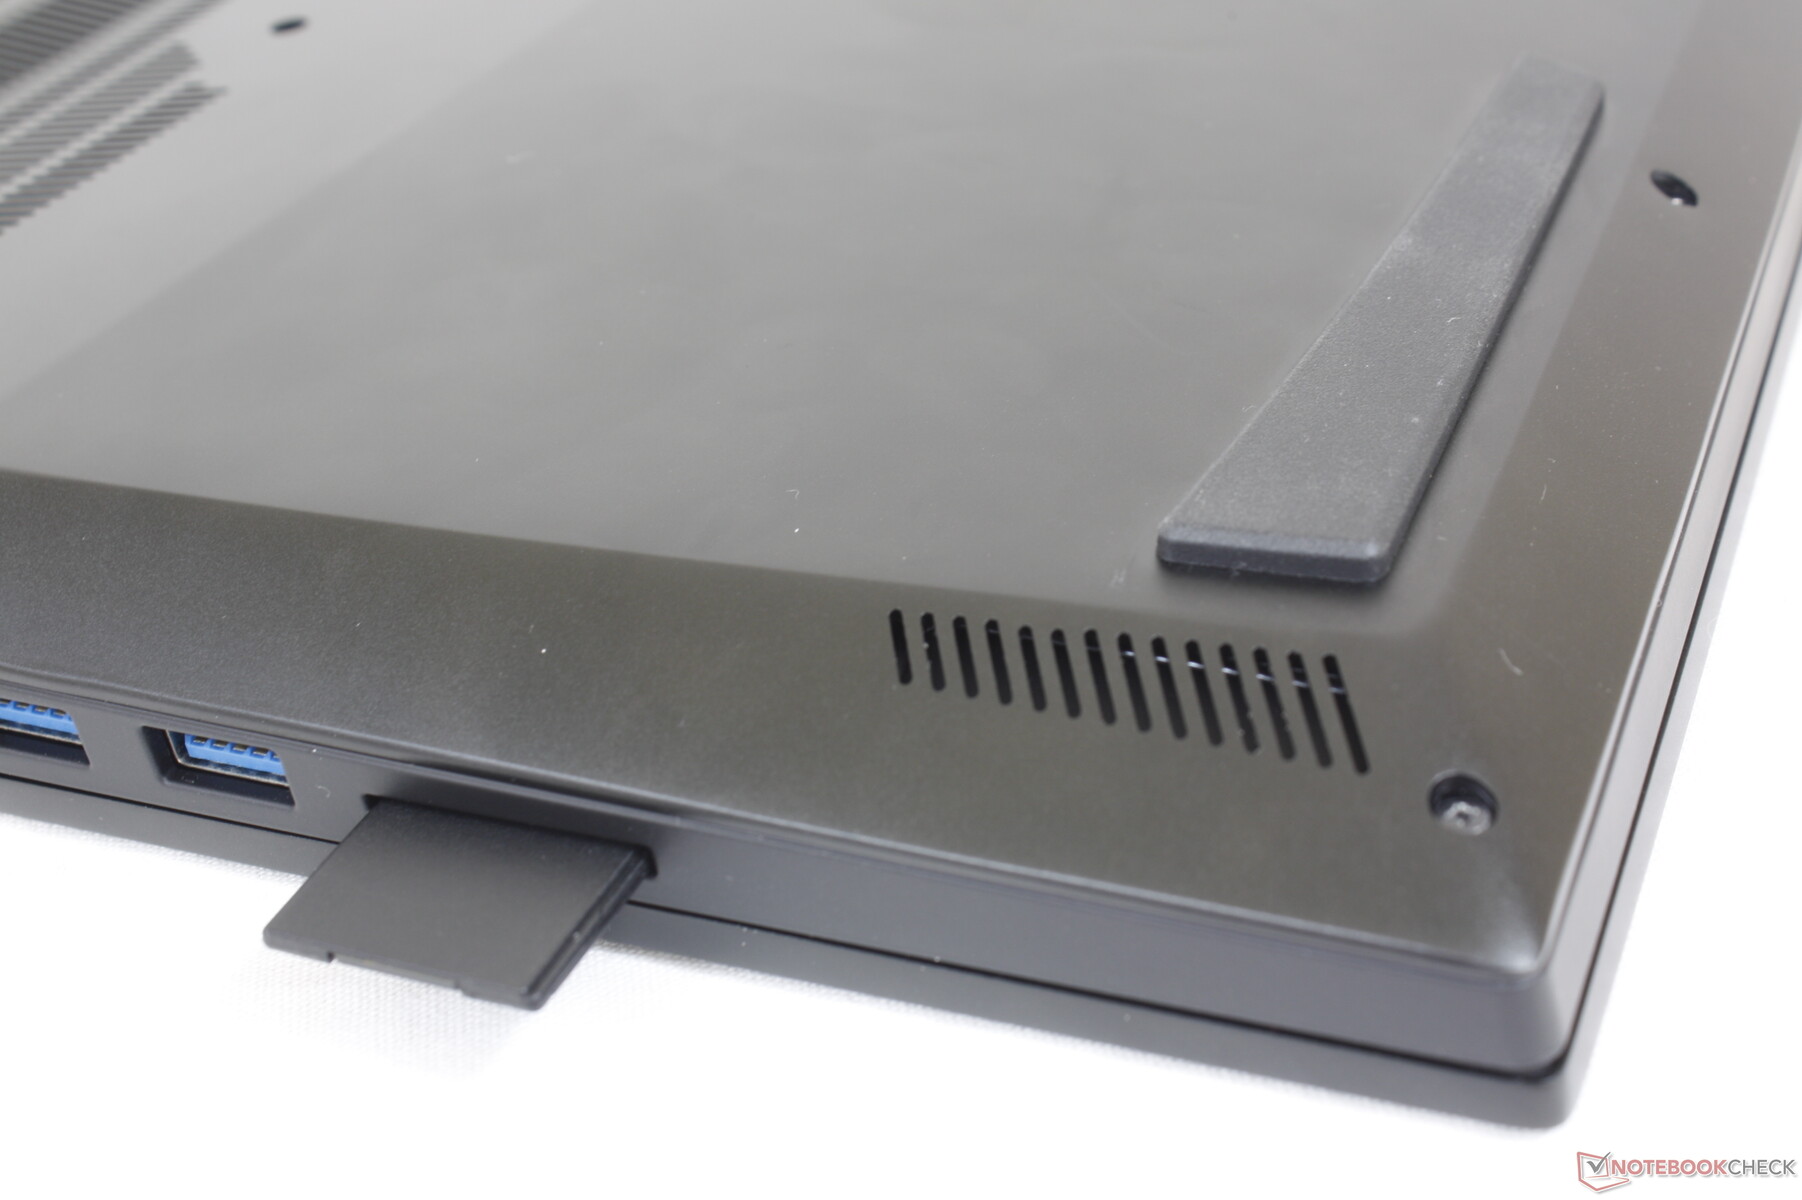
SD-kortläsare
Överföringshastigheten med den integrerade kortläsaren är bara hälften av den för Asus Zephyrus S17 eller Razer Blade 17. Detta bör inte vara ett problem för de flesta användare bortsett från de som är mycket beroende av att överföra stora filer via SD-kort.
| SD Card Reader | |
| average JPG Copy Test (av. of 3 runs) | |
| Asus ROG Zephyrus S17 GX703HSD | |
| Razer Blade 17 Early 2022 (AV PRO microSD 128 GB V60) | |
| Uniwell Technology GM7AG8N Liquid Cooling Box (AV PRO microSD 128 GB V60) | |
| MSI Stealth GS77 12UHS-083US (AV Pro V60) | |
| MSI Titan GT77 12UHS (AV PRO microSD 128 GB V60) | |
| maximum AS SSD Seq Read Test (1GB) | |
| Asus ROG Zephyrus S17 GX703HSD | |
| Uniwell Technology GM7AG8N Liquid Cooling Box (AV PRO microSD 128 GB V60) | |
| MSI Titan GT77 12UHS (AV PRO microSD 128 GB V60) | |
| MSI Stealth GS77 12UHS-083US (AV Pro V60) | |
Kommunikation
Det är en liten besvikelse att Wi-Fi 6E inte ingår med tanke på det höga priset på den bärbara datorn. Ändå är Wi-Fi 6 fortfarande mer än tillräckligt för de flesta användare eftersom Wi-Fi 6E sällan är bättre i de flesta verkliga scenarier.
| Networking | |
| iperf3 transmit AX12 | |
| MSI Stealth GS77 12UHS-083US | |
| Asus ROG Zephyrus S17 GX703HSD | |
| iperf3 receive AX12 | |
| MSI Stealth GS77 12UHS-083US | |
| Asus ROG Zephyrus S17 GX703HSD | |
| iperf3 receive AXE11000 6GHz | |
| Aorus 17X XES | |
| MSI Titan GT77 12UHS | |
| iperf3 receive AXE11000 | |
| MSI Titan GT77 12UHS | |
| Razer Blade 17 Early 2022 | |
| Uniwell Technology GM7AG8N Liquid Cooling Box | |
| iperf3 transmit AXE11000 6GHz | |
| Aorus 17X XES | |
| MSI Titan GT77 12UHS | |
| iperf3 transmit AXE11000 | |
| MSI Titan GT77 12UHS | |
| Uniwell Technology GM7AG8N Liquid Cooling Box | |
Webbkamera
2 MP-kameran har dåliga färger, till och med enligt de redan låga standarderna för webbkameror. IR-stöd stöds, men det finns ingen avskärmande slutare.


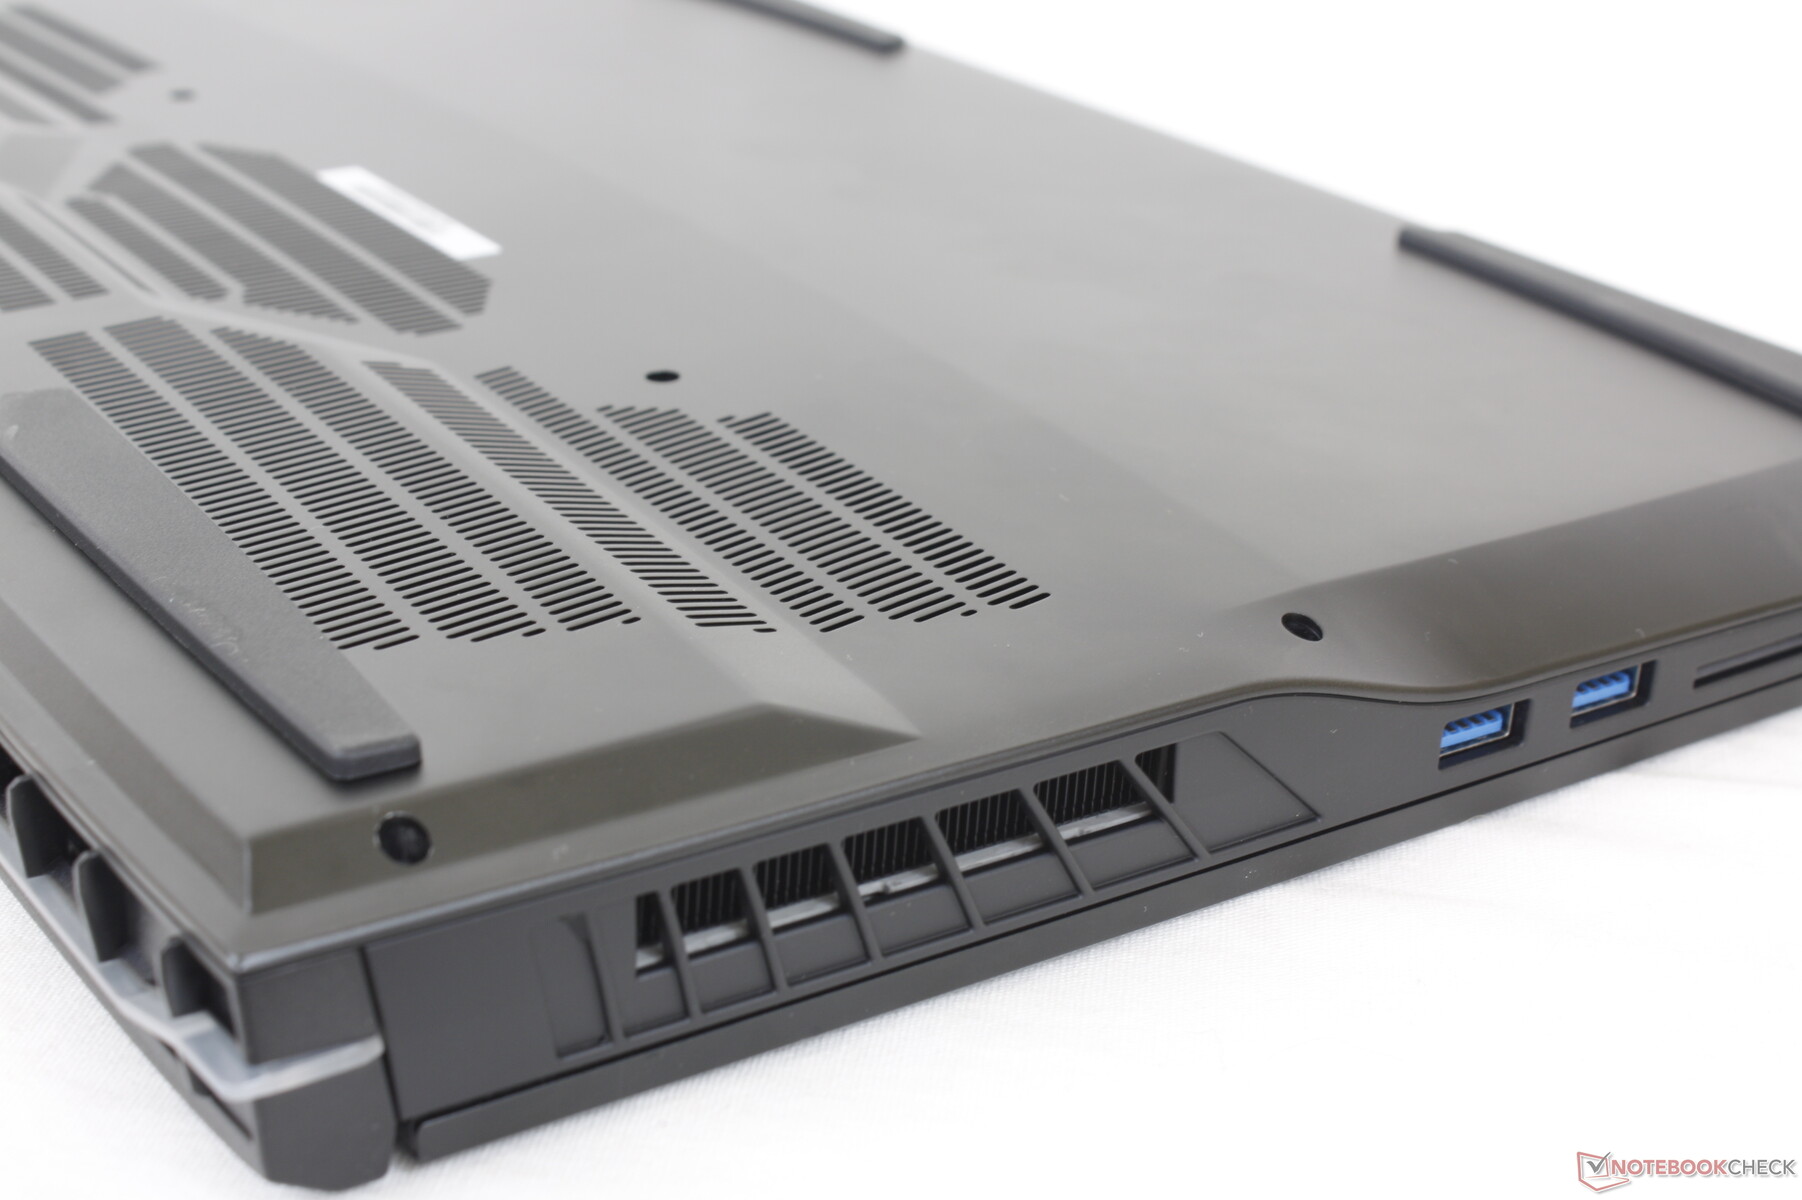
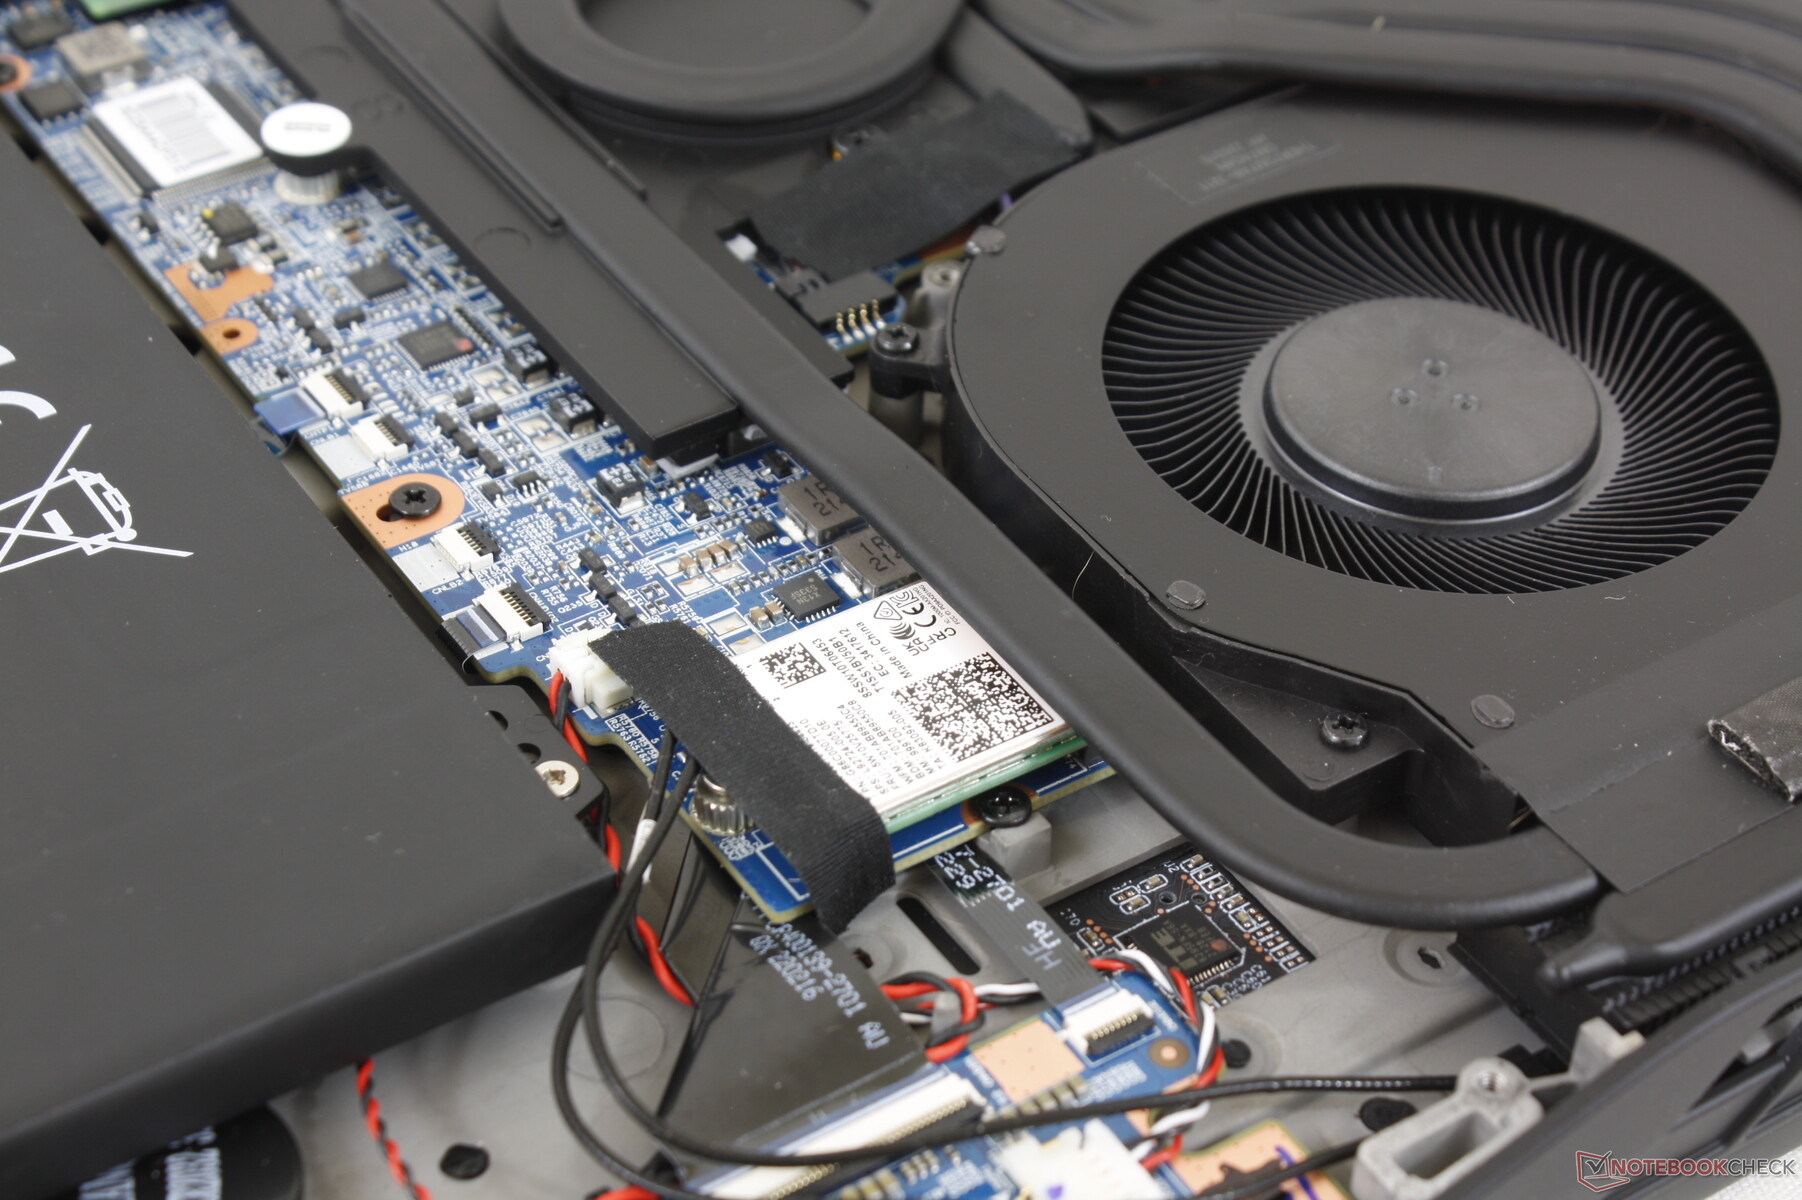
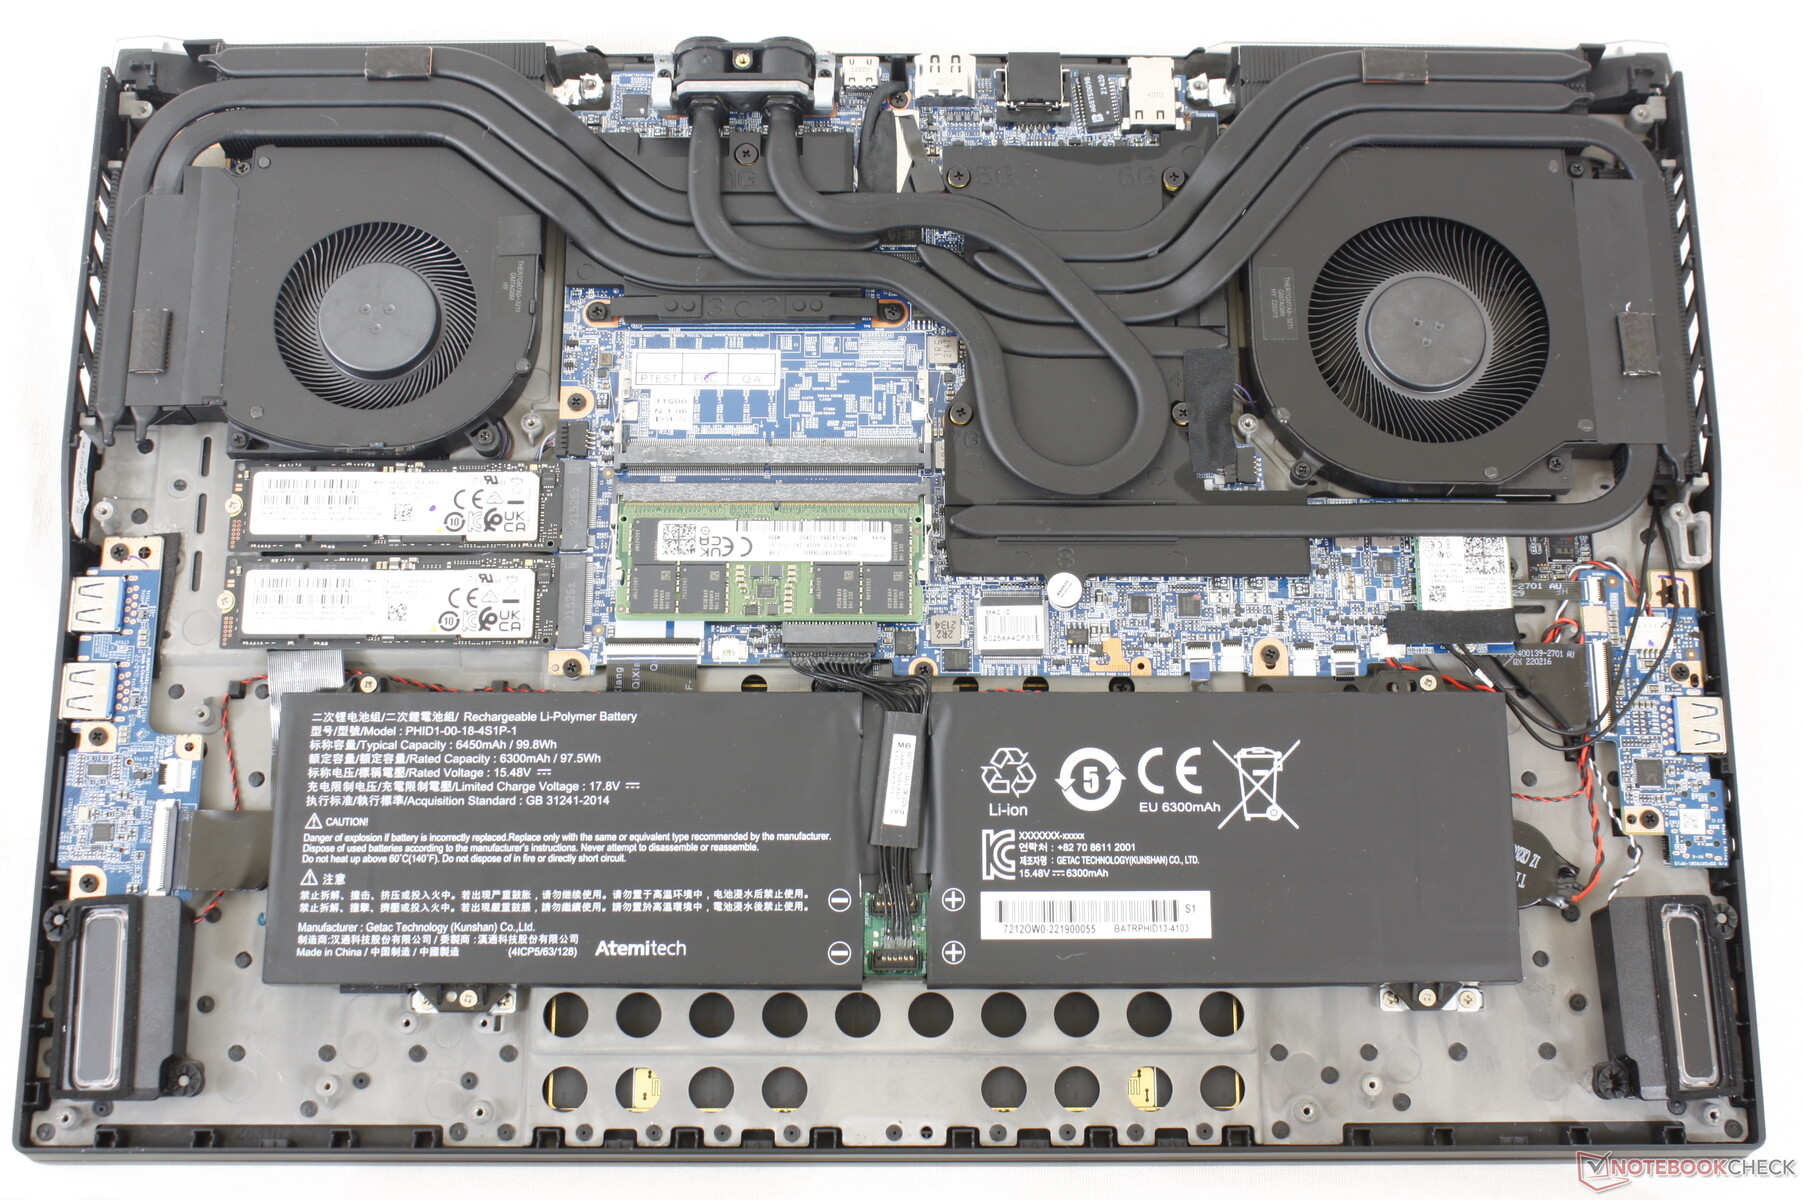
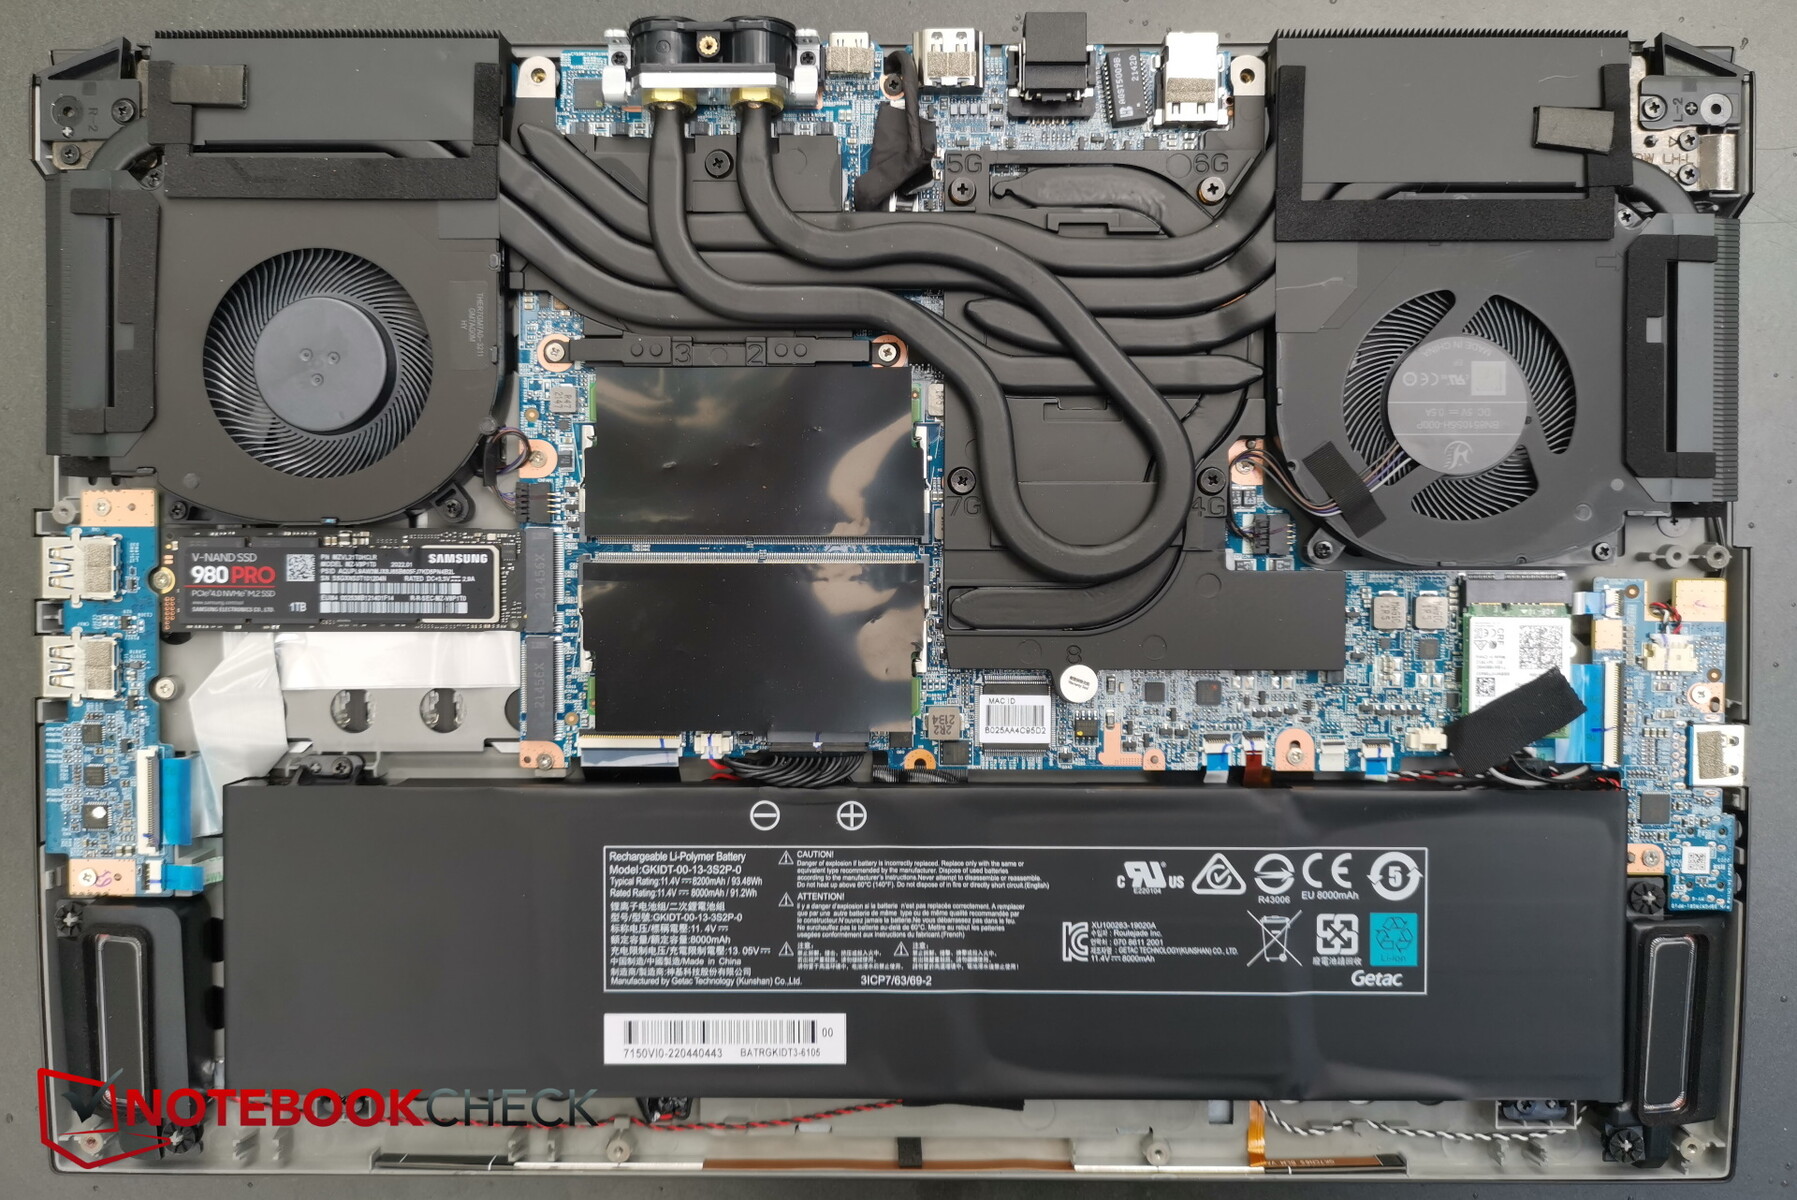
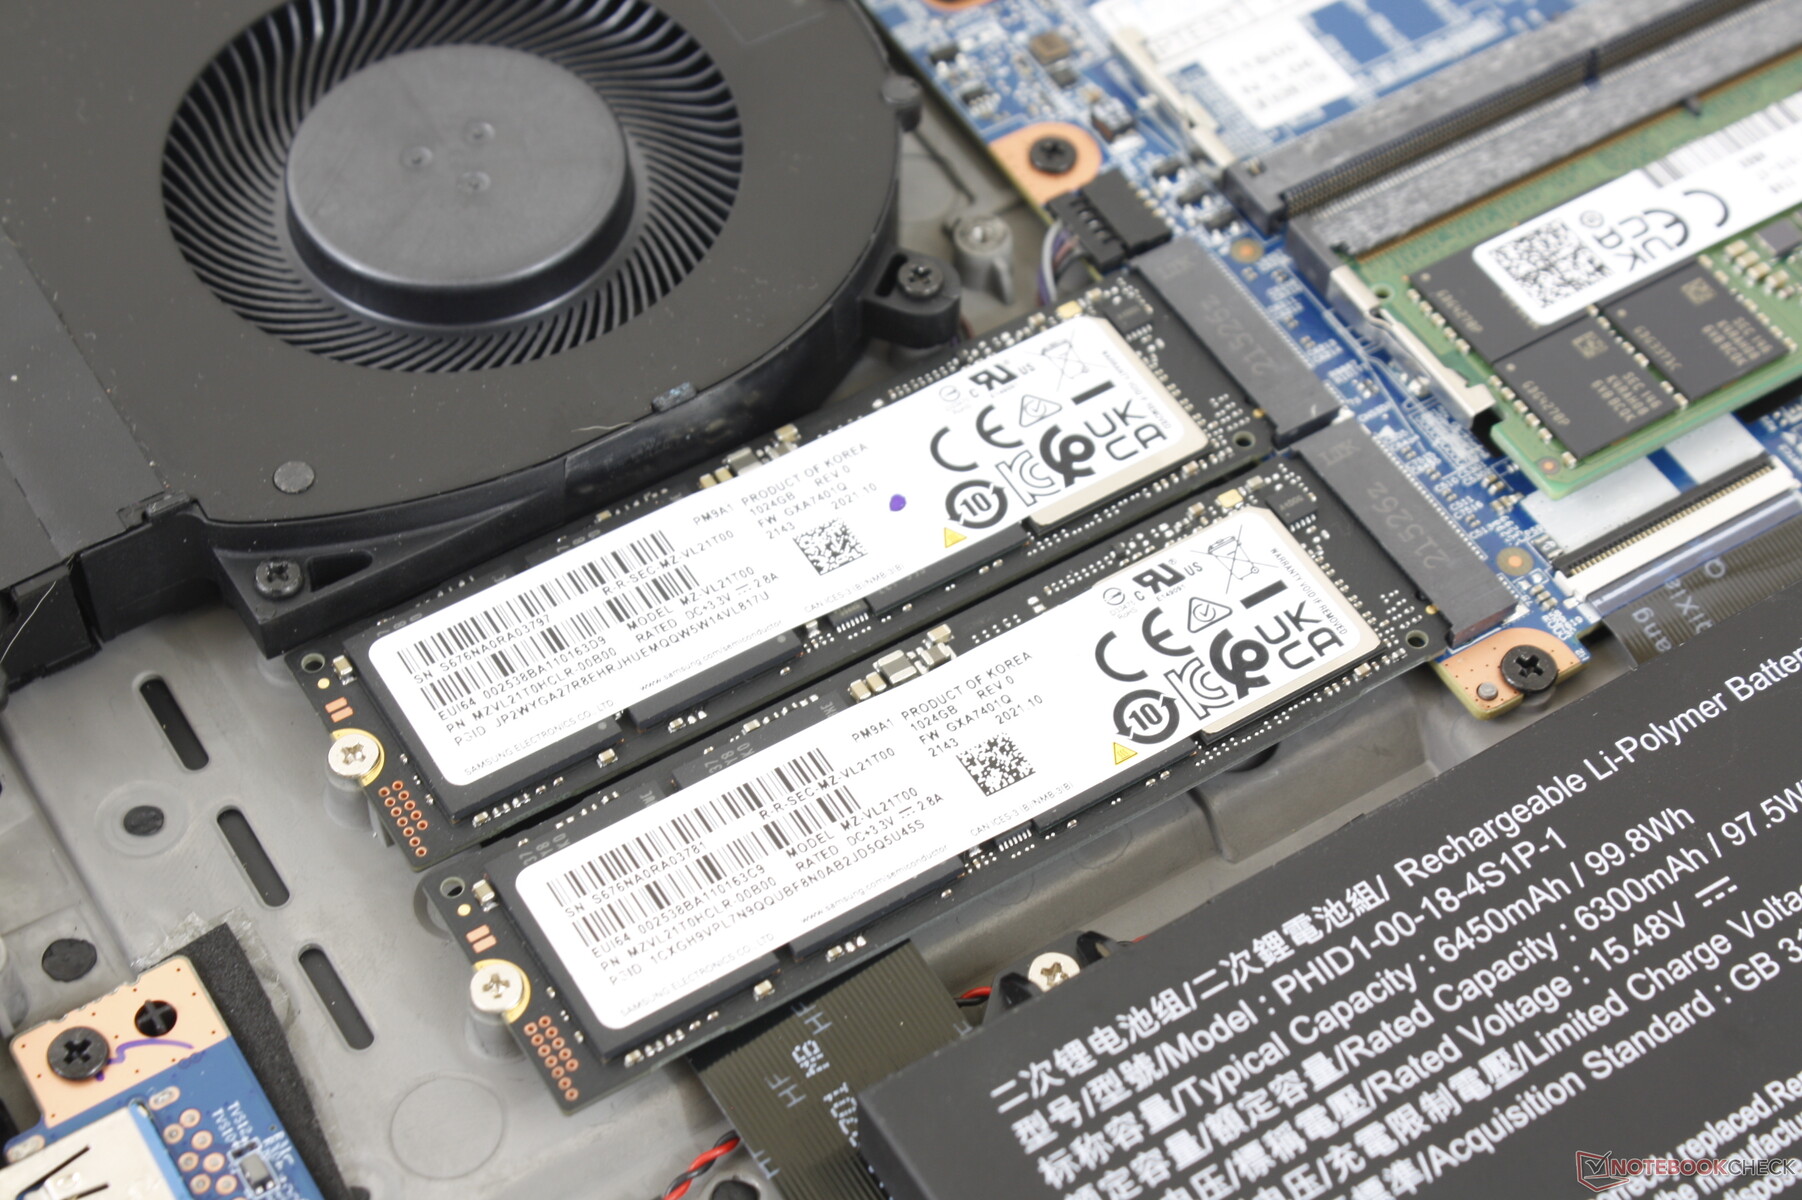
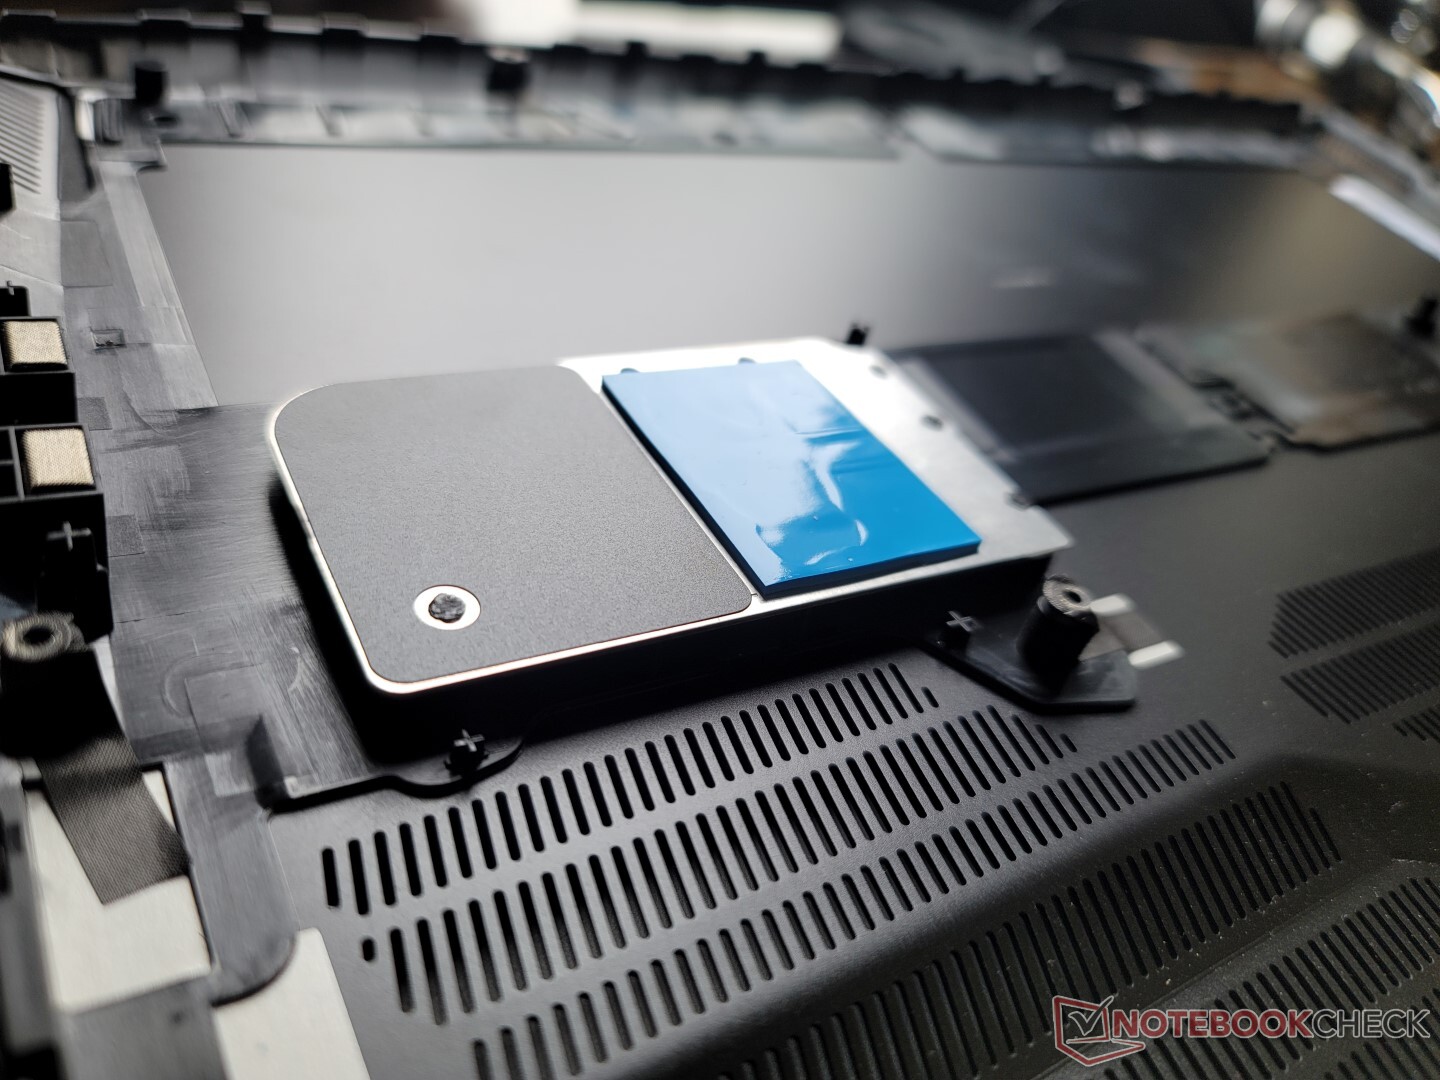
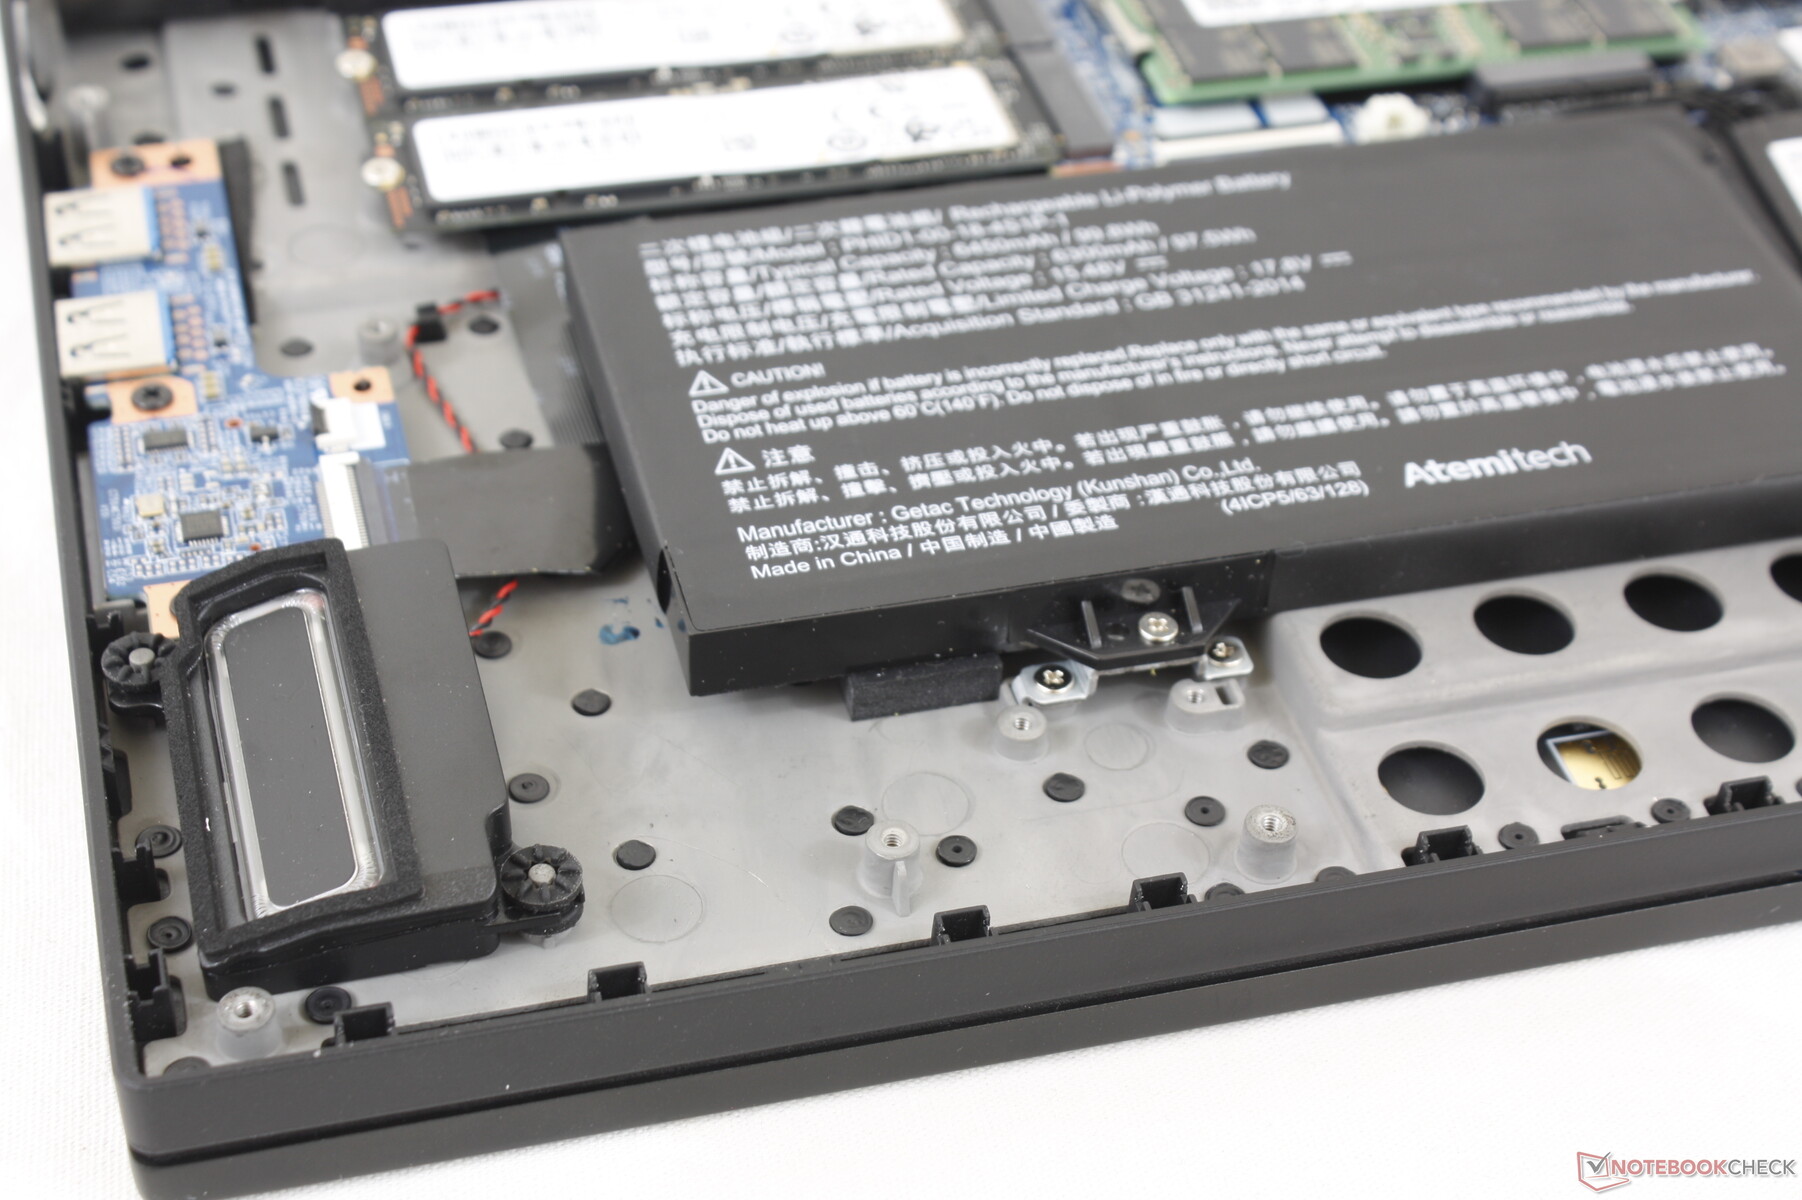
Underhåll
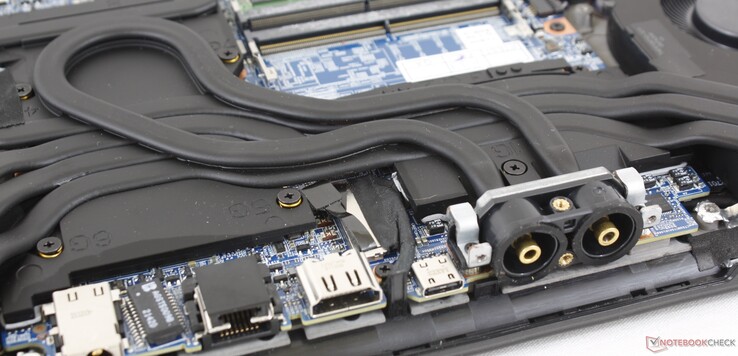
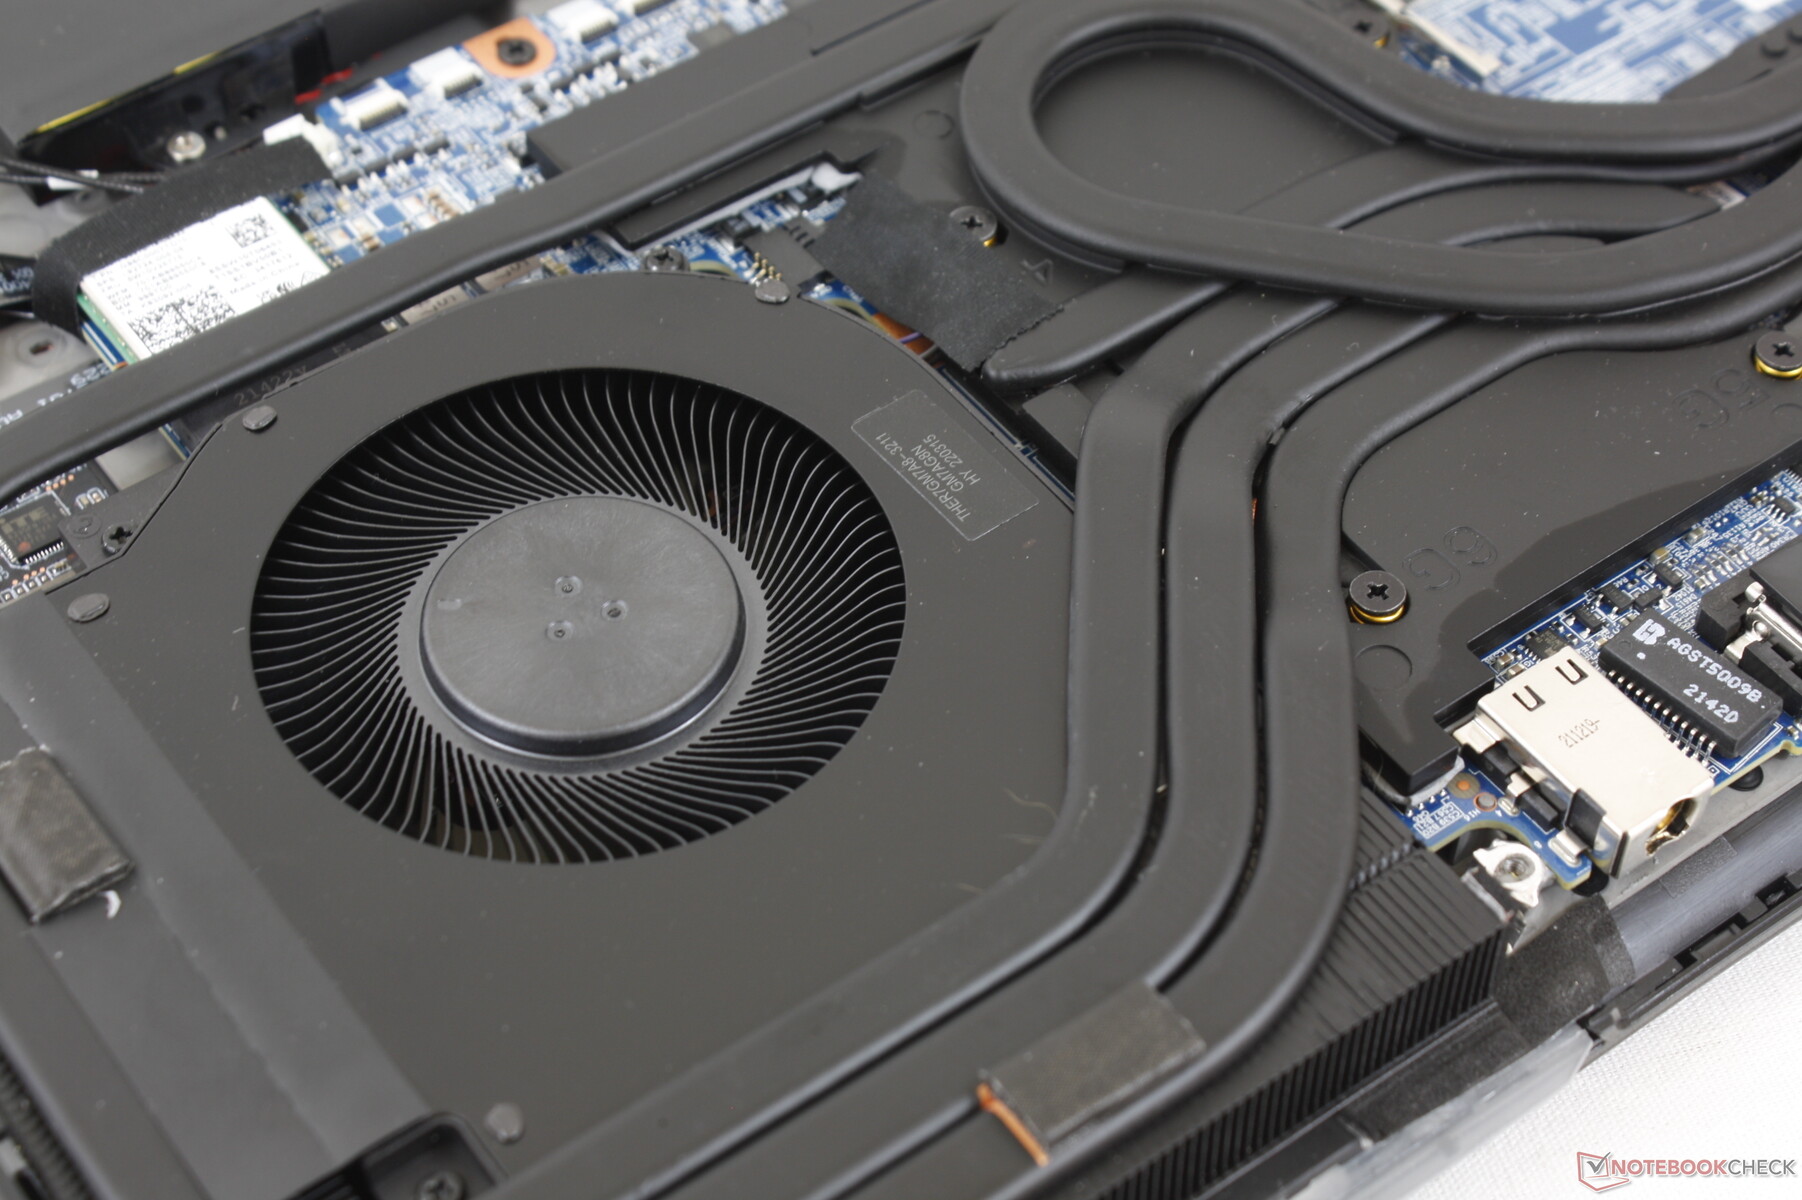
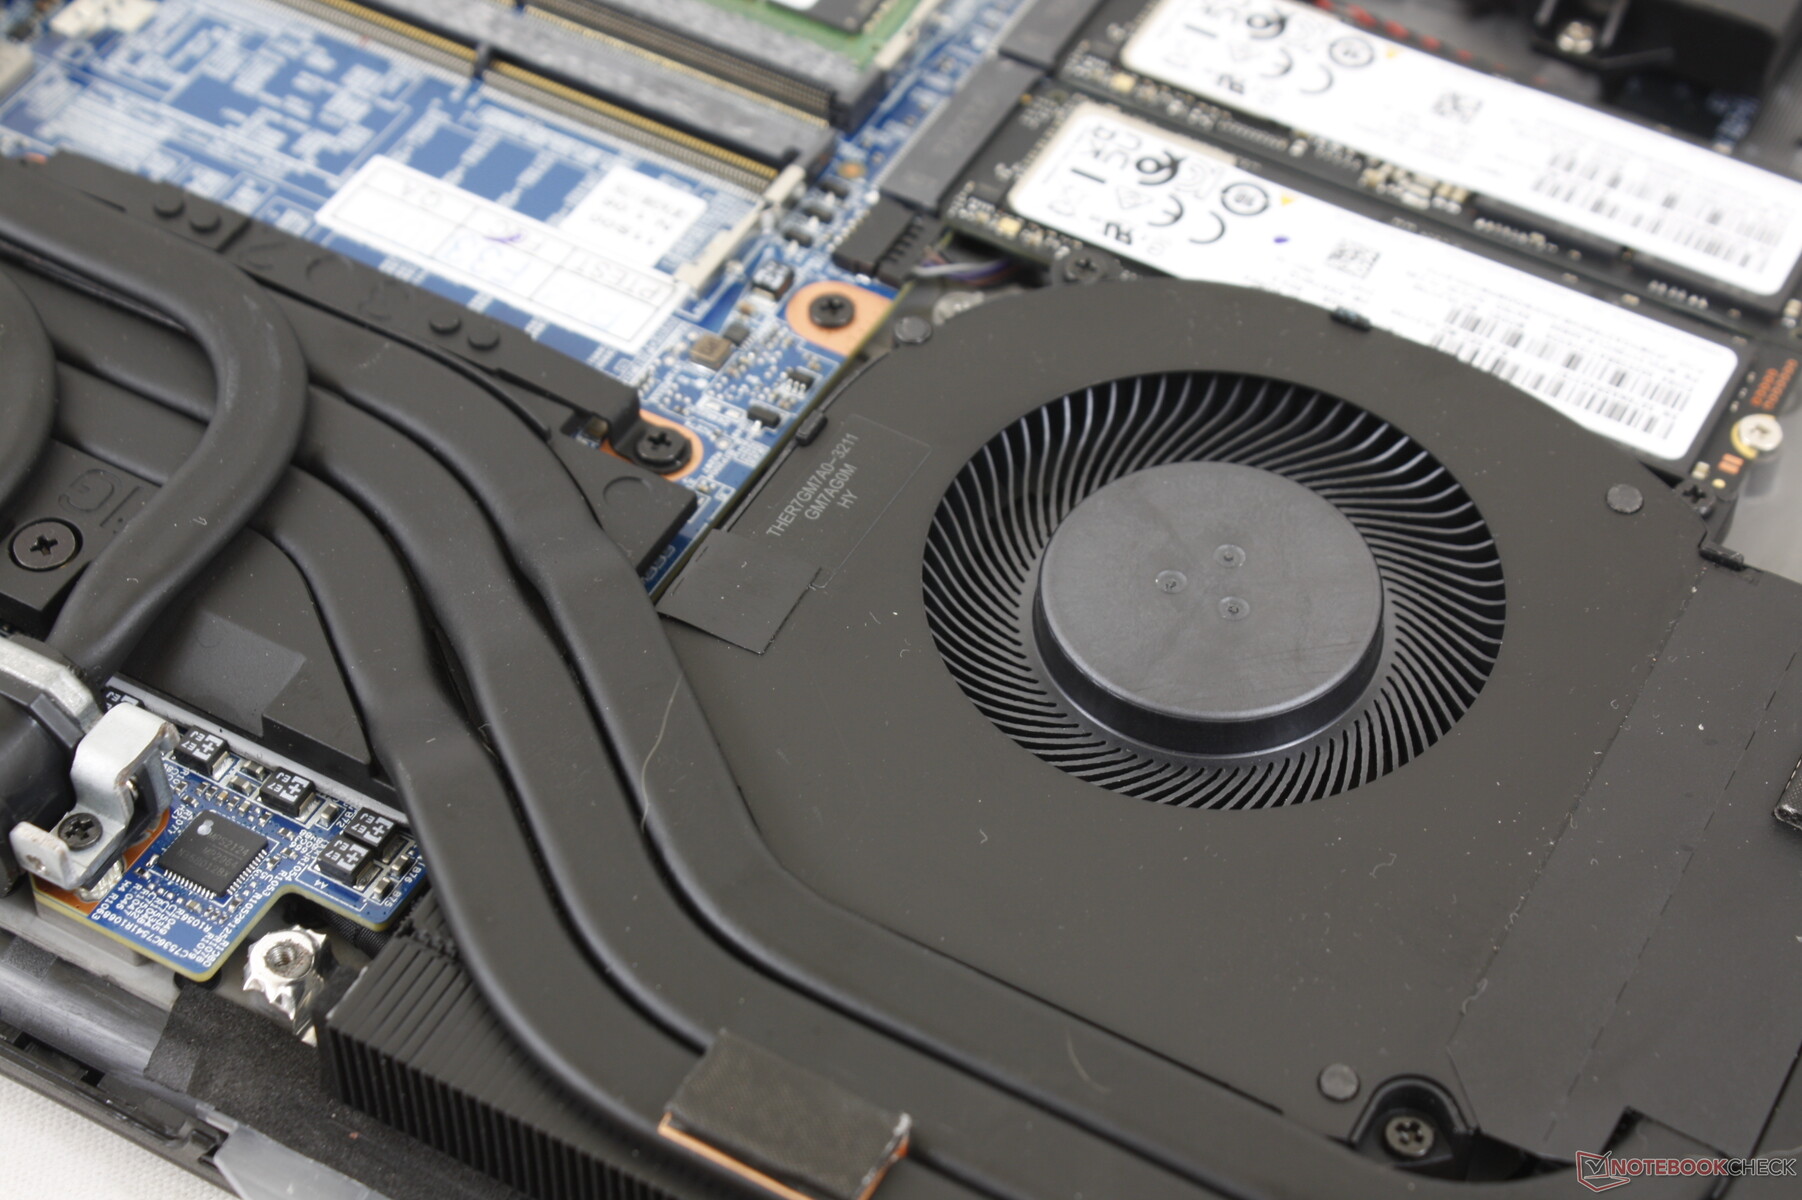
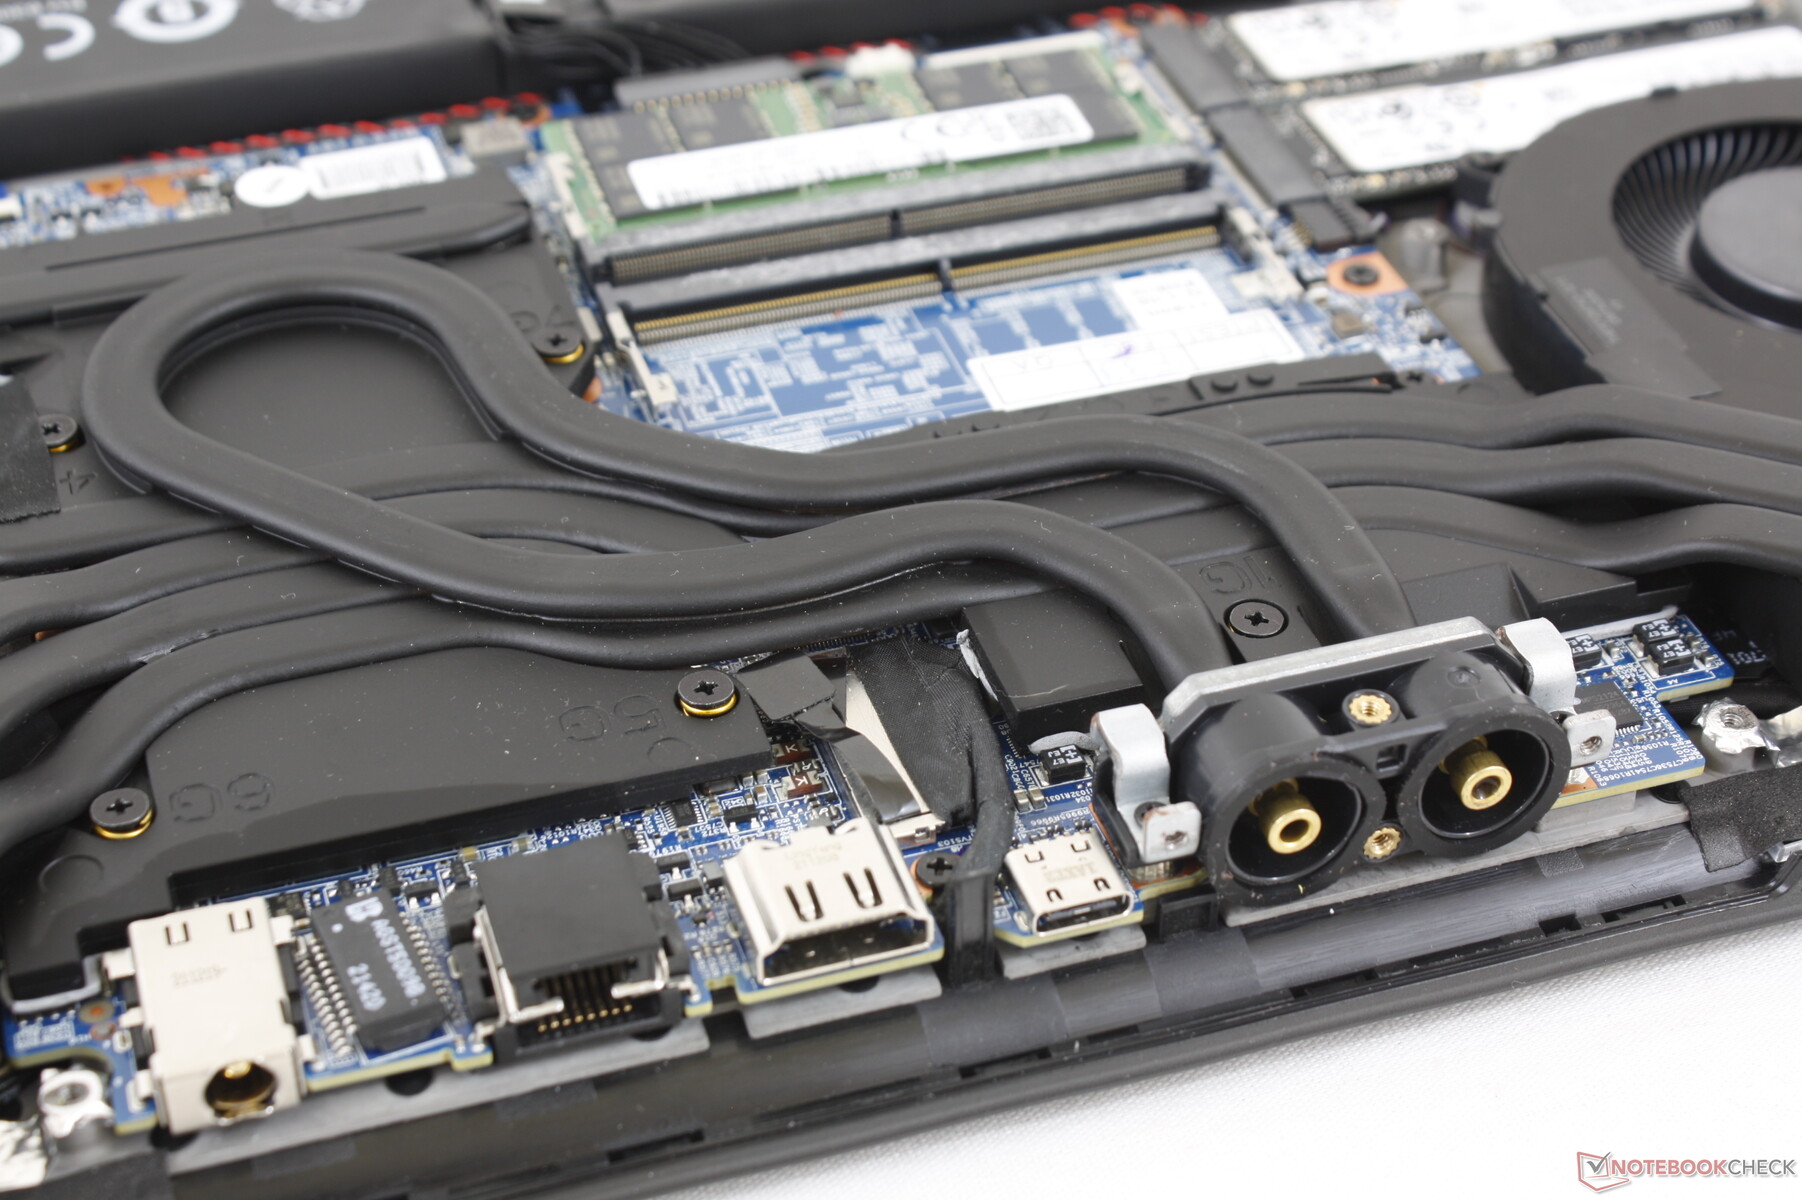
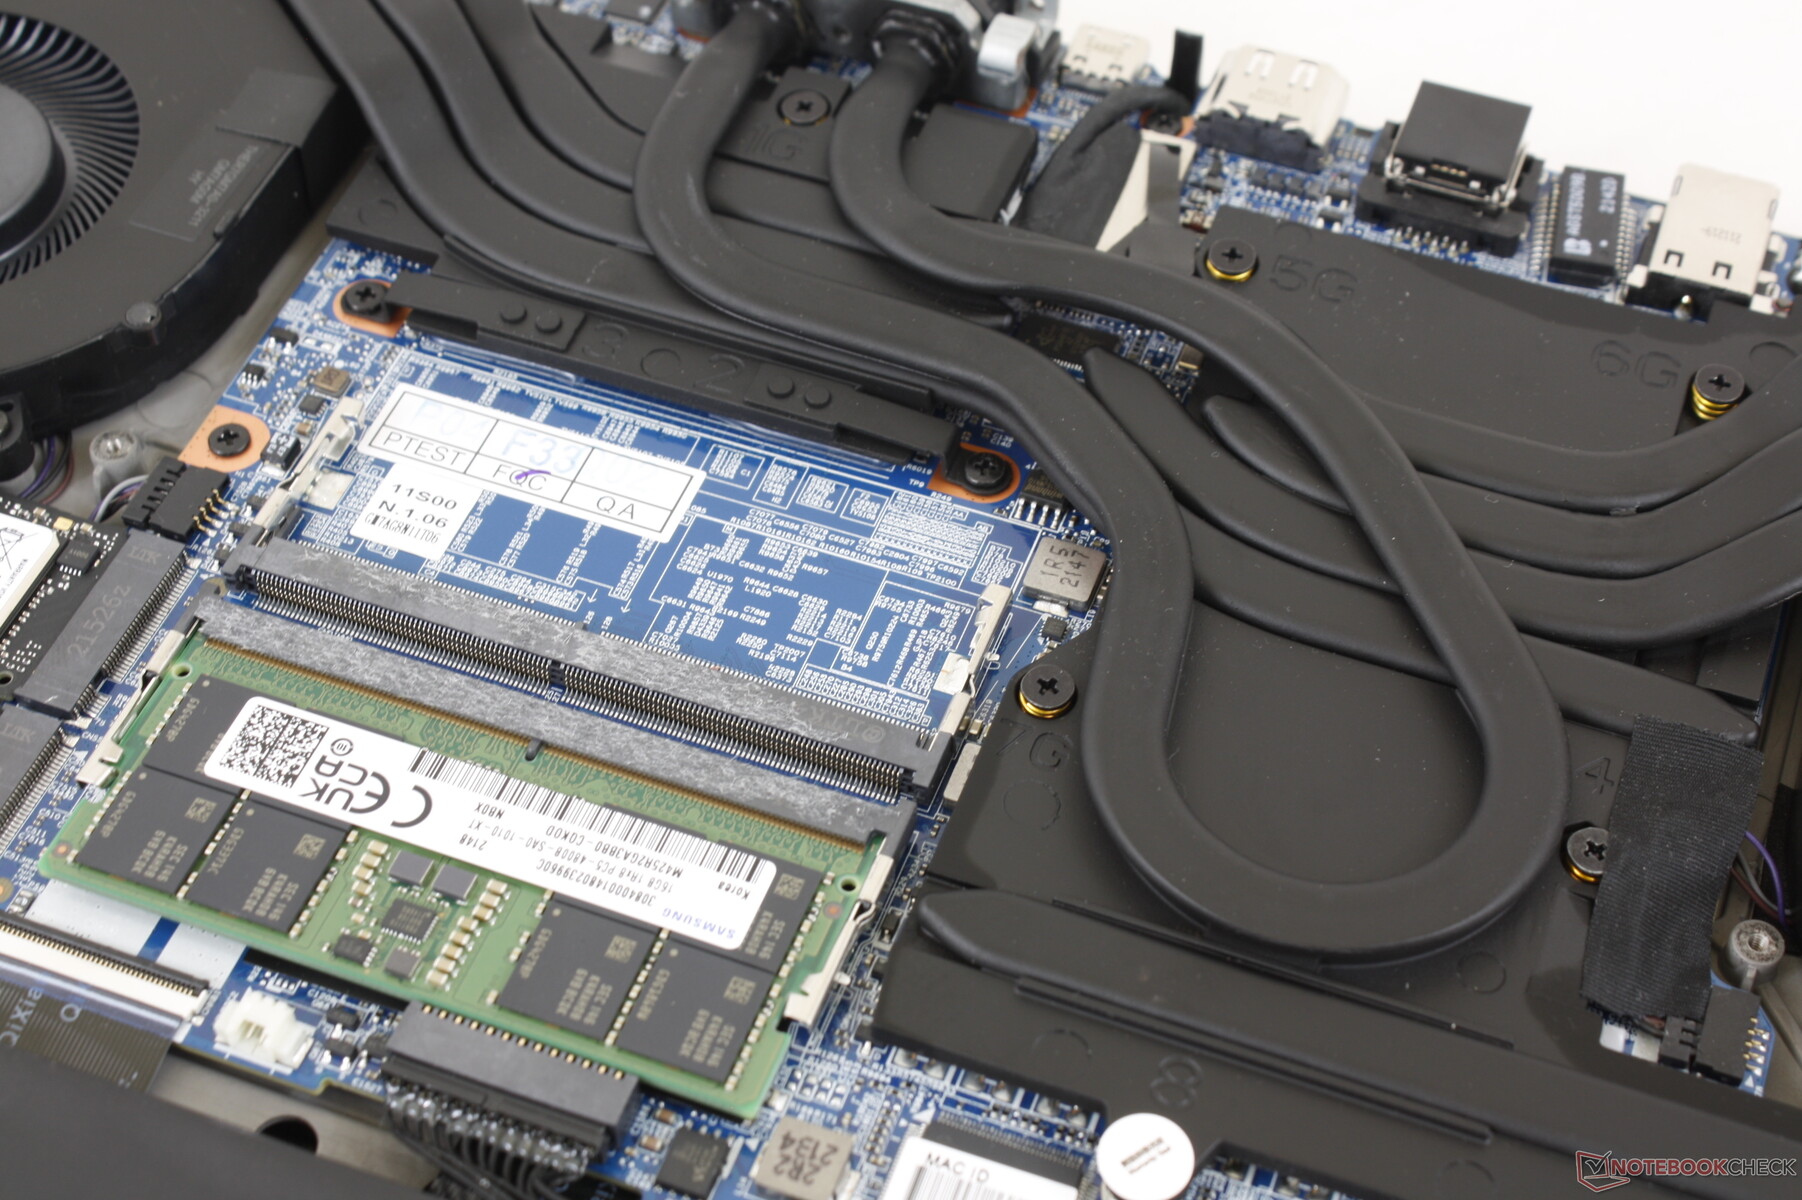
Bottenpanelen kan enkelt tas bort efter att du tagit bort flera Philips-skruvar för att enkelt kunna uppgradera RAM- eller SSD-minne. Moderkortet har många likheter med GM5AG8W men med små förändringar i kylningslösningen, vilket framgår av jämförelsebilderna nedan.
Tillbehör och garanti
Den externa kylboxen innehåller två avloppspluggar, två vattenslangar, två vattenproppar och en bruksanvisning utöver den vanliga växelströmsadaptern.
Den vanliga ettåriga begränsade garantin gäller om den köps i USA.
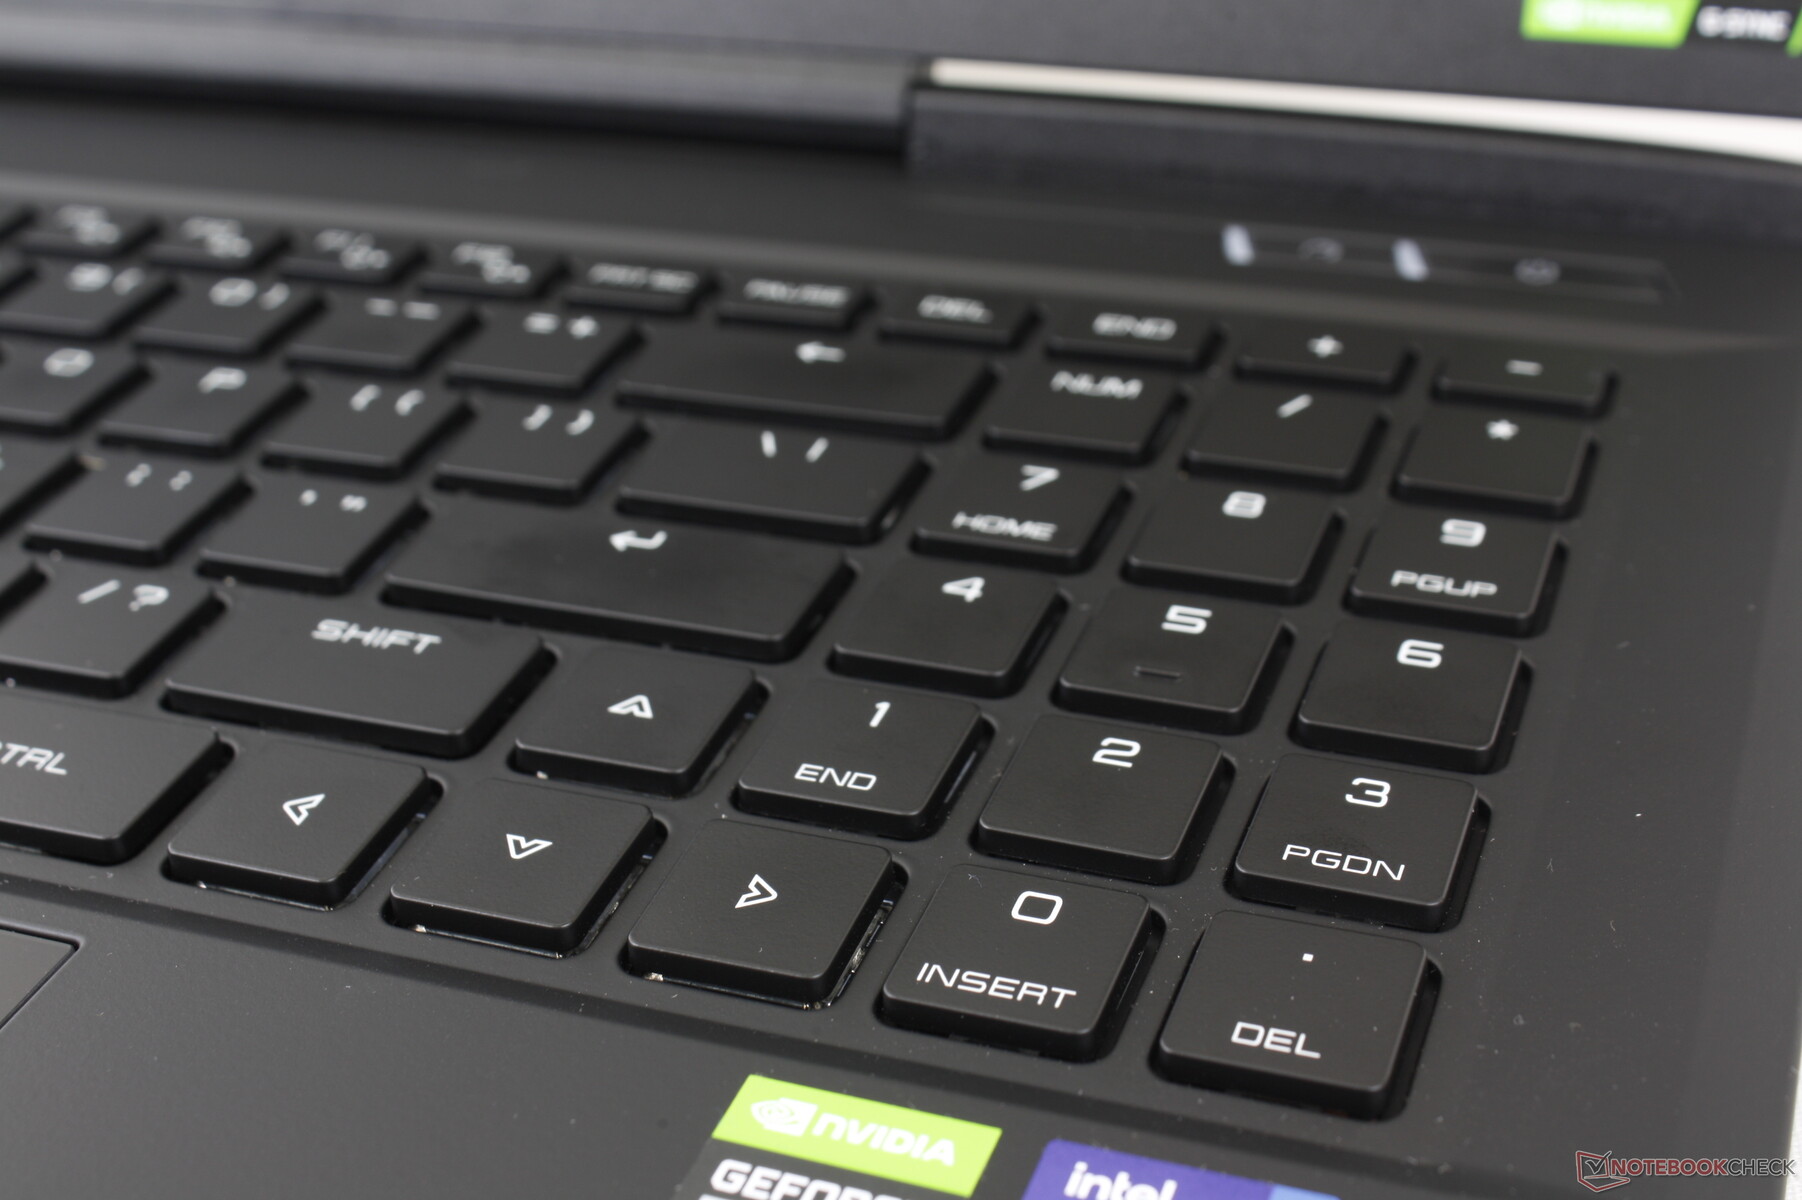
Inmatningsenheter - Högljudda och klickiga
Tangentbord
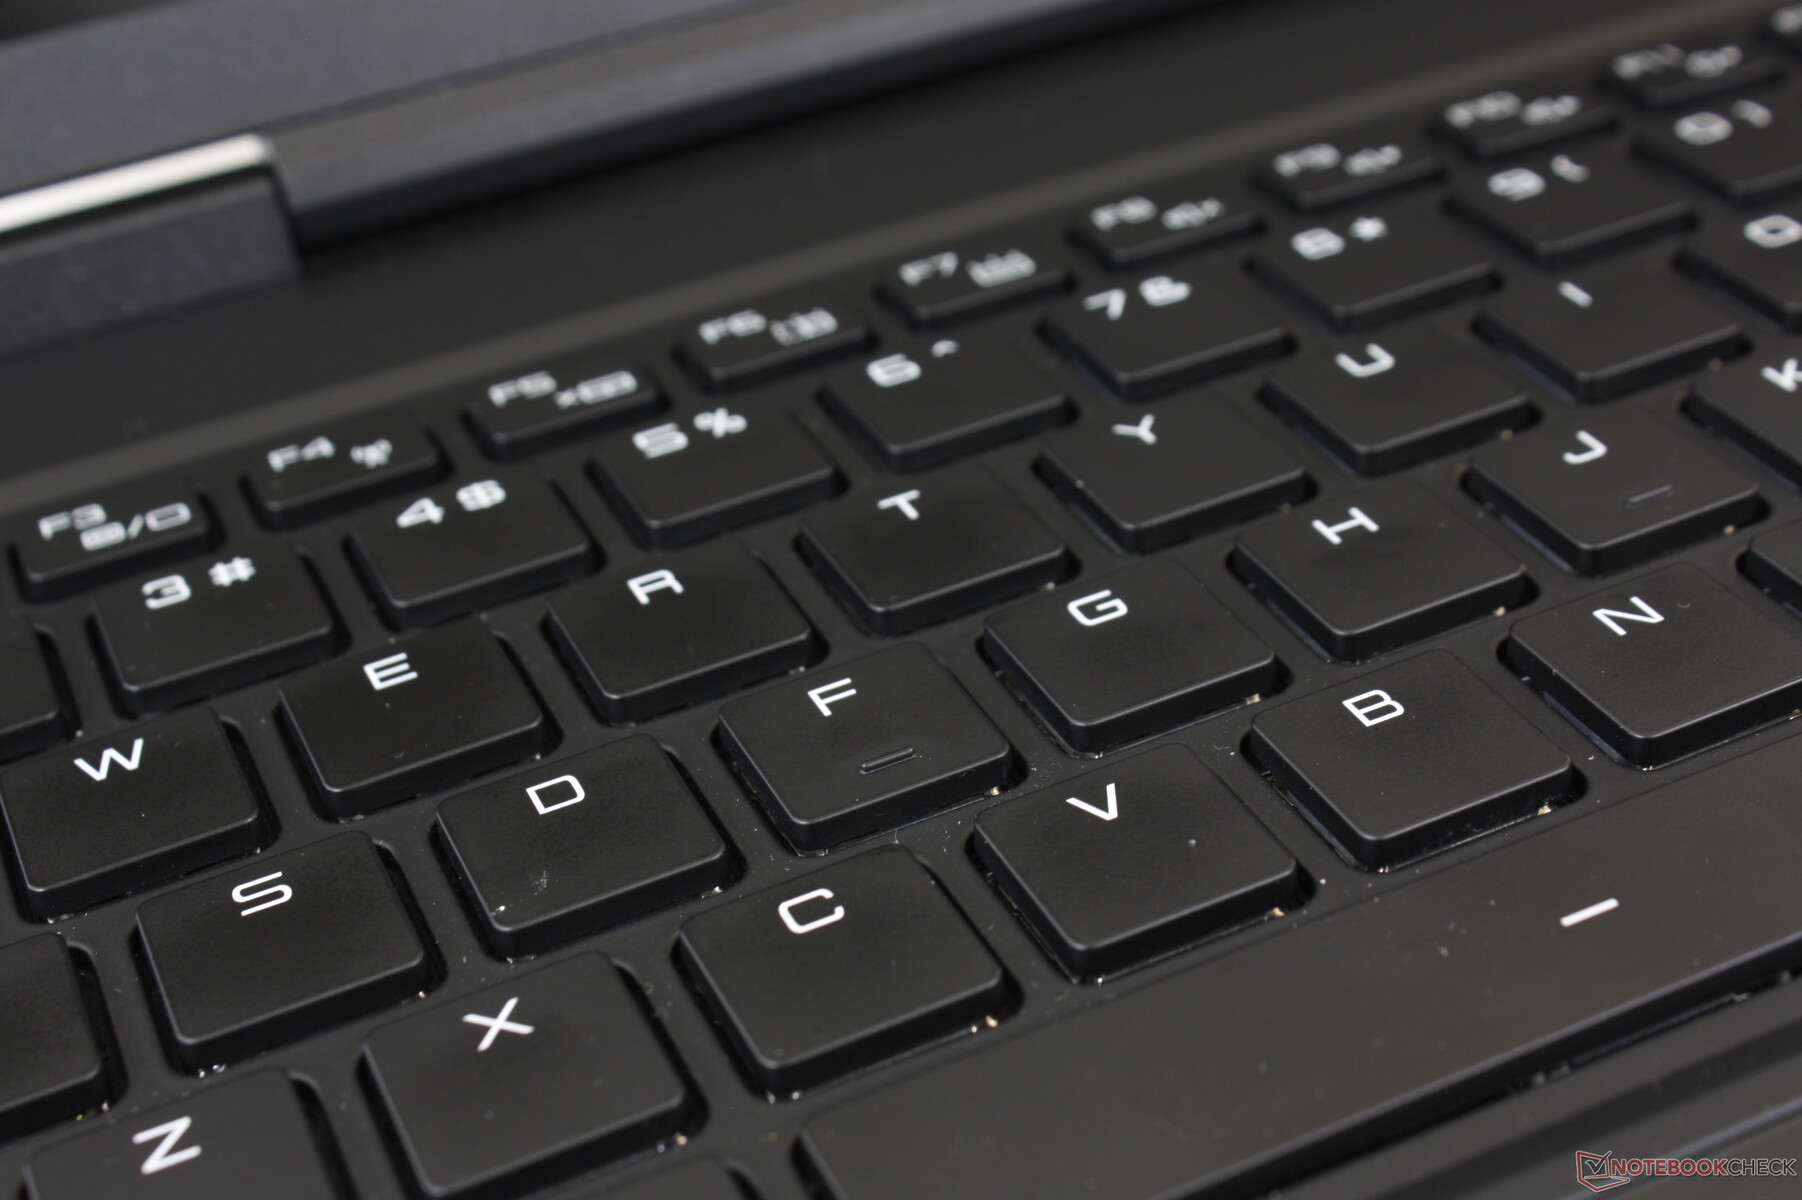
RGB-tangentbordet per tangent är annorlunda än påXMG Neo 15 E22 även om de två bärbara datorerna har samma portar. Cherry MX-tangenterna på vår Uniwell har märkbart djupare slaglängd, skarpare återkoppling och ett mycket högre skrammel än på de flesta andra bärbara datorer. Du bör undvika att använda den här bärbara datorn i klassrum, konferenser eller bibliotek på grund av det höga skramlet
En irriterande aspekt som vi noterade är att numpad-tangenterna är mjukare och tystare än de huvudsakliga QWERTY-tangenterna och att återkopplingen därför inte är jämn över alla tangenter. Det känns besvärligt att skriva mellan ord och siffror eftersom återkopplingen är så olika mellan tangenterna.
Pekplatta
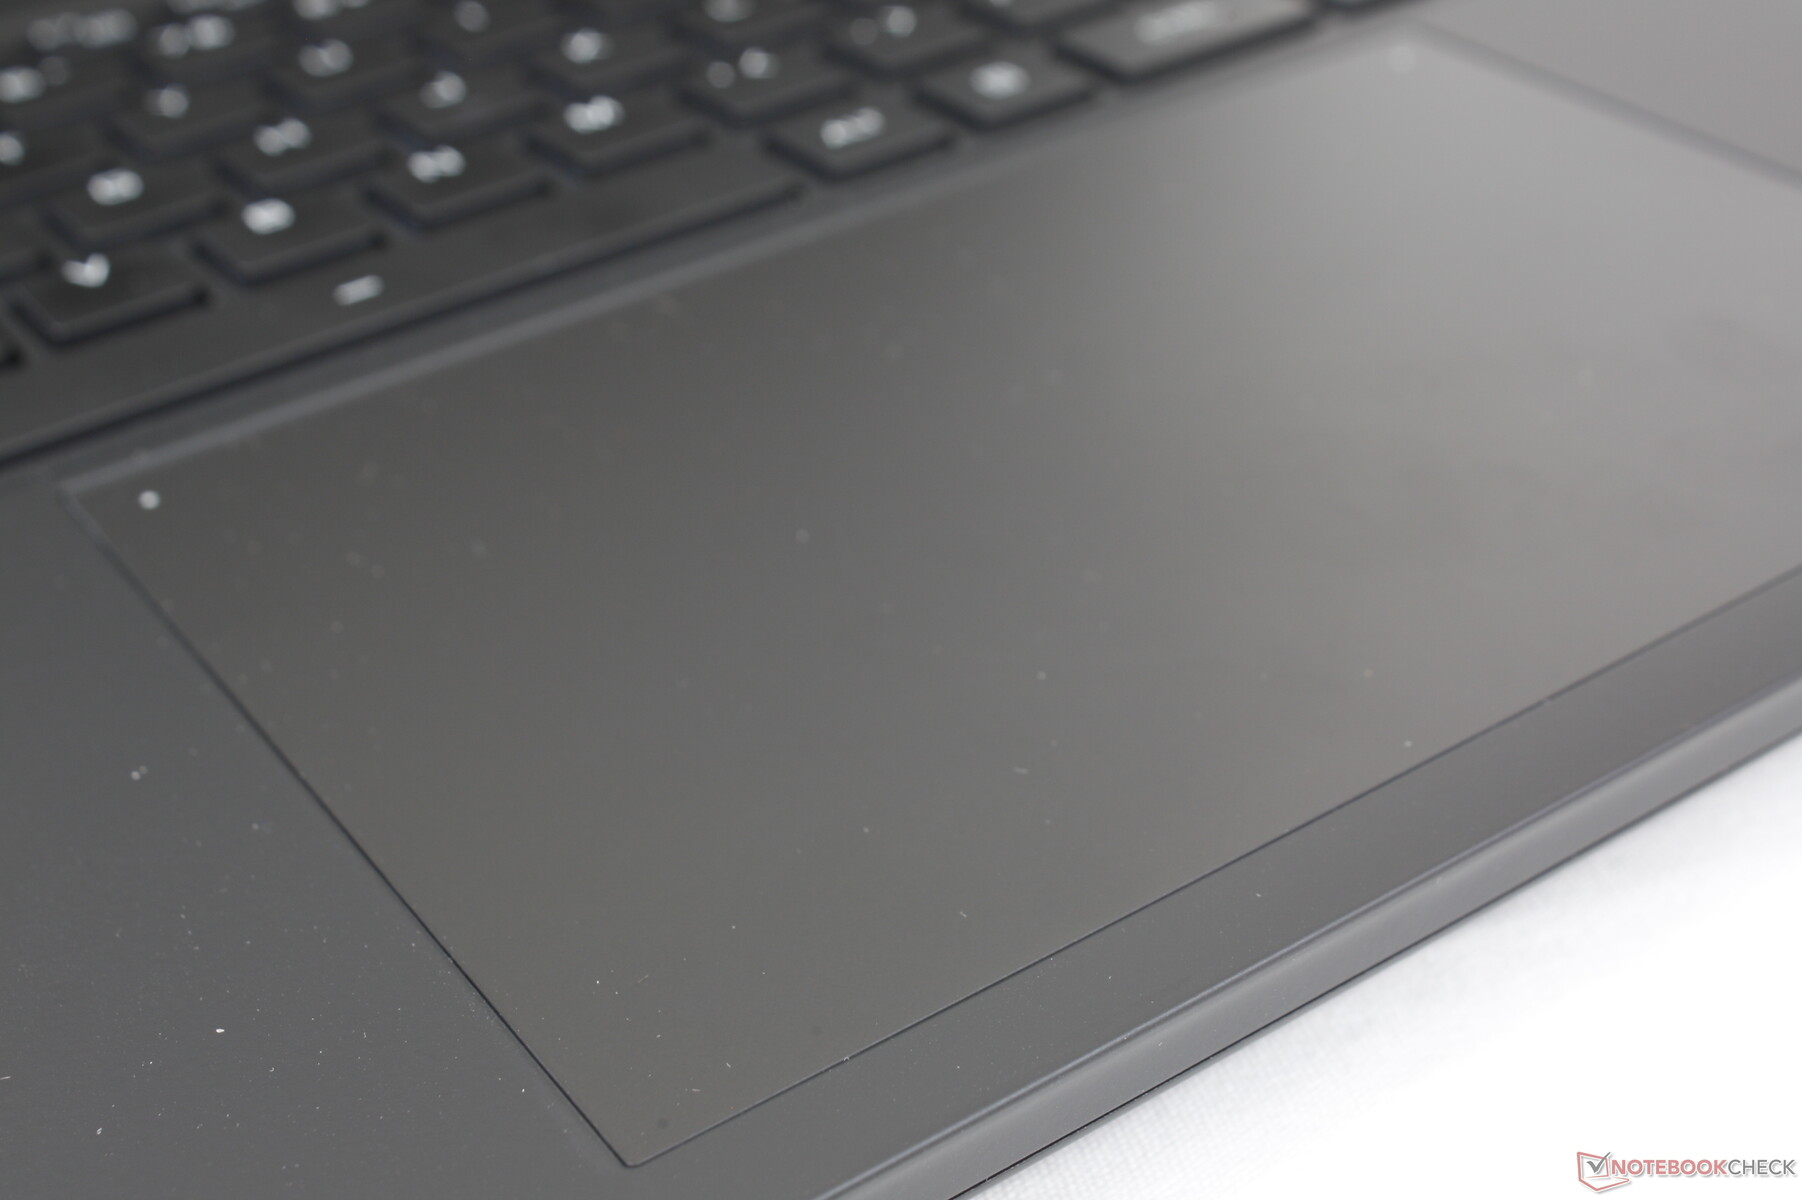
Den överdimensionerade klickplattan är ännu större än den redan stora klickplattan på MSI GS77 (15,5 x 10 cm jämfört med 13,2 x 8,2 cm). Dess yta är lätt gummerad för ett mycket smidigt glid vid medelhöga till höga hastigheter med endast lite kladd vid lägre hastigheter.
Återkopplingen när du klickar på klickplattan är fastare än på den stora XPS 17 klickplattan för en mer tillfredsställande känsla. Den är dock definitivt högre, men vi förväntar oss inte att detta ska vara ett stort problem eftersom de mekaniska tangenterna redan är ganska högljudda ändå.
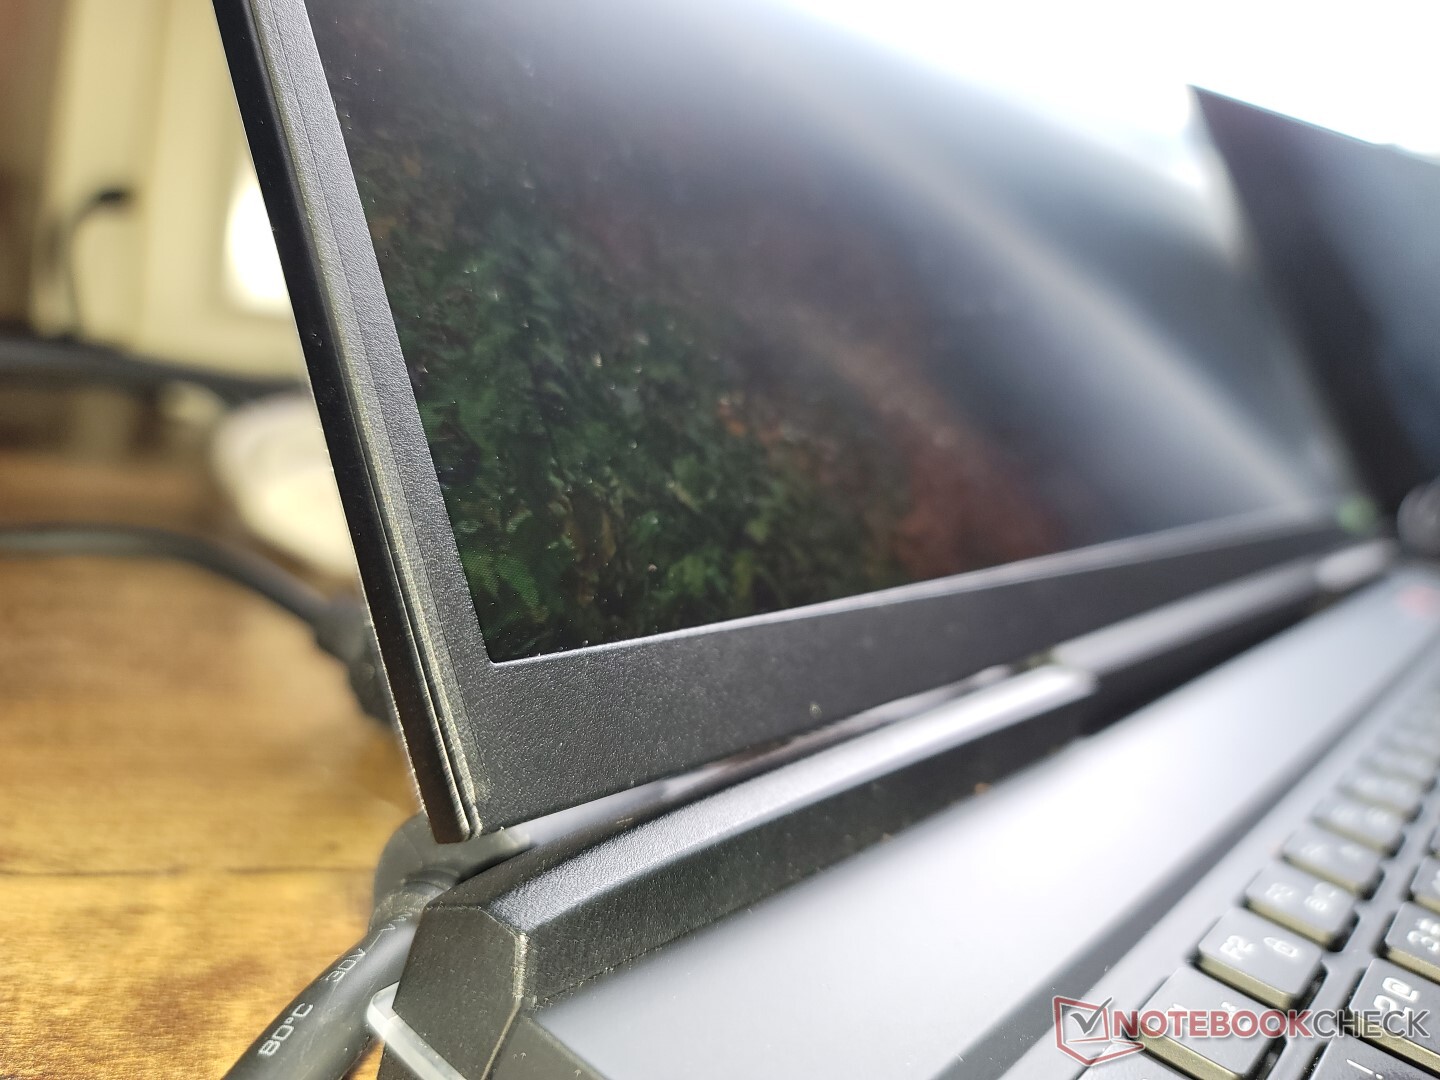
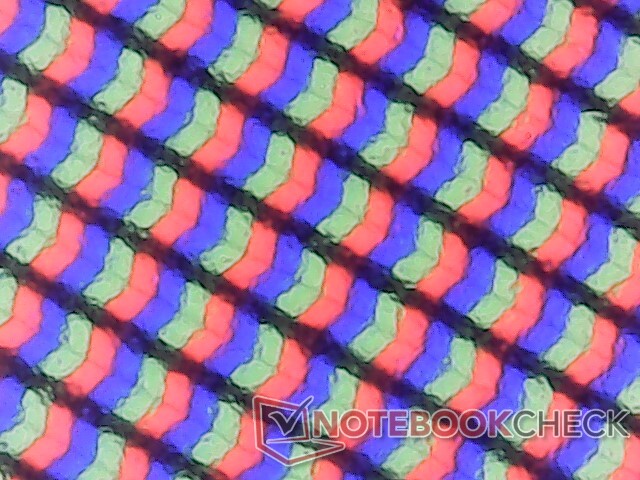
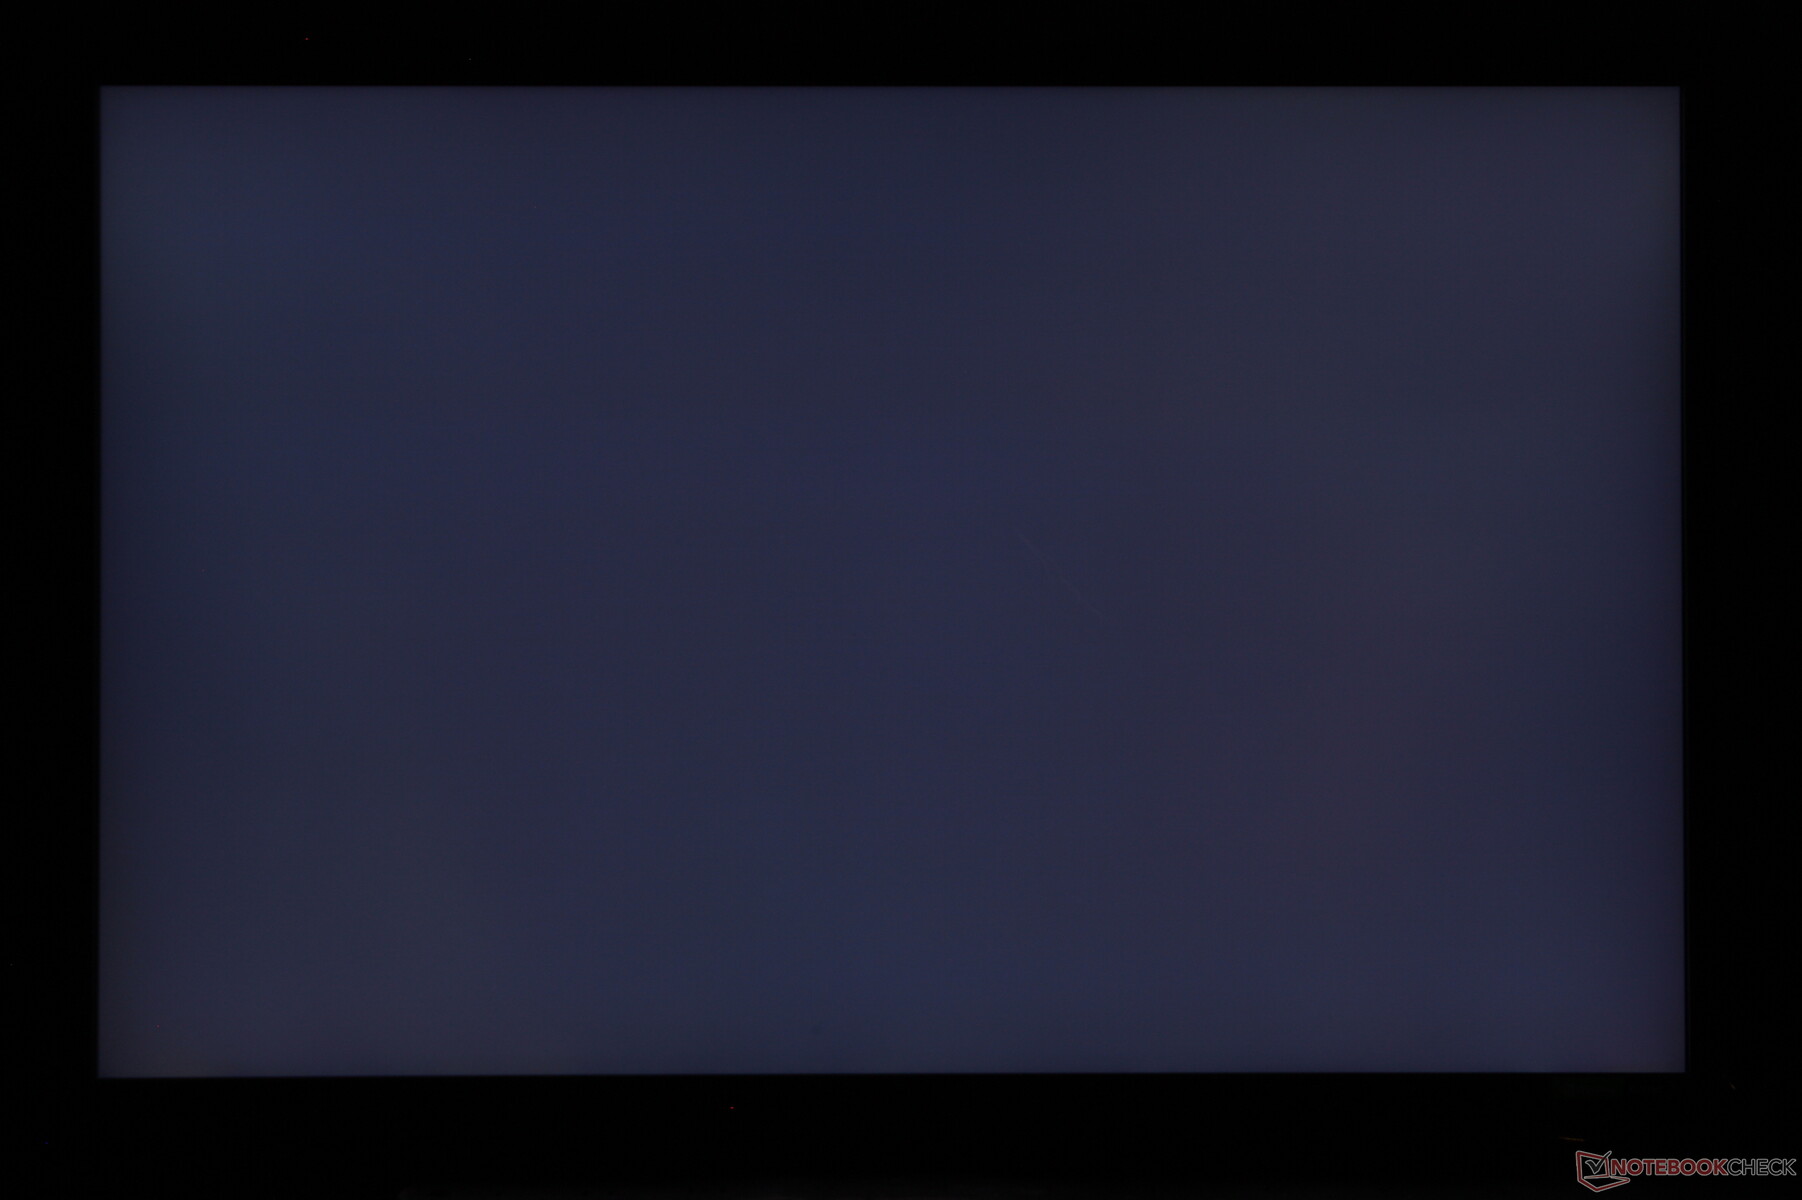
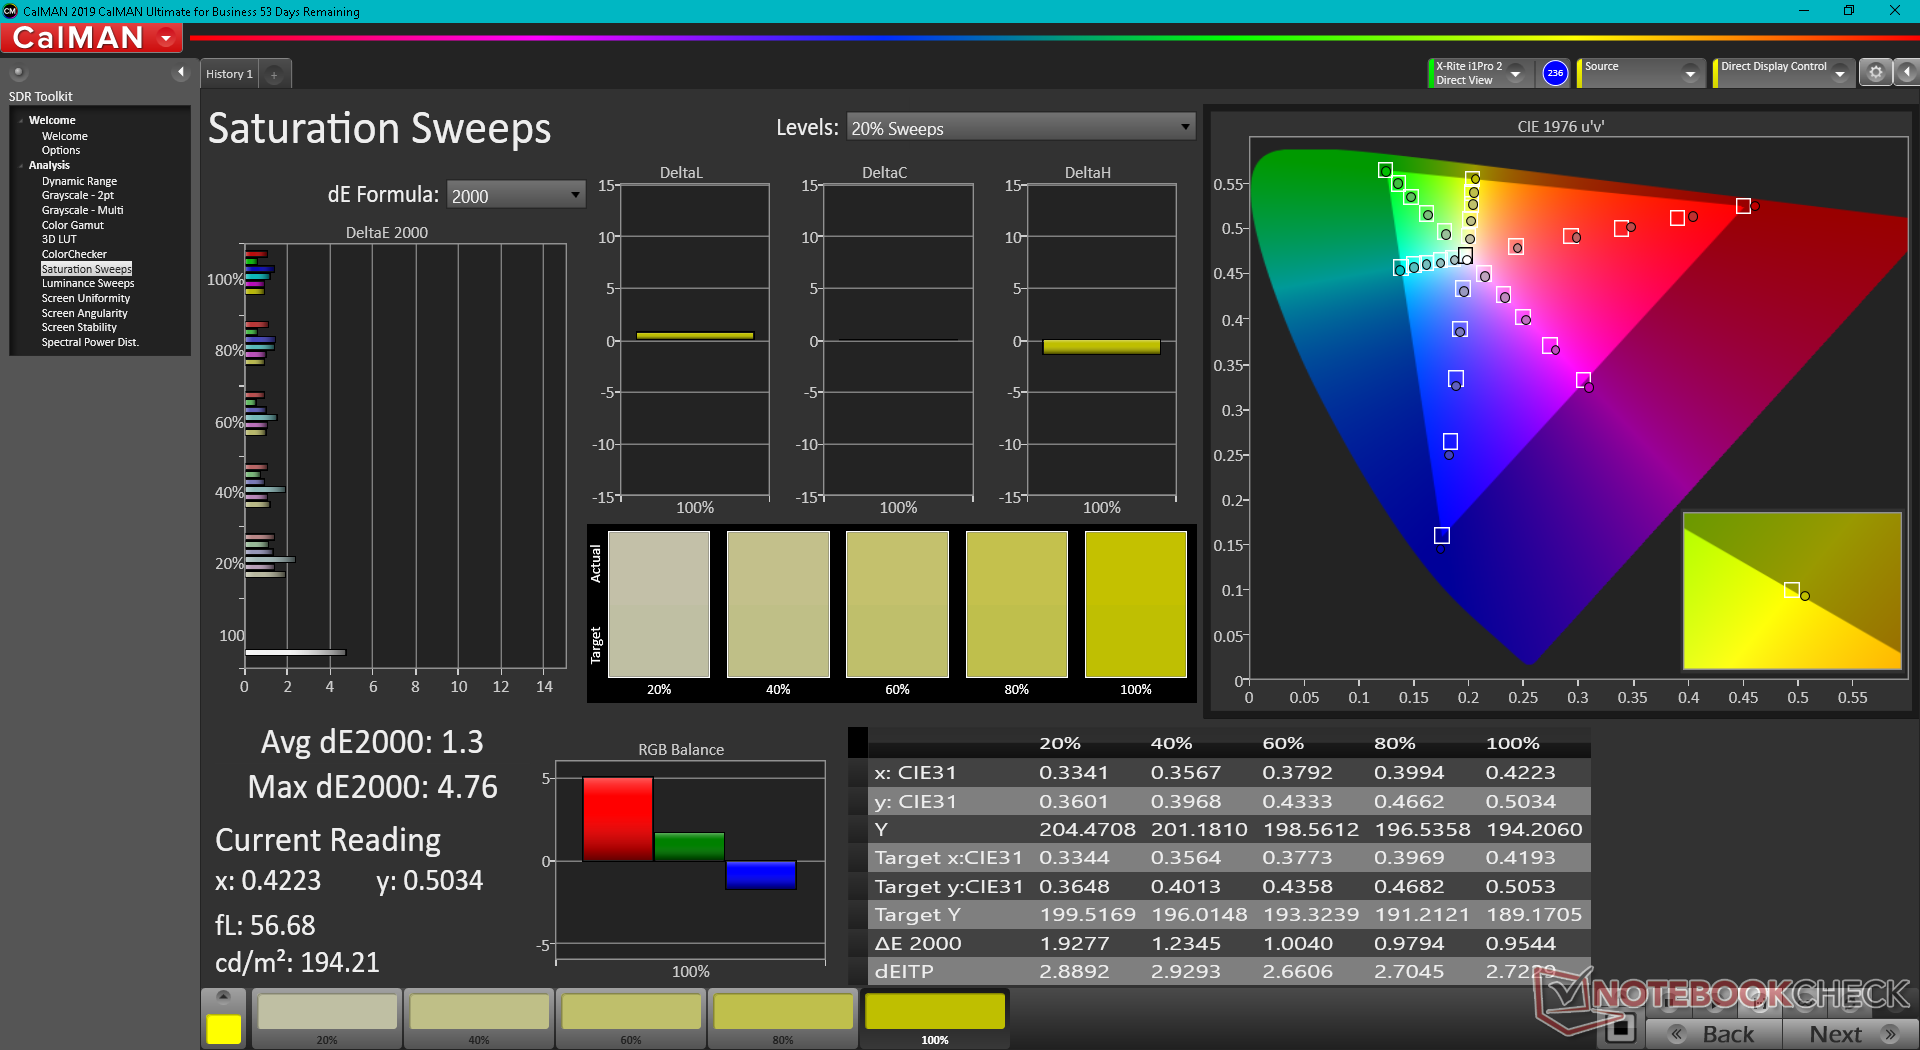
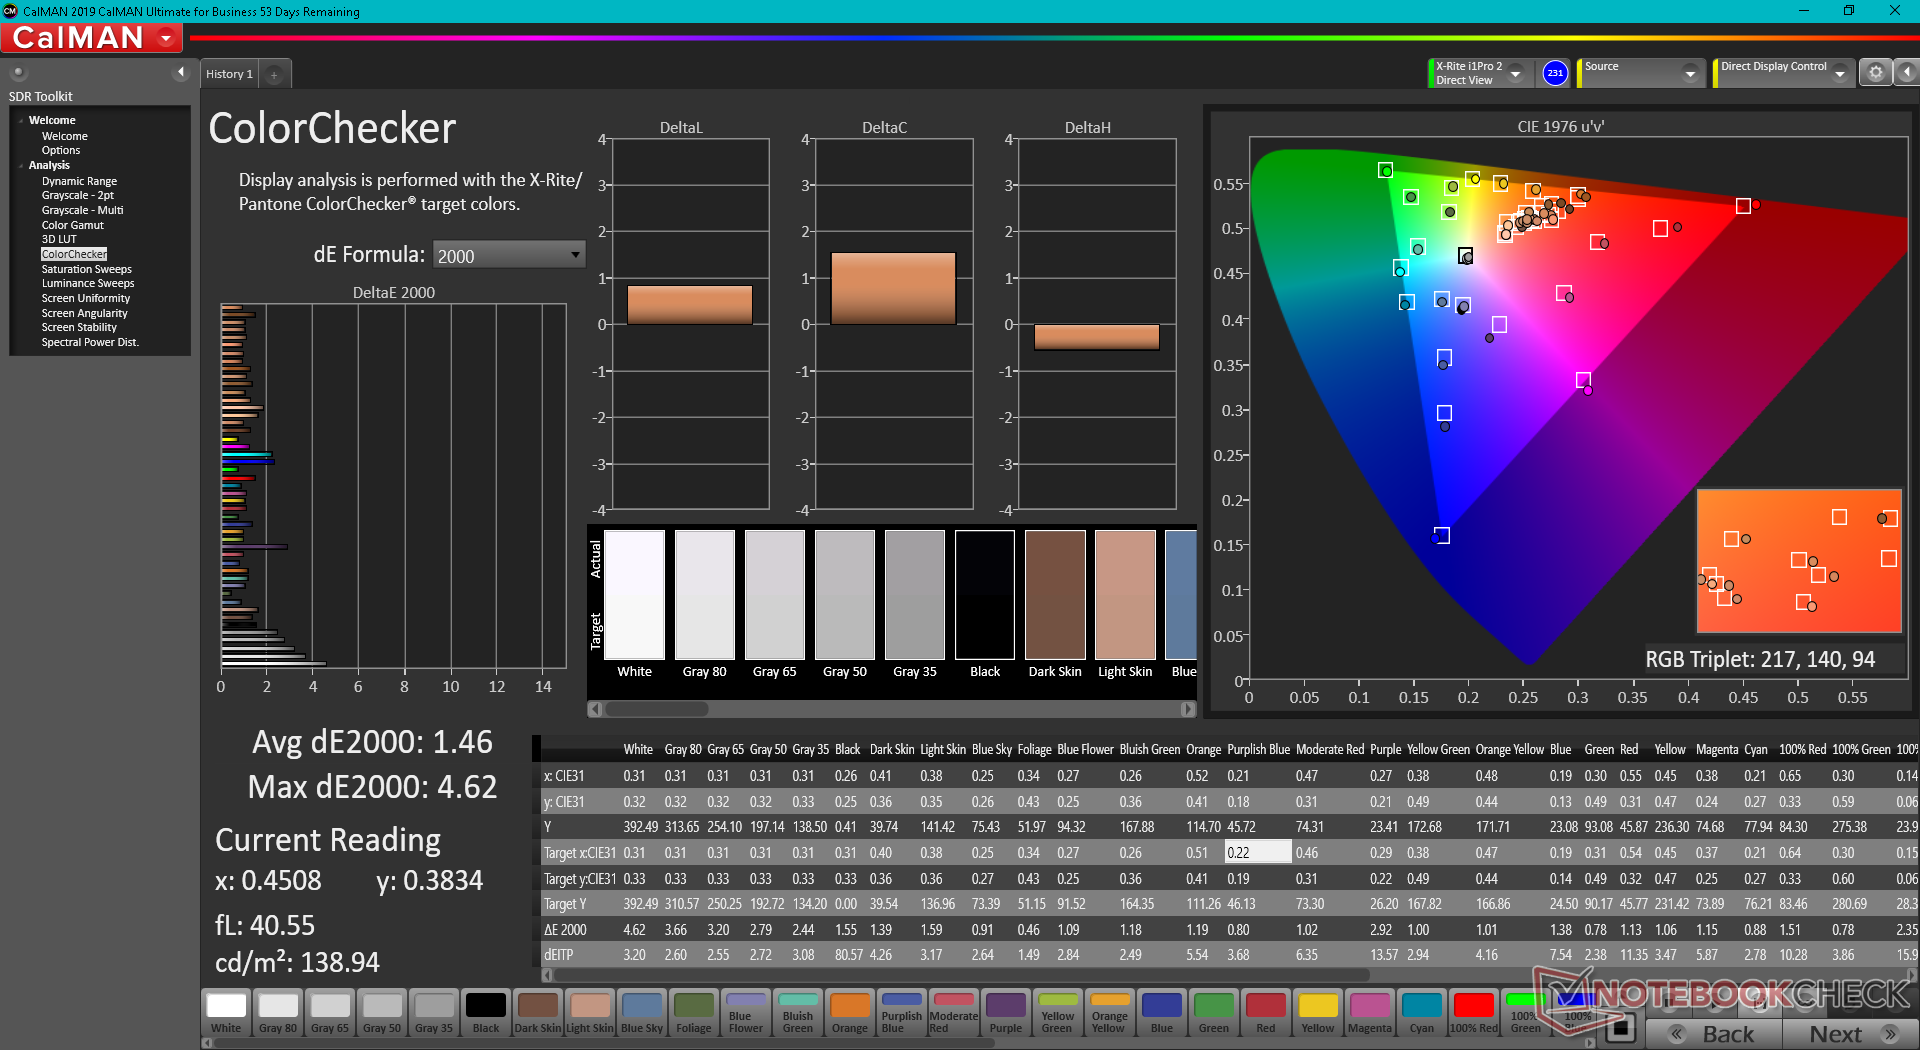
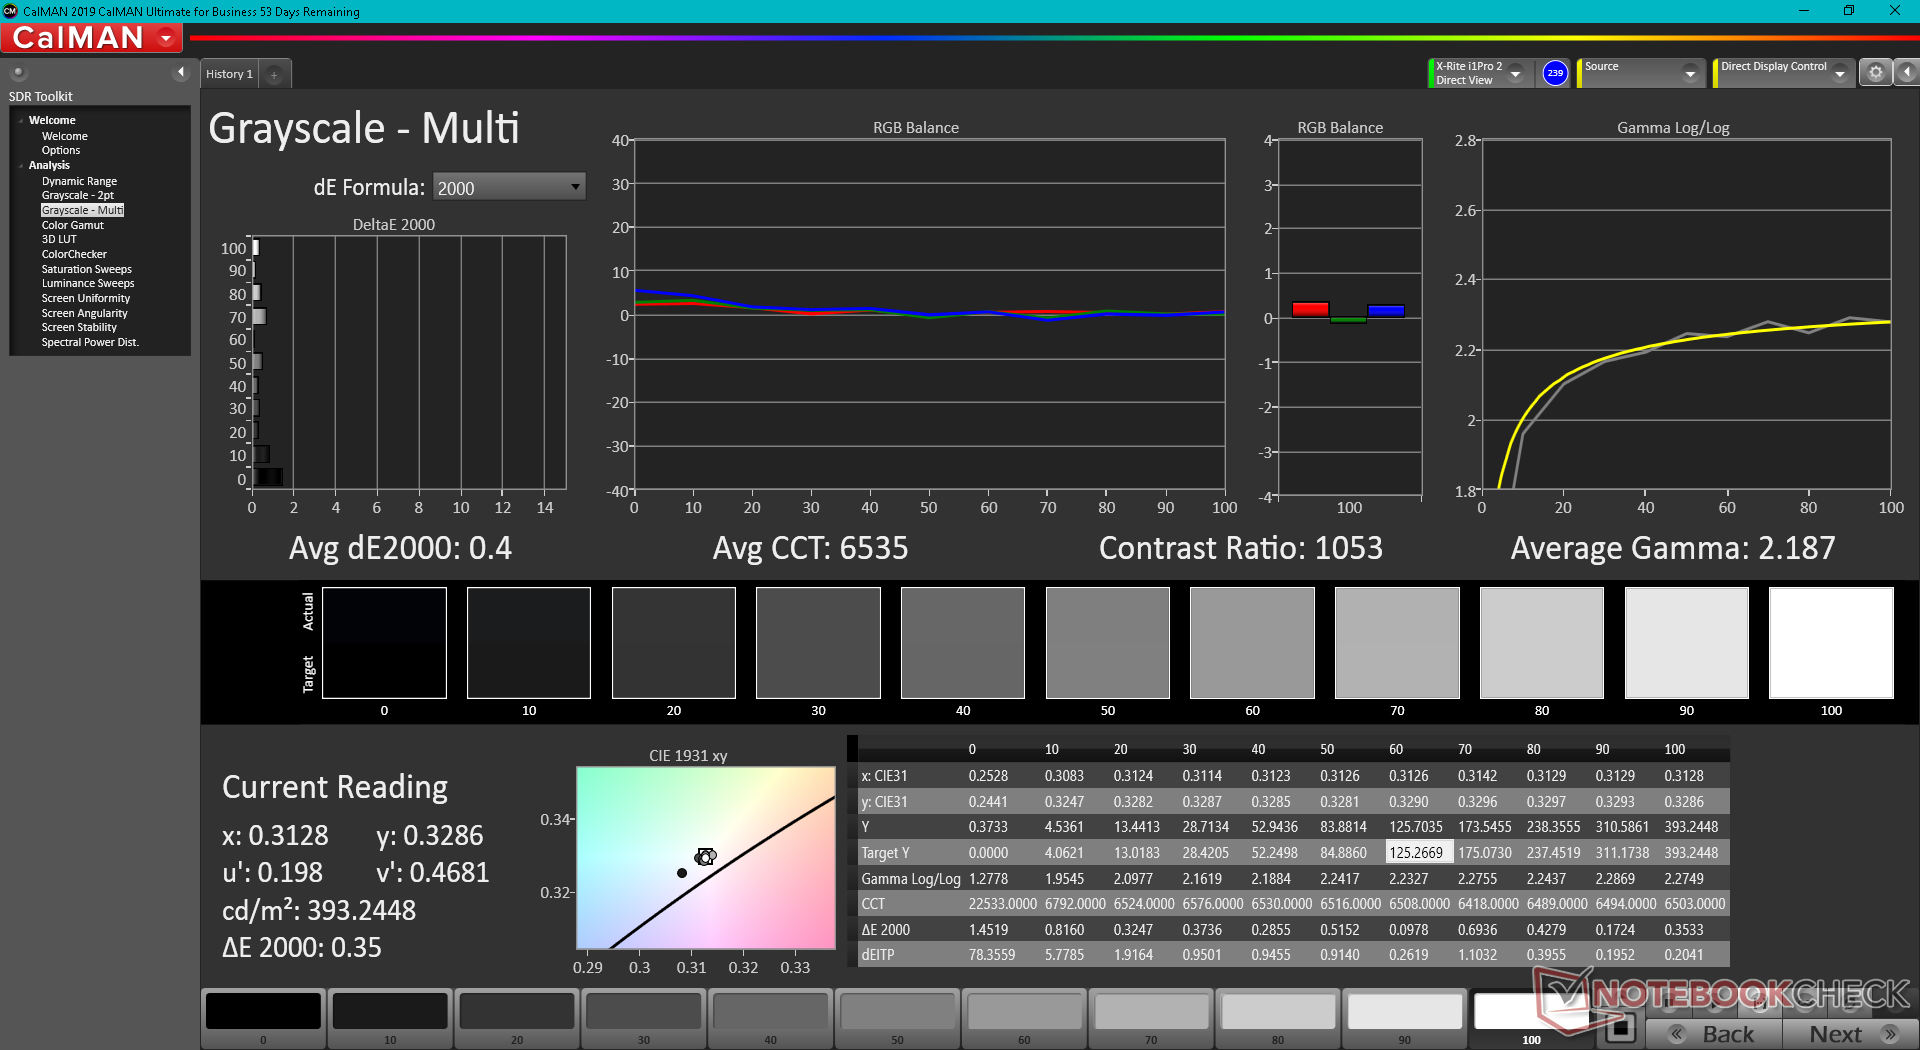
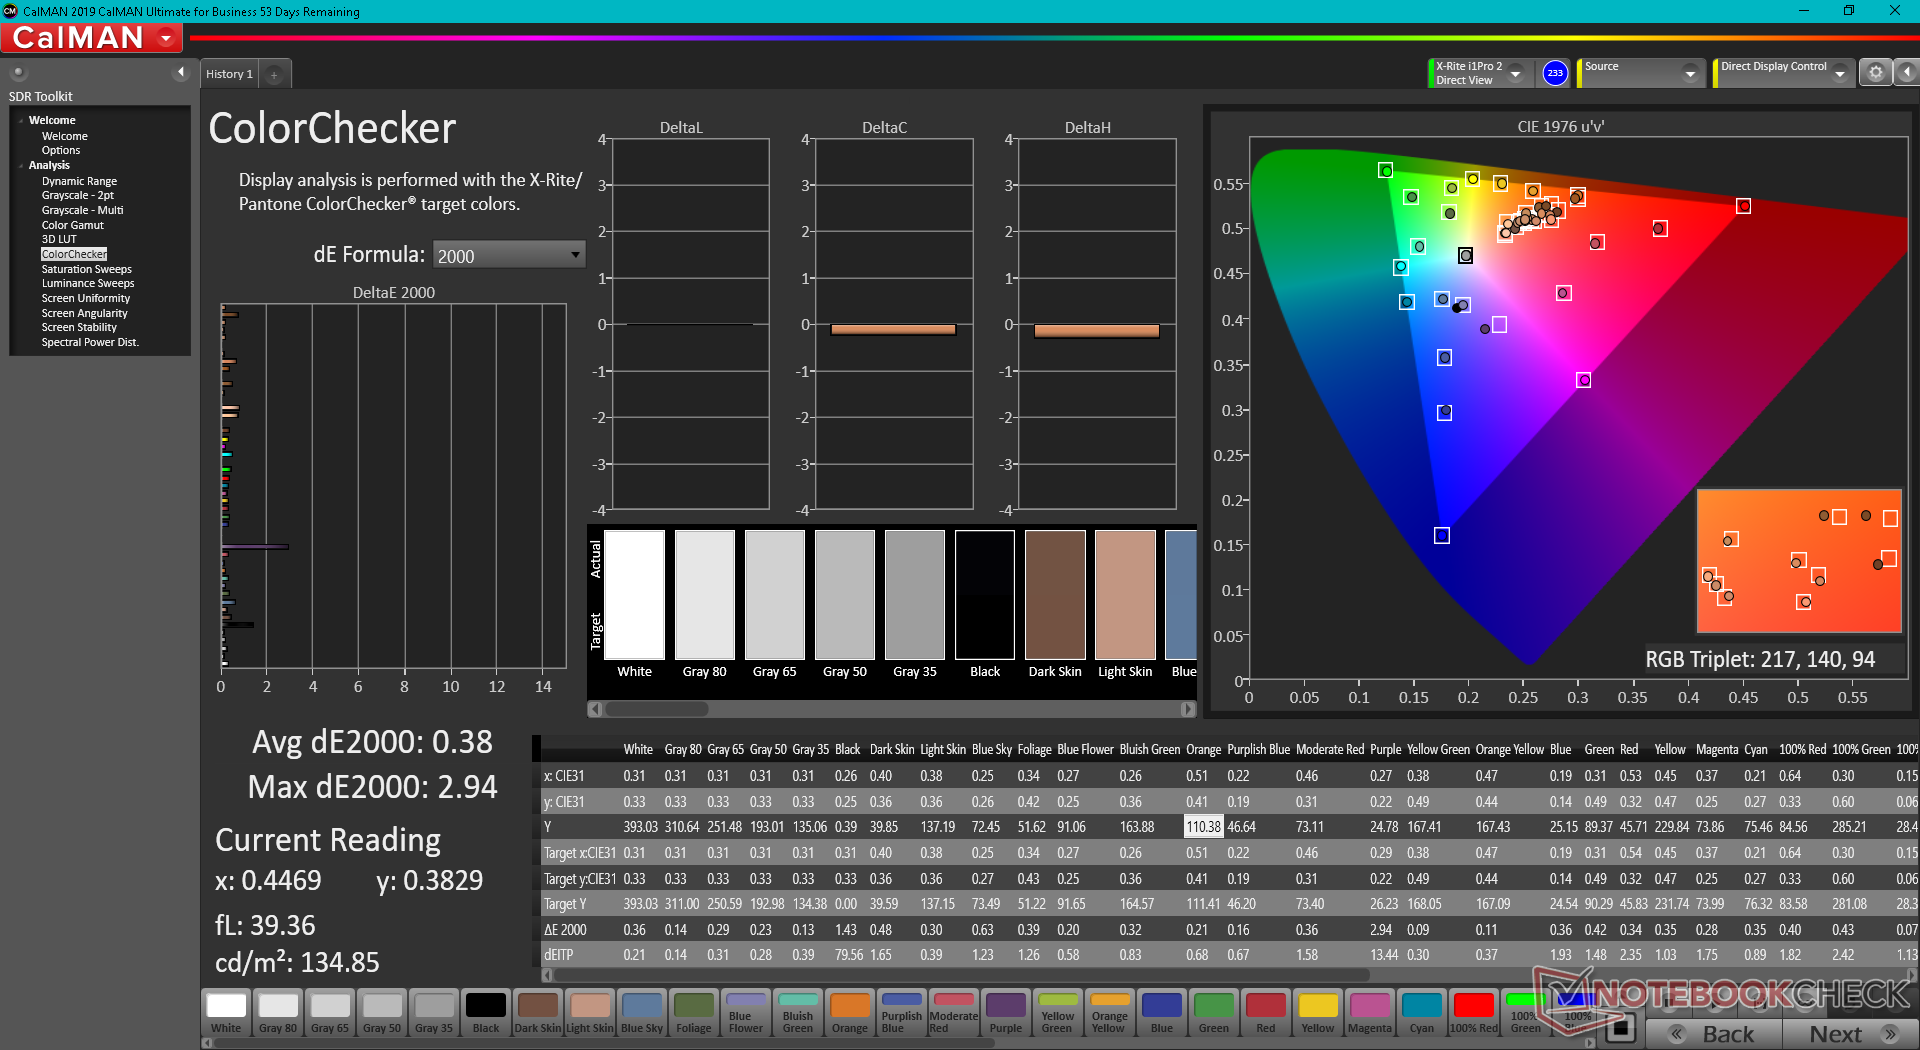
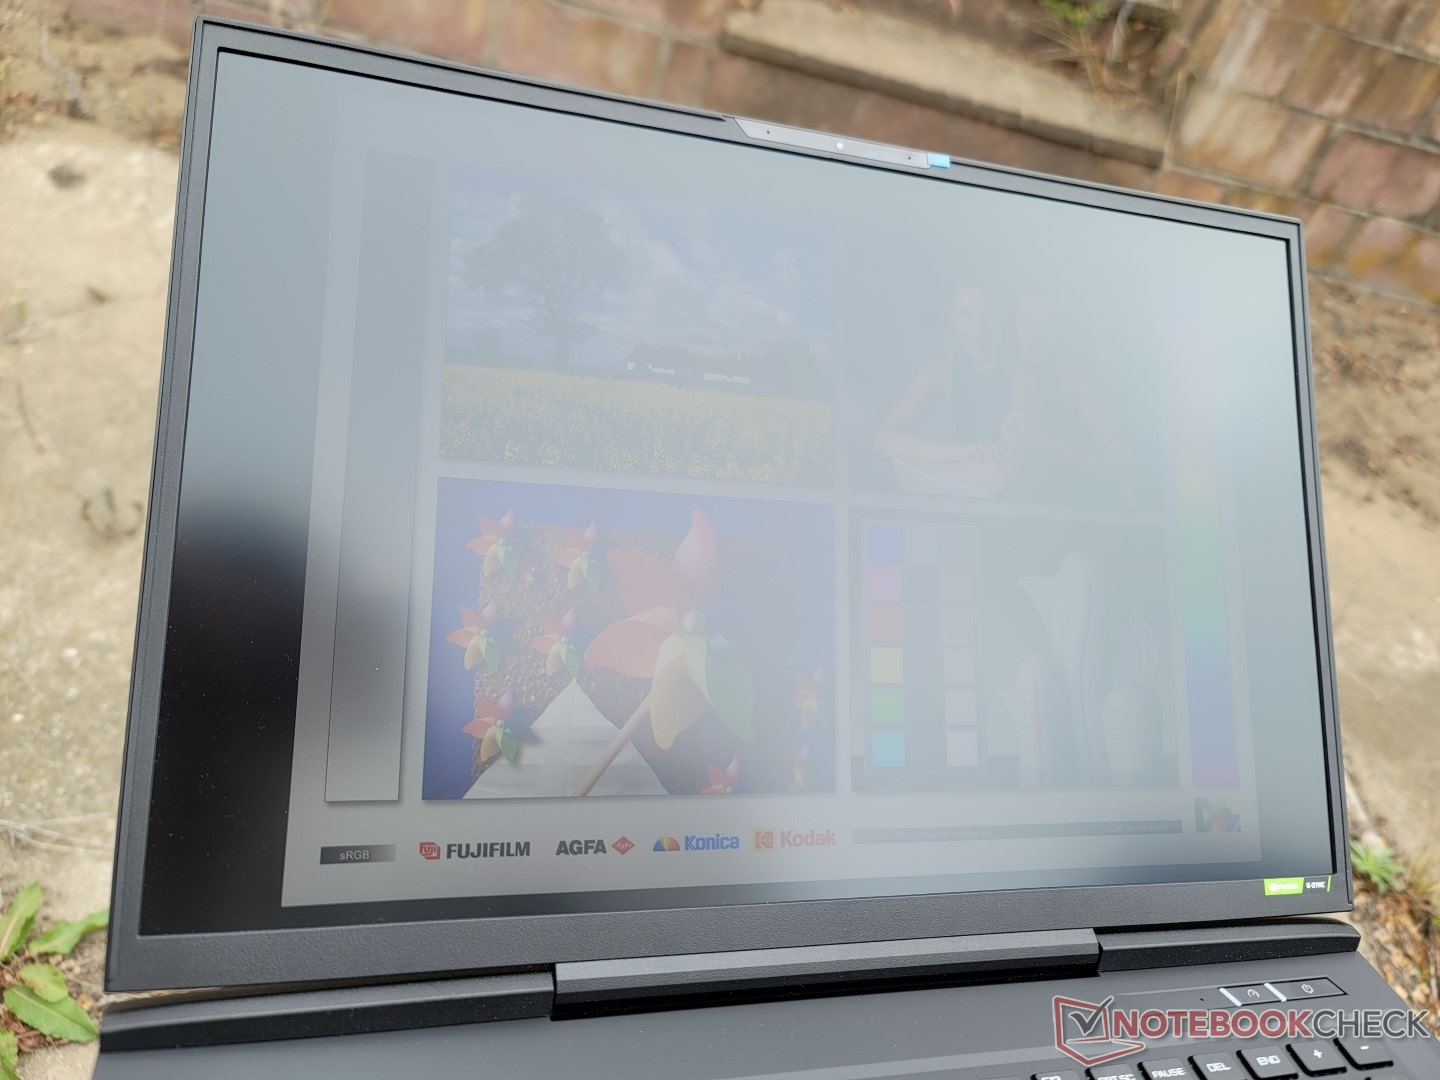
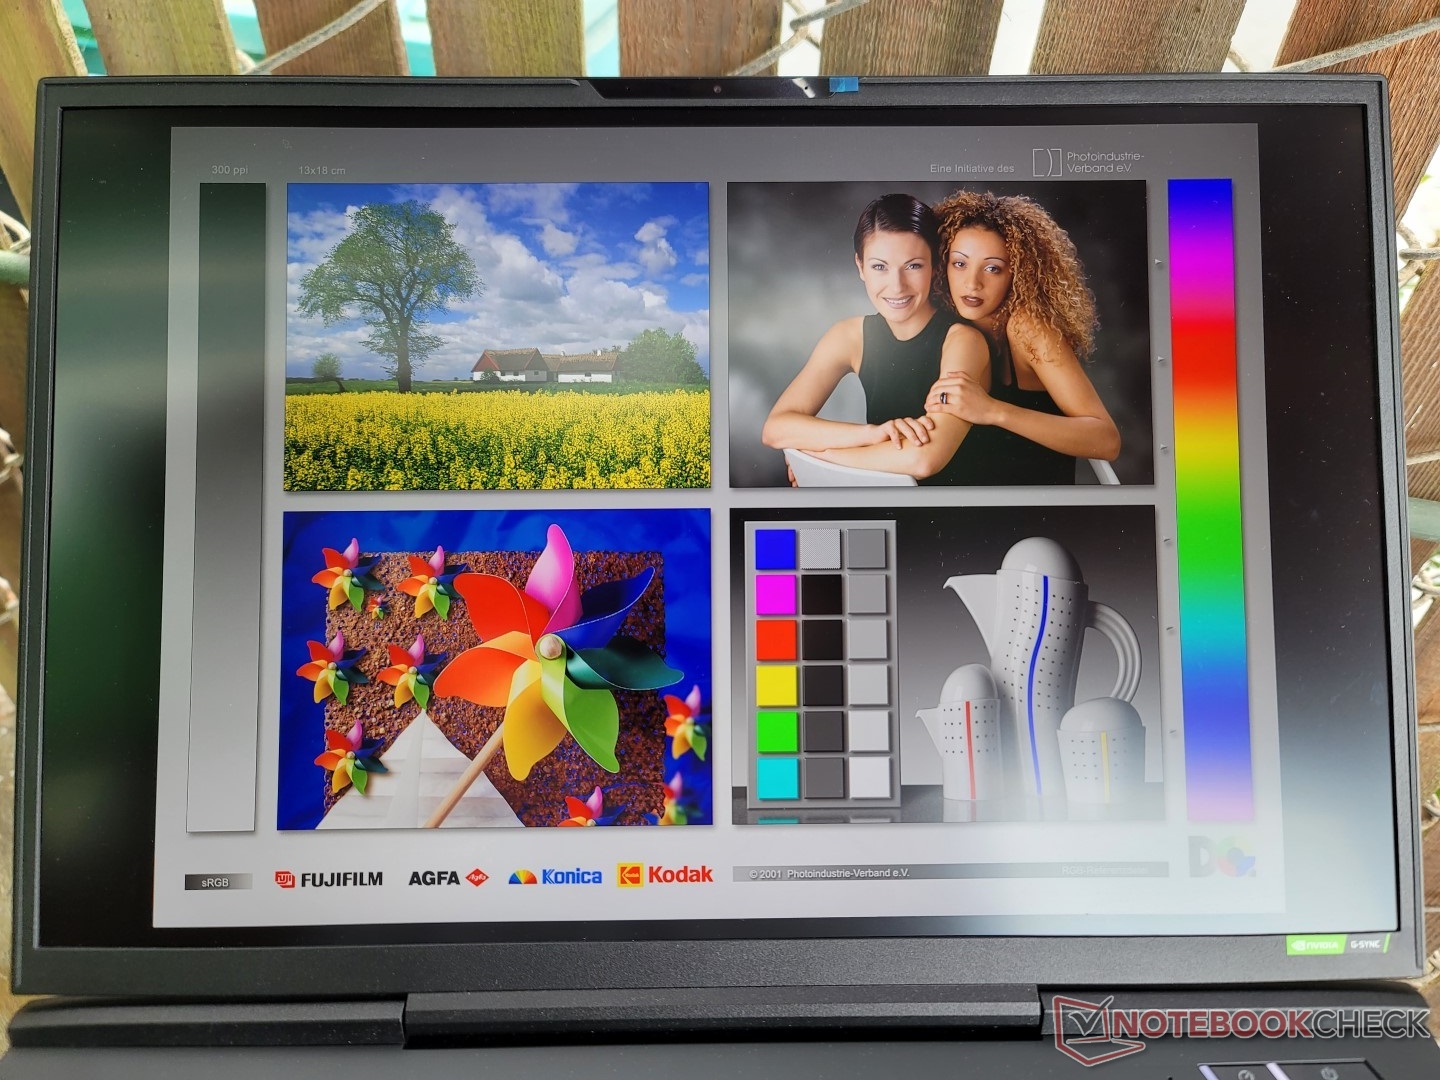
Skärm - Optimerad för 1440p-spel
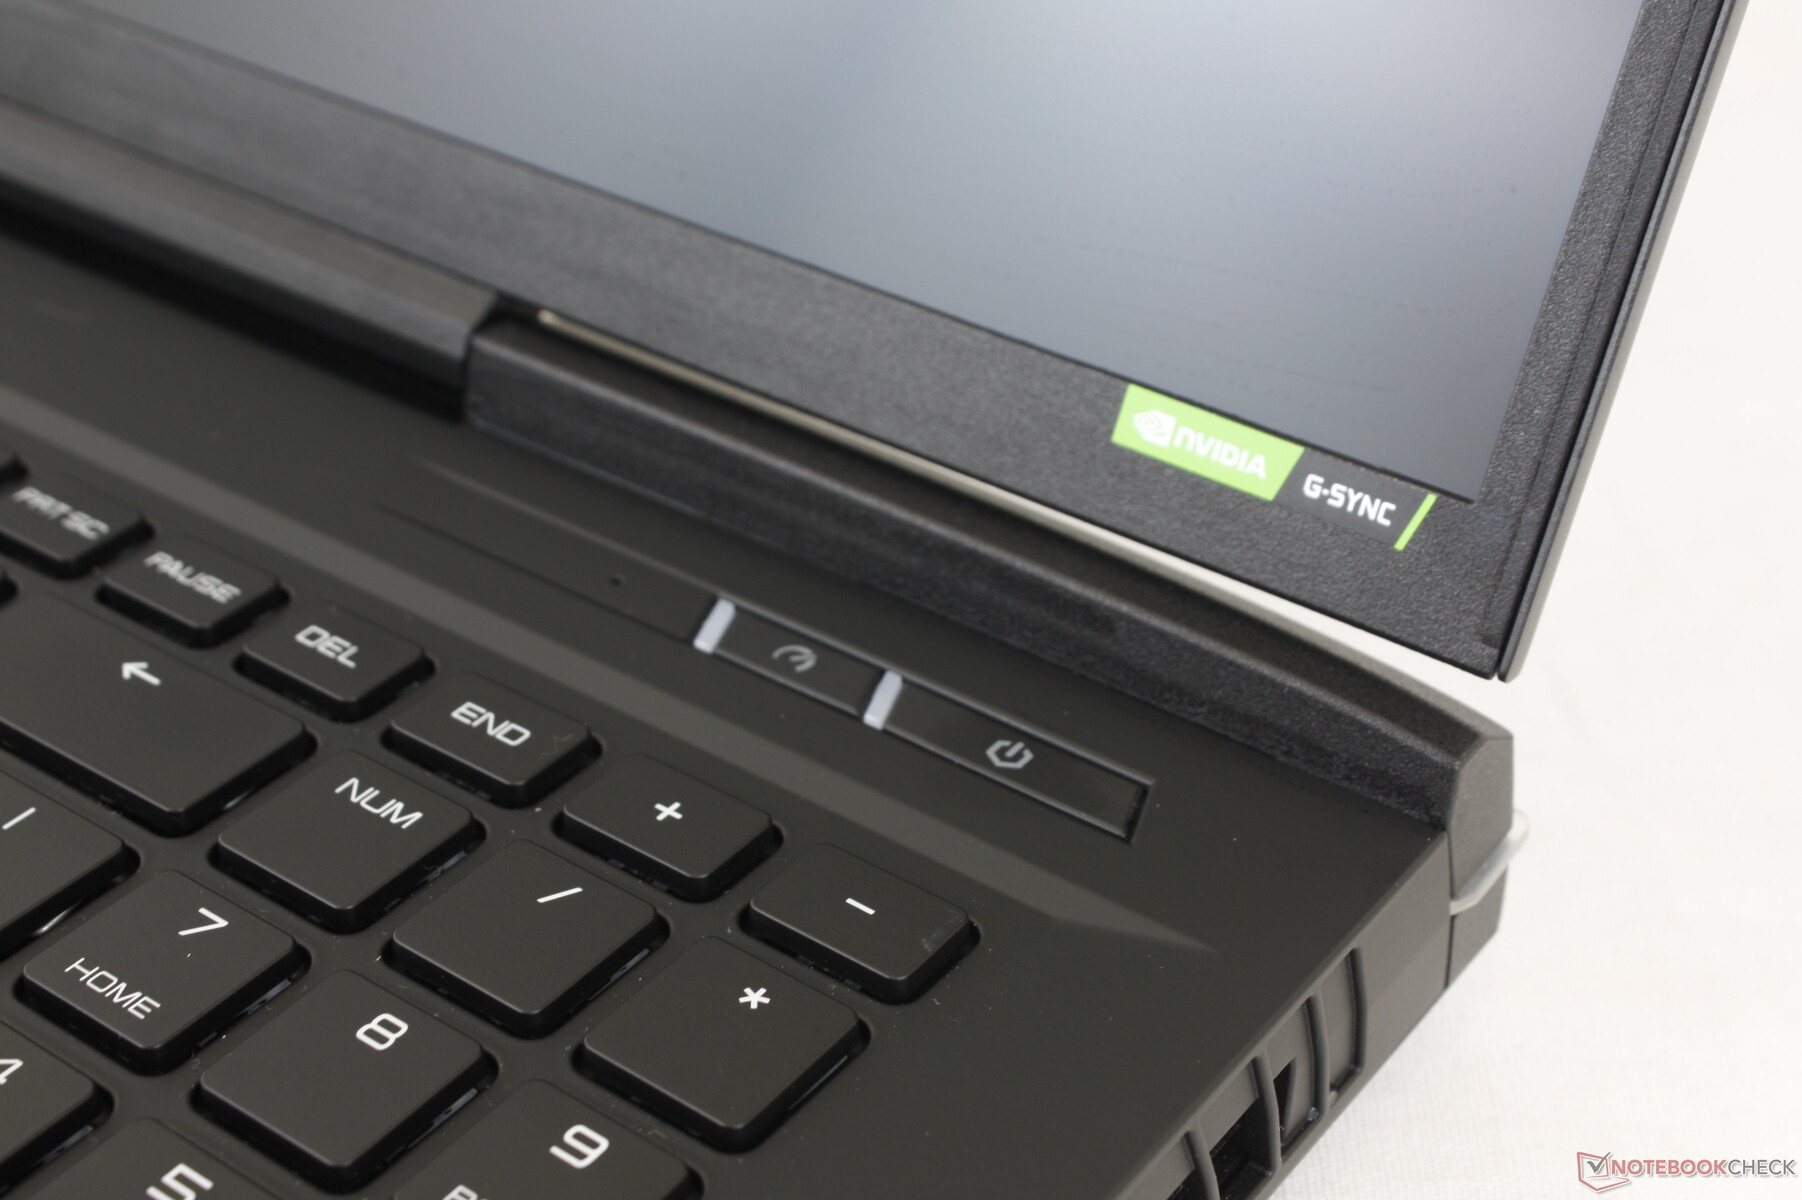
BOE NE170QDM-NZ1-panelen på vår Uniwell-typenhet är den första som finns i vår databas. Den här G-Sync-kompatibla IPS-panelen erbjuder full sRGB-täckning, snabba svarstider, bra kontrast, en snabb uppdateringsfrekvens på 240 Hz och en relativt ljusstark bakgrundsbelysning på 400 nit för att vara lämplig för en entusiastspelmaskin. De flesta andra bärbara datorer för spel, som t.ex Razer Blade 17 har ytterligare panelalternativ som 4K eller OLED som båda inte är tillgängliga på Uniwell.
| |||||||||||||||||||||||||
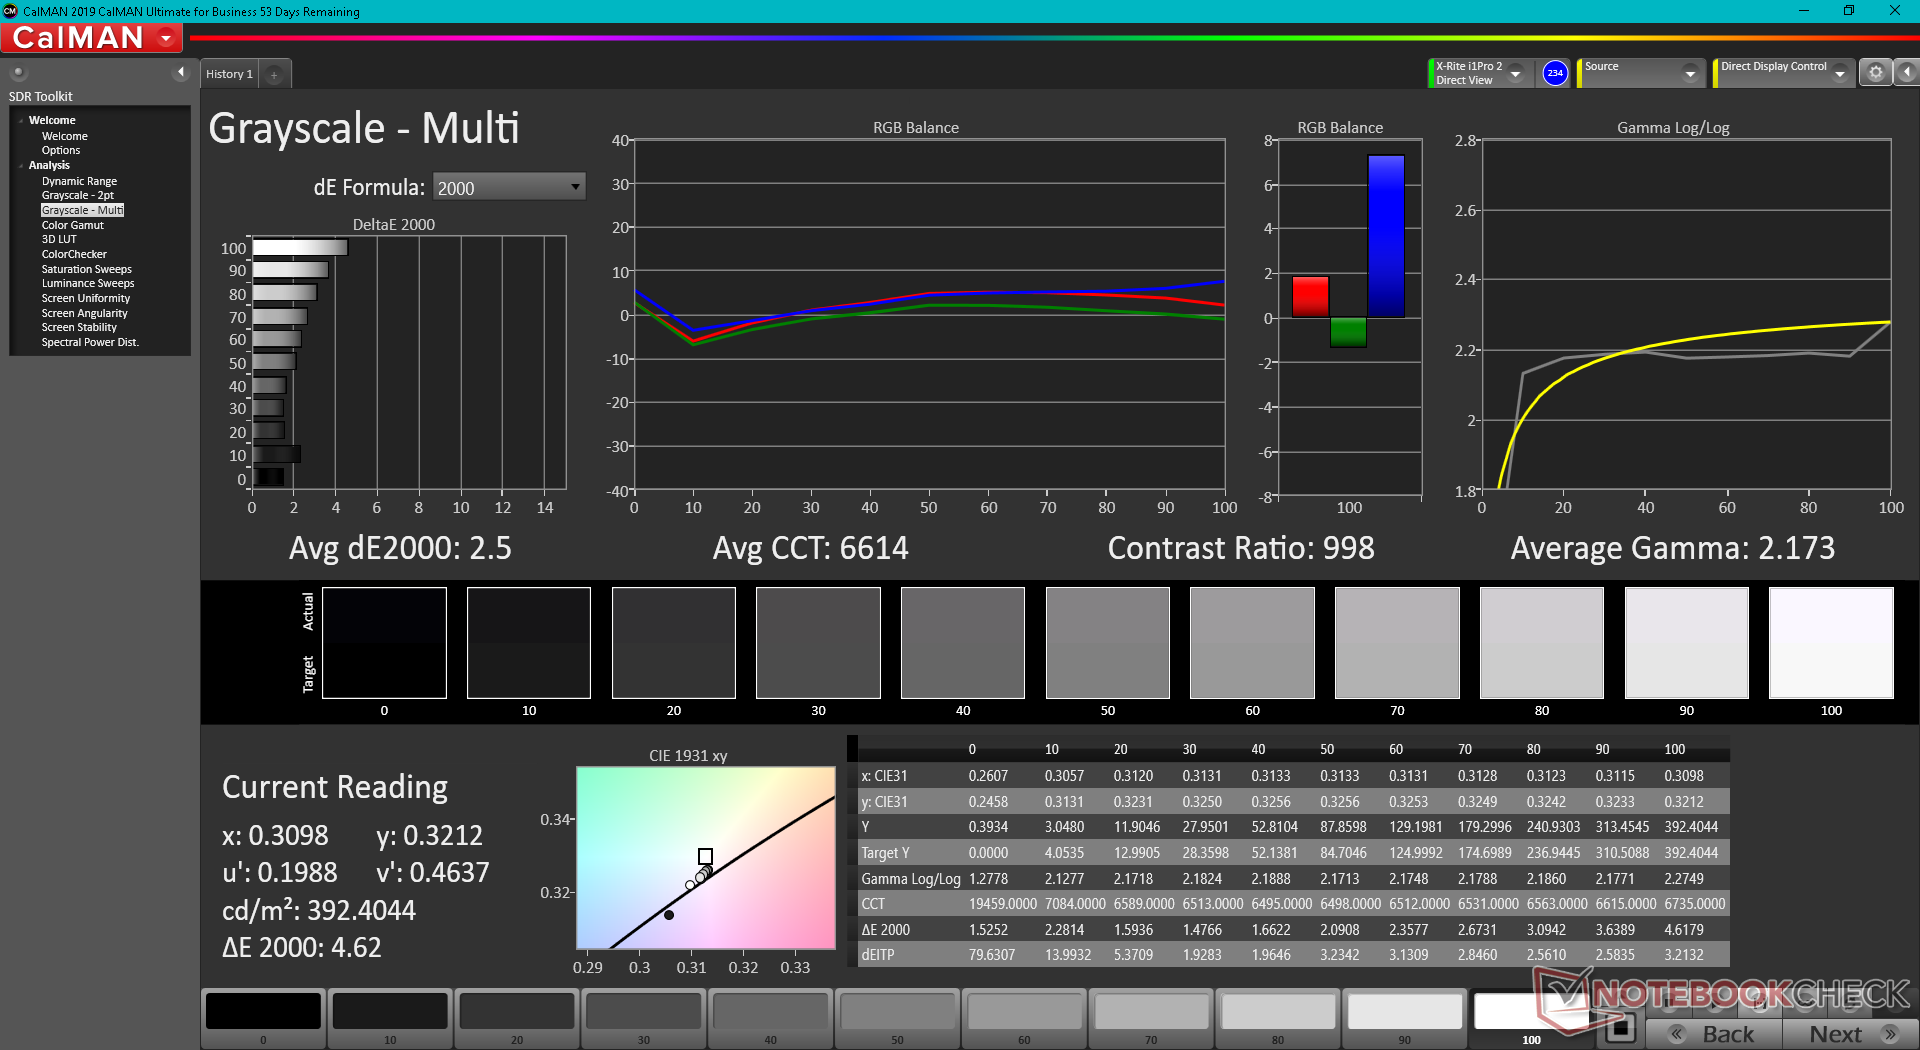
Distribution av ljusstyrkan: 91 %
Mitt på batteriet: 392.5 cd/m²
Kontrast: 872:1 (Svärta: 0.45 cd/m²)
ΔE ColorChecker Calman: 1.46 | ∀{0.5-29.43 Ø4.71}
calibrated: 0.38
ΔE Greyscale Calman: 2.5 | ∀{0.09-98 Ø4.96}
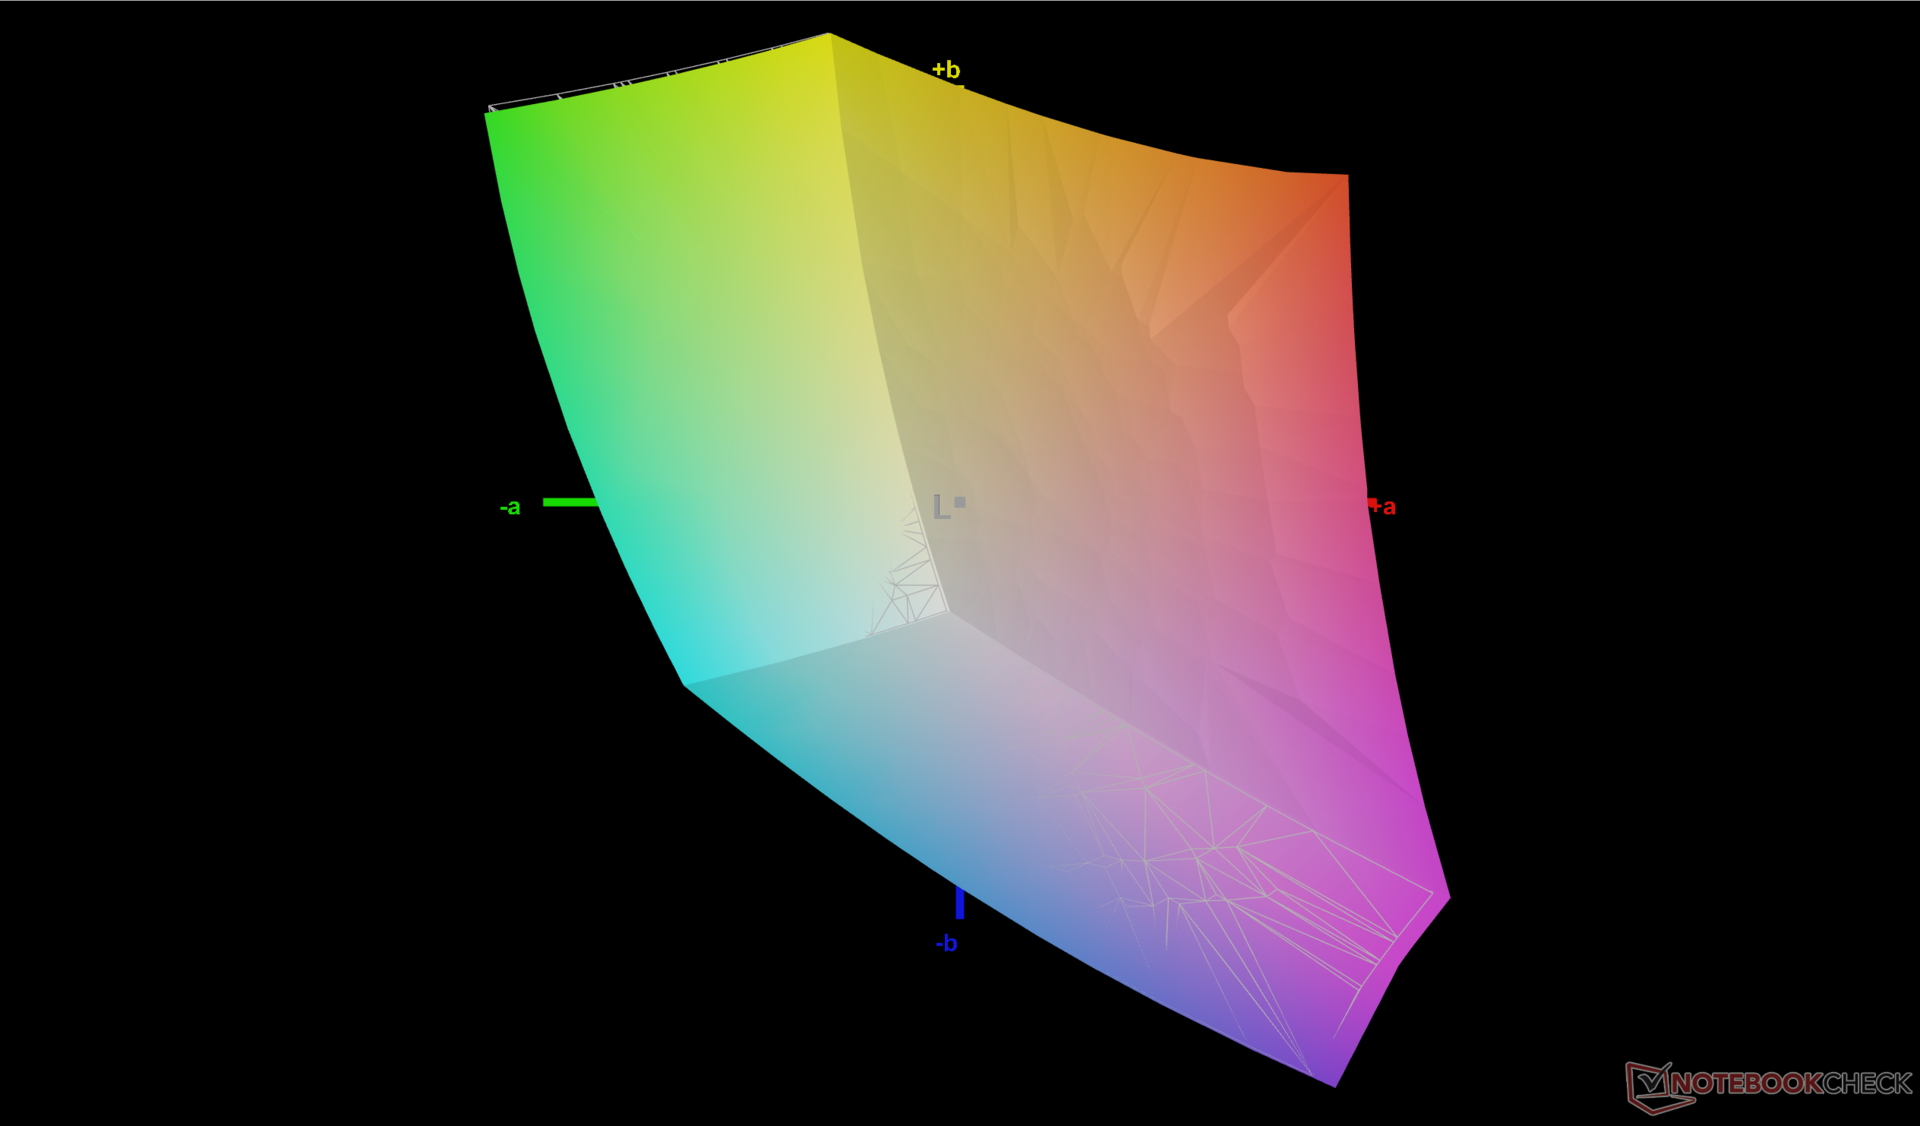
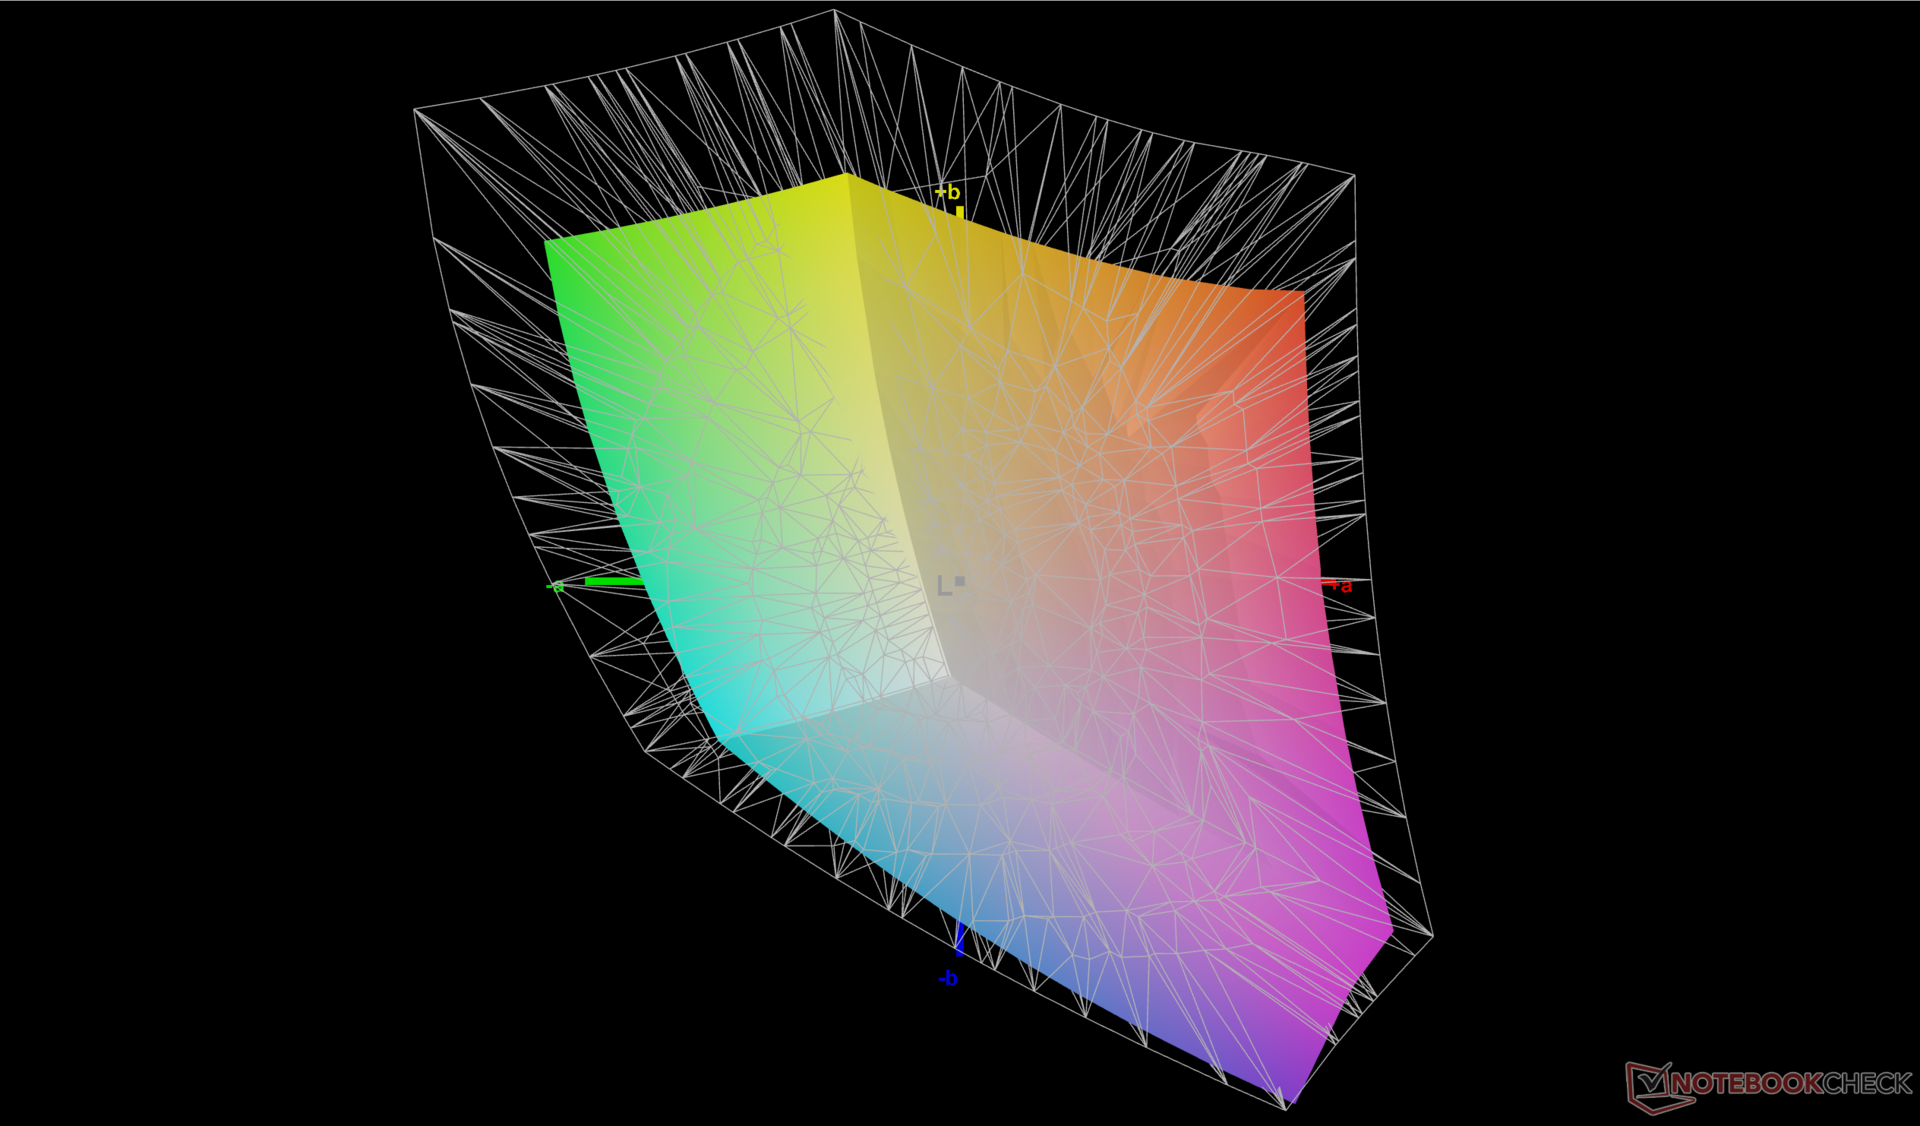
69.8% AdobeRGB 1998 (Argyll 3D)
99.7% sRGB (Argyll 3D)
69.1% Display P3 (Argyll 3D)
Gamma: 2.17
CCT: 6614 K
| Uniwell Technology GM7AG8N Liquid Cooling Box BOE NE170QDM-NZ1, IPS, 2560x1600, 17" | MSI Titan GT77 12UHS Sharp SHP1544 LQ173M1JW08, IPS-Level, 1920x1080, 17.3" | Aorus 17X XES Sharp SHP1563, IPS, 1920x1080, 17.3" | Razer Blade 17 Early 2022 AU Optronics B173ZAN06.9, IPS, 3840x2160, 17.3" | MSI Stealth GS77 12UHS-083US BOE NE173QHM-NZ1, IPS, 2560x1440, 17.3" | Asus ROG Zephyrus S17 GX703HSD BOE099D (BOE CQ NE173QHM-NY3), IPS, 2560x1440, 17.3" | |
|---|---|---|---|---|---|---|
| Display | 2% | 1% | 23% | 21% | 19% | |
| Display P3 Coverage (%) | 69.1 | 70.8 2% | 70.1 1% | 99.4 44% | 96.2 39% | 94.2 36% |
| sRGB Coverage (%) | 99.7 | 98.9 -1% | 99.9 0% | 100 0% | 99.7 0% | 98.7 -1% |
| AdobeRGB 1998 Coverage (%) | 69.8 | 73 5% | 71.9 3% | 87.3 25% | 85.8 23% | 84.4 21% |
| Response Times | 63% | 59% | 44% | -31% | 43% | |
| Response Time Grey 50% / Grey 80% * (ms) | 12.8 ? | 3.03 ? 76% | 3.4 ? 73% | 7.5 ? 41% | 17.6 ? -38% | 4.8 63% |
| Response Time Black / White * (ms) | 10.4 ? | 5.28 ? 49% | 5.8 ? 44% | 5.6 ? 46% | 12.8 ? -23% | 8 23% |
| PWM Frequency (Hz) | ||||||
| Screen | -55% | -74% | 11% | -47% | -62% | |
| Brightness middle (cd/m²) | 392.5 | 280 -29% | 278 -29% | 503 28% | 334.8 -15% | 322 -18% |
| Brightness (cd/m²) | 392 | 275 -30% | 273 -30% | 486 24% | 305 -22% | 288 -27% |
| Brightness Distribution (%) | 91 | 79 -13% | 79 -13% | 84 -8% | 79 -13% | 72 -21% |
| Black Level * (cd/m²) | 0.45 | 0.4 11% | 0.26 42% | 0.44 2% | 0.34 24% | 0.3 33% |
| Contrast (:1) | 872 | 700 -20% | 1069 23% | 1143 31% | 985 13% | 1073 23% |
| Colorchecker dE 2000 * | 1.46 | 2.1 -44% | 3.96 -171% | 1.08 26% | 4.1 -181% | 3.05 -109% |
| Colorchecker dE 2000 max. * | 4.62 | 5.83 -26% | 10.78 -133% | 4.54 2% | 7.28 -58% | 5.23 -13% |
| Colorchecker dE 2000 calibrated * | 0.38 | 1.58 -316% | 1.07 -182% | 0.6 -58% | 1.92 -405% | |
| Greyscale dE 2000 * | 2.5 | 3.3 -32% | 6.8 -172% | 1.3 48% | 5.6 -124% | 3.11 -24% |
| Gamma | 2.17 101% | 2.13 103% | 2.224 99% | 2.151 102% | 2.16 102% | 2.13 103% |
| CCT | 6614 98% | 7060 92% | 7651 85% | 6541 99% | 6314 103% | 6553 99% |
| Color Space (Percent of AdobeRGB 1998) (%) | 84 | |||||
| Color Space (Percent of sRGB) (%) | 99 | |||||
| Totalt genomsnitt (program/inställningar) | 3% /
-26% | -5% /
-39% | 26% /
18% | -19% /
-29% | 0% /
-30% |
* ... mindre är bättre
Skärmen är redan välkalibrerad från början, vilket framgår av våra CalMAN-resultat nedan. Att försöka kalibrera den ytterligare med vår X-Rite-kolorimeter skulle förbättra de genomsnittliga värdena för DeltaE i gråskala och färg bara marginellt till 0,4 respektive 0,38.

Visa svarstider
| ↔ Svarstid svart till vitt | ||
|---|---|---|
| 10.4 ms ... stiga ↗ och falla ↘ kombinerat | ↗ 6 ms stiga | 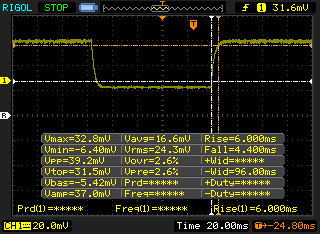 |
| ↘ 4.4 ms hösten | ||
| Skärmen visar bra svarsfrekvens i våra tester, men kan vara för långsam för konkurrenskraftiga spelare. I jämförelse sträcker sig alla testade enheter från 0.1 (minst) till 240 (maximalt) ms. » 28 % av alla enheter är bättre. Det betyder att den uppmätta svarstiden är bättre än genomsnittet av alla testade enheter (19.8 ms). | ||
| ↔ Svarstid 50 % grått till 80 % grått | ||
| 12.8 ms ... stiga ↗ och falla ↘ kombinerat | ↗ 6 ms stiga | 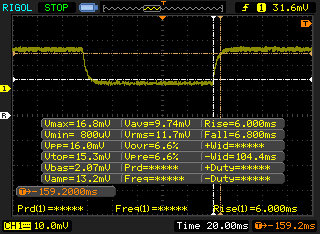 |
| ↘ 6.8 ms hösten | ||
| Skärmen visar bra svarsfrekvens i våra tester, men kan vara för långsam för konkurrenskraftiga spelare. I jämförelse sträcker sig alla testade enheter från 0.165 (minst) till 636 (maximalt) ms. » 26 % av alla enheter är bättre. Det betyder att den uppmätta svarstiden är bättre än genomsnittet av alla testade enheter (31 ms). | ||
Skärmflimmer / PWM (Puls-Width Modulation)
| Skärmflimmer / PWM upptäcktes inte | 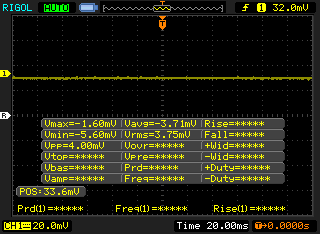 | ||
Som jämförelse: 52 % av alla testade enheter använder inte PWM för att dämpa skärmen. Om PWM upptäcktes mättes ett medelvärde av 7754 (minst: 5 - maximum: 343500) Hz. | |||
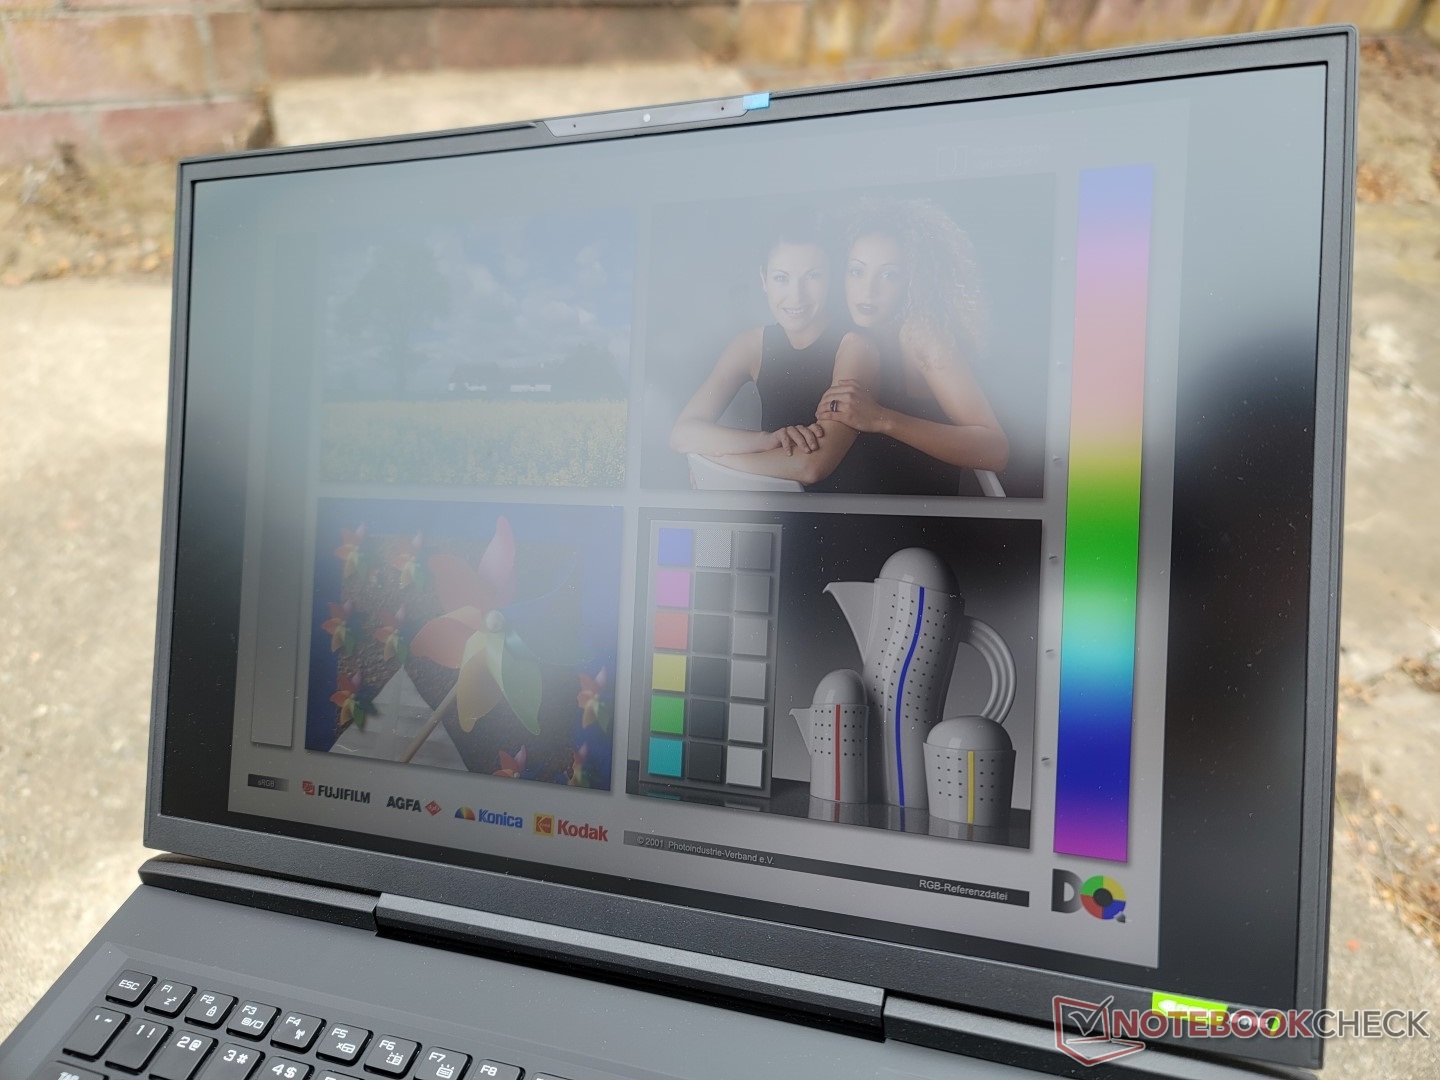
Utomhus är sikten hyfsad om den ligger i skugga. Bakgrundsbelysningen med 400 nit är ljusare än på de flesta andra bärbara datorer för spel, t.ex Aorus 17X eller Asus Zephyrus S17 där 300 nits är vanligt.
Prestanda - Ofördröjd
Provningsförhållanden
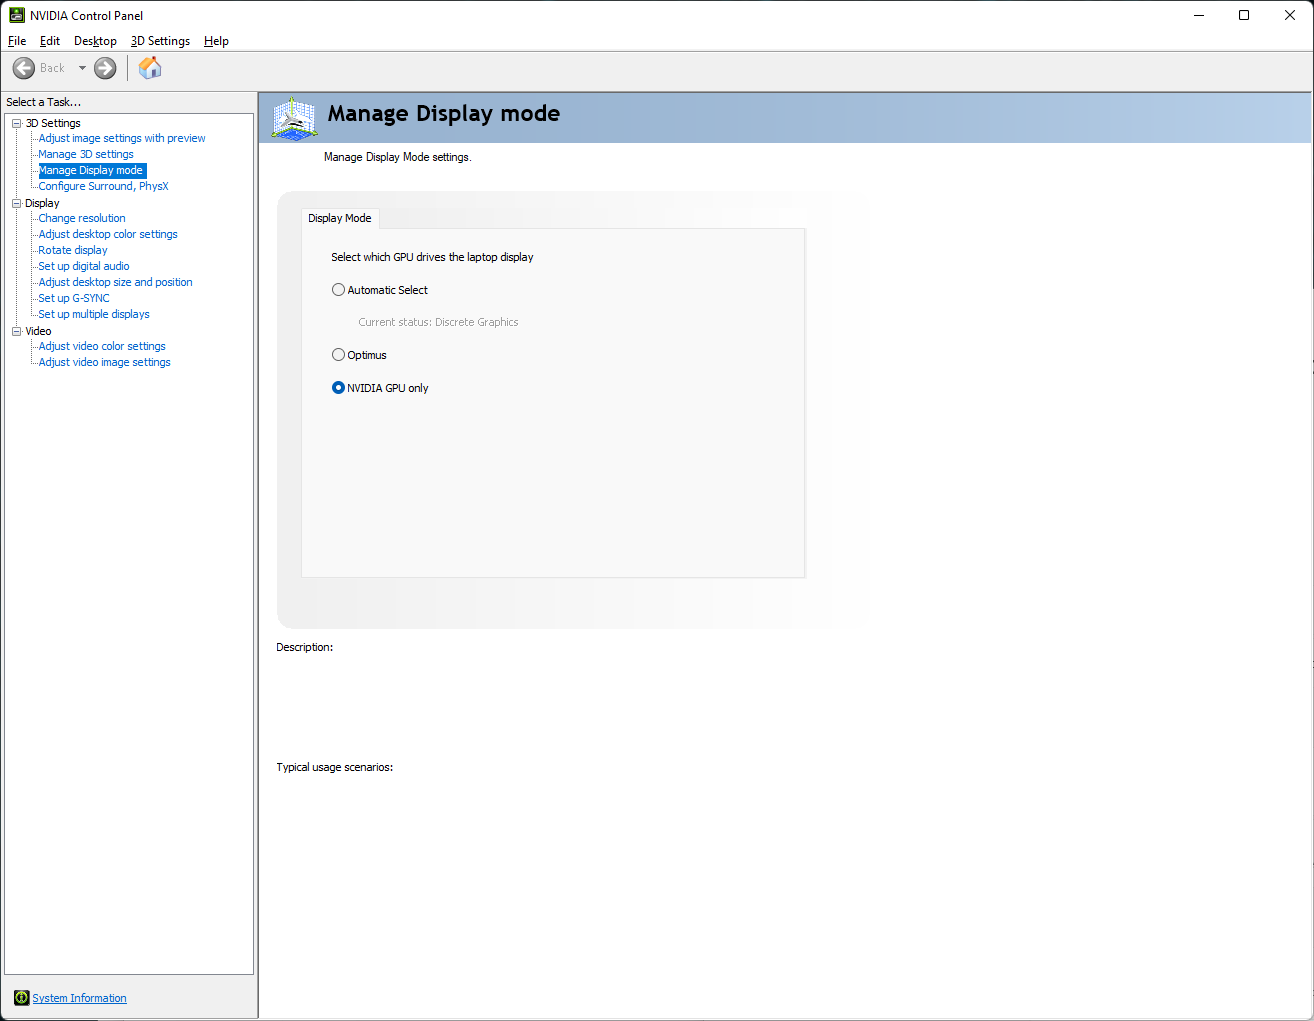
Om inget annat anges utfördes alla tester och benchmarks nedan med den externa kylboxen ansluten och aktiv. Vi såg också till att ställa in Windows på Prestanda, inaktivera Optimus till förmån för MUX och ställa in Control Center-programvaran på "Fan Boost".
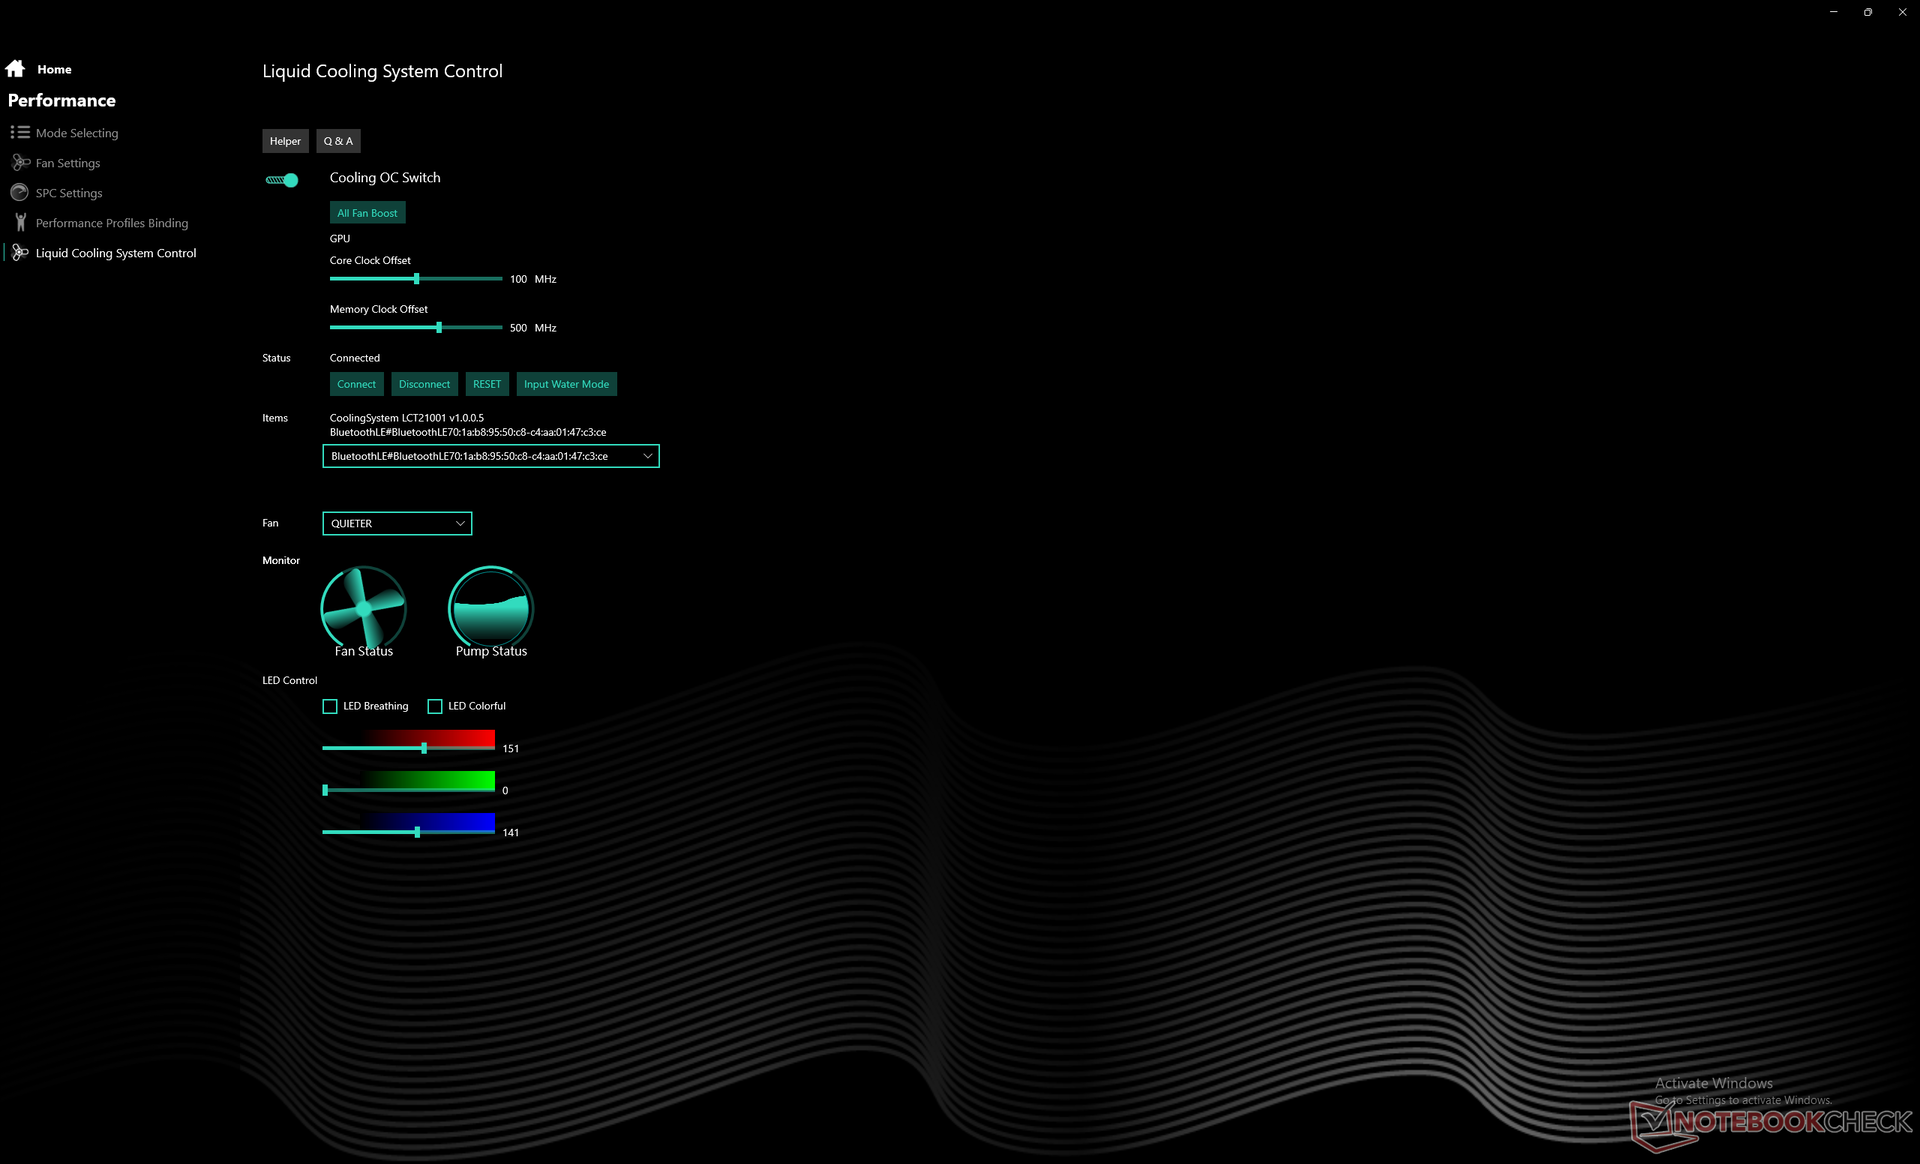
Kylboxen har tre inställningar för ljudnivån: Quieter (tystare), Quiet (tyst) och Balanced (balanserad). Namngivningen lurar dock ingen, eftersom dessa tre inställningar kan översättas till Low, Medium och Loudest. Vi ställde in vår kylboxenhet på "Balanserad" för teständamål. Tänk på att kylboxen inte kommer att köras på batteri.
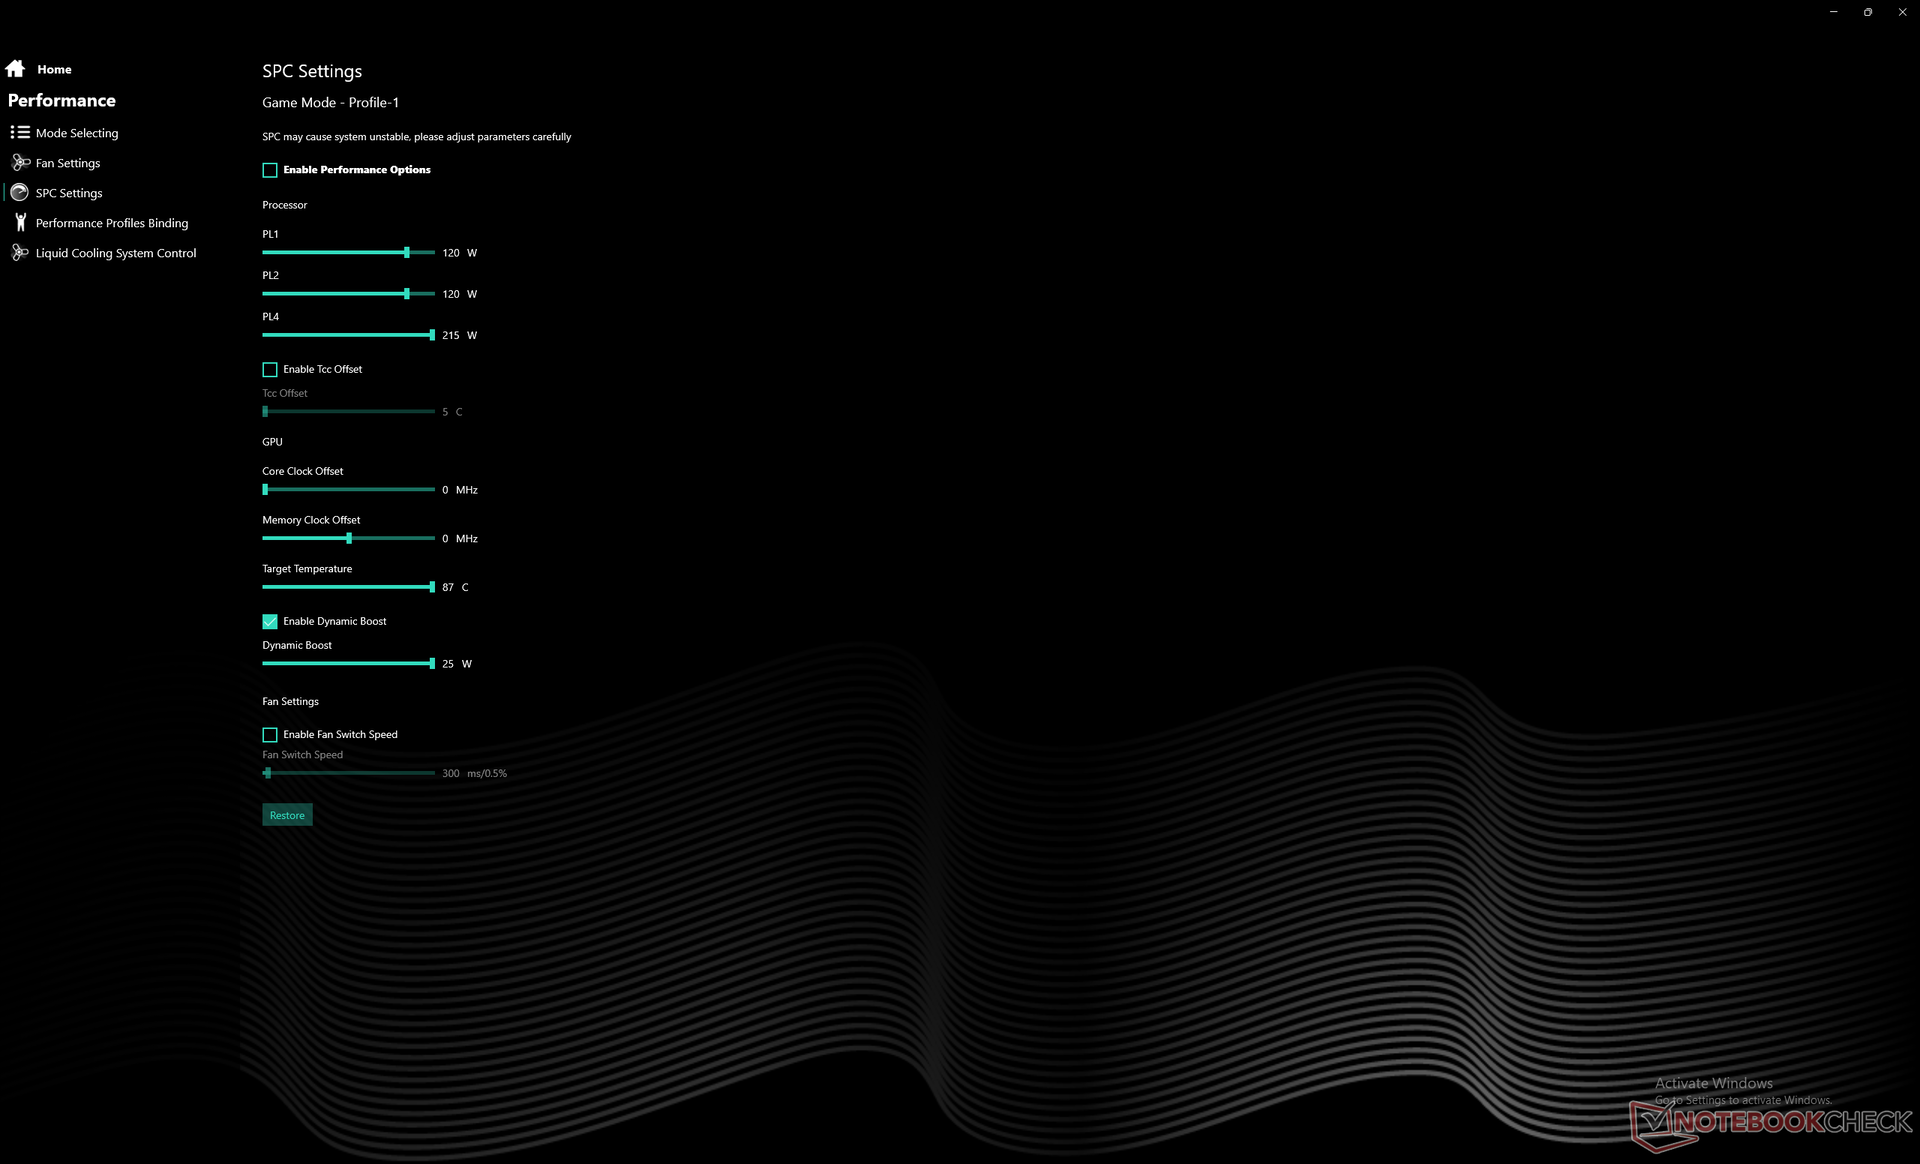
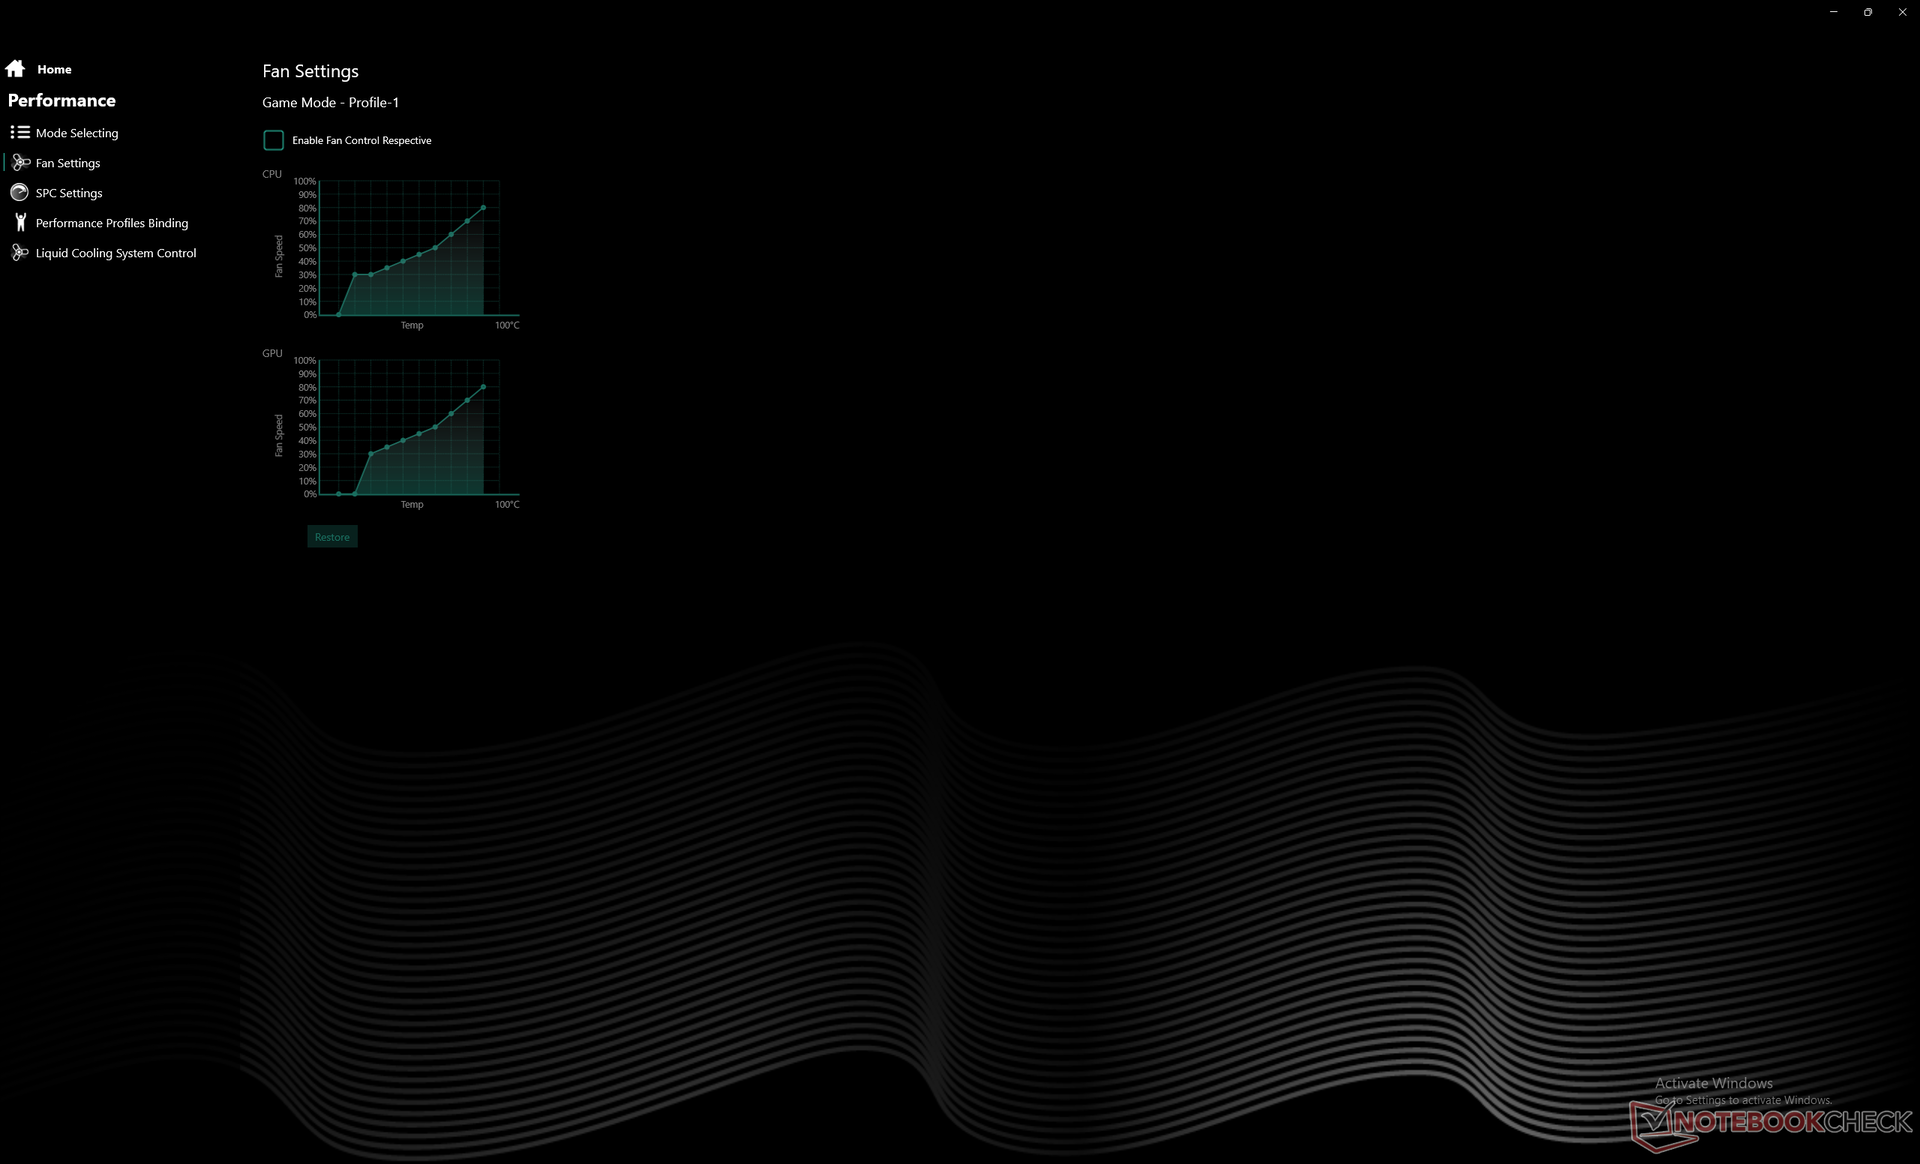
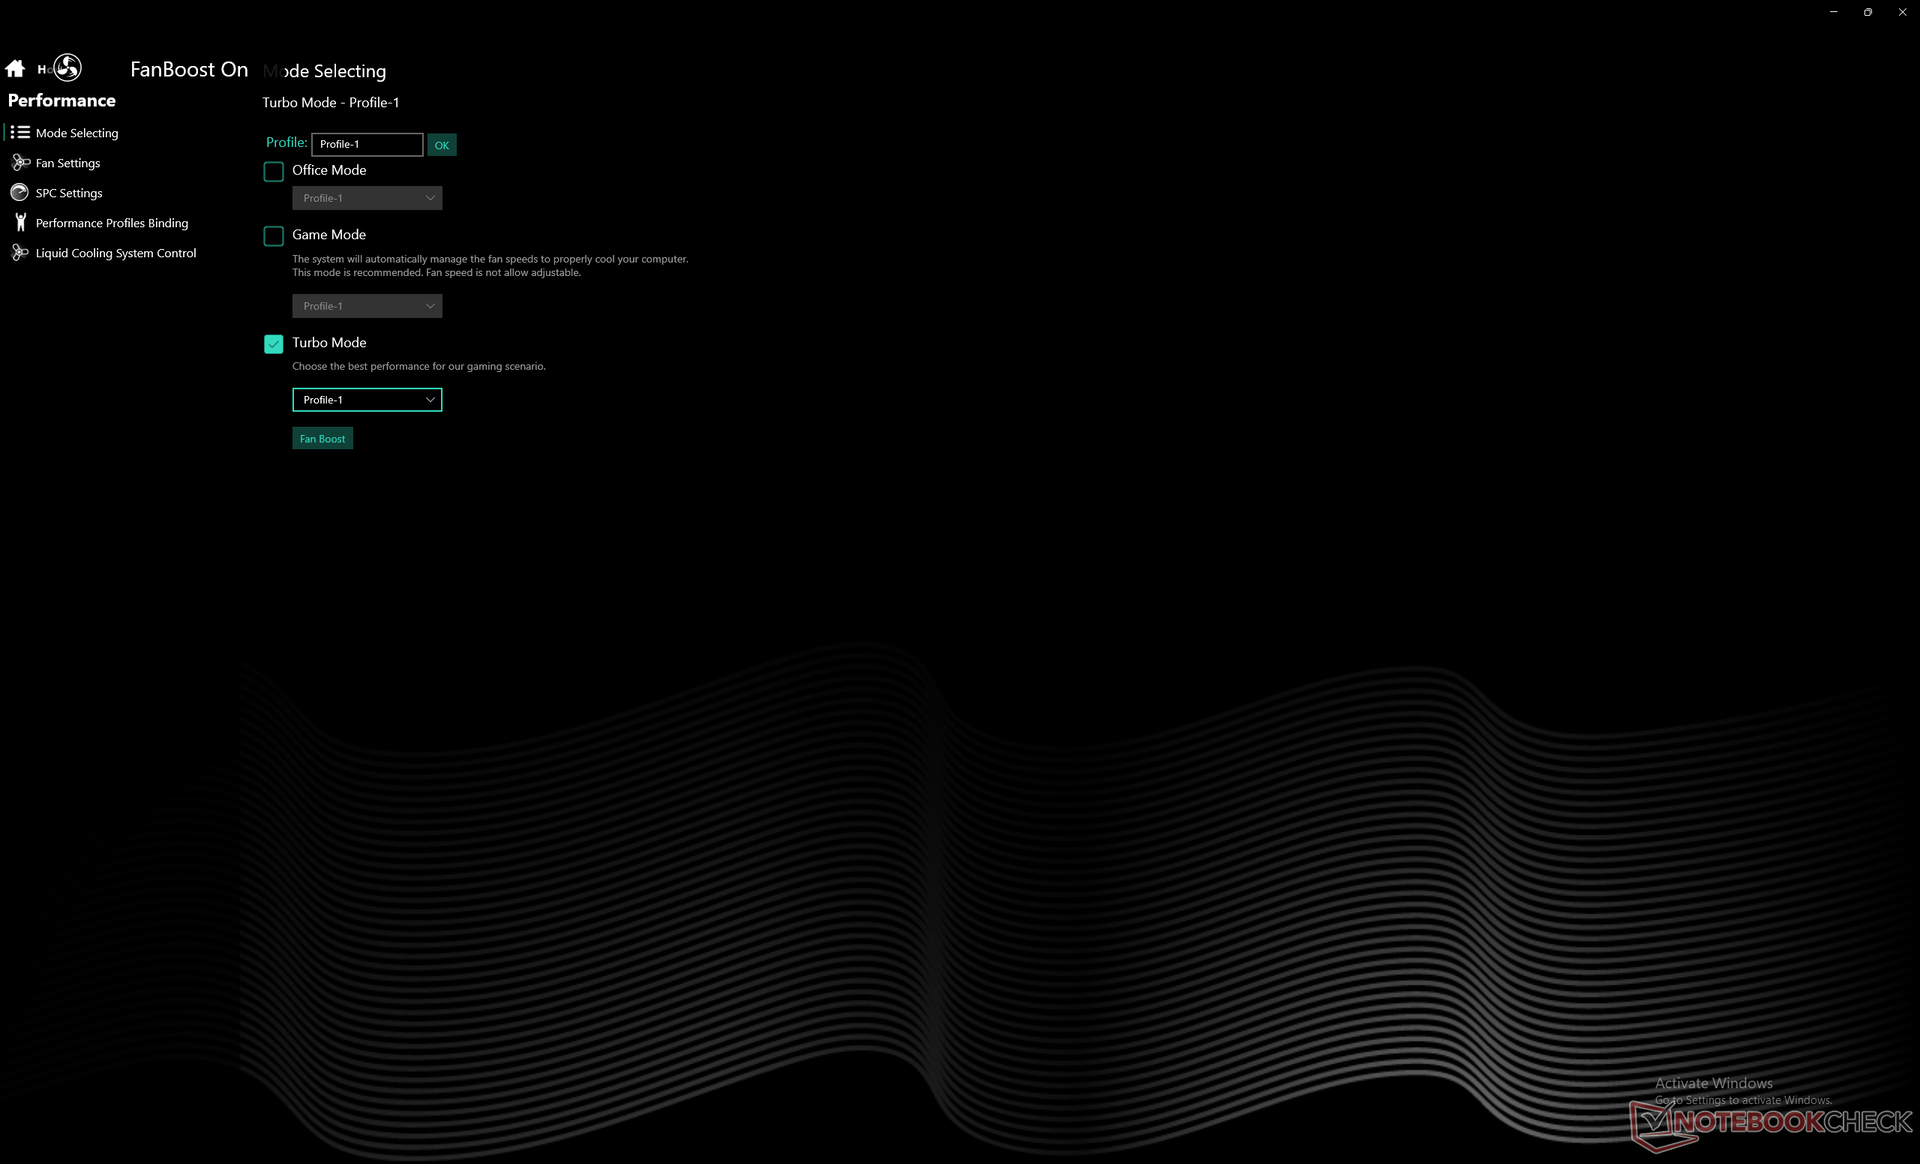
Det rekommenderas starkt att ägarna bekantar sig med den förinstallerade Control Center-programvaran eftersom den är den bärbara datorns kontrollhubb. Allt från prestanda till belysning, fläktkontroller och överklockning kontrolleras här, vilket framgår av några skärmdumpar nedan. Våra överklockningsinställningar är standardinställningarna för den bärbara datorn som den levereras.
Processor
CPU-prestandan är bättre än förväntat med resultat som är 15-25 procent snabbare än den genomsnittliga bärbara datorn i vår databas med samma Core i9-12900H. Faktum är att den här Uniwell-modellen är den snabbaste bärbara datorn med Core i9-12900H som vi hittills har testat.
Prestandahållbarheten är också utmärkt, vilket man kan förvänta sig av en anständig bärbar dator för spel, särskilt av en som är vattenkyld.
Cinebench R15 Multi Loop
Cinebench R20: CPU (Multi Core) | CPU (Single Core)
Cinebench R23: Multi Core | Single Core
Cinebench R15: CPU Multi 64Bit | CPU Single 64Bit
Blender: v2.79 BMW27 CPU
7-Zip 18.03: 7z b 4 | 7z b 4 -mmt1
Geekbench 5.5: Multi-Core | Single-Core
HWBOT x265 Benchmark v2.2: 4k Preset
LibreOffice : 20 Documents To PDF
R Benchmark 2.5: Overall mean
* ... mindre är bättre
AIDA64: FP32 Ray-Trace | FPU Julia | CPU SHA3 | CPU Queen | FPU SinJulia | FPU Mandel | CPU AES | CPU ZLib | FP64 Ray-Trace | CPU PhotoWorxx
| Performance rating | |
| MSI Titan GT77 12UHS | |
| Uniwell Technology GM7AG8N Liquid Cooling Box | |
| Aorus 17X XES | |
| Genomsnitt Intel Core i9-12900H | |
| MSI Stealth GS77 12UHS-083US | |
| Razer Blade 17 Early 2022 | |
| Asus ROG Zephyrus S17 GX703HSD -9! | |
| AIDA64 / FP32 Ray-Trace | |
| MSI Titan GT77 12UHS | |
| Uniwell Technology GM7AG8N Liquid Cooling Box | |
| Aorus 17X XES | |
| Genomsnitt Intel Core i9-12900H (4074 - 18289, n=29) | |
| MSI Stealth GS77 12UHS-083US | |
| Razer Blade 17 Early 2022 | |
| AIDA64 / FPU Julia | |
| MSI Titan GT77 12UHS | |
| Uniwell Technology GM7AG8N Liquid Cooling Box | |
| Aorus 17X XES | |
| Genomsnitt Intel Core i9-12900H (22307 - 93236, n=29) | |
| MSI Stealth GS77 12UHS-083US | |
| Razer Blade 17 Early 2022 | |
| AIDA64 / CPU SHA3 | |
| MSI Titan GT77 12UHS | |
| Uniwell Technology GM7AG8N Liquid Cooling Box | |
| Aorus 17X XES | |
| MSI Stealth GS77 12UHS-083US | |
| Genomsnitt Intel Core i9-12900H (1378 - 4215, n=29) | |
| Razer Blade 17 Early 2022 | |
| AIDA64 / CPU Queen | |
| Uniwell Technology GM7AG8N Liquid Cooling Box | |
| Aorus 17X XES | |
| MSI Titan GT77 12UHS | |
| Genomsnitt Intel Core i9-12900H (78172 - 111241, n=28) | |
| MSI Stealth GS77 12UHS-083US | |
| Razer Blade 17 Early 2022 | |
| AIDA64 / FPU SinJulia | |
| MSI Titan GT77 12UHS | |
| Aorus 17X XES | |
| Uniwell Technology GM7AG8N Liquid Cooling Box | |
| MSI Stealth GS77 12UHS-083US | |
| Genomsnitt Intel Core i9-12900H (5709 - 10410, n=29) | |
| Razer Blade 17 Early 2022 | |
| AIDA64 / FPU Mandel | |
| MSI Titan GT77 12UHS | |
| Uniwell Technology GM7AG8N Liquid Cooling Box | |
| Aorus 17X XES | |
| Genomsnitt Intel Core i9-12900H (11257 - 45581, n=29) | |
| MSI Stealth GS77 12UHS-083US | |
| Razer Blade 17 Early 2022 | |
| AIDA64 / CPU AES | |
| MSI Titan GT77 12UHS | |
| Aorus 17X XES | |
| MSI Stealth GS77 12UHS-083US | |
| Uniwell Technology GM7AG8N Liquid Cooling Box | |
| Genomsnitt Intel Core i9-12900H (31935 - 151546, n=29) | |
| Razer Blade 17 Early 2022 | |
| AIDA64 / CPU ZLib | |
| MSI Titan GT77 12UHS | |
| Uniwell Technology GM7AG8N Liquid Cooling Box | |
| MSI Stealth GS77 12UHS-083US | |
| Aorus 17X XES | |
| Genomsnitt Intel Core i9-12900H (449 - 1193, n=29) | |
| Razer Blade 17 Early 2022 | |
| Asus ROG Zephyrus S17 GX703HSD | |
| AIDA64 / FP64 Ray-Trace | |
| MSI Titan GT77 12UHS | |
| Uniwell Technology GM7AG8N Liquid Cooling Box | |
| Aorus 17X XES | |
| Genomsnitt Intel Core i9-12900H (2235 - 10511, n=29) | |
| MSI Stealth GS77 12UHS-083US | |
| Razer Blade 17 Early 2022 | |
| AIDA64 / CPU PhotoWorxx | |
| MSI Titan GT77 12UHS | |
| Aorus 17X XES | |
| MSI Stealth GS77 12UHS-083US | |
| Razer Blade 17 Early 2022 | |
| Genomsnitt Intel Core i9-12900H (20960 - 48269, n=30) | |
| Uniwell Technology GM7AG8N Liquid Cooling Box | |
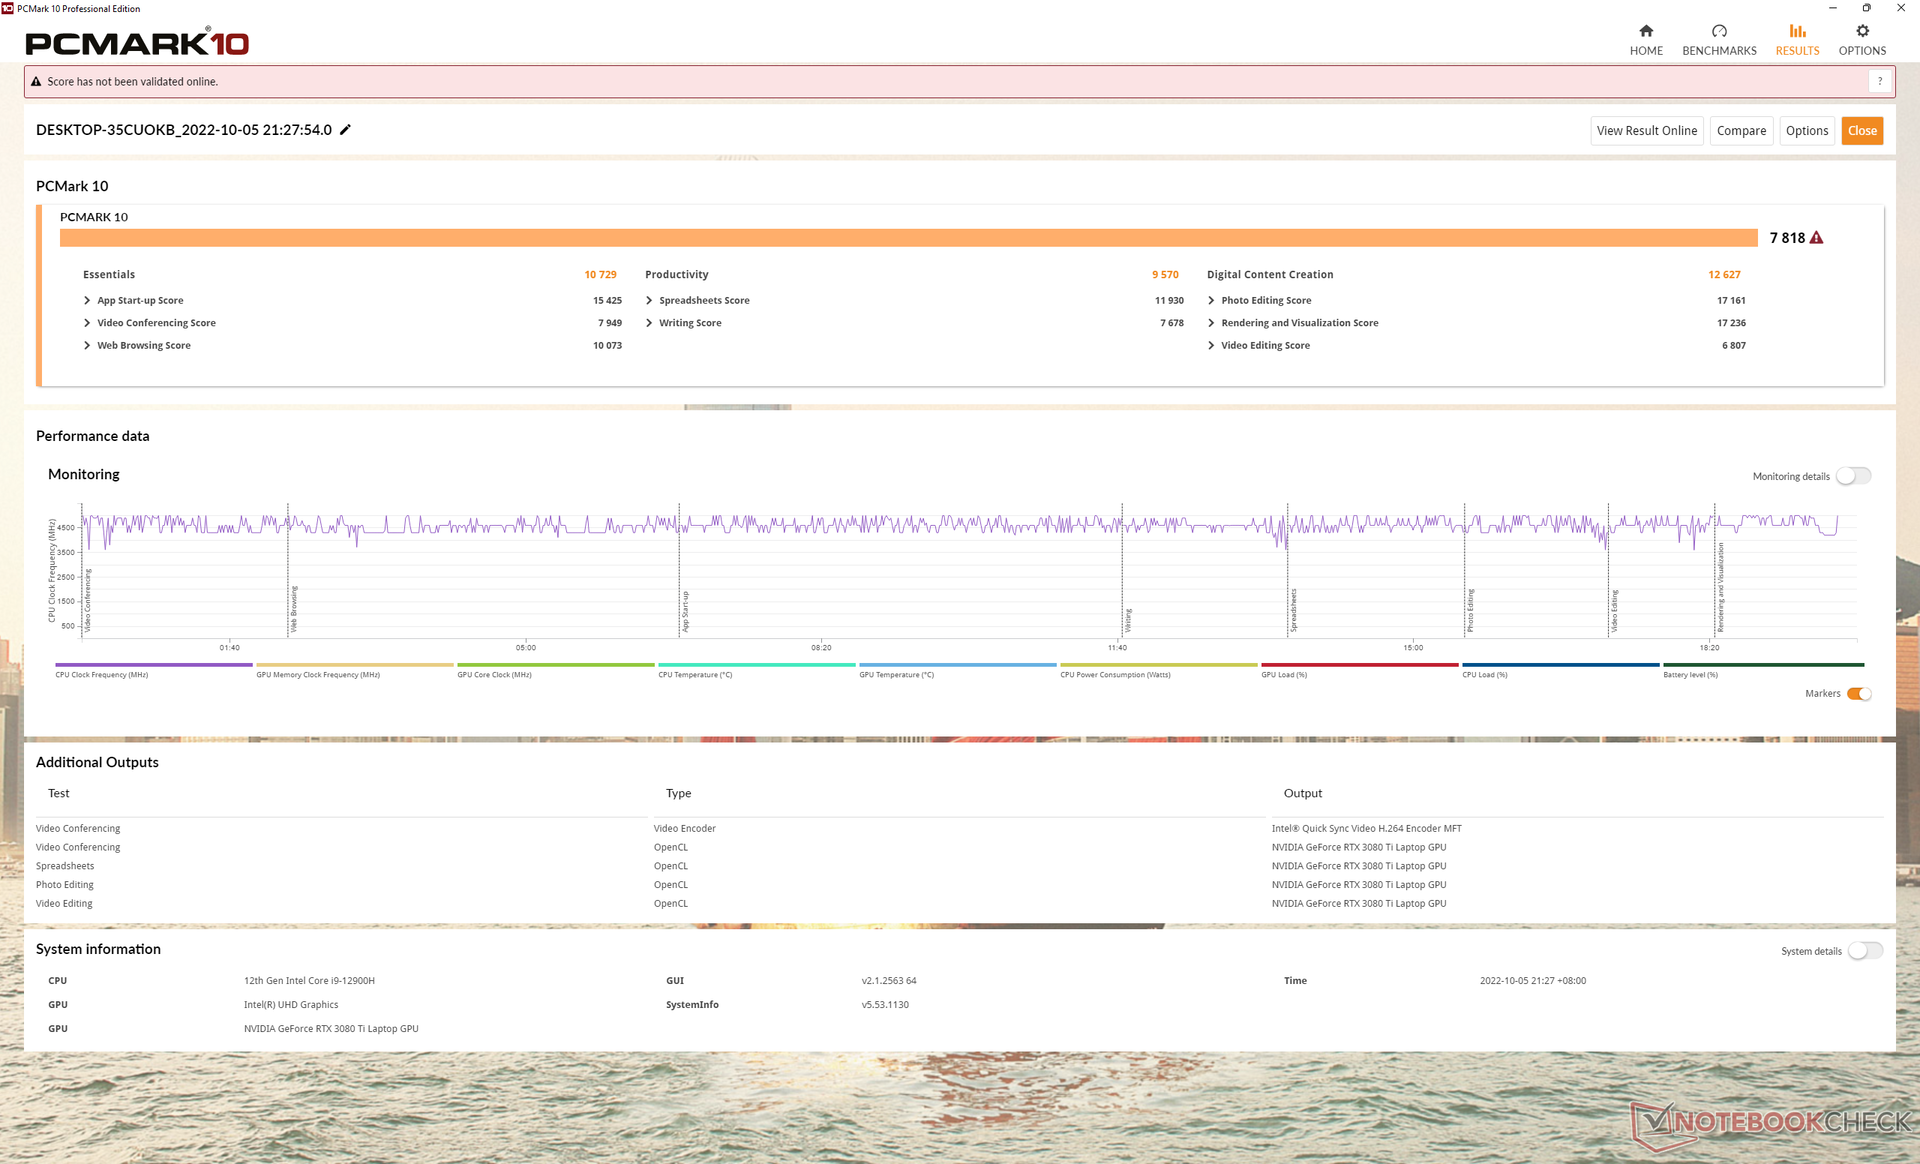
Systemets prestanda
PCMark 10-resultaten är jämförbara med andra bärbara datorer med samma CPU och GPU som t.ex.Alienware x15 R2 P111F eller Razer Blade 17 Early 2022.
CrossMark: Overall | Productivity | Creativity | Responsiveness
| PCMark 10 / Score | |
| MSI Titan GT77 12UHS | |
| Aorus 17X XES | |
| Uniwell Technology GM7AG8N Liquid Cooling Box | |
| Genomsnitt Intel Core i9-12900H, NVIDIA GeForce RTX 3080 Ti Laptop GPU (7139 - 8083, n=6) | |
| MSI Stealth GS77 12UHS-083US | |
| Asus ROG Zephyrus S17 GX703HSD | |
| Razer Blade 17 Early 2022 | |
| PCMark 10 / Essentials | |
| MSI Titan GT77 12UHS | |
| Genomsnitt Intel Core i9-12900H, NVIDIA GeForce RTX 3080 Ti Laptop GPU (10254 - 11178, n=6) | |
| Uniwell Technology GM7AG8N Liquid Cooling Box | |
| Asus ROG Zephyrus S17 GX703HSD | |
| Aorus 17X XES | |
| MSI Stealth GS77 12UHS-083US | |
| Razer Blade 17 Early 2022 | |
| PCMark 10 / Productivity | |
| Aorus 17X XES | |
| MSI Titan GT77 12UHS | |
| Genomsnitt Intel Core i9-12900H, NVIDIA GeForce RTX 3080 Ti Laptop GPU (9102 - 11186, n=6) | |
| Uniwell Technology GM7AG8N Liquid Cooling Box | |
| MSI Stealth GS77 12UHS-083US | |
| Asus ROG Zephyrus S17 GX703HSD | |
| Razer Blade 17 Early 2022 | |
| PCMark 10 / Digital Content Creation | |
| MSI Titan GT77 12UHS | |
| Uniwell Technology GM7AG8N Liquid Cooling Box | |
| Aorus 17X XES | |
| Genomsnitt Intel Core i9-12900H, NVIDIA GeForce RTX 3080 Ti Laptop GPU (9847 - 12627, n=6) | |
| MSI Stealth GS77 12UHS-083US | |
| Razer Blade 17 Early 2022 | |
| Asus ROG Zephyrus S17 GX703HSD | |
| CrossMark / Overall | |
| Aorus 17X XES | |
| MSI Titan GT77 12UHS | |
| Genomsnitt Intel Core i9-12900H, NVIDIA GeForce RTX 3080 Ti Laptop GPU (1696 - 1965, n=3) | |
| Razer Blade 17 Early 2022 | |
| Uniwell Technology GM7AG8N Liquid Cooling Box | |
| CrossMark / Productivity | |
| Aorus 17X XES | |
| MSI Titan GT77 12UHS | |
| Genomsnitt Intel Core i9-12900H, NVIDIA GeForce RTX 3080 Ti Laptop GPU (1622 - 1870, n=3) | |
| Razer Blade 17 Early 2022 | |
| Uniwell Technology GM7AG8N Liquid Cooling Box | |
| CrossMark / Creativity | |
| Aorus 17X XES | |
| MSI Titan GT77 12UHS | |
| Genomsnitt Intel Core i9-12900H, NVIDIA GeForce RTX 3080 Ti Laptop GPU (1855 - 2135, n=3) | |
| Razer Blade 17 Early 2022 | |
| Uniwell Technology GM7AG8N Liquid Cooling Box | |
| CrossMark / Responsiveness | |
| Aorus 17X XES | |
| MSI Titan GT77 12UHS | |
| Razer Blade 17 Early 2022 | |
| Genomsnitt Intel Core i9-12900H, NVIDIA GeForce RTX 3080 Ti Laptop GPU (1483 - 1777, n=3) | |
| Uniwell Technology GM7AG8N Liquid Cooling Box | |
| PCMark 10 Score | 7818 poäng | |
Hjälp | ||
| AIDA64 / Memory Copy | |
| MSI Titan GT77 12UHS | |
| Aorus 17X XES | |
| MSI Stealth GS77 12UHS-083US | |
| Razer Blade 17 Early 2022 | |
| Genomsnitt Intel Core i9-12900H (34438 - 74264, n=29) | |
| Uniwell Technology GM7AG8N Liquid Cooling Box | |
| AIDA64 / Memory Read | |
| Aorus 17X XES | |
| MSI Stealth GS77 12UHS-083US | |
| Razer Blade 17 Early 2022 | |
| MSI Titan GT77 12UHS | |
| Genomsnitt Intel Core i9-12900H (36365 - 74642, n=29) | |
| Uniwell Technology GM7AG8N Liquid Cooling Box | |
| AIDA64 / Memory Write | |
| MSI Stealth GS77 12UHS-083US | |
| MSI Titan GT77 12UHS | |
| Aorus 17X XES | |
| Genomsnitt Intel Core i9-12900H (32276 - 67858, n=29) | |
| Razer Blade 17 Early 2022 | |
| Uniwell Technology GM7AG8N Liquid Cooling Box | |
| AIDA64 / Memory Latency | |
| MSI Stealth GS77 12UHS-083US | |
| Uniwell Technology GM7AG8N Liquid Cooling Box | |
| MSI Titan GT77 12UHS | |
| Aorus 17X XES | |
| Genomsnitt Intel Core i9-12900H (74.7 - 118.1, n=28) | |
| Asus ROG Zephyrus S17 GX703HSD | |
* ... mindre är bättre
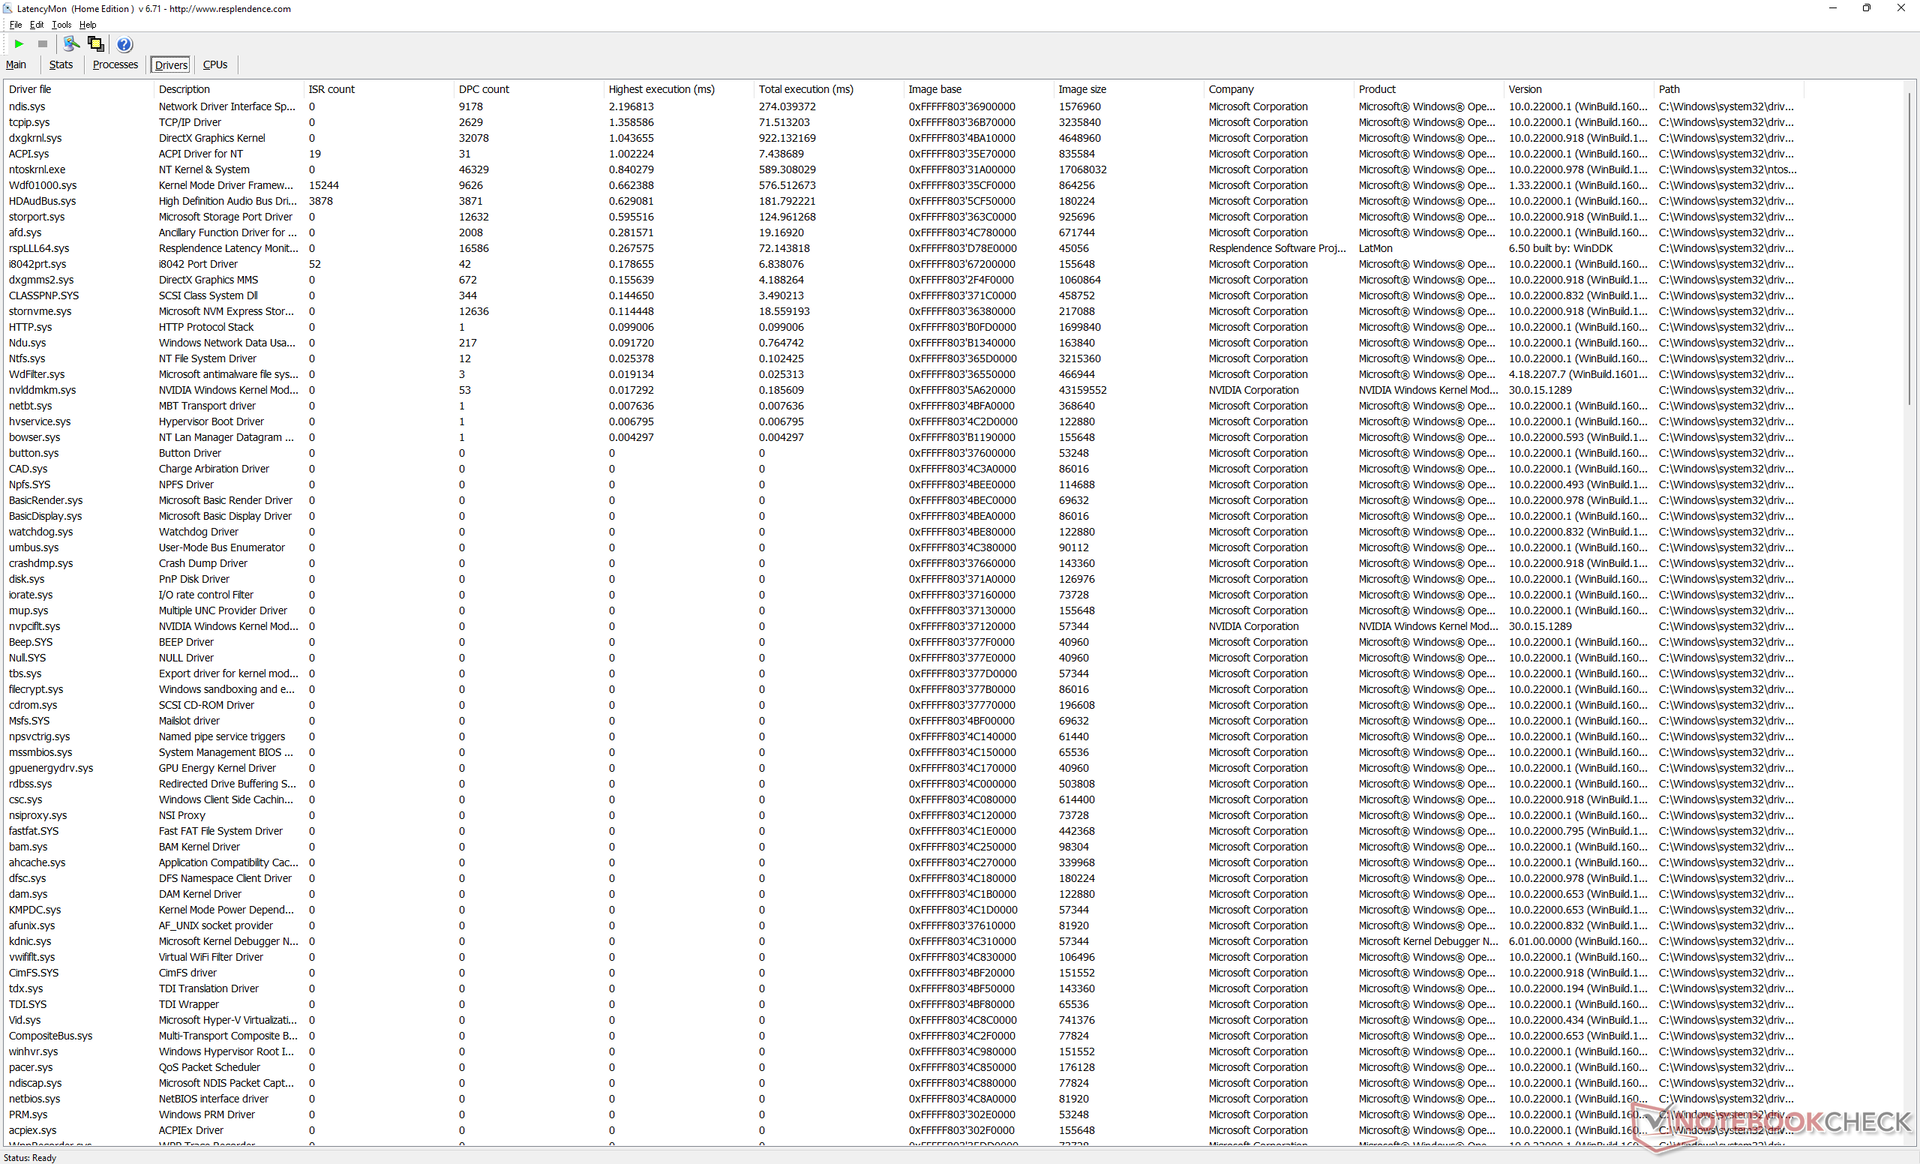
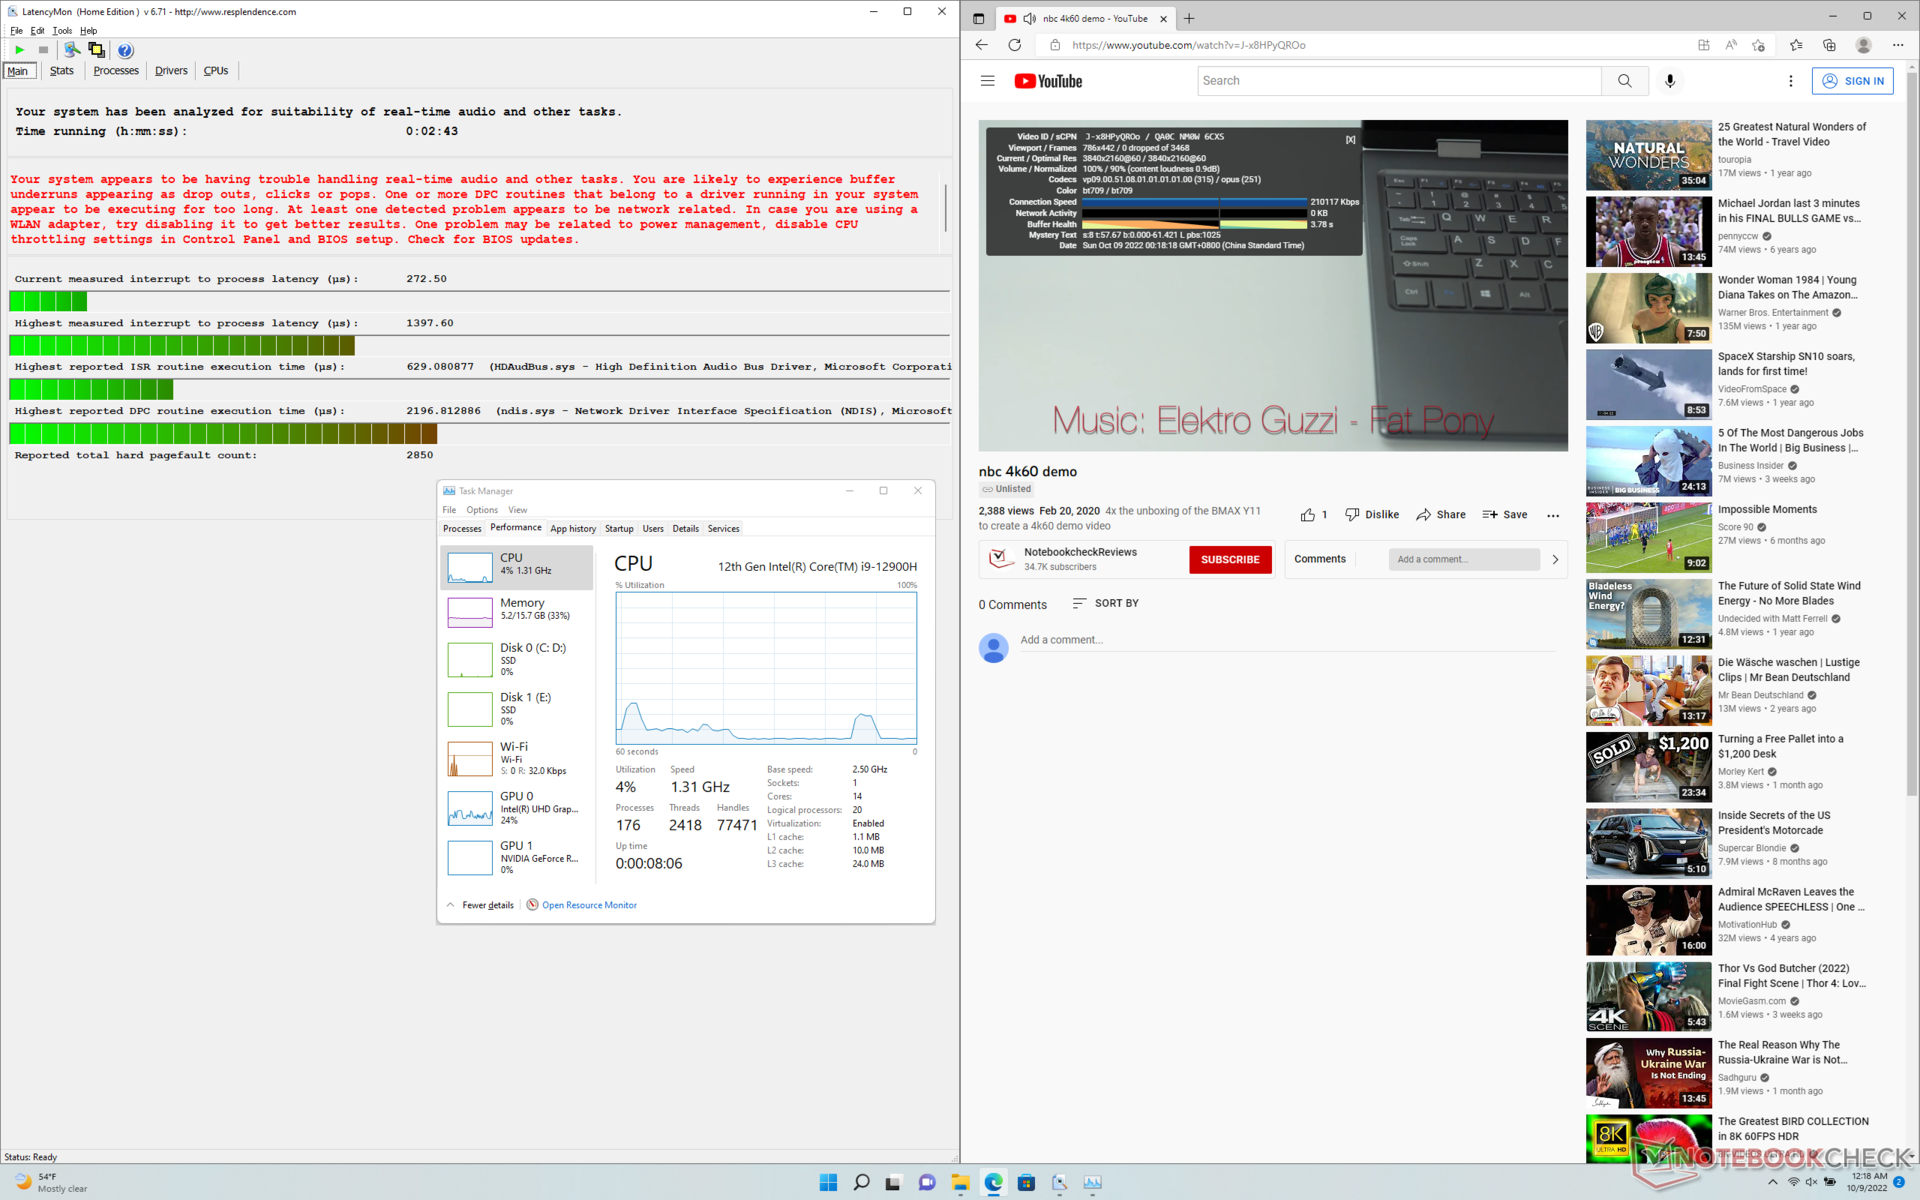
DPC-latenstid
LatencyMon avslöjar DPC-problem när du öppnar flera webbläsarflikar på vår hemsida. uppspelning av 4K60-video är annars perfekt utan några tappade bilder.
| DPC Latencies / LatencyMon - interrupt to process latency (max), Web, Youtube, Prime95 | |
| MSI Stealth GS77 12UHS-083US | |
| Asus ROG Zephyrus S17 GX703HSD | |
| Uniwell Technology GM7AG8N Liquid Cooling Box | |
| Aorus 17X XES | |
| Razer Blade 17 Early 2022 | |
* ... mindre är bättre
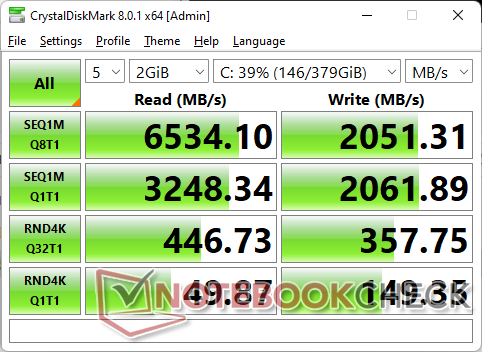
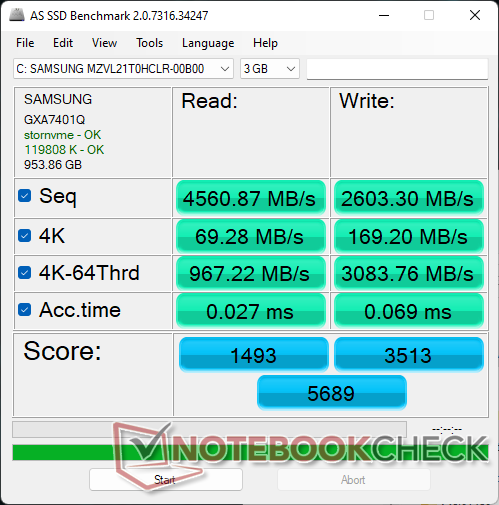
Lagringsenheter - Stöd för 2x M.2 2280 PCIe4 x4
Vår testenhet är utrustad med sammaSamsung PM9A1 MZVL21T0HCLR PCIe4 x4 SSD som finns i många andra bärbara datorer för spel i toppklass, t.ex MSI Titan GT77. Enheten uppvisar dock prestandaproblem när den stressas trots att en värmespridare ingår. När DiskSpd kördes i en loop började läsfrekvensen mycket högt med ~6500 MB/s för att sedan snabbt sjunka till ~1400 MB/s, vilket visas i vår graf nedan. Detta kan vara ett potentiellt fel i systemet.

| Drive Performance rating - Percent | |
| Asus ROG Zephyrus S17 GX703HSD | |
| Aorus 17X XES | |
| MSI Titan GT77 12UHS | |
| Razer Blade 17 Early 2022 | |
| MSI Stealth GS77 12UHS-083US | |
| Uniwell Technology GM7AG8N Liquid Cooling Box | |
* ... mindre är bättre
Disk Throttling: DiskSpd Read Loop, Queue Depth 8
GPU-prestanda - Full Fat 175 W TGP GPU
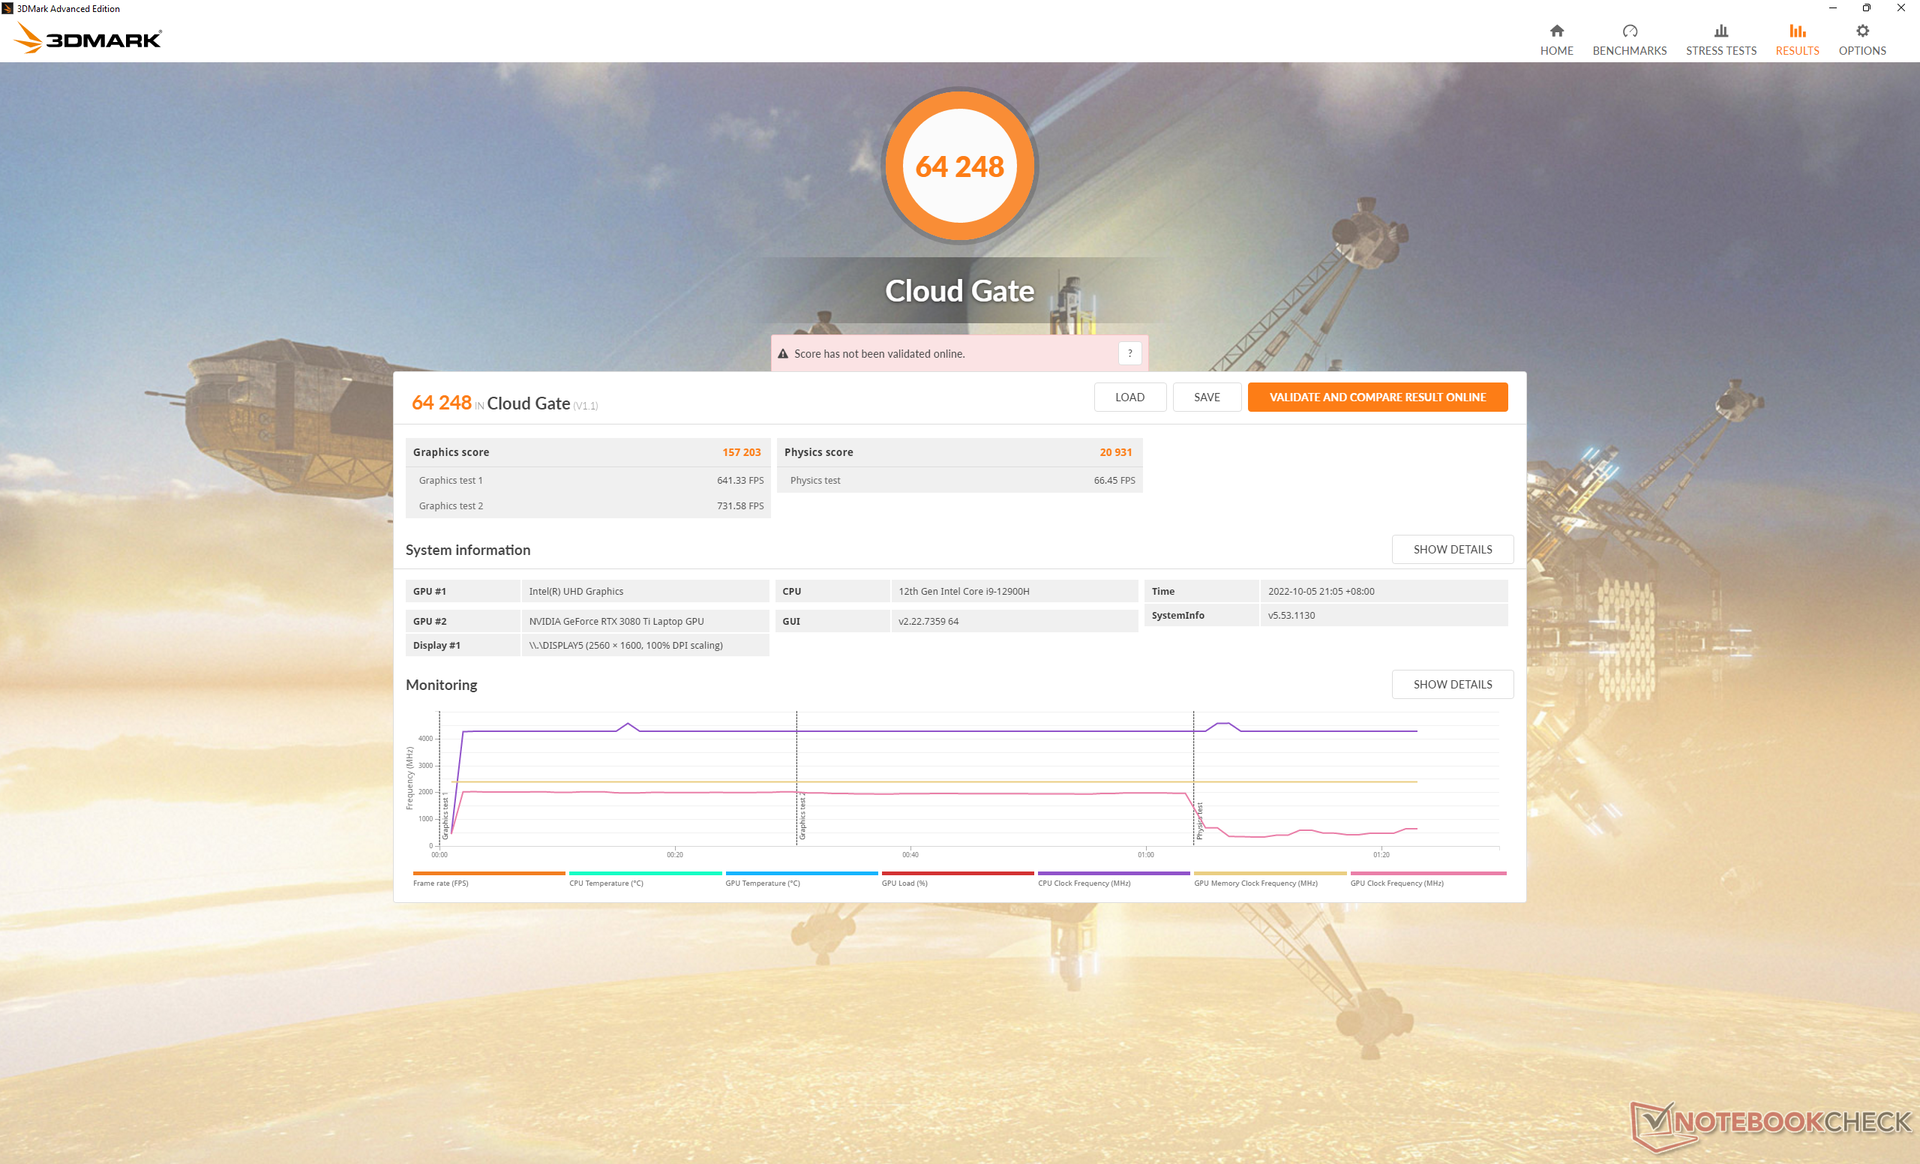
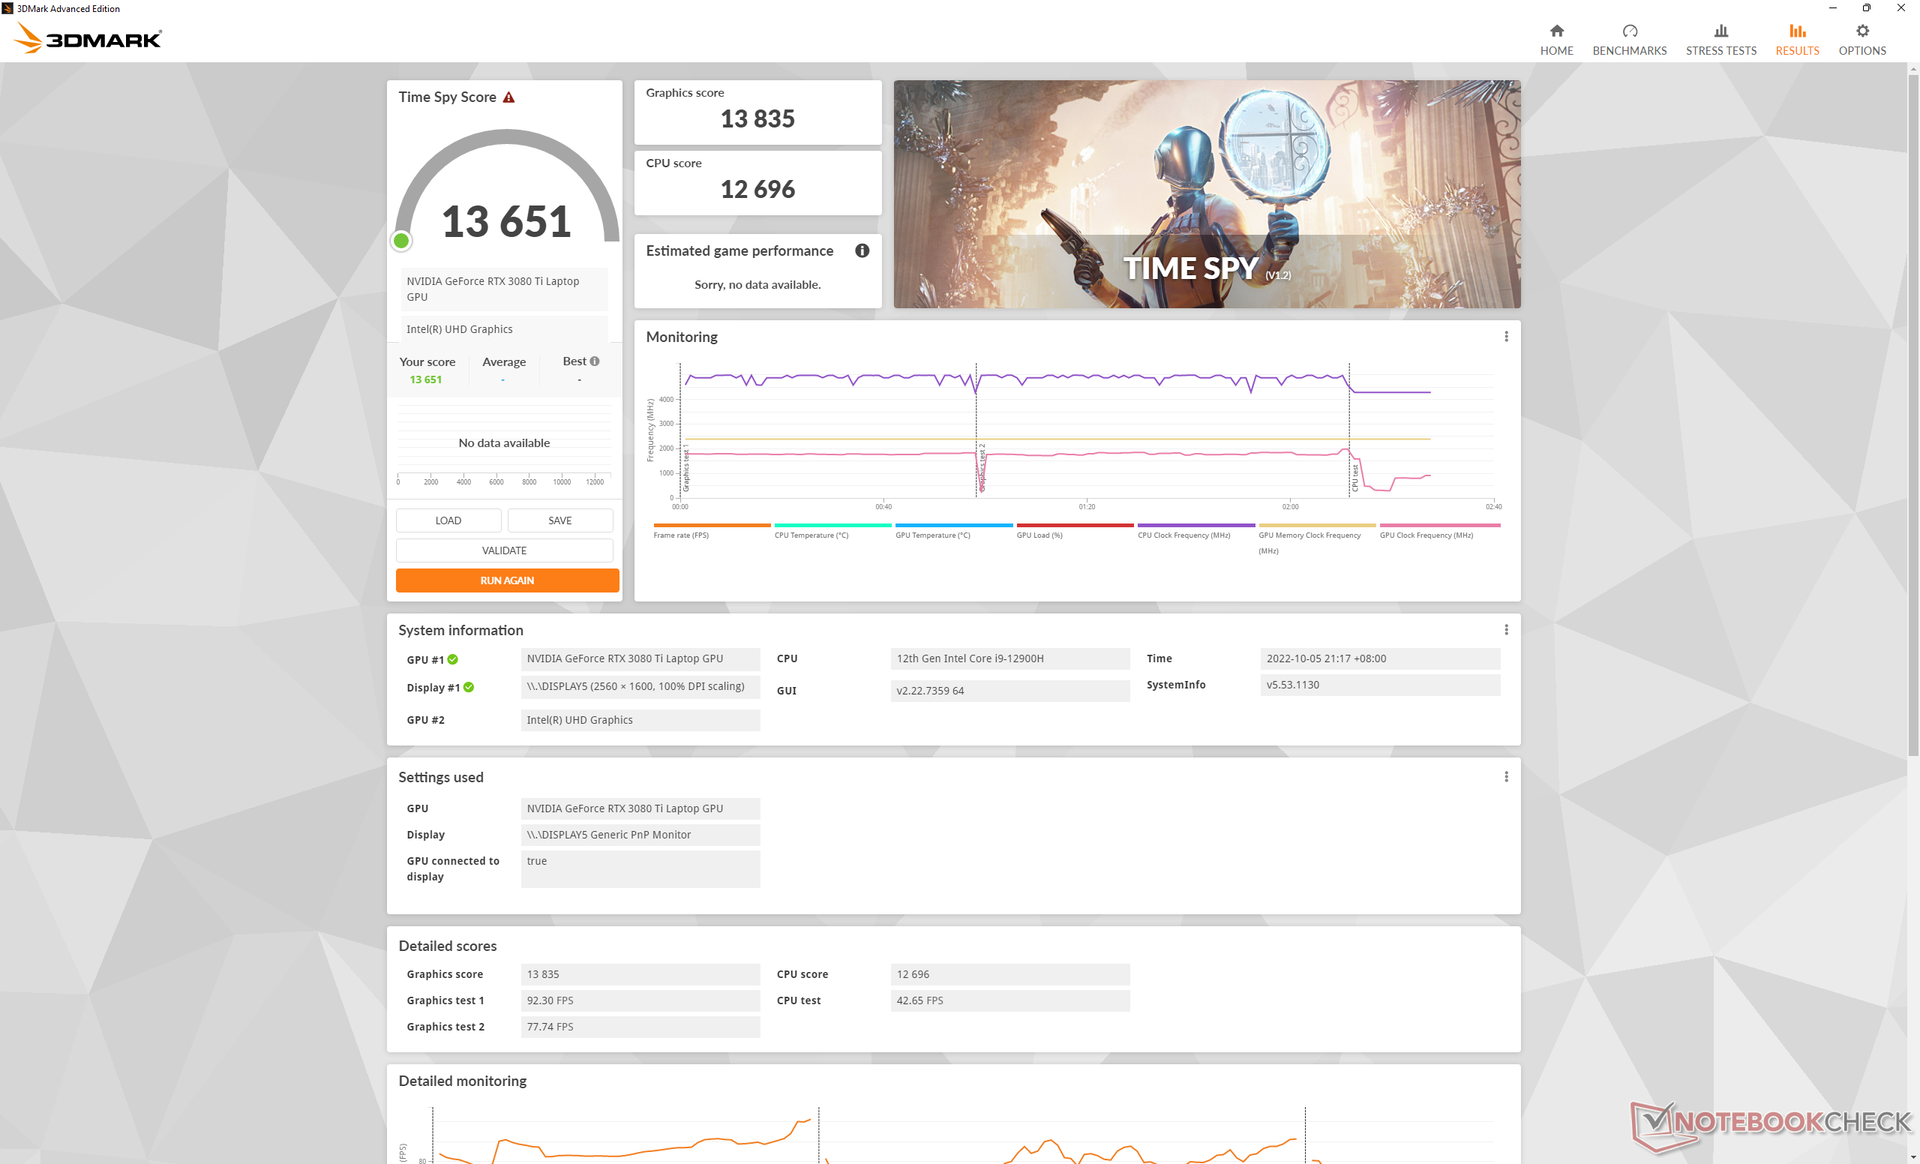
Grafikprestanda är cirka 5 till 15 procent snabbare än den genomsnittliga bärbara datorn i vår databas som är utrustad med samma GeForce RTX 3080 Ti GPU. GPU:n kan köras ännu snabbare om användare väljer att överklocka den ytterligare utöver tillverkarens inställningar
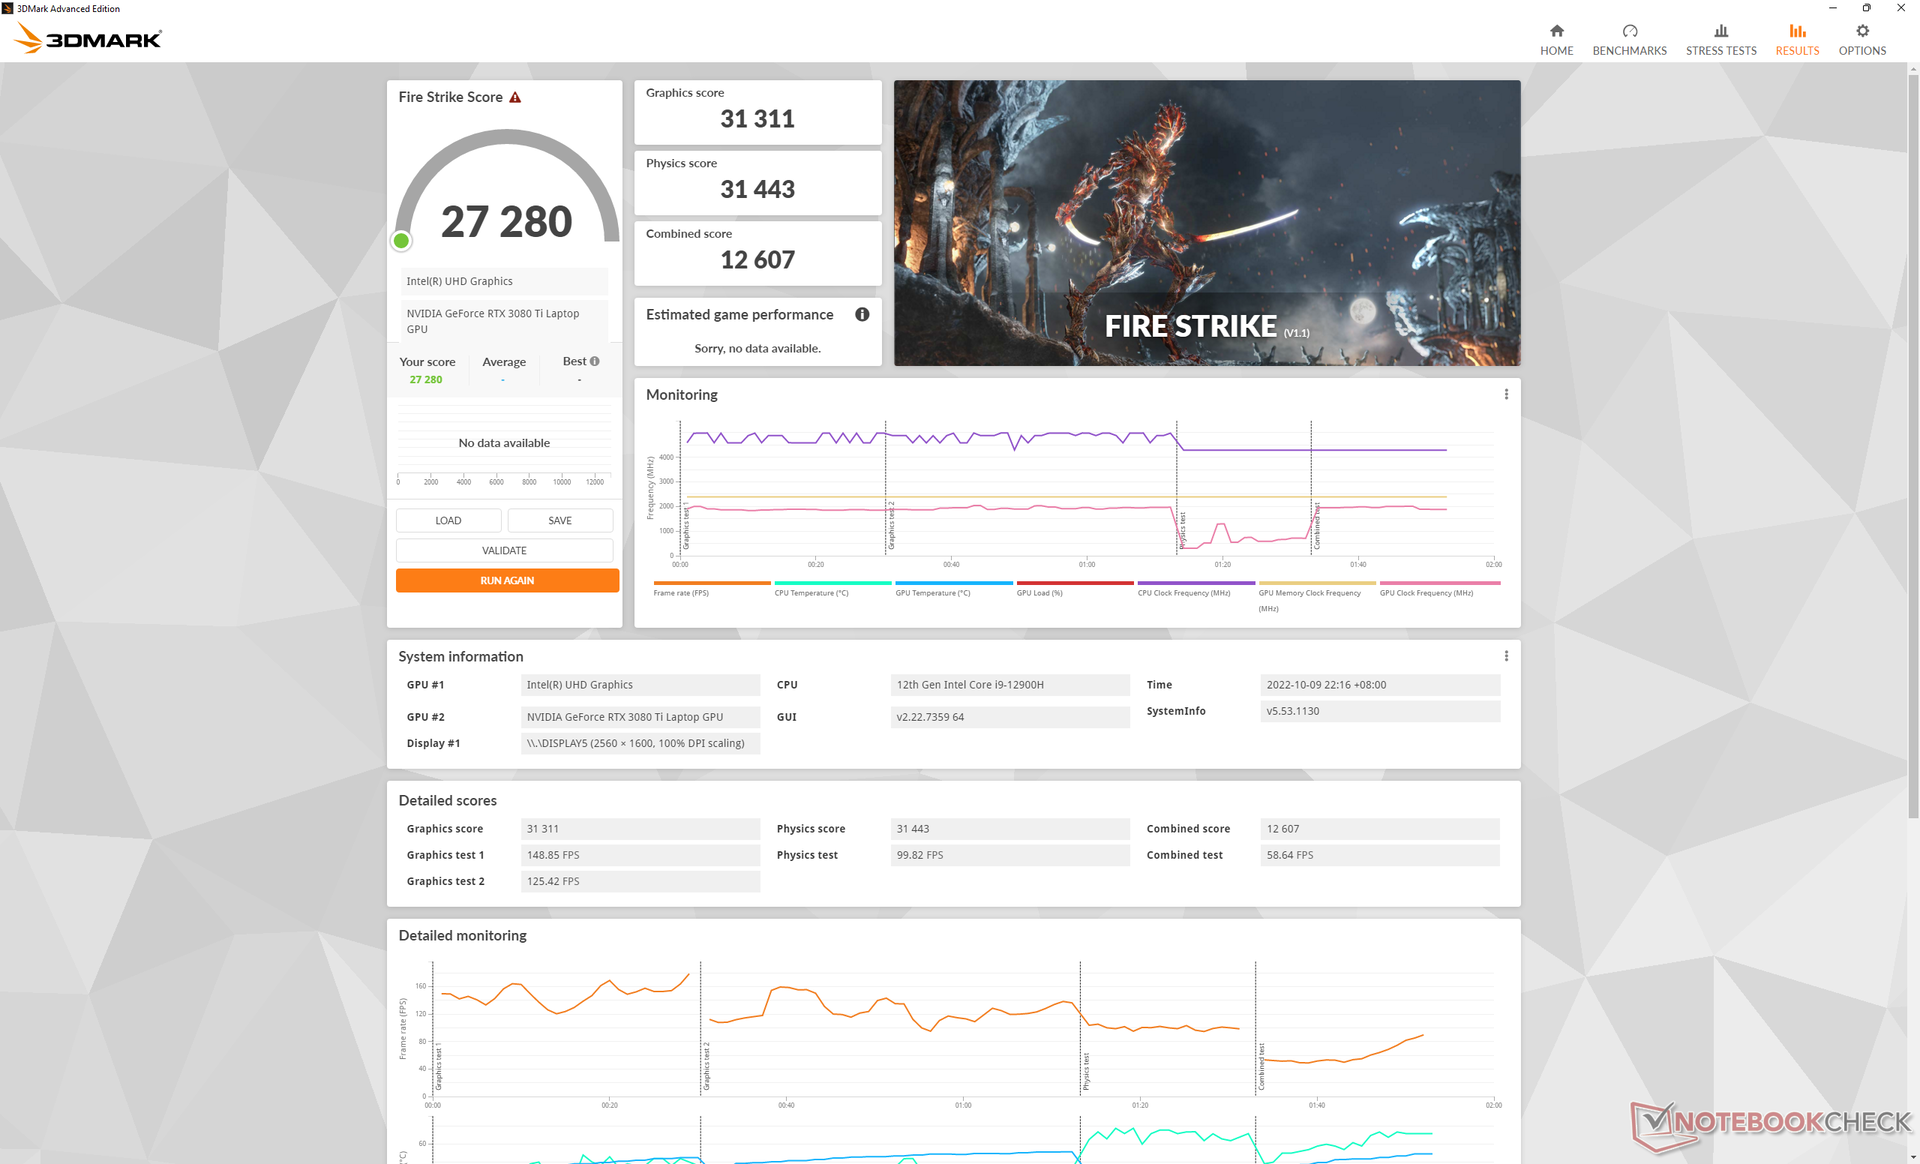
Intressant nog minskar inte grafikprestandan om man kör kylboxen på den lägsta inställningen för fläktnivå. Att köra Fire Strike i läget "Quietest" skulle resultera i fysik- och grafikpoäng på 31443 respektive 31311 poäng, jämfört med 30601 och 30959 poäng i läget "Balanced" för kylboxen. Detta är särskilt viktigt eftersom det innebär att du inte behöver köra systemet på de maximala fläktinställningarna om du inte tänker överklocka GPU:n.
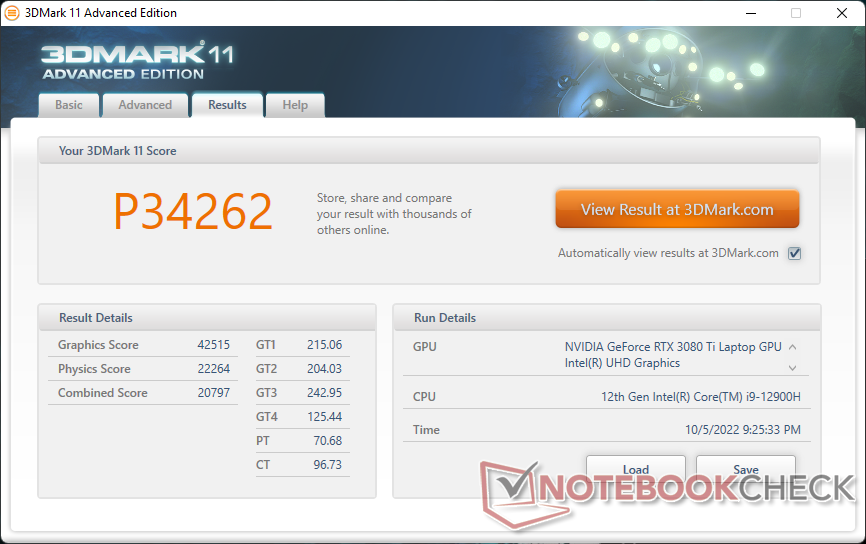

| 3DMark 11 Performance | 34262 poäng | |
| 3DMark Cloud Gate Standard Score | 64248 poäng | |
| 3DMark Fire Strike Score | 27342 poäng | |
| 3DMark Time Spy Score | 13651 poäng | |
Hjälp | ||
| Blender | |
| v3.3 Classroom OPTIX/RTX | |
| Aorus 17X XES | |
| MSI Titan GT77 12UHS | |
| Uniwell Technology GM7AG8N Liquid Cooling Box | |
| v3.3 Classroom CUDA | |
| Aorus 17X XES | |
| Uniwell Technology GM7AG8N Liquid Cooling Box | |
| MSI Titan GT77 12UHS | |
| v3.3 Classroom CPU | |
| Aorus 17X XES | |
| Uniwell Technology GM7AG8N Liquid Cooling Box | |
| MSI Titan GT77 12UHS | |
* ... mindre är bättre
Witcher 3 FPS Chart
| låg | med. | hög | ultra | QHD | |
|---|---|---|---|---|---|
| GTA V (2015) | 184.8 | 181.6 | 177.3 | 123.3 | 112.6 |
| The Witcher 3 (2015) | 464.9 | 366.2 | 257.5 | 127.2 | |
| Dota 2 Reborn (2015) | 171.3 | 158.9 | 152.3 | 145.3 | |
| Final Fantasy XV Benchmark (2018) | 188.7 | 164.4 | 122.7 | 97 | |
| X-Plane 11.11 (2018) | 149.2 | 133.8 | 106.2 | ||
| Strange Brigade (2018) | 448 | 311 | 255 | 224 | 166.8 |
| Cyberpunk 2077 1.6 (2022) | 144.9 | 140.1 | 115.8 | 96.7 | 63.3 |
Utsläpp
Systembrus
Som tidigare nämnts har kylboxen tre fläktlägen: Lättare, tystare och balanserad. Fläktljudet på "Quietest" är redan ganska högt med 41,6 dB(A), vilket är lika högt som de flesta Ultrabooks när de körs med hög belastning. Om du höjer den till läget "Quiet" och "Balanced" ökar fläktljudet till 44,2 dB(A) respektive 45,8 dB(A). Vi rekommenderar att du placerar kylboxen så långt bak som möjligt från ditt säte för att minska ljudnivåerna.
Det finns en fjärde effektprofil i Control Center-programvaran som heter "Fan Boost", där de interna fläktarna körs på maximalt varvtal. När både "Fan Boost" och kylboxens "Balanced"-läge är aktiva kan det totala systemljudet vara så högt som 55,9 dB(A), vilket faktiskt är mycket likt de flesta "vanliga" bärbara 17-tums gamingdatorer utan externa kylningslösningar.
Den stora kicken här är att du inte behöver aktivera Fan Boost eller ha kylboxen på sin högsta inställning för att köra CPU eller GPU vid standardhastigheter. Däremot kräver de flesta andra bärbara speldatorer som Asus Zephyrus S17 eller Razer Blade 17 att användaren aktiverar Turbo Mode, annars kommer TGP att strypas när du spelar. Detta innebär att Uniwell-ägare kan köra kylboxen i det "tystaste" läget på 41,6 dB(A) för att få bättre än genomsnittlig spelprestanda för RTX 3080 Ti, medan de flesta andra bärbara datorer för spel måste utstå ett fläktljud på 50 dB(A) eller högre bara för att komma i närheten av Uniwells prestanda. Kort sagt kan kylboxen göra nästan allt kylningsarbete även när man spelar med de tystaste fläktinställningarna utan att behöva strypa CPU eller GPU.
Ljudnivå
| Låg belastning |
| 41.6 / 42.1 / 42.1 dB(A) |
| Hög belastning |
| 42.2 / 55.9 dB(A) |
 | ||
30 dB tyst 40 dB(A) hörbar 50 dB(A) högt ljud |
||
min: | ||
| Uniwell Technology GM7AG8N Liquid Cooling Box GeForce RTX 3080 Ti Laptop GPU, i9-12900H, Samsung PM9A1 MZVL21T0HCLR | MSI Titan GT77 12UHS GeForce RTX 3080 Ti Laptop GPU, i9-12900HX, Samsung PM9A1 MZVL21T0HCLR | Aorus 17X XES GeForce RTX 3070 Ti Laptop GPU, i9-12900HX, Gigabyte AG470S1TB-SI B10 | Razer Blade 17 Early 2022 GeForce RTX 3080 Ti Laptop GPU, i9-12900H, Samsung PM9A1 MZVL21T0HCLR | MSI Stealth GS77 12UHS-083US GeForce RTX 3080 Ti Laptop GPU, i7-12700H, Micron 3400 1TB MTFDKBA1T0TFH | Asus ROG Zephyrus S17 GX703HSD GeForce RTX 3080 Laptop GPU, i9-11900H, Samsung PM9A1 MZVL22T0HBLB | |
|---|---|---|---|---|---|---|
| Noise | 17% | 5% | 12% | 19% | 23% | |
| av / miljö * (dB) | 22.8 | 21.9 4% | 26 -14% | 26 -14% | 24.5 -7% | 23 -1% |
| Idle Minimum * (dB) | 41.6 | 24.53 41% | 28 33% | 26 37% | 24.5 41% | 23 45% |
| Idle Average * (dB) | 42.1 | 24.53 42% | 32 24% | 27 36% | 24.5 42% | 23 45% |
| Idle Maximum * (dB) | 42.1 | 24.53 42% | 38 10% | 32 24% | 30.8 27% | 23 45% |
| Load Average * (dB) | 42.2 | 46.25 -10% | 53 -26% | 50 -18% | 34.6 18% | 41 3% |
| Witcher 3 ultra * (dB) | 55.9 | 56.86 -2% | 54 3% | 51 9% | 46.2 17% | 45 19% |
| Load Maximum * (dB) | 55.9 | 54.25 3% | 55 2% | 51 9% | 56.8 -2% | 52 7% |
* ... mindre är bättre
Temperatur - att hålla den sval
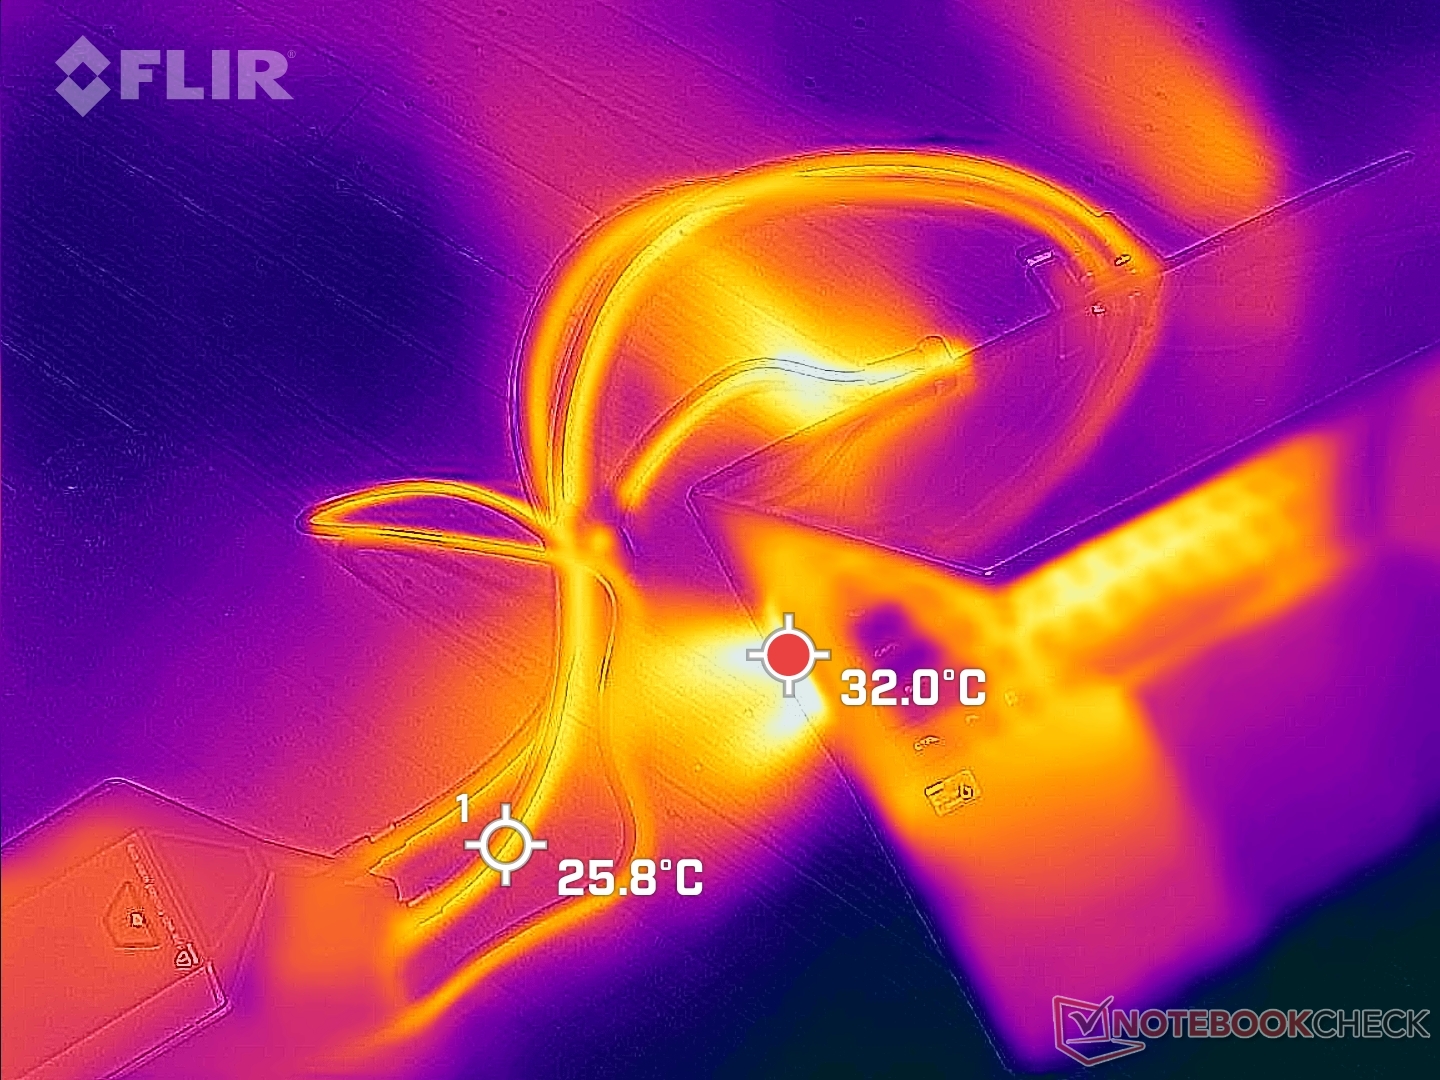
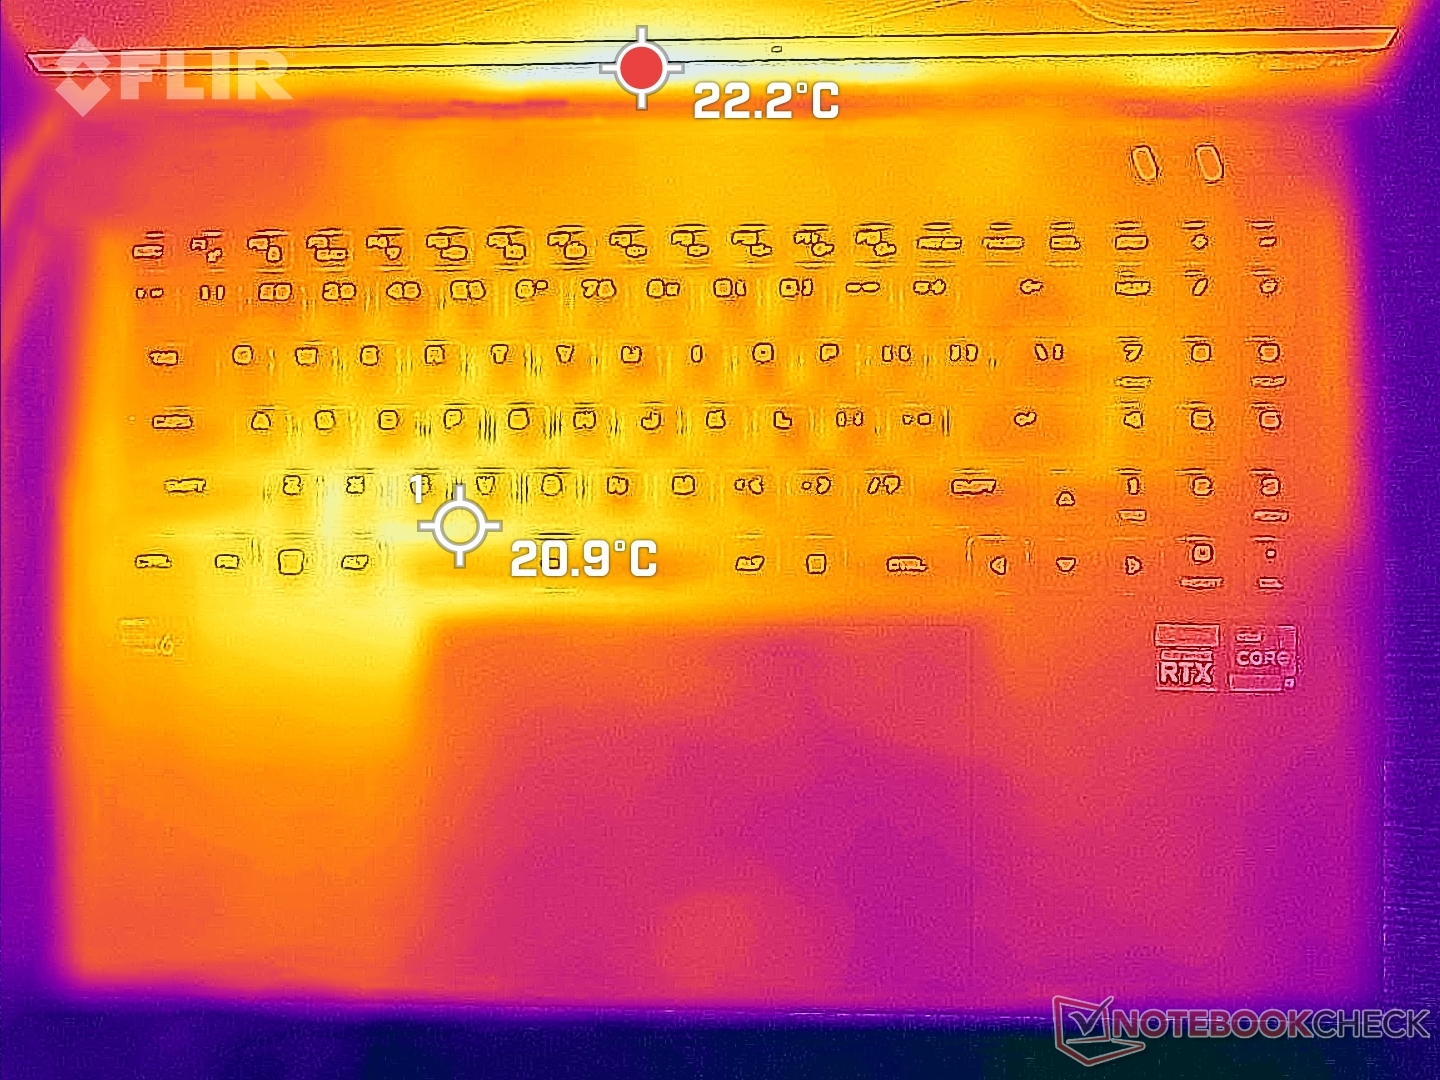
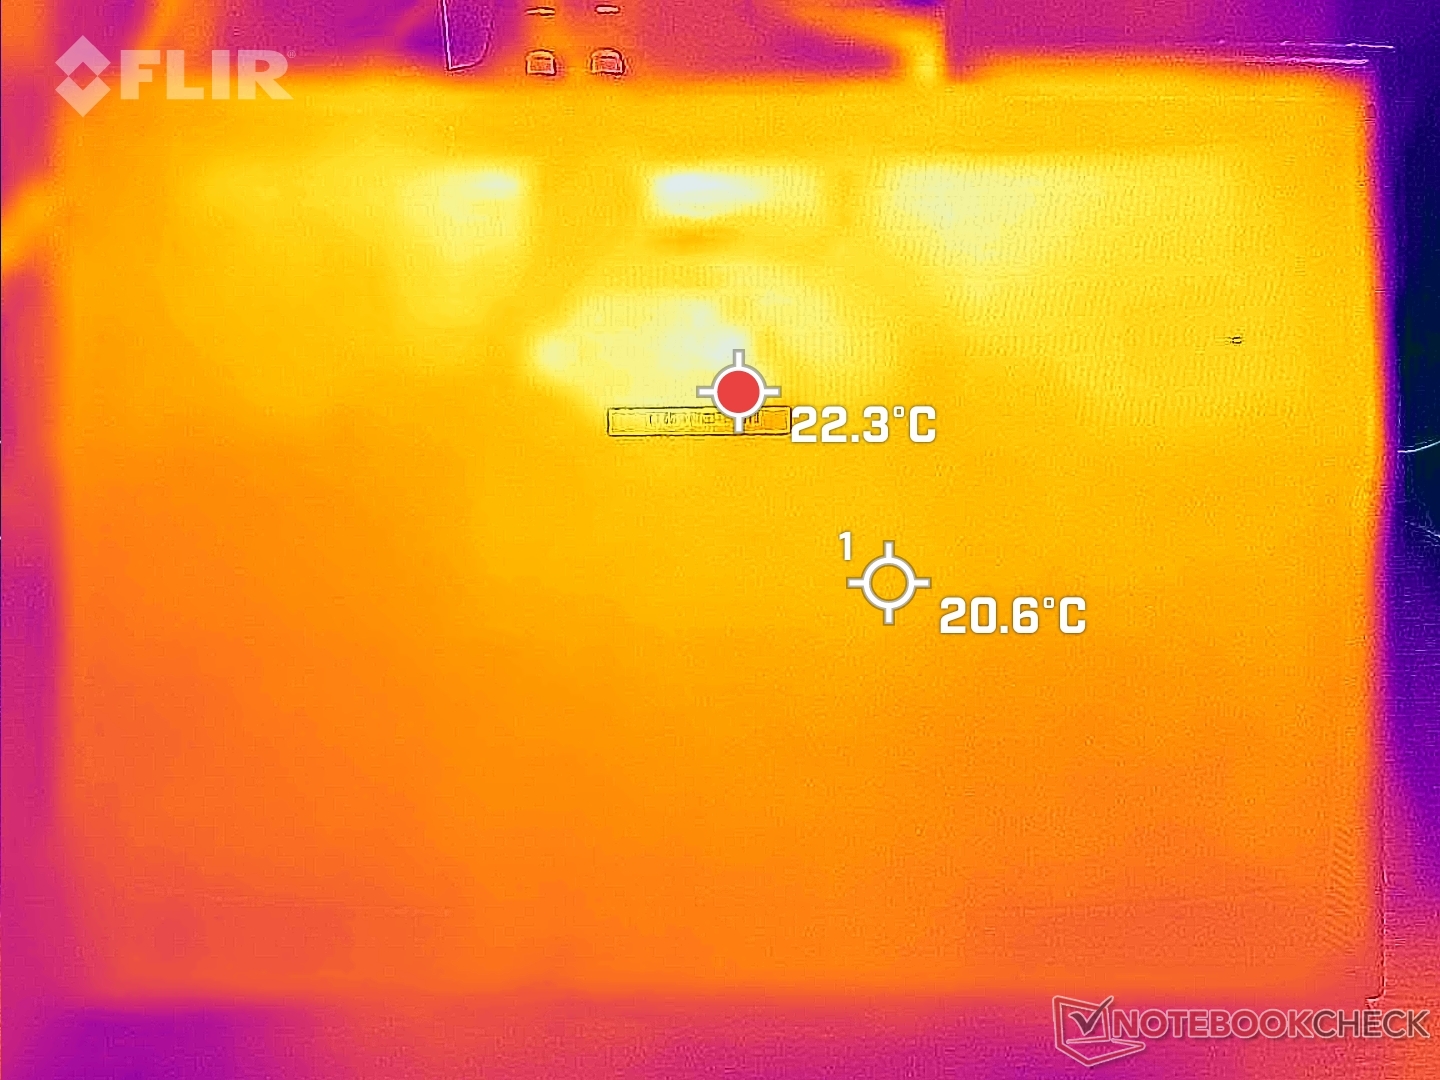
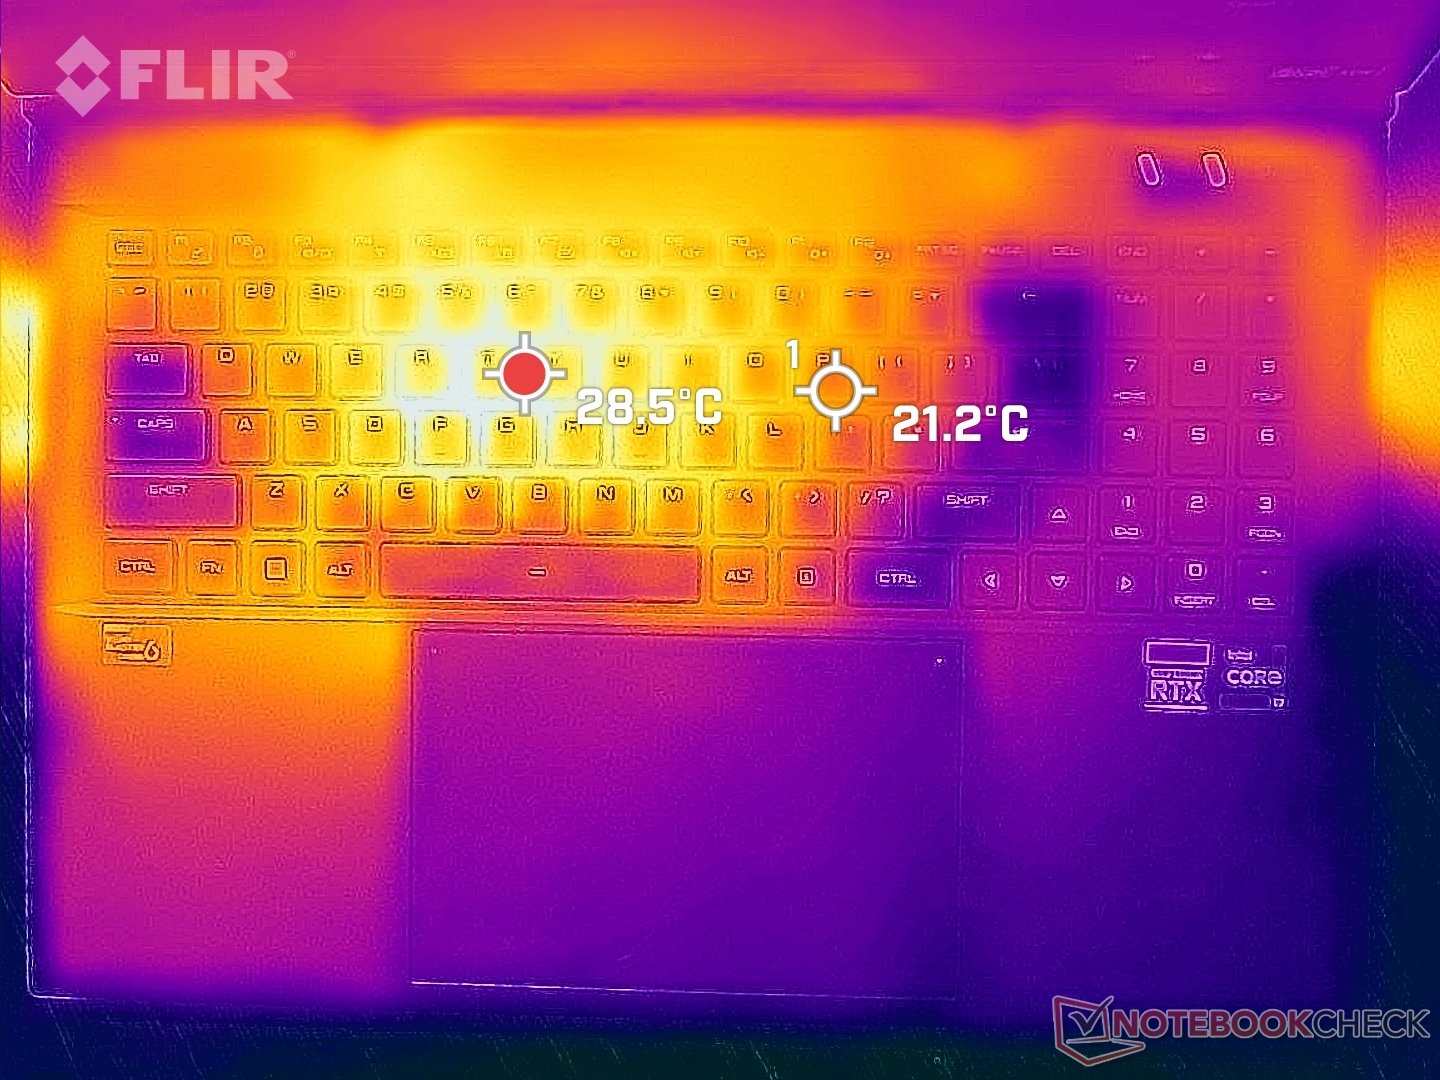
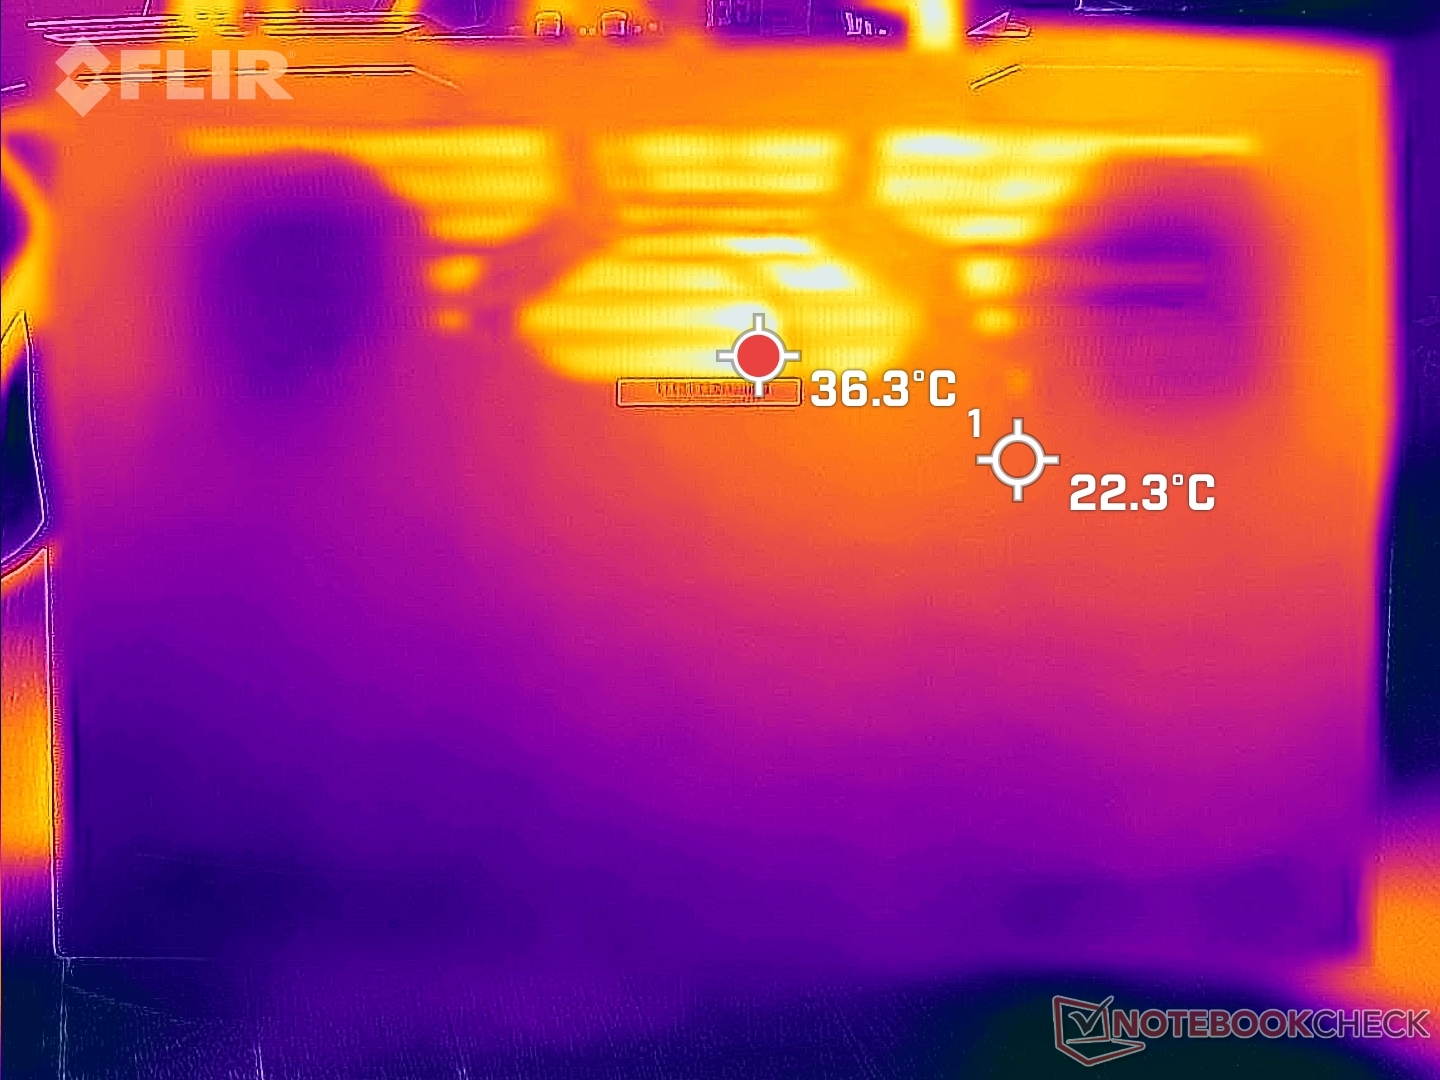
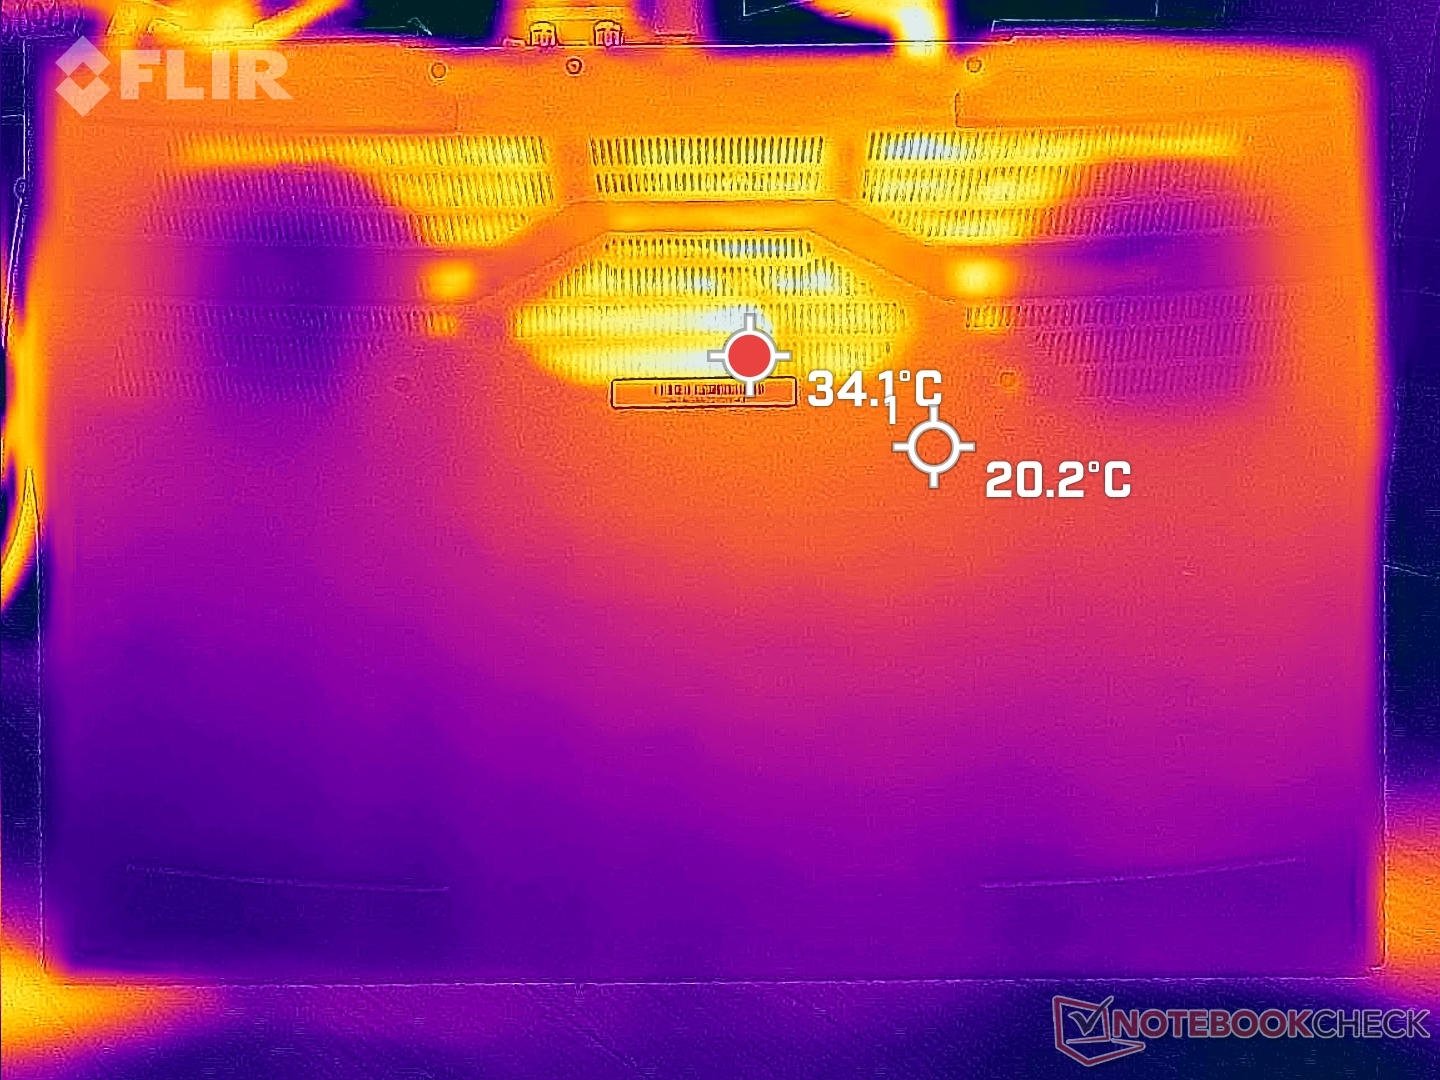
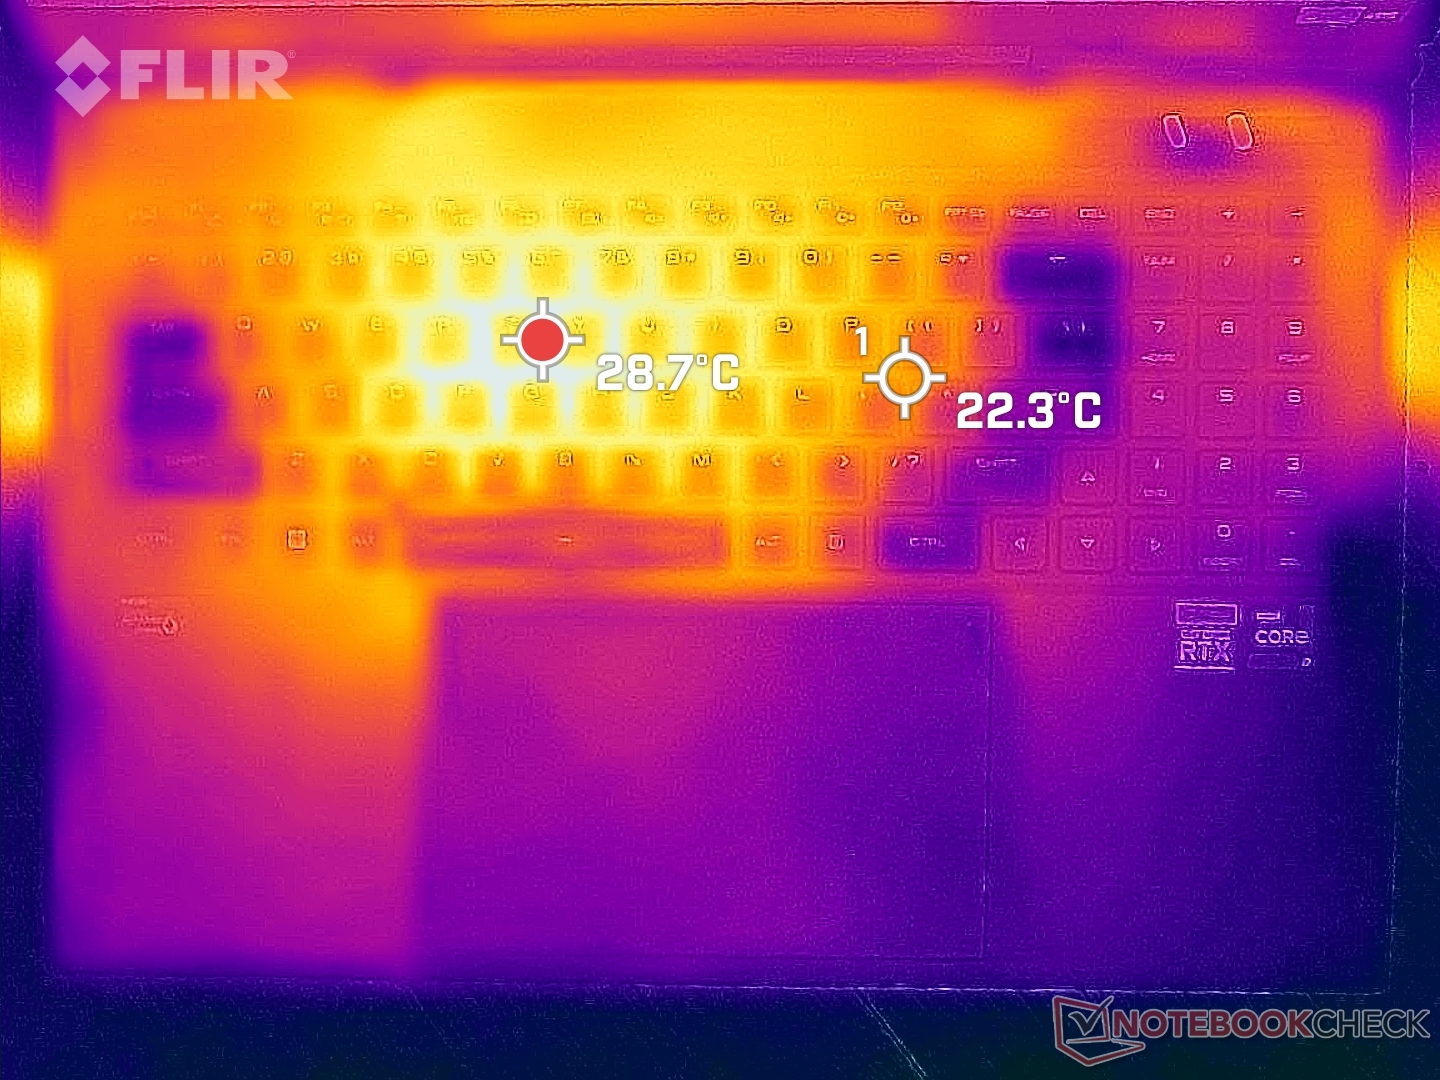
Yttemperaturen är den svalaste vi någonsin har registrerat på en bärbar dator för spel. Vid 100 procent CPU- och GPU-användning når de varma punkterna på toppen och botten endast 32 C respektive 30 C, jämfört med 50 C till 60+ C på MSI Stealth GS77. Den genomsnittliga temperaturökningen är endast cirka 3 C jämfört med ett tomgångstillstånd. Kylboxen är anmärkningsvärd när det gäller att hålla temperaturen i schack.
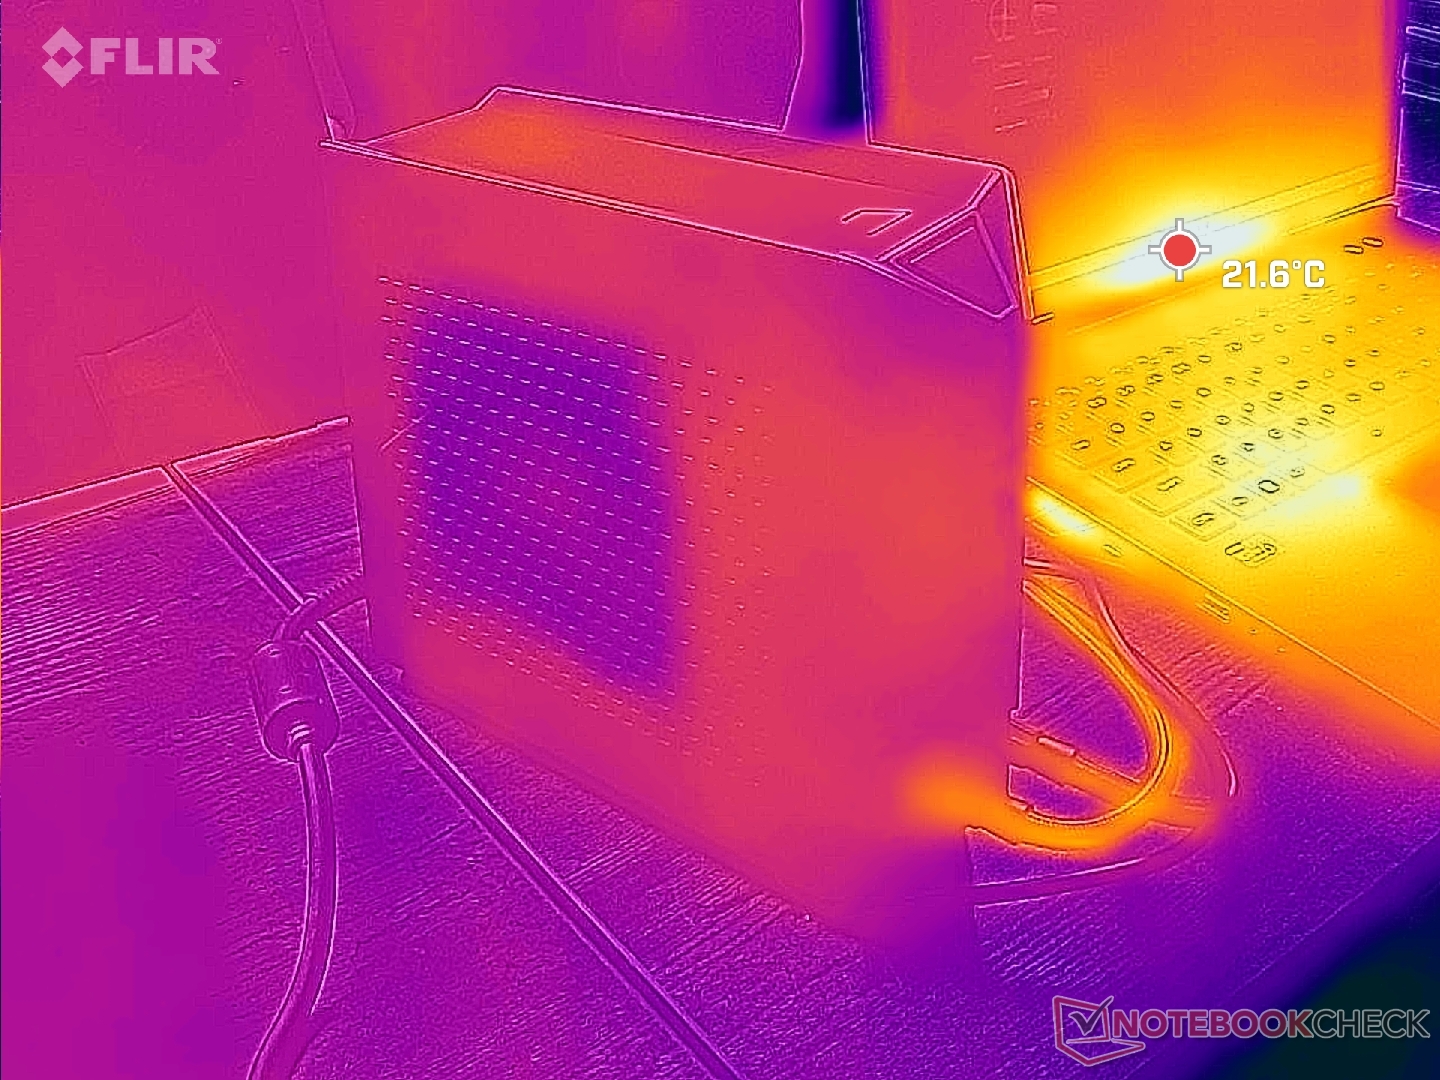
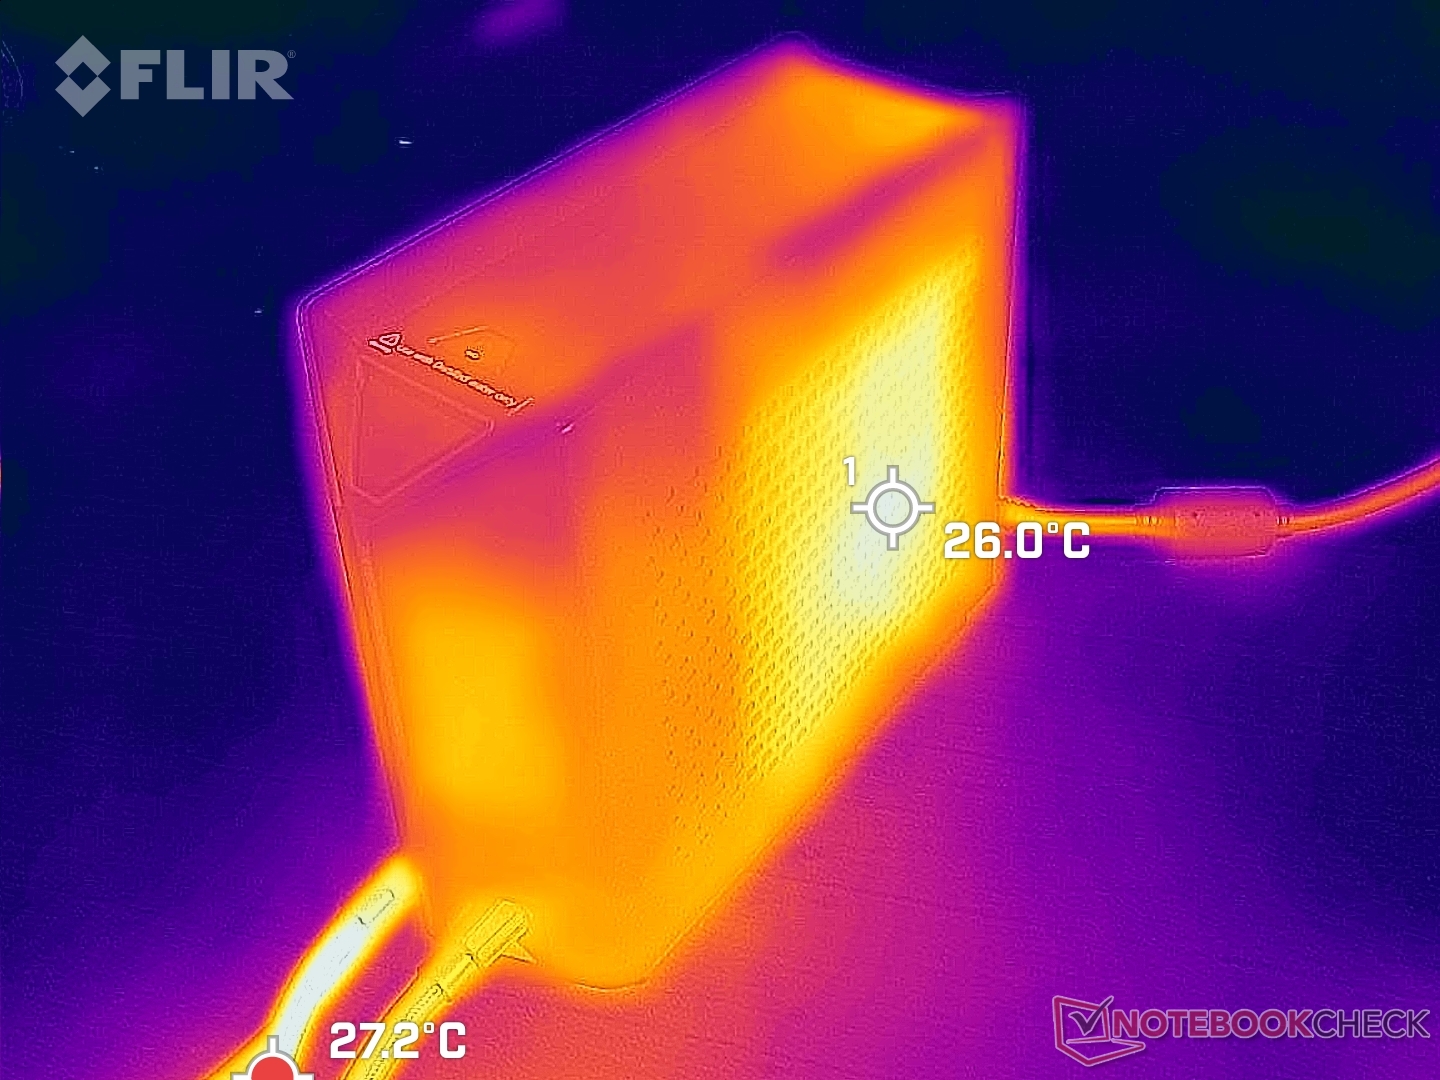
(+) Den maximala temperaturen på ovansidan är 32 °C / 90 F, jämfört med genomsnittet av 40.4 °C / 105 F , allt från 21.2 till 68.8 °C för klassen Gaming.
(+) Botten värms upp till maximalt 30 °C / 86 F, jämfört med genomsnittet av 43.2 °C / 110 F
(+) Vid tomgångsbruk är medeltemperaturen för ovansidan 24.5 °C / 76 F, jämfört med enhetsgenomsnittet på 33.9 °C / ### class_avg_f### F.
(+) När du spelar The Witcher 3 är medeltemperaturen för ovansidan 27.2 °C / 81 F, jämfört med enhetsgenomsnittet på 33.9 °C / ## #class_avg_f### F.
(+) Handledsstöden och pekplattan är kallare än hudtemperaturen med maximalt 25.2 °C / 77.4 F och är därför svala att ta på.
(+) Medeltemperaturen för handledsstödsområdet på liknande enheter var 28.8 °C / 83.8 F (+3.6 °C / 6.4 F).
| Uniwell Technology GM7AG8N Liquid Cooling Box Intel Core i9-12900H, NVIDIA GeForce RTX 3080 Ti Laptop GPU | MSI Titan GT77 12UHS Intel Core i9-12900HX, NVIDIA GeForce RTX 3080 Ti Laptop GPU | Aorus 17X XES Intel Core i9-12900HX, NVIDIA GeForce RTX 3070 Ti Laptop GPU | Razer Blade 17 Early 2022 Intel Core i9-12900H, NVIDIA GeForce RTX 3080 Ti Laptop GPU | MSI Stealth GS77 12UHS-083US Intel Core i7-12700H, NVIDIA GeForce RTX 3080 Ti Laptop GPU | Asus ROG Zephyrus S17 GX703HSD Intel Core i9-11900H, NVIDIA GeForce RTX 3080 Laptop GPU | |
|---|---|---|---|---|---|---|
| Heat | -47% | -65% | -58% | -55% | -59% | |
| Maximum Upper Side * (°C) | 32 | 40.8 -27% | 54 -69% | 50 -56% | 50.6 -58% | 59 -84% |
| Maximum Bottom * (°C) | 30 | 52.4 -75% | 58 -93% | 56 -87% | 59.6 -99% | 53 -77% |
| Idle Upper Side * (°C) | 26.4 | 34.6 -31% | 37 -40% | 36 -36% | 30 -14% | 35 -33% |
| Idle Bottom * (°C) | 25 | 38.4 -54% | 39 -56% | 38 -52% | 37.4 -50% | 35 -40% |
* ... mindre är bättre
Stresstest - mycket utrymme för överklockning
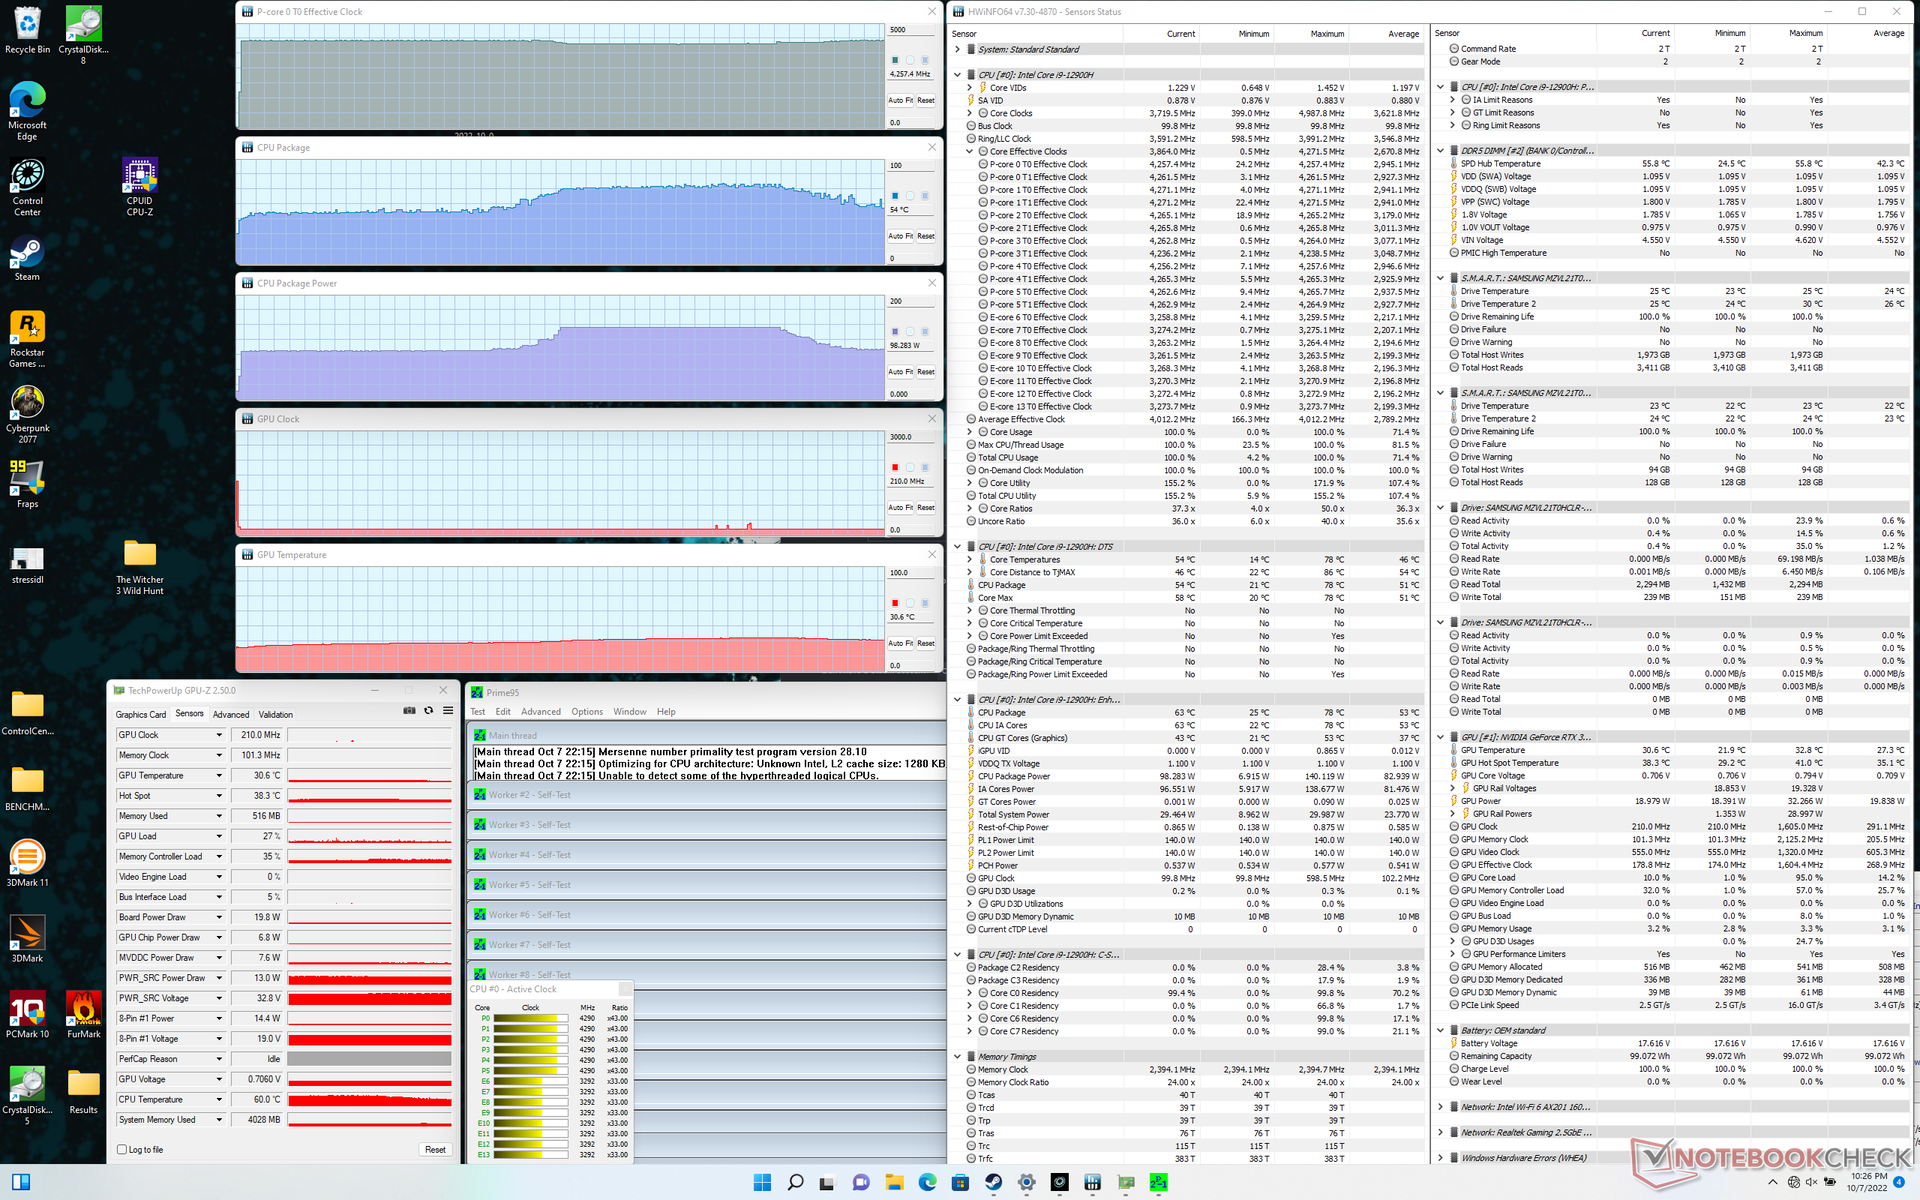
Systemet uppvisar inga problem med att upprätthålla en hög Turbo Boost-klockfrekvens på 4,3 GHz när kylboxen och de interna fläktarna är inställda på sina respektive maxnivåer. Processorn skulle stabilisera sig vid en hög klockfrekvens på 4,3 GHz, en låg kärntemperatur på 54 C och ett högt effektuttag på 98 W när Prime95 körs. Samma Prime95-test på MSI Vector GP66 med exakt samma CPU skulle resultera i långsammare kärnklockfrekvens, högre temperatur och lägre strömförbrukning på 3,0 GHz, 90 C respektive 70 W.
Temperaturen och strömförbrukningen när Prime95 kördes kunde ibland stiga till 78 C respektive 140 W utan att klockfrekvensen påverkades. Vi är inte säkra på varför detta inträffar, men det är ändå anmärkningsvärt
GPU:n skulle stabiliseras vid 1890 MHz, 2125 MHz VRAM, 55 C och 163 W (mot dess nominella TGP på 175 W) när man körde Witcher 3. Att upprepa det här testet på MSI GS77 med samma 3080 Ti GPU skulle resultera i en långsammare klockfrekvens på 1432 MHz och 1750 MHz VRAM, en varmare temperatur på 75 C och ett lägre effektuttag på 105 W. Fördelarna med en extern vattenkylningsbox är mycket tydliga i det här avseendet.
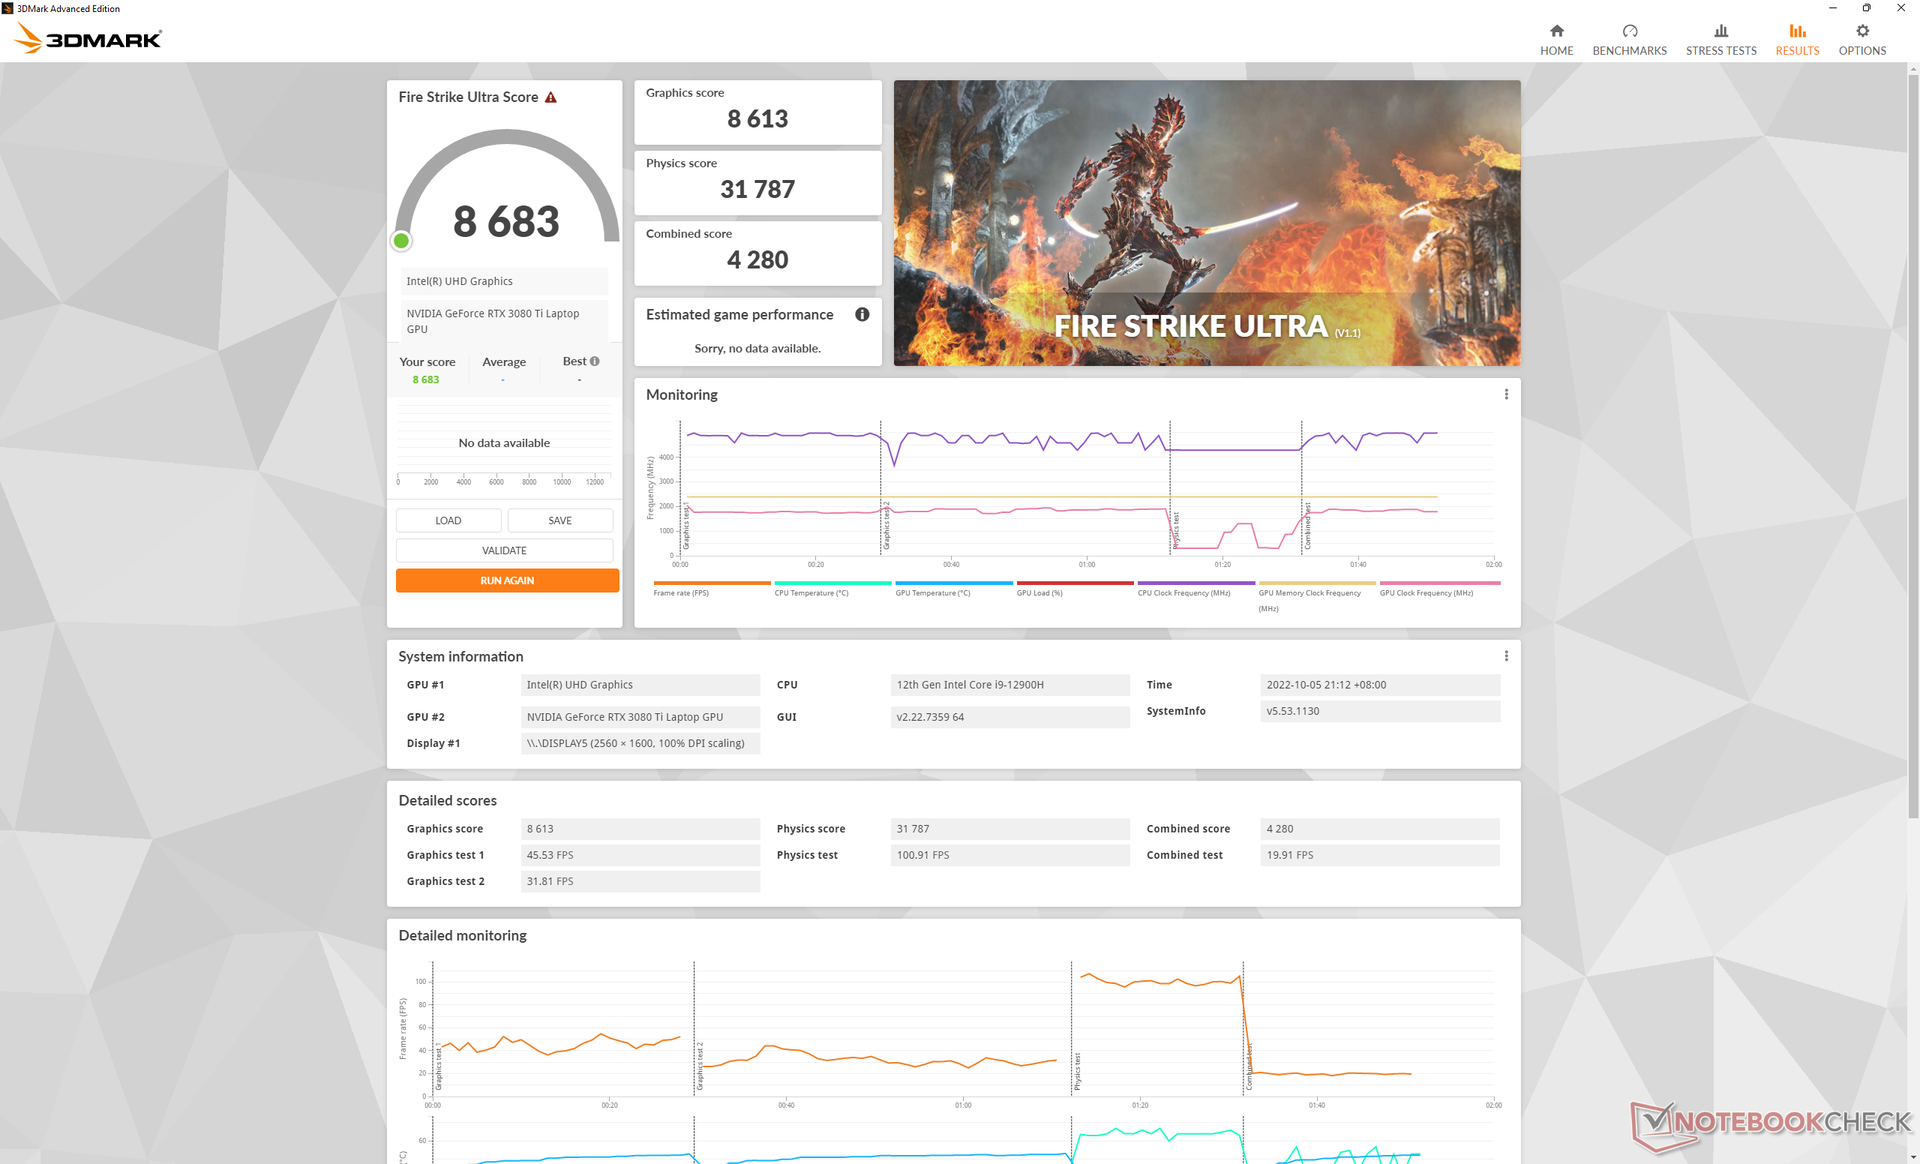
Att köra på batteri begränsar prestandan som man kan förvänta sig. Ett Fire Strike -test på batterier skulle ge fysik- och grafikresultat på bara 11276 respektive 4393 poäng, jämfört med 30601 respektive 30959 poäng när det är på nätet.
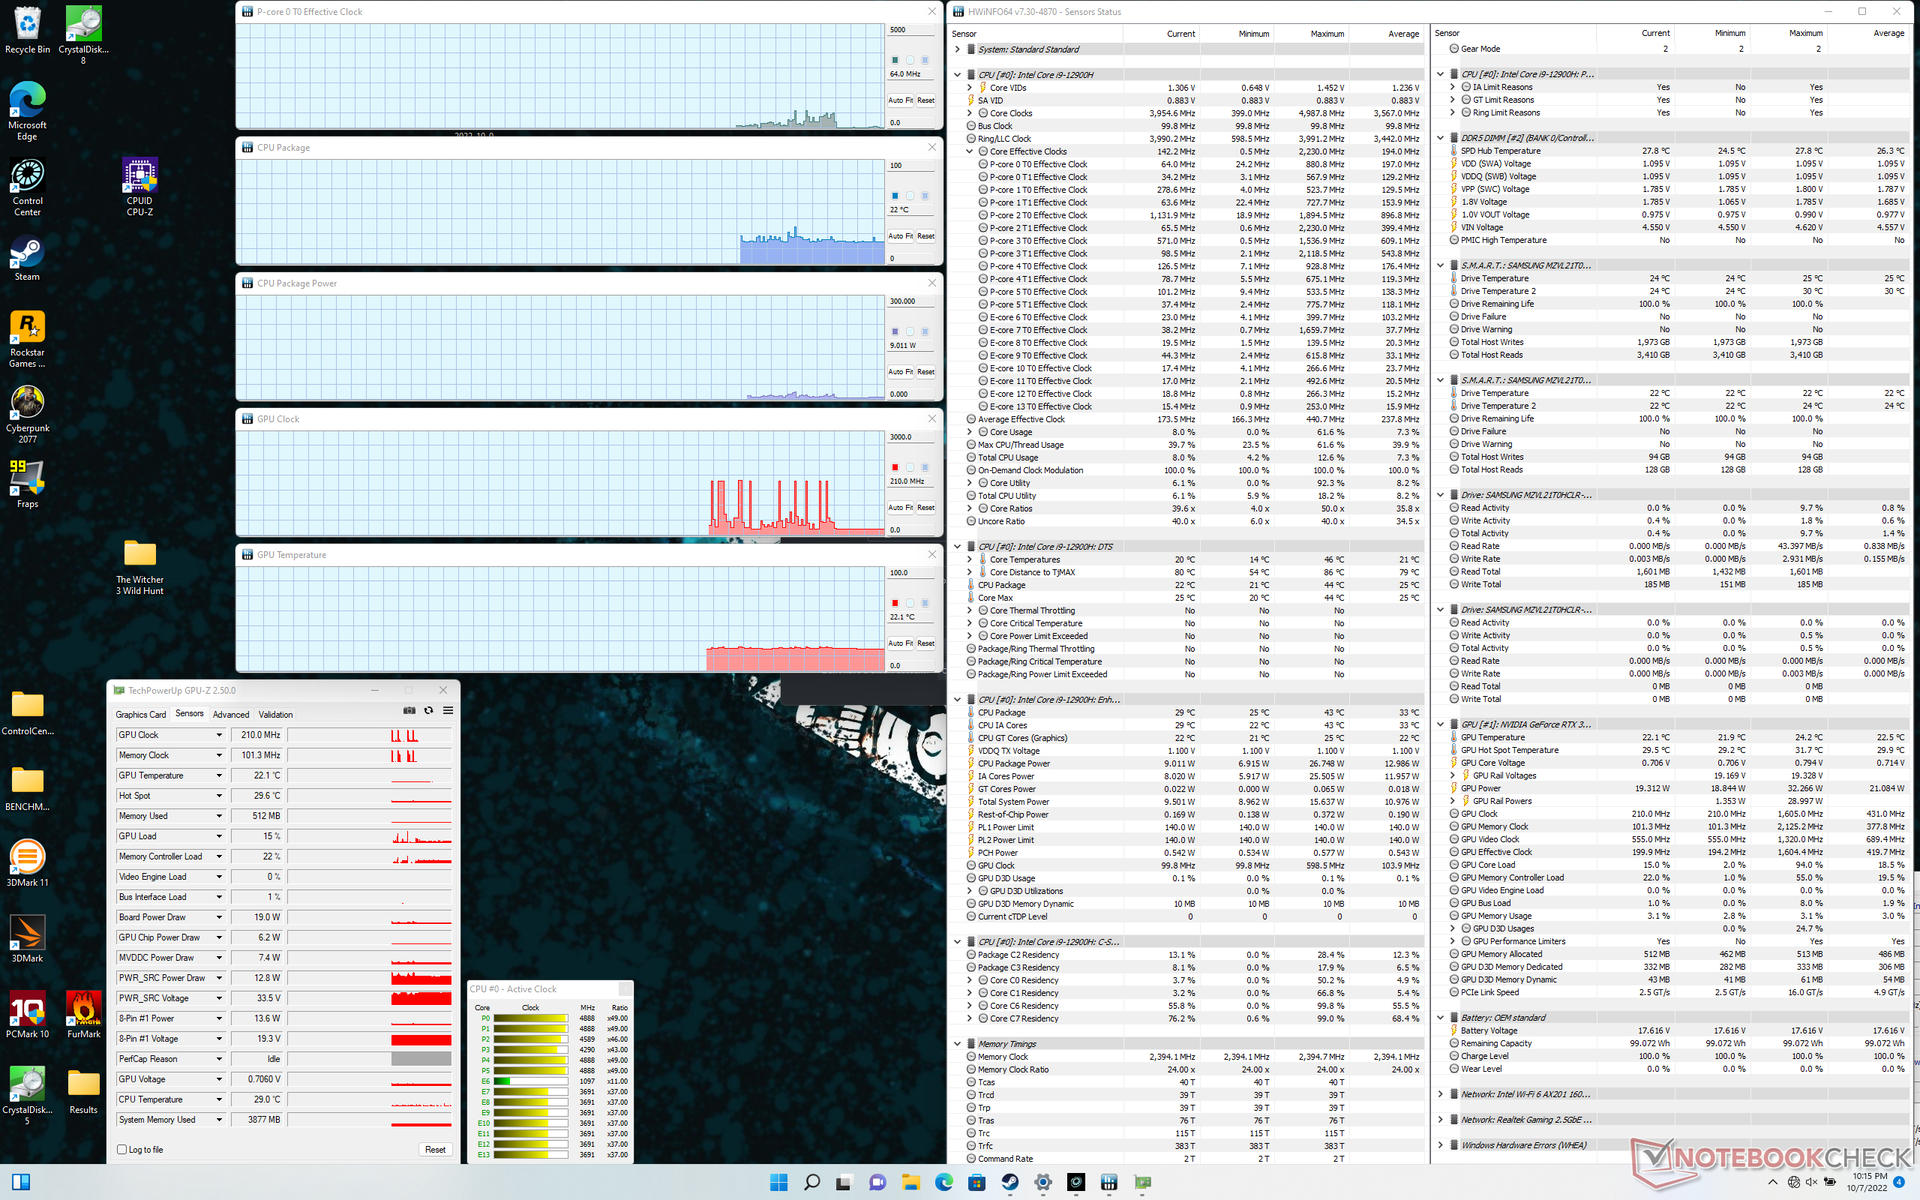
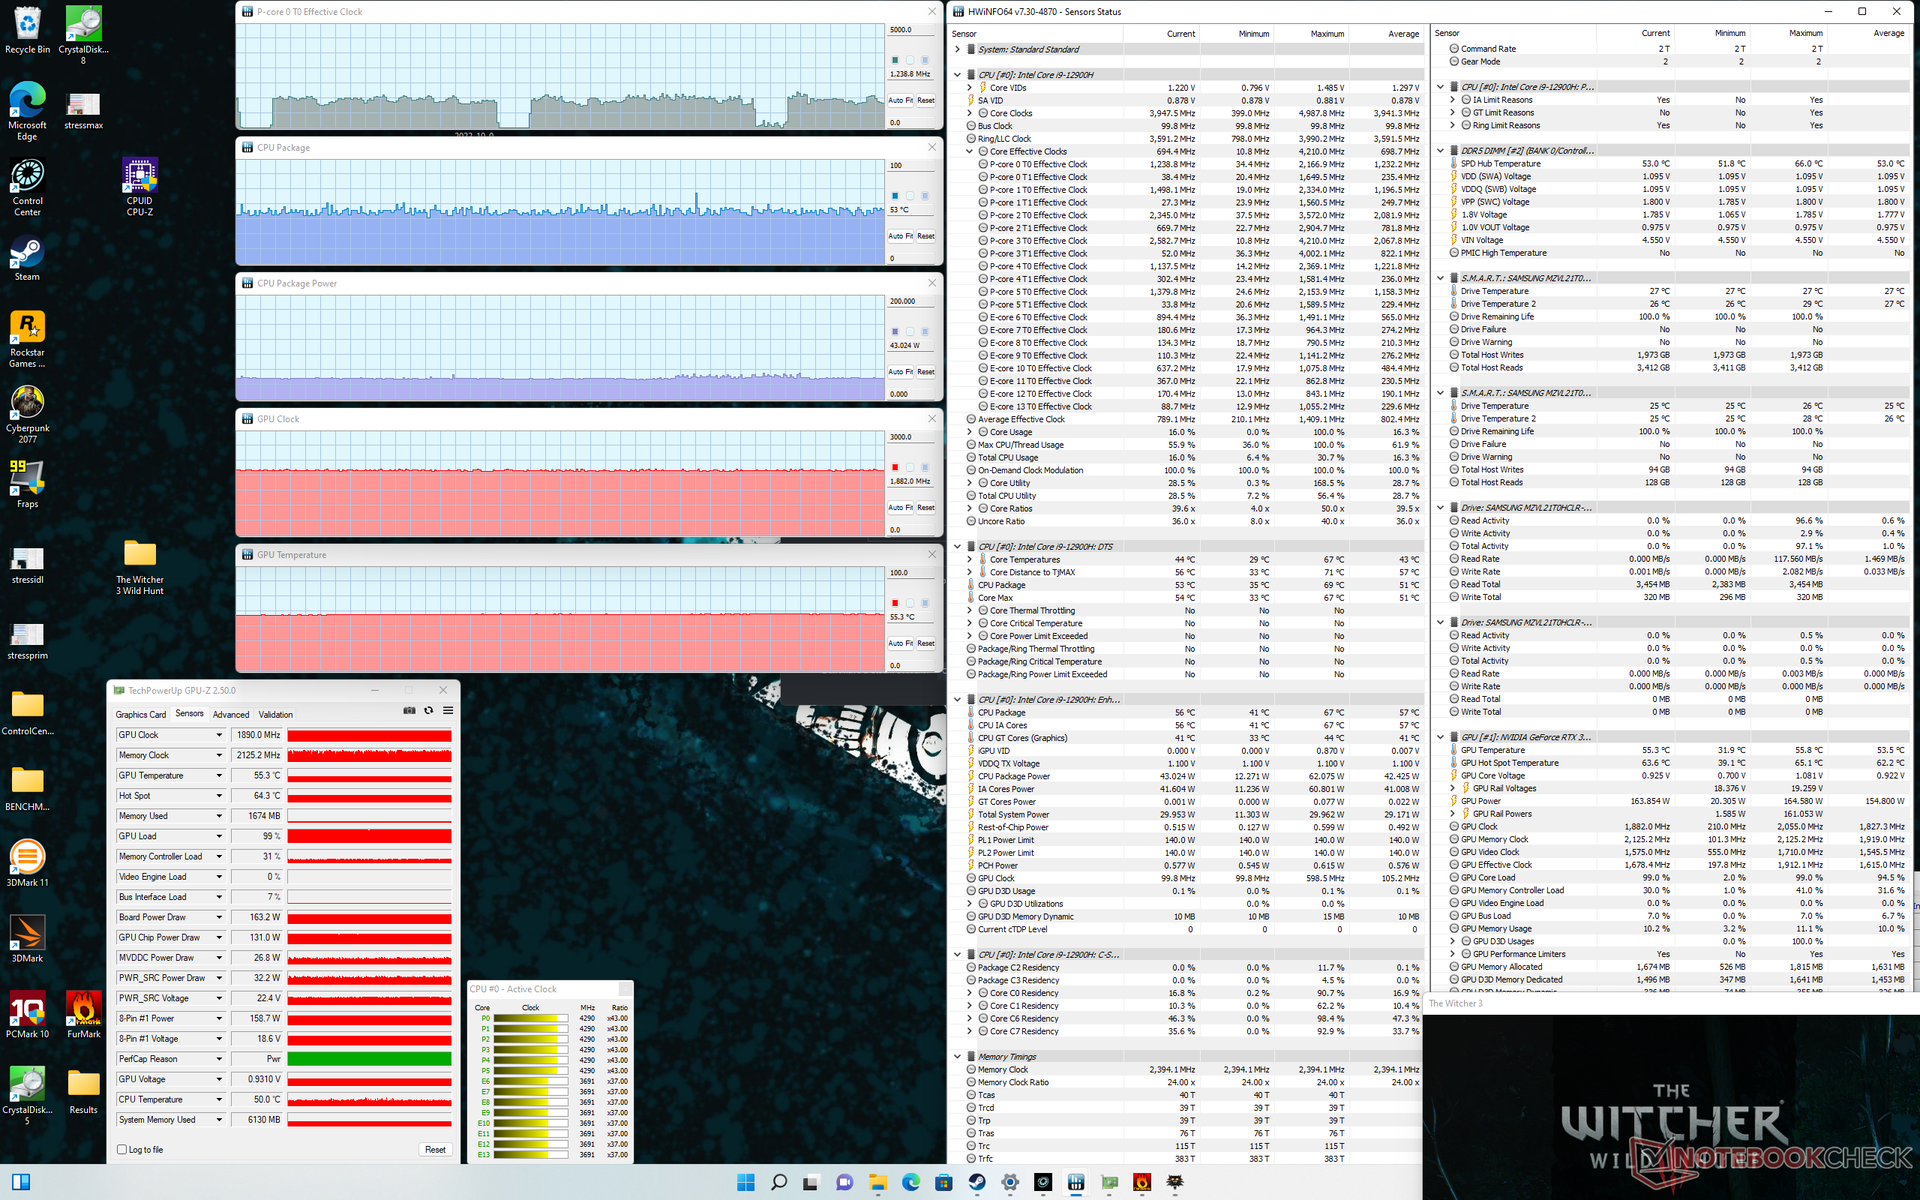
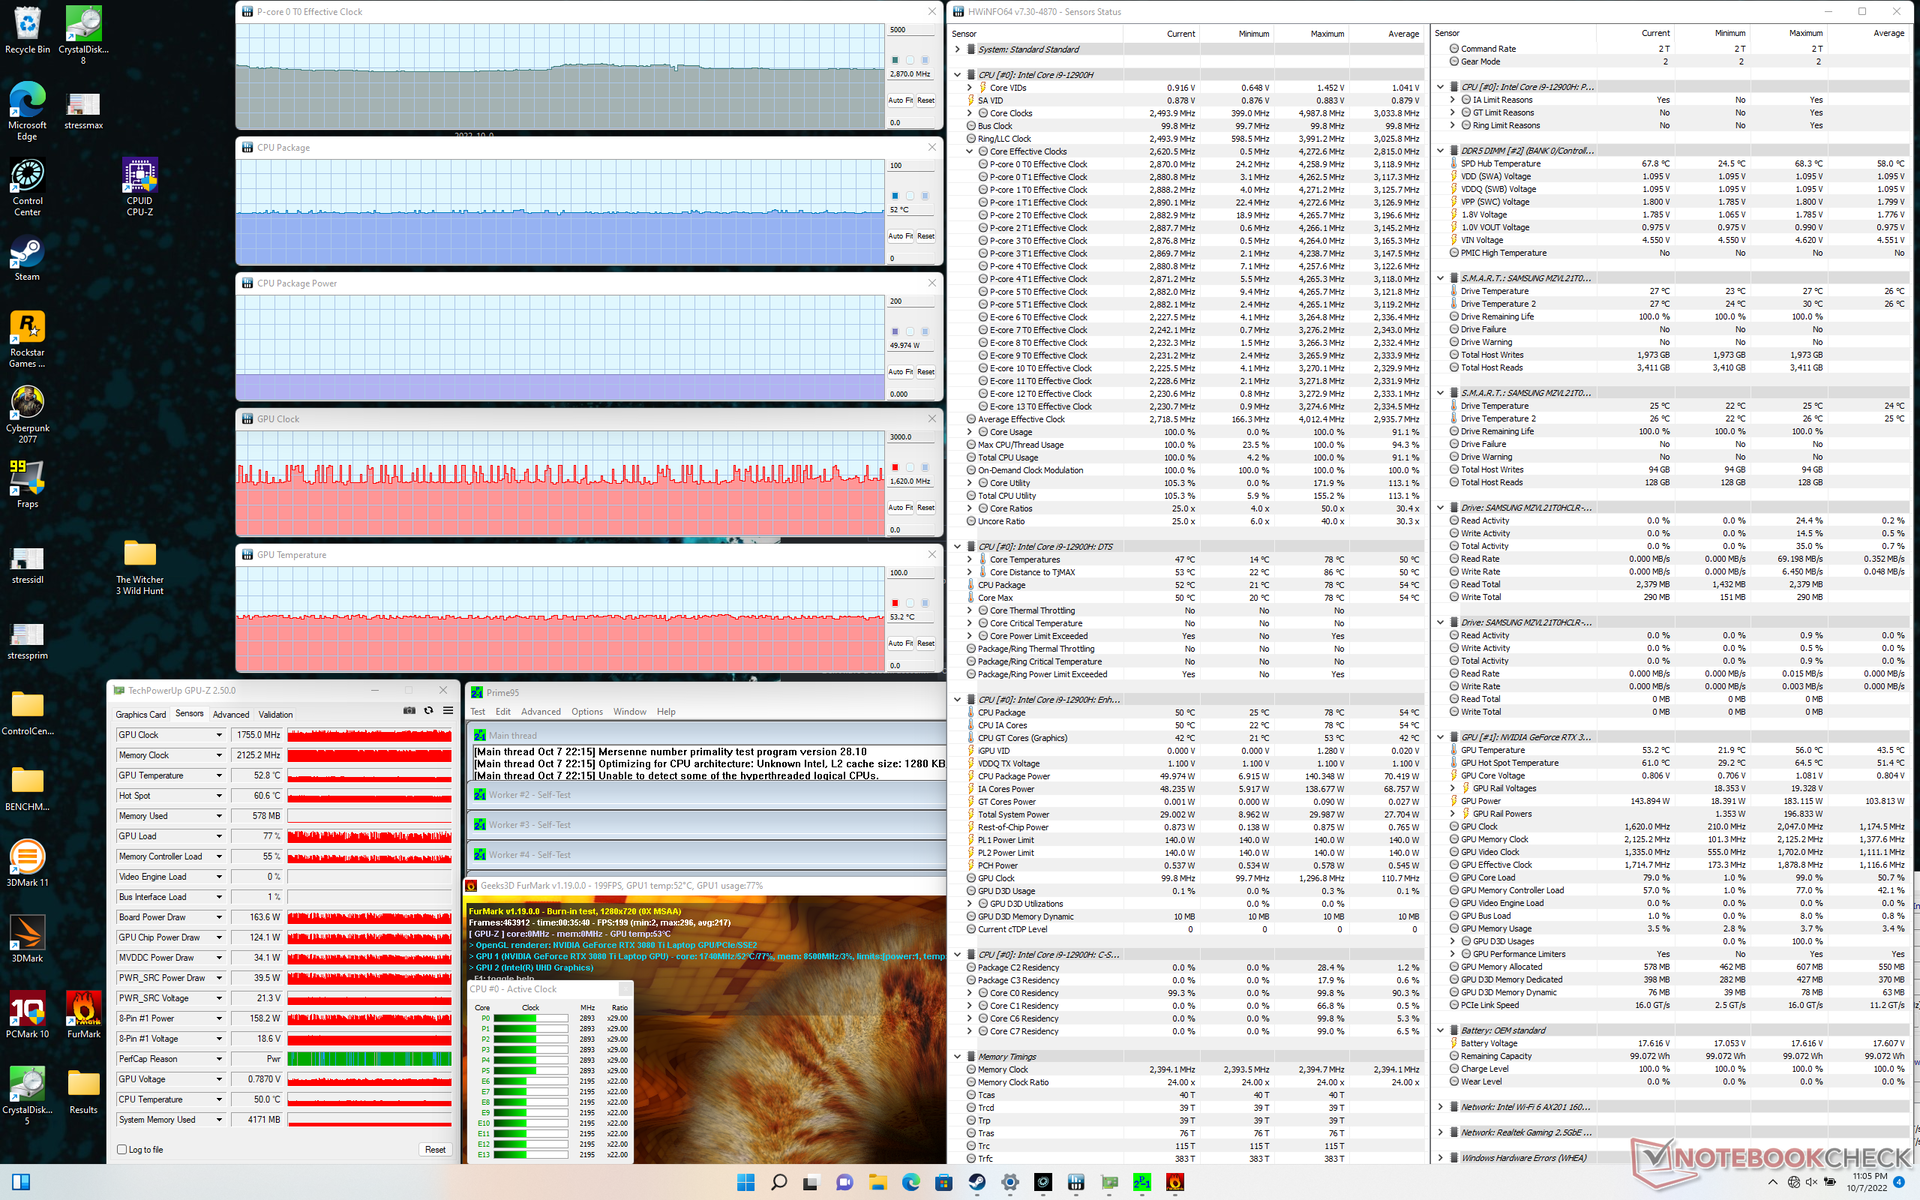
| CPU-klocka (GHz) | GPU-klocka (MHz) | Genomsnittlig CPU-temperatur (°C) | Genomsnittlig GPU-temperatur (°C) | |
| Systemets tomgång | -- | -- | 22 | 22 |
| Prime95 Stress | 4.3 | -- | 54 | 31 |
| Prime95 + FurMark Stress | 2.9 | ~1755 | 52 | 53 |
| Witcher 3 Stress | ~1,3 | 1890 | 53 | 55 |
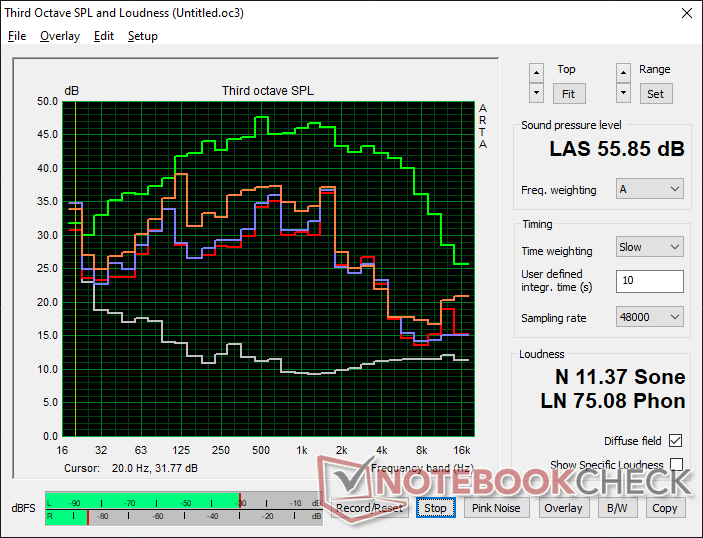
Högtalare
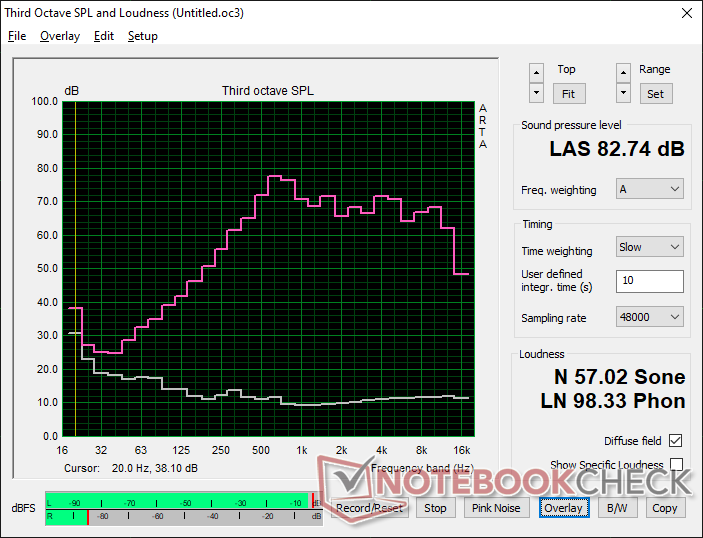
Uniwell Technology GM7AG8N Liquid Cooling Box ljudanalys
(+) | högtalare kan spela relativt högt (82.7 dB)
Bas 100 - 315 Hz
(-) | nästan ingen bas - i genomsnitt 17.5% lägre än medianen
(±) | linjäriteten för basen är genomsnittlig (8% delta till föregående frekvens)
Mellan 400 - 2000 Hz
(±) | högre mellan - i genomsnitt 5% högre än median
(±) | linjäriteten för mids är genomsnittlig (7.8% delta till föregående frekvens)
Högsta 2 - 16 kHz
(+) | balanserade toppar - endast 2.2% från medianen
(+) | toppar är linjära (5.5% delta till föregående frekvens)
Totalt 100 - 16 000 Hz
(±) | linjäriteten för det totala ljudet är genomsnittlig (15.1% skillnad mot median)
Jämfört med samma klass
» 32% av alla testade enheter i den här klassen var bättre, 6% liknande, 62% sämre
» Den bästa hade ett delta på 6%, genomsnittet var 18%, sämst var 132%
Jämfört med alla testade enheter
» 21% av alla testade enheter var bättre, 4% liknande, 75% sämre
» Den bästa hade ett delta på 4%, genomsnittet var 23%, sämst var 134%
Apple MacBook Pro 16 2021 M1 Pro ljudanalys
(+) | högtalare kan spela relativt högt (84.7 dB)
Bas 100 - 315 Hz
(+) | bra bas - bara 3.8% från medianen
(+) | basen är linjär (5.2% delta till föregående frekvens)
Mellan 400 - 2000 Hz
(+) | balanserad mellan - endast 1.3% från medianen
(+) | mids är linjära (2.1% delta till föregående frekvens)
Högsta 2 - 16 kHz
(+) | balanserade toppar - endast 1.9% från medianen
(+) | toppar är linjära (2.7% delta till föregående frekvens)
Totalt 100 - 16 000 Hz
(+) | det totala ljudet är linjärt (4.6% skillnad mot median)
Jämfört med samma klass
» 0% av alla testade enheter i den här klassen var bättre, 0% liknande, 100% sämre
» Den bästa hade ett delta på 5%, genomsnittet var 17%, sämst var 45%
Jämfört med alla testade enheter
» 0% av alla testade enheter var bättre, 0% liknande, 100% sämre
» Den bästa hade ett delta på 4%, genomsnittet var 23%, sämst var 134%
Energiförvaltning
Strömförbrukning - Yikes!
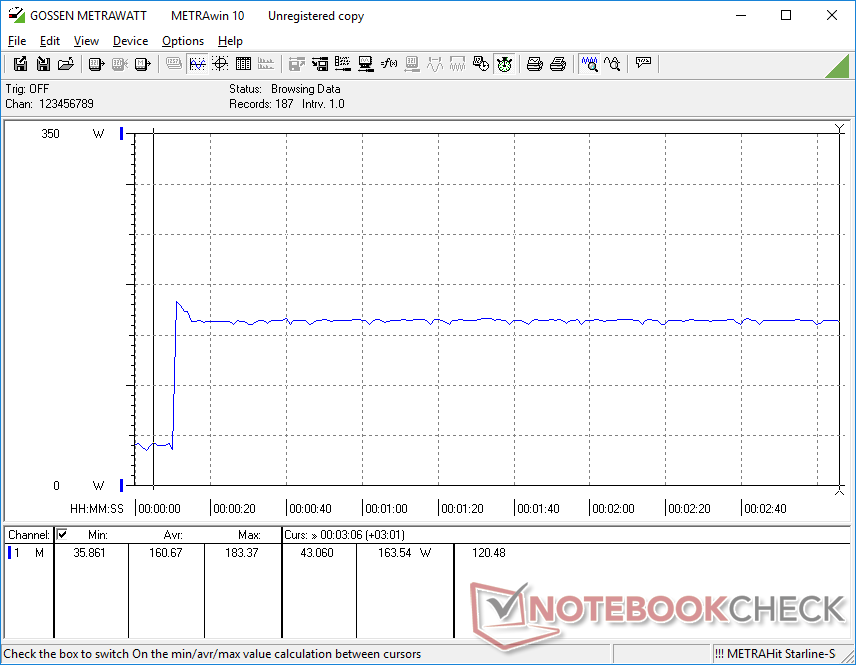
Vid tomgång på skrivbordet med de lägsta inställningarna för ljusstyrka och energiprofil och med kylboxen bortkopplad drar den bara 14 W från uttaget. Om däremot skrivbordet går på tomgång vid högsta ljusstyrka och inställningar för strömprofilen och kylboxen är aktiv, skulle det dra nästan 44 W jämfört med ~35 W eller mindre påAsus ROG Zephyrus S17 eller Razer Blade 17. Du kanske vill stänga av kylboxen om den inte används för att spara på elräkningarna
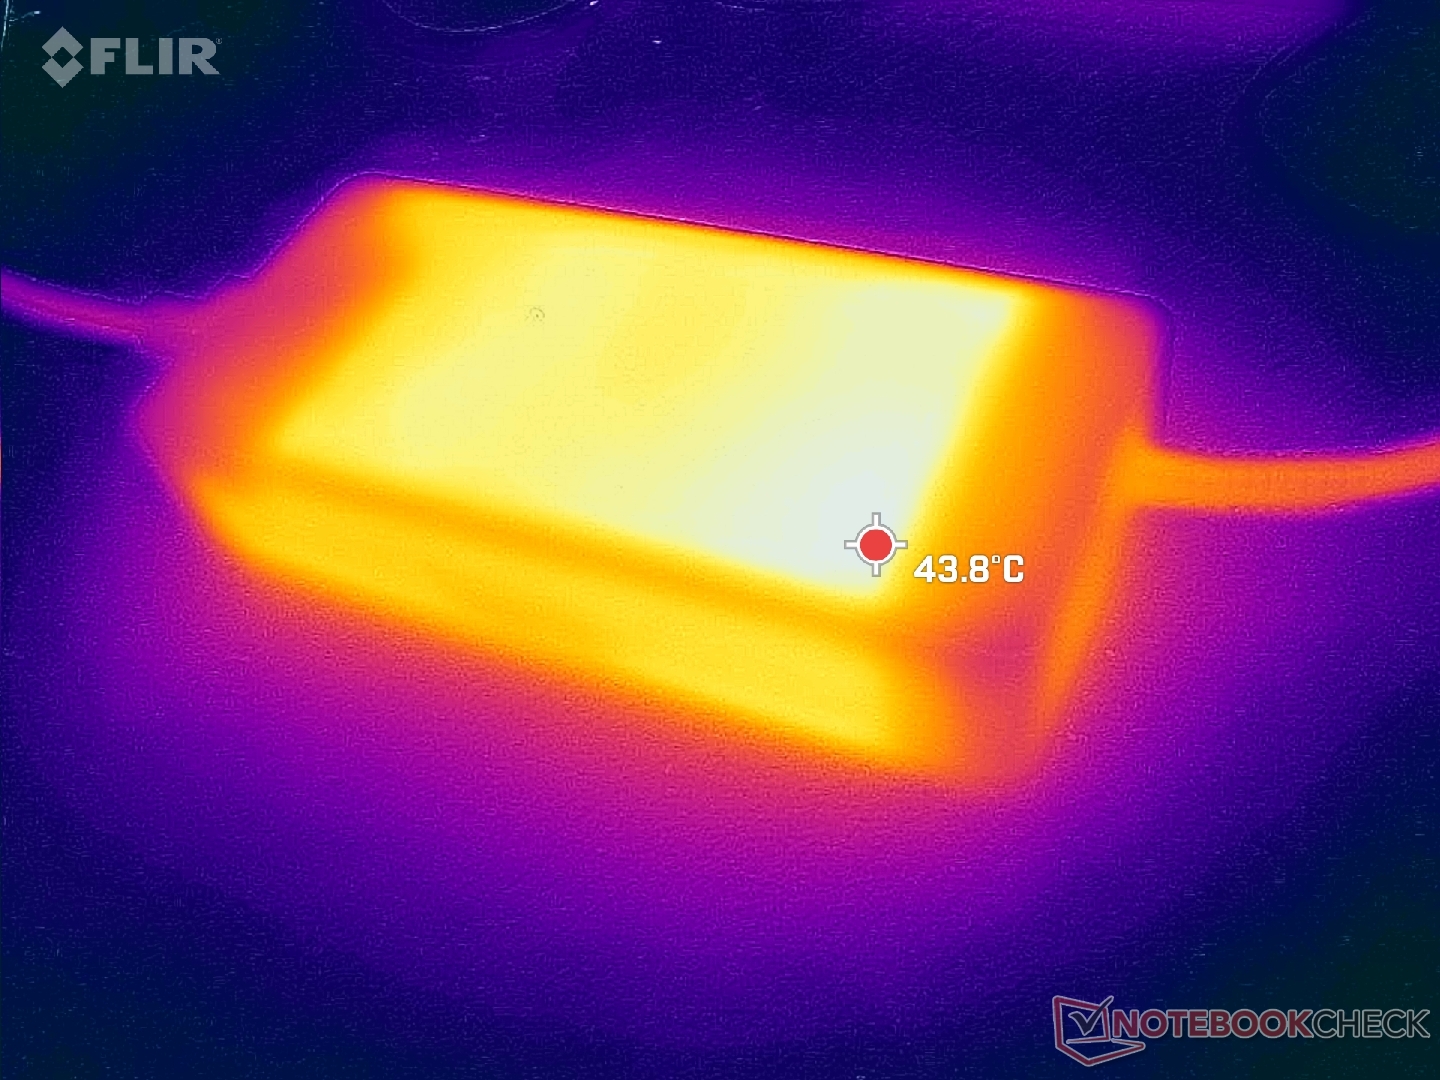
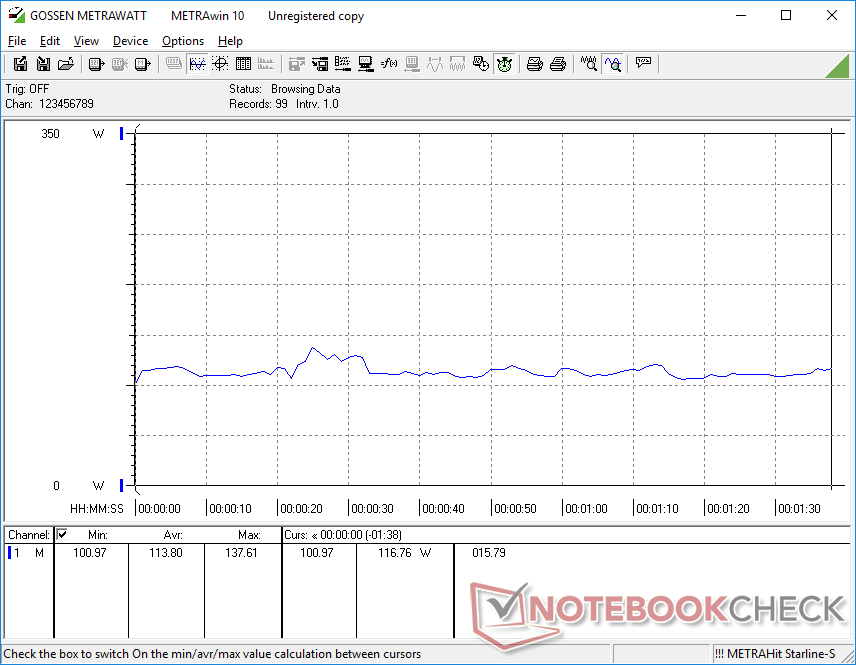
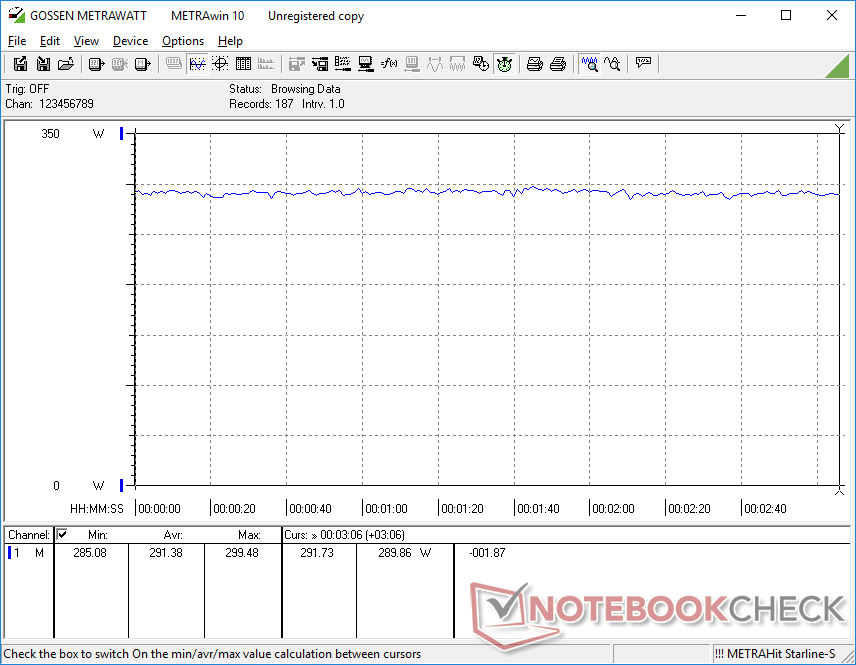
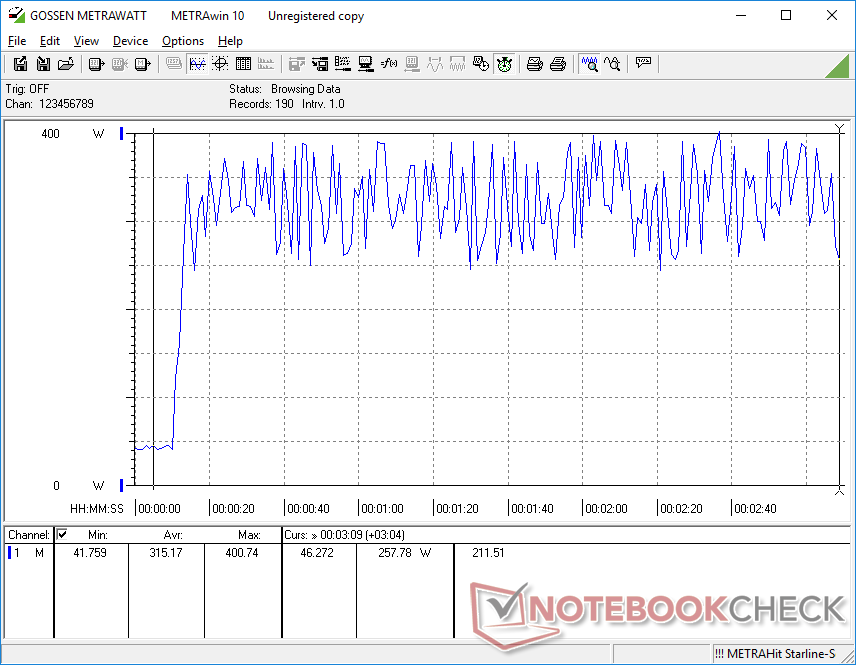
Den stora nätadaptern (~18,5 x 8,5 x 3,5 cm) är dimensionerad för 330 W. Körning Witcher 3 drar redan 291 W för att vara betydligt mer än de flesta andra bärbara datorer inklusive även den massiva MSI Titan GT77 med nästan 15 procent. Om CPU:n och GPU:n är 100 procent utnyttjade vardera kan strömförbrukningen cykla mellan 250 W och 400 W, vilket visas i våra grafer nedan. Den medföljande 330 W AC-adaptern är tillräcklig för speländamål, men det behövs uppenbarligen mer ström om du tänker köra både CPU och GPU på sina respektive maxnivåer.
| Av/Standby | |
| Låg belastning | |
| Hög belastning |
|
Förklaring:
min: | |
| Uniwell Technology GM7AG8N Liquid Cooling Box i9-12900H, GeForce RTX 3080 Ti Laptop GPU, Samsung PM9A1 MZVL21T0HCLR, IPS, 2560x1600, 17" | MSI Titan GT77 12UHS i9-12900HX, GeForce RTX 3080 Ti Laptop GPU, Samsung PM9A1 MZVL21T0HCLR, IPS-Level, 1920x1080, 17.3" | Aorus 17X XES i9-12900HX, GeForce RTX 3070 Ti Laptop GPU, Gigabyte AG470S1TB-SI B10, IPS, 1920x1080, 17.3" | Razer Blade 17 Early 2022 i9-12900H, GeForce RTX 3080 Ti Laptop GPU, Samsung PM9A1 MZVL21T0HCLR, IPS, 3840x2160, 17.3" | MSI Stealth GS77 12UHS-083US i7-12700H, GeForce RTX 3080 Ti Laptop GPU, Micron 3400 1TB MTFDKBA1T0TFH, IPS, 2560x1440, 17.3" | Asus ROG Zephyrus S17 GX703HSD i9-11900H, GeForce RTX 3080 Laptop GPU, Samsung PM9A1 MZVL22T0HBLB, IPS, 2560x1440, 17.3" | |
|---|---|---|---|---|---|---|
| Power Consumption | -10% | 5% | 15% | 22% | 14% | |
| Idle Minimum * (Watt) | 13.7 | 30.21 -121% | 18 -31% | 17 -24% | 20 -46% | 21.7 -58% |
| Idle Average * (Watt) | 38 | 32.42 15% | 28 26% | 23 39% | 21.4 44% | 27 29% |
| Idle Maximum * (Watt) | 43.4 | 33.7 22% | 36 17% | 34 22% | 27 38% | 33 24% |
| Load Average * (Watt) | 113.8 | 125.09 -10% | 153 -34% | 120 -5% | 100.5 12% | 108 5% |
| Witcher 3 ultra * (Watt) | 291 | 256 12% | 221 24% | 229 21% | 165 43% | 195 33% |
| Load Maximum * (Watt) | 400.8 | 321.88 20% | 290 28% | 243 39% | 247.1 38% | 210 48% |
* ... mindre är bättre
Power Consumption Witcher 3 / Stresstest
Power Consumption external Monitor
Batteritid - faktiskt inte dåligt
Batterikapaciteten är liknande den för MSI Stealth GS77 med 99 Wh. Den totala körtiden är likartad med MSI GT77 trots storleksskillnaderna.
USB-PD stöds inte och därför kan den bärbara datorn inte laddas via USB-C.
| Uniwell Technology GM7AG8N Liquid Cooling Box i9-12900H, GeForce RTX 3080 Ti Laptop GPU, 99 Wh | MSI Titan GT77 12UHS i9-12900HX, GeForce RTX 3080 Ti Laptop GPU, 99.9 Wh | Aorus 17X XES i9-12900HX, GeForce RTX 3070 Ti Laptop GPU, 99 Wh | Razer Blade 17 Early 2022 i9-12900H, GeForce RTX 3080 Ti Laptop GPU, 82 Wh | MSI Stealth GS77 12UHS-083US i7-12700H, GeForce RTX 3080 Ti Laptop GPU, 99 Wh | Asus ROG Zephyrus S17 GX703HSD i9-11900H, GeForce RTX 3080 Laptop GPU, 90 Wh | |
|---|---|---|---|---|---|---|
| Batteridrifttid | -7% | -25% | -19% | 0% | 38% | |
| Reader / Idle (h) | 8.7 | 7.1 -18% | 10.8 24% | |||
| WiFi v1.3 (h) | 7 | 6.9 -1% | 4.4 -37% | 3.8 -46% | 6.2 -11% | 7.5 7% |
| Load (h) | 1.6 | 1.4 -13% | 1.4 -13% | 1.7 6% | 1.4 -13% | 2.7 69% |
| H.264 (h) | 7.2 | 3.8 | 4.8 | 7.2 | ||
| Witcher 3 ultra (h) | 1.5 | 1 |
För
Emot
Bedömning - Det fungerar verkligen
En extern vattenpump är en galen lösning för att kyla en bärbar dator för spel. Den är inte bara klumpig med sina kablar och slangar, utan gör också transporten till ett stort problem. Den förankrar i princip den bärbara datorn vid skrivbordet och avskräcker från att resa ännu mer än en eGPU-dockningsstation.
Vätske kylboxen är avsedd för en relativt liten entusiastmarknad för bärbara datorer, men dess prestanda och relativt låga ljudnivå är ändå imponerande och bättre än förväntat. Den står dock inför stora utmaningar mot den växande eGPU-marknaden.
Resultaten är dock svåra att ignorera. Den totala prestandan är snabbare än de flesta andra bärbara datorer utrustade med samma Core i9-12900H CPU och RTX 3080 Ti GPU även när Uniwell och kylboxen är inställda på sina lägsta fläktinställningar. Den kan köras märkbart tystare än traditionella bärbara datorer för spel utan att behöva strypa prestandan, vilket inte är något vi kan säga om nästan alla andra bärbara datorer för spel där ute.
Resultaten är lika imponerande när systemet är inställt på sina högsta fläktinställningar. De stabila kärntemperaturerna på strax runt 55 C är över 30 C svalare än på de flesta ultratunna bärbara speldatorer för att vara den lägsta registrerade temperaturen vi har sett för kategorin. Detta lämnar en hel del överklockningsutrymme för entusiaster om de är villiga att tolerera det högre fläktljudet.
Pris och tillgänglighet
Namn, pris och tillgänglighet för den testade modellen, vid behov med avvikelser från relevanta utrustningsvarianter. Affil länk till en butik från listan i länkfönstret.
Uniwell Technology GM7AG8N Liquid Cooling Box
- 10/13/2022 v7 (old)
Allen Ngo
Price comparison

