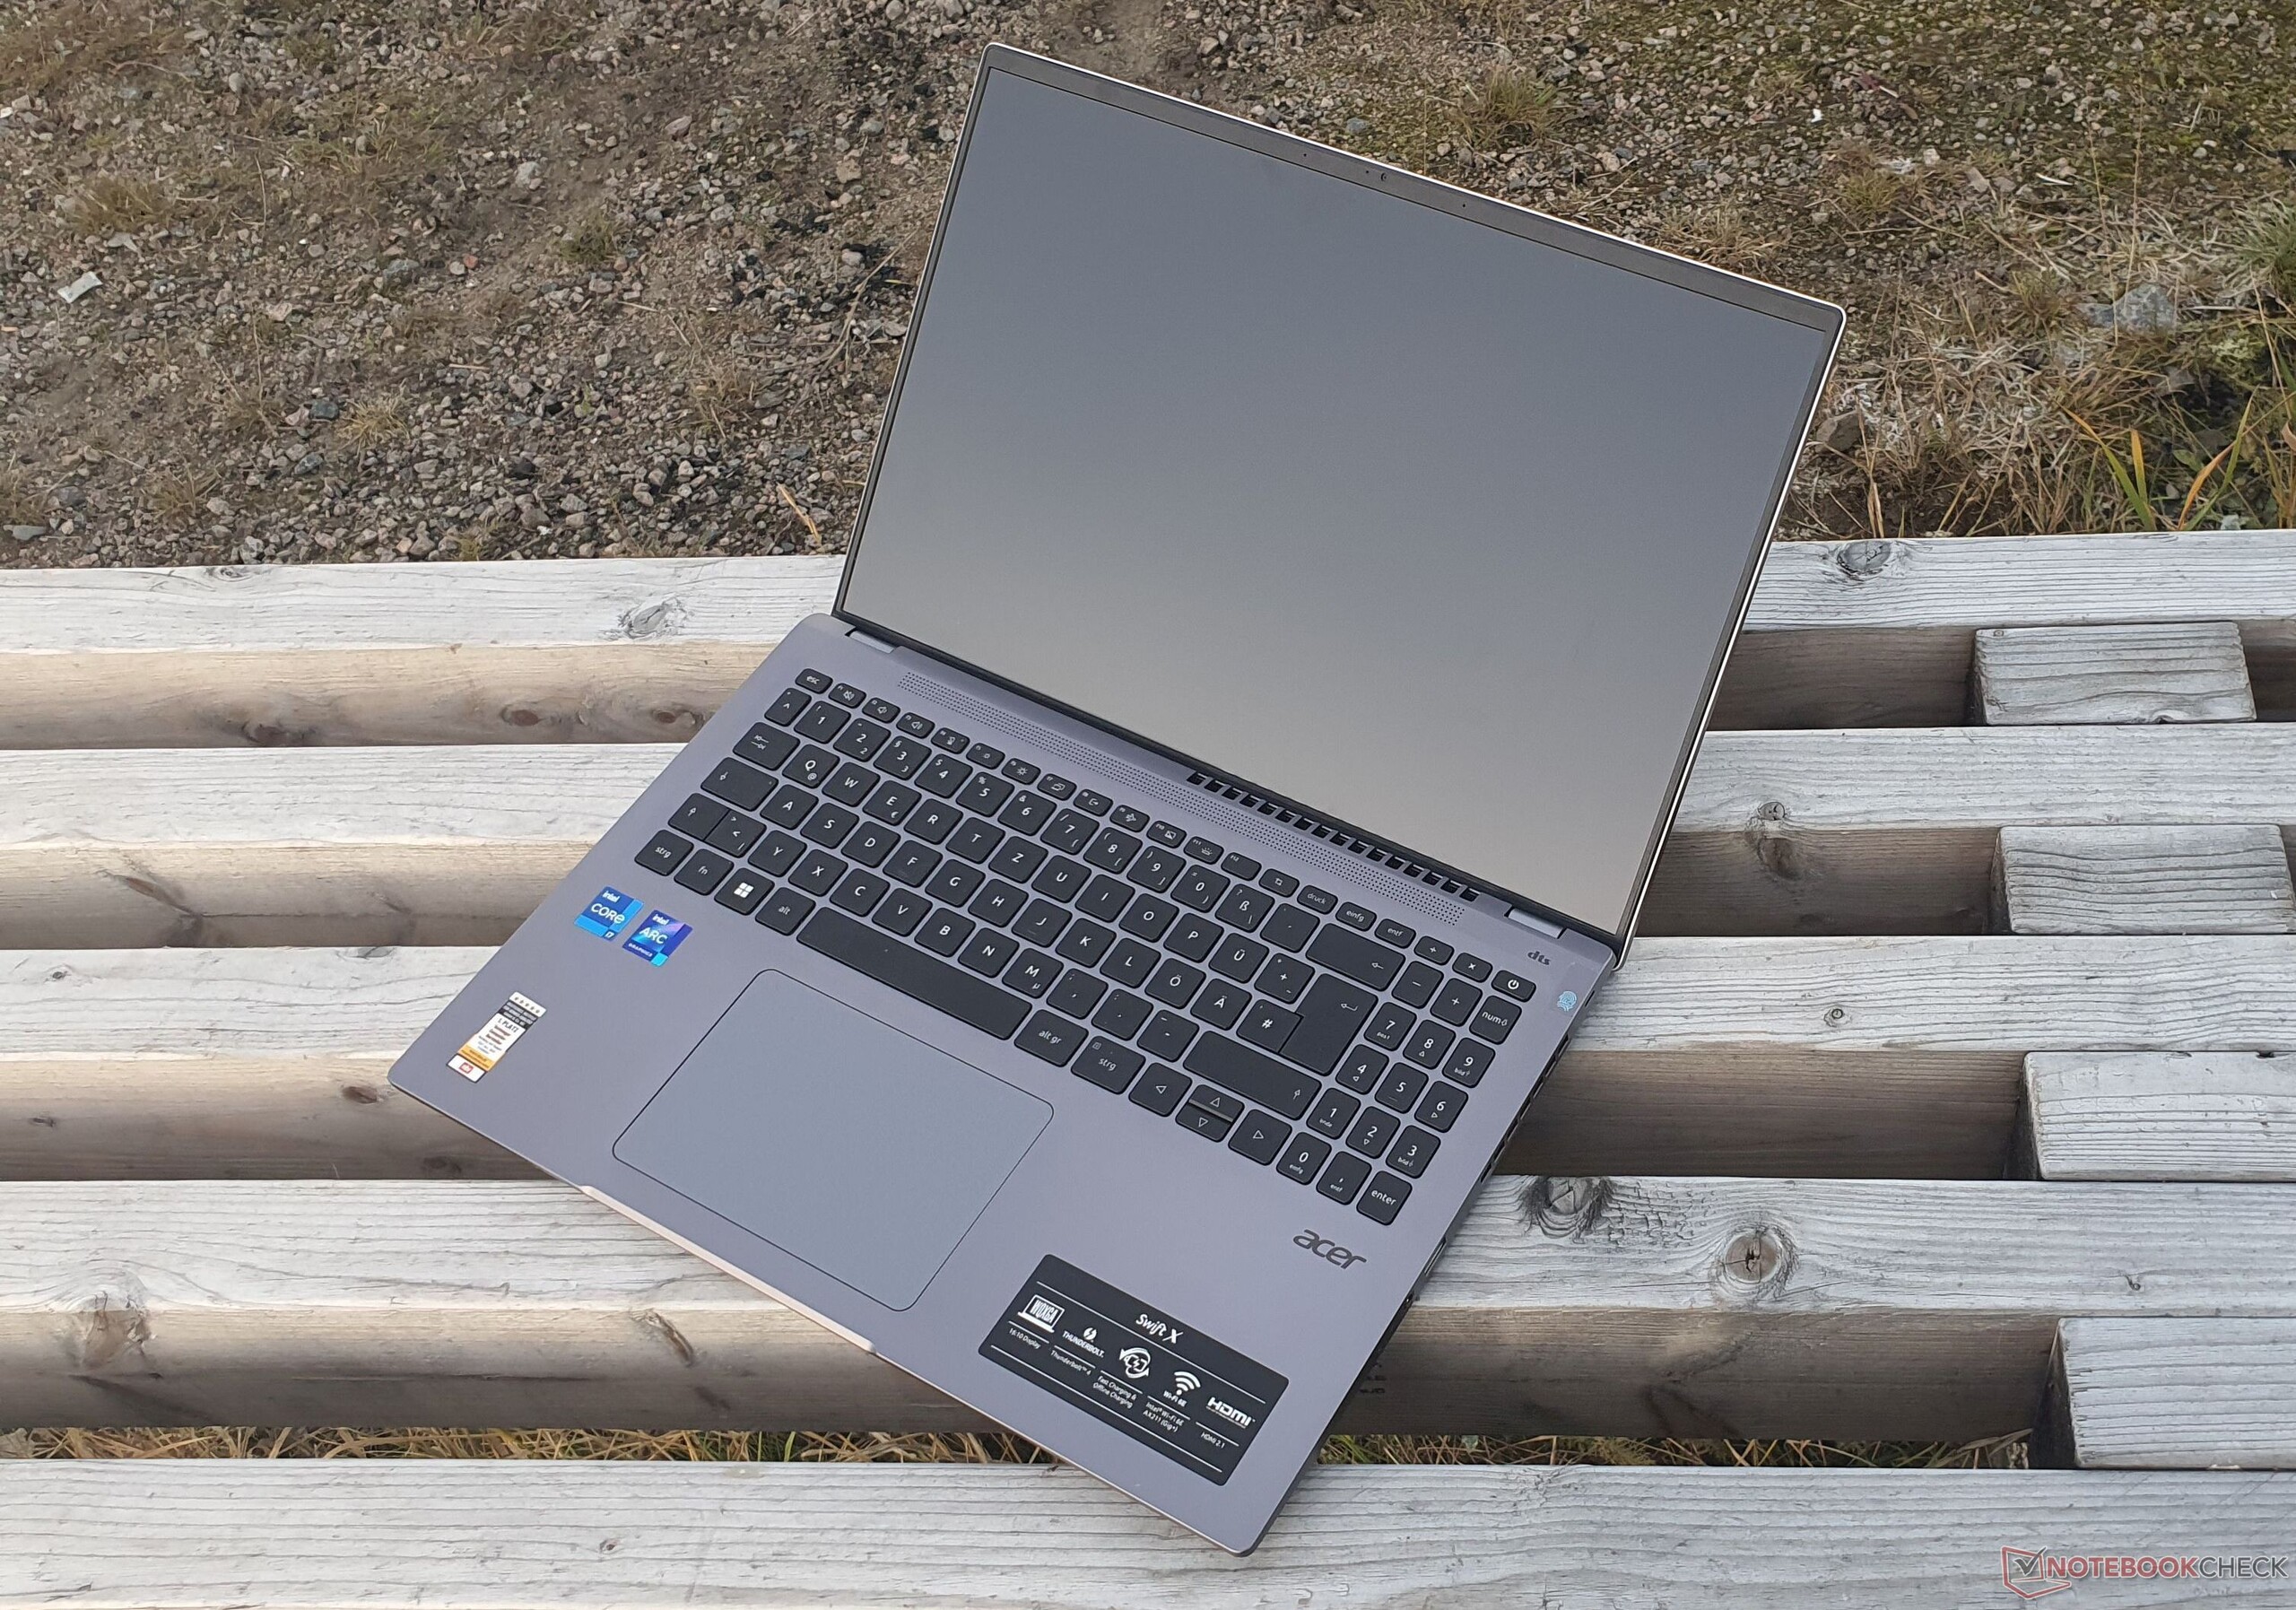
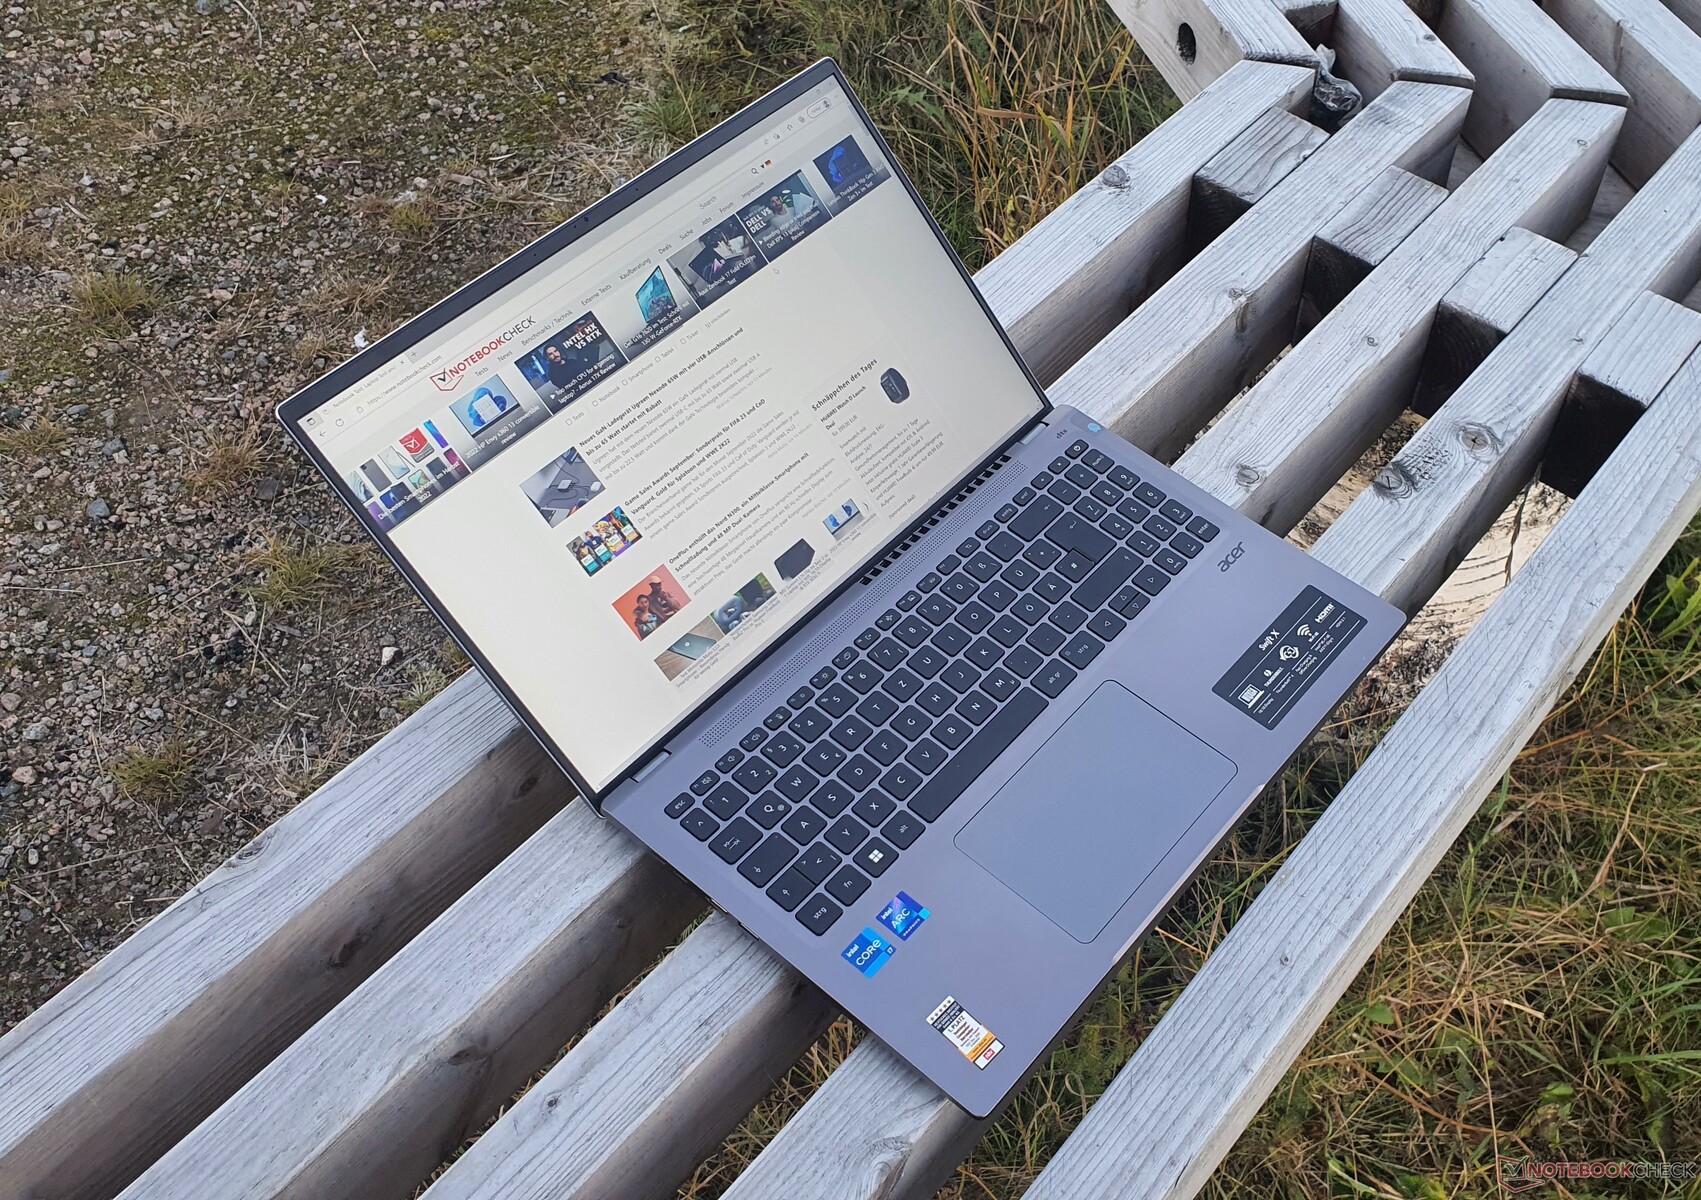
Acer Swift X 16 (2022) recension: 16-tums bärbar dator med kraftfulla uppdateringar
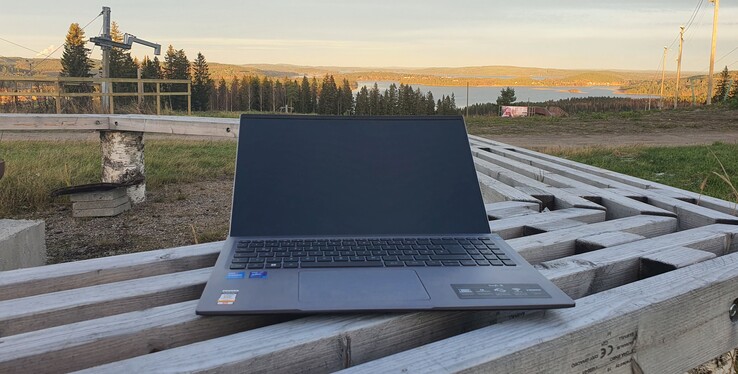
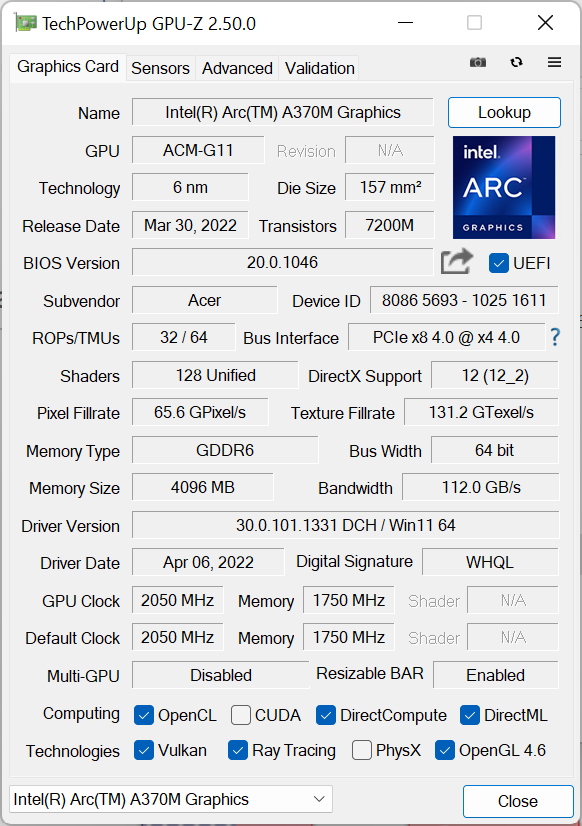
Acer Swift X 16 (2022) har fått många förbättringar: En ljus 16-tums skärm med en 2,5K-upplösning i 16:10-formatet som drivs av Intel Arc A370M, en ljusstark 16-tums skärm med en 2,5K-upplösning i 16:10-formatet som drivs av Intel Arc A370M, ettCore i7-1260Poch en snabb 1 TB PCIe 4.0 SSD. I alla fall finns det 16 GB lödda DDR5 4800 RAM-minne. Några mindre förbättringar som HDMI 2.1 och webbkameran i 1080p gynnar också den bärbara multimediebärbara datorn.
Med den nuvarande generationen av Swift X 16 har Acer lyckats åtgärda många av föregångarens brister. Men hur gör Intels Arc A370Mpresterar jämfört med en Nvidia GeForce RTX 3050 Tii jämförelseapparater som Dell Inspiron 16 Plusoch Asus Vivobook Pro 16XellerRTX 2050 i Lenovo ThinkBook 16 G4+?
Eftersom syskonmodellen som vi nyligen testade är identisk, bortsett från CPU och SSD, hänvisar vi dig till motsvarande granskning av den Acer Swift X SFX16-52G-52VE. Till och med skärmen som används är identisk.
Ytterligare Acer recensioner:
Potentiella konkurrenter i jämförelse
Gradering | Datum | Modell | Vikt | Höjd | Storlek | Upplösning | Pris |
|---|---|---|---|---|---|---|---|
| 86.4 % v7 (old) | 11/2022 | Acer Swift X SFX16-52G-77RX i7-1260P, A370M | 1.8 kg | 21.2 mm | 16.00" | 2560x1600 | |
| 88.4 % v7 (old) | 09/2022 | Lenovo ThinkBook 16 G4+ IAP i7-12700H, GeForce RTX 2050 Mobile | 1.8 kg | 16.5 mm | 16.00" | 2560x1600 | |
| 87.4 % v7 (old) | 08/2022 | Dell Inspiron 16 Plus 7620 i7-12700H, GeForce RTX 3050 Ti Laptop GPU | 2.1 kg | 18.99 mm | 16.00" | 3072x1920 | |
| 86.9 % v7 (old) | 09/2022 | HP Envy 16 h0112nr i7-12700H, GeForce RTX 3060 Laptop GPU | 2.3 kg | 19.8 mm | 16.00" | 3840x2400 | |
| 86.2 % v7 (old) | 11/2022 | Acer Swift X SFX16-52G-52VE i5-1240P, A370M | 1.8 kg | 21.3 mm | 16.00" | 2560x1600 | |
| 86.2 % v7 (old) | 07/2022 | Acer Swift X SFX16-51G-5388 i5-11320H, GeForce RTX 3050 4GB Laptop GPU | 1.8 kg | 18.9 mm | 16.10" | 1920x1080 | |
| 85.7 % v7 (old) | 09/2022 | Lenovo IdeaPad 5 Pro 16ARH7 R5 6600HS, Radeon 660M | 1.9 kg | 18.4 mm | 16.00" | 2560x1600 | |
v (old) | 12/2021 | Asus Vivobook Pro 16X-M7600QE R9 5900HX, GeForce RTX 3050 Ti Laptop GPU | 1.9 kg | 19 mm | 16.10" | 3840x2400 |

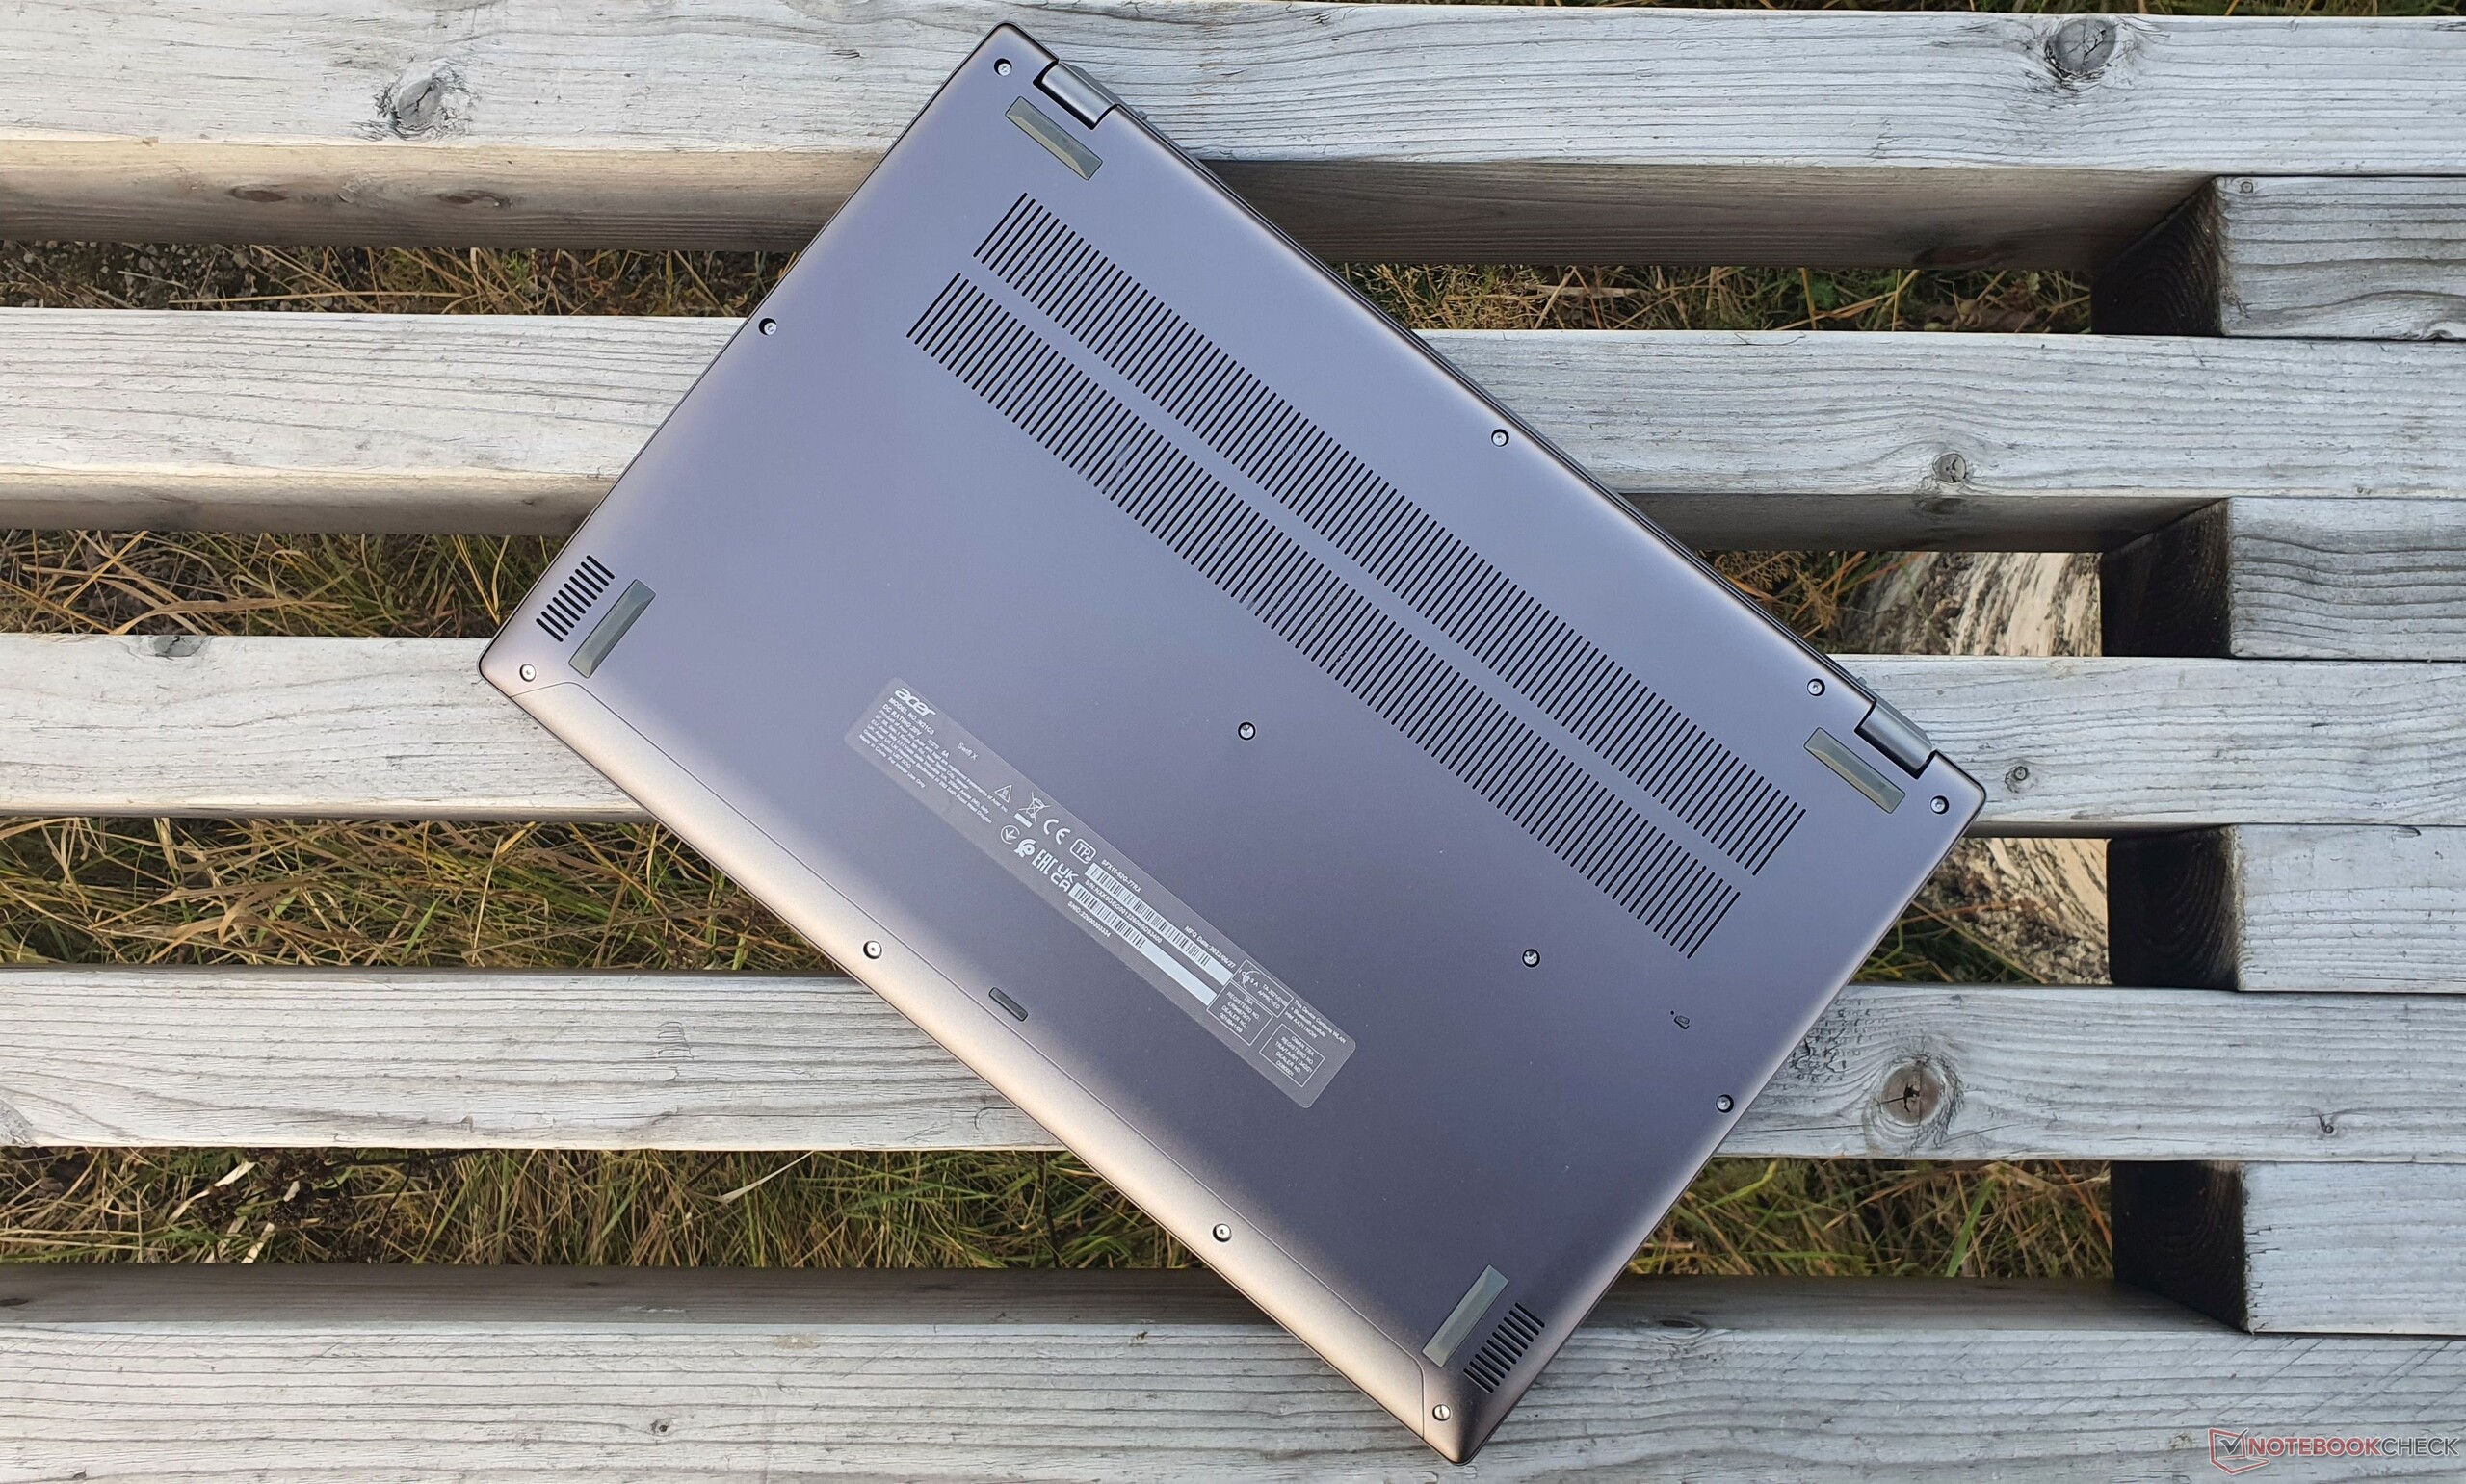
Eftersom hela botten av höljet är utbuktat resulterar detta i en maximal tjocklek på cirka 21 mm. Tillverkarens specifikation på 17,9 mm (~0,7 tum) avser en mätning som inte tar hänsyn till denna utbuktning.
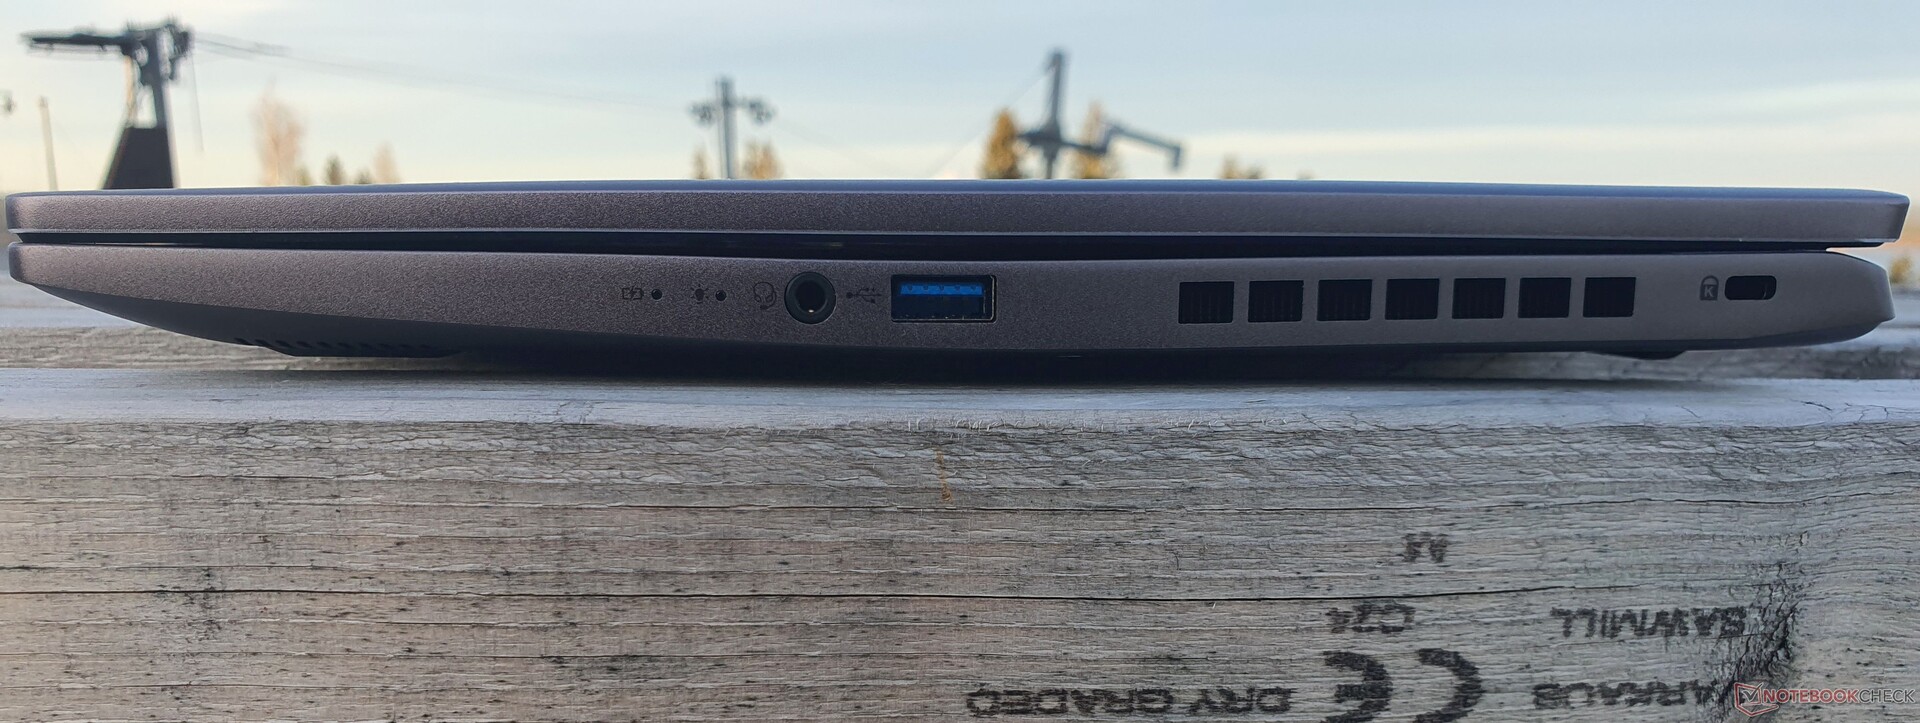
Utrustning: Uppdatering till HDMI 2.1 & TB4 för Acer Swift X

| Networking | |
| Acer Swift X SFX16-52G-77RX | |
| iperf3 receive AXE11000 | |
| iperf3 transmit AXE11000 | |
| Acer Swift X SFX16-52G-52VE | |
| iperf3 receive AXE11000 | |
| iperf3 transmit AXE11000 | |
| Acer Swift X SFX16-51G-5388 | |
| iperf3 transmit AX12 | |
| iperf3 receive AX12 | |
| Lenovo ThinkBook 16 G4+ IAP | |
| iperf3 receive AXE11000 | |
| iperf3 transmit AXE11000 | |
| HP Envy 16 h0112nr | |
| iperf3 receive AXE11000 6GHz | |
| iperf3 transmit AXE11000 6GHz | |
| Dell Inspiron 16 Plus 7620 | |
| iperf3 receive AXE11000 6GHz | |
| iperf3 transmit AXE11000 6GHz | |
| Lenovo IdeaPad 5 Pro 16ARH7 | |
| iperf3 receive AXE11000 | |
| iperf3 transmit AXE11000 | |
| Asus Vivobook Pro 16X-M7600QE | |
| iperf3 transmit AX12 | |
| iperf3 receive AX12 | |
WiFi Chart
Webbkamera


Underhåll

Garanti
Acer erbjuder den vanliga tvååriga garantin för sin Swift-serie i Tyskland.
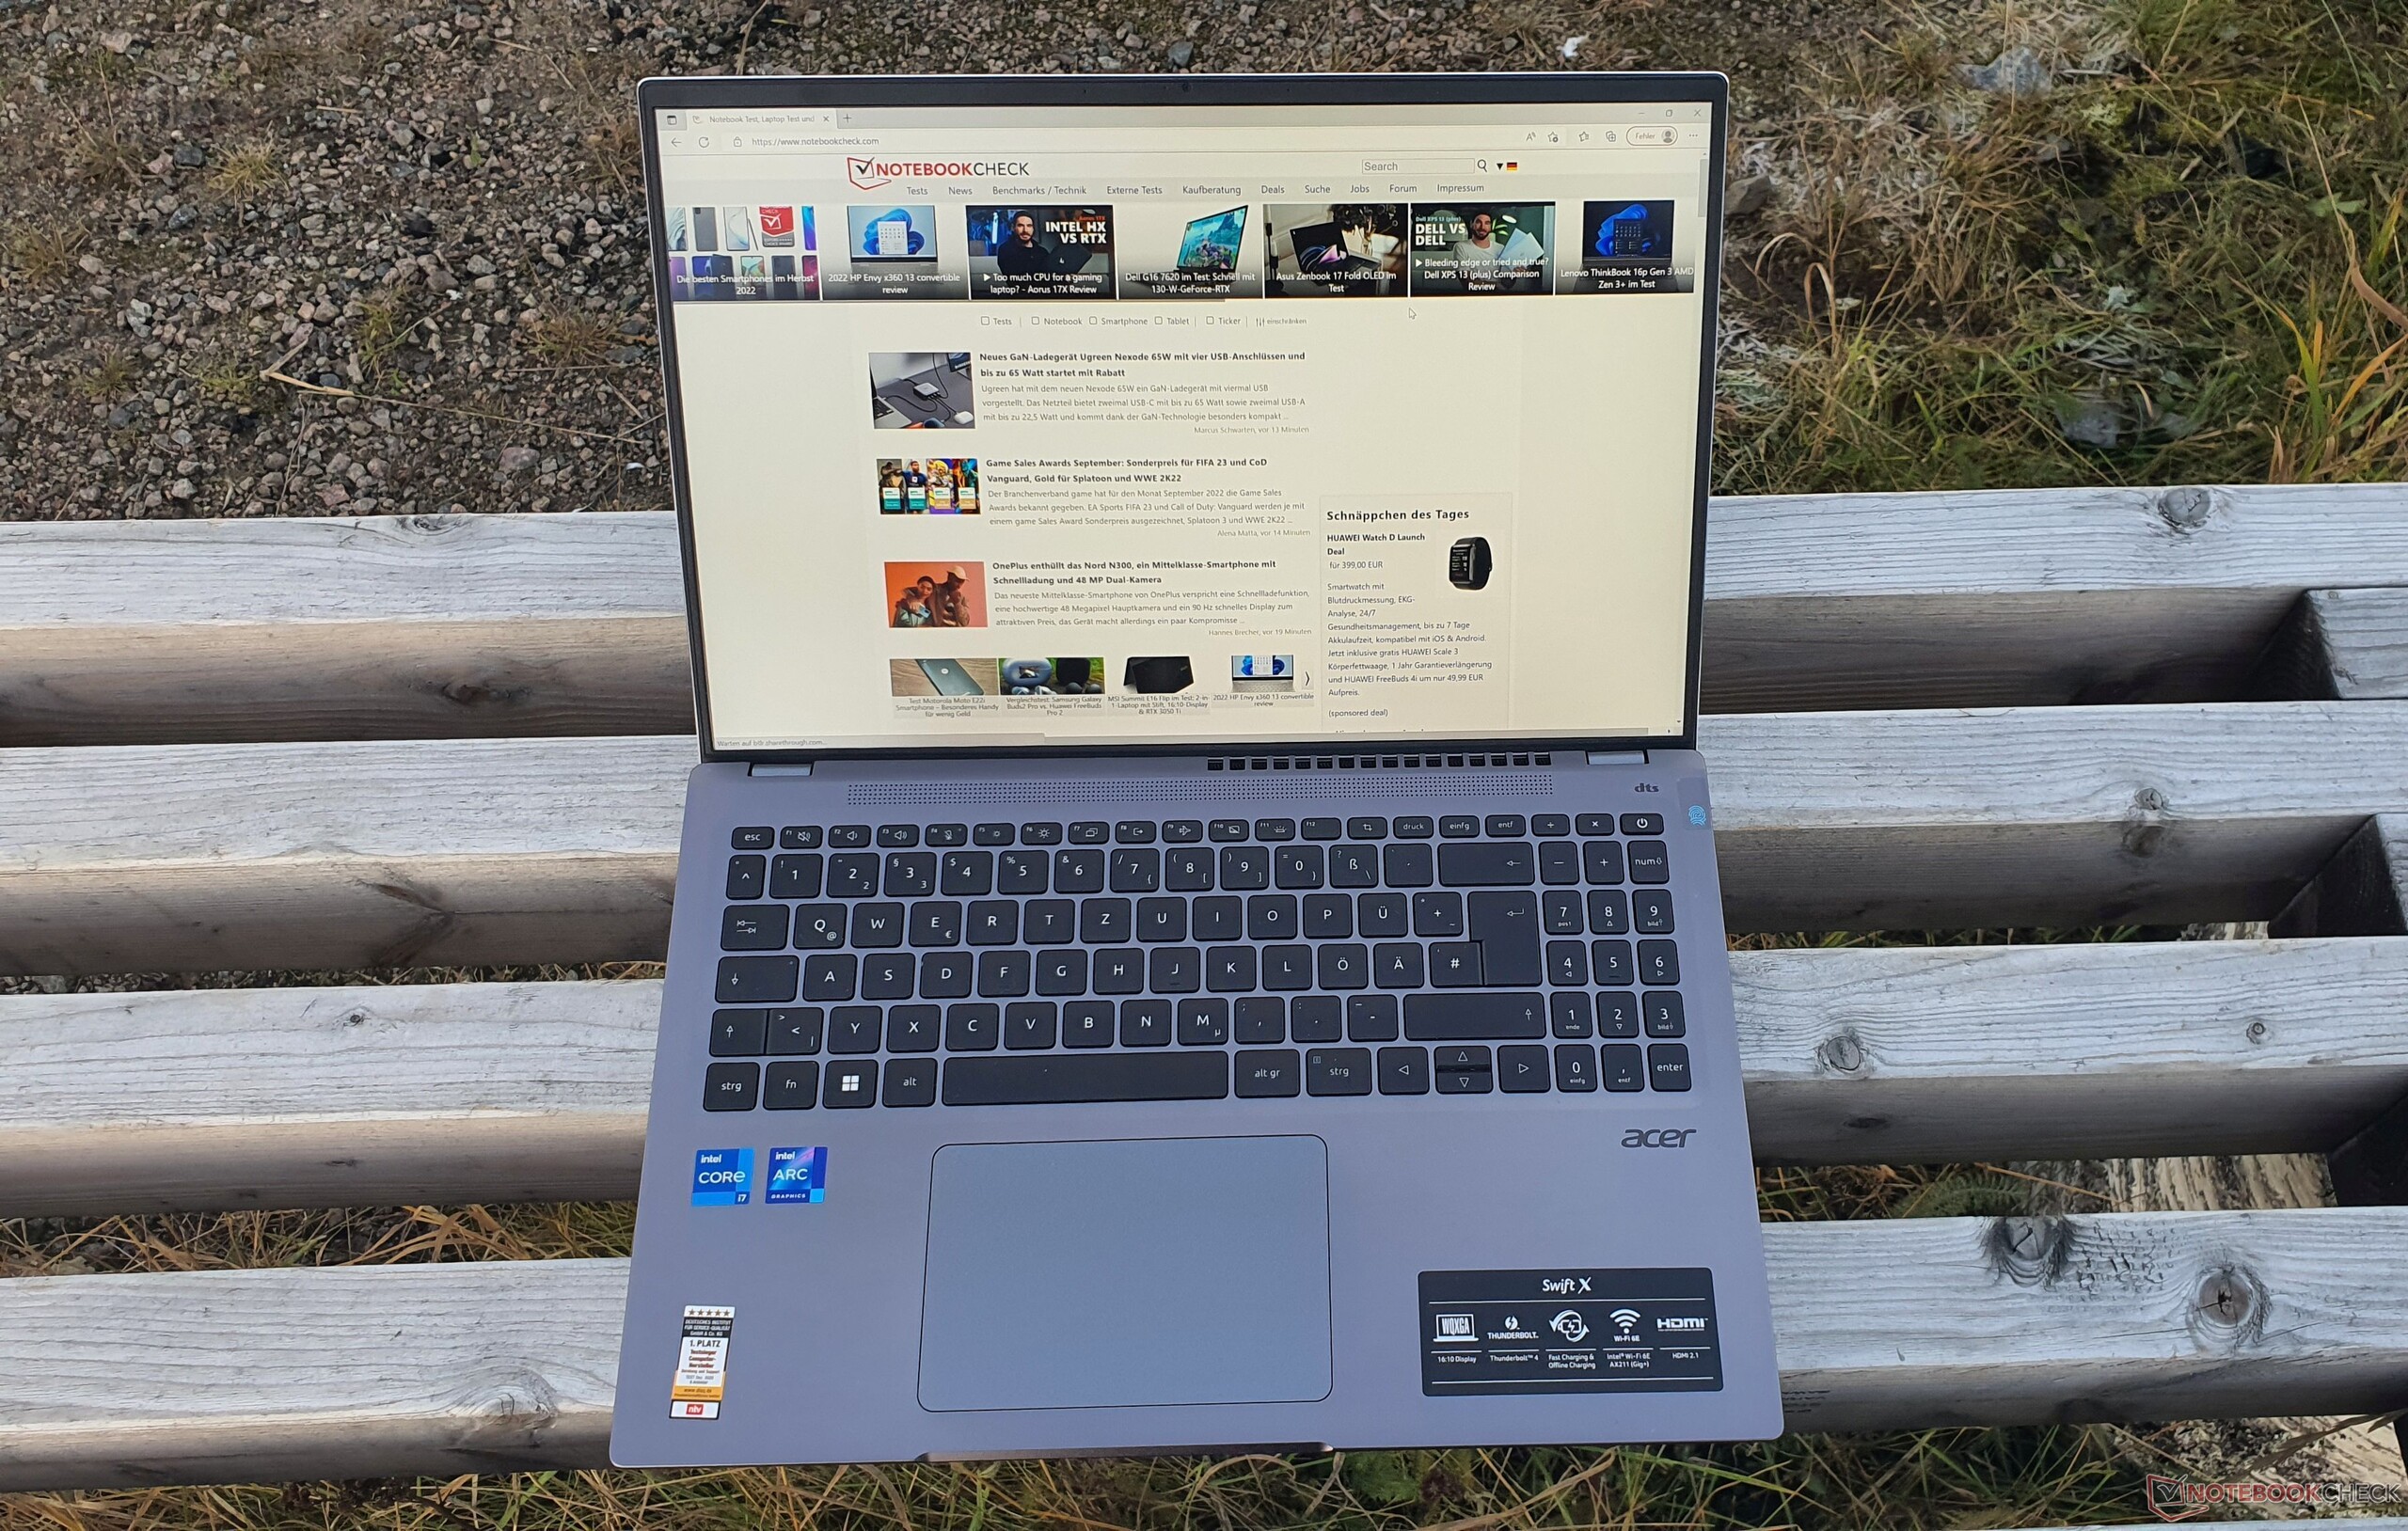
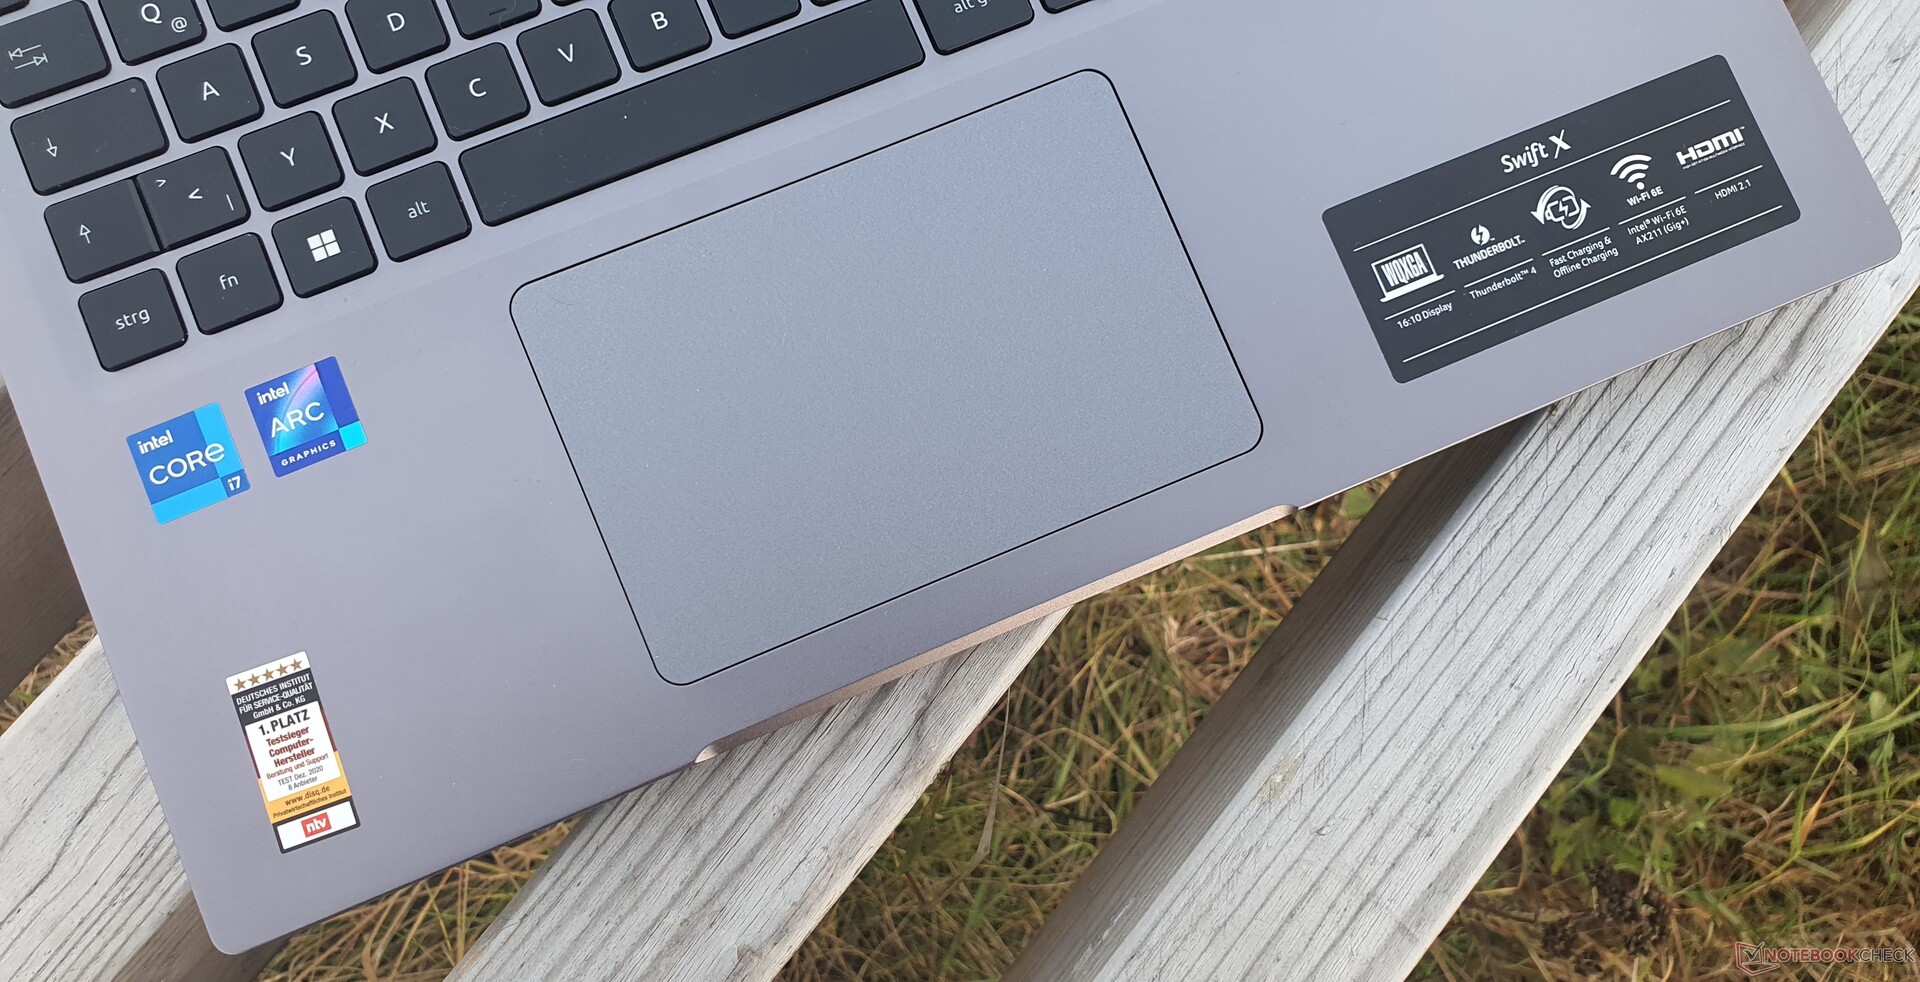
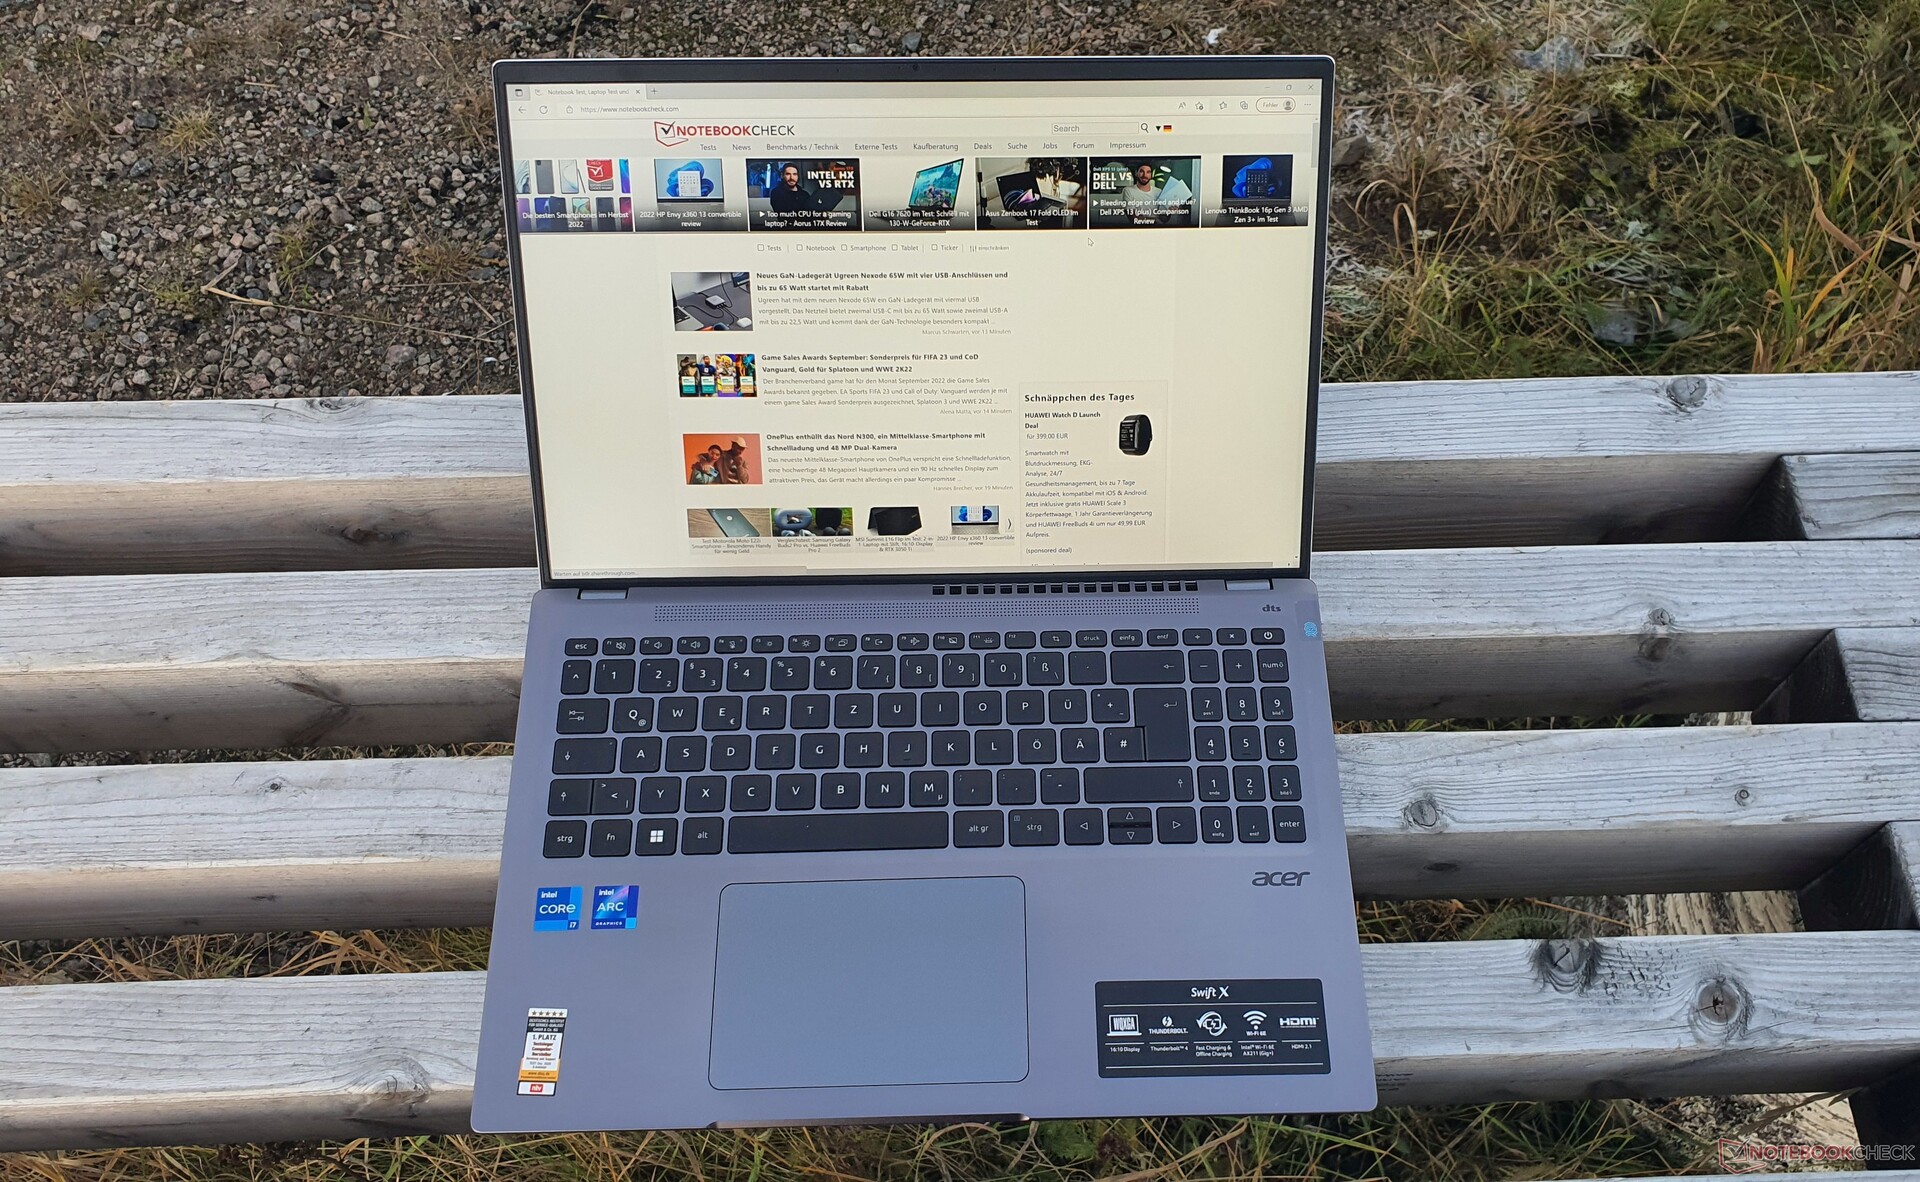
Inmatningsenheter: Acer Swift X: Bra tangentbord men svag pekplatta
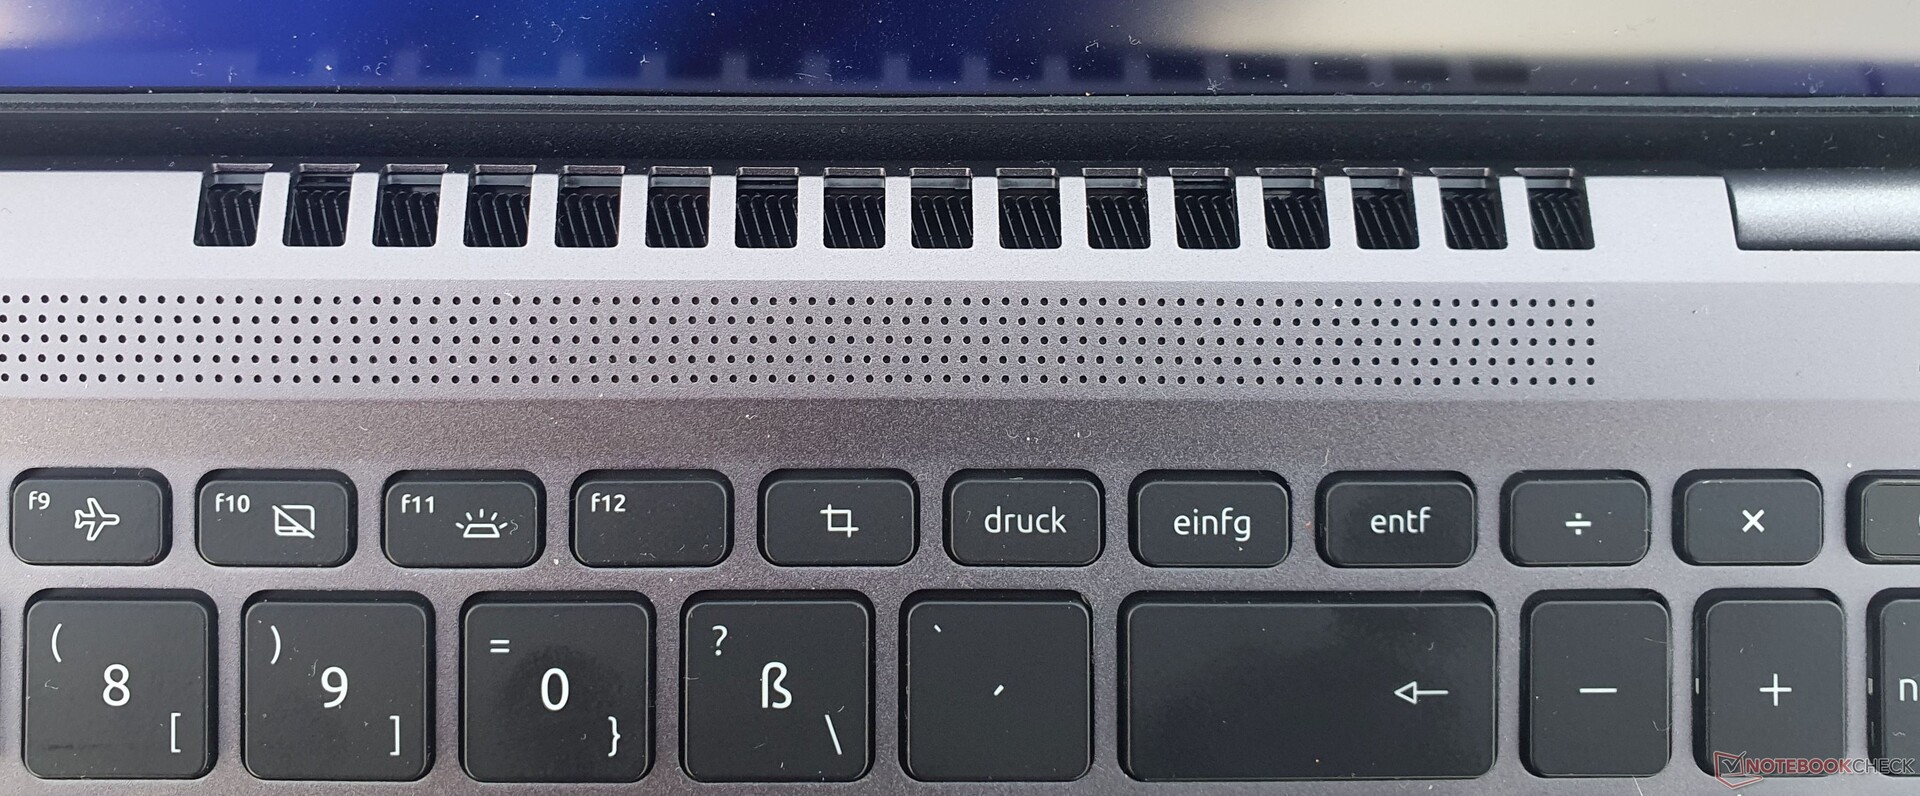
Tangentbord
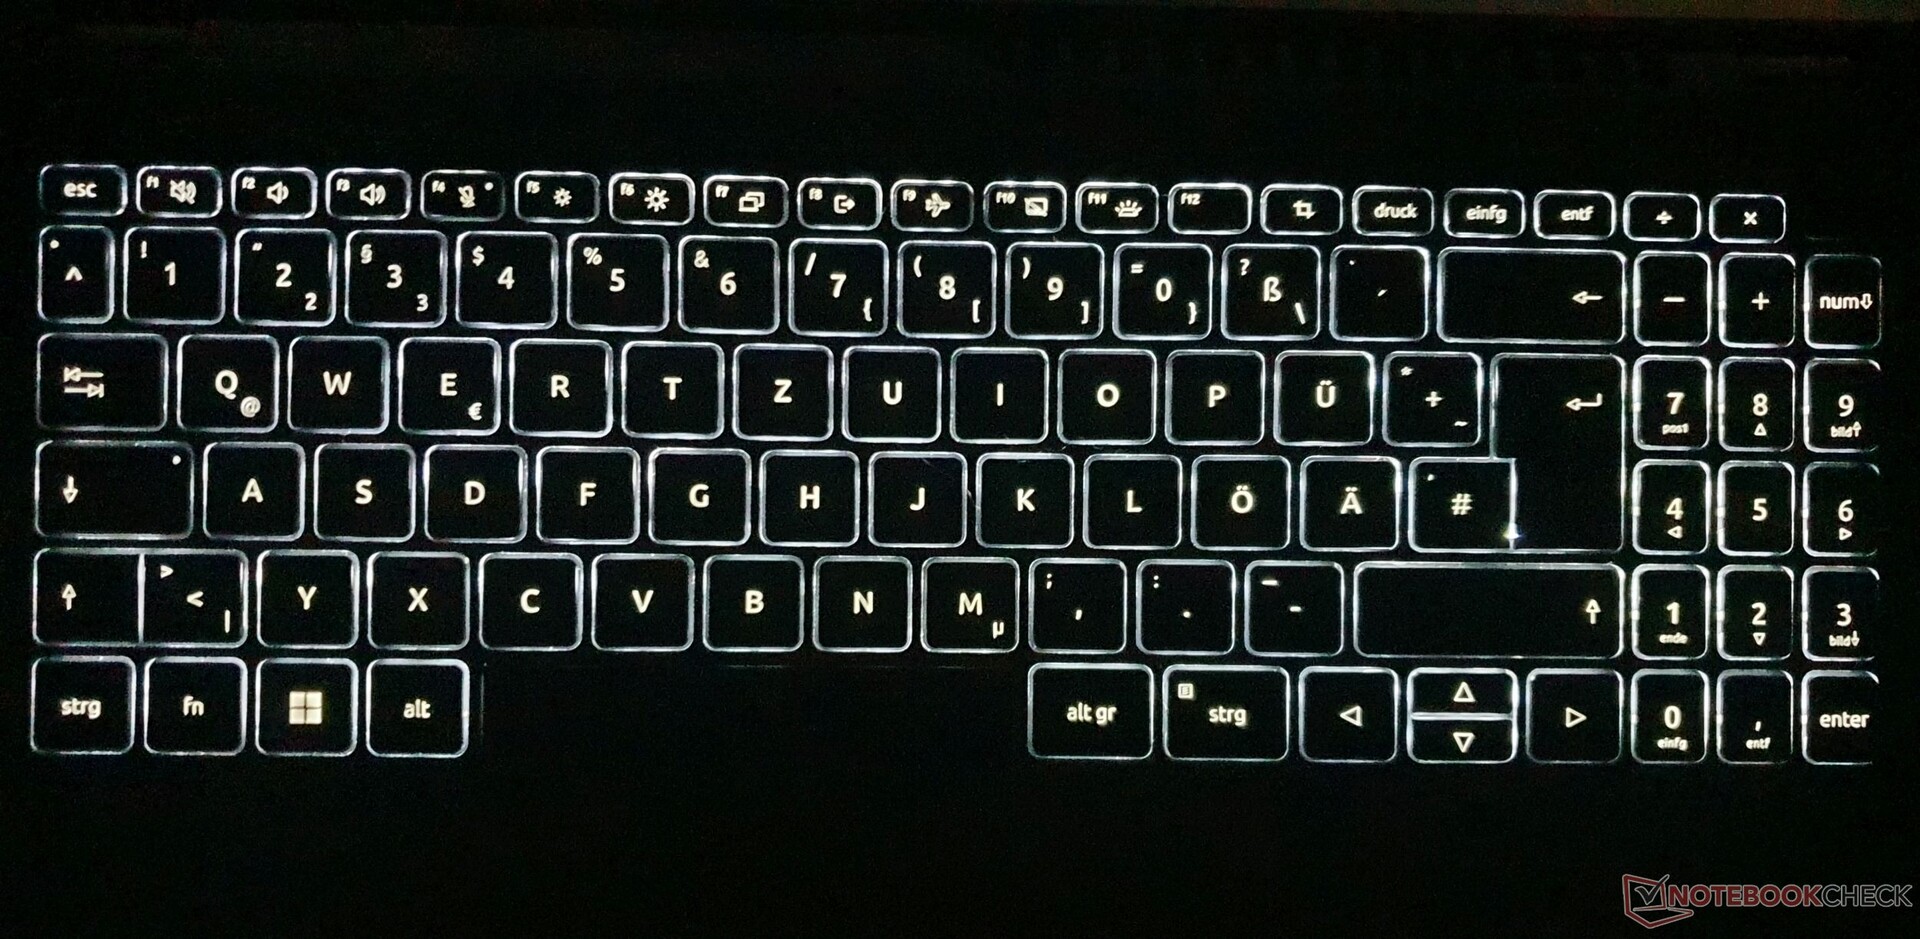
Tangentstorleken på det 6-radiga chiclet-tangentbordet är något mindre, 15 x 15 mm (~0,59 x 0,59 tum). Tangenttrycket är kort, men tillsammans med ett väljusterat motstånd skapar tryckpunkten en kraftfull återkoppling. Du kan också använda det för att skriva längre texter utan problem.
Tangentbordet har dock en viss eftergivenhet vid målinriktat tryck. När du skriver blir detta tydligt i form av något skramlande Enter- och Hash-tangenter. Layouten på Acer-tangentbordet har de typiska dubbla beläggningarna, ett trångt sifferblock och mindre piltangenter uppåt/nedåt-tangenter.
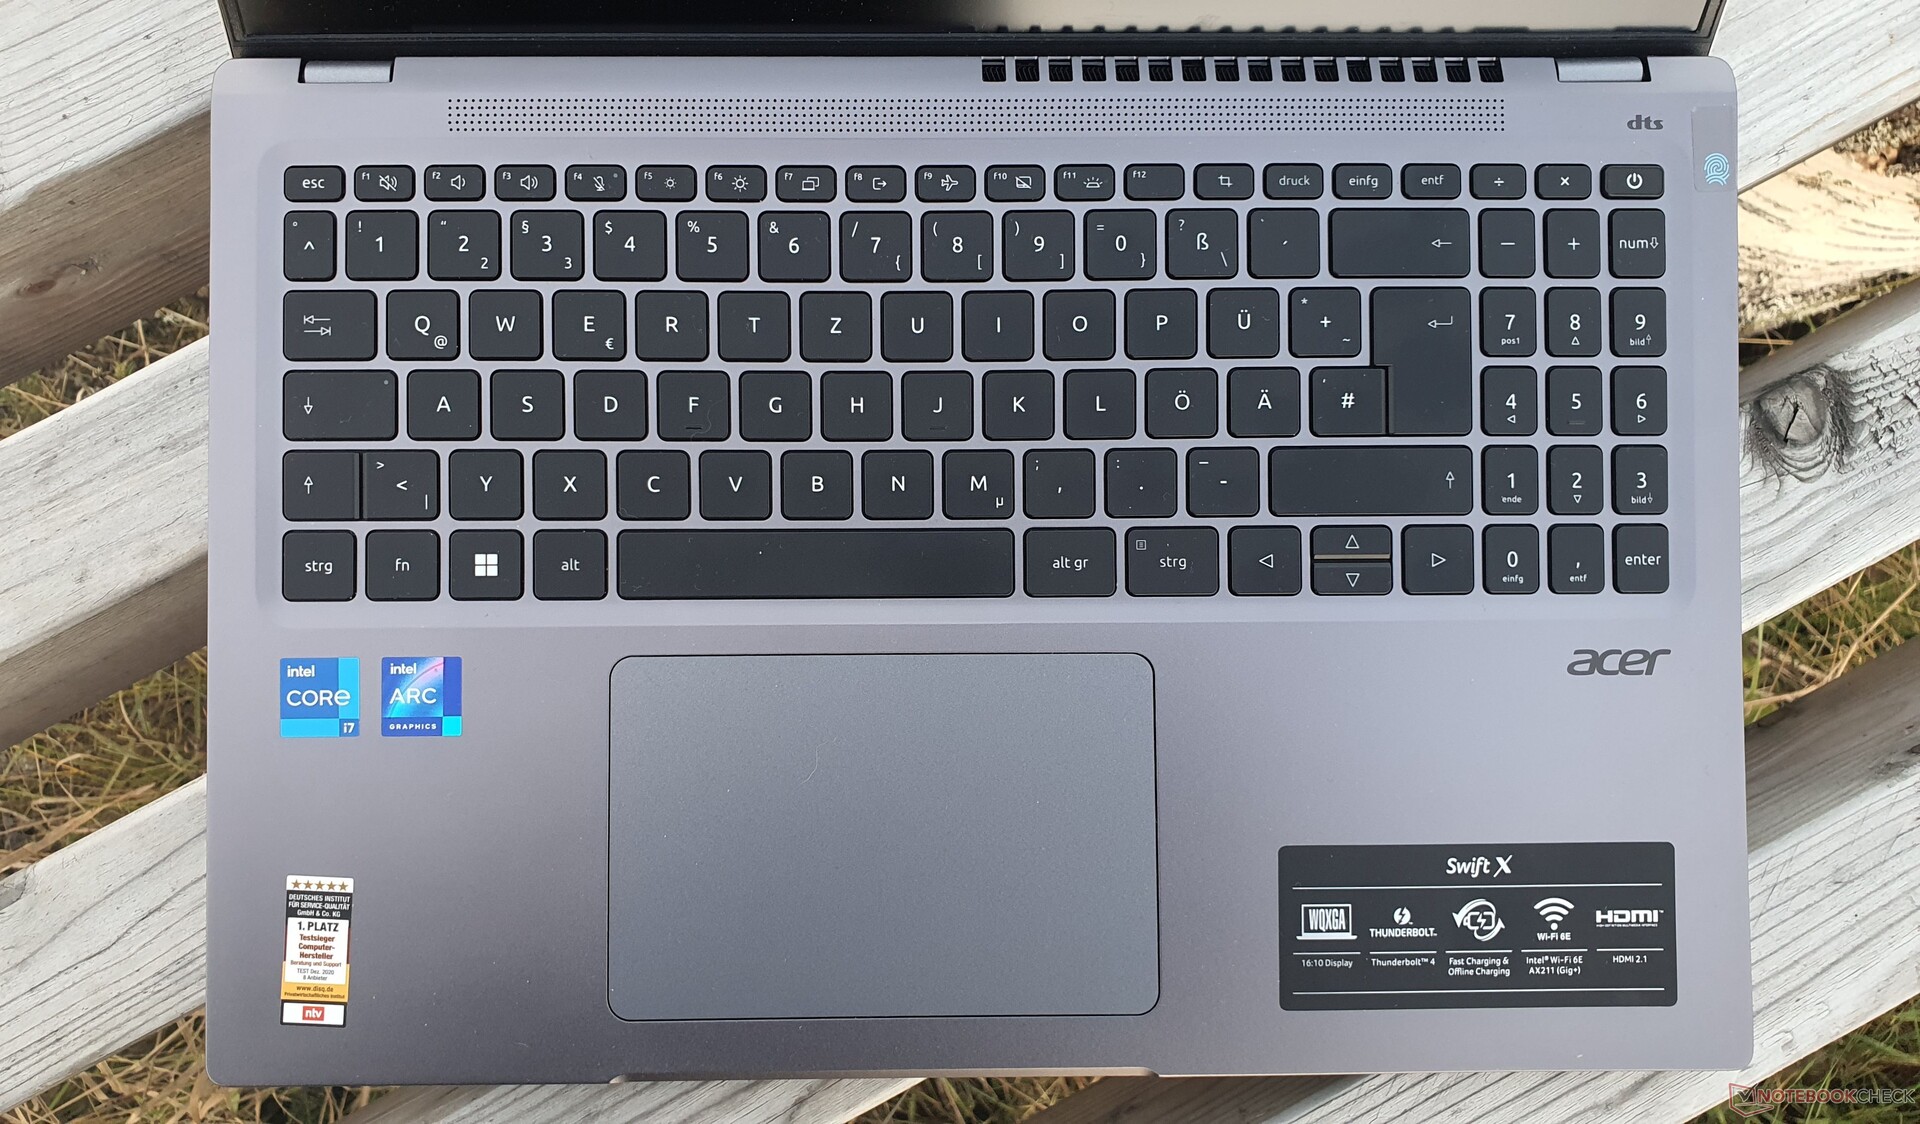
Pekplatta
I år har Acer utrustat Swift X 16 med sin OceanGlass-touchpad. Den 12,7 x 8,3 cm stora ytan är hal med en nästan oljig känsla, vilket gör det nästan omöjligt att göra exakta inmatningar. Drag-och-släpp-rörelser är också mycket svårare att utföra. De integrerade klicktangenterna med medelhögt slag är tråkiga och skramlar när fingrarna glider över pekplattan.
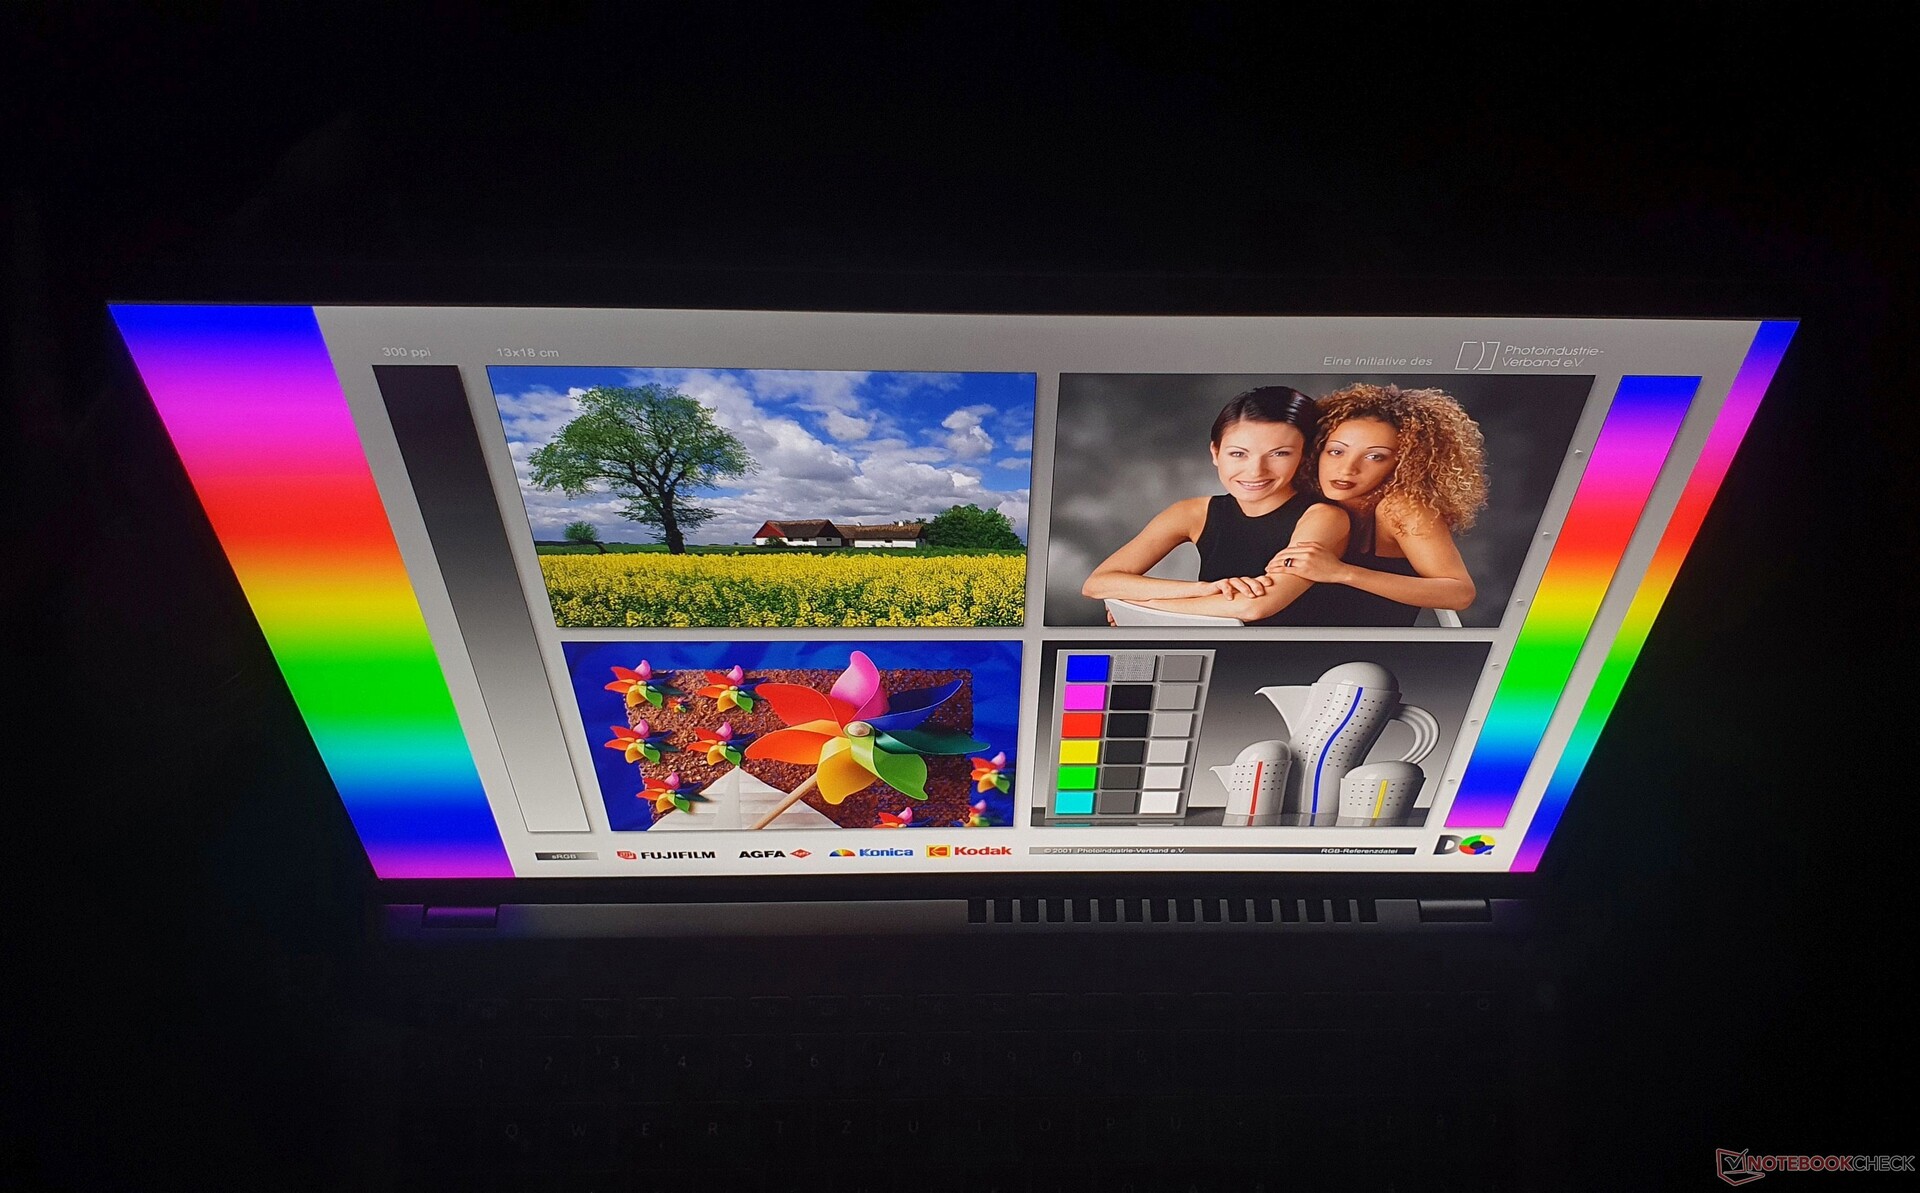
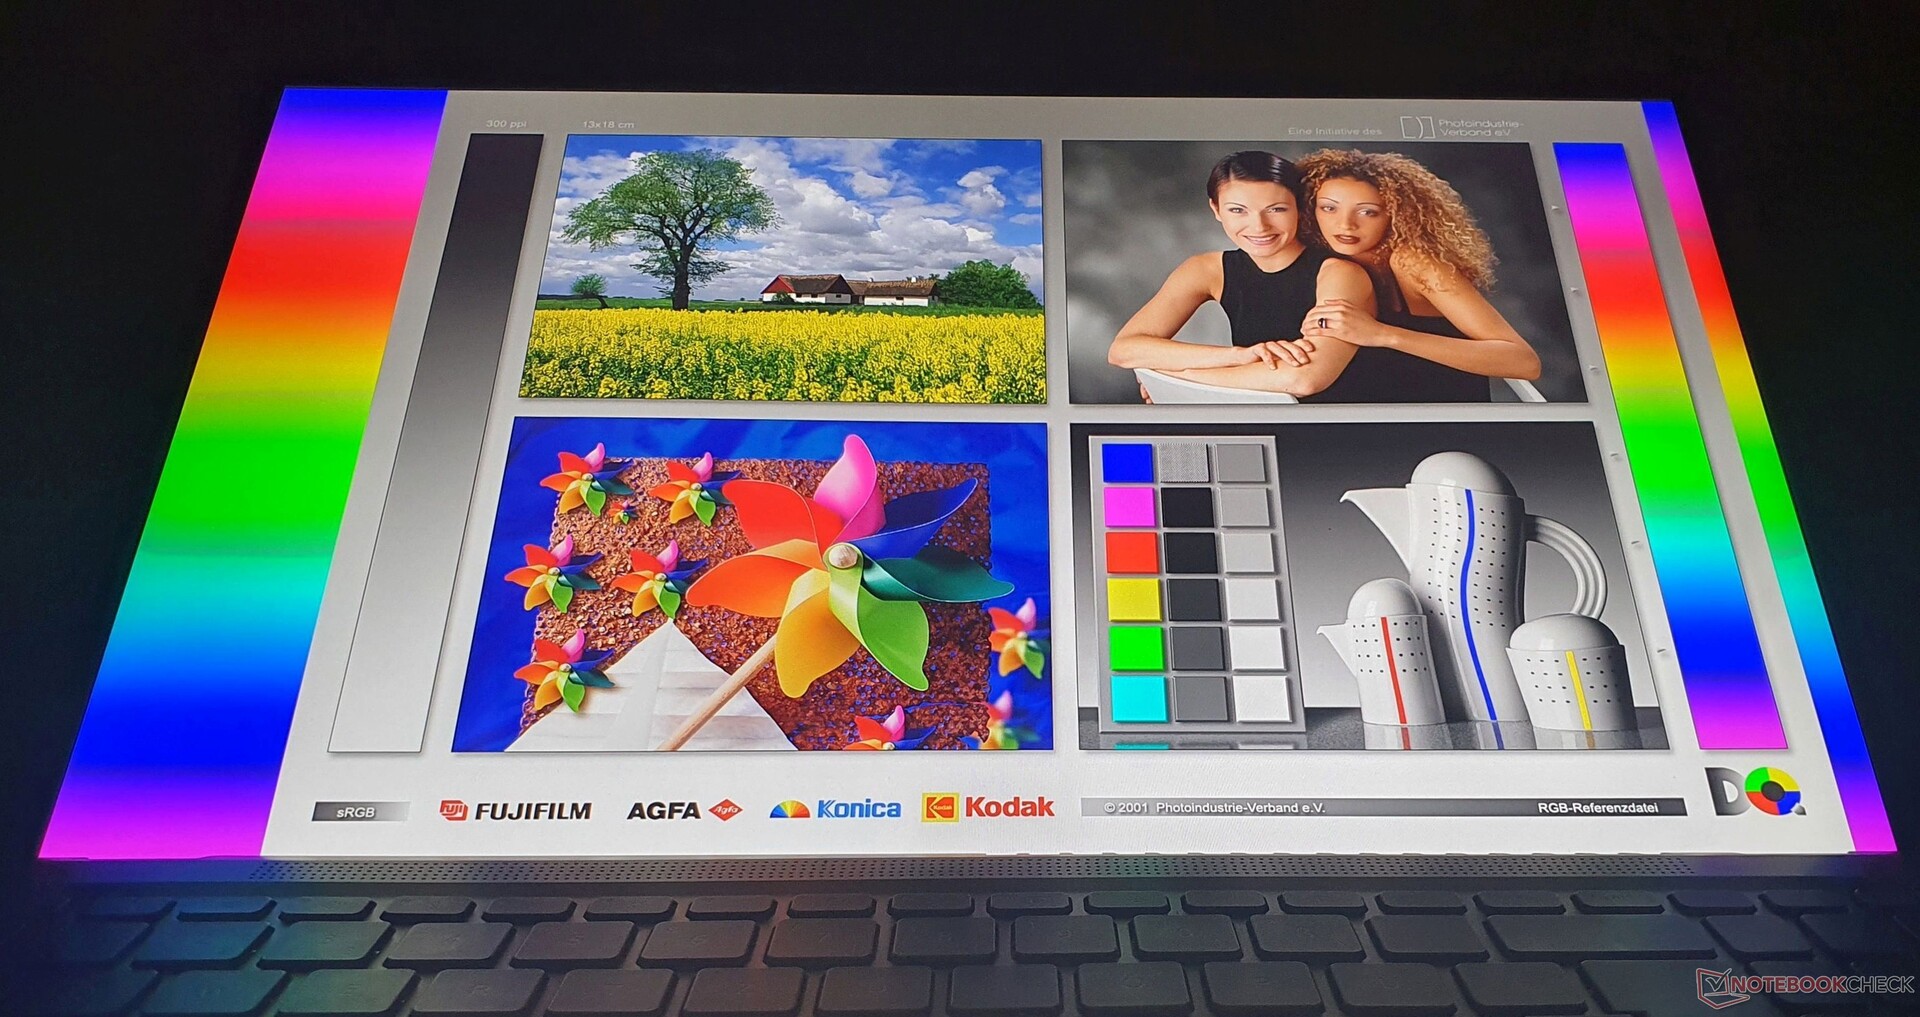
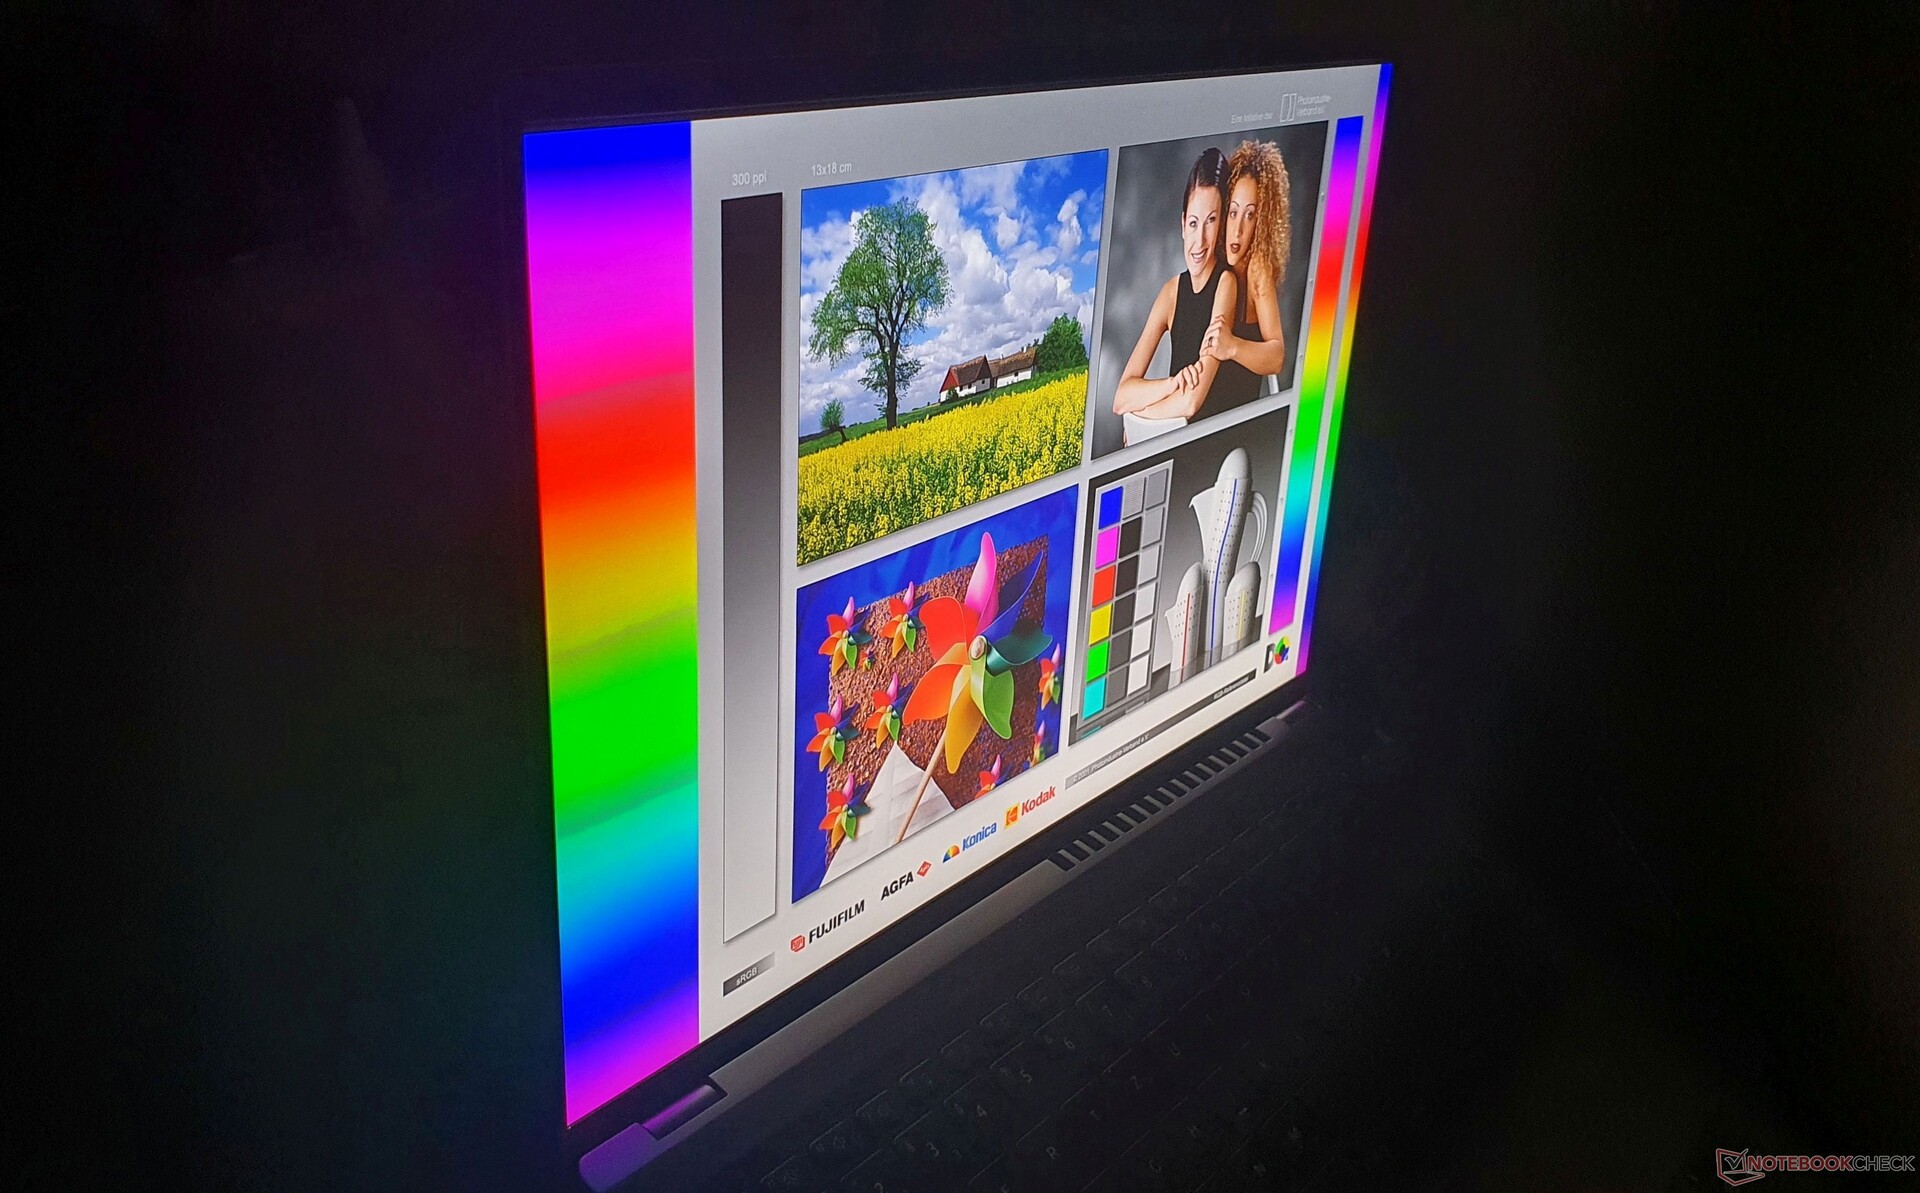
Visa: En ljusstark 2,5K-panel och äntligen 16:10 i Swift X 16

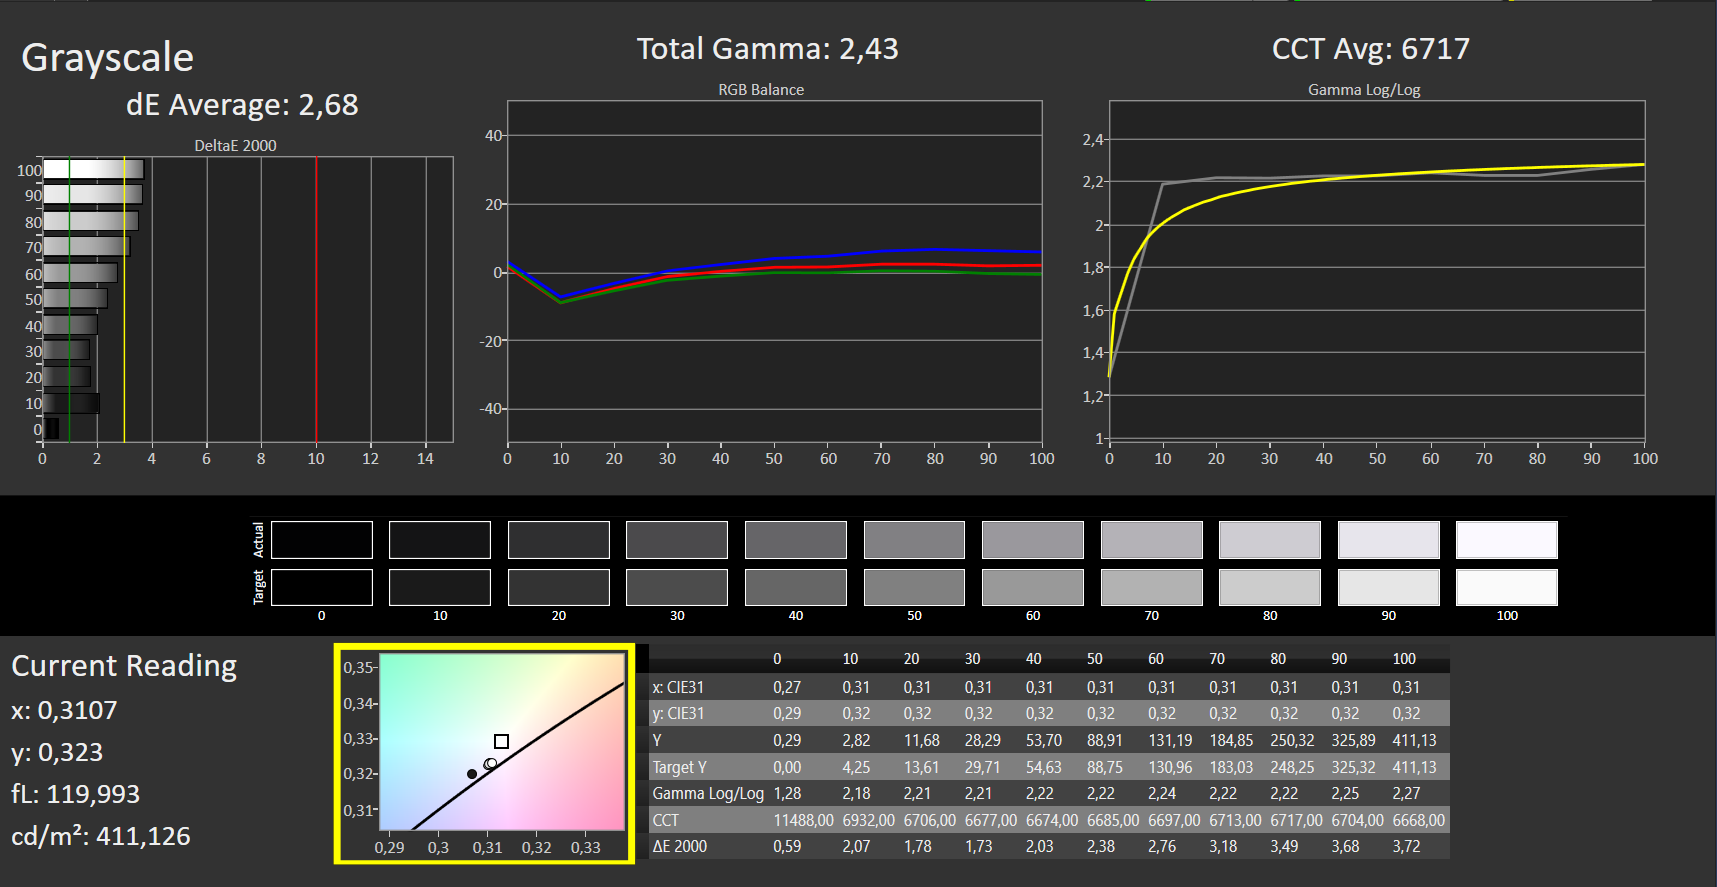
Den matta panelen med etiketten "B160QAN02.M" är densamma som i syskonmodellen. Till skillnad från föregångaren används 16:10-formatet här, och ljusstyrkan är nu drygt 378 nits.
Upplösningen på 2 560 x 1 600 pixlar i en 16-tums panel ger en skarp skärm. Asus Vivobook Pro 16Xoch HP:s Envy 16har en upplösning på 3 840 x 2 400 pixlar och OLED-paneler.
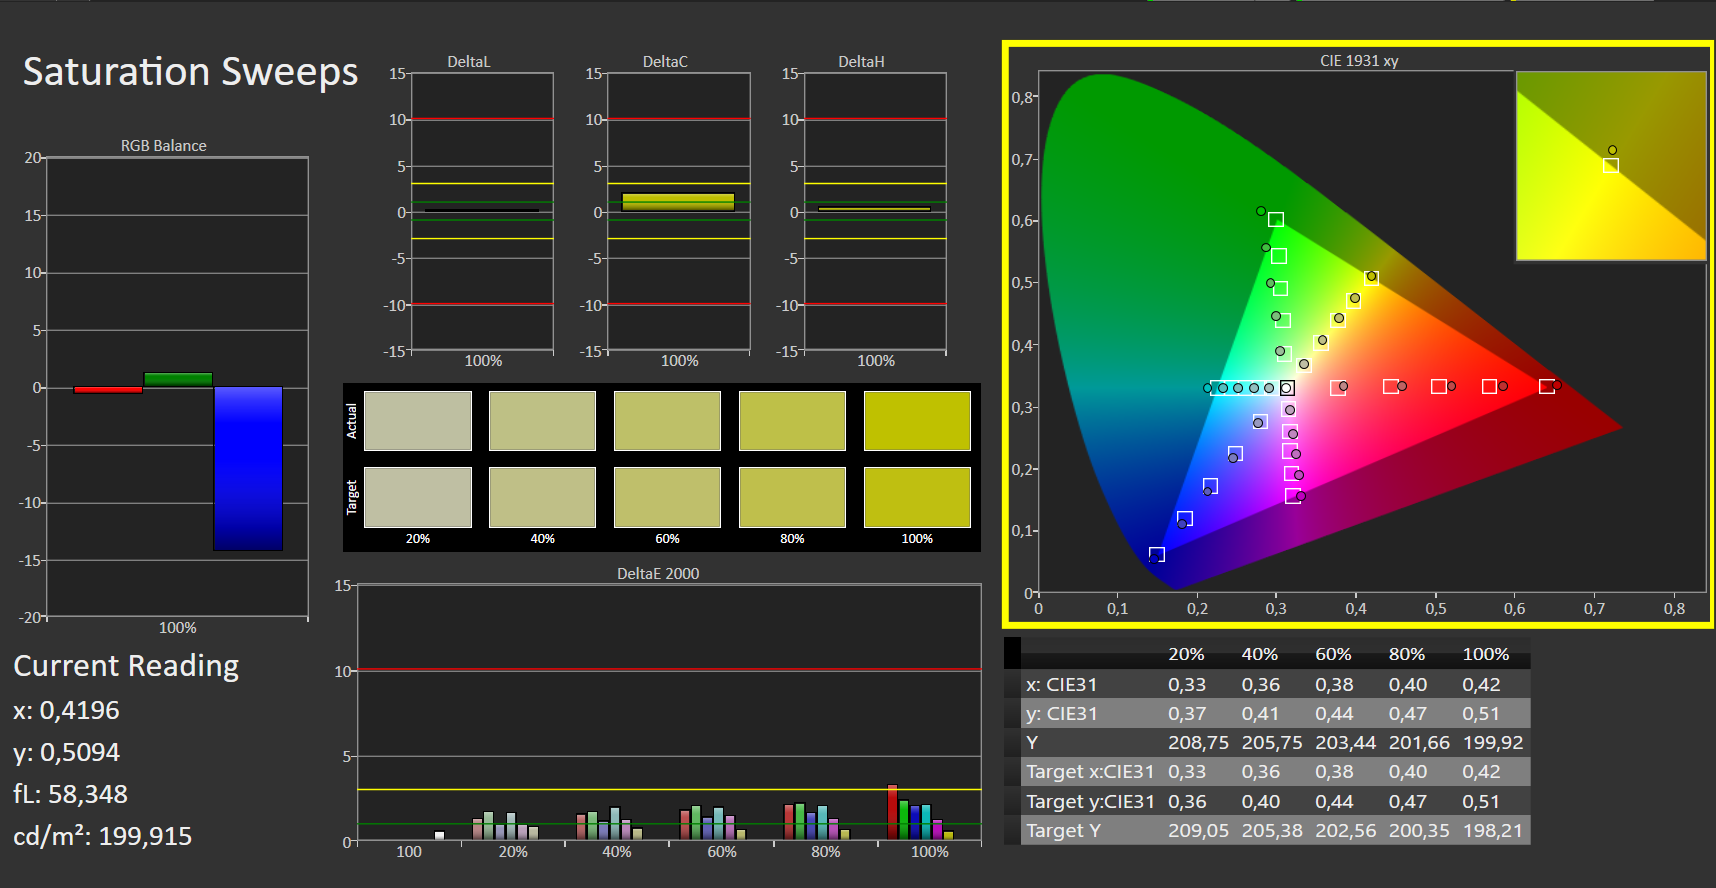
Kontrasten på 1 417:1 och svartvärdet på 0,29 nits leder till en mättad svart. Det vita värdet på 6 717 K ligger också nära idealet på 6 500 K
Med 83 % är ljusfördelningen inte särskilt jämn, men detta blir inte uppenbart i den dagliga driften. Alternativt finns även en panel med 1 920 x 1 200 pixlar. Det finns inget PWM-flimmer.
| |||||||||||||||||||||||||
Distribution av ljusstyrkan: 83 %
Mitt på batteriet: 411 cd/m²
Kontrast: 1417:1 (Svärta: 0.29 cd/m²)
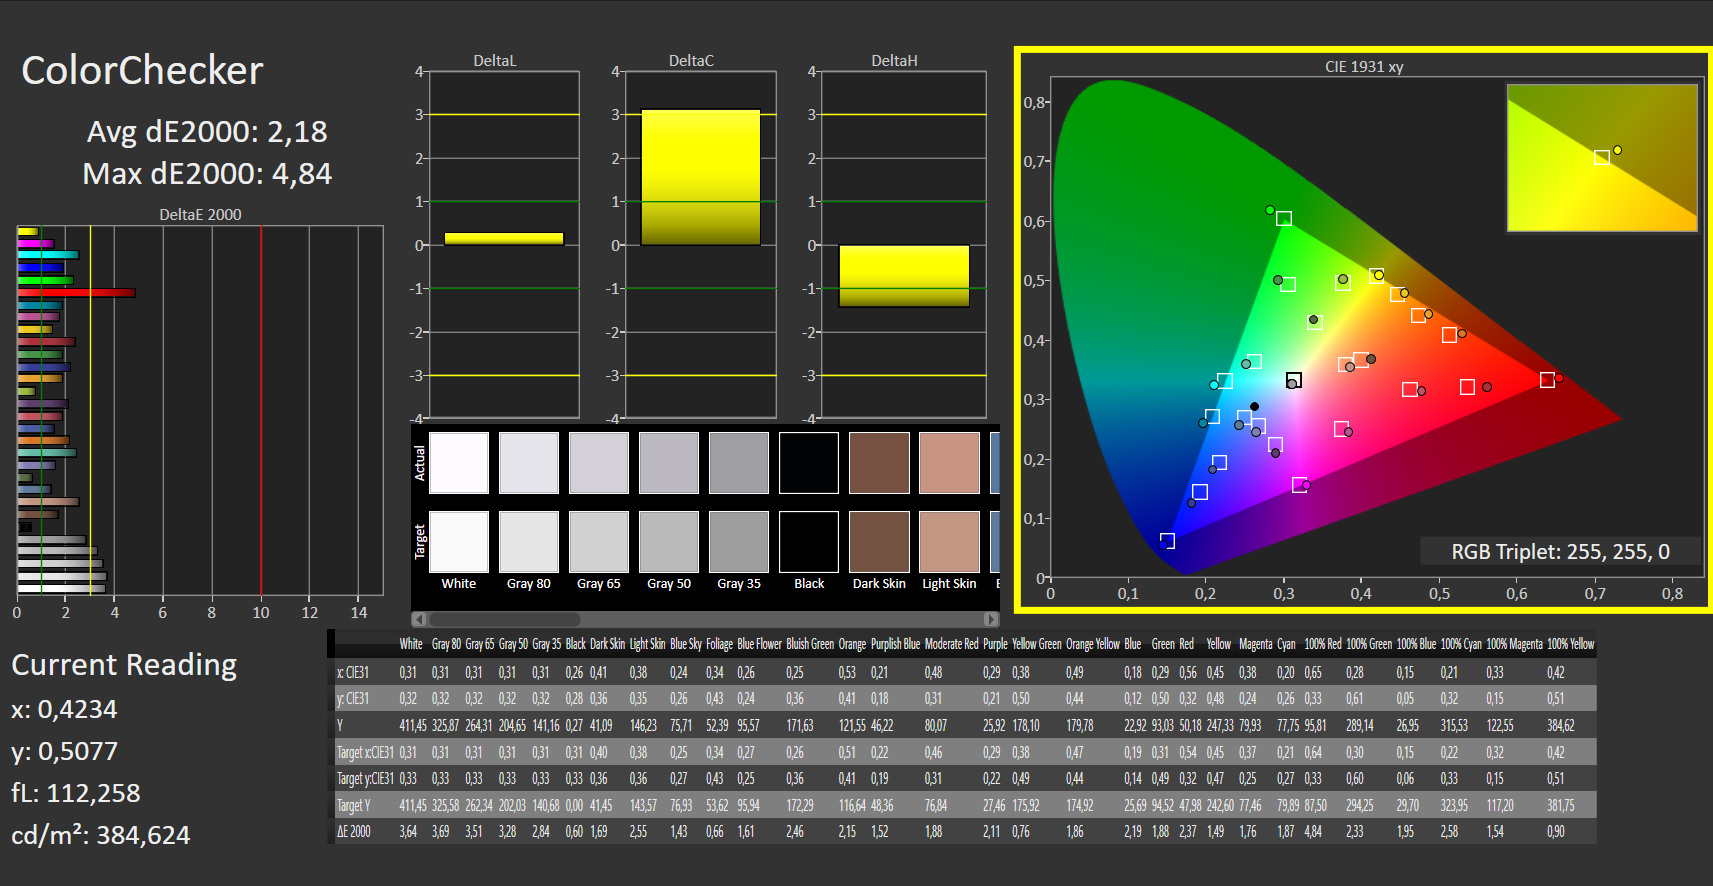
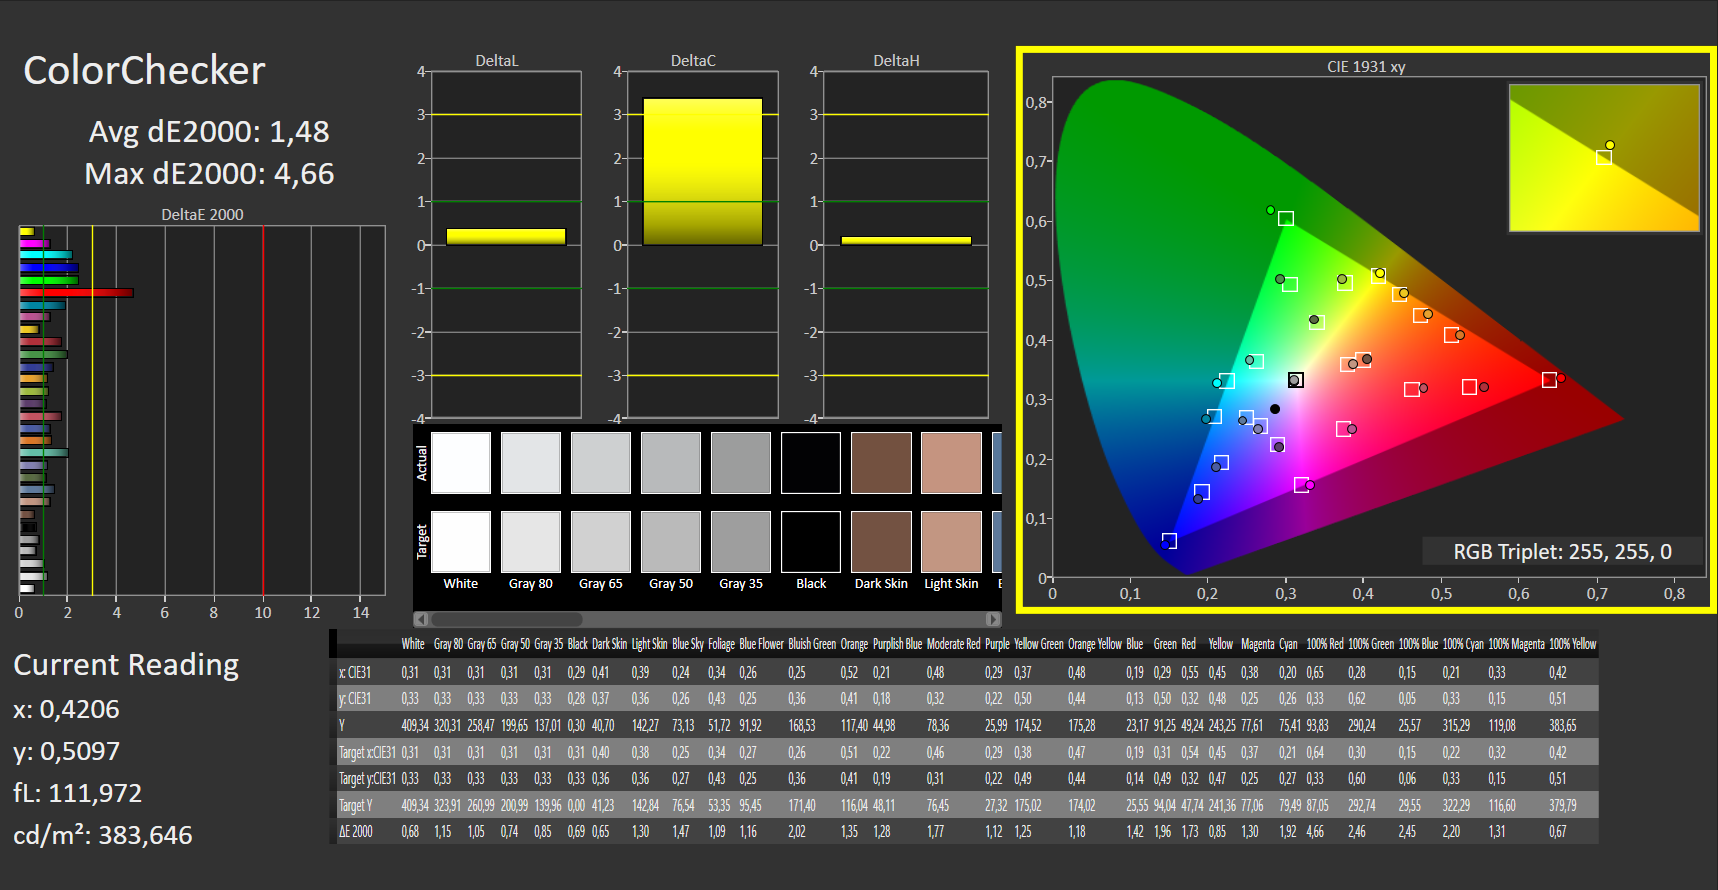
ΔE ColorChecker Calman: 2.18 | ∀{0.5-29.43 Ø4.72}
calibrated: 1.48
ΔE Greyscale Calman: 2.68 | ∀{0.09-98 Ø4.97}
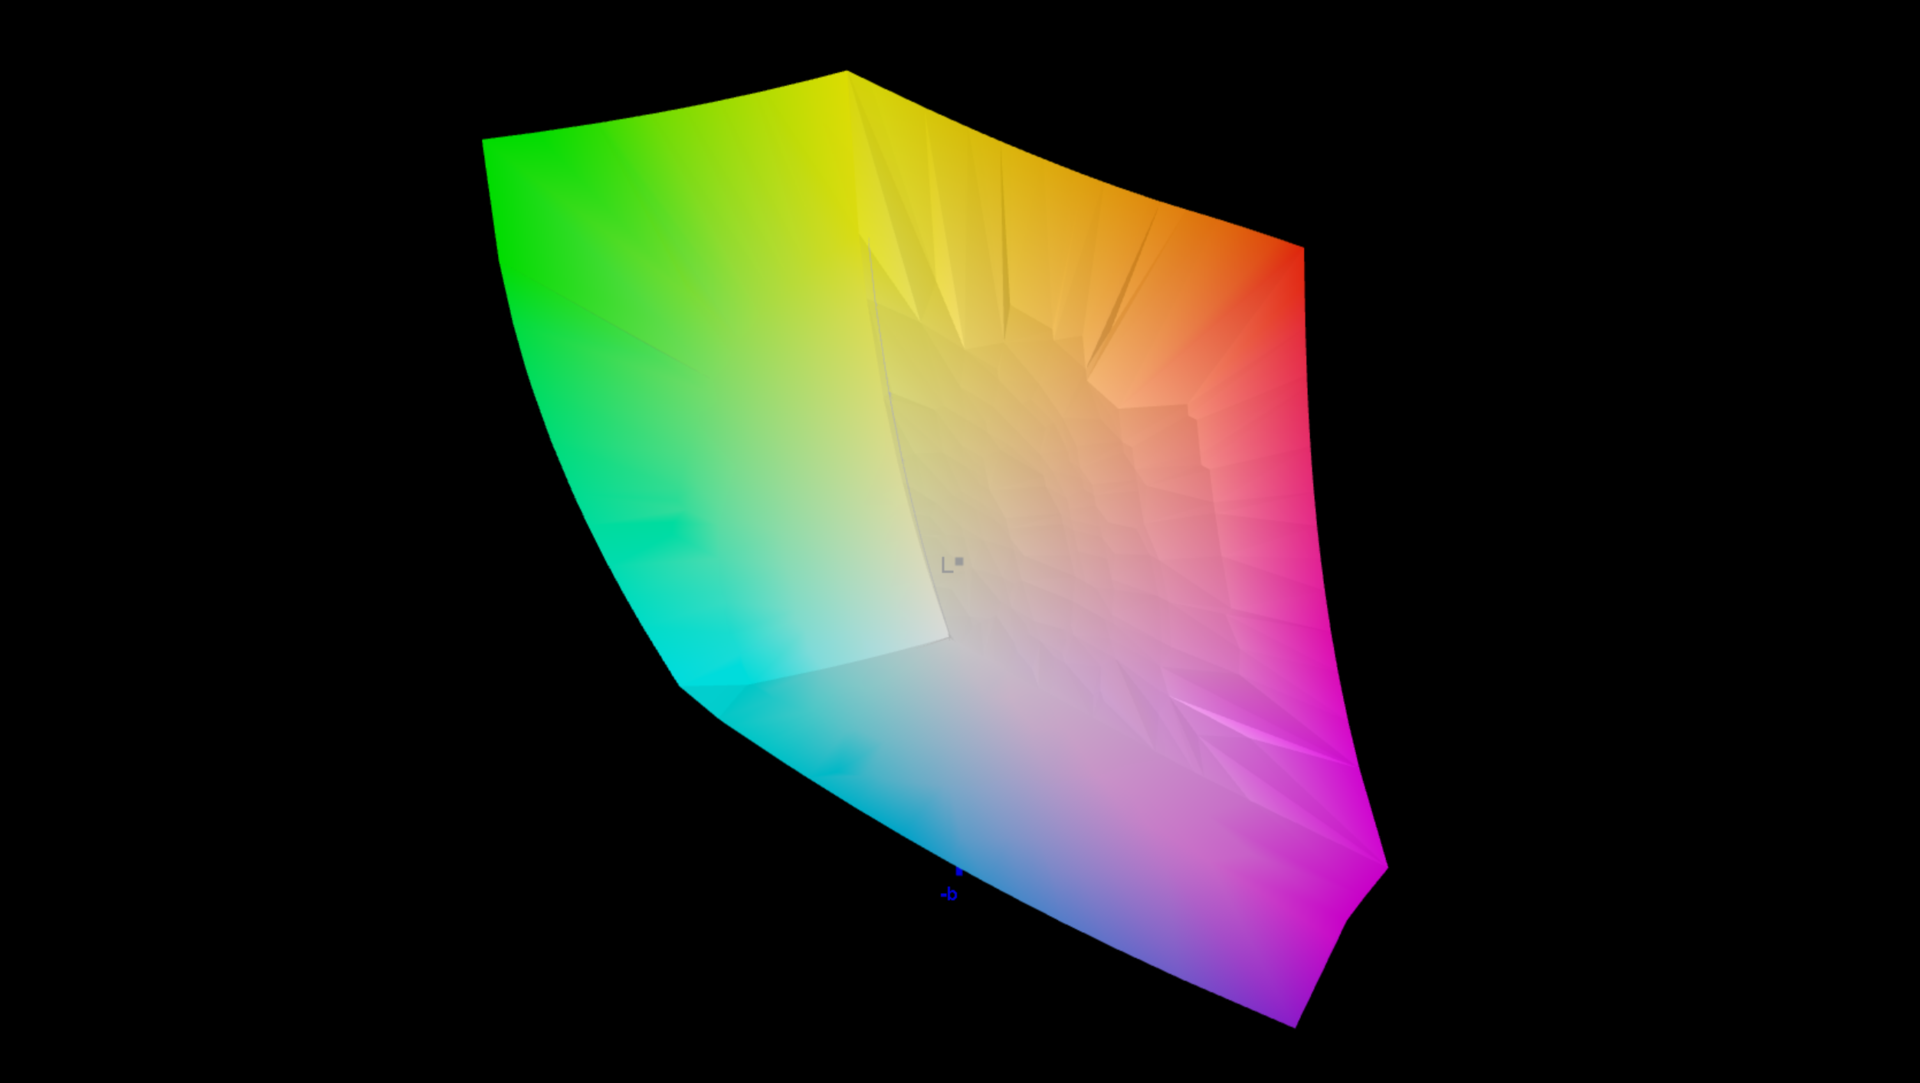
76.6% AdobeRGB 1998 (Argyll 3D)
100% sRGB (Argyll 3D)
76.4% Display P3 (Argyll 3D)
Gamma: 2.43
CCT: 6717 K
| Acer Swift X SFX16-52G-77RX B160QAN02.M, IPS-LED, 2560x1600, 16" | Acer Swift X SFX16-52G-52VE AU Optronics AUOBD9E, , 2560x1600, 16" | Acer Swift X SFX16-51G-5388 Chi Mei N161HCA-EA3, , 1920x1080, 16.1" | Lenovo ThinkBook 16 G4+ IAP LEN160WQXGA, IPS, 2560x1600, 16" | Dell Inspiron 16 Plus 7620 BOE NE16N41, IPS, 3072x1920, 16" | HP Envy 16 h0112nr Samsung SDC4174, OLED, 3840x2400, 16" | Lenovo IdeaPad 5 Pro 16ARH7 AUO B160QAN02.H, IPS, 2560x1600, 16" | Asus Vivobook Pro 16X-M7600QE Samsung ATNA60YV02-0, OLED, 3840x2400, 16.1" | |
|---|---|---|---|---|---|---|---|---|
| Display | -0% | -11% | -6% | -4% | 15% | -10% | 19% | |
| Display P3 Coverage (%) | 76.4 | 75.75 -1% | 65.1 -15% | 69.6 -9% | 70.8 -7% | 99.3 30% | 65 -15% | 99.8 31% |
| sRGB Coverage (%) | 100 | 100 0% | 95.65 -4% | 97.5 -2% | 99.5 0% | 100 0% | 98 -2% | 100 0% |
| AdobeRGB 1998 Coverage (%) | 76.6 | 76.51 0% | 66.75 -13% | 71.7 -6% | 73.2 -4% | 88 15% | 67.2 -12% | 96.9 27% |
| Response Times | -10% | -12% | -6% | -51% | 91% | 55% | 91% | |
| Response Time Grey 50% / Grey 80% * (ms) | 33 ? | 37 ? -12% | 30 ? 9% | 32.7 ? 1% | 38 ? -15% | 2 ? 94% | 14.1 ? 57% | 2 ? 94% |
| Response Time Black / White * (ms) | 15 ? | 16 ? -7% | 20 ? -33% | 16.8 ? -12% | 28 ? -87% | 1.9 ? 87% | 7.1 ? 53% | 2 ? 87% |
| PWM Frequency (Hz) | 240.4 ? | 60 ? | ||||||
| Screen | 14% | 11% | -1% | 10% | 7% | 2% | 12% | |
| Brightness middle (cd/m²) | 411 | 411 0% | 276 -33% | 371 -10% | 288.9 -30% | 328.8 -20% | 415 1% | 392 -5% |
| Brightness (cd/m²) | 378 | 364 -4% | 264 -30% | 357 -6% | 276 -27% | 332 -12% | 409 8% | 396 5% |
| Brightness Distribution (%) | 83 | 81 -2% | 85 2% | 91 10% | 92 11% | 97 17% | 91 10% | 98 18% |
| Black Level * (cd/m²) | 0.29 | 0.295 -2% | 0.16 45% | 0.23 21% | 0.26 10% | 0.32 -10% | ||
| Contrast (:1) | 1417 | 1393 -2% | 1725 22% | 1613 14% | 1111 -22% | 1297 -8% | ||
| Colorchecker dE 2000 * | 2.18 | 1.73 21% | 1.8 17% | 2.6 -19% | 1.88 14% | 1.53 30% | 1.92 12% | 1.74 20% |
| Colorchecker dE 2000 max. * | 4.84 | 2.7 44% | 3.77 22% | 4.4 9% | 4.37 10% | 6.04 -25% | 5.71 -18% | 3.18 34% |
| Colorchecker dE 2000 calibrated * | 1.48 | 1.18 20% | 0.63 57% | 1.3 12% | 0.42 72% | 0.58 61% | 1.85 -25% | |
| Greyscale dE 2000 * | 2.68 | 1.26 53% | 2.76 -3% | 3.7 -38% | 1.4 48% | 1.3 51% | 3.7 -38% | 1.77 34% |
| Gamma | 2.43 91% | 2.35 94% | 2.37 93% | 2.32 95% | 2.3 96% | 2.18 101% | 2.272 97% | 2.22 99% |
| CCT | 6717 97% | 6616 98% | 6564 99% | 7271 89% | 6634 98% | 6362 102% | 7132 91% | 6483 100% |
| Totalt genomsnitt (program/inställningar) | 1% /
8% | -4% /
3% | -4% /
-3% | -15% /
-2% | 38% /
24% | 16% /
7% | 41% /
27% |
* ... mindre är bättre
SRGB-färgrymden täcks till 100 %, vilket möjliggör mindre ambitiös bild- och videobearbetning.
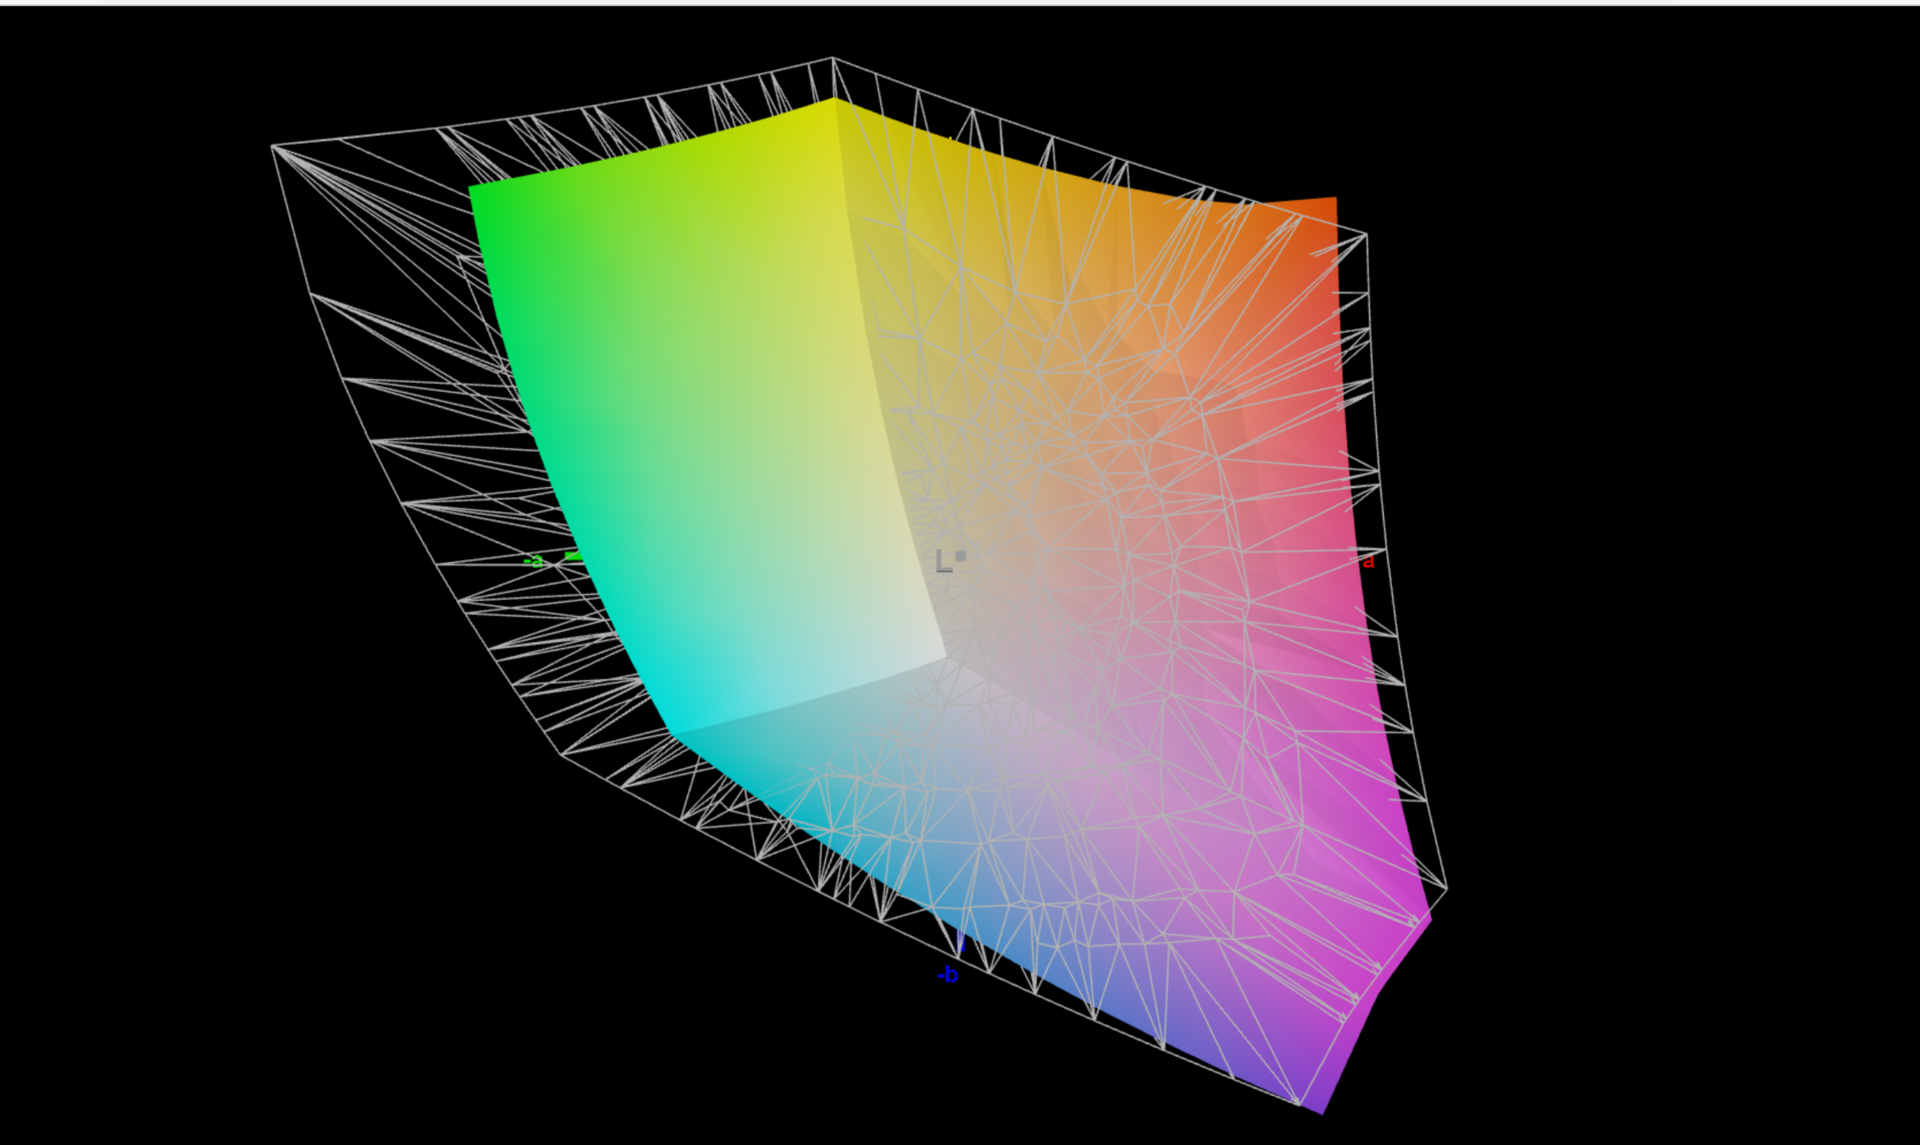
DeltaE-värdet på strax över 2 kan minskas till ännu mer exakta 1,48 efter vår kalibrering. Endast den röda färgen fortsätter att visa en betydande avvikelse vid ett värde strax under 5. Du kan ladda ner vår kalibrerade färgprofil i rutan till höger bredvid diagrammet för ljusfördelning.


Visa svarstider
| ↔ Svarstid svart till vitt | ||
|---|---|---|
| 15 ms ... stiga ↗ och falla ↘ kombinerat | ↗ 5 ms stiga |  |
| ↘ 10 ms hösten | ||
| Skärmen visar bra svarsfrekvens i våra tester, men kan vara för långsam för konkurrenskraftiga spelare. I jämförelse sträcker sig alla testade enheter från 0.1 (minst) till 240 (maximalt) ms. » 36 % av alla enheter är bättre. Det betyder att den uppmätta svarstiden är bättre än genomsnittet av alla testade enheter (19.8 ms). | ||
| ↔ Svarstid 50 % grått till 80 % grått | ||
| 33 ms ... stiga ↗ och falla ↘ kombinerat | ↗ 15 ms stiga |  |
| ↘ 18 ms hösten | ||
| Skärmen visar långsamma svarsfrekvenser i våra tester och kommer att vara otillfredsställande för spelare. I jämförelse sträcker sig alla testade enheter från 0.165 (minst) till 636 (maximalt) ms. » 45 % av alla enheter är bättre. Det betyder att den uppmätta svarstiden liknar genomsnittet av alla testade enheter (31 ms). | ||
Skärmflimmer / PWM (Puls-Width Modulation)
| Skärmflimmer / PWM upptäcktes inte |    | ||
Som jämförelse: 52 % av alla testade enheter använder inte PWM för att dämpa skärmen. Om PWM upptäcktes mättes ett medelvärde av 7769 (minst: 5 - maximum: 343500) Hz. | |||
Tack vare den matta skärmytan är skärmens ljusstyrka på 378 nits tillräcklig för att du ska kunna använda Acer Swift X 16 även utomhus. Du bör dock fortfarande undvika direkt solljus.
Prestanda: Snabb Turbo men svag Intel Arc A370M
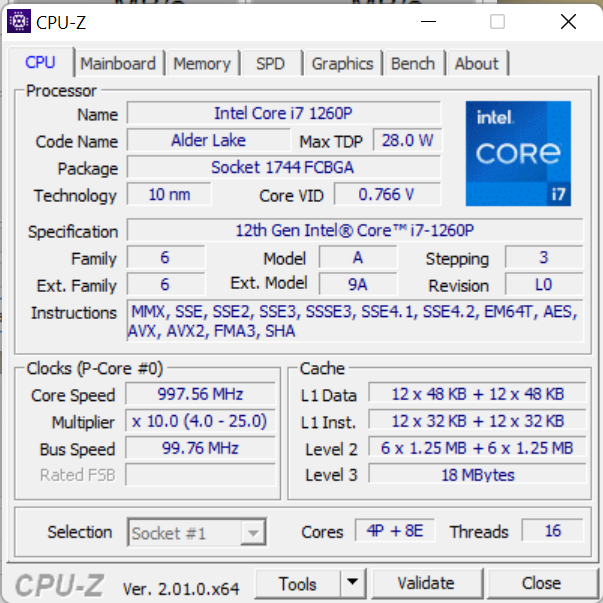
Medan syskonmodellen använder en Intel Core i5-1240Poch en 512 GB PCIe 4.0 SSD som enda alternativt alternativ, har vår testenhet en Core i7-1260Poch en snabbare 1 TB SSD. AMD-versioner finns inte tillgängliga. Båda modellerna erbjuder 16 GB lödda DDR5-4800 RAM och Intels Arc A370M. Den bärbara 16-tumsdatorn är utformad till exempel för enkel videoklippning och mediekonsumtion, inklusive Full-HD-spel.
Testförhållanden
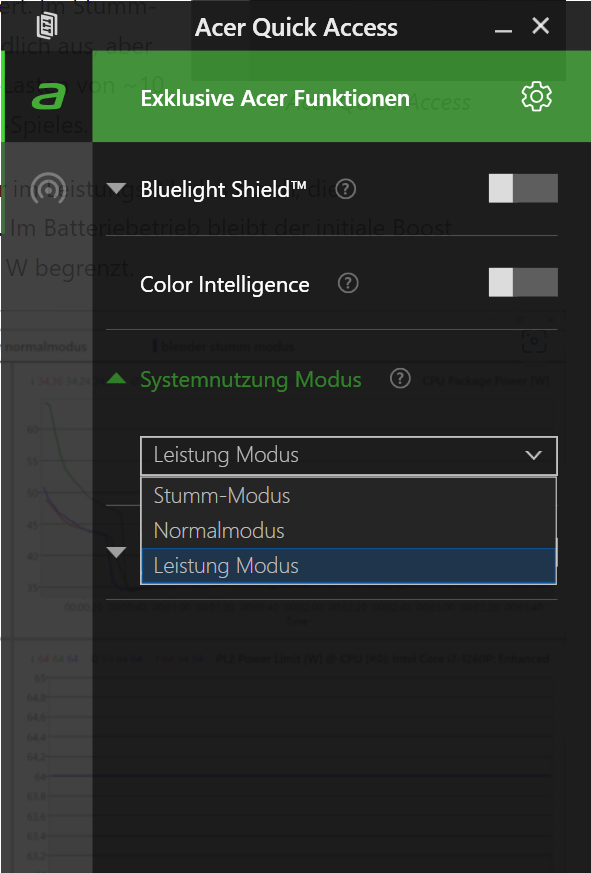
Med "Acer Quick Access" kan du välja mellan tre prestandaprofiler. De har dock bara effekt på Intels Arc GPUsom diagrammet nedan visar. Fläktbeteendet ändras också, vilket vi förklarar i avsnittet "Utsläpp" nedan.
Vi kör våra prestandarelaterade tester i läget Prestanda och bestämmer batteritiden i läget Normal. I batteridrift är den initiala boostningen på 64 watt helt utelämnad, och CPU:n är begränsad till 28 watt.
| Prestandaläge | Normalläge | Tyst läge | Batteriläge | |
|---|---|---|---|---|
| CPU | 64 W > 35 W | 56 W > 35 W | 53 W > 35 W | 28 W |
| GPU | 35 W | 25 W | 20 W | 25 W |
Processor
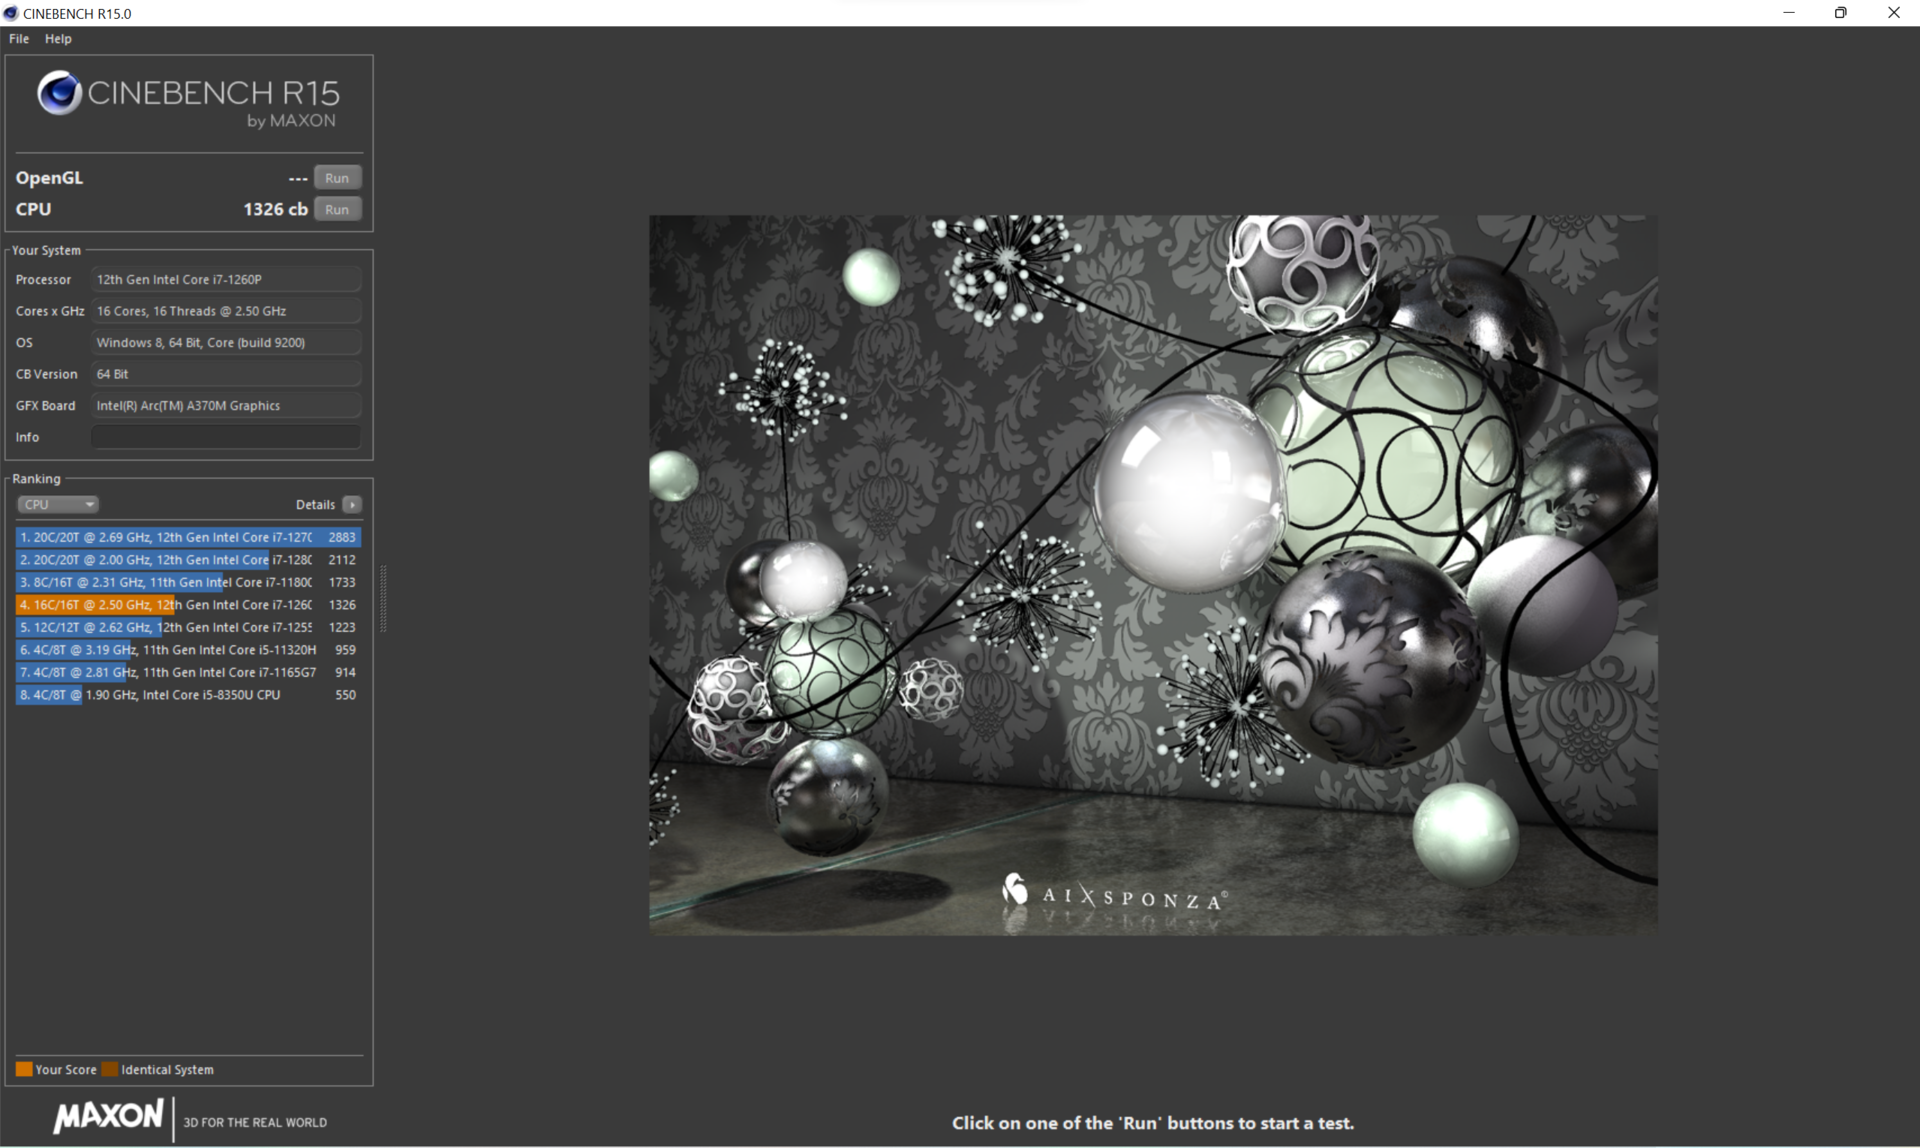
Intel Core i7-1260Pligger på samma nivå som Core i5 i syskonmodellen. Det finns endast en 10-procentig fördel när det gäller enkelkärnig prestanda. Enligt detta är den extra premie på 200 euro (~198 dollar) inte motiverad, trots den större SSD-enheten.
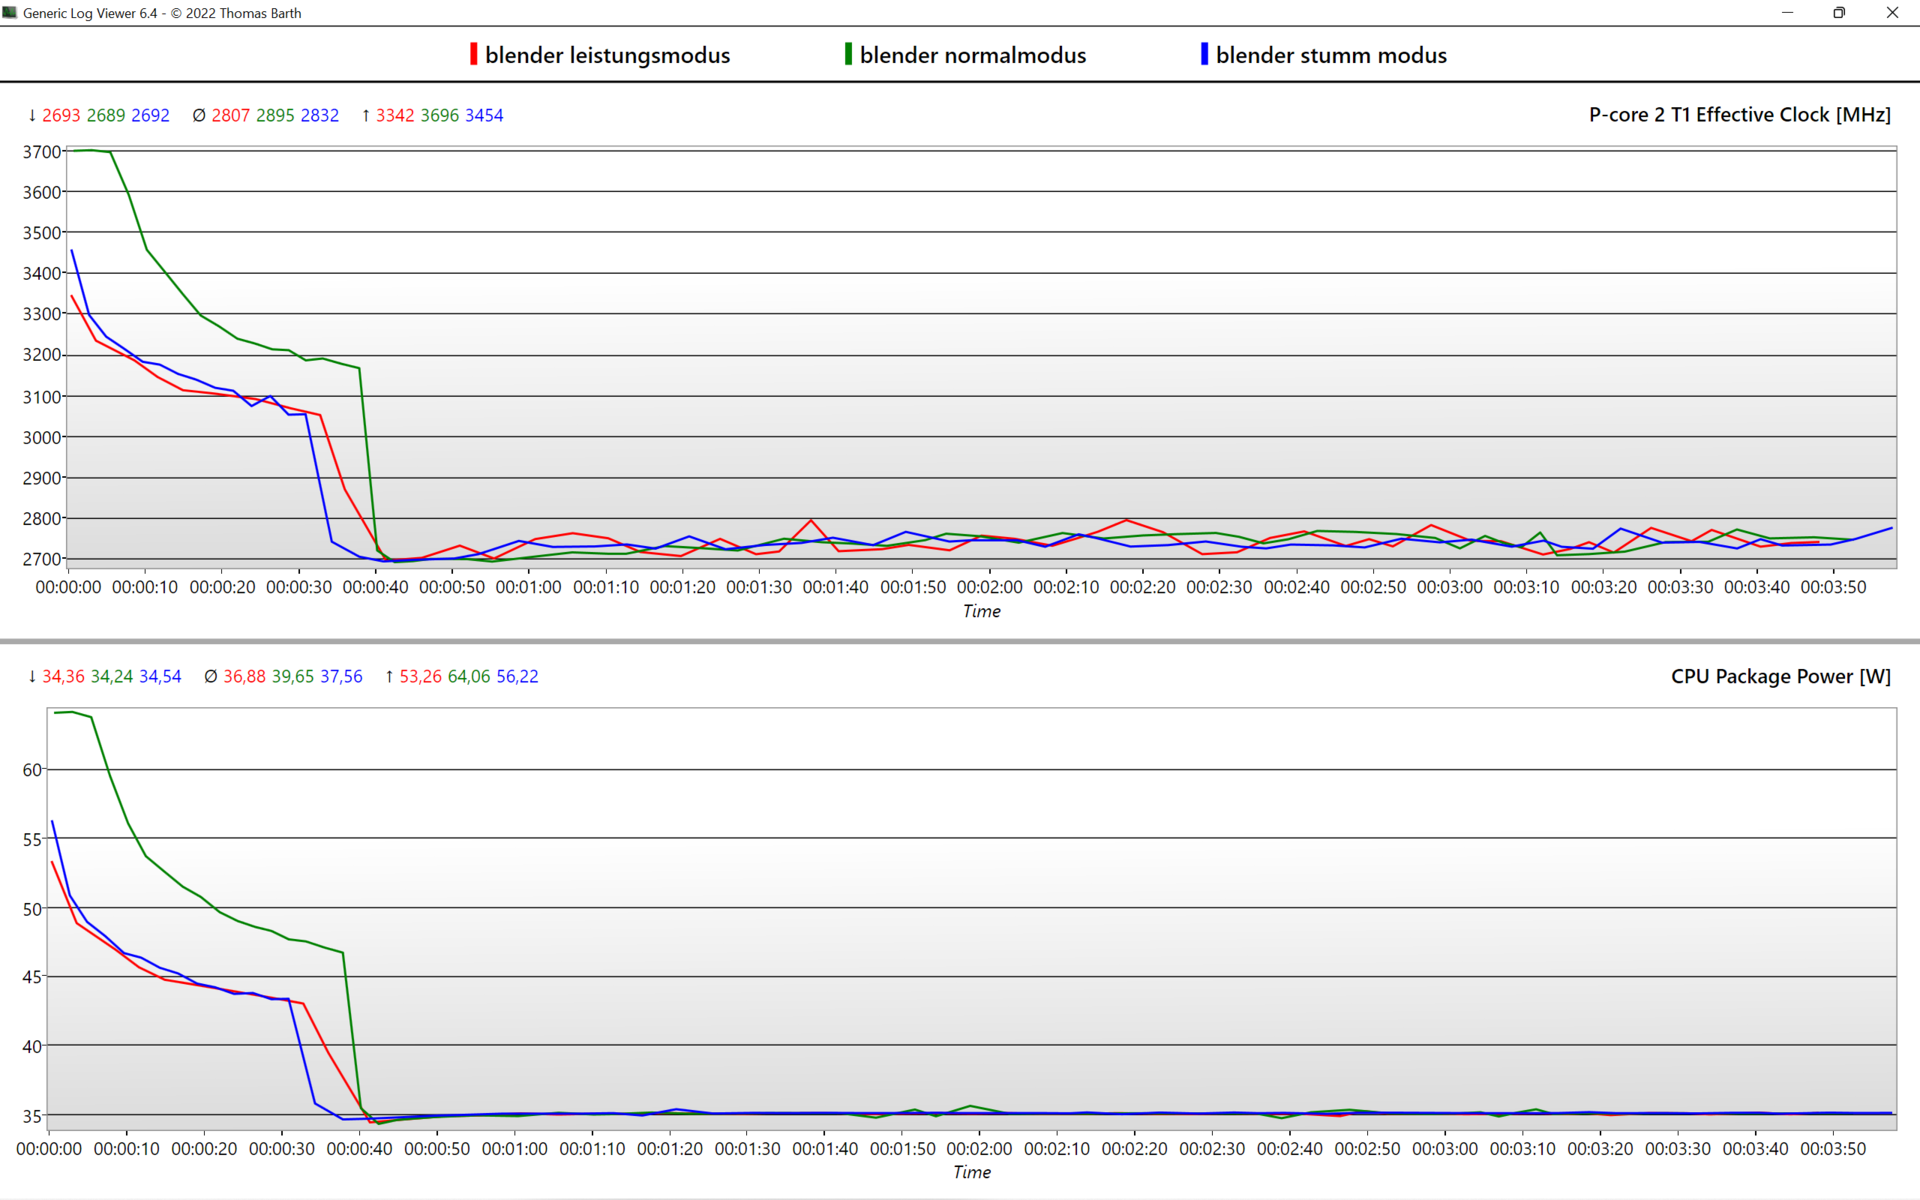
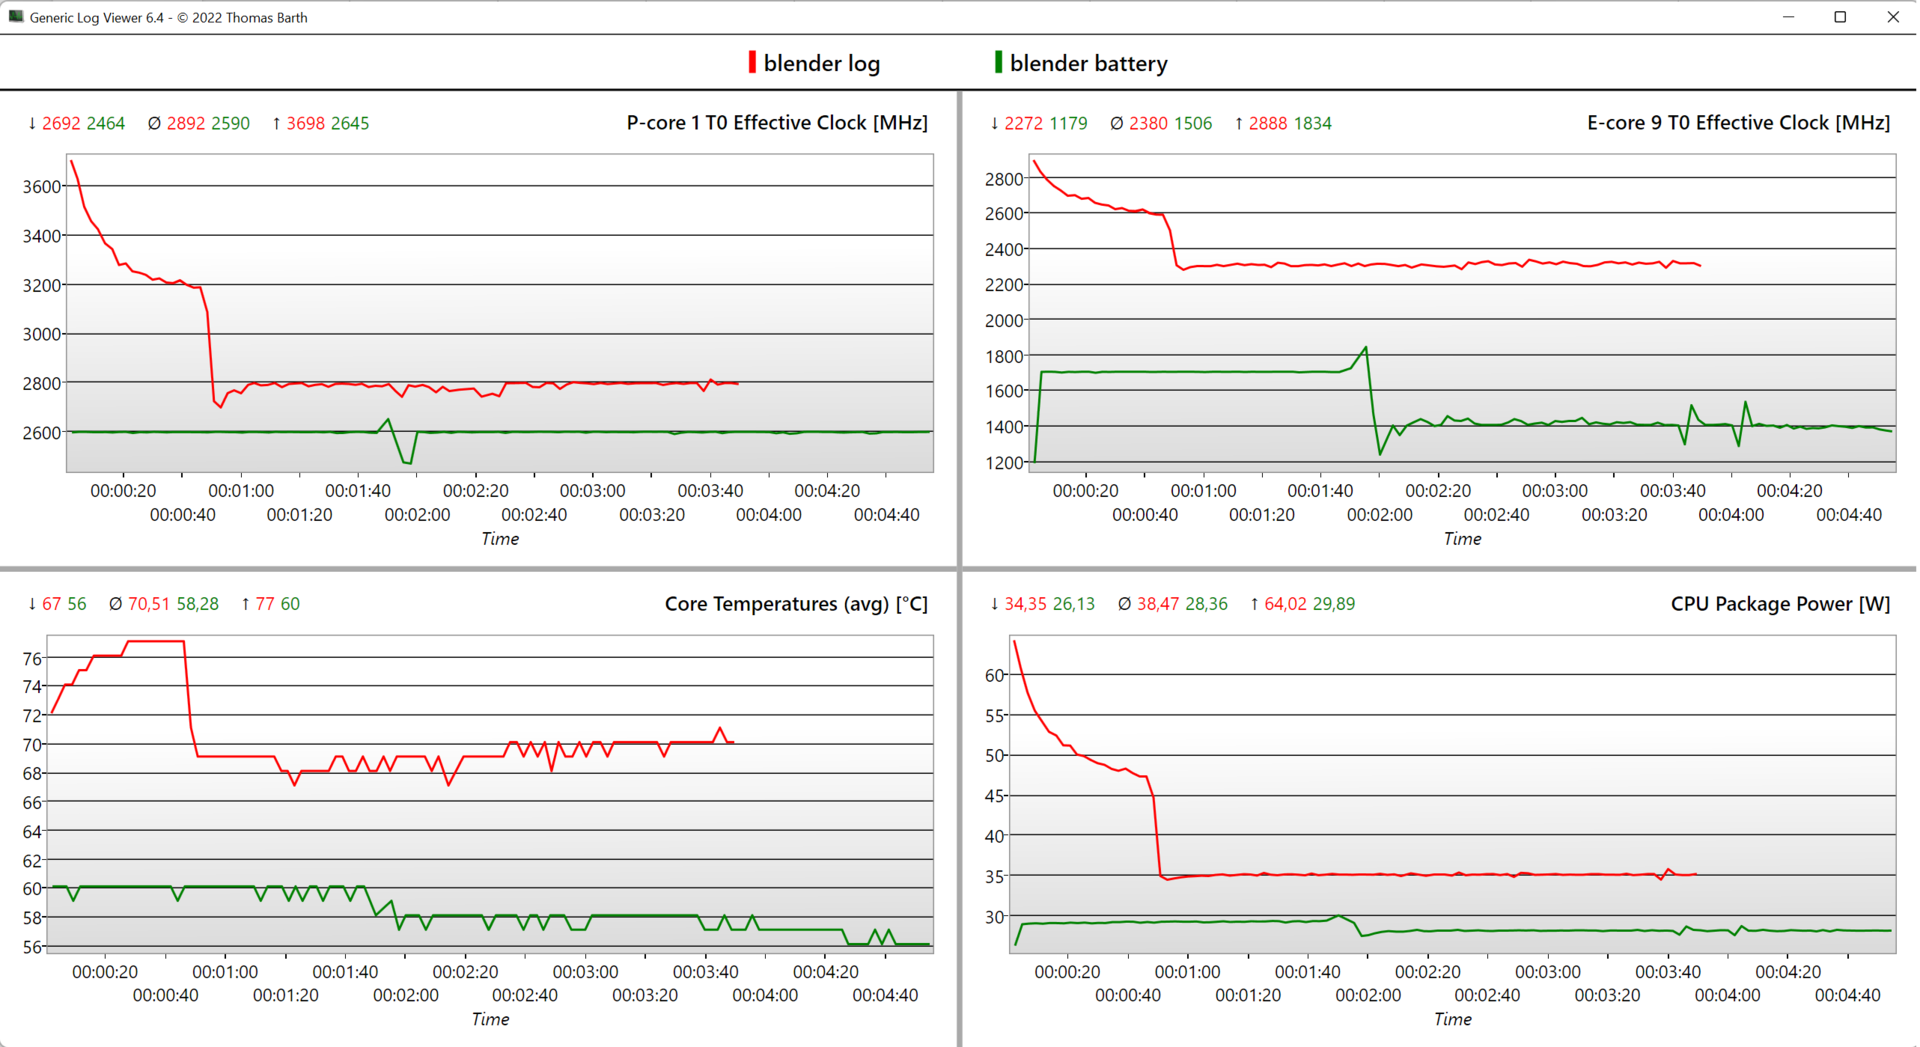
I början börjar P-kärnorna med en klockfrekvens på 3,7 GHz, för att sedan gradvis sjunka till 3,2 GHz inom 40 sekunder, och när effektgränsen på 35 watt slår igenom planar de slutligen ut på en konstant 2,8 GHz. Kärnornas temperatur jämnar ut sig på lämpliga 70 °C (158 °F).
Den långsiktiga prestandan överträffar den för föregångaren med en fyrkärnig CPUmed ~65 % med samma effektgräns på 35 watt. Även AMD:s Ryzen 9 5900X i Asus Vivobook Pro 16Xär bara marginellt snabbare i de flesta scenarier. MenThinkBook 16 G4+och Dells Inspiron 16 Plusleder rankingen med en betydande fördel tack vare sina Core i7-12700Hmed högre effektgränser.
Eftersom det inte finns någon Turbo boost och effekten är begränsad till 28 watt vid batteridrift sjunker prestandan med 20-30 %, beroende på scenario.
Cinebench R15 Multi Constant Load Test
Cinebench R23: Multi Core | Single Core
Cinebench R20: CPU (Multi Core) | CPU (Single Core)
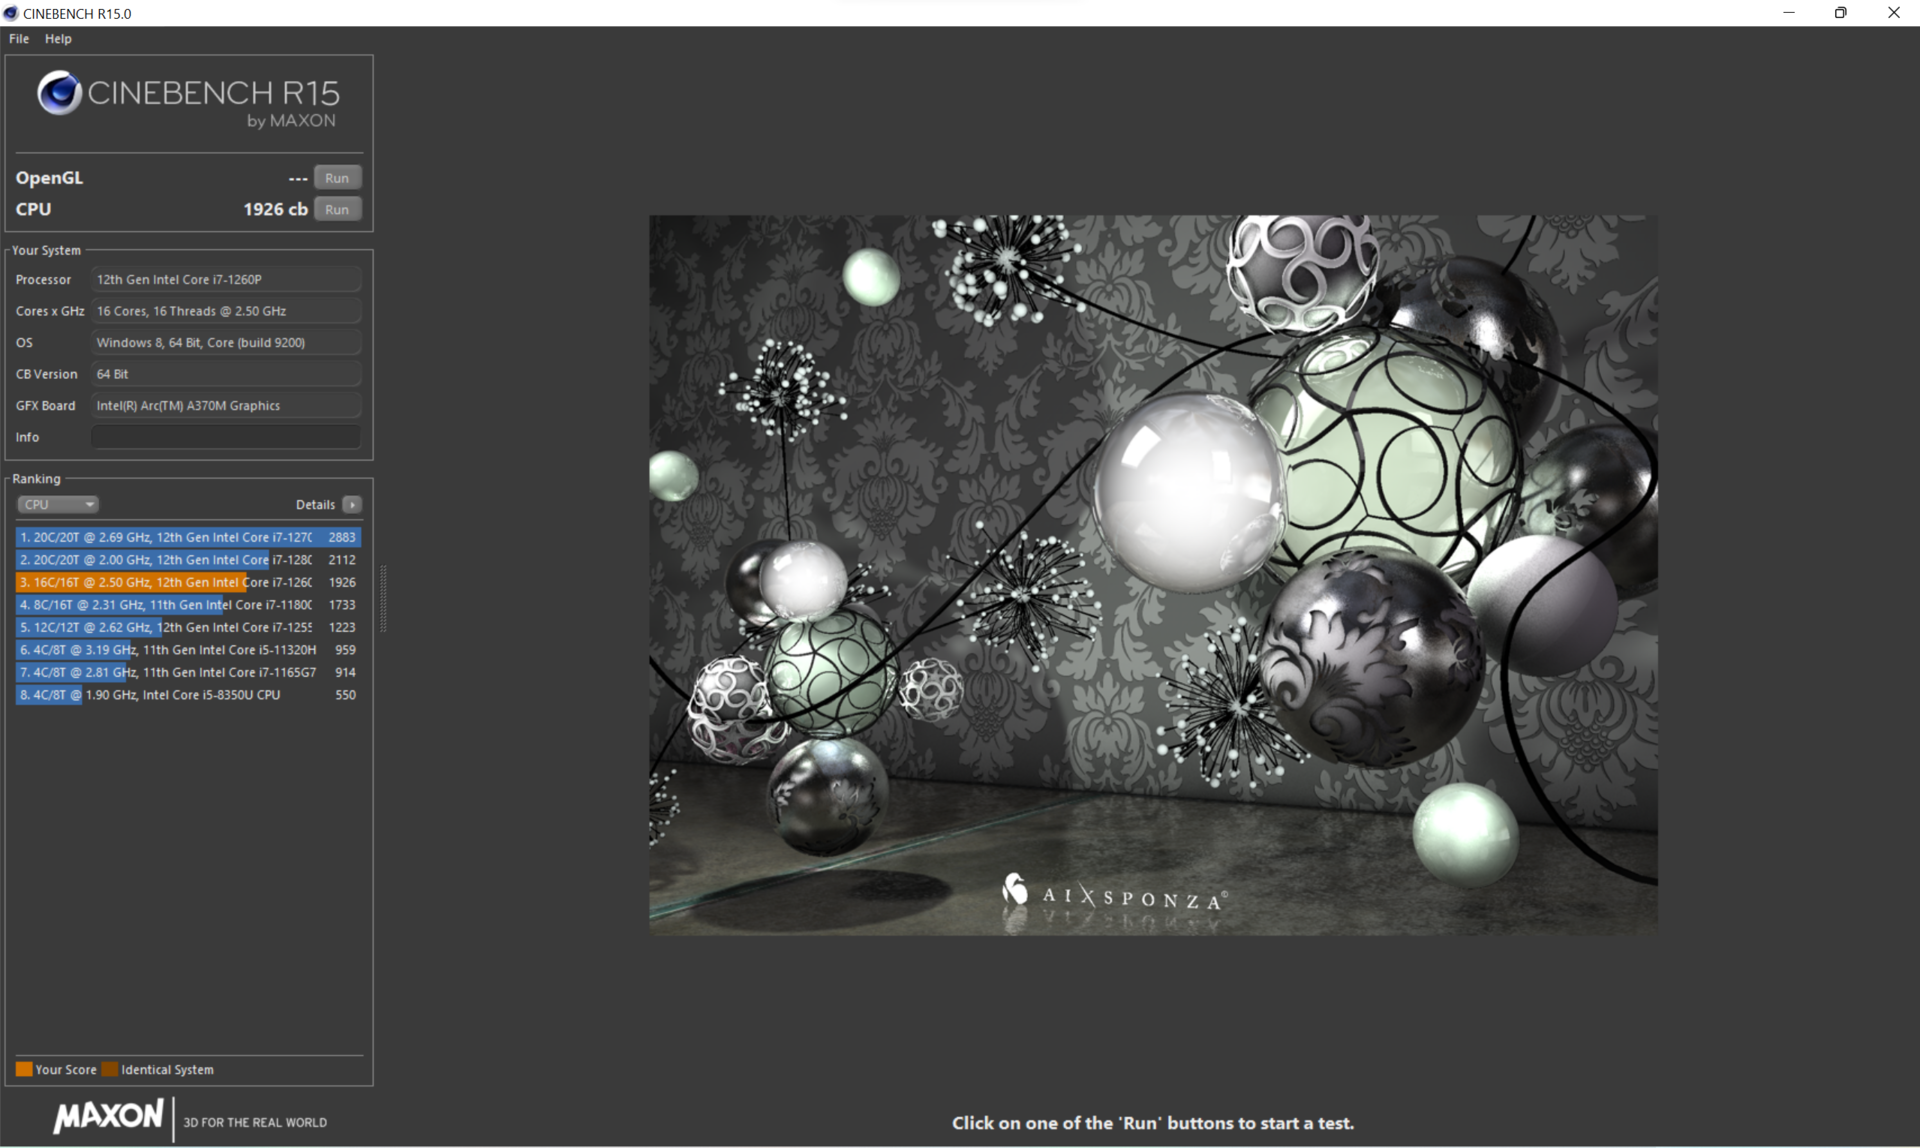
Cinebench R15: CPU Multi 64Bit | CPU Single 64Bit
Blender: v2.79 BMW27 CPU
7-Zip 18.03: 7z b 4 | 7z b 4 -mmt1
Geekbench 5.5: Multi-Core | Single-Core
HWBOT x265 Benchmark v2.2: 4k Preset
LibreOffice : 20 Documents To PDF
R Benchmark 2.5: Overall mean
| CPU Performance rating | |
| Genomsnitt av klass Multimedia | |
| Lenovo ThinkBook 16 G4+ IAP | |
| Dell Inspiron 16 Plus 7620 | |
| HP Envy 16 h0112nr | |
| Asus Vivobook Pro 16X-M7600QE | |
| Acer Swift X SFX16-52G-77RX | |
| Acer Swift X SFX16-52G-52VE | |
| Genomsnitt Intel Core i7-1260P | |
| Lenovo IdeaPad 5 Pro 16ARH7 | |
| Acer Swift X SFX16-51G-5388 | |
| Cinebench R23 / Multi Core | |
| Genomsnitt av klass Multimedia (4861 - 33362, n=81, senaste 2 åren) | |
| Lenovo ThinkBook 16 G4+ IAP | |
| Dell Inspiron 16 Plus 7620 | |
| HP Envy 16 h0112nr | |
| Asus Vivobook Pro 16X-M7600QE | |
| Asus Vivobook Pro 16X-M7600QE | |
| Acer Swift X SFX16-52G-77RX | |
| Acer Swift X SFX16-52G-52VE | |
| Genomsnitt Intel Core i7-1260P (3173 - 12150, n=27) | |
| Lenovo IdeaPad 5 Pro 16ARH7 | |
| Acer Swift X SFX16-51G-5388 | |
| Cinebench R23 / Single Core | |
| Genomsnitt av klass Multimedia (1128 - 2459, n=73, senaste 2 åren) | |
| Lenovo ThinkBook 16 G4+ IAP | |
| HP Envy 16 h0112nr | |
| Dell Inspiron 16 Plus 7620 | |
| Acer Swift X SFX16-52G-77RX | |
| Genomsnitt Intel Core i7-1260P (1155 - 1812, n=25) | |
| Acer Swift X SFX16-52G-52VE | |
| Asus Vivobook Pro 16X-M7600QE | |
| Asus Vivobook Pro 16X-M7600QE | |
| Lenovo IdeaPad 5 Pro 16ARH7 | |
| Acer Swift X SFX16-51G-5388 | |
| Cinebench R20 / CPU (Multi Core) | |
| Genomsnitt av klass Multimedia (1887 - 12912, n=64, senaste 2 åren) | |
| Lenovo ThinkBook 16 G4+ IAP | |
| Dell Inspiron 16 Plus 7620 | |
| HP Envy 16 h0112nr | |
| Asus Vivobook Pro 16X-M7600QE | |
| Asus Vivobook Pro 16X-M7600QE | |
| Acer Swift X SFX16-52G-77RX | |
| Acer Swift X SFX16-52G-52VE | |
| Lenovo IdeaPad 5 Pro 16ARH7 | |
| Genomsnitt Intel Core i7-1260P (1234 - 4748, n=25) | |
| Acer Swift X SFX16-51G-5388 | |
| Cinebench R20 / CPU (Single Core) | |
| Genomsnitt av klass Multimedia (425 - 853, n=64, senaste 2 åren) | |
| Lenovo ThinkBook 16 G4+ IAP | |
| HP Envy 16 h0112nr | |
| Dell Inspiron 16 Plus 7620 | |
| Acer Swift X SFX16-52G-77RX | |
| Genomsnitt Intel Core i7-1260P (448 - 698, n=25) | |
| Acer Swift X SFX16-52G-52VE | |
| Lenovo IdeaPad 5 Pro 16ARH7 | |
| Asus Vivobook Pro 16X-M7600QE | |
| Asus Vivobook Pro 16X-M7600QE | |
| Acer Swift X SFX16-51G-5388 | |
| Cinebench R15 / CPU Multi 64Bit | |
| Genomsnitt av klass Multimedia (856 - 5224, n=68, senaste 2 åren) | |
| HP Envy 16 h0112nr | |
| Lenovo ThinkBook 16 G4+ IAP | |
| Dell Inspiron 16 Plus 7620 | |
| Asus Vivobook Pro 16X-M7600QE | |
| Asus Vivobook Pro 16X-M7600QE | |
| Acer Swift X SFX16-52G-77RX | |
| Acer Swift X SFX16-52G-52VE | |
| Lenovo IdeaPad 5 Pro 16ARH7 | |
| Genomsnitt Intel Core i7-1260P (549 - 2034, n=29) | |
| Acer Swift X SFX16-51G-5388 | |
| Cinebench R15 / CPU Single 64Bit | |
| Genomsnitt av klass Multimedia (184.8 - 326, n=66, senaste 2 åren) | |
| Lenovo ThinkBook 16 G4+ IAP | |
| HP Envy 16 h0112nr | |
| Dell Inspiron 16 Plus 7620 | |
| Acer Swift X SFX16-52G-77RX | |
| Asus Vivobook Pro 16X-M7600QE | |
| Asus Vivobook Pro 16X-M7600QE | |
| Lenovo IdeaPad 5 Pro 16ARH7 | |
| Acer Swift X SFX16-52G-52VE | |
| Genomsnitt Intel Core i7-1260P (165.4 - 260, n=27) | |
| Acer Swift X SFX16-51G-5388 | |
| Blender / v2.79 BMW27 CPU | |
| Acer Swift X SFX16-51G-5388 | |
| Genomsnitt Intel Core i7-1260P (264 - 906, n=26) | |
| Lenovo IdeaPad 5 Pro 16ARH7 | |
| Acer Swift X SFX16-52G-52VE | |
| Acer Swift X SFX16-52G-77RX | |
| Asus Vivobook Pro 16X-M7600QE | |
| Asus Vivobook Pro 16X-M7600QE | |
| HP Envy 16 h0112nr | |
| Genomsnitt av klass Multimedia (100 - 557, n=65, senaste 2 åren) | |
| Dell Inspiron 16 Plus 7620 | |
| Lenovo ThinkBook 16 G4+ IAP | |
| 7-Zip 18.03 / 7z b 4 | |
| Lenovo ThinkBook 16 G4+ IAP | |
| Dell Inspiron 16 Plus 7620 | |
| Genomsnitt av klass Multimedia (26062 - 130368, n=62, senaste 2 åren) | |
| Asus Vivobook Pro 16X-M7600QE | |
| Asus Vivobook Pro 16X-M7600QE | |
| HP Envy 16 h0112nr | |
| Acer Swift X SFX16-52G-52VE | |
| Lenovo IdeaPad 5 Pro 16ARH7 | |
| Acer Swift X SFX16-52G-77RX | |
| Genomsnitt Intel Core i7-1260P (16146 - 47064, n=25) | |
| Acer Swift X SFX16-51G-5388 | |
| 7-Zip 18.03 / 7z b 4 -mmt1 | |
| Genomsnitt av klass Multimedia (3666 - 7545, n=63, senaste 2 åren) | |
| Asus Vivobook Pro 16X-M7600QE | |
| Asus Vivobook Pro 16X-M7600QE | |
| HP Envy 16 h0112nr | |
| Lenovo ThinkBook 16 G4+ IAP | |
| Dell Inspiron 16 Plus 7620 | |
| Lenovo IdeaPad 5 Pro 16ARH7 | |
| Genomsnitt Intel Core i7-1260P (4064 - 5791, n=25) | |
| Acer Swift X SFX16-52G-77RX | |
| Acer Swift X SFX16-52G-52VE | |
| Acer Swift X SFX16-51G-5388 | |
| Geekbench 5.5 / Multi-Core | |
| Genomsnitt av klass Multimedia (4652 - 20422, n=62, senaste 2 åren) | |
| HP Envy 16 h0112nr | |
| Lenovo ThinkBook 16 G4+ IAP | |
| Dell Inspiron 16 Plus 7620 | |
| Acer Swift X SFX16-52G-77RX | |
| Acer Swift X SFX16-52G-52VE | |
| Genomsnitt Intel Core i7-1260P (3866 - 10570, n=25) | |
| Asus Vivobook Pro 16X-M7600QE | |
| Asus Vivobook Pro 16X-M7600QE | |
| Lenovo IdeaPad 5 Pro 16ARH7 | |
| Acer Swift X SFX16-51G-5388 | |
| Geekbench 5.5 / Single-Core | |
| Genomsnitt av klass Multimedia (805 - 2974, n=62, senaste 2 åren) | |
| Acer Swift X SFX16-52G-77RX | |
| HP Envy 16 h0112nr | |
| Lenovo ThinkBook 16 G4+ IAP | |
| Dell Inspiron 16 Plus 7620 | |
| Genomsnitt Intel Core i7-1260P (1436 - 1786, n=25) | |
| Acer Swift X SFX16-52G-52VE | |
| Asus Vivobook Pro 16X-M7600QE | |
| Asus Vivobook Pro 16X-M7600QE | |
| Lenovo IdeaPad 5 Pro 16ARH7 | |
| Acer Swift X SFX16-51G-5388 | |
| HWBOT x265 Benchmark v2.2 / 4k Preset | |
| Genomsnitt av klass Multimedia (5.26 - 36.1, n=63, senaste 2 åren) | |
| Lenovo ThinkBook 16 G4+ IAP | |
| Dell Inspiron 16 Plus 7620 | |
| Asus Vivobook Pro 16X-M7600QE | |
| Asus Vivobook Pro 16X-M7600QE | |
| HP Envy 16 h0112nr | |
| Acer Swift X SFX16-52G-77RX | |
| Acer Swift X SFX16-52G-52VE | |
| Lenovo IdeaPad 5 Pro 16ARH7 | |
| Genomsnitt Intel Core i7-1260P (3.45 - 13.6, n=26) | |
| Acer Swift X SFX16-51G-5388 | |
| LibreOffice / 20 Documents To PDF | |
| Lenovo IdeaPad 5 Pro 16ARH7 | |
| Acer Swift X SFX16-52G-77RX | |
| Asus Vivobook Pro 16X-M7600QE | |
| Asus Vivobook Pro 16X-M7600QE | |
| Acer Swift X SFX16-51G-5388 | |
| Genomsnitt av klass Multimedia (23.9 - 146.7, n=64, senaste 2 åren) | |
| Genomsnitt Intel Core i7-1260P (40.2 - 65.7, n=25) | |
| Acer Swift X SFX16-52G-52VE | |
| Lenovo ThinkBook 16 G4+ IAP | |
| Dell Inspiron 16 Plus 7620 | |
| HP Envy 16 h0112nr | |
| R Benchmark 2.5 / Overall mean | |
| Acer Swift X SFX16-51G-5388 | |
| Acer Swift X SFX16-52G-52VE | |
| Lenovo IdeaPad 5 Pro 16ARH7 | |
| Genomsnitt Intel Core i7-1260P (0.4559 - 0.727, n=25) | |
| Asus Vivobook Pro 16X-M7600QE | |
| Asus Vivobook Pro 16X-M7600QE | |
| Dell Inspiron 16 Plus 7620 | |
| Acer Swift X SFX16-52G-77RX | |
| Genomsnitt av klass Multimedia (0.3604 - 0.947, n=63, senaste 2 åren) | |
| Lenovo ThinkBook 16 G4+ IAP | |
| HP Envy 16 h0112nr | |
* ... mindre är bättre
AIDA64: FP32 Ray-Trace | FPU Julia | CPU SHA3 | CPU Queen | FPU SinJulia | FPU Mandel | CPU AES | CPU ZLib | FP64 Ray-Trace | CPU PhotoWorxx
| Performance rating | |
| Genomsnitt av klass Multimedia | |
| Asus Vivobook Pro 16X-M7600QE | |
| Lenovo ThinkBook 16 G4+ IAP | |
| HP Envy 16 h0112nr | |
| Dell Inspiron 16 Plus 7620 | |
| Lenovo IdeaPad 5 Pro 16ARH7 | |
| Acer Swift X SFX16-52G-77RX | |
| Acer Swift X SFX16-52G-52VE | |
| Genomsnitt Intel Core i7-1260P | |
| Acer Swift X SFX16-51G-5388 | |
| AIDA64 / FP32 Ray-Trace | |
| Genomsnitt av klass Multimedia (2214 - 50388, n=60, senaste 2 åren) | |
| Lenovo ThinkBook 16 G4+ IAP | |
| Asus Vivobook Pro 16X-M7600QE | |
| Asus Vivobook Pro 16X-M7600QE | |
| Dell Inspiron 16 Plus 7620 | |
| HP Envy 16 h0112nr | |
| Lenovo IdeaPad 5 Pro 16ARH7 | |
| Acer Swift X SFX16-52G-52VE | |
| Acer Swift X SFX16-52G-77RX | |
| Genomsnitt Intel Core i7-1260P (2176 - 10898, n=26) | |
| Acer Swift X SFX16-51G-5388 | |
| AIDA64 / FPU Julia | |
| Asus Vivobook Pro 16X-M7600QE | |
| Asus Vivobook Pro 16X-M7600QE | |
| Genomsnitt av klass Multimedia (12867 - 201874, n=61, senaste 2 åren) | |
| Lenovo ThinkBook 16 G4+ IAP | |
| Lenovo IdeaPad 5 Pro 16ARH7 | |
| Dell Inspiron 16 Plus 7620 | |
| HP Envy 16 h0112nr | |
| Acer Swift X SFX16-52G-77RX | |
| Acer Swift X SFX16-52G-52VE | |
| Genomsnitt Intel Core i7-1260P (11015 - 56906, n=26) | |
| Acer Swift X SFX16-51G-5388 | |
| AIDA64 / CPU SHA3 | |
| Genomsnitt av klass Multimedia (626 - 8623, n=61, senaste 2 åren) | |
| Lenovo ThinkBook 16 G4+ IAP | |
| Asus Vivobook Pro 16X-M7600QE | |
| Asus Vivobook Pro 16X-M7600QE | |
| Dell Inspiron 16 Plus 7620 | |
| HP Envy 16 h0112nr | |
| Lenovo IdeaPad 5 Pro 16ARH7 | |
| Acer Swift X SFX16-52G-77RX | |
| Acer Swift X SFX16-52G-52VE | |
| Acer Swift X SFX16-51G-5388 | |
| Genomsnitt Intel Core i7-1260P (669 - 2709, n=26) | |
| AIDA64 / CPU Queen | |
| Lenovo ThinkBook 16 G4+ IAP | |
| HP Envy 16 h0112nr | |
| Asus Vivobook Pro 16X-M7600QE | |
| Asus Vivobook Pro 16X-M7600QE | |
| Dell Inspiron 16 Plus 7620 | |
| Acer Swift X SFX16-52G-77RX | |
| Lenovo IdeaPad 5 Pro 16ARH7 | |
| Genomsnitt av klass Multimedia (13483 - 181505, n=48, senaste 2 åren) | |
| Genomsnitt Intel Core i7-1260P (42571 - 82493, n=26) | |
| Acer Swift X SFX16-52G-52VE | |
| Acer Swift X SFX16-51G-5388 | |
| AIDA64 / FPU SinJulia | |
| Asus Vivobook Pro 16X-M7600QE | |
| Asus Vivobook Pro 16X-M7600QE | |
| Lenovo ThinkBook 16 G4+ IAP | |
| Lenovo IdeaPad 5 Pro 16ARH7 | |
| Genomsnitt av klass Multimedia (886 - 28794, n=61, senaste 2 åren) | |
| Dell Inspiron 16 Plus 7620 | |
| HP Envy 16 h0112nr | |
| Acer Swift X SFX16-52G-77RX | |
| Acer Swift X SFX16-52G-52VE | |
| Genomsnitt Intel Core i7-1260P (2901 - 6975, n=26) | |
| Acer Swift X SFX16-51G-5388 | |
| AIDA64 / FPU Mandel | |
| Asus Vivobook Pro 16X-M7600QE | |
| Asus Vivobook Pro 16X-M7600QE | |
| Genomsnitt av klass Multimedia (6395 - 105740, n=60, senaste 2 åren) | |
| Lenovo IdeaPad 5 Pro 16ARH7 | |
| Lenovo ThinkBook 16 G4+ IAP | |
| Dell Inspiron 16 Plus 7620 | |
| HP Envy 16 h0112nr | |
| Acer Swift X SFX16-52G-77RX | |
| Acer Swift X SFX16-52G-52VE | |
| Acer Swift X SFX16-51G-5388 | |
| Genomsnitt Intel Core i7-1260P (5950 - 26376, n=26) | |
| AIDA64 / CPU AES | |
| Asus Vivobook Pro 16X-M7600QE | |
| Asus Vivobook Pro 16X-M7600QE | |
| HP Envy 16 h0112nr | |
| Lenovo ThinkBook 16 G4+ IAP | |
| Genomsnitt av klass Multimedia (8171 - 126790, n=61, senaste 2 åren) | |
| Dell Inspiron 16 Plus 7620 | |
| Acer Swift X SFX16-51G-5388 | |
| Acer Swift X SFX16-52G-77RX | |
| Acer Swift X SFX16-52G-52VE | |
| Genomsnitt Intel Core i7-1260P (16041 - 92356, n=26) | |
| Lenovo IdeaPad 5 Pro 16ARH7 | |
| AIDA64 / CPU ZLib | |
| Lenovo ThinkBook 16 G4+ IAP | |
| Genomsnitt av klass Multimedia (143.8 - 2022, n=61, senaste 2 åren) | |
| Dell Inspiron 16 Plus 7620 | |
| Acer Swift X SFX16-52G-52VE | |
| HP Envy 16 h0112nr | |
| Asus Vivobook Pro 16X-M7600QE | |
| Asus Vivobook Pro 16X-M7600QE | |
| Acer Swift X SFX16-52G-77RX | |
| Lenovo IdeaPad 5 Pro 16ARH7 | |
| Genomsnitt Intel Core i7-1260P (259 - 771, n=26) | |
| Acer Swift X SFX16-51G-5388 | |
| AIDA64 / FP64 Ray-Trace | |
| Genomsnitt av klass Multimedia (1014 - 26875, n=61, senaste 2 åren) | |
| Asus Vivobook Pro 16X-M7600QE | |
| Asus Vivobook Pro 16X-M7600QE | |
| Lenovo ThinkBook 16 G4+ IAP | |
| Dell Inspiron 16 Plus 7620 | |
| HP Envy 16 h0112nr | |
| Lenovo IdeaPad 5 Pro 16ARH7 | |
| Acer Swift X SFX16-52G-77RX | |
| Acer Swift X SFX16-52G-52VE | |
| Genomsnitt Intel Core i7-1260P (1237 - 5858, n=26) | |
| Acer Swift X SFX16-51G-5388 | |
| AIDA64 / CPU PhotoWorxx | |
| Genomsnitt av klass Multimedia (8187 - 88154, n=61, senaste 2 åren) | |
| Acer Swift X SFX16-52G-52VE | |
| Acer Swift X SFX16-52G-77RX | |
| Lenovo ThinkBook 16 G4+ IAP | |
| HP Envy 16 h0112nr | |
| Acer Swift X SFX16-51G-5388 | |
| Dell Inspiron 16 Plus 7620 | |
| Genomsnitt Intel Core i7-1260P (13261 - 43652, n=26) | |
| Lenovo IdeaPad 5 Pro 16ARH7 | |
| Asus Vivobook Pro 16X-M7600QE | |
| Asus Vivobook Pro 16X-M7600QE | |
Systemets prestanda
I likhet med syskonmodellär systemprestandan på en hög nivå, särskilt när man surfar på nätet, tack vare den höga Turbo Boost-graden i Intel-processorer.
På grund av sin RTX 3060, är denHP Envy 16kan gå framåt särskilt när det gäller skapande av innehåll. Under den processtunga webbsurfningen kan avståndet till den Core i7-12700Hsom används i den bärbara datorn minskas till mellan 10 och 15 procent.
CrossMark: Overall | Productivity | Creativity | Responsiveness
Youtube: 2160p60 CPU Load
Sunspider: 1.0 Total Score
Mozilla Kraken 1.1: Total
Speedometer 2.0: Result 2.0
Octane V2: Total Score
Jetstream 2: 2.0 Total
WebXPRT 3: Overall
WebXPRT 4: Overall
| PCMark 10 / Score | |
| Genomsnitt av klass Multimedia (4325 - 10386, n=58, senaste 2 åren) | |
| HP Envy 16 h0112nr | |
| Dell Inspiron 16 Plus 7620 | |
| Asus Vivobook Pro 16X-M7600QE | |
| Acer Swift X SFX16-52G-77RX | |
| Genomsnitt Intel Core i7-1260P, Intel Arc A370M (n=1) | |
| Acer Swift X SFX16-52G-52VE | |
| Lenovo IdeaPad 5 Pro 16ARH7 | |
| Acer Swift X SFX16-51G-5388 | |
| PCMark 10 / Essentials | |
| HP Envy 16 h0112nr | |
| Acer Swift X SFX16-52G-77RX | |
| Genomsnitt Intel Core i7-1260P, Intel Arc A370M (n=1) | |
| Asus Vivobook Pro 16X-M7600QE | |
| Genomsnitt av klass Multimedia (8025 - 11664, n=57, senaste 2 åren) | |
| Dell Inspiron 16 Plus 7620 | |
| Lenovo IdeaPad 5 Pro 16ARH7 | |
| Acer Swift X SFX16-52G-52VE | |
| Acer Swift X SFX16-51G-5388 | |
| PCMark 10 / Productivity | |
| Genomsnitt av klass Multimedia (7323 - 18233, n=57, senaste 2 åren) | |
| Asus Vivobook Pro 16X-M7600QE | |
| HP Envy 16 h0112nr | |
| Dell Inspiron 16 Plus 7620 | |
| Lenovo IdeaPad 5 Pro 16ARH7 | |
| Acer Swift X SFX16-51G-5388 | |
| Acer Swift X SFX16-52G-52VE | |
| Acer Swift X SFX16-52G-77RX | |
| Genomsnitt Intel Core i7-1260P, Intel Arc A370M (n=1) | |
| PCMark 10 / Digital Content Creation | |
| HP Envy 16 h0112nr | |
| Genomsnitt av klass Multimedia (3651 - 16240, n=57, senaste 2 åren) | |
| Dell Inspiron 16 Plus 7620 | |
| Asus Vivobook Pro 16X-M7600QE | |
| Acer Swift X SFX16-52G-77RX | |
| Genomsnitt Intel Core i7-1260P, Intel Arc A370M (n=1) | |
| Acer Swift X SFX16-52G-52VE | |
| Acer Swift X SFX16-51G-5388 | |
| Lenovo IdeaPad 5 Pro 16ARH7 | |
| CrossMark / Overall | |
| Genomsnitt av klass Multimedia (866 - 2728, n=67, senaste 2 åren) | |
| HP Envy 16 h0112nr | |
| Lenovo ThinkBook 16 G4+ IAP | |
| Dell Inspiron 16 Plus 7620 | |
| Acer Swift X SFX16-52G-77RX | |
| Genomsnitt Intel Core i7-1260P, Intel Arc A370M (n=1) | |
| Acer Swift X SFX16-52G-52VE | |
| Acer Swift X SFX16-51G-5388 | |
| CrossMark / Productivity | |
| Genomsnitt av klass Multimedia (931 - 2489, n=67, senaste 2 åren) | |
| HP Envy 16 h0112nr | |
| Lenovo ThinkBook 16 G4+ IAP | |
| Acer Swift X SFX16-52G-77RX | |
| Genomsnitt Intel Core i7-1260P, Intel Arc A370M (n=1) | |
| Dell Inspiron 16 Plus 7620 | |
| Acer Swift X SFX16-51G-5388 | |
| Acer Swift X SFX16-52G-52VE | |
| CrossMark / Creativity | |
| Genomsnitt av klass Multimedia (907 - 3465, n=67, senaste 2 åren) | |
| HP Envy 16 h0112nr | |
| Lenovo ThinkBook 16 G4+ IAP | |
| Dell Inspiron 16 Plus 7620 | |
| Acer Swift X SFX16-52G-77RX | |
| Genomsnitt Intel Core i7-1260P, Intel Arc A370M (n=1) | |
| Acer Swift X SFX16-52G-52VE | |
| Acer Swift X SFX16-51G-5388 | |
| CrossMark / Responsiveness | |
| Acer Swift X SFX16-52G-77RX | |
| Genomsnitt Intel Core i7-1260P, Intel Arc A370M (n=1) | |
| HP Envy 16 h0112nr | |
| Lenovo ThinkBook 16 G4+ IAP | |
| Dell Inspiron 16 Plus 7620 | |
| Genomsnitt av klass Multimedia (605 - 2024, n=67, senaste 2 åren) | |
| Acer Swift X SFX16-52G-52VE | |
| Acer Swift X SFX16-51G-5388 | |
| Youtube / 2160p60 CPU Load | |
| Genomsnitt av klass Multimedia (3 - 46, n=58, senaste 2 åren) | |
| Acer Swift X SFX16-52G-52VE (42, 1) | |
| Lenovo ThinkBook 16 G4+ IAP (43, 8) | |
| Acer Swift X SFX16-52G-77RX (37) | |
| Genomsnitt Intel Core i7-1260P, Intel Arc A370M (n=1) | |
| Asus Vivobook Pro 16X-M7600QE (76, 38) | |
| Dell Inspiron 16 Plus 7620 (46, 1) | |
| HP Envy 16 h0112nr (45, 3) | |
| Lenovo IdeaPad 5 Pro 16ARH7 (1) | |
| Sunspider / 1.0 Total Score | |
| Lenovo IdeaPad 5 Pro 16ARH7 | |
| Acer Swift X SFX16-52G-77RX | |
| Genomsnitt Intel Core i7-1260P, Intel Arc A370M (n=1) | |
| Genomsnitt av klass Multimedia (n=1senaste 2 åren) | |
| Mozilla Kraken 1.1 / Total | |
| Acer Swift X SFX16-51G-5388 | |
| Lenovo IdeaPad 5 Pro 16ARH7 | |
| Asus Vivobook Pro 16X-M7600QE | |
| Asus Vivobook Pro 16X-M7600QE | |
| Acer Swift X SFX16-52G-77RX | |
| Genomsnitt Intel Core i7-1260P, Intel Arc A370M (n=1) | |
| Acer Swift X SFX16-52G-52VE | |
| HP Envy 16 h0112nr | |
| Dell Inspiron 16 Plus 7620 | |
| Lenovo ThinkBook 16 G4+ IAP | |
| Genomsnitt av klass Multimedia (228 - 835, n=73, senaste 2 åren) | |
| Speedometer 2.0 / Result 2.0 | |
| Genomsnitt av klass Multimedia (337 - 946, n=34, senaste 2 åren) | |
| Lenovo ThinkBook 16 G4+ IAP | |
| Acer Swift X SFX16-52G-77RX | |
| Genomsnitt Intel Core i7-1260P, Intel Arc A370M (n=1) | |
| Octane V2 / Total Score | |
| Genomsnitt av klass Multimedia (64079 - 153175, n=34, senaste 2 åren) | |
| Lenovo ThinkBook 16 G4+ IAP | |
| Acer Swift X SFX16-52G-77RX | |
| Genomsnitt Intel Core i7-1260P, Intel Arc A370M (n=1) | |
| Acer Swift X SFX16-52G-52VE | |
| Acer Swift X SFX16-51G-5388 | |
| Jetstream 2 / 2.0 Total | |
| Genomsnitt av klass Multimedia (287 - 481, n=35, senaste 2 åren) | |
| HP Envy 16 h0112nr | |
| Dell Inspiron 16 Plus 7620 | |
| Lenovo ThinkBook 16 G4+ IAP | |
| Acer Swift X SFX16-52G-77RX | |
| Genomsnitt Intel Core i7-1260P, Intel Arc A370M (n=1) | |
| Acer Swift X SFX16-52G-52VE | |
| Acer Swift X SFX16-51G-5388 | |
| WebXPRT 3 / Overall | |
| Genomsnitt av klass Multimedia (136.4 - 596, n=70, senaste 2 åren) | |
| HP Envy 16 h0112nr | |
| Dell Inspiron 16 Plus 7620 | |
| Lenovo ThinkBook 16 G4+ IAP | |
| Asus Vivobook Pro 16X-M7600QE | |
| Acer Swift X SFX16-52G-77RX | |
| Genomsnitt Intel Core i7-1260P, Intel Arc A370M (n=1) | |
| Acer Swift X SFX16-52G-52VE | |
| Acer Swift X SFX16-51G-5388 | |
| Lenovo IdeaPad 5 Pro 16ARH7 | |
| WebXPRT 4 / Overall | |
| Genomsnitt av klass Multimedia (167.3 - 402, n=71, senaste 2 åren) | |
| HP Envy 16 h0112nr | |
| Lenovo ThinkBook 16 G4+ IAP | |
| Dell Inspiron 16 Plus 7620 | |
| Acer Swift X SFX16-52G-77RX | |
| Genomsnitt Intel Core i7-1260P, Intel Arc A370M (n=1) | |
| Acer Swift X SFX16-52G-52VE | |
| Acer Swift X SFX16-51G-5388 | |
* ... mindre är bättre
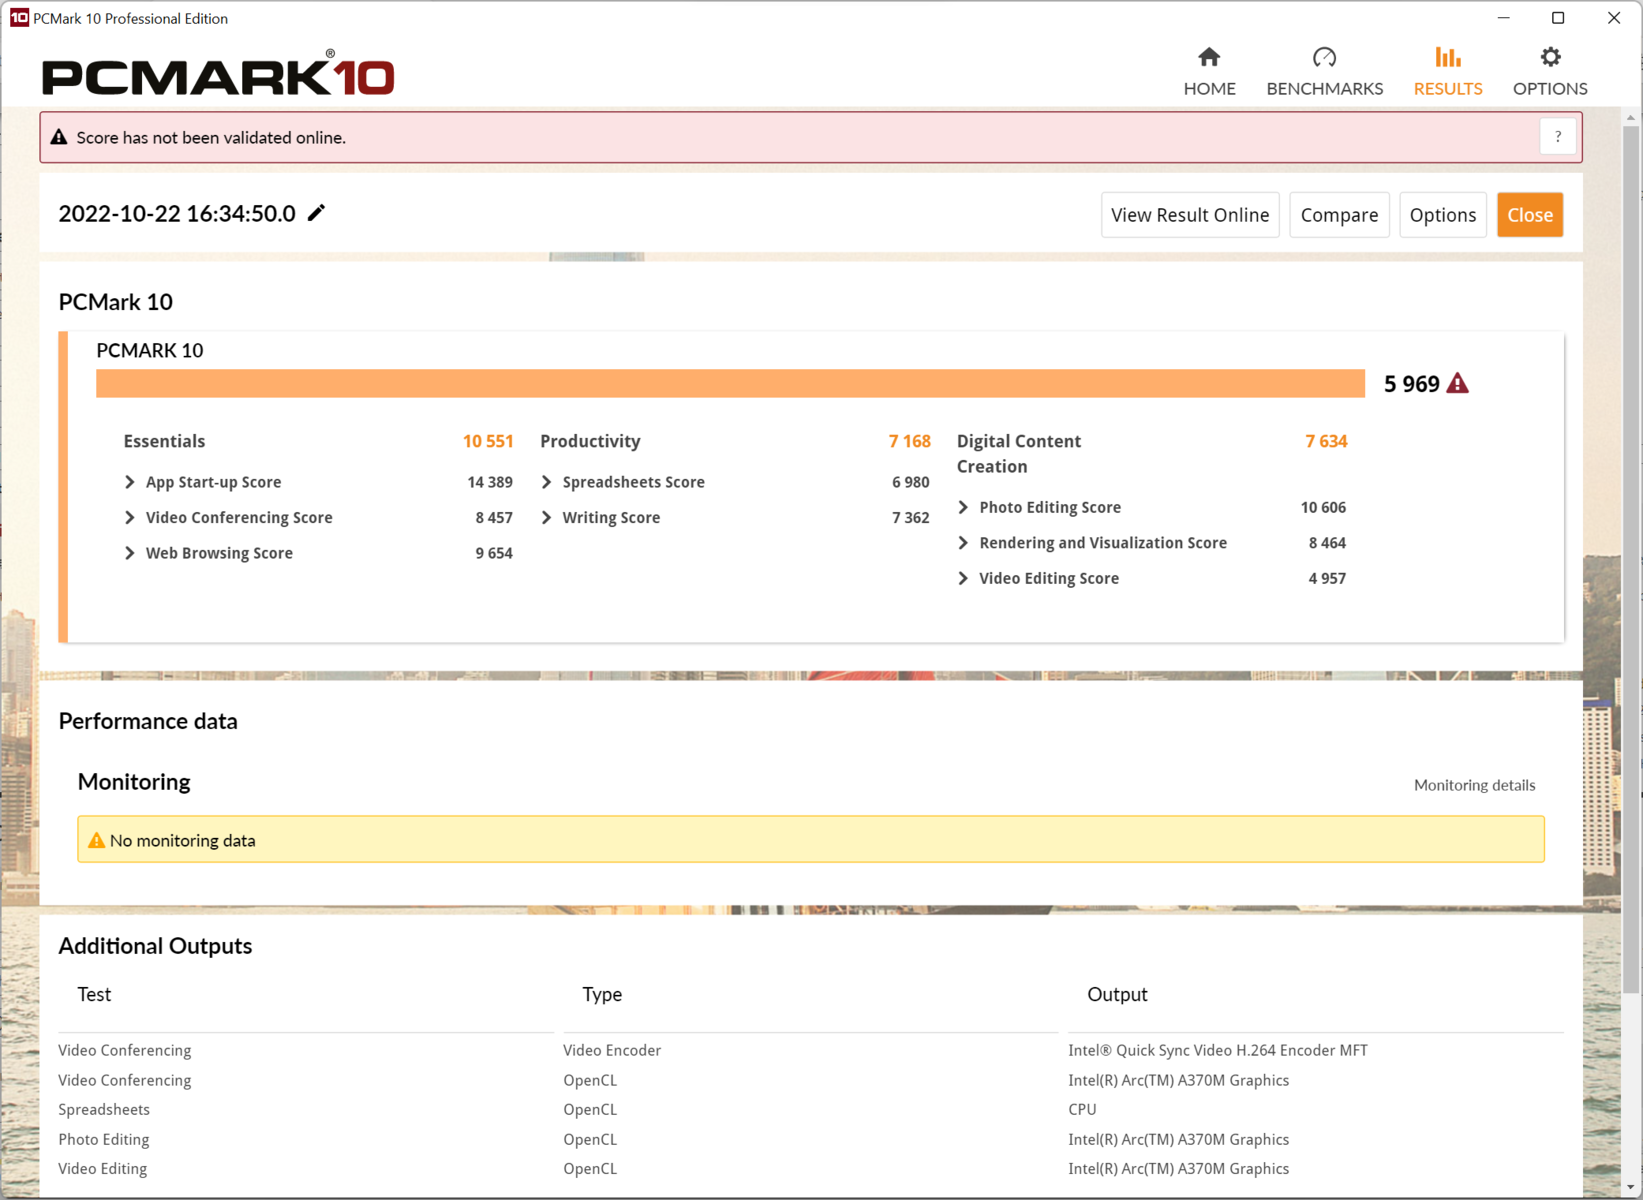
| PCMark 10 Score | 5969 poäng | |
Hjälp | ||
| AIDA64 / Memory Copy | |
| Genomsnitt av klass Multimedia (11299 - 132135, n=61, senaste 2 åren) | |
| Acer Swift X SFX16-52G-77RX | |
| Acer Swift X SFX16-52G-52VE | |
| Lenovo ThinkBook 16 G4+ IAP | |
| HP Envy 16 h0112nr | |
| Acer Swift X SFX16-51G-5388 | |
| Dell Inspiron 16 Plus 7620 | |
| Genomsnitt Intel Core i7-1260P (25125 - 71544, n=25) | |
| Lenovo IdeaPad 5 Pro 16ARH7 | |
| Asus Vivobook Pro 16X-M7600QE | |
| Asus Vivobook Pro 16X-M7600QE | |
| AIDA64 / Memory Read | |
| Genomsnitt av klass Multimedia (11624 - 174586, n=61, senaste 2 åren) | |
| Lenovo ThinkBook 16 G4+ IAP | |
| Acer Swift X SFX16-52G-77RX | |
| HP Envy 16 h0112nr | |
| Acer Swift X SFX16-52G-52VE | |
| Dell Inspiron 16 Plus 7620 | |
| Genomsnitt Intel Core i7-1260P (24983 - 72065, n=25) | |
| Acer Swift X SFX16-51G-5388 | |
| Asus Vivobook Pro 16X-M7600QE | |
| Asus Vivobook Pro 16X-M7600QE | |
| Lenovo IdeaPad 5 Pro 16ARH7 | |
| AIDA64 / Memory Write | |
| Lenovo IdeaPad 5 Pro 16ARH7 | |
| Genomsnitt av klass Multimedia (11755 - 134998, n=61, senaste 2 åren) | |
| Acer Swift X SFX16-51G-5388 | |
| Acer Swift X SFX16-52G-77RX | |
| HP Envy 16 h0112nr | |
| Acer Swift X SFX16-52G-52VE | |
| Lenovo ThinkBook 16 G4+ IAP | |
| Dell Inspiron 16 Plus 7620 | |
| Genomsnitt Intel Core i7-1260P (23512 - 66799, n=25) | |
| Asus Vivobook Pro 16X-M7600QE | |
| Asus Vivobook Pro 16X-M7600QE | |
| AIDA64 / Memory Latency | |
| Genomsnitt av klass Multimedia (7 - 535, n=60, senaste 2 åren) | |
| Lenovo IdeaPad 5 Pro 16ARH7 | |
| Acer Swift X SFX16-51G-5388 | |
| Acer Swift X SFX16-52G-77RX | |
| Lenovo ThinkBook 16 G4+ IAP | |
| Acer Swift X SFX16-52G-52VE | |
| Dell Inspiron 16 Plus 7620 | |
| HP Envy 16 h0112nr | |
| Genomsnitt Intel Core i7-1260P (77.9 - 118.4, n=21) | |
| Asus Vivobook Pro 16X-M7600QE | |
| Asus Vivobook Pro 16X-M7600QE | |
* ... mindre är bättre
DPC-latenstider
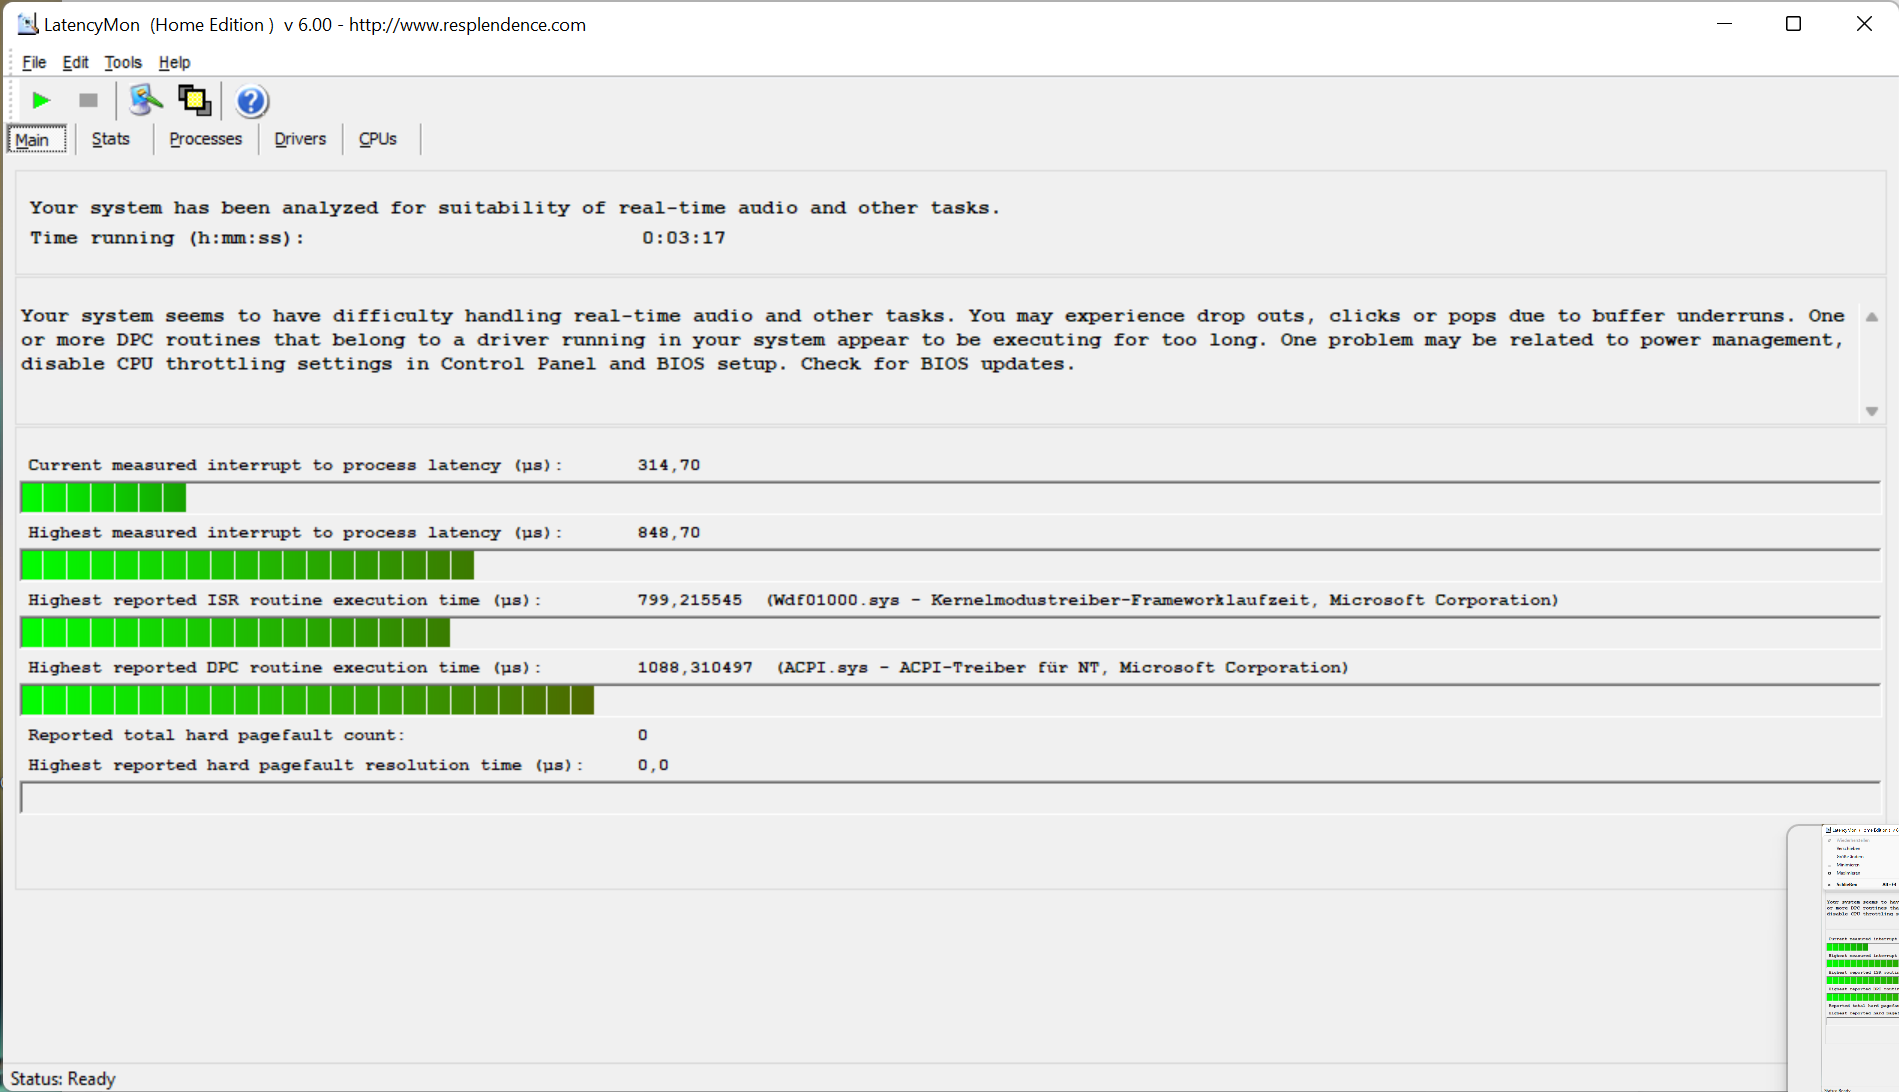
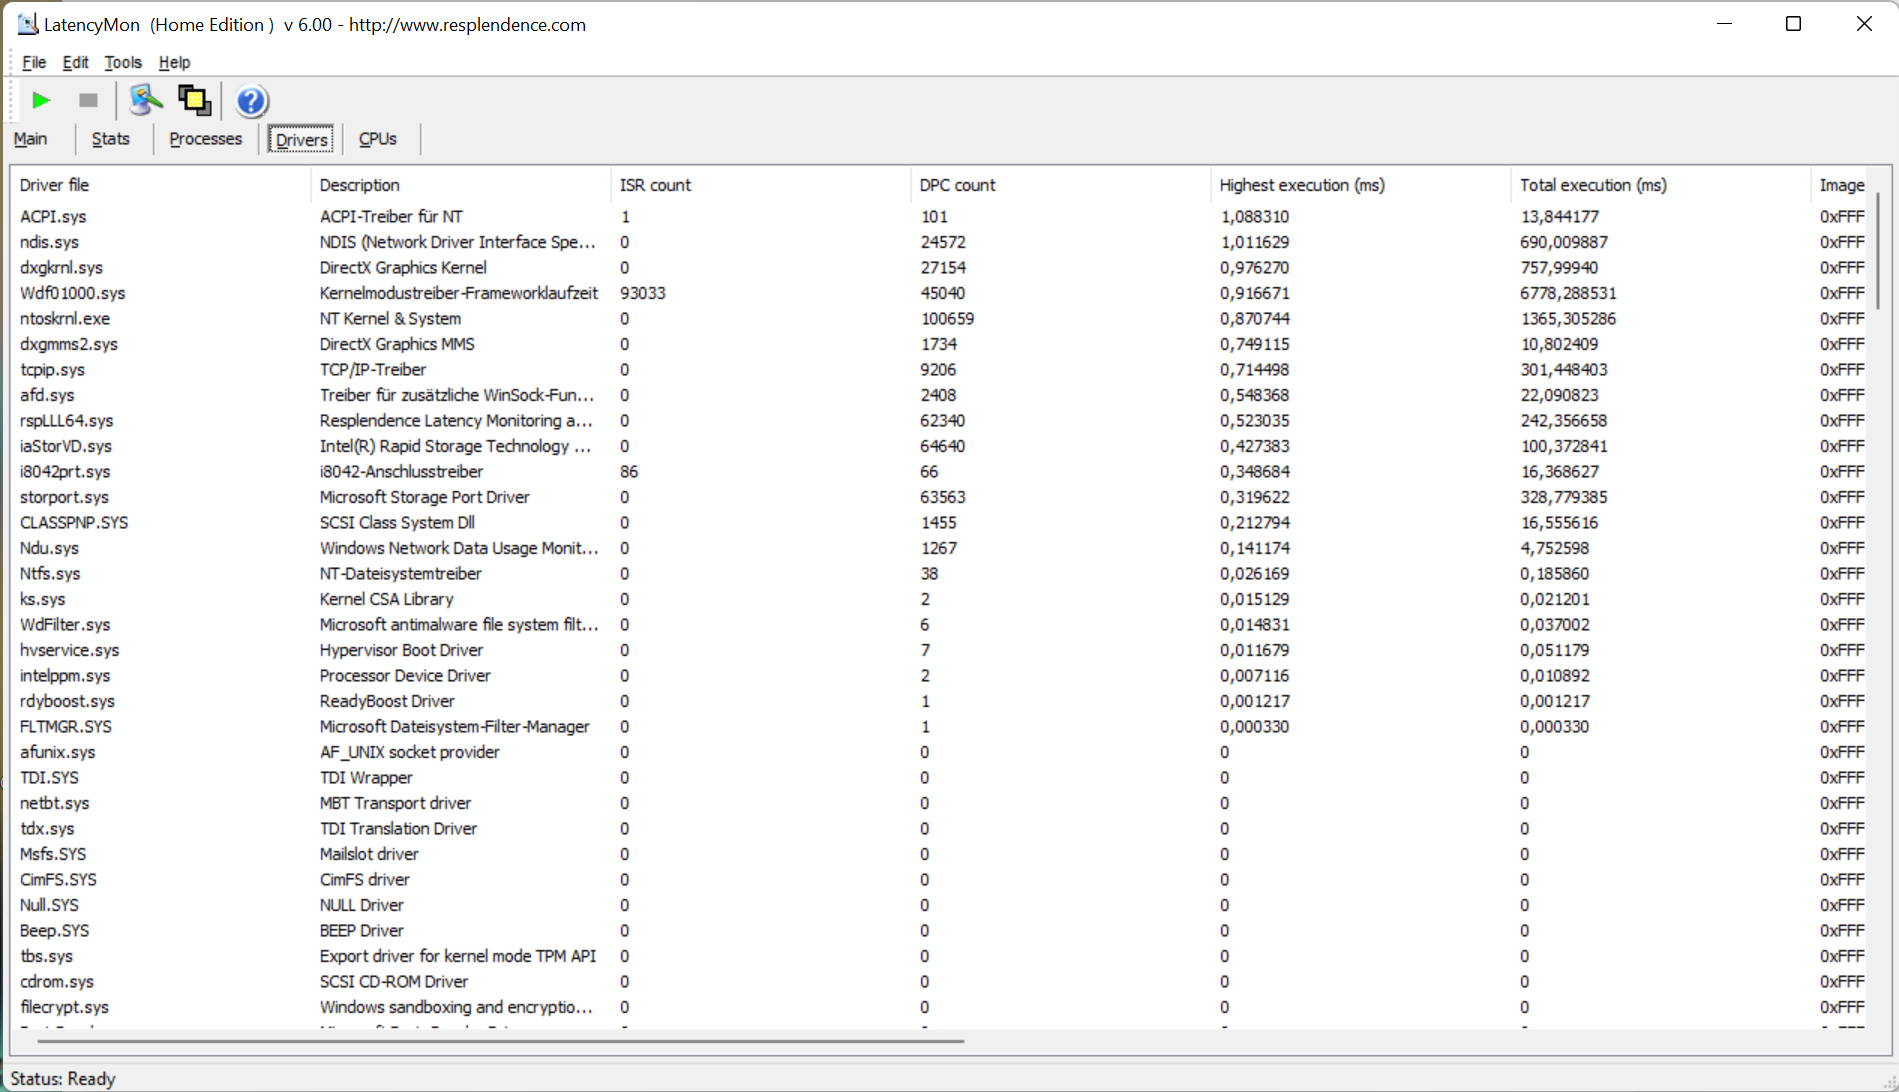
| DPC Latencies / LatencyMon - interrupt to process latency (max), Web, Youtube, Prime95 | |
| Acer Swift X SFX16-51G-5388 | |
| Lenovo ThinkBook 16 G4+ IAP | |
| Asus Vivobook Pro 16X-M7600QE | |
| Acer Swift X SFX16-52G-52VE | |
| Dell Inspiron 16 Plus 7620 | |
| HP Envy 16 h0112nr | |
| Acer Swift X SFX16-52G-77RX | |
| Lenovo IdeaPad 5 Pro 16ARH7 | |
* ... mindre är bättre
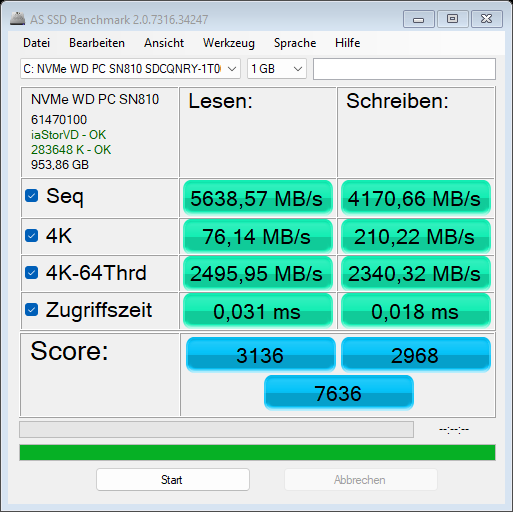
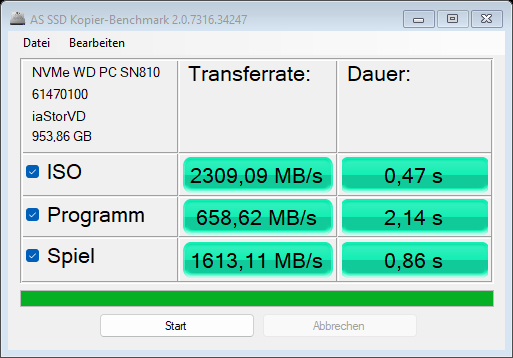
Lagringslösning
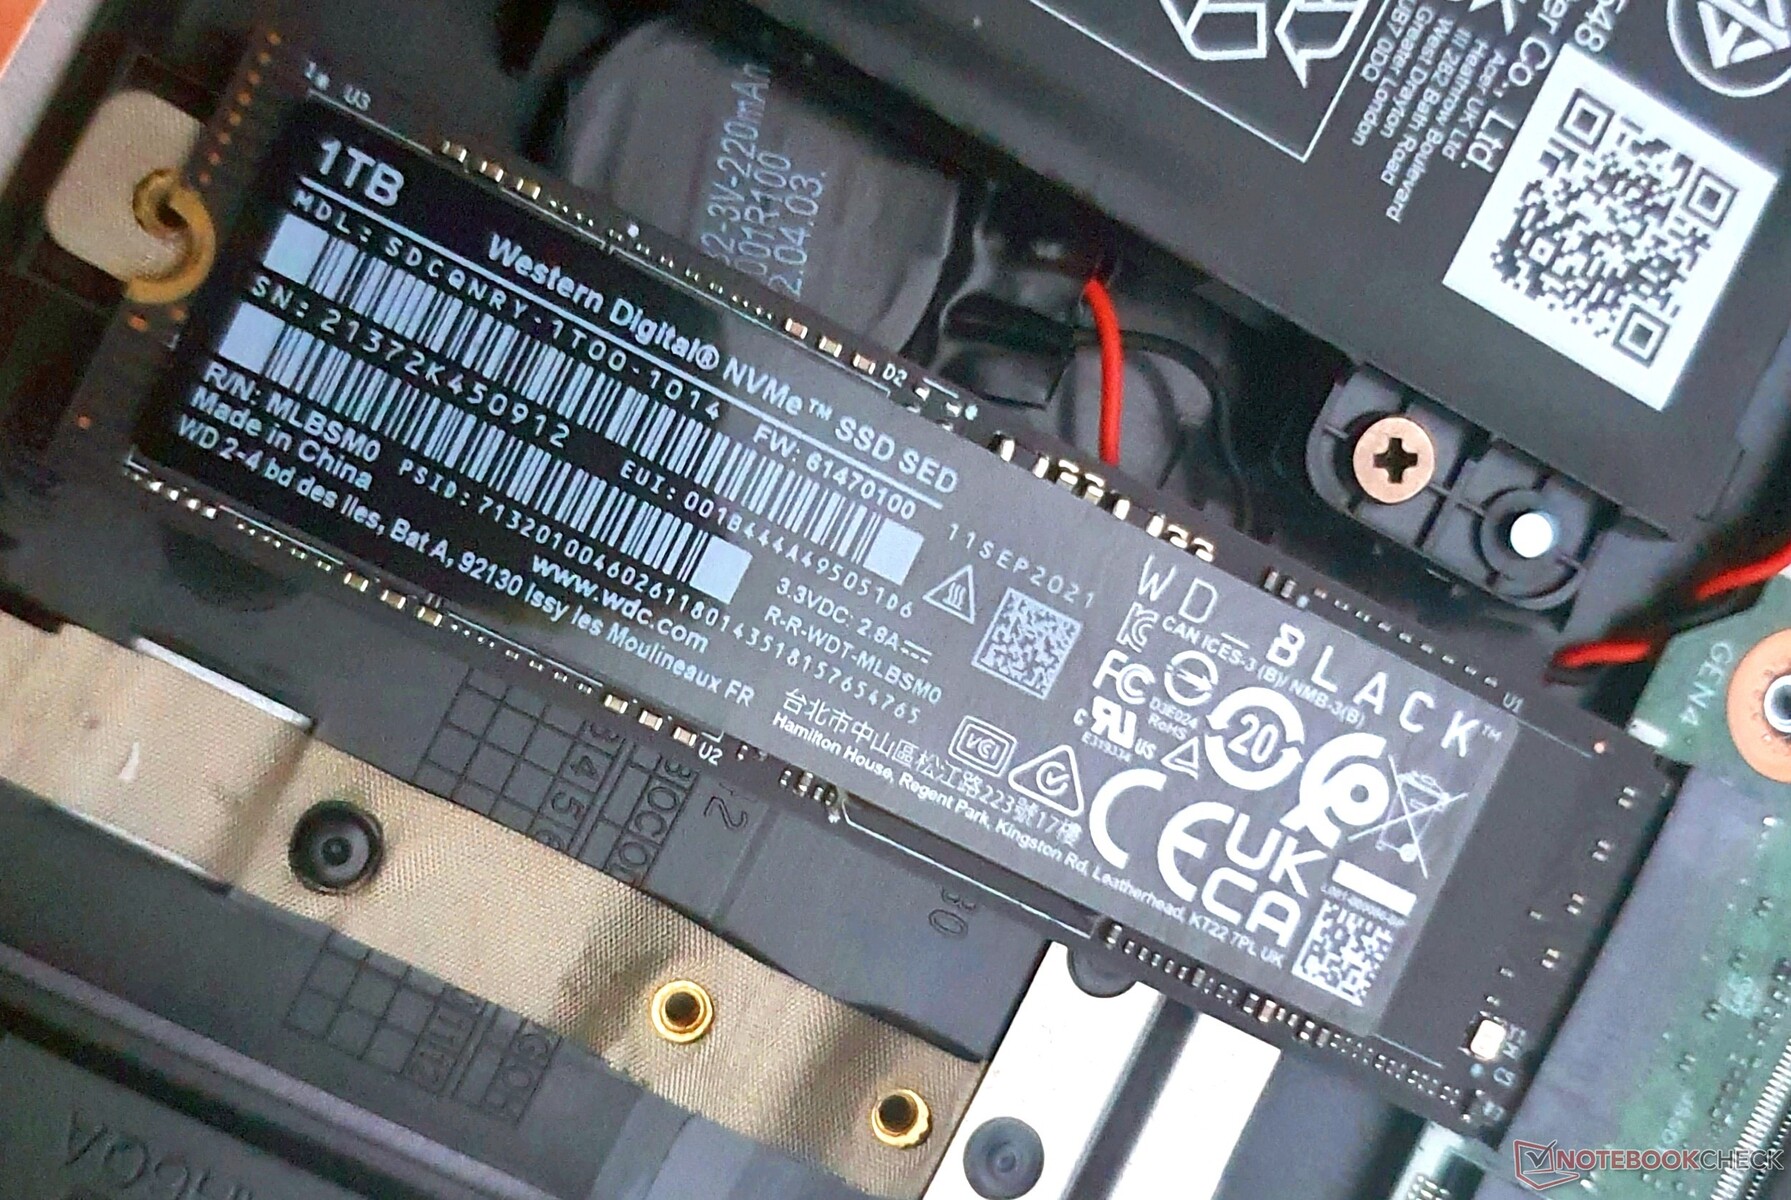
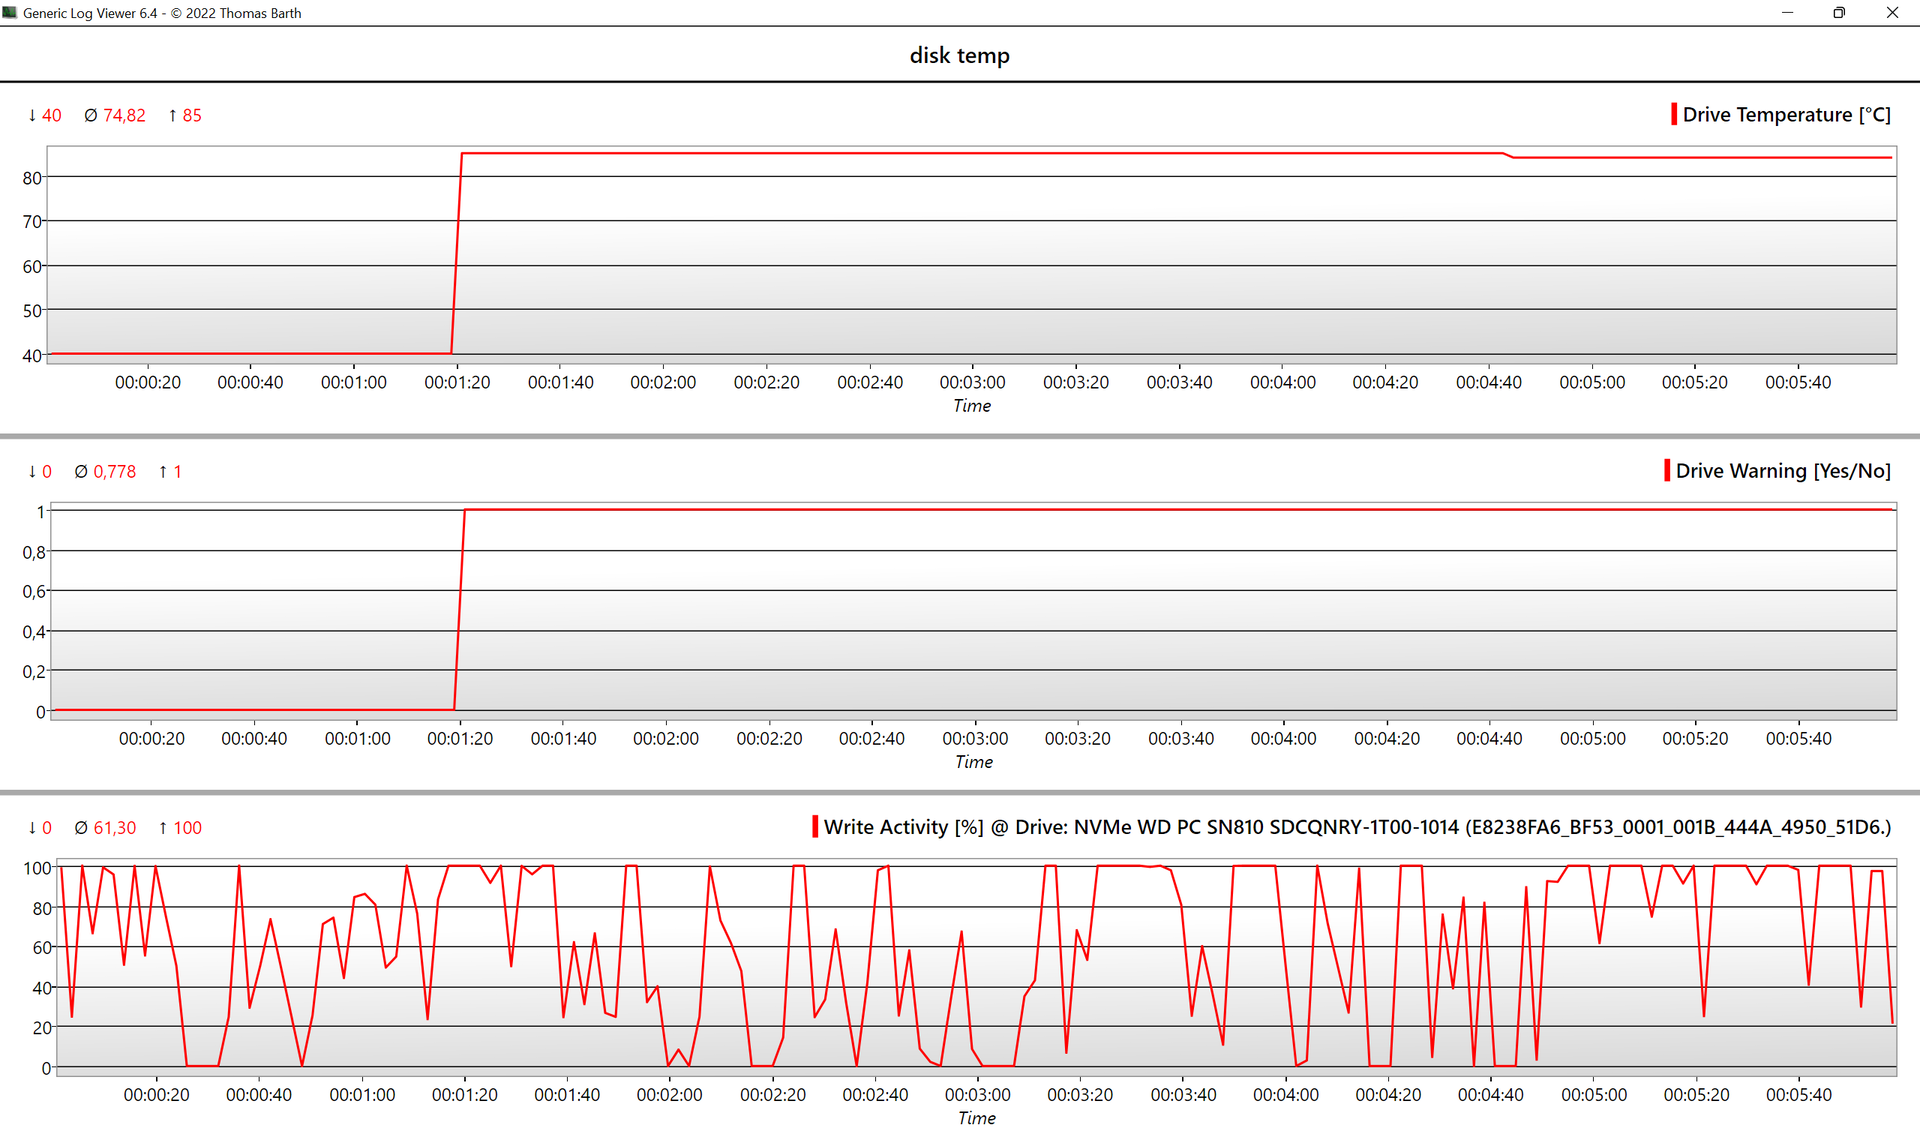
Med sina mycket höga överföringshastigheter gör 1 TB SSD från Western Digital PCIe 4.0-standarden rättvisa.
Medan den direkta föregångaren till Acer Swift X placerar sig längst ner i våra SSD-prestandabedömningar kan årets modell placera sig i toppen och lämnar ett visst avstånd till nästa modell.
Syskonmodellen med en 512 GB SSD överträffas också betydligt. SSD-enheterna i båda modellerna stryps dock kraftigt på grund av överhettning.
| Acer Swift X SFX16-52G-77RX WDC PC SN810 1TB | Acer Swift X SFX16-52G-52VE Micron 3400 MTFDKBA512TFH 512GB | Acer Swift X SFX16-51G-5388 Samsung PM991 MZVLQ512HBLU | Lenovo ThinkBook 16 G4+ IAP Micron 2450 1TB MTFDKCD1T0TFK | Dell Inspiron 16 Plus 7620 Kioxia BG5 KBG50ZNS512G | Lenovo IdeaPad 5 Pro 16ARH7 Samsung PM9A1 MZVL2512HCJQ | |
|---|---|---|---|---|---|---|
| AS SSD | -39% | -55% | -70% | -69% | -53% | |
| Seq Read (MB/s) | 5639 | 3200 -43% | 2744.12 -51% | 2825 -50% | 2693.29 -52% | 4687.88 -17% |
| Seq Write (MB/s) | 4171 | 3430 -18% | 1559.79 -63% | 1852 -56% | 1683.46 -60% | 2697.07 -35% |
| 4K Read (MB/s) | 76.1 | 63.1 -17% | 51.41 -32% | 58.44 -23% | 65.01 -15% | 61.12 -20% |
| 4K Write (MB/s) | 210.2 | 141.6 -33% | 156.13 -26% | 227.47 8% | 197.81 -6% | 125.7 -40% |
| 4K-64 Read (MB/s) | 2496 | 1354 -46% | 1014.34 -59% | 954.65 -62% | 855.48 -66% | 827.56 -67% |
| 4K-64 Write (MB/s) | 2340 | 1802 -23% | 940.2 -60% | 2413.44 3% | 395.8 -83% | 1884.06 -19% |
| Access Time Read * (ms) | 0.031 | 0.064 -106% | 0.073 -135% | 0.026 16% | 0.078 -152% | 0.073 -135% |
| Access Time Write * (ms) | 0.018 | 0.026 -44% | 0.028 -56% | 0.131 -628% | 0.06 -233% | 0.04 -122% |
| Score Read (Points) | 3136 | 1737 -45% | 1340 -57% | 1296 -59% | 1190 -62% | 1357 -57% |
| Score Write (Points) | 2968 | 2287 -23% | 1252 -58% | 2826 -5% | 762 -74% | 2279 -23% |
| Score Total (Points) | 7636 | 4936 -35% | 3229 -58% | 4750 -38% | 2529 -67% | 4247 -44% |
| Copy ISO MB/s (MB/s) | 2309 | 1363.82 -41% | 2155.05 -7% | 1634.1 -29% | ||
| Copy Program MB/s (MB/s) | 658.6 | 433.2 -34% | 414.57 -37% | 379.46 -42% | ||
| Copy Game MB/s (MB/s) | 1613 | 1055.69 -35% | 1055.89 -35% | 1174.45 -27% | ||
| DiskSpd | -25% | -71% | -50% | -56% | -40% | |
| seq read (MB/s) | 4206 | 2619 -38% | 1248 -70% | 2124 -50% | 2355 -44% | 3304 -21% |
| seq write (MB/s) | 5015 | 3900 -22% | 790 -84% | 2677 -47% | 2020 -60% | 2744 -45% |
| seq q8 t1 read (MB/s) | 6940 | 6439 -7% | 1655 -76% | 3377 -51% | 2569 -63% | 6708 -3% |
| seq q8 t1 write (MB/s) | 5031 | 3911 -22% | 871 -83% | 3241 -36% | 2752 -45% | 4857 -3% |
| 4k q32 t16 read (MB/s) | 2605 | 1522 -42% | 778 -70% | 923 -65% | 652 -75% | 824 -68% |
| 4k q32 t16 write (MB/s) | 2780 | 2390 -14% | 640 -77% | 501 -82% | 408 -85% | 299 -89% |
| 4k q1 t1 read (MB/s) | 88 | 65.3 -26% | 43.2 -51% | 61.2 -30% | 62.7 -29% | 63.4 -28% |
| 4k q1 t1 write (MB/s) | 305 | 208 -32% | 123.5 -60% | 187.8 -38% | 162.6 -47% | 125.7 -59% |
| Totalt genomsnitt (program/inställningar) | -32% /
-33% | -63% /
-61% | -60% /
-62% | -63% /
-64% | -47% /
-47% |
* ... mindre är bättre
* ... mindre är bättre
Constant Performance Reading: DiskSpd Read Loop, Queue Depth 8
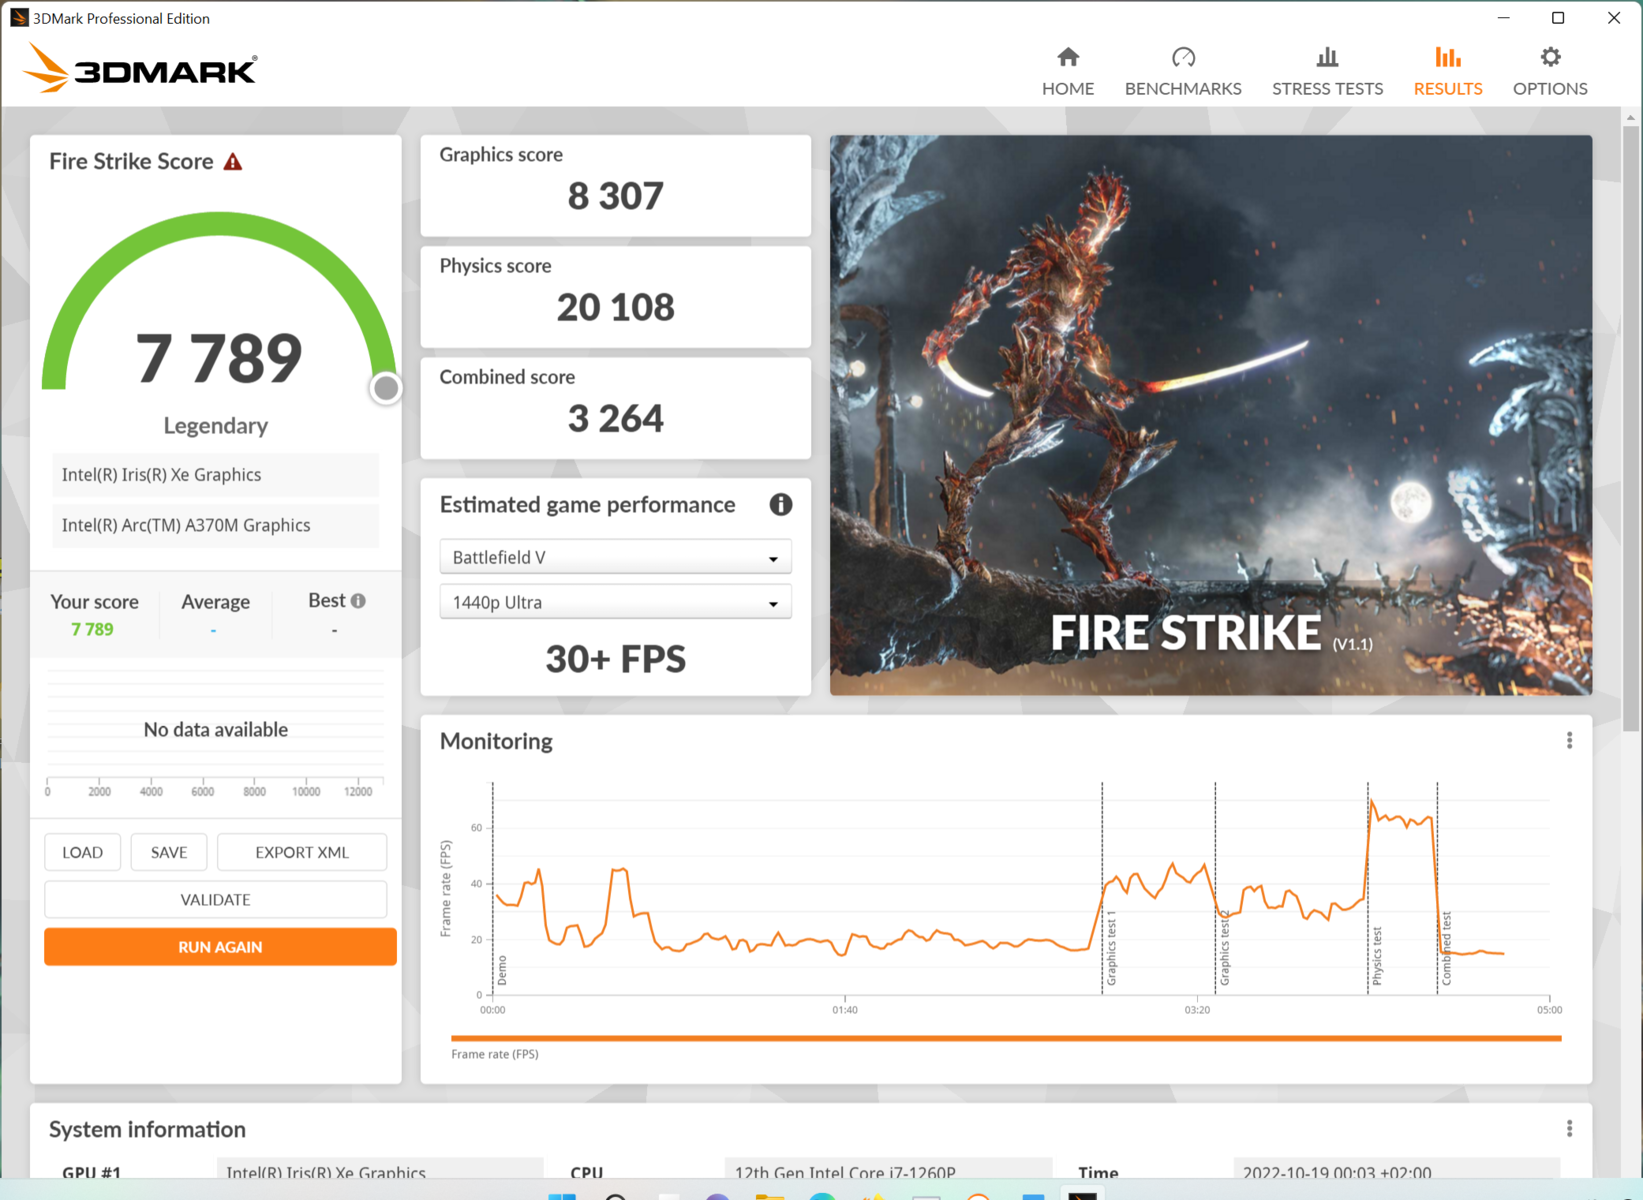
Grafikkort
Intel Arc A370Msom används här är den variant som har den lägsta TGP på 35 watt. I genomsnitt är RTX 3050i föregångaren och Asus Vivobook Pro 16Xär ungefär 50 % snabbare i de syntetiska riktmärkena. I de arbetsstationsrelaterade 3D-benchmarks kan detta snabbt bli upp till 150 eller 200 %. Den syntetiska prestandan hos en integrerad AMD Radeon 680Mligger ungefär på samma nivå som Arc A370M.
Vid batteridrift minskar grafikprestandan med ytterligare 30 %.
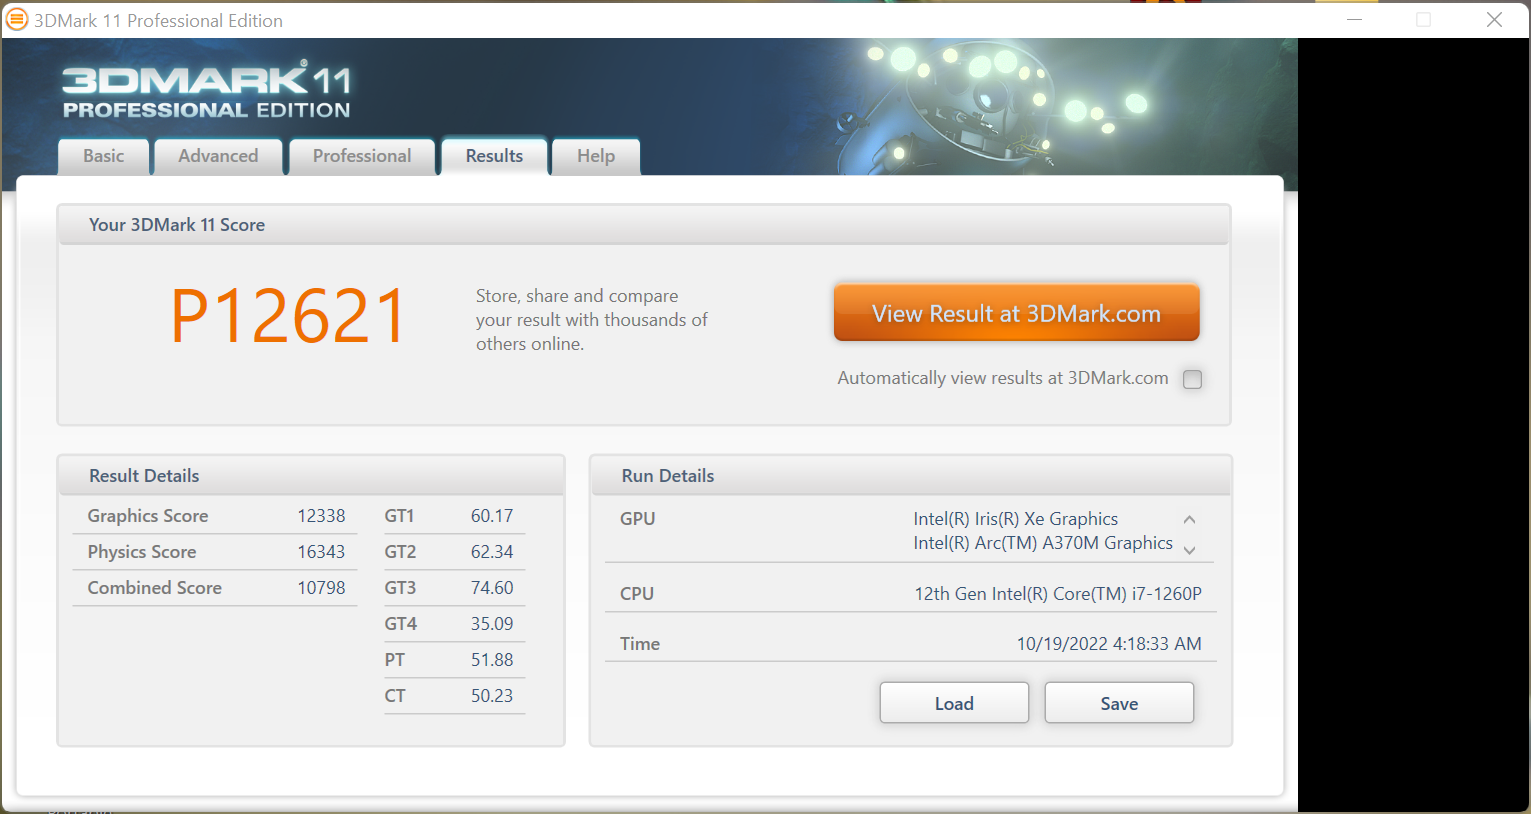
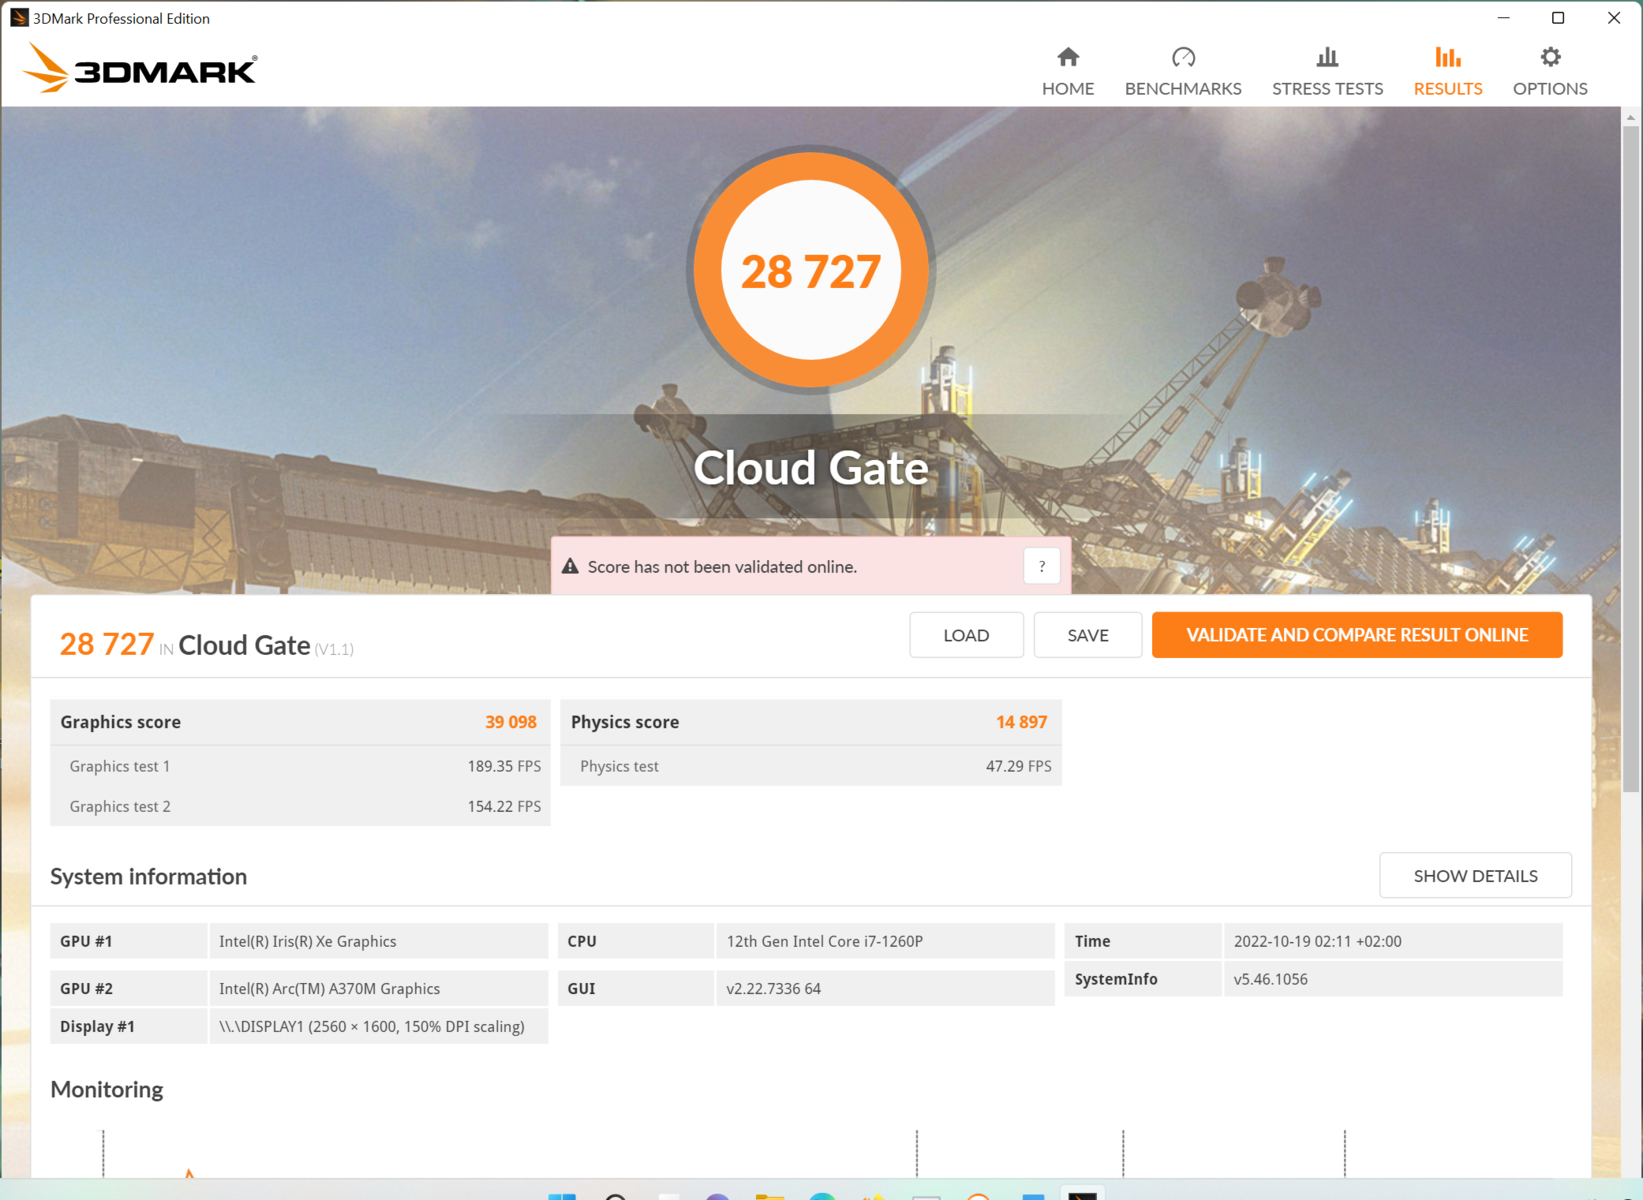
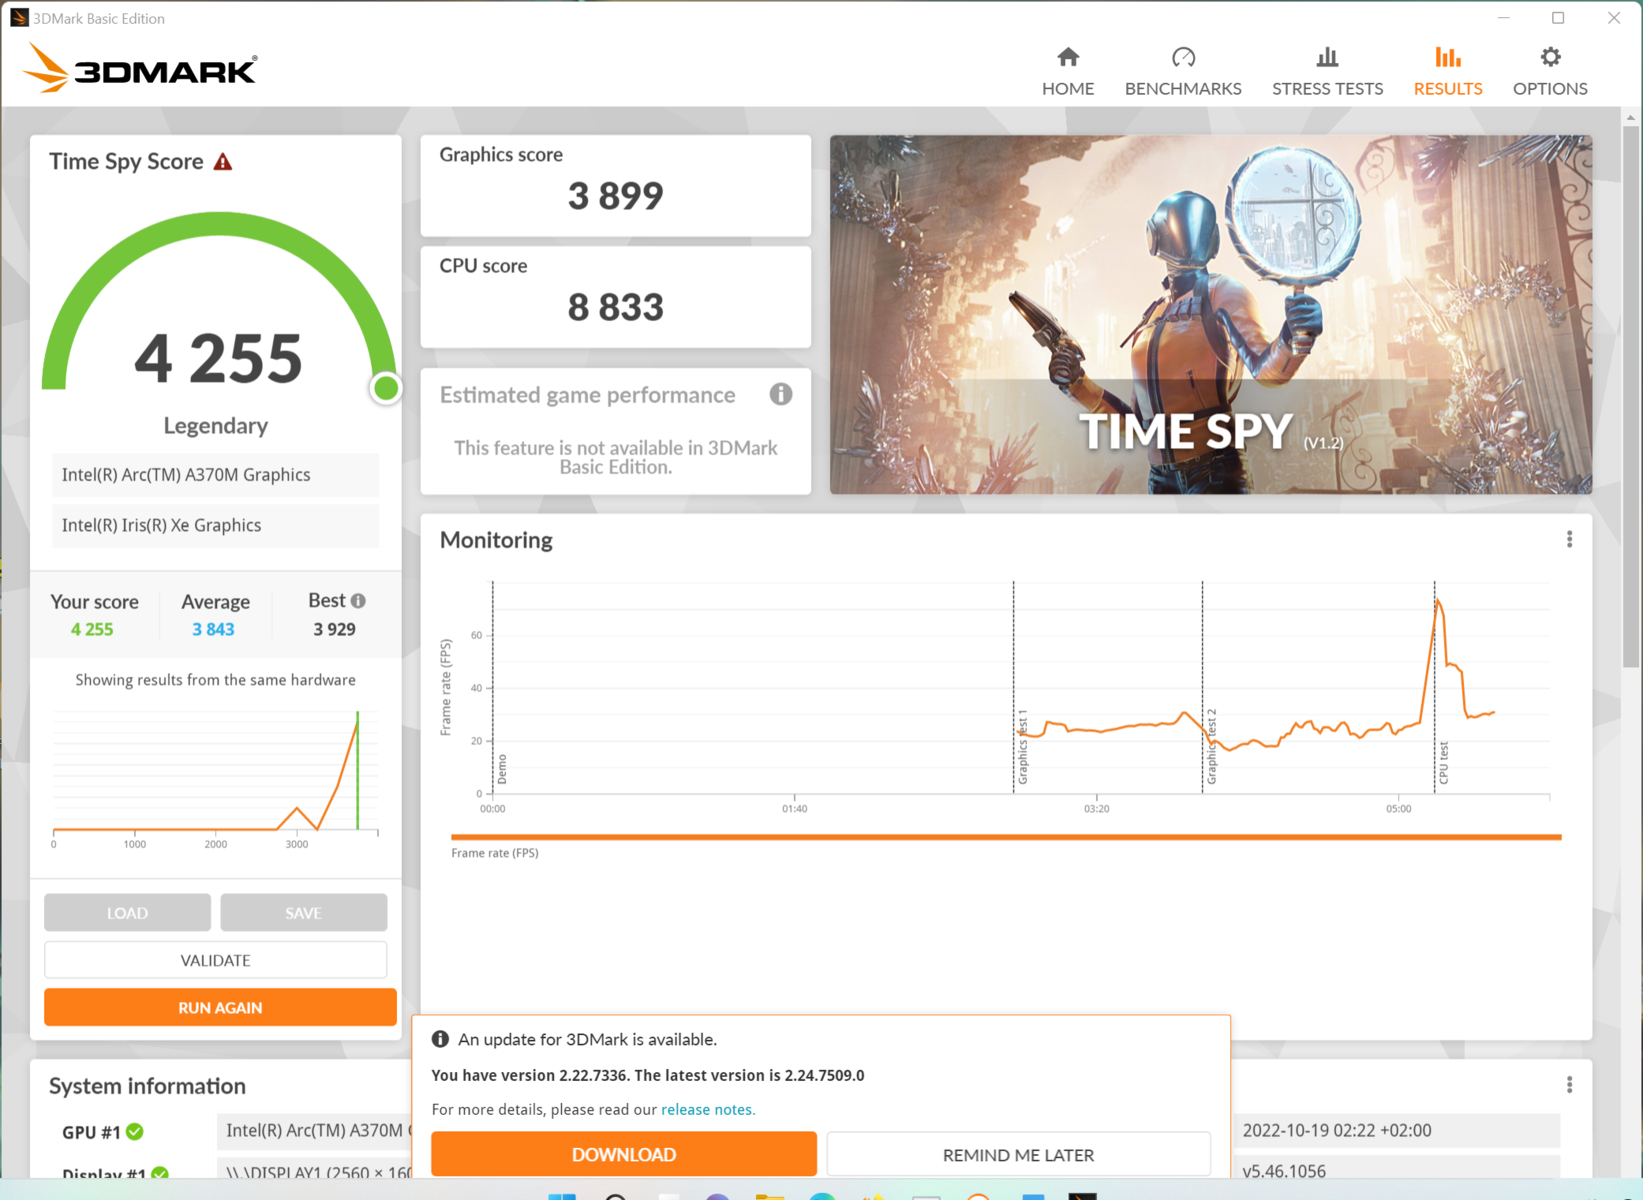
| 3DMark 11 Performance | 12621 poäng | |
| 3DMark Cloud Gate Standard Score | 28727 poäng | |
| 3DMark Fire Strike Score | 7789 poäng | |
| 3DMark Time Spy Score | 4255 poäng | |
Hjälp | ||
| Blender | |
| v3.3 Classroom oneAPI/Intel | |
| Acer Swift X SFX16-52G-77RX | |
| v3.3 Classroom HIP/AMD | |
| Lenovo ThinkPad T14 G3-21CF004NGE | |
| v3.3 Classroom CUDA | |
| HP ZBook Firefly 14 G9-6B8A2EA | |
| Acer Swift X SFX16-51G-5388 | |
| HP Envy 16 h0112nr | |
| Dell Inspiron 16 Plus 7620 | |
| v3.3 Classroom CPU | |
| HP ZBook Firefly 14 G9-6B8A2EA | |
| Acer Swift X SFX16-51G-5388 | |
| Acer Swift X SFX16-52G-77RX | |
| Acer Swift X SFX16-52G-52VE | |
| Lenovo ThinkPad T14 G3-21CF004NGE | |
| HP Envy 16 h0112nr | |
| Dell Inspiron 16 Plus 7620 | |
* ... mindre är bättre
Spelprestanda
I spel kan Intel Arc A370M överträffas med 60 % av RTX 3050 Ti i Vivobook Pro 16Xoch med cirka 100 % av Dell Inspiron 16. I vissa spel blir fördelen extrem med 200-300 %, vilket beror på otillräckliga drivrutinsoptimeringar av den fortfarande ganska unga grafikenheten
GeForceRTX 3060 i HP Envy 16 är ungefär 3 gånger snabbare i nästan alla fall, och en integrerad Radeon 680Möverträffas endast med 10-20 %.
Om du väljer en lägre upplösning (Full HD) än den ursprungliga QHD+-upplösningen och låter detaljerna vara medelhöga eller höga kan de flesta spel visas smidigt. I moderna spel är höga detaljnivåer då dock endast sällan möjliga.
| The Witcher 3 - 1920x1080 High Graphics & Postprocessing (Nvidia HairWorks Off) | |
| HP Envy 16 h0112nr | |
| Dell Inspiron 16 Plus 7620 | |
| Genomsnitt av klass Multimedia (22 - 224, n=13, senaste 2 åren) | |
| Lenovo ThinkBook 16 G4+ IAP | |
| Acer Swift X SFX16-51G-5388 | |
| Acer Swift X SFX16-52G-77RX | |
| Lenovo IdeaCentre AIO 3 24IAP7 | |
| Acer Swift X SFX16-52G-52VE | |
| Lenovo IdeaPad 5 Pro 16ARH7 | |
| Shadow of the Tomb Raider | |
| 1920x1080 High Preset AA:SM | |
| Genomsnitt av klass Multimedia (26 - 143, n=8, senaste 2 åren) | |
| Genomsnitt Intel Arc A370M (39 - 42, n=2) | |
| Acer Swift X SFX16-52G-77RX | |
| 1920x1080 Highest Preset AA:T | |
| Genomsnitt av klass Multimedia (23 - 129, n=8, senaste 2 åren) | |
| Acer Swift X SFX16-52G-77RX | |
| Genomsnitt Intel Arc A370M (n=1) | |
| God of War | |
| 1920x1080 Original Preset | |
| Acer Swift X SFX16-52G-77RX | |
| Genomsnitt Intel Arc A370M (30 - 31.8, n=3) | |
| Acer Swift X SFX16-52G-52VE | |
| Lenovo IdeaPad 5 Pro 16ARH7 | |
| 1920x1080 High Preset | |
| Acer Swift X SFX16-52G-77RX | |
| Genomsnitt Intel Arc A370M (24 - 25.6, n=3) | |
| Acer Swift X SFX16-52G-52VE | |
| Lenovo IdeaPad 5 Pro 16ARH7 | |
| GRID Legends | |
| 1920x1080 Ultra Preset | |
| Acer Swift X SFX16-52G-77RX | |
| Genomsnitt Intel Arc A370M (41.7 - 41.9, n=2) | |
| Acer Swift X SFX16-52G-52VE | |
| 2560x1440 Ultra Preset | |
| Acer Swift X SFX16-52G-77RX | |
| Genomsnitt Intel Arc A370M (31.3 - 34.4, n=2) | |
| Acer Swift X SFX16-52G-52VE | |
The Witcher 3 FPS Chart
| låg | med. | hög | ultra | QHD | 4K | |
|---|---|---|---|---|---|---|
| GTA V (2015) | 148.6 | 136.9 | 41.4 | 16.4 | 11 | |
| The Witcher 3 (2015) | 168.8 | 100 | 53 | 26.3 | ||
| Dota 2 Reborn (2015) | 99.1 | 83.5 | 68.4 | 66.3 | 39.5 | |
| Final Fantasy XV Benchmark (2018) | 70.4 | 37.9 | 26.3 | 19.3 | ||
| X-Plane 11.11 (2018) | 34.7 | 27.8 | 24 | 22.2 | ||
| Far Cry 5 (2018) | 90 | 49 | 46 | 43 | 29 | |
| Strange Brigade (2018) | 175.8 | 73.2 | 61.4 | 52.1 | ||
| Shadow of the Tomb Raider (2018) | 67 | 49 | 39 | 32 | 20 | |
| God of War (2022) | 35.8 | 31.8 | 25.6 | 20.4 | 12.4 | |
| GRID Legends (2022) | 95.6 | 69.4 | 55 | 41.9 | 34.4 |
Utsläpp: Acer Swift X 16 gillar att blåsa mycket luft
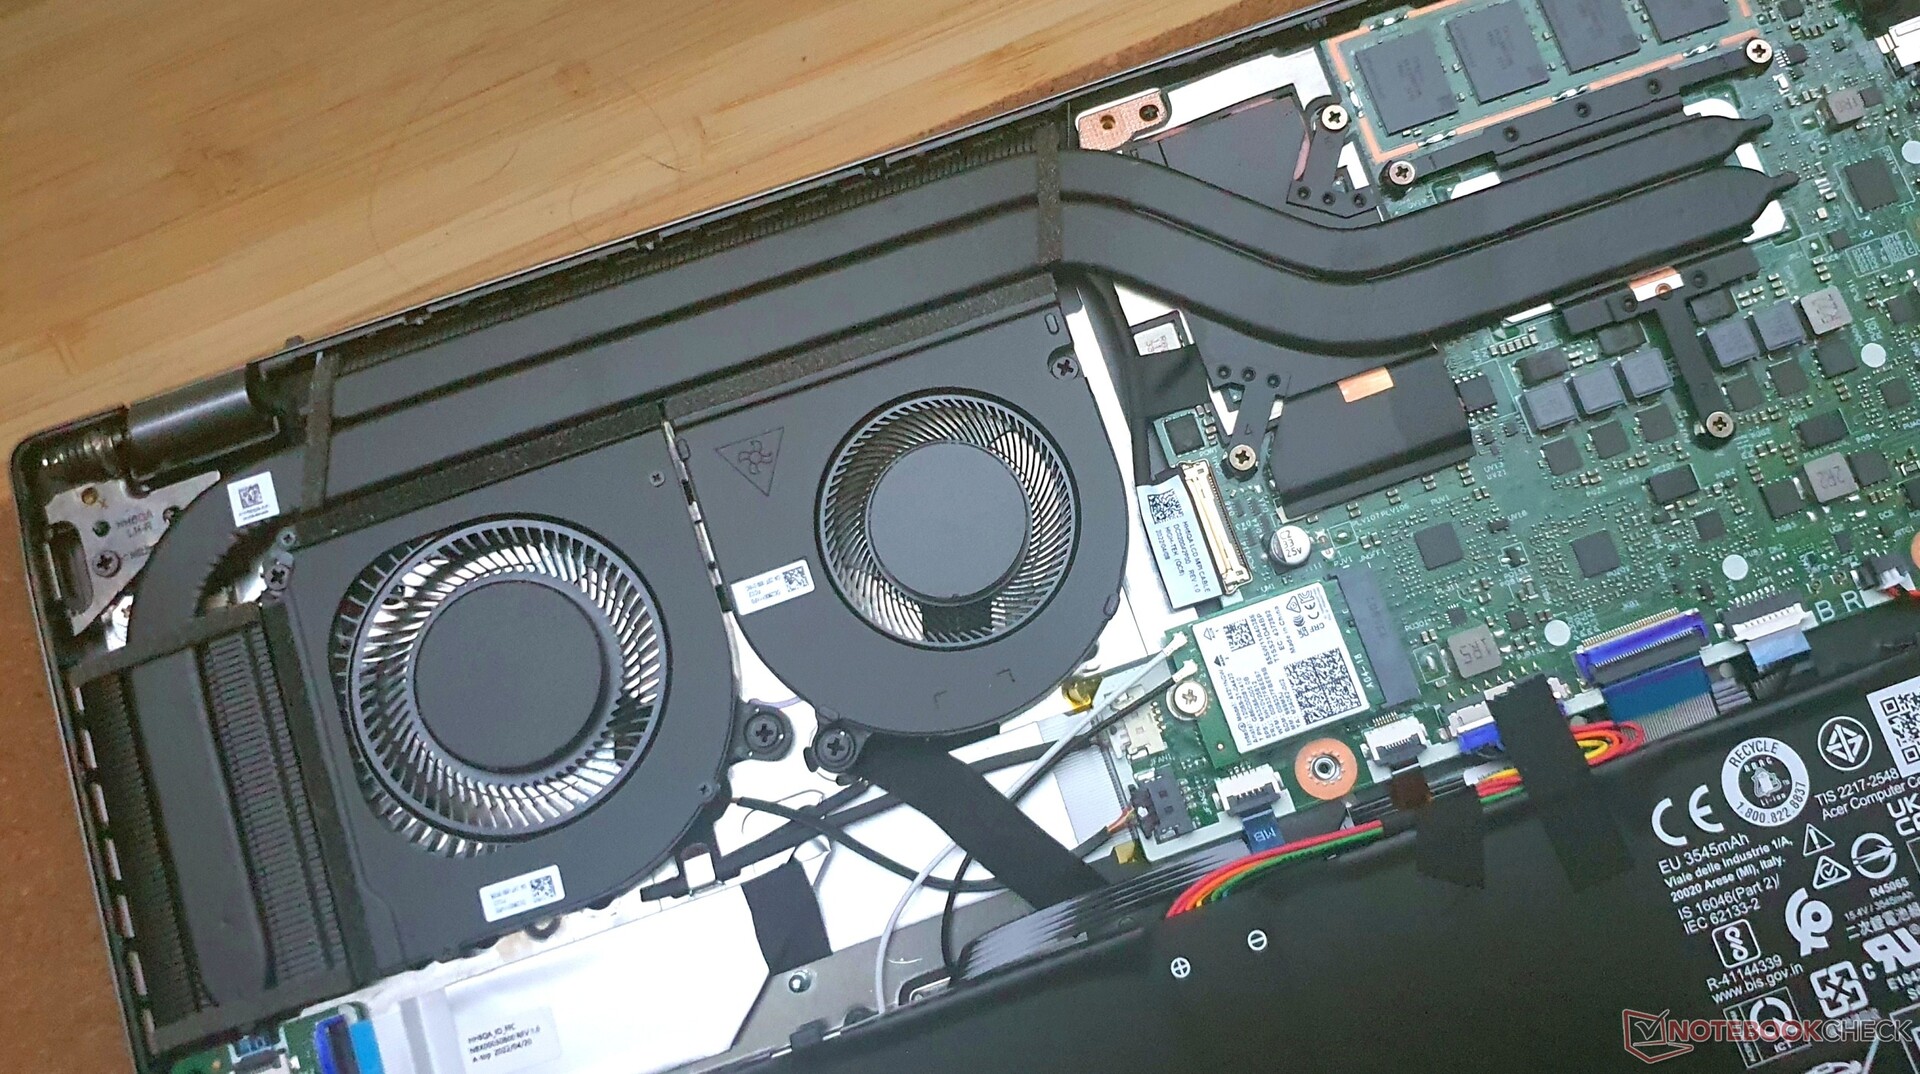
Bullerutsläpp
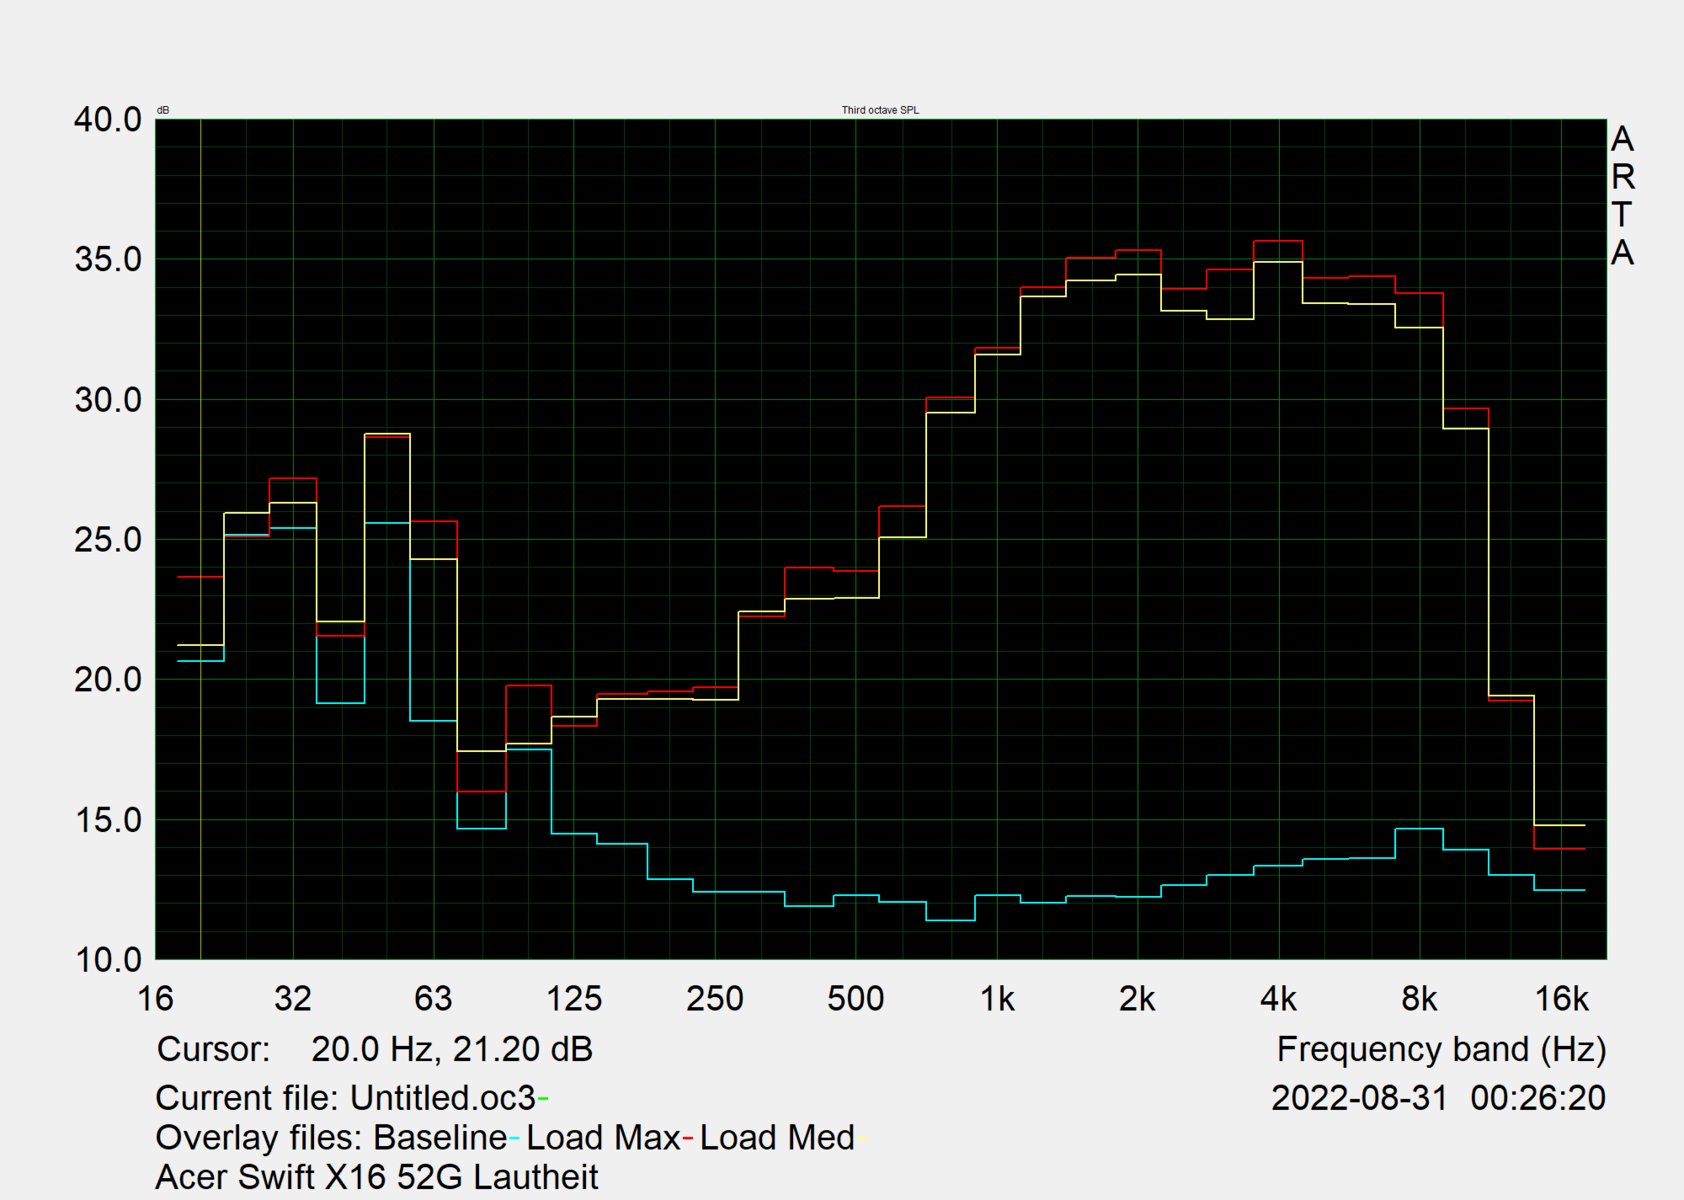
Fläktarna är mest högljudda i prestandaläget och körs också mest under mycket låg belastning.
I läget Normal är de tystare och är åtminstone knappt märkbara vid låg belastning. Men detta ändras också igen vid något högre belastning.
I Silent-läget förblir fläktarna avstängda betydligt oftare, men de börjar också gå redan vid CPU-belastningar på endast cirka 10 %, till exempel när du laddar ner ett Steam-spel.
Med 44,7 dB(A) i genomsnitt är fläktarna inte heller riktigt tysta vid högre belastning. De 36,5 dB(A) frånCore-i5-modellenär betydligt tystare.
Alla andra enheter i vårt testfält är dock lika högljudda under belastning. Under laddningen hör vi då och då några elektroniska ljud nära USB-C-porten.
Ljudnivå
| Låg belastning |
| 25 / 25 / 25 dB(A) |
| Hög belastning |
| 44.7 / 45.6 dB(A) |
 | ||
30 dB tyst 40 dB(A) hörbar 50 dB(A) högt ljud |
||
min: | ||
| Acer Swift X SFX16-52G-77RX A370M, i7-1260P, WDC PC SN810 1TB | Acer Swift X SFX16-52G-52VE A370M, i5-1240P, Micron 3400 MTFDKBA512TFH 512GB | Lenovo ThinkBook 16 G4+ IAP GeForce RTX 2050 Mobile, i7-12700H, Micron 2450 1TB MTFDKCD1T0TFK | Dell Inspiron 16 Plus 7620 GeForce RTX 3050 Ti Laptop GPU, i7-12700H, Kioxia BG5 KBG50ZNS512G | HP Envy 16 h0112nr GeForce RTX 3060 Laptop GPU, i7-12700H, Micron 3400 1TB MTFDKBA1T0TFH | Asus Vivobook Pro 16X-M7600QE GeForce RTX 3050 Ti Laptop GPU, R9 5900HX, SK Hynix HFM001TD3JX013N | |
|---|---|---|---|---|---|---|
| Noise | 3% | 1% | -6% | -1% | -4% | |
| av / miljö * (dB) | 25 | 25 -0% | 24.2 3% | 23.3 7% | 22.8 9% | 26 -4% |
| Idle Minimum * (dB) | 25 | 25 -0% | 24.2 3% | 25.7 -3% | 22.9 8% | 27 -8% |
| Idle Average * (dB) | 25 | 25 -0% | 24.2 3% | 26.1 -4% | 22.9 8% | 27 -8% |
| Idle Maximum * (dB) | 25 | 26.4 -6% | 24.2 3% | 30.6 -22% | 30.5 -22% | 27.5 -10% |
| Load Average * (dB) | 44.7 | 36.5 18% | 47 -5% | 46.2 -3% | 41.4 7% | 41.7 7% |
| Load Maximum * (dB) | 45.6 | 43 6% | 47 -3% | 49.4 -8% | 51.4 -13% | 45.3 1% |
| Witcher 3 ultra * (dB) | 47 | 49.2 | 51.1 |
* ... mindre är bättre
Temperaturer
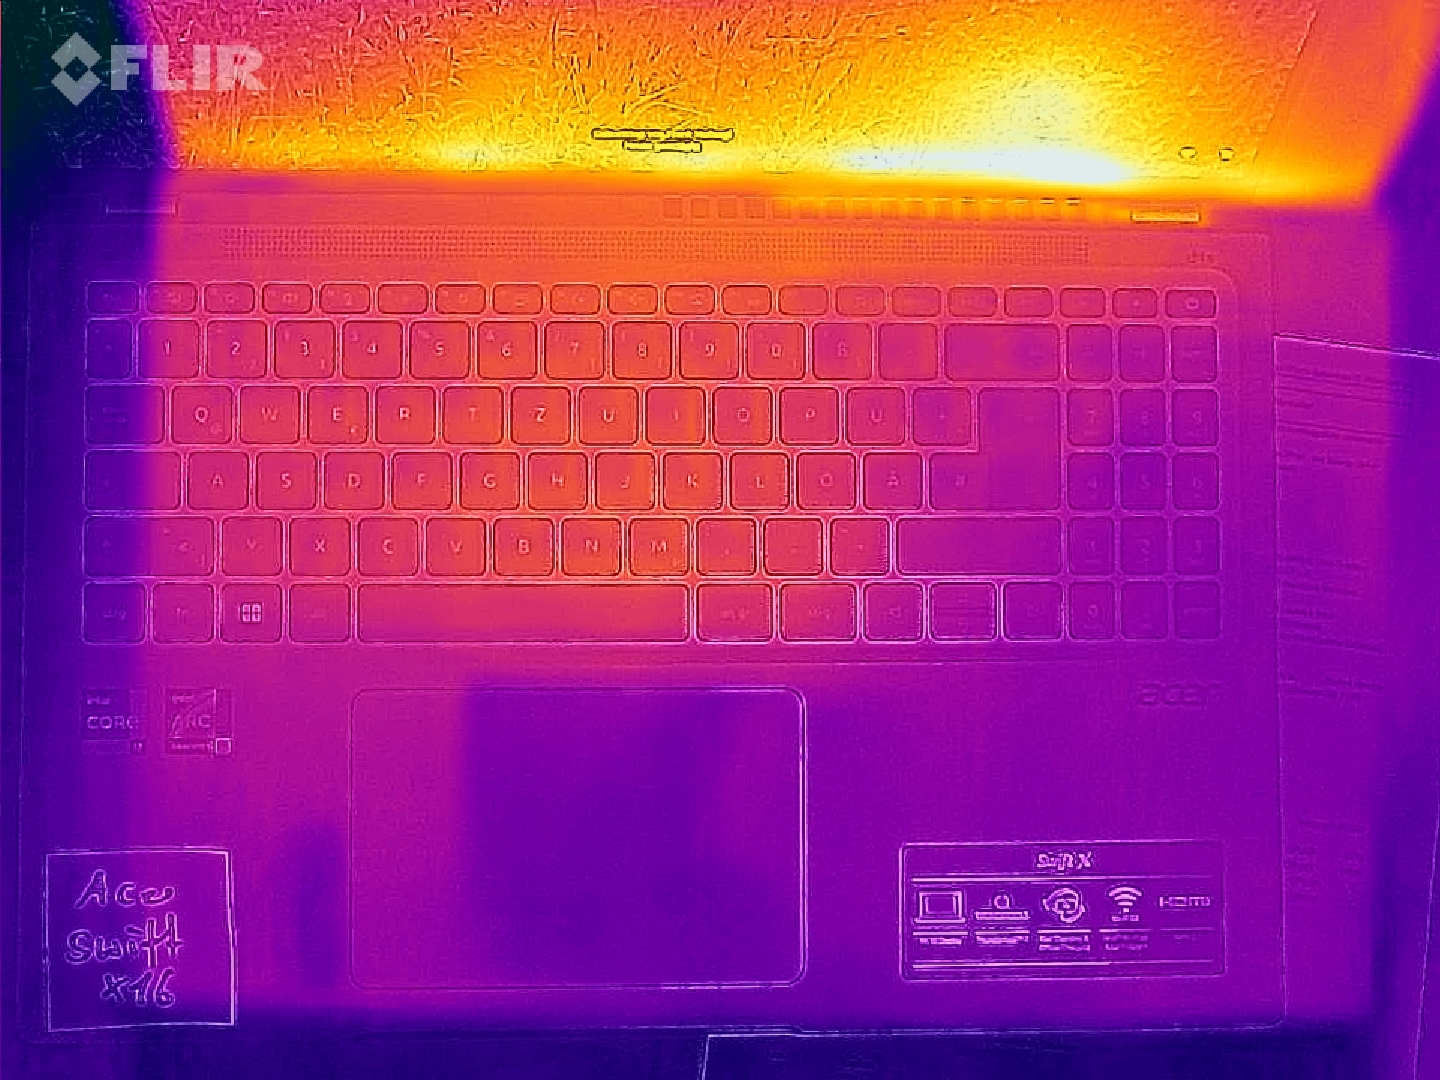
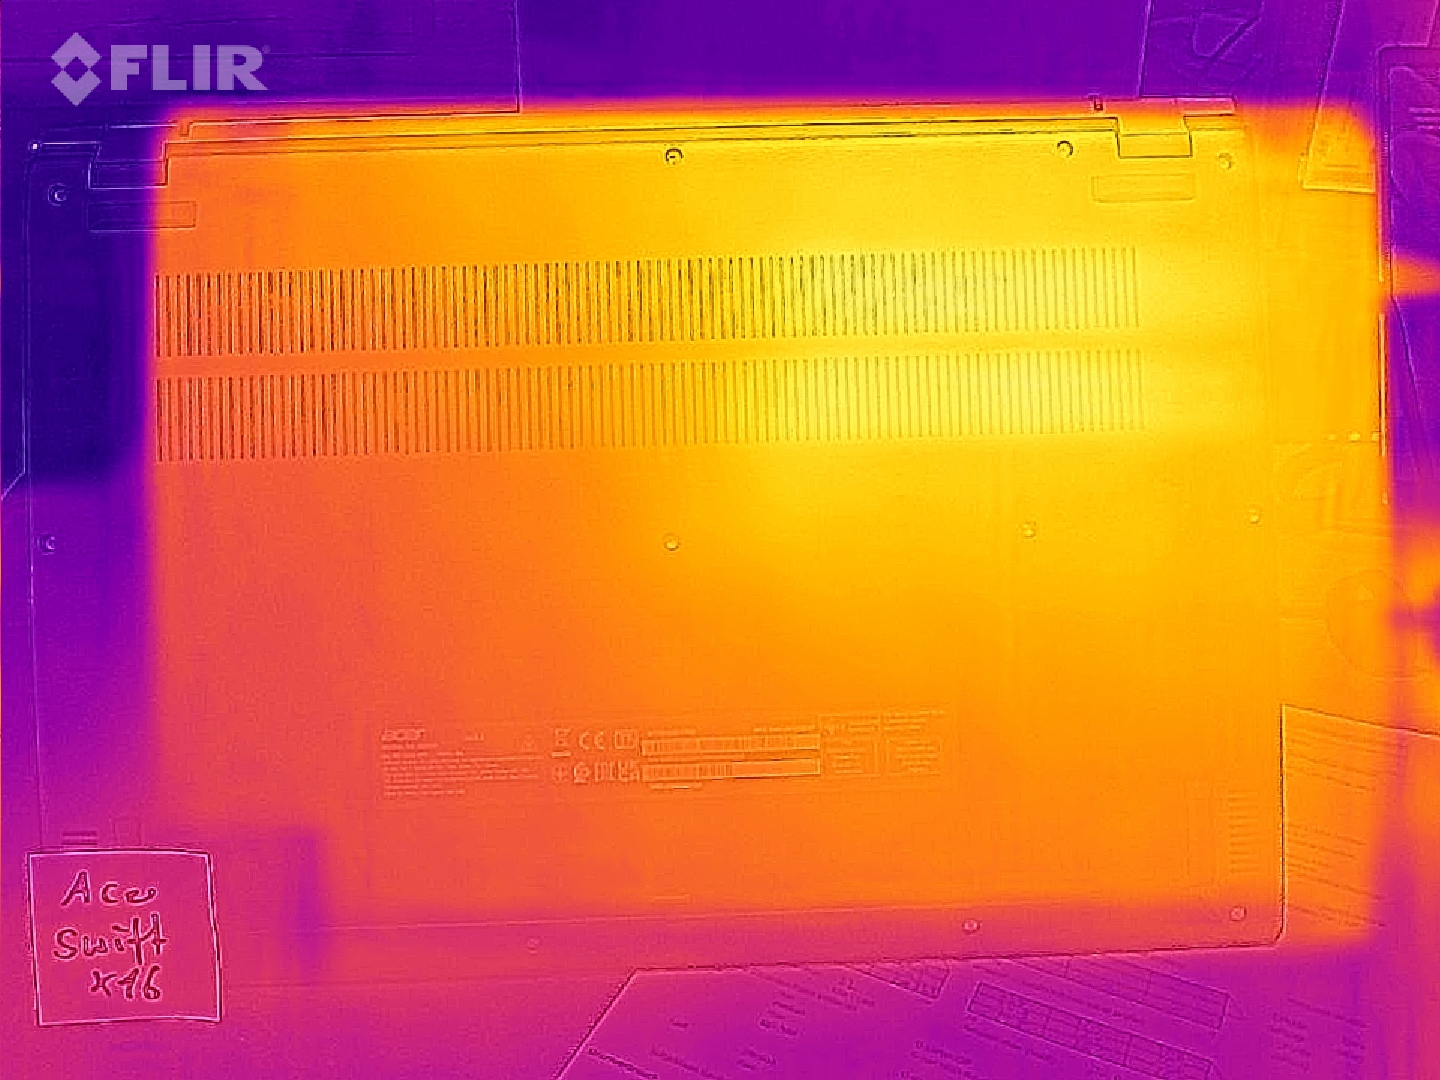
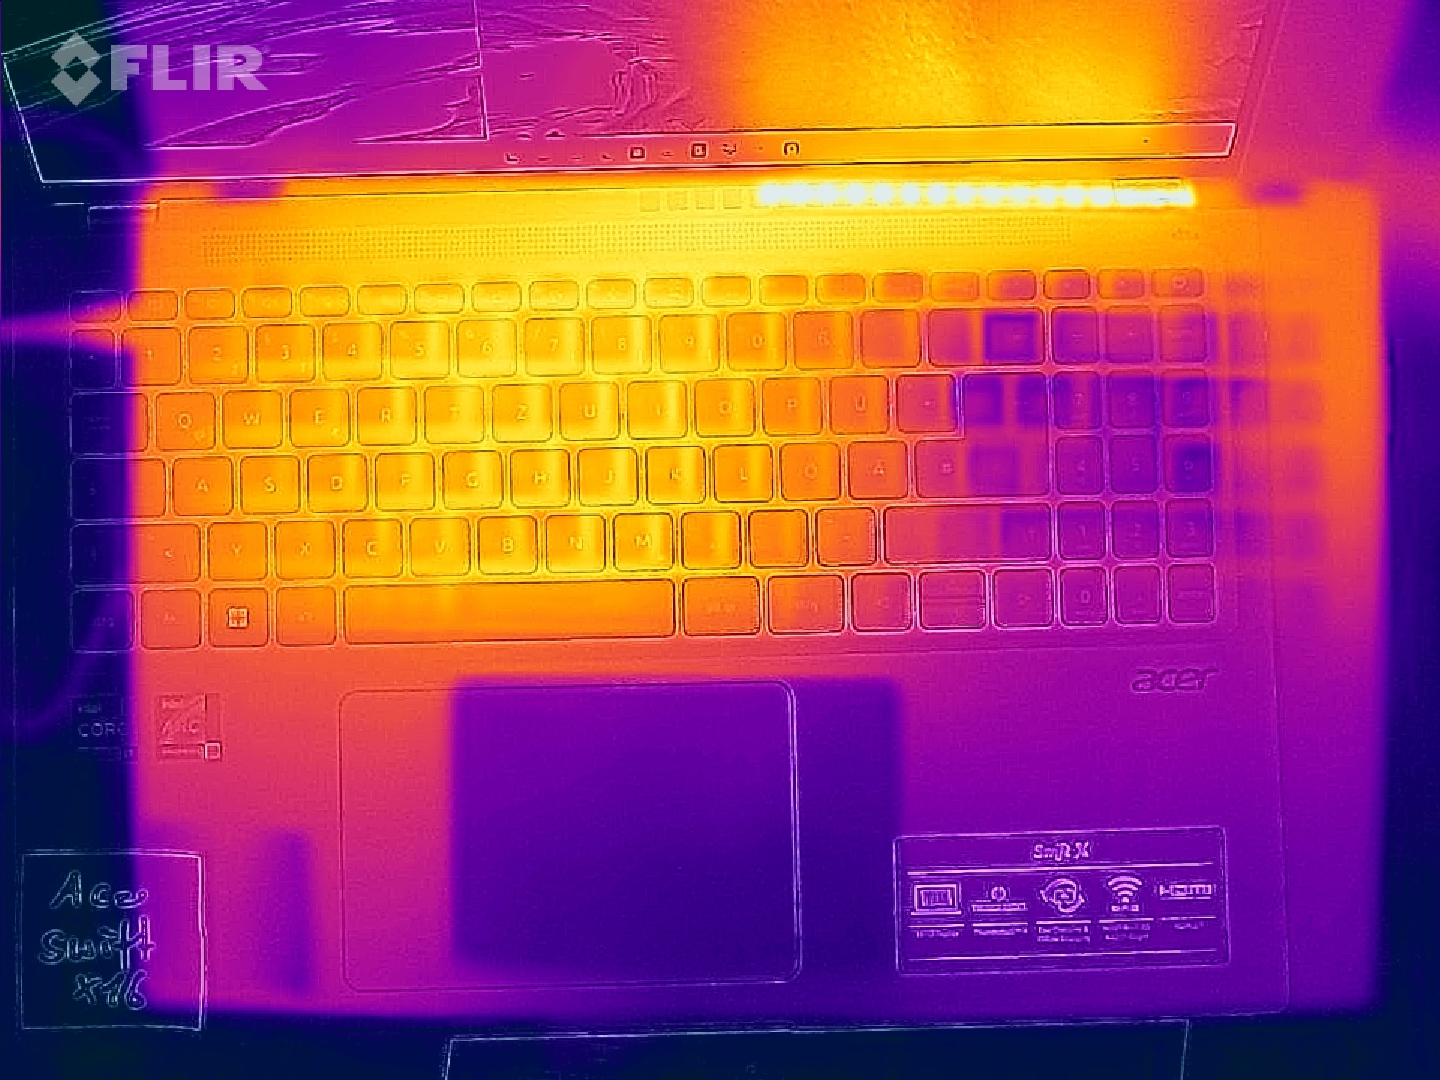
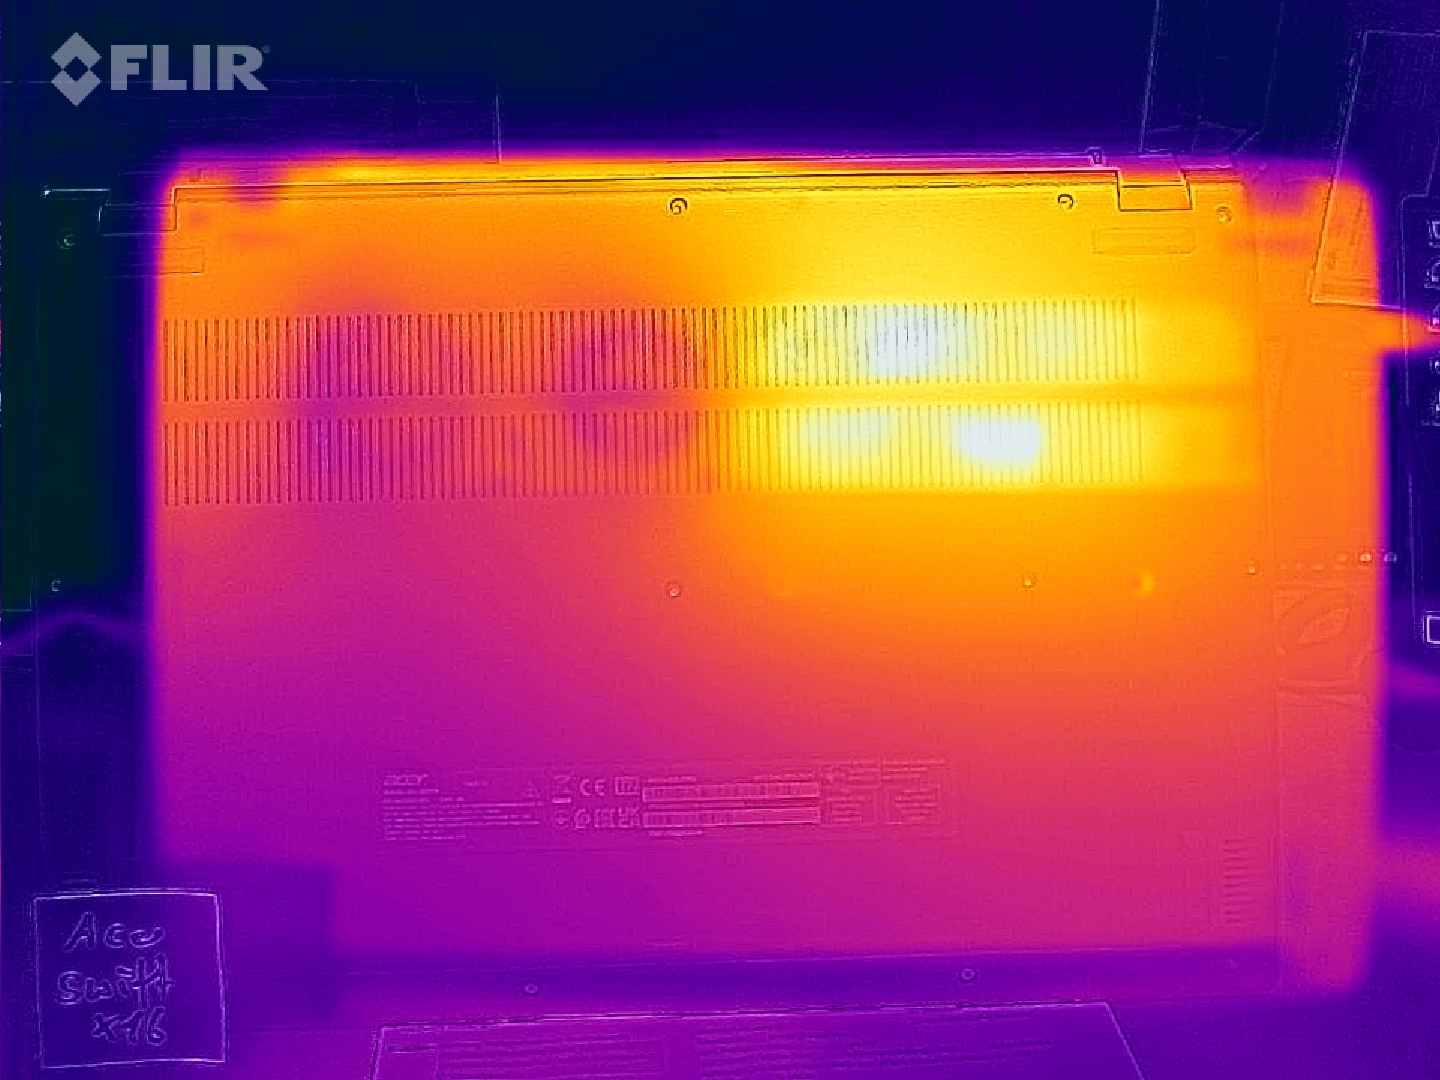
Kylsystemet är inte bara högljutt utan också svagt. Särskilt området ovanför tangentbordet nära fläktventilerna kan bli obehagligt varmt vid full belastning, och enhetens undersida värms då också upp med en hotspot på upp till 55,5 °C (131 °F). Även med kraftfullare komponenter vet konkurrenterna att hålla sig svalare.
(-) Den maximala temperaturen på ovansidan är 49.4 °C / 121 F, jämfört med genomsnittet av 36.8 °C / 98 F , allt från 21 till 71 °C för klassen Multimedia.
(-) Botten värms upp till maximalt 55.5 °C / 132 F, jämfört med genomsnittet av 39.1 °C / 102 F
(+) Vid tomgångsbruk är medeltemperaturen för ovansidan 25.9 °C / 79 F, jämfört med enhetsgenomsnittet på 31.3 °C / ### class_avg_f### F.
(-) Handledsstöden och pekplattan kan bli väldigt varma vid beröring med maximalt 49.4 °C / 120.9 F.
(-) Medeltemperaturen för handledsstödsområdet på liknande enheter var 28.7 °C / 83.7 F (-20.7 °C / -37.2 F).
| Acer Swift X SFX16-52G-77RX Intel Core i7-1260P, Intel Arc A370M | Acer Swift X SFX16-52G-52VE Intel Core i5-1240P, Intel Arc A370M | Lenovo ThinkBook 16 G4+ IAP Intel Core i7-12700H, NVIDIA GeForce RTX 2050 Mobile | Dell Inspiron 16 Plus 7620 Intel Core i7-12700H, NVIDIA GeForce RTX 3050 Ti Laptop GPU | HP Envy 16 h0112nr Intel Core i7-12700H, NVIDIA GeForce RTX 3060 Laptop GPU | Lenovo IdeaPad 5 Pro 16ARH7 AMD Ryzen 5 6600HS, AMD Radeon 660M | Asus Vivobook Pro 16X-M7600QE AMD Ryzen 9 5900HX, NVIDIA GeForce RTX 3050 Ti Laptop GPU | |
|---|---|---|---|---|---|---|---|
| Heat | -0% | 12% | 7% | 3% | 10% | 15% | |
| Maximum Upper Side * (°C) | 49.4 | 52 -5% | 42.9 13% | 46 7% | 45.2 9% | 46 7% | 39.4 20% |
| Maximum Bottom * (°C) | 55.5 | 50.4 9% | 50.6 9% | 45.8 17% | 44 21% | 48 14% | 43.6 21% |
| Idle Upper Side * (°C) | 28.4 | 30 -6% | 26 8% | 29.2 -3% | 33.6 -18% | 28 1% | 27.6 3% |
| Idle Bottom * (°C) | 32.6 | 32.4 1% | 26.5 19% | 31 5% | 32.6 -0% | 27 17% | 27.5 16% |
* ... mindre är bättre
Stresstest
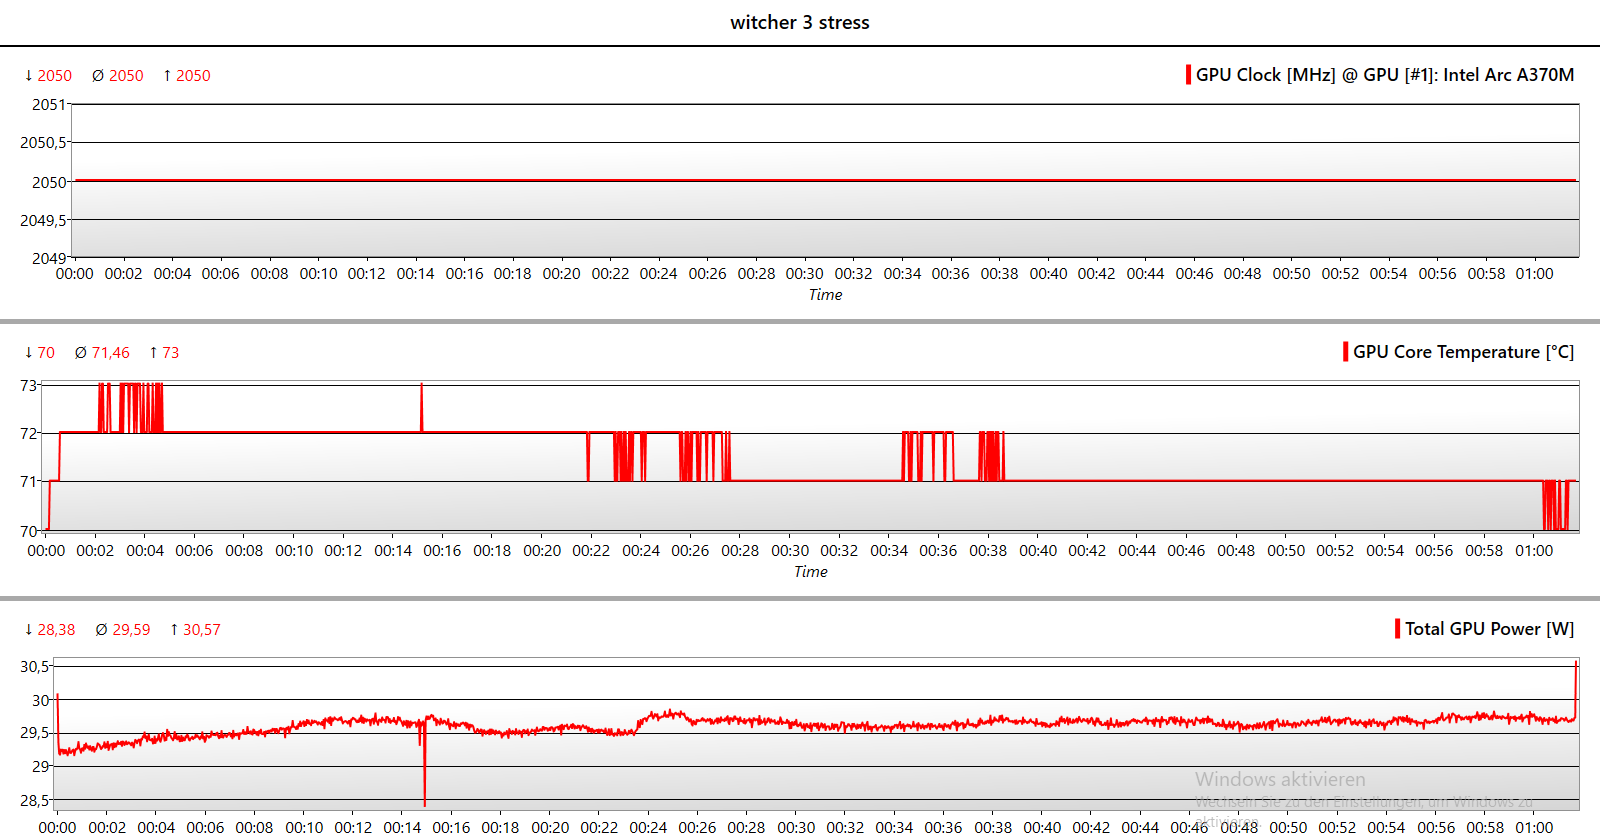
Till och med i det timslånga kombinerade stresstestet med Prime95 och FurMark ligger GPU:s klockfrekvens endast 5 % under maxvärdet. Processorn stryps sedan från 35 till 25 watt och når en temperatur på 88 °C (190 °F), medan GPU:n stabiliseras på 86 °C (187 °F). P-kärnorna har då en klockfrekvens på endast cirka 1,75 GHz, vilket är lägre än den grundläggande klockfrekvensen på 2,1 GHz. Under ren CPU-stress går hastigheten inte under denna gräns.
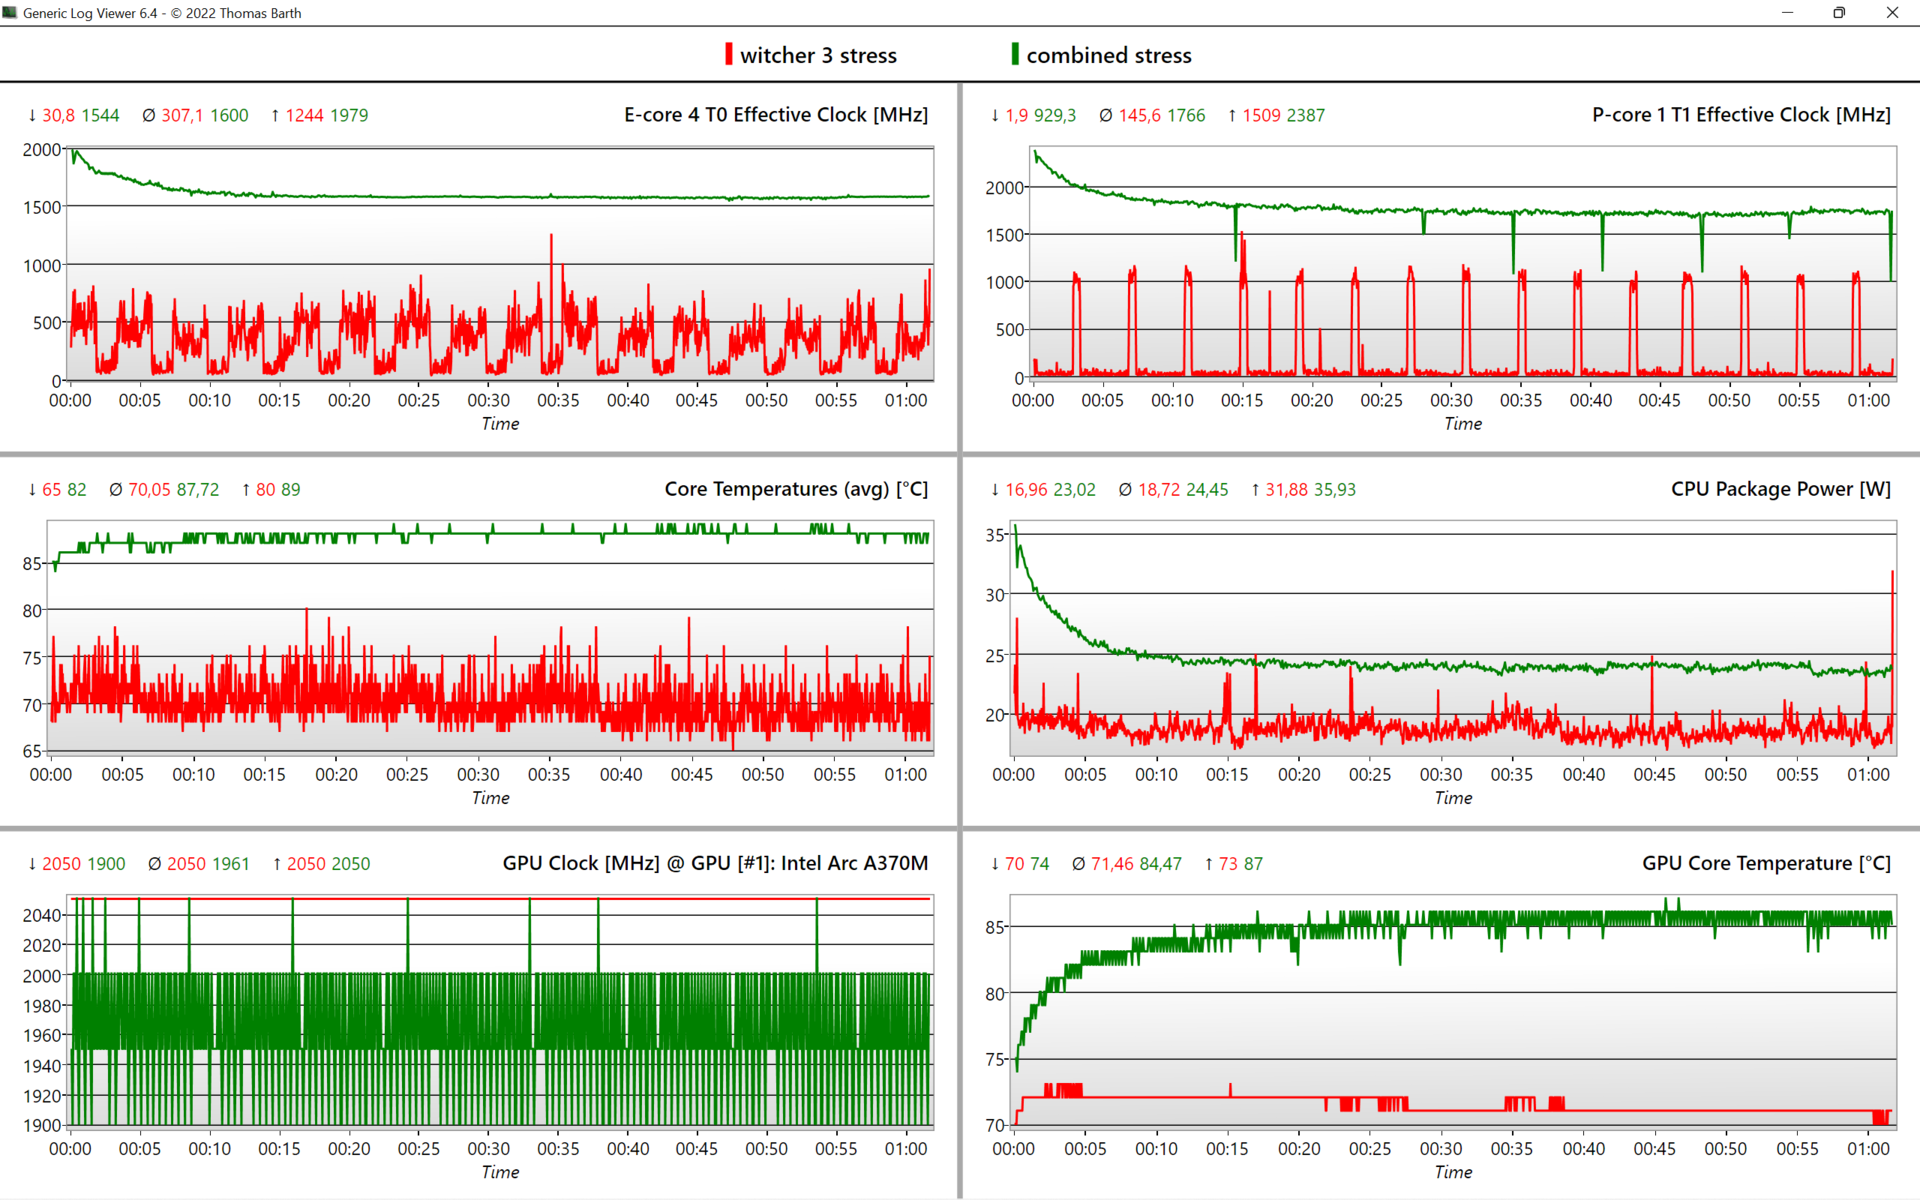
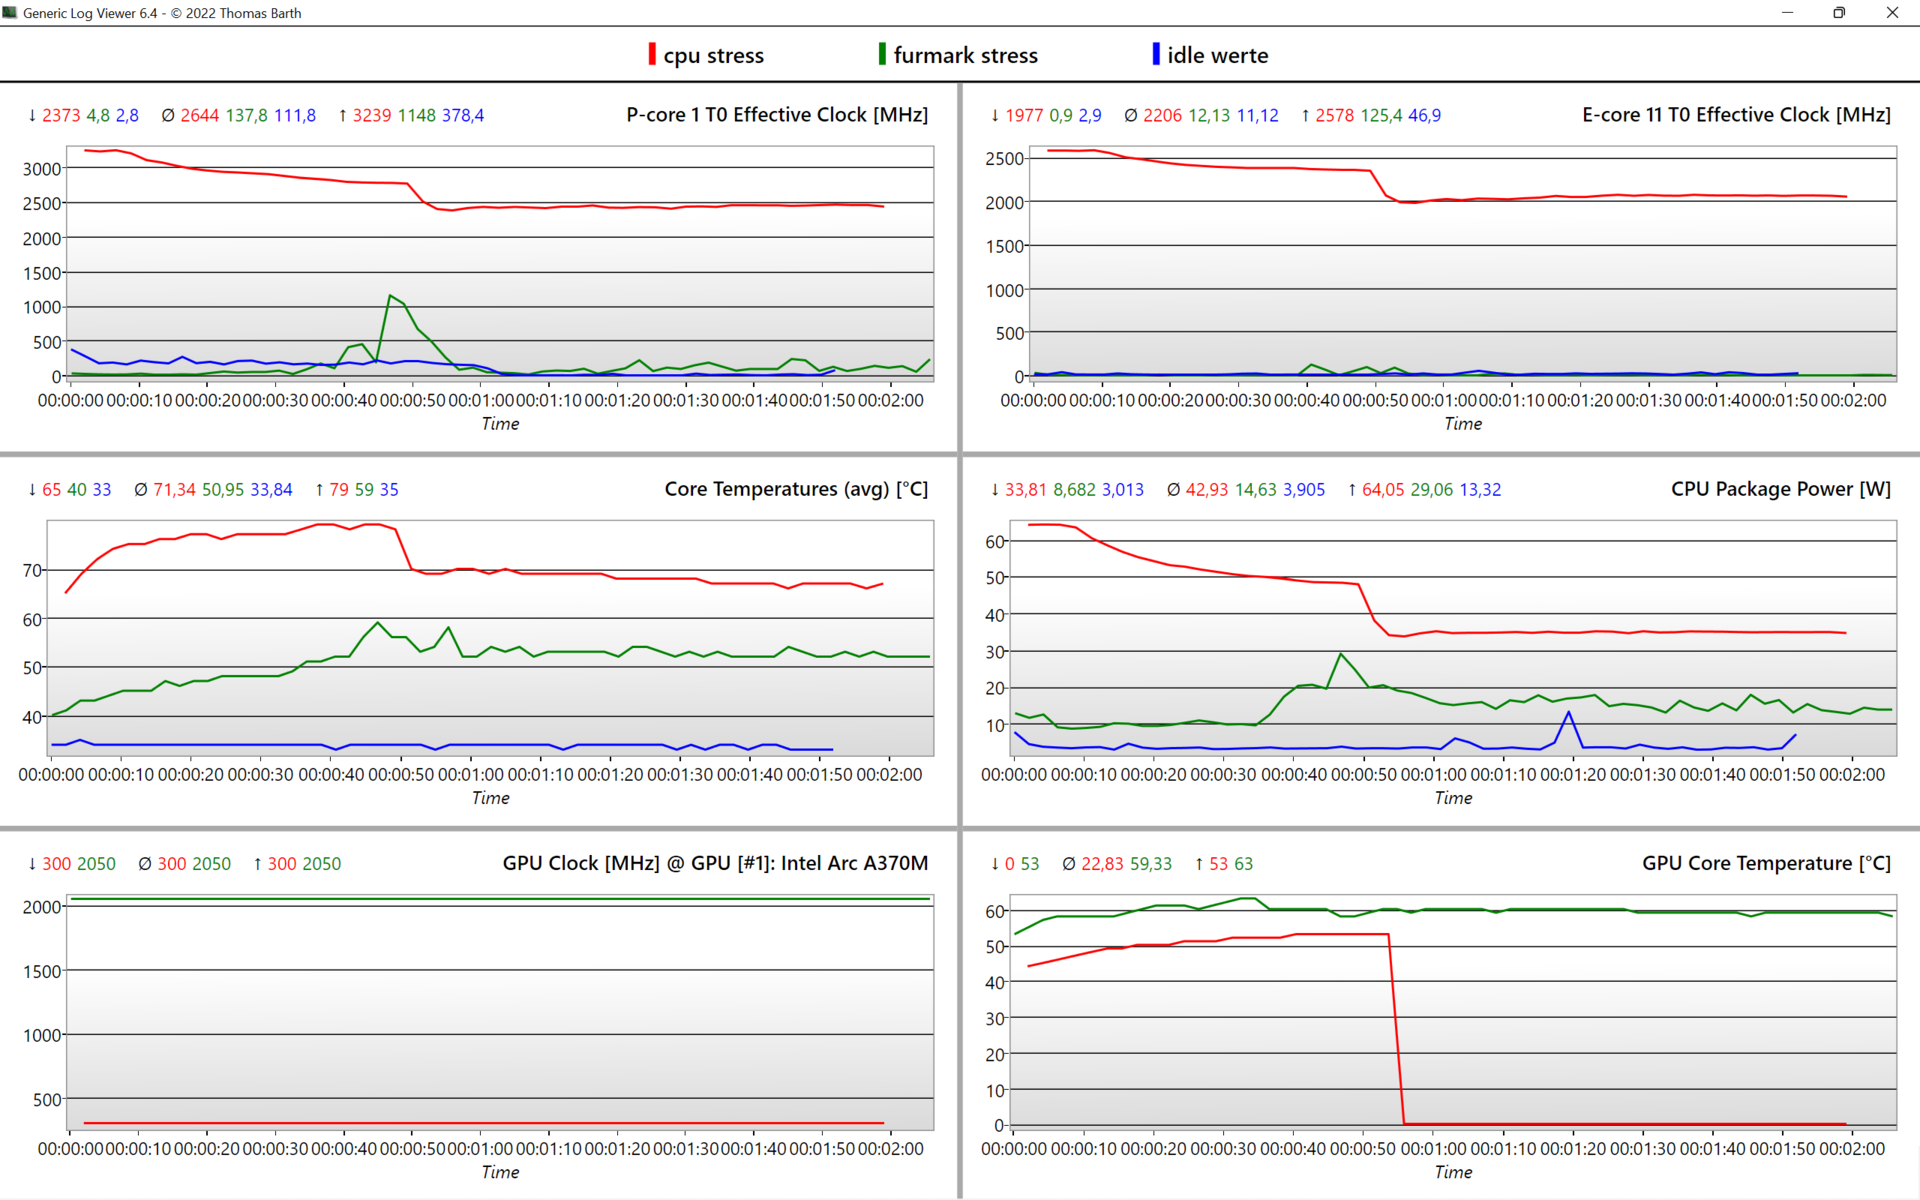
| CPU-klocka E-/P-kärnor (GHz) | GPU-klocka (MHz) | Genomsnittlig CPU-temperatur (°C) | Genomsnittlig GPU-temperatur (°C) | |
| System Idle | - | 300 | 34 | 29 |
| Prime95 Stress | 2.1 / 2.5 | 300 | 67 | 53 |
| Prime95 + FurMark Stress | 1,6 / 1,75 | 1 960 | 88 | 86 |
| FurMark Stress | - | 2 050 | 52 | 60 |
| Witcher 3 Stress | 0,3 / 0,15 | 2,050 | 70 | 71 |
Högtalare
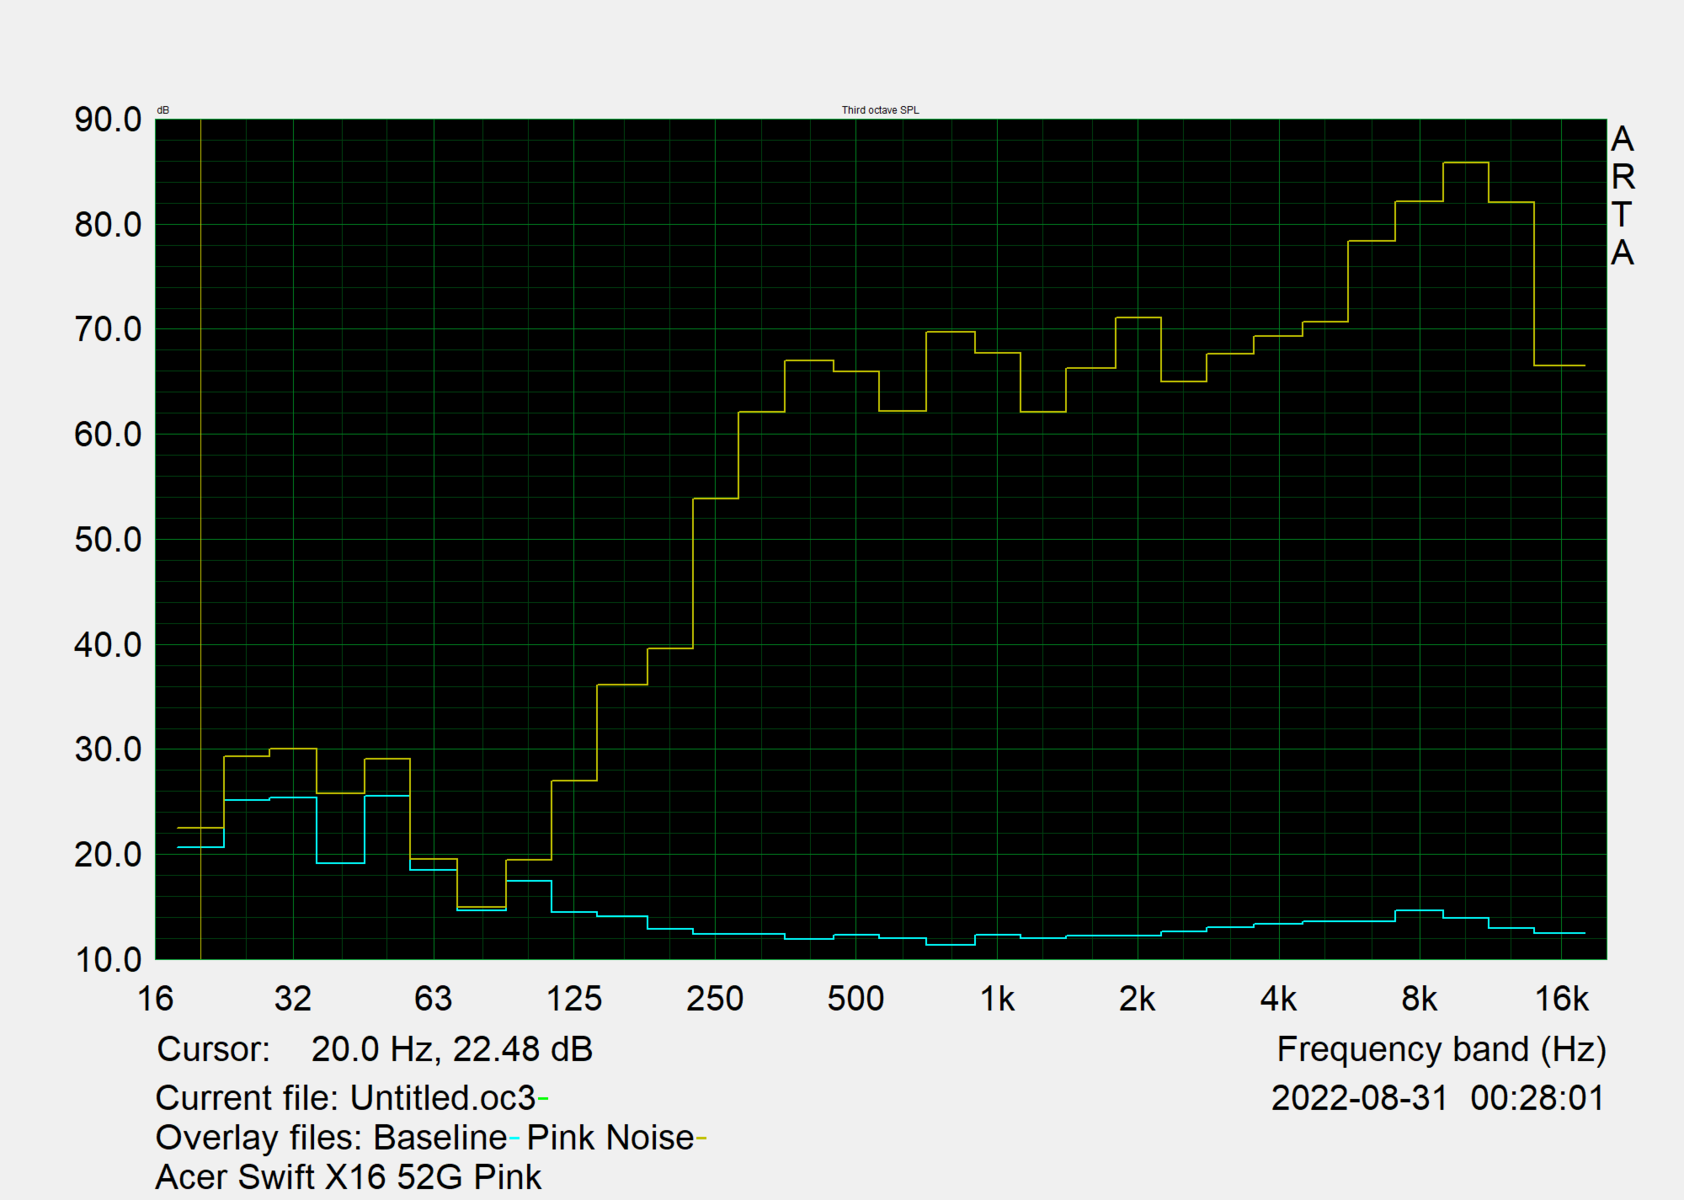
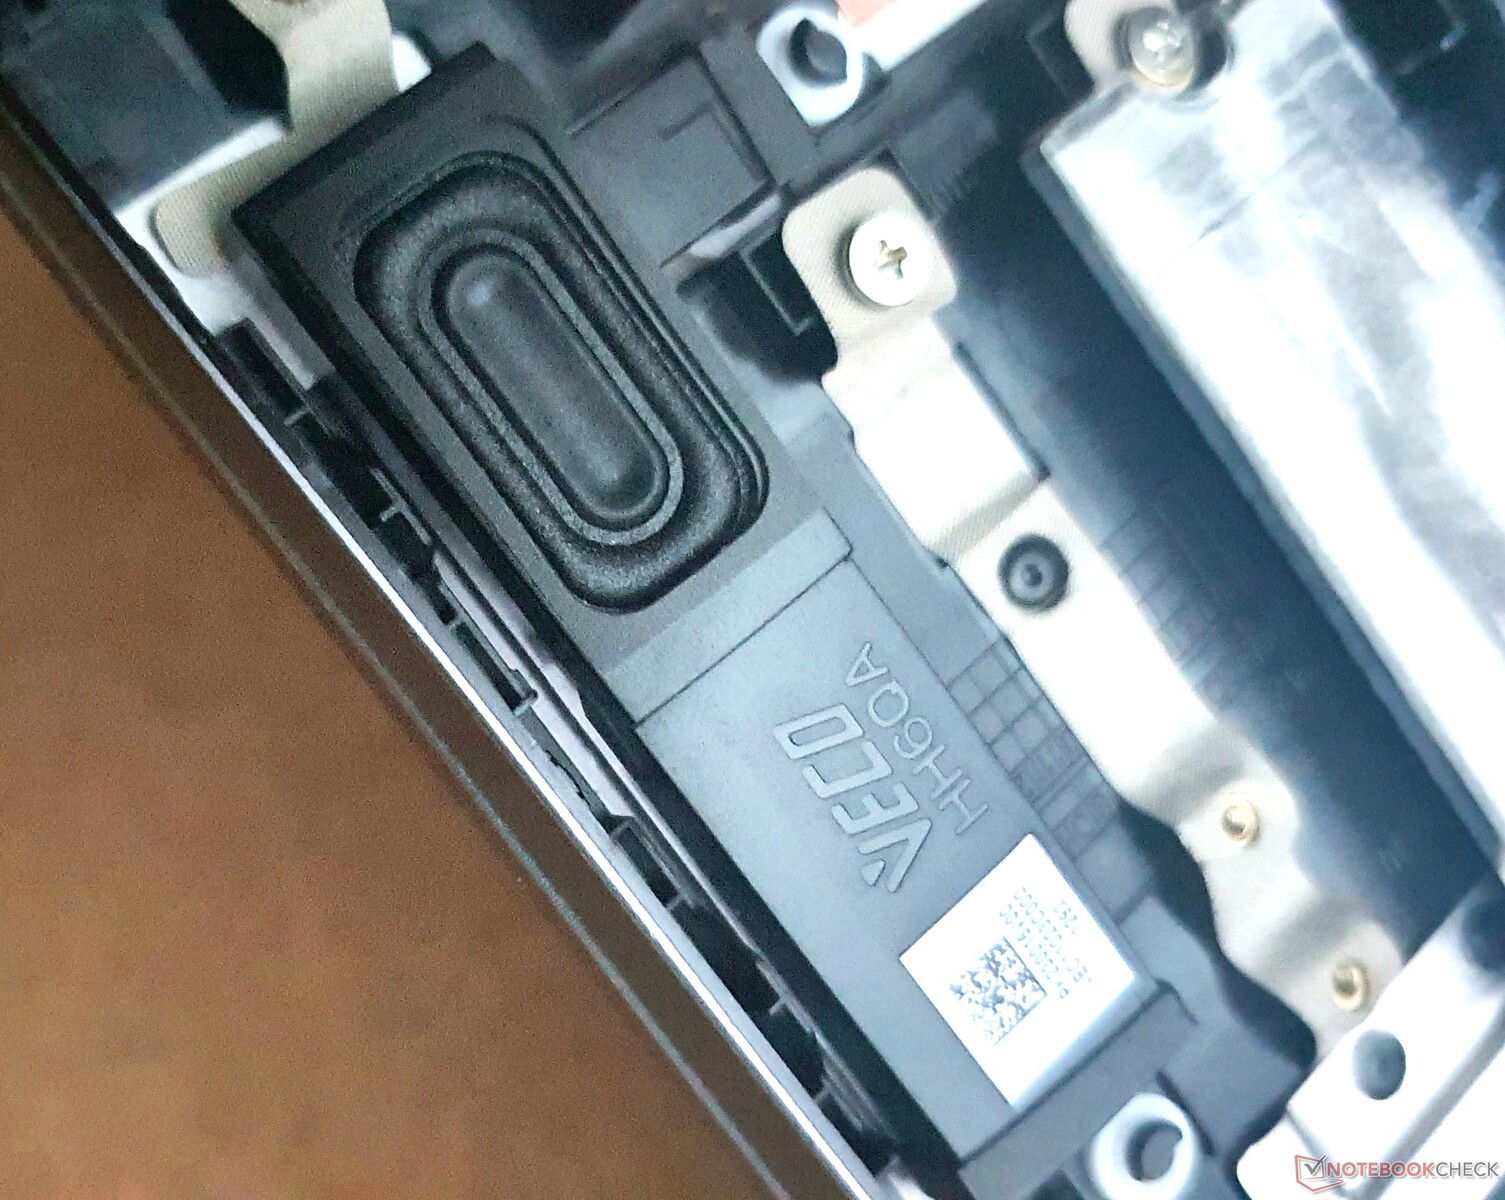
Ljudet från högtalarna, som pekar uppåt, har dålig bas och en kvalitet som ligger under genomsnittet. Med nästan 88 dB(A) lyckas de dock fylla även ett stort rum. Om du bara behöver återge röster är de tillräckliga, men om du vill njuta av musik bör du använda externa ljudenheter via ljudporten eller Bluetooth.
Acer Swift X SFX16-52G-77RX ljudanalys
(+) | högtalare kan spela relativt högt (87.8 dB)
Bas 100 - 315 Hz
(-) | nästan ingen bas - i genomsnitt 26.8% lägre än medianen
(±) | linjäriteten för basen är genomsnittlig (14.6% delta till föregående frekvens)
Mellan 400 - 2000 Hz
(+) | balanserad mellan - endast 2.4% från medianen
(±) | linjäriteten för mids är genomsnittlig (7.9% delta till föregående frekvens)
Högsta 2 - 16 kHz
(±) | högre toppar - i genomsnitt 8.1% högre än medianen
(±) | linjäriteten för toppar är genomsnittlig (7.1% delta till föregående frekvens)
Totalt 100 - 16 000 Hz
(±) | linjäriteten för det totala ljudet är genomsnittlig (20.6% skillnad mot median)
Jämfört med samma klass
» 70% av alla testade enheter i den här klassen var bättre, 8% liknande, 22% sämre
» Den bästa hade ett delta på 5%, genomsnittet var 17%, sämst var 45%
Jämfört med alla testade enheter
» 55% av alla testade enheter var bättre, 8% liknande, 37% sämre
» Den bästa hade ett delta på 4%, genomsnittet var 24%, sämst var 134%
Lenovo ThinkBook 16 G4+ IAP ljudanalys
(±) | högtalarljudstyrkan är genomsnittlig men bra (77.6 dB)
Bas 100 - 315 Hz
(-) | nästan ingen bas - i genomsnitt 17.3% lägre än medianen
(±) | linjäriteten för basen är genomsnittlig (10.3% delta till föregående frekvens)
Mellan 400 - 2000 Hz
(+) | balanserad mellan - endast 4.6% från medianen
(+) | mids är linjära (4.6% delta till föregående frekvens)
Högsta 2 - 16 kHz
(+) | balanserade toppar - endast 1.6% från medianen
(+) | toppar är linjära (6.2% delta till föregående frekvens)
Totalt 100 - 16 000 Hz
(±) | linjäriteten för det totala ljudet är genomsnittlig (15.7% skillnad mot median)
Jämfört med samma klass
» 39% av alla testade enheter i den här klassen var bättre, 5% liknande, 56% sämre
» Den bästa hade ett delta på 5%, genomsnittet var 17%, sämst var 45%
Jämfört med alla testade enheter
» 24% av alla testade enheter var bättre, 5% liknande, 71% sämre
» Den bästa hade ett delta på 4%, genomsnittet var 24%, sämst var 134%
Energihantering: Swift X: riklig batteritid och låg förbrukning
Effektförbrukning
Under vardagliga uppgifter mäter vi cirka 7,6 watt, vilket bara kan slås av några få enheter i multimediaklassen, som t.ex IdeaPad 5 Pro 16.
Omkring 70 watt under spel och i andra belastningsscenarier är samma som föregångaren med den Nvidia RTX 3050 också använde. Enligt vår databas är enheter med en integrerad RDNA 2 GPU från AMD till och med betydligt effektivare med cirka 45 watt. Å andra sidan ärHP Envy 16 med denRTX 3060förbrukar ungefär dubbelt så mycket ström när den spelar (133 watt).
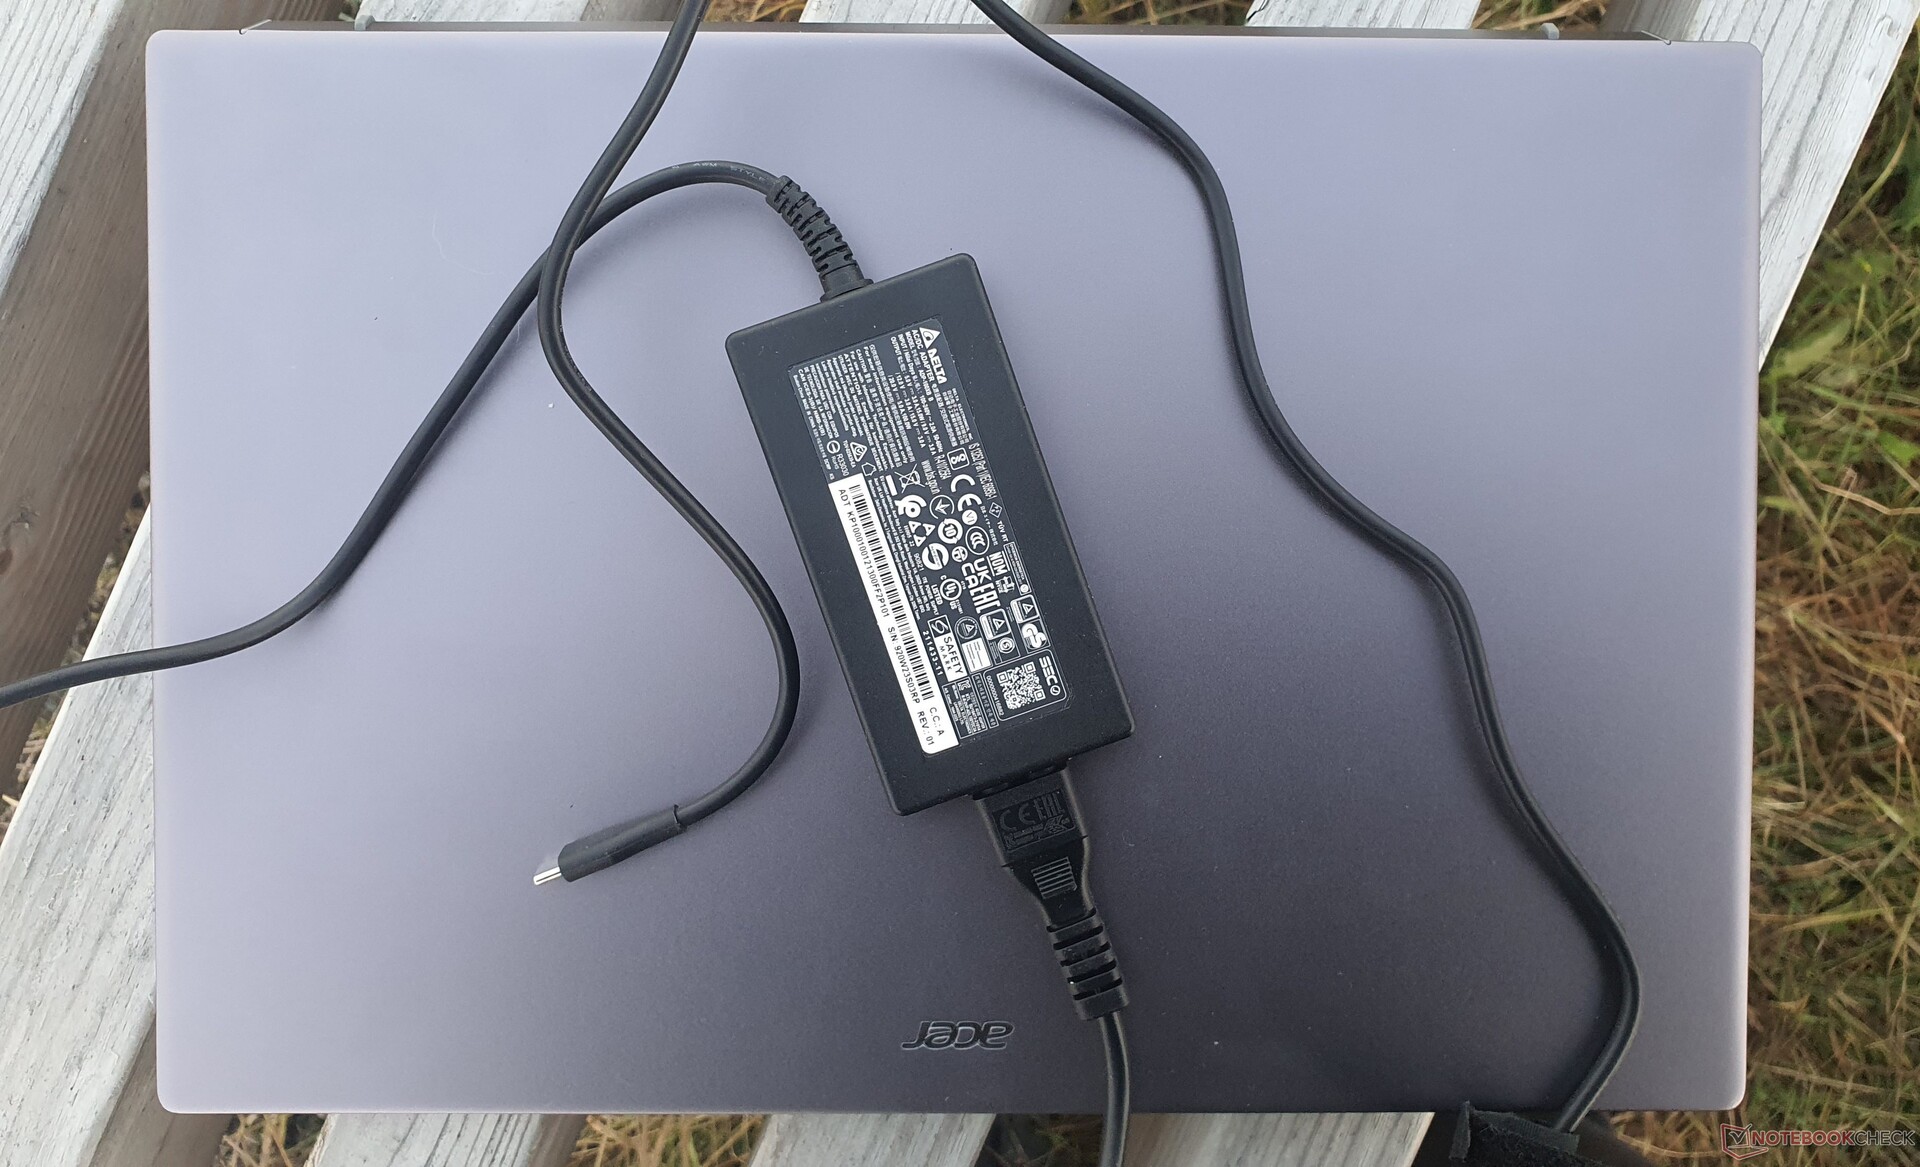
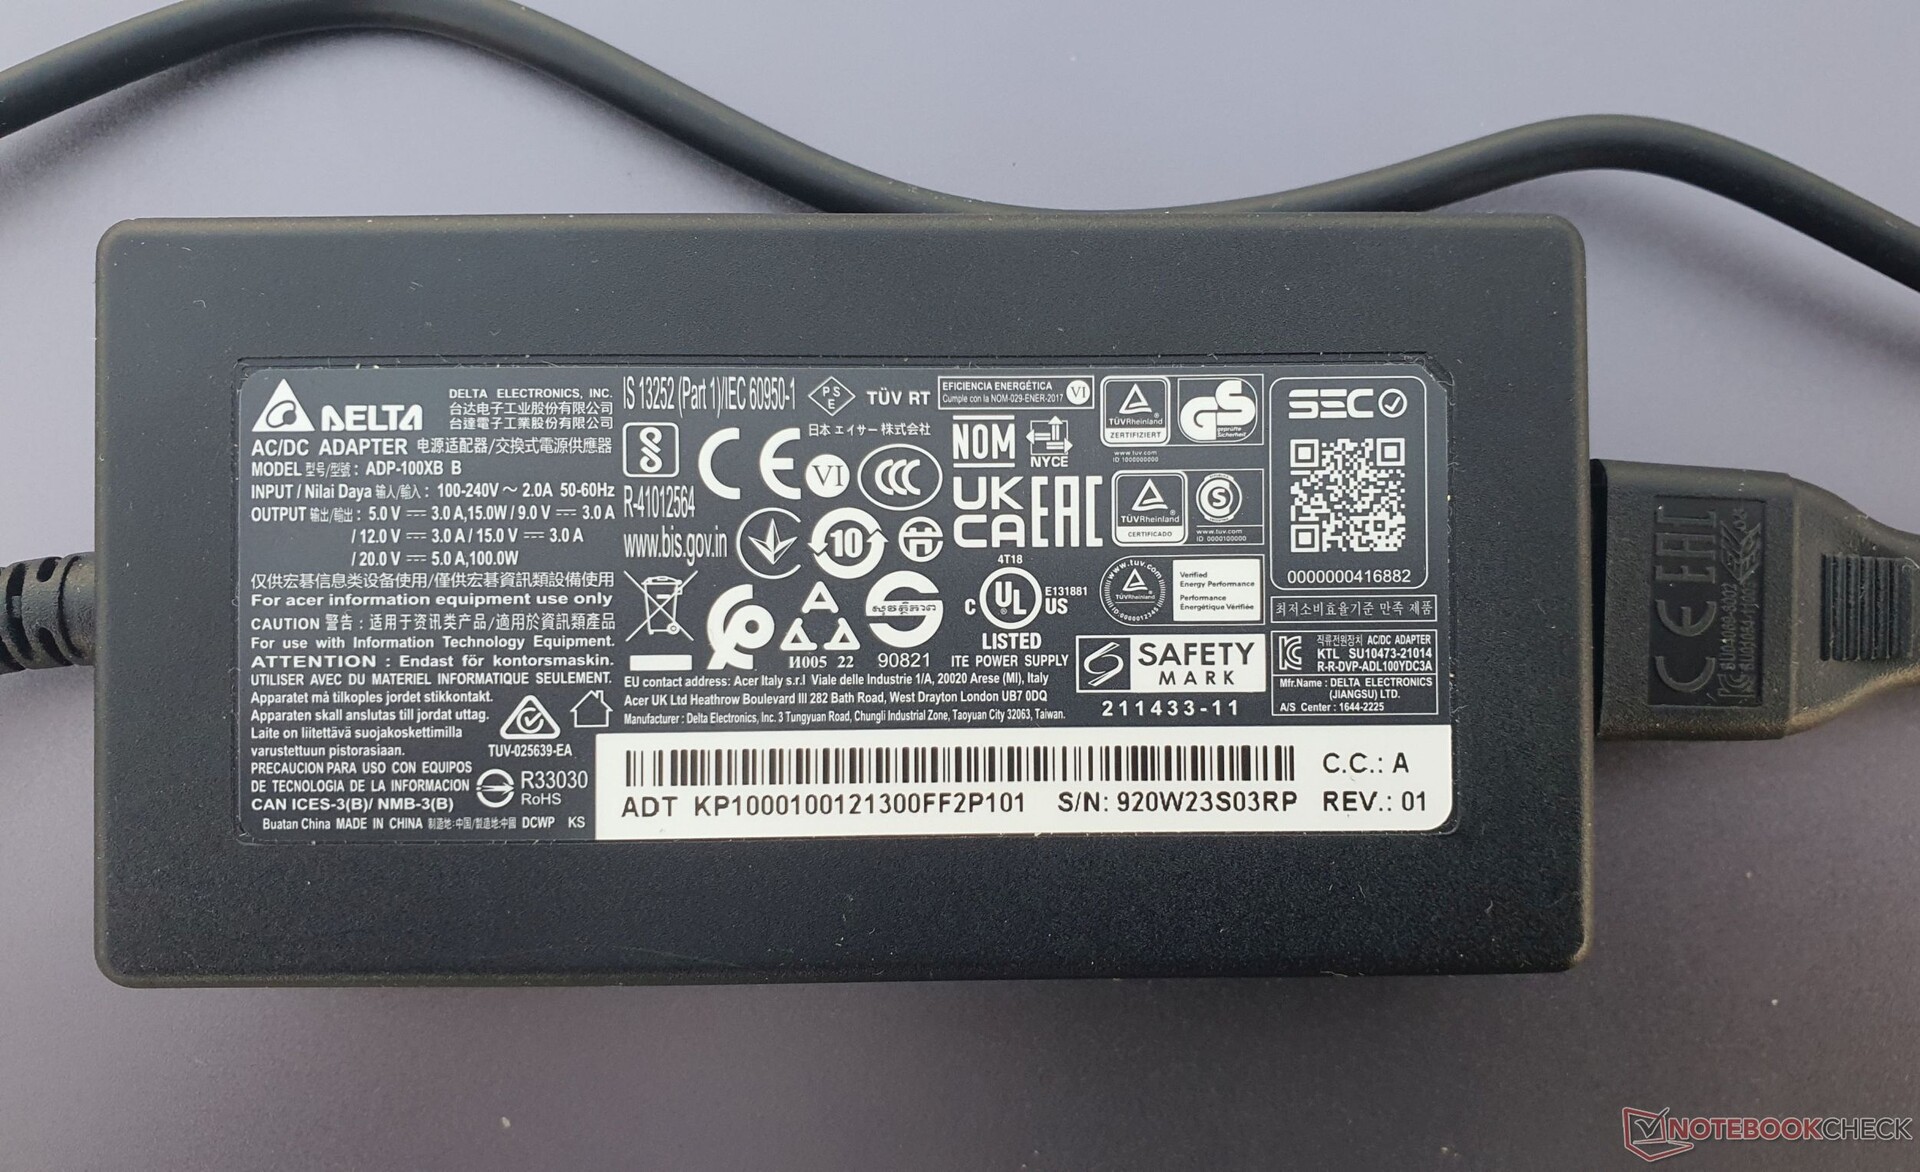
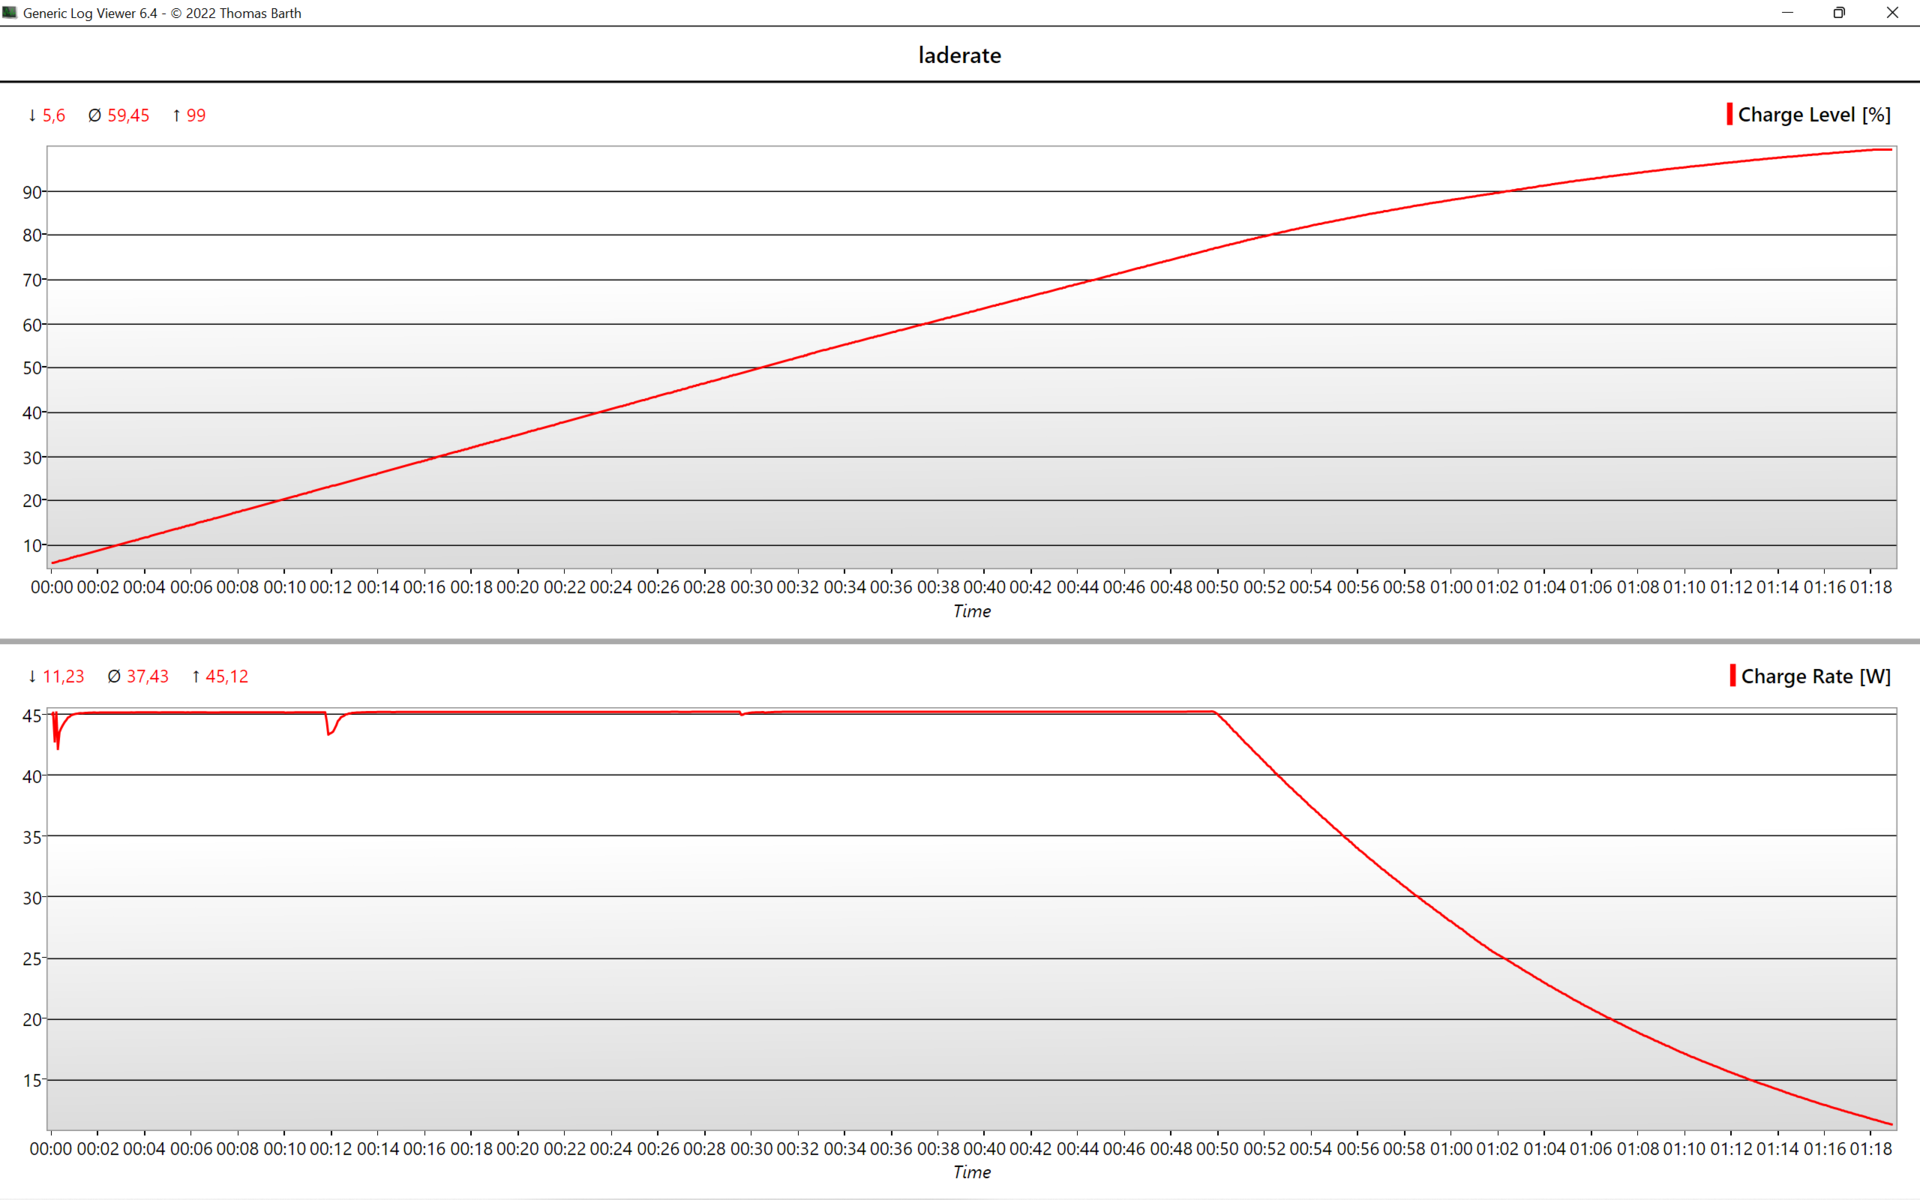
USB-C-laddaren på 100 watt är tillräcklig, eftersom toppbelastningar på strax över 100 watt endast uppstår under det orealistiska scenariot i vårt kombinerade stresstest, vilket egentligen inte skulle inträffa i daglig drift. De skulle möjligen bara kunna inträffa under den första sekunden, till exempel vid full ren CPU-belastning eller under spelande.
| Av/Standby | |
| Låg belastning | |
| Hög belastning |
|
Förklaring:
min: | |
| Acer Swift X SFX16-52G-77RX i7-1260P, A370M, WDC PC SN810 1TB, IPS-LED, 2560x1600, 16" | Acer Swift X SFX16-52G-52VE i5-1240P, A370M, Micron 3400 MTFDKBA512TFH 512GB, , 2560x1600, 16" | Lenovo ThinkBook 16 G4+ IAP i7-12700H, GeForce RTX 2050 Mobile, Micron 2450 1TB MTFDKCD1T0TFK, IPS, 2560x1600, 16" | Dell Inspiron 16 Plus 7620 i7-12700H, GeForce RTX 3050 Ti Laptop GPU, Kioxia BG5 KBG50ZNS512G, IPS, 3072x1920, 16" | HP Envy 16 h0112nr i7-12700H, GeForce RTX 3060 Laptop GPU, Micron 3400 1TB MTFDKBA1T0TFH, OLED, 3840x2400, 16" | Asus Vivobook Pro 16X-M7600QE R9 5900HX, GeForce RTX 3050 Ti Laptop GPU, SK Hynix HFM001TD3JX013N, OLED, 3840x2400, 16.1" | Genomsnitt av klass Multimedia | |
|---|---|---|---|---|---|---|---|
| Power Consumption | -9% | -22% | -54% | -103% | -50% | -18% | |
| Idle Minimum * (Watt) | 3.7 | 5.7 -54% | 5 -35% | 6.8 -84% | 10 -170% | 8.2 -122% | 5.64 ? -52% |
| Idle Average * (Watt) | 7.6 | 8 -5% | 11.2 -47% | 9.6 -26% | 10.9 -43% | 16.2 -113% | 10 ? -32% |
| Idle Maximum * (Watt) | 11.1 | 10.4 6% | 11.6 -5% | 17 -53% | 27.8 -150% | 19.7 -77% | 12.2 ? -10% |
| Load Average * (Watt) | 70 | 74 -6% | 89.3 -28% | 117.5 -68% | 116.4 -66% | 65.8 6% | 64.8 ? 7% |
| Witcher 3 ultra * (Watt) | 68.8 | 65 6% | 83 -21% | 113.1 -64% | 133.7 -94% | 65.6 5% | |
| Load Maximum * (Watt) | 108 | 108.5 -0% | 102 6% | 137.4 -27% | 209.8 -94% | 104 4% | 111.7 ? -3% |
* ... mindre är bättre
Power Consumption The Witcher 3 / Stress Test
Power Consumption With External Monitor
Batteritid
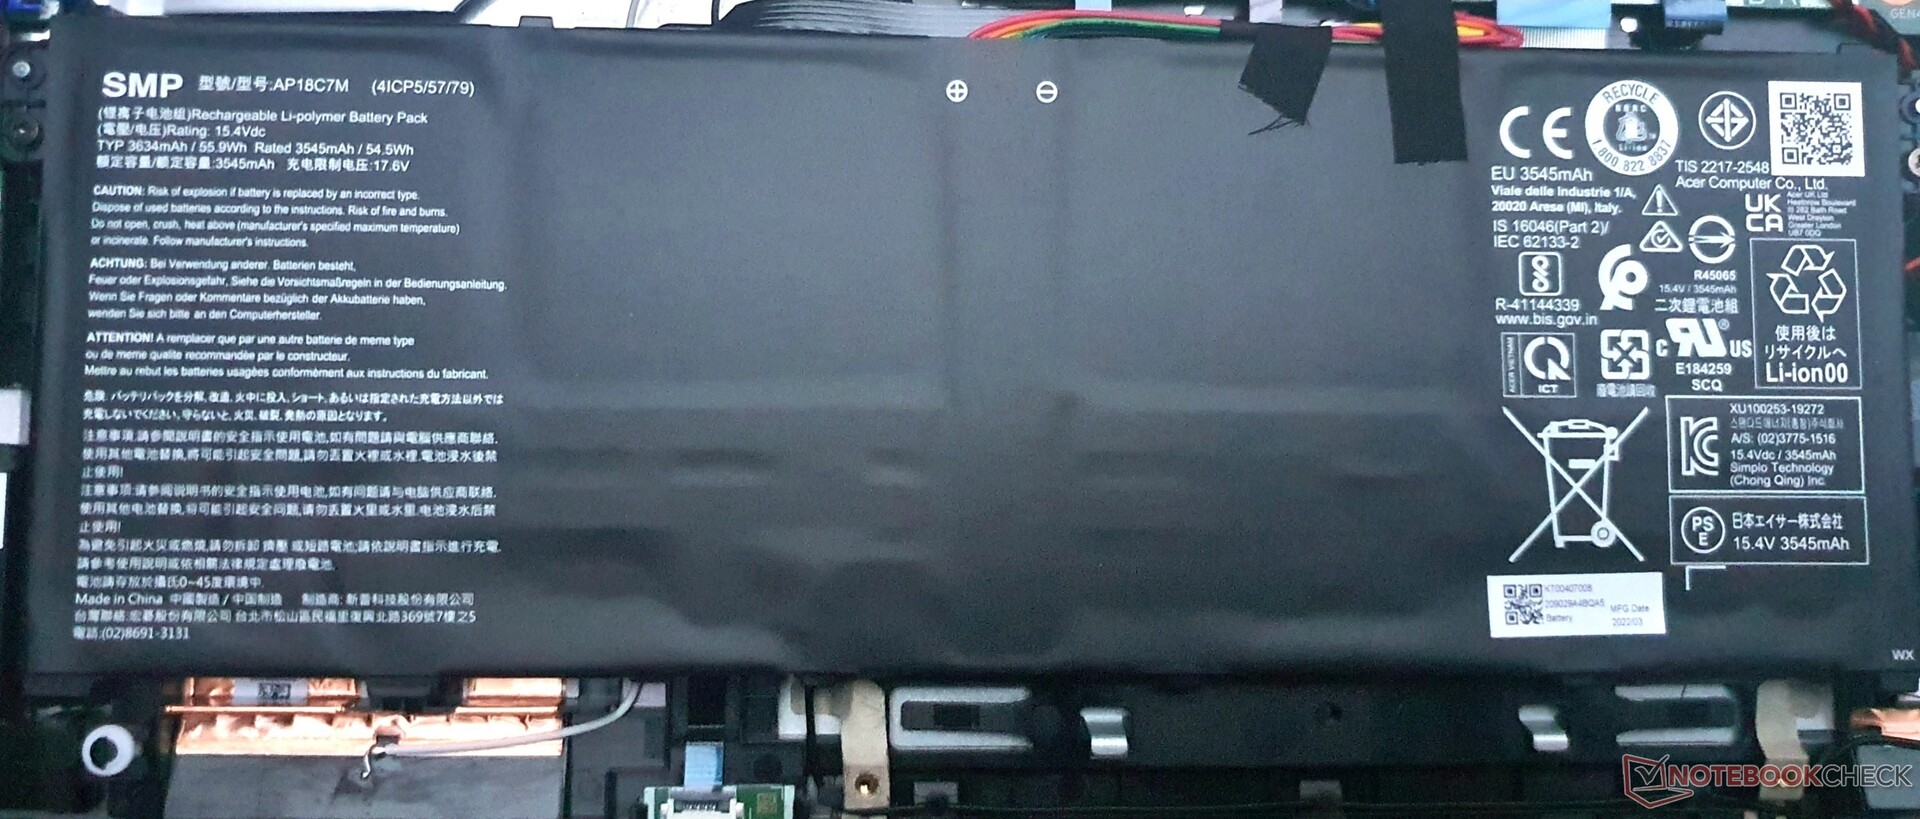
I vårt WLAN-test med ljusstyrkan inställd på 150 nits och i Acers normalläge håller Swift X 16 i 9 timmar. Det är en timme längre än föregångaren och 40 minuter mindre än syskonmodellen, som dock testades i energisparläge
Överlag ligger värdena inom genomsnittet för den här klassen. Asus Vivobook Pro 16Xhåller i mer än 11 timmar, medan Dells Inspiron 16 Plusoch Lenovo IdeaPad 5 Pro 16uppnår liknande värden som Swift X.
| Acer Swift X SFX16-52G-77RX i7-1260P, A370M, 56 Wh | Acer Swift X SFX16-52G-52VE i5-1240P, A370M, 56 Wh | Acer Swift X SFX16-51G-5388 i5-11320H, GeForce RTX 3050 4GB Laptop GPU, 58.7 Wh | Lenovo ThinkBook 16 G4+ IAP i7-12700H, GeForce RTX 2050 Mobile, 71 Wh | Dell Inspiron 16 Plus 7620 i7-12700H, GeForce RTX 3050 Ti Laptop GPU, 86 Wh | HP Envy 16 h0112nr i7-12700H, GeForce RTX 3060 Laptop GPU, 83 Wh | Lenovo IdeaPad 5 Pro 16ARH7 R5 6600HS, Radeon 660M, 75 Wh | Asus Vivobook Pro 16X-M7600QE R9 5900HX, GeForce RTX 3050 Ti Laptop GPU, 96 Wh | Genomsnitt av klass Multimedia | |
|---|---|---|---|---|---|---|---|---|---|
| Batteridrifttid | -6% | 2% | 16% | 7% | 16% | 8% | 12% | 47% | |
| H.264 (h) | 10.4 | 9.8 -6% | 8.4 -19% | 12.6 21% | 16.4 ? 58% | ||||
| WiFi v1.3 (h) | 9.1 | 9.7 7% | 8.1 -11% | 8.2 -10% | 9.6 5% | 7.9 -13% | 9.8 8% | 11.3 24% | 12 ? 32% |
| Load (h) | 1.1 | 0.9 -18% | 1.5 36% | 1.5 36% | 1.2 9% | 1.6 45% | 1.1 0% | 1.675 ? 52% |
För
Emot
Domslut: Trots rejäla uppgraderingar levererar Acer Swift X 16 fortfarande inte
Acer Swift X 16 (2022) är en kompakt bärbar dator på 16 tum som bara väger 1,75 kg. Många problemområden från föregångaren har lyckligtvis åtgärdats. Skärmen är nu betydligt ljusare med 380 nits, erbjuder en hög upplösning på 2 560 x 1 600 pixlar och vi gillar även 16:10-formatet.
Tyvärr är Intels Arc GPU inte avsedd för 3D-arbete och haltar också bakom GeForce.RTX 3050 Tii DellInspiron 16 Plusoch AsusVivoBook Pro 16Xnär du spelar. Å andra sidan erbjuder systemet en hög prestanda tack vare Intels Alder Lake P CPU. Dessutom är den inbyggda PCIe 4.0 SSD:n en av de snabbaste, även om den lider av kraftig termisk strypning. Men du kan åtminstone installera en andra fullstor M.2 SSD i full storlek.
Andra positiva punkter är uppdateringen till HDMI 2.1 och webbkameran i 1080p, medan höljet fortsätter att vara tillverkat av robust metall och tangentbordet även lämpar sig för frekventa maskinskrivare. Den hala pekplattan är dock betydligt sämre.
Trots några betydande förbättringar av skärmen och systemprestandan, med tanke på den minskade grafikprestandan på grund av Intel Arc och de höga utsläppen, är priset på 1500 euro (~1482 dollar) helt enkelt för högt
Fläktbeteendet och kylningsprestandan är inte särskilt imponerande, högtalarna fortsätter att vara dåliga och en AMD-version med en effektiv iGPU finns inte tillgänglig. Så på det hela taget kan vi inte se någon motivering för det höga priset på 1500 euro (~1482 dollar). Men åtminstone vid ungefär samma prestanda kostar Core i5-versionen med 512 GB SSD 200 euro (~198 dollar) mindre.
Å andra sidan levererar konkurrenterna till ännu lägre kostnader mer i många avseenden, till exempel Lenovos ThinkBook 16 G4+ för 1 200 euro (~1186 dollar) eller den IdeaPad 5 Pro 16 för 1 000 euro (988 dollar) HP:s Envy 16erbjuder en blandning av multimedia, affärsverksamhet och spel och ger betydligt mer prestanda för 1700 euro (1680 kr)
Pris och tillgänglighet
En amerikansk modell av Acer Swift X, SFX16-52G-73U6 med 512 GB SSD, 16 GB RAM, en skärm med 1920 x 1200 pixlar och en Intel Core i7-1260P, kan beställas för $1250 direkt från Acers webbutik, och Amazon listar för närvarande denna modell för 1049 dollar.
Acer Swift X SFX16-52G-77RX
- 10/25/2022 v7 (old)
Marvin Gollor
Price comparison

