Recension av 2022 års Dell XPS 15 9520 med 3.5K OLED - Skippa eller köpa?
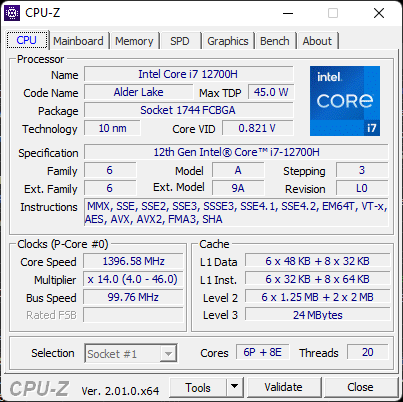
Dell inledde årtiondet med en bra start genom att lansera den helt uppdaterade XPS 15 9500 som efterträdare till den äldre generationen av XPS 15 9500 XPS 15 7590-serien. Modellen flyttade XPS 15-familjen från 16:9 till 16:10 tillsammans med en helt ny chassidesign med Intel 10:e generationens Comet Lake-H CPU:er och GeForce GTX 1650 Ti GPU. XPS 15 9510 tog ett steg längre med 11:e generationens Tiger Lake-H CPU:er och valfria 3,5K OLED-paneler. Nu är XPS 15 9520 ännu en stegvis uppdatering med 12:e generationens Alder Lake-H CPU:er och snabbare DDR5 RAM.
Vi rekommenderar att du kollar in vår befintliga recension av XPS 15 9500 eftersom chassit till XPS 15 9520 är identiskt. Den här recensionssidan kommer att fokusera på prestandan hos XPS 15 9520 och andra skillnader som användare kan förvänta sig jämfört med tidigare modeller.
Alternativ till Dell XPS 15 9520 är andra bärbara 15,6-tums multimediebärbara datorer med diskret grafik som t.ex Asus Zenbook Pro 15 OLED, Lenovo Yoga Creator 7 15, HP Spectre x360 15, HP Envy 15, eller MSI Creator 15.
Fler recensioner om Dell:
Jämförelse av potentiella konkurrenter
Gradering | Datum | Modell | Vikt | Höjd | Storlek | Upplösning | Pris |
|---|---|---|---|---|---|---|---|
| 89.5 % v7 (old) | 05/2022 | Dell XPS 15 9520 RTX 3050 Ti i7-12700H, GeForce RTX 3050 Ti Laptop GPU | 1.9 kg | 18 mm | 15.60" | 3456x2160 | |
| 88.4 % v7 (old) | 09/2021 | Dell XPS 15 9510 11800H RTX 3050 Ti OLED i7-11800H, GeForce RTX 3050 Ti Laptop GPU | 1.9 kg | 18 mm | 15.60" | 3456x2160 | |
| 85 % v7 (old) | 01/2020 | HP Spectre X360 15-5ZV31AV i7-10510U, GeForce MX250 | 2.1 kg | 19.3 mm | 15.60" | 3840x2160 | |
| 87.7 % v7 (old) | 05/2022 | Asus Zenbook Pro 15 OLED UM535Q R9 5900HX, GeForce RTX 3050 Ti Laptop GPU | 1.9 kg | 18 mm | 15.60" | 1920x1080 | |
| 82.4 % v7 (old) | MSI Stealth 15M A11SEK i7-1185G7, GeForce RTX 2060 Max-Q | 1.7 kg | 16.15 mm | 15.60" | 1920x1080 | ||
| 93.2 % v7 (old) | 11/2021 | Apple MacBook Pro 16 2021 M1 Pro M1 Pro, M1 Pro 16-Core GPU | 2.2 kg | 16.8 mm | 16.20" | 3456x2234 |
Hölje
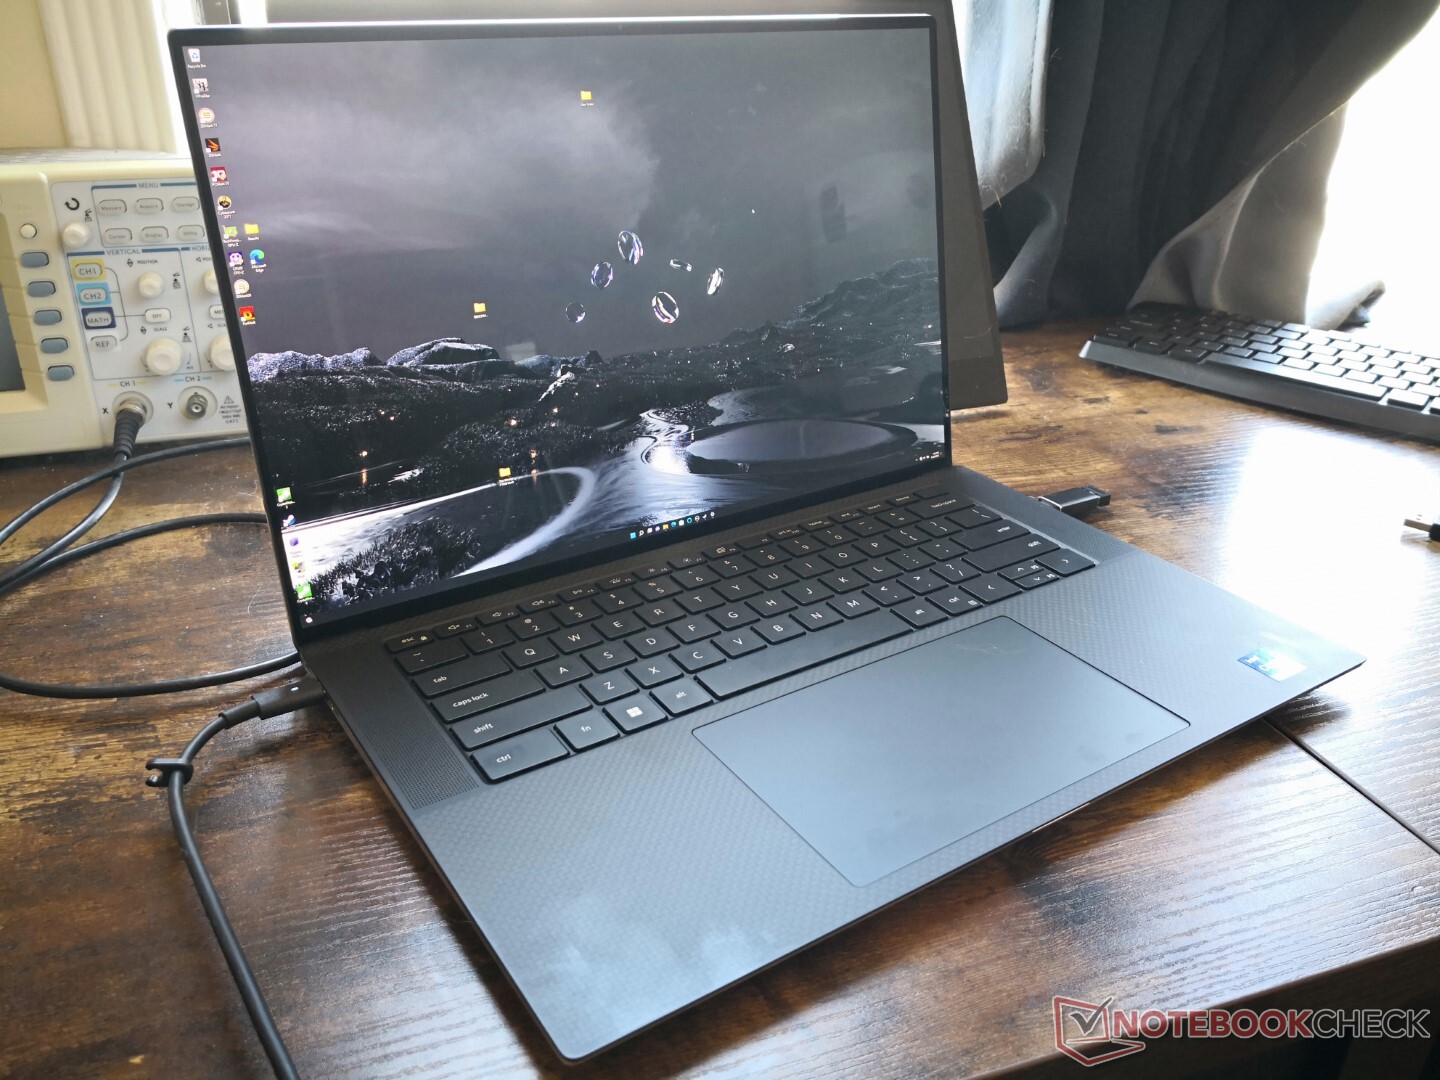
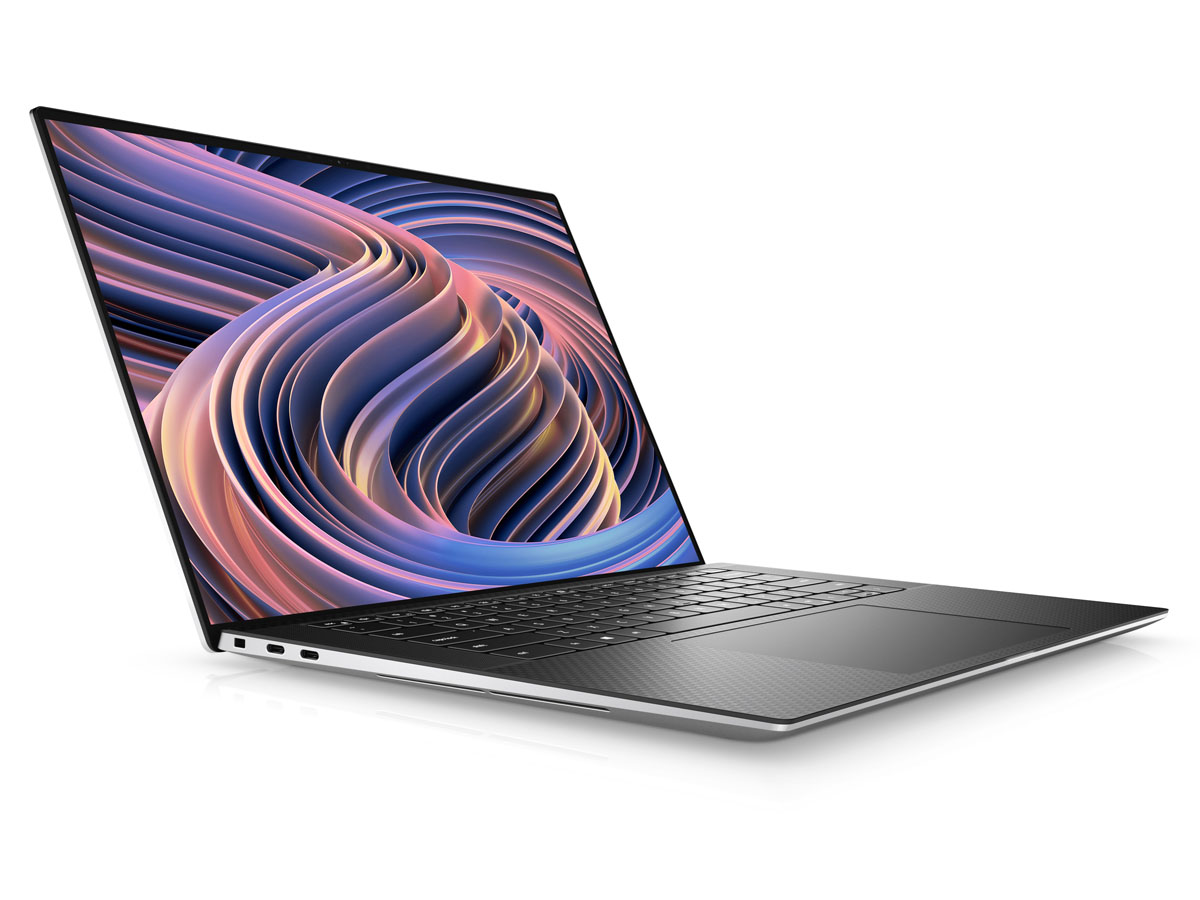
Chassit till XPS 15 9520 är fortfarande en av de minsta modellerna i sin storleksklass trots att den är två år gammal. De mycket smala ramarna på alla fyra sidor inklusive hakan bidrar till att minska fotavtrycket med större marginaler än till exempel Zenbook Pro 15 eller Spectre x360 15.
SD-kortläsare
| SD Card Reader | |
| average JPG Copy Test (av. of 3 runs) | |
| Dell XPS 15 9510 11800H RTX 3050 Ti OLED (AV Pro V60) | |
| Dell XPS 15 9500 Core i7 4K UHD (Toshiba Exceria Pro SDXC 64 GB UHS-II) | |
| MSI Stealth 15M A11SEK (Toshiba Exceria Pro M501 microSDXC 32GB) | |
| Dell XPS 15 9520 RTX 3050 Ti (Toshiba Exceria Pro SDXC 64 GB UHS-II) | |
| HP Spectre X360 15-5ZV31AV (Toshiba Exceria Pro M501 UHS-II) | |
| Asus Zenbook Pro 15 OLED UM535Q (Toshiba Exceria Pro SDXC 64 GB UHS-II) | |
| maximum AS SSD Seq Read Test (1GB) | |
| MSI Stealth 15M A11SEK (Toshiba Exceria Pro M501 microSDXC 32GB) | |
| Dell XPS 15 9510 11800H RTX 3050 Ti OLED (AV Pro V60) | |
| Dell XPS 15 9500 Core i7 4K UHD (Toshiba Exceria Pro SDXC 64 GB UHS-II) | |
| HP Spectre X360 15-5ZV31AV (Toshiba Exceria Pro M501 UHS-II) | |
| Dell XPS 15 9520 RTX 3050 Ti (Toshiba Exceria Pro SDXC 64 GB UHS-II) | |
| Asus Zenbook Pro 15 OLED UM535Q (Toshiba Exceria Pro SDXC 64 GB UHS-II) | |
Kommunikation
En Intel AX211 är standard för Wi-Fi 6E och Bluetooth 5.2. Dell har dock bekräftat för oss att XPS 15 9520 inte var konstruerad för att stödja 6 GHz Wi-Fi 6E-nätverk trots att AX211-chippet kan göra det. Ägare av XPS 15 9520 kommer alltså bara att kunna ansluta till 2,4 GHz- och 5 GHz-nätverk upp till Wi-Fi 6.
| Networking | |
| iperf3 transmit AX12 | |
| Dell XPS 15 9510 11800H RTX 3050 Ti OLED | |
| Dell XPS 15 9500 Core i7 4K UHD | |
| MSI Stealth 15M A11SEK | |
| Asus Zenbook Pro 15 OLED UM535Q | |
| iperf3 receive AX12 | |
| Dell XPS 15 9500 Core i7 4K UHD | |
| Dell XPS 15 9510 11800H RTX 3050 Ti OLED | |
| MSI Stealth 15M A11SEK | |
| Asus Zenbook Pro 15 OLED UM535Q | |
| iperf3 receive AXE11000 | |
| Dell XPS 15 9520 RTX 3050 Ti | |
| iperf3 transmit AXE11000 | |
| Dell XPS 15 9520 RTX 3050 Ti | |
Webbkamera
Dell har förbättrat färgerna i webbkameran genom att separera IR- och RGB-sensorerna jämfört med XPS 15 9510 eller 9500. Det är dock fortfarande bara 1 MP, jämfört med 2 MP på andra bärbara 15,6-tums flaggskepp som 15,6-tums bärbara datorer som t.ex Razer Blade 15. Även om färgerna kan vara lite bättre är bilden alltså fortfarande lerig.


Underhåll
Tillbehör och garanti
I förpackningen ingår USB-C AC-adapter, pappersarbete och en USB-C- till HDMI- och USB-A-adapter i fullstorlek. Den sistnämnda är särskilt användbar eftersom systemet endast integrerar USB-C-portar.
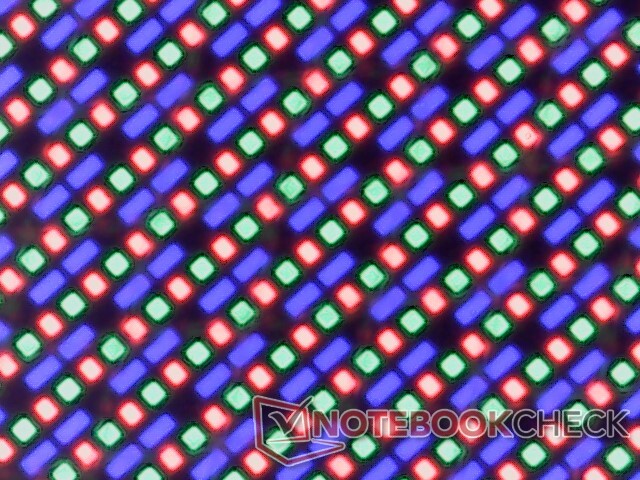
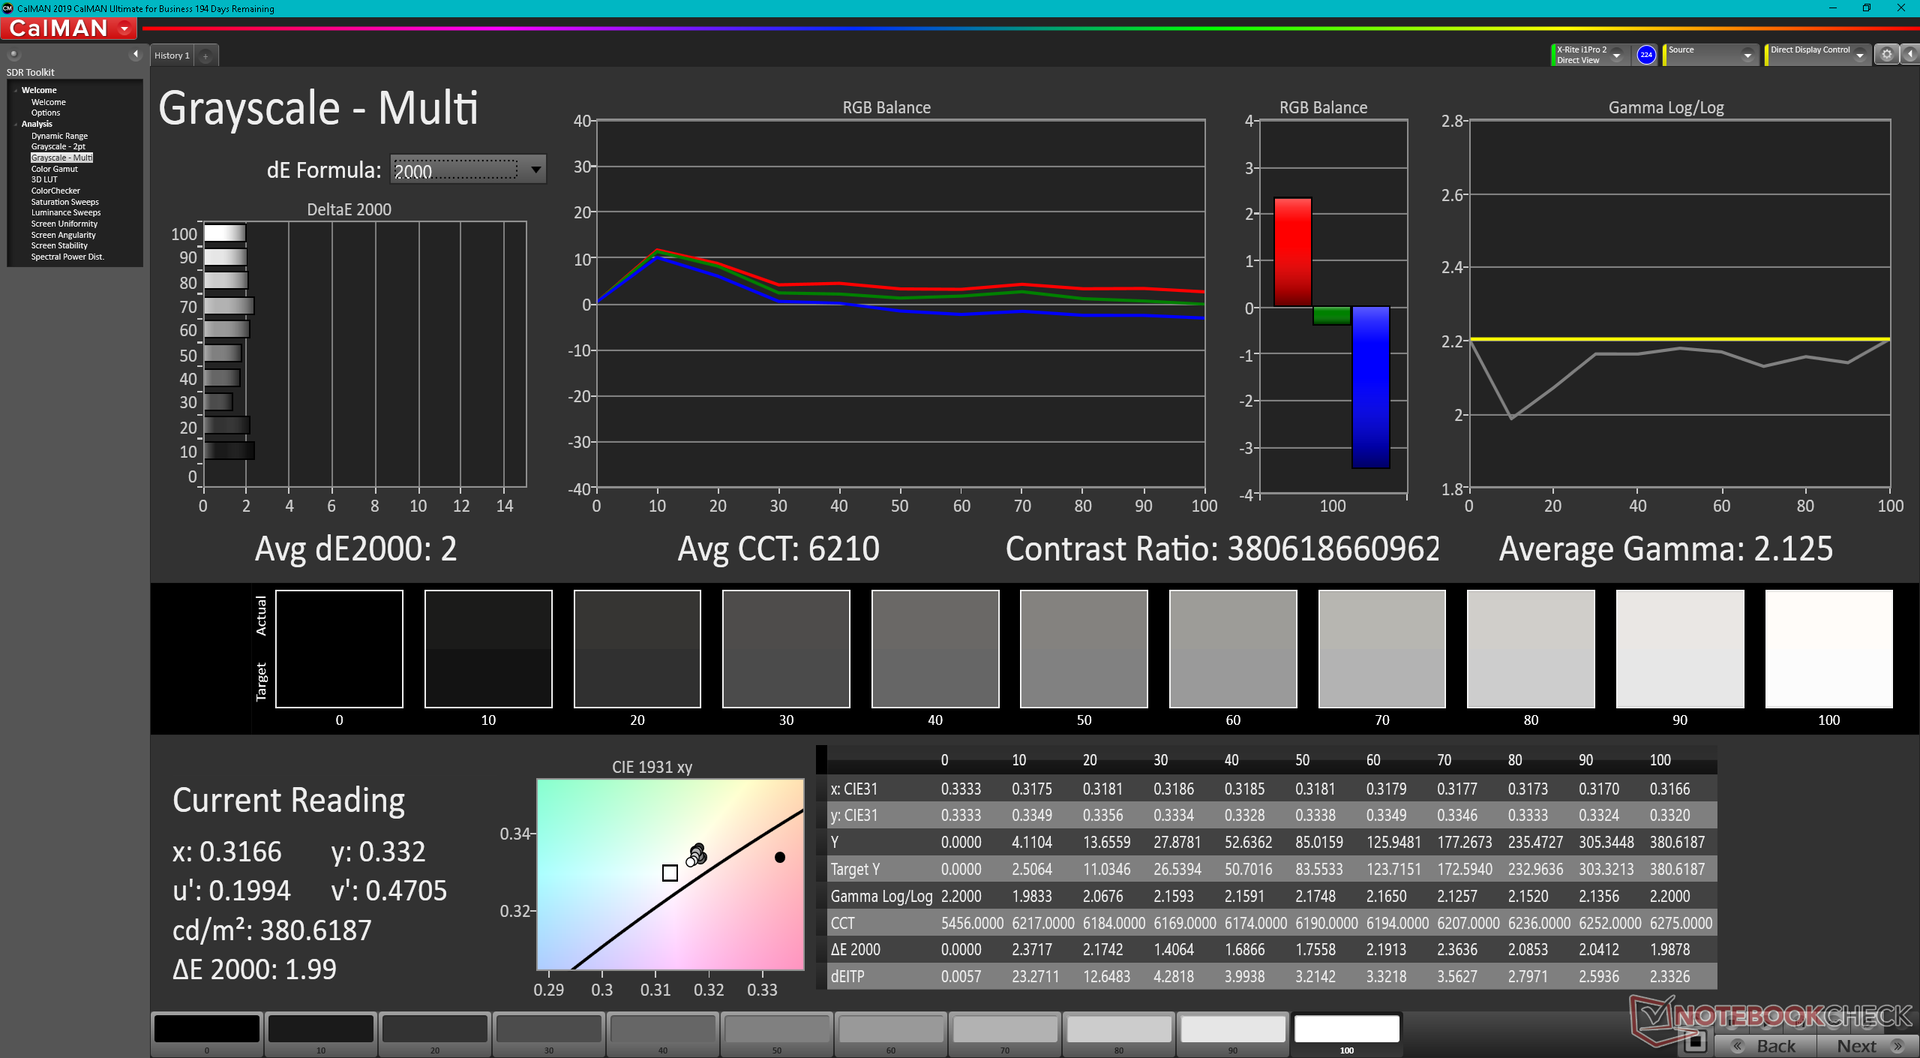
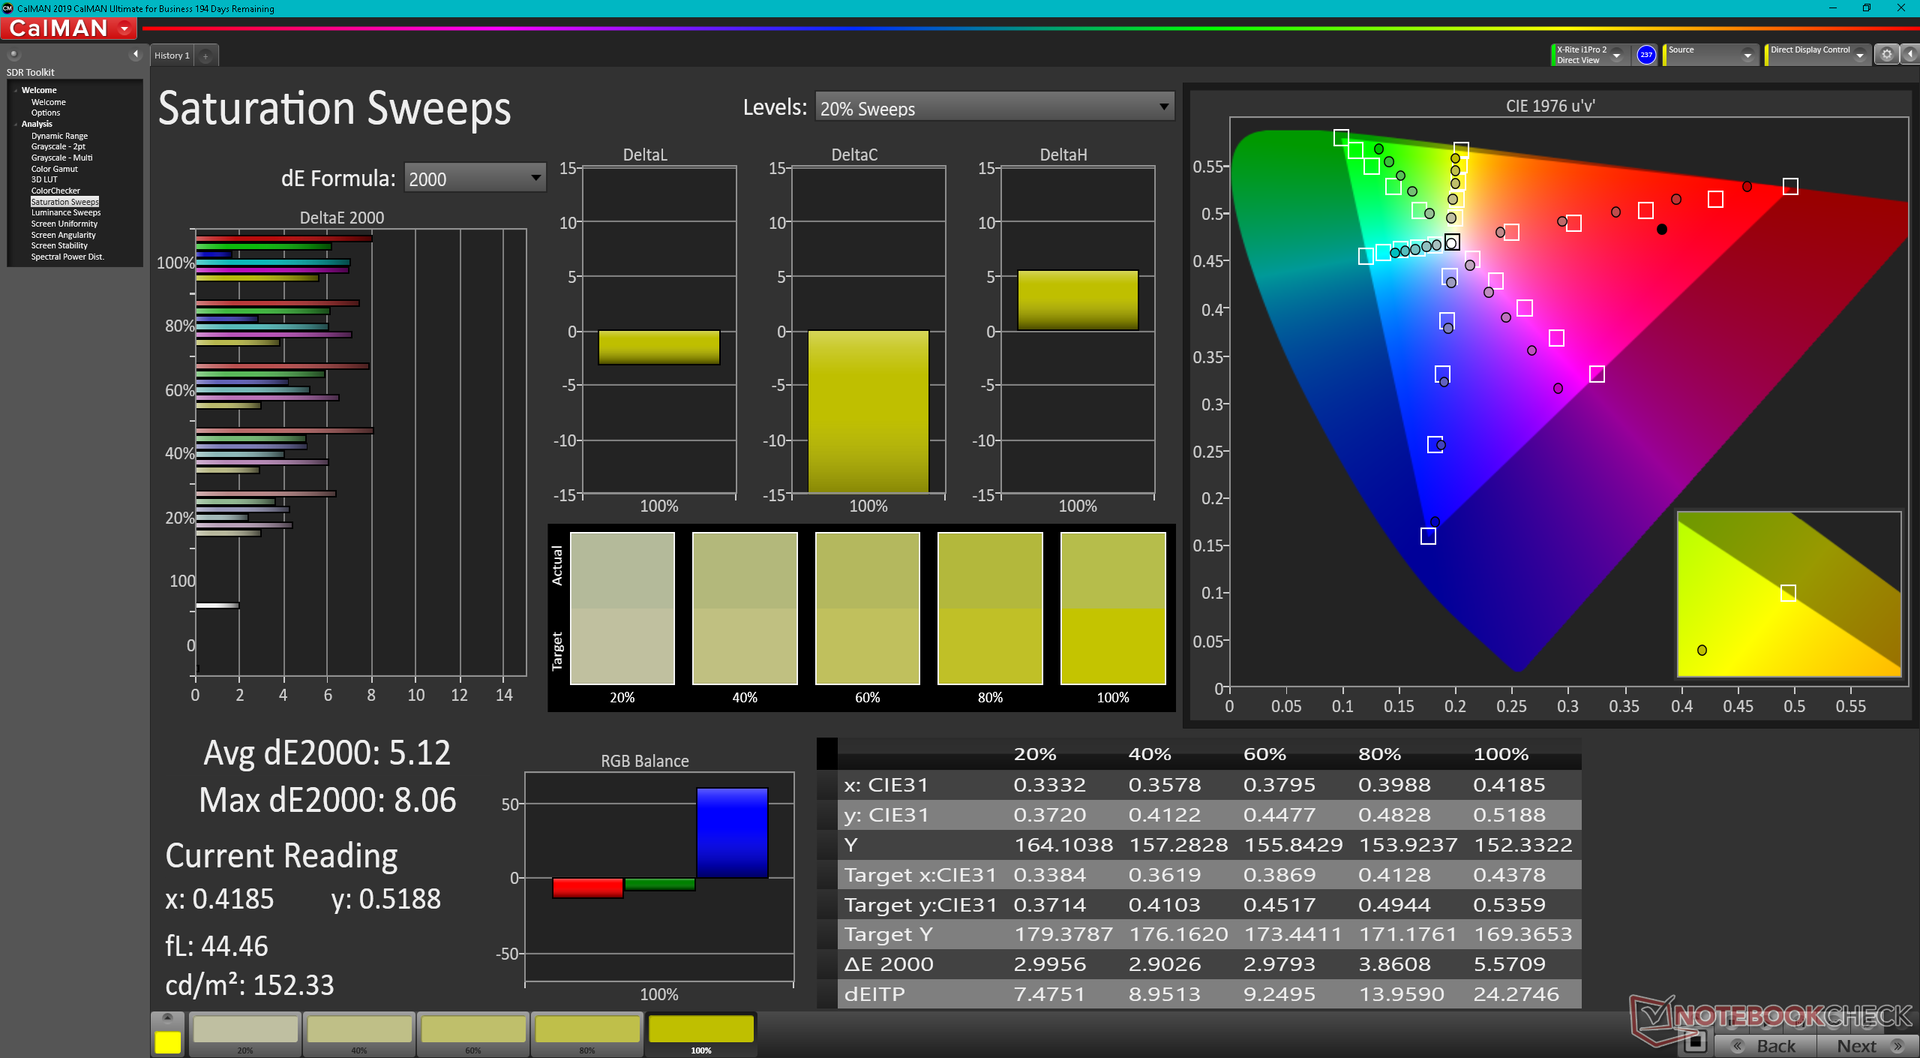
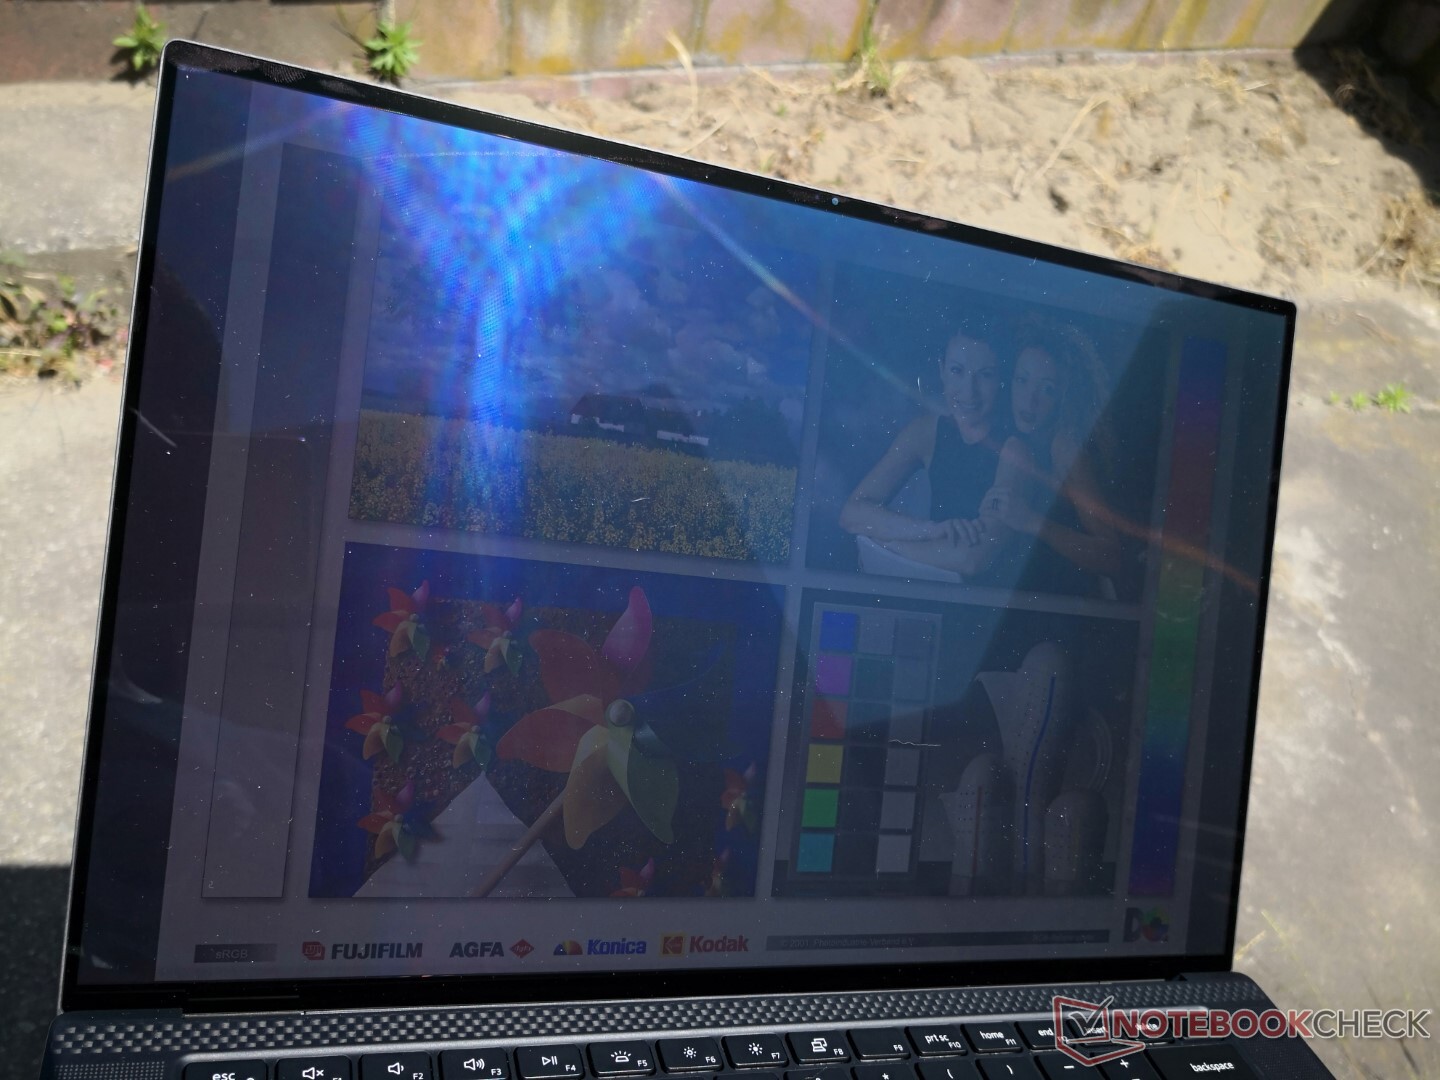
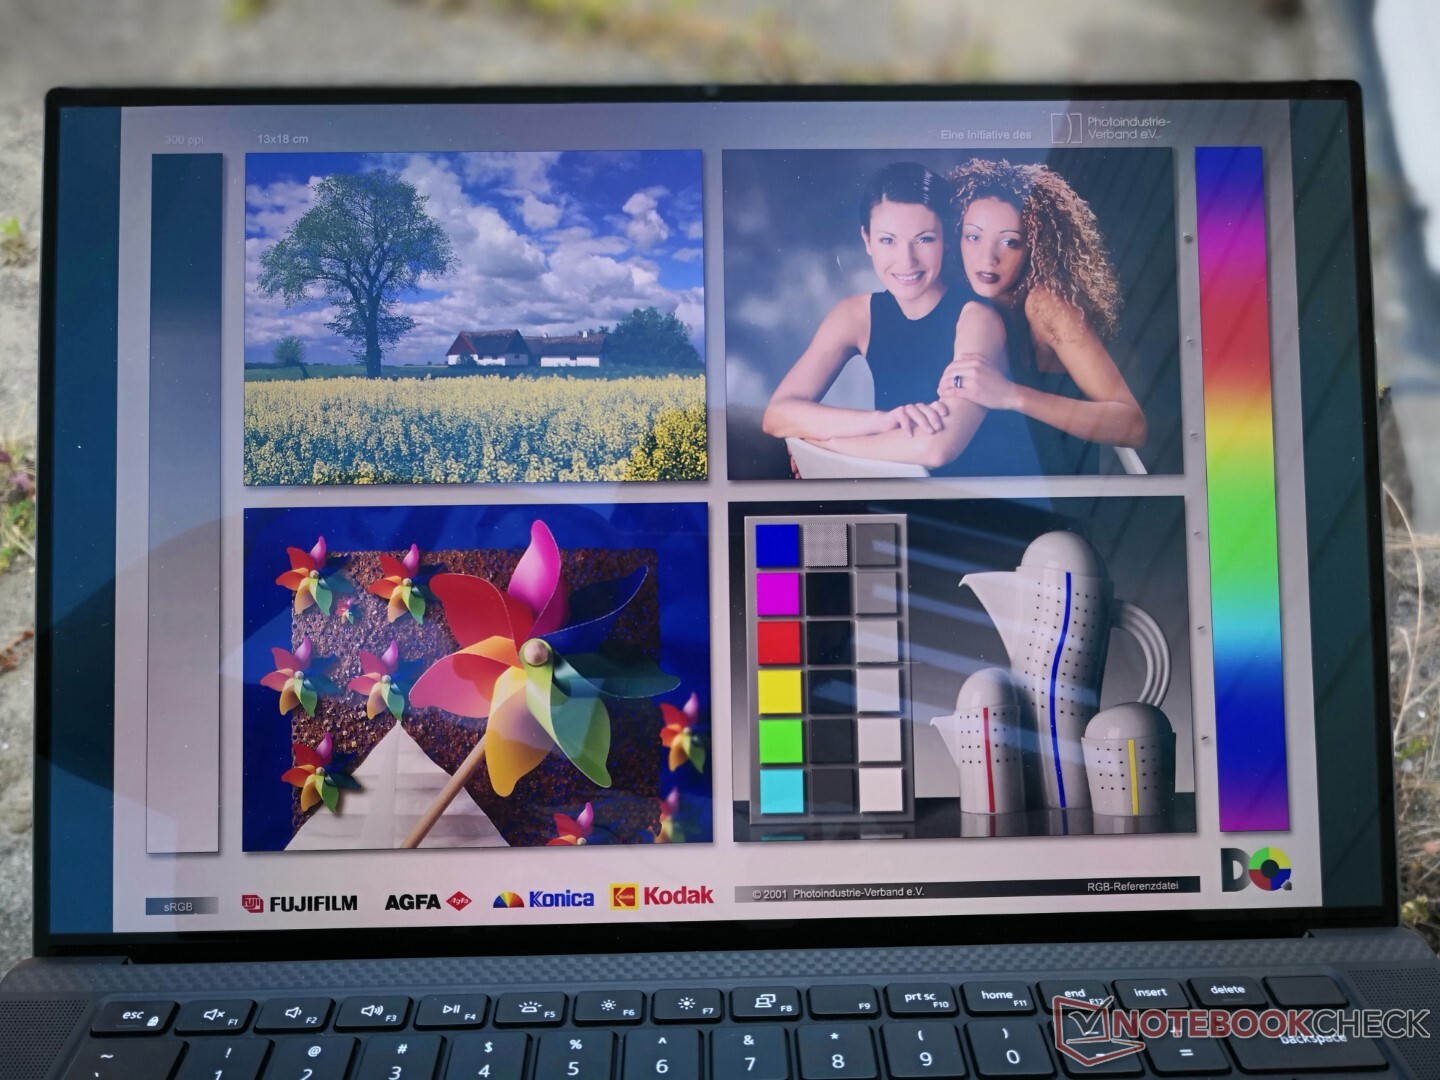
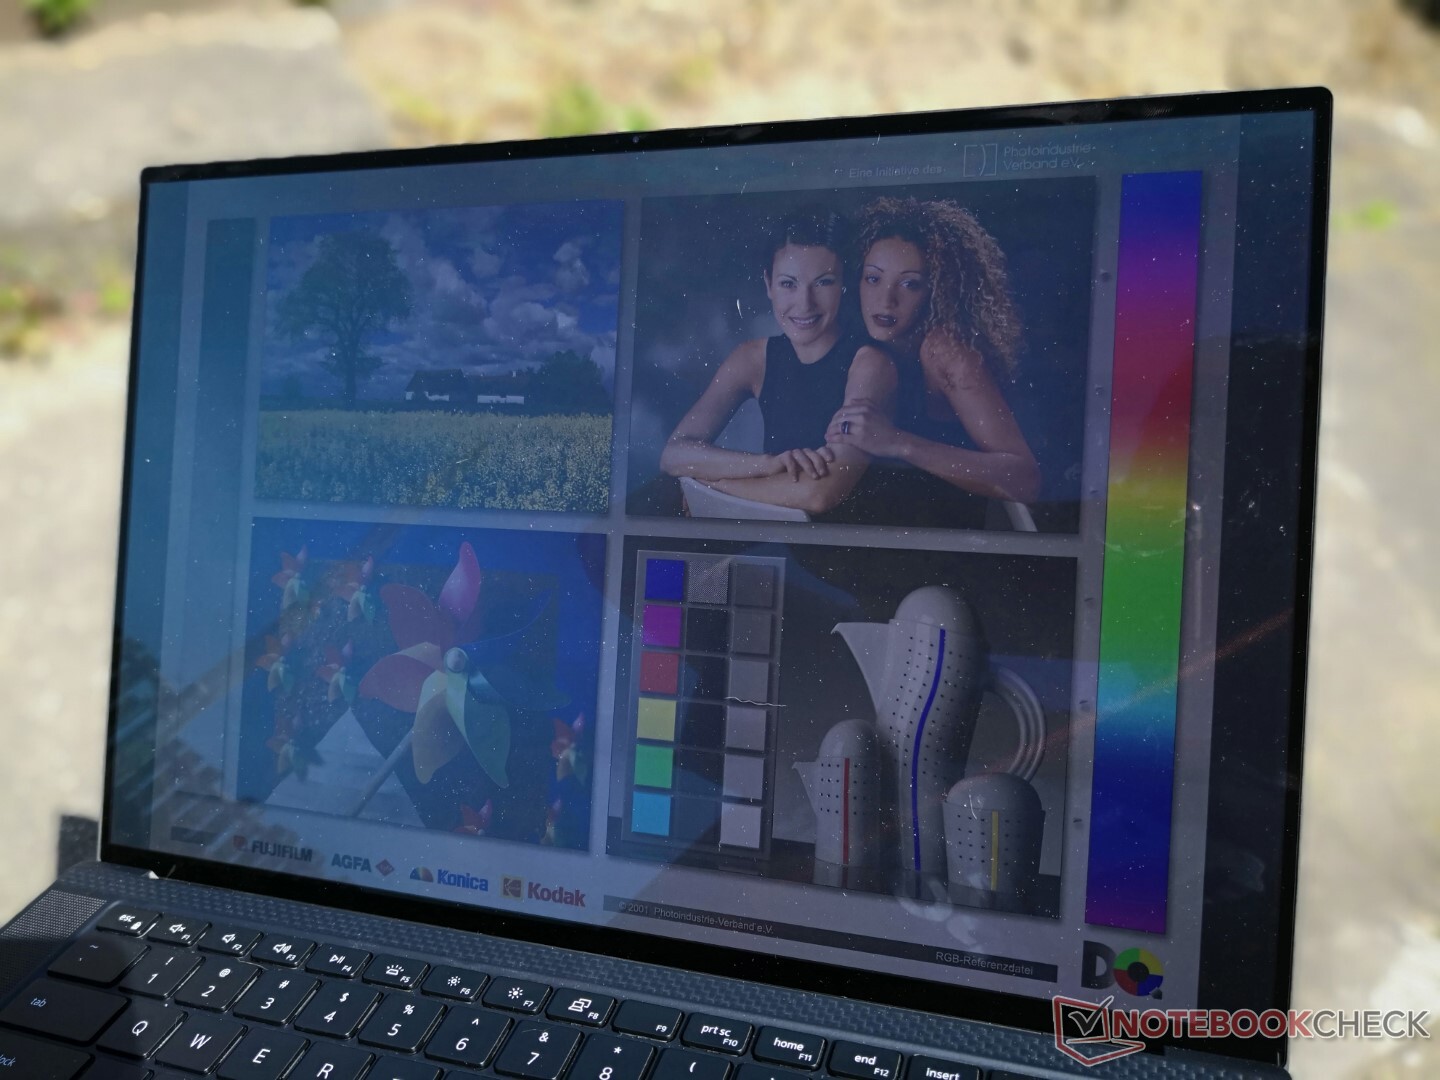
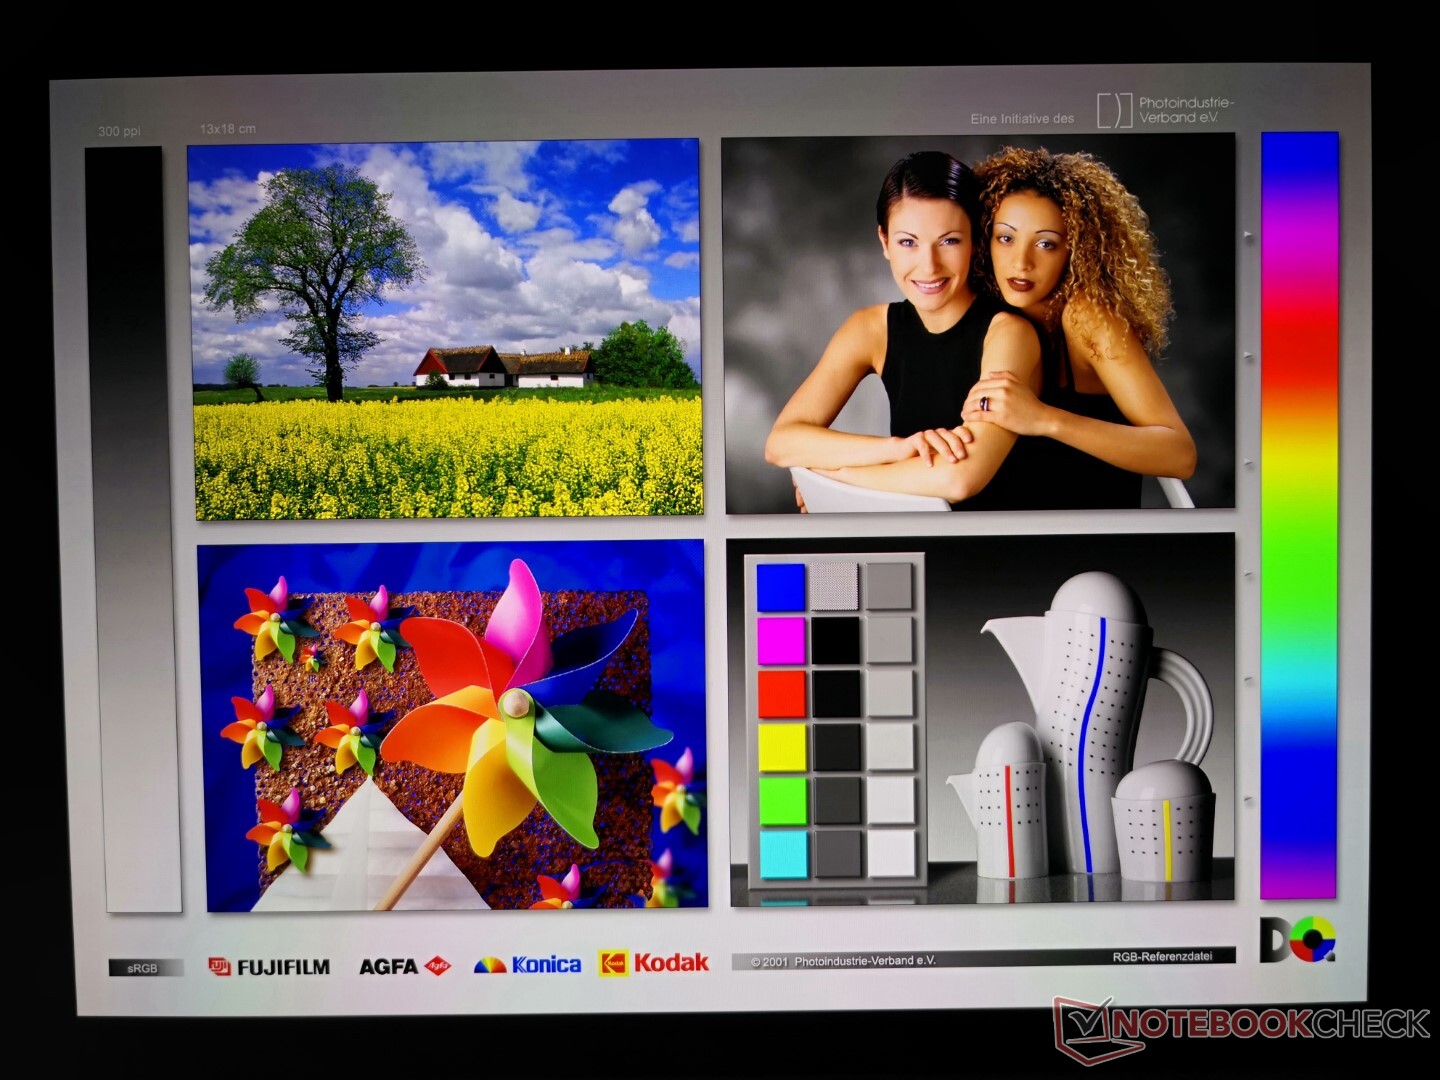
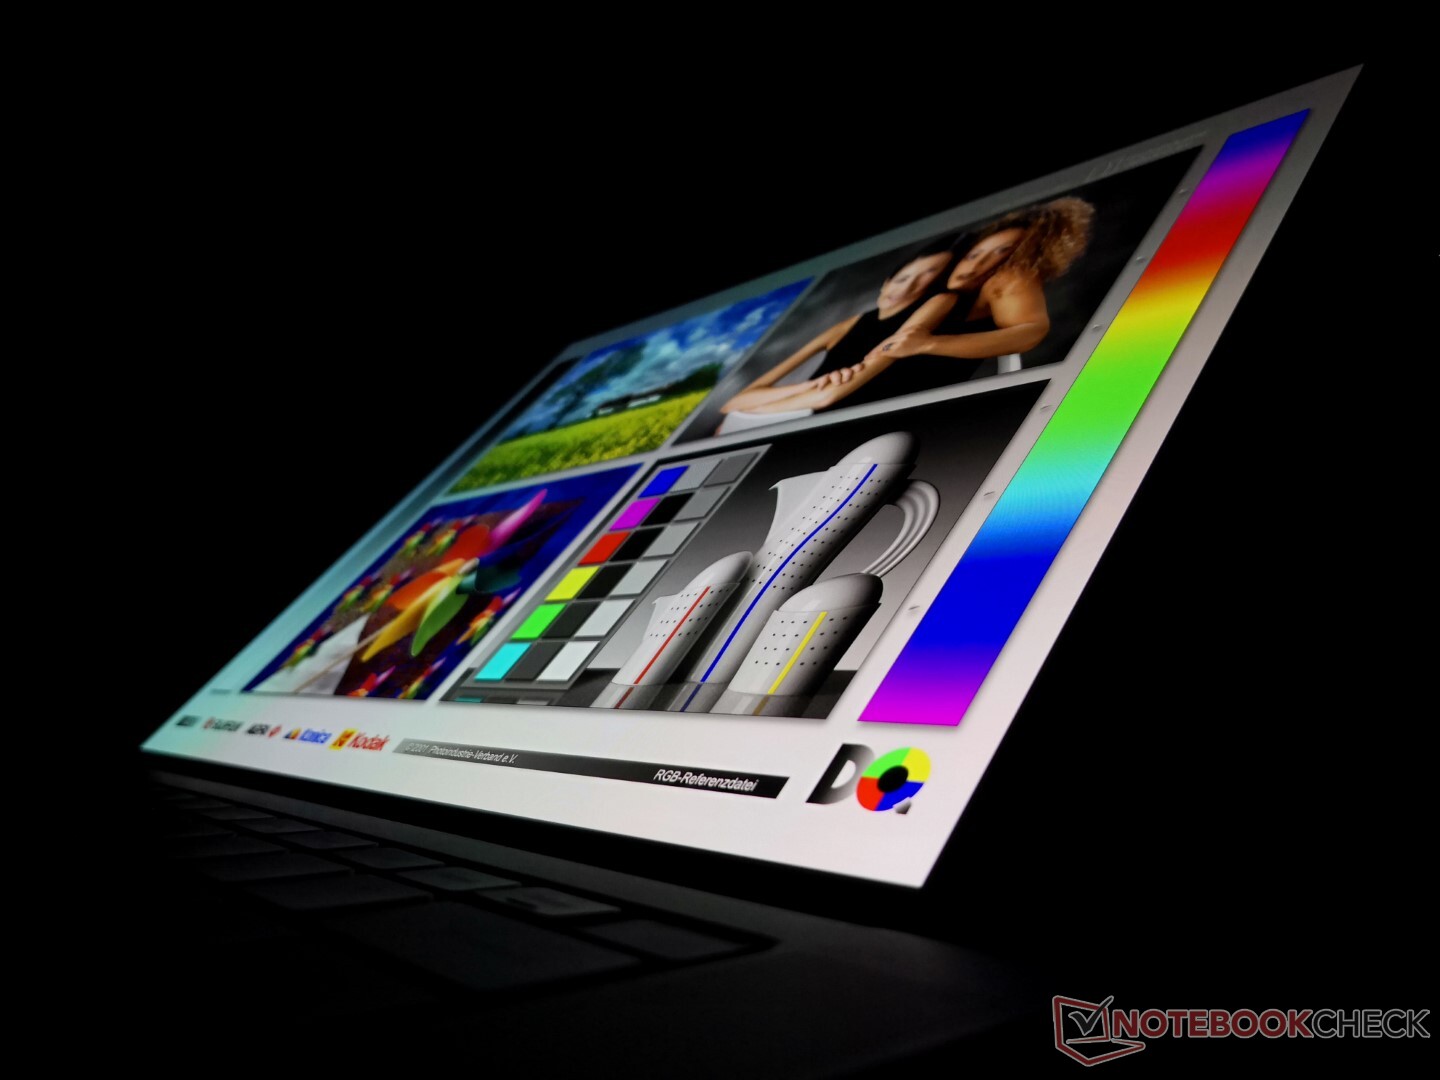
Skärm - Ovanlig 3.5K OLED
Vår recensionsenhet har samma 3,5K OLED-pekskärm som fanns på förra årets XPS 15 9510, vilket innebär att den visuella upplevelsen inte har förändrats från år till år. Ett IPS-alternativ med lägre upplösning 1920 x 1200 och ett IPS-alternativ med högre upplösning 3840 x 2400 finns också tillgängliga, men alla paneler är tyvärr begränsade till en uppdateringsfrekvens på 60 Hz. Vissa ultrabooks som Lenovo IdeaPad Slim 7i Pro eller Asus Vivobook Pro 14 levereras redan med snabbare 90 Hz-paneler för en märkbart smidigare UI-upplevelse.
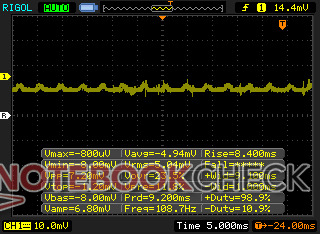
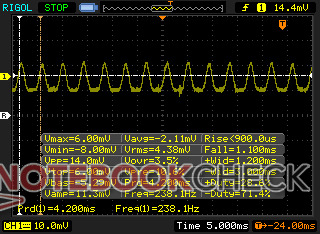
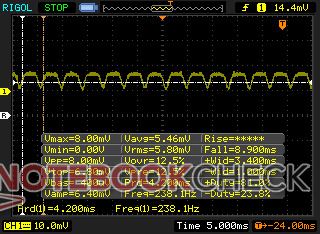
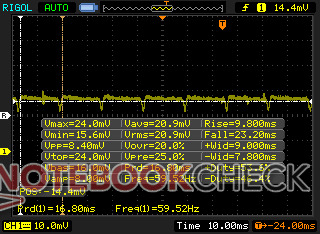
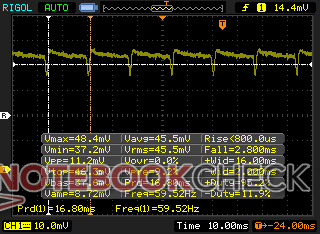
Tänk på att pulsbreddsmodulering finns på all ljusstyrka vid 238 Hz från 0 procent till 25 procent ljusstyrka och 59 Hz från 26 procent till 100 procent ljusstyrka. Om skärmflimmer är ett problem rekommenderar vi att du konfigurerar med IPS istället.
| |||||||||||||||||||||||||
Distribution av ljusstyrkan: 95 %
Mitt på batteriet: 381.4 cd/m²
Kontrast: ∞:1 (Svärta: 0 cd/m²)
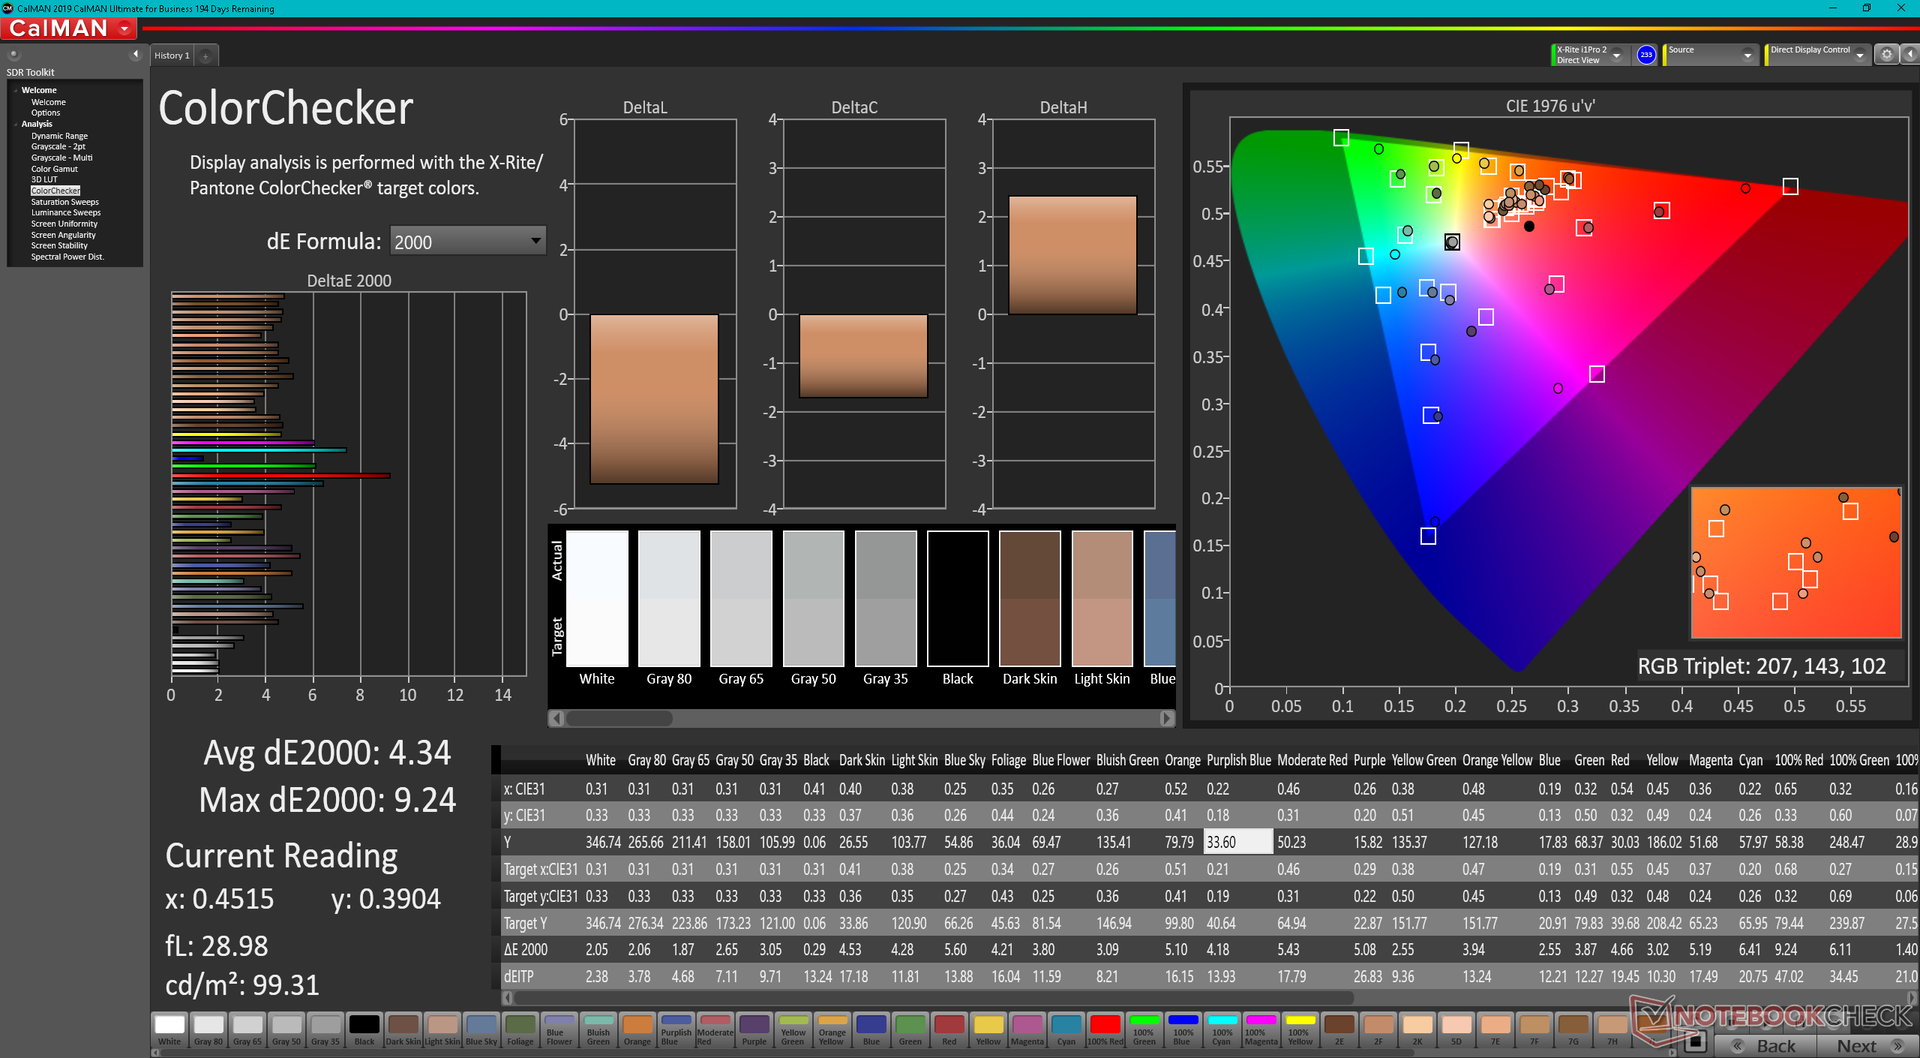
ΔE ColorChecker Calman: 4.34 | ∀{0.5-29.43 Ø4.71}
ΔE Greyscale Calman: 2 | ∀{0.09-98 Ø4.96}
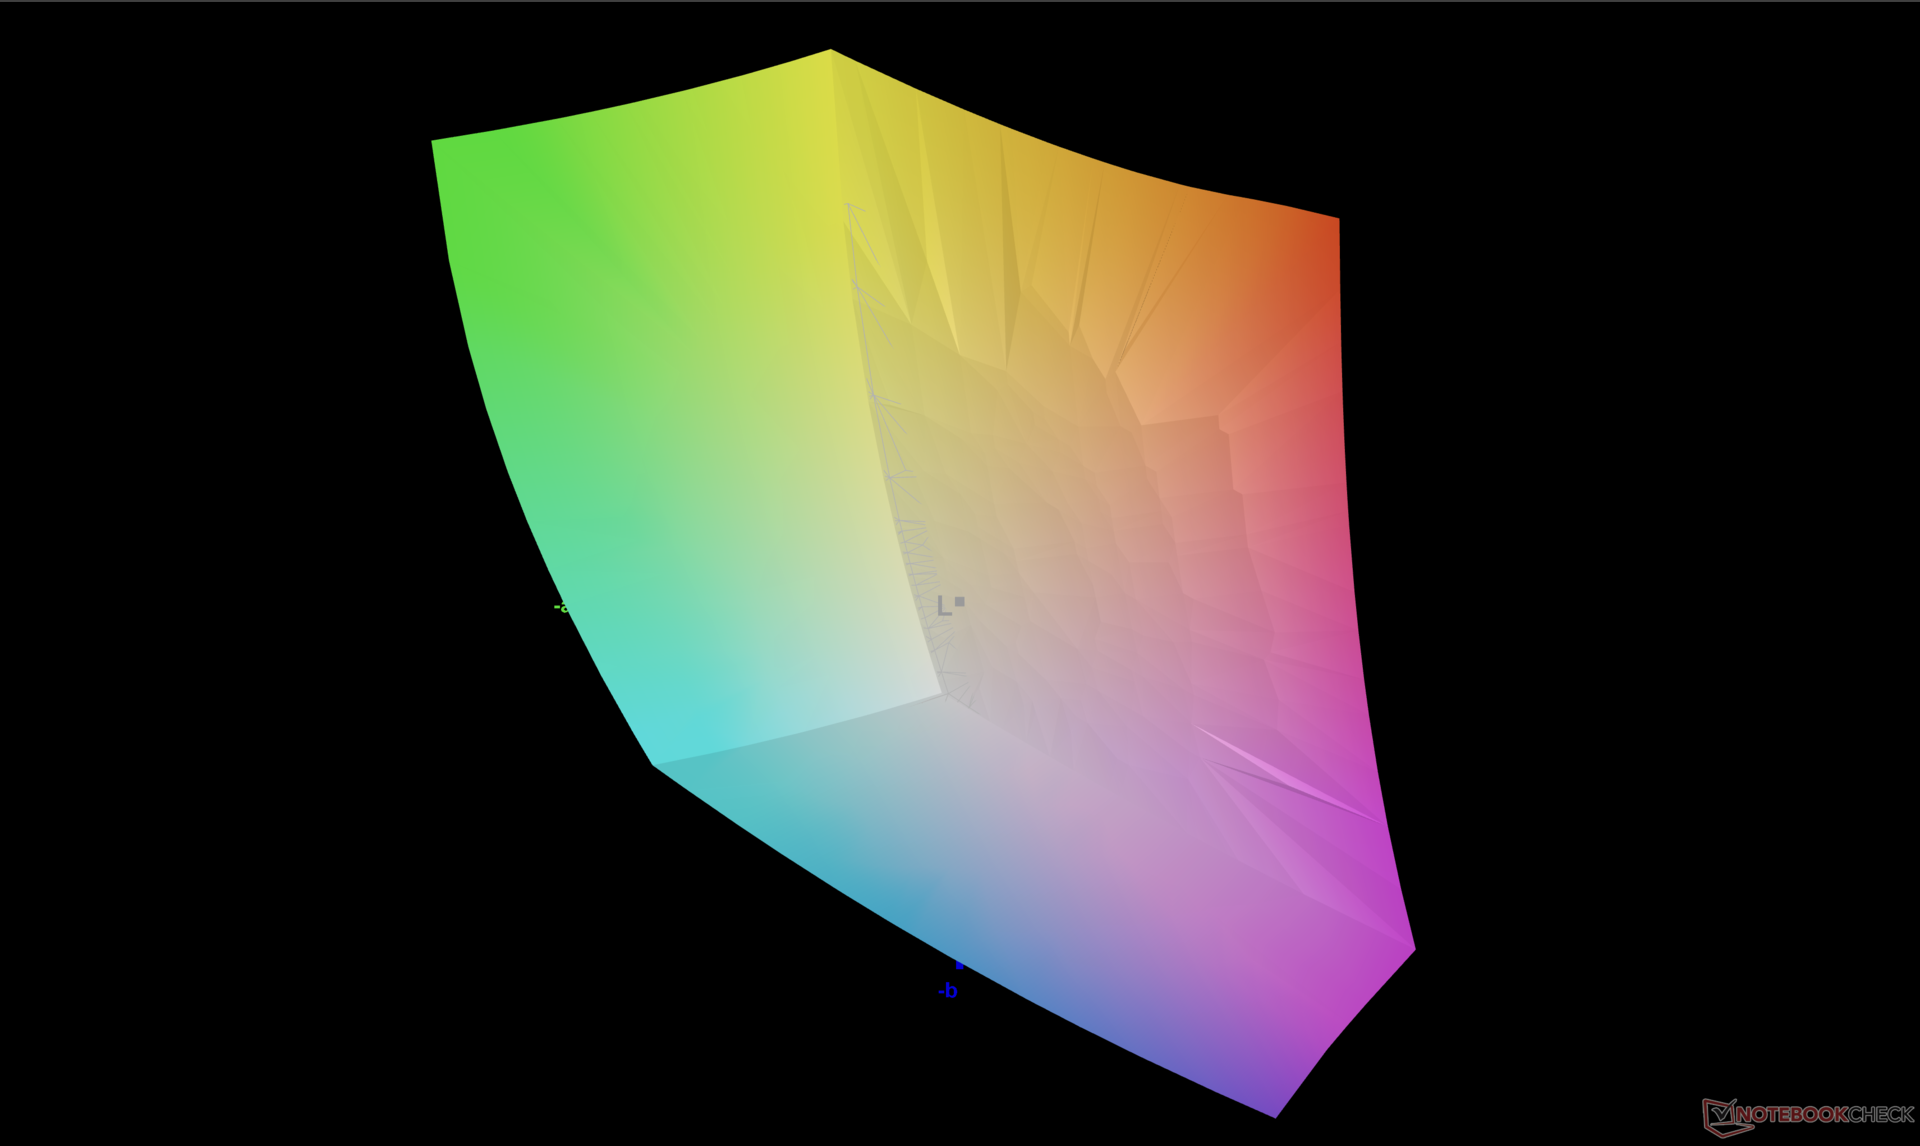
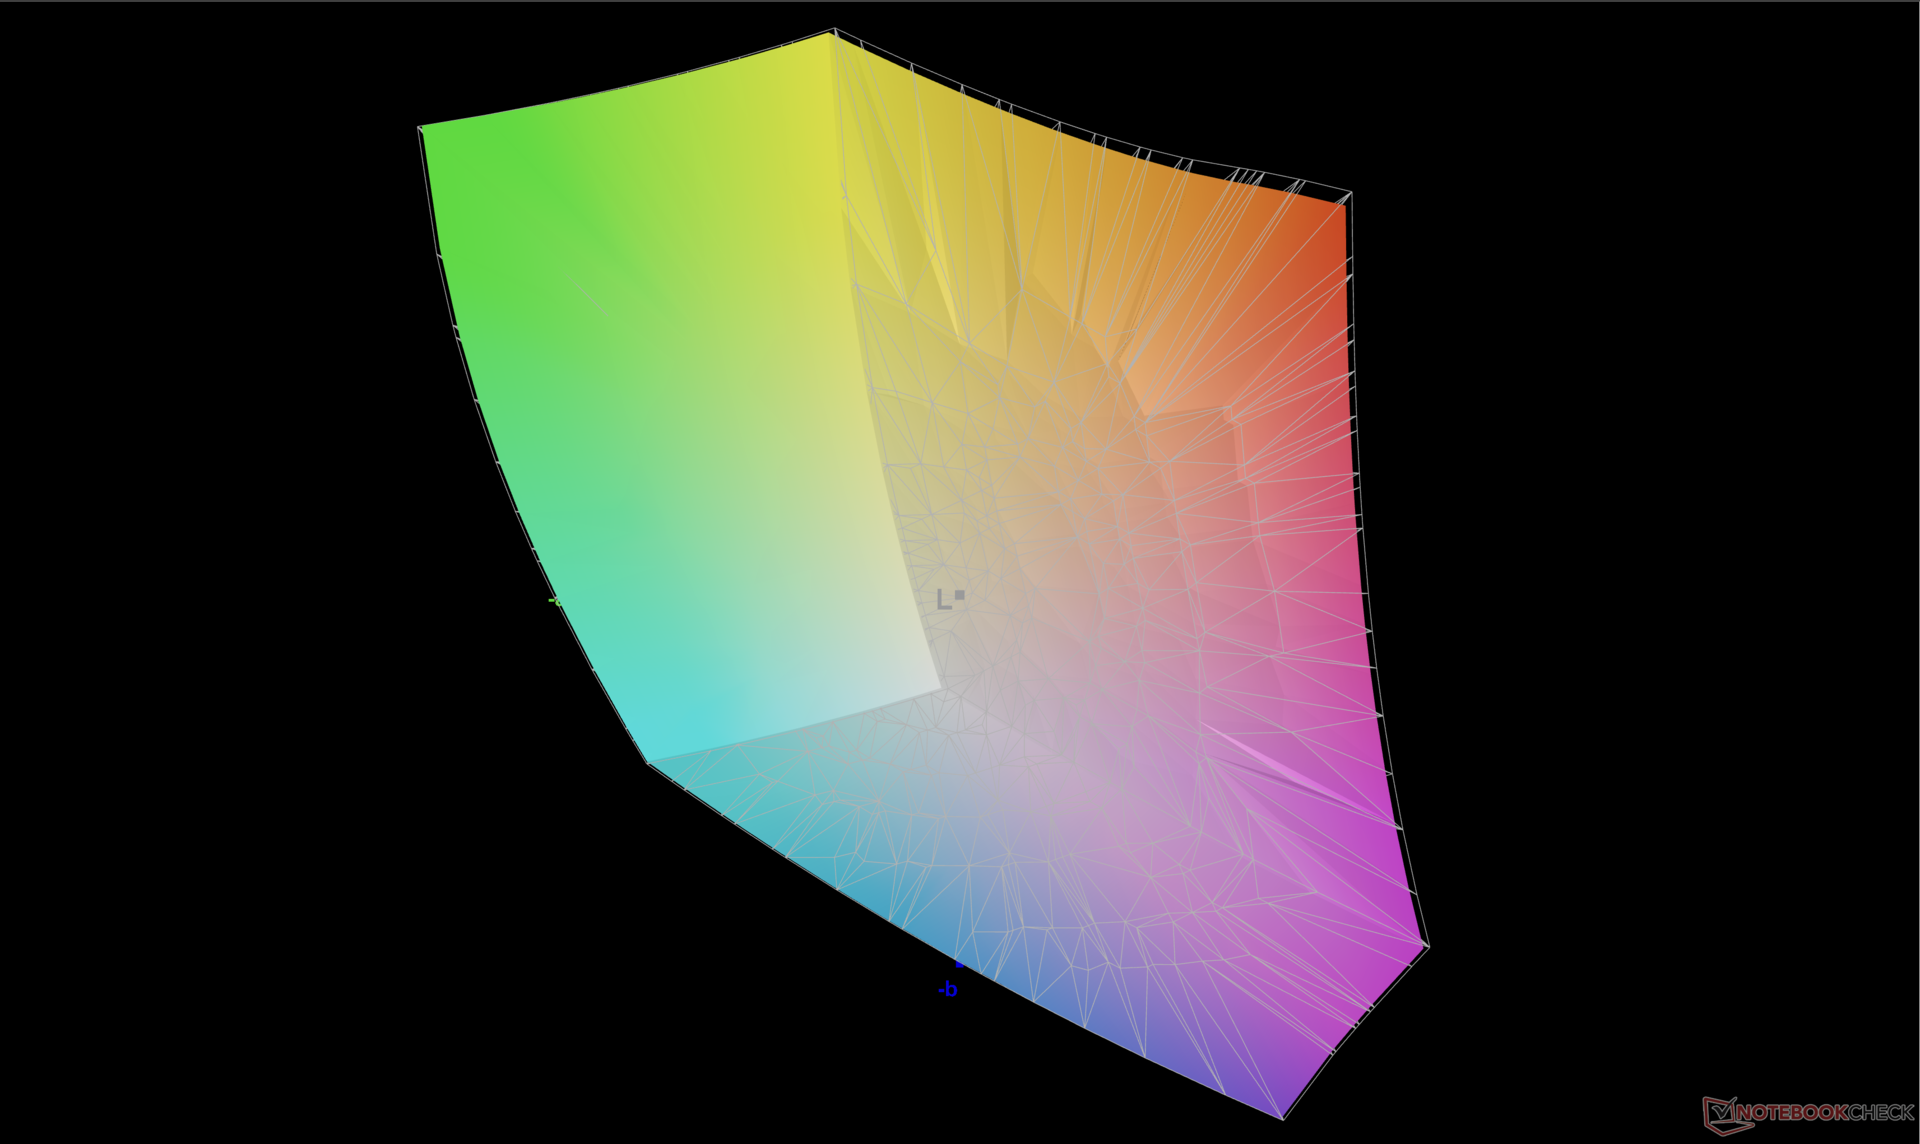
86% AdobeRGB 1998 (Argyll 3D)
99.9% sRGB (Argyll 3D)
97.8% Display P3 (Argyll 3D)
Gamma: 2.13
CCT: 6210 K
| Dell XPS 15 9520 RTX 3050 Ti Samsung 156XG01, OLED, 3456x2160, 15.6" | Dell XPS 15 9510 11800H RTX 3050 Ti OLED SDC414D, OLED, 3456x2160, 15.6" | Dell XPS 15 9500 Core i7 4K UHD Sharp LQ156R1, IPS, 3840x2400, 15.6" | HP Spectre X360 15-5ZV31AV AU Optronics AUO30EB, IPS, 3840x2160, 15.6" | Asus Zenbook Pro 15 OLED UM535Q Samsung ATNA56YX03-0, OLED, 1920x1080, 15.6" | MSI Stealth 15M A11SEK Chi Mei N156HCE-EN1, IPS, 1920x1080, 15.6" | |
|---|---|---|---|---|---|---|
| Display | 5% | 3% | -19% | -7% | -23% | |
| Display P3 Coverage (%) | 97.8 | 99.9 2% | 89.7 -8% | 68.3 -30% | 79.3 -19% | 62 -37% |
| sRGB Coverage (%) | 99.9 | 100 0% | 100 0% | 94.3 -6% | 95.6 -4% | 93.4 -7% |
| AdobeRGB 1998 Coverage (%) | 86 | 98.1 14% | 99.8 16% | 68.4 -20% | 87.3 2% | 64.1 -25% |
| Response Times | -68% | -2195% | -2468% | -16% | -2079% | |
| Response Time Grey 50% / Grey 80% * (ms) | 1.9 ? | 3.6 ? -89% | 54 ? -2742% | 56.8 ? -2889% | 2.1 ? -11% | 47.6 ? -2405% |
| Response Time Black / White * (ms) | 1.9 ? | 2.8 ? -47% | 33.2 ? -1647% | 40.8 ? -2047% | 2.3 ? -21% | 35.2 ? -1753% |
| PWM Frequency (Hz) | 59.52 ? | 59.5 ? | 60.2 | 25000 ? | ||
| Screen | 22% | 5% | -11% | 13% | -4% | |
| Brightness middle (cd/m²) | 381.4 | 362 -5% | 557.9 46% | 284.6 -25% | 342.9 -10% | 279 -27% |
| Brightness (cd/m²) | 384 | 367 -4% | 541 41% | 285 -26% | 346 -10% | 252 -34% |
| Brightness Distribution (%) | 95 | 97 2% | 91 -4% | 85 -11% | 98 3% | 82 -14% |
| Black Level * (cd/m²) | 0.06 | 0.39 | 0.25 | 0.32 | ||
| Colorchecker dE 2000 * | 4.34 | 2.1 52% | 4.54 -5% | 3.52 19% | 2.42 44% | 1.72 60% |
| Colorchecker dE 2000 max. * | 9.24 | 4.1 56% | 7.92 14% | 5.56 40% | 4.05 56% | 5.62 39% |
| Greyscale dE 2000 * | 2 | 1.4 30% | 3.2 -60% | 3.2 -60% | 2.1 -5% | 2.9 -45% |
| Gamma | 2.13 103% | 2.18 101% | 1.99 111% | 2.28 96% | 2.21 100% | 2.3 96% |
| CCT | 6210 105% | 6608 98% | 6451 101% | 7070 92% | 6364 102% | 6700 97% |
| Contrast (:1) | 6033 | 1431 | 1138 | 872 | ||
| Colorchecker dE 2000 calibrated * | 2.5 | 3.82 | 3 | 1.39 | ||
| Color Space (Percent of AdobeRGB 1998) (%) | 89.5 | 61.1 | 59 | |||
| Color Space (Percent of sRGB) (%) | 100 | 93.8 | 93.2 | |||
| Totalt genomsnitt (program/inställningar) | -14% /
1% | -729% /
-395% | -833% /
-460% | -3% /
2% | -702% /
-386% |
* ... mindre är bättre
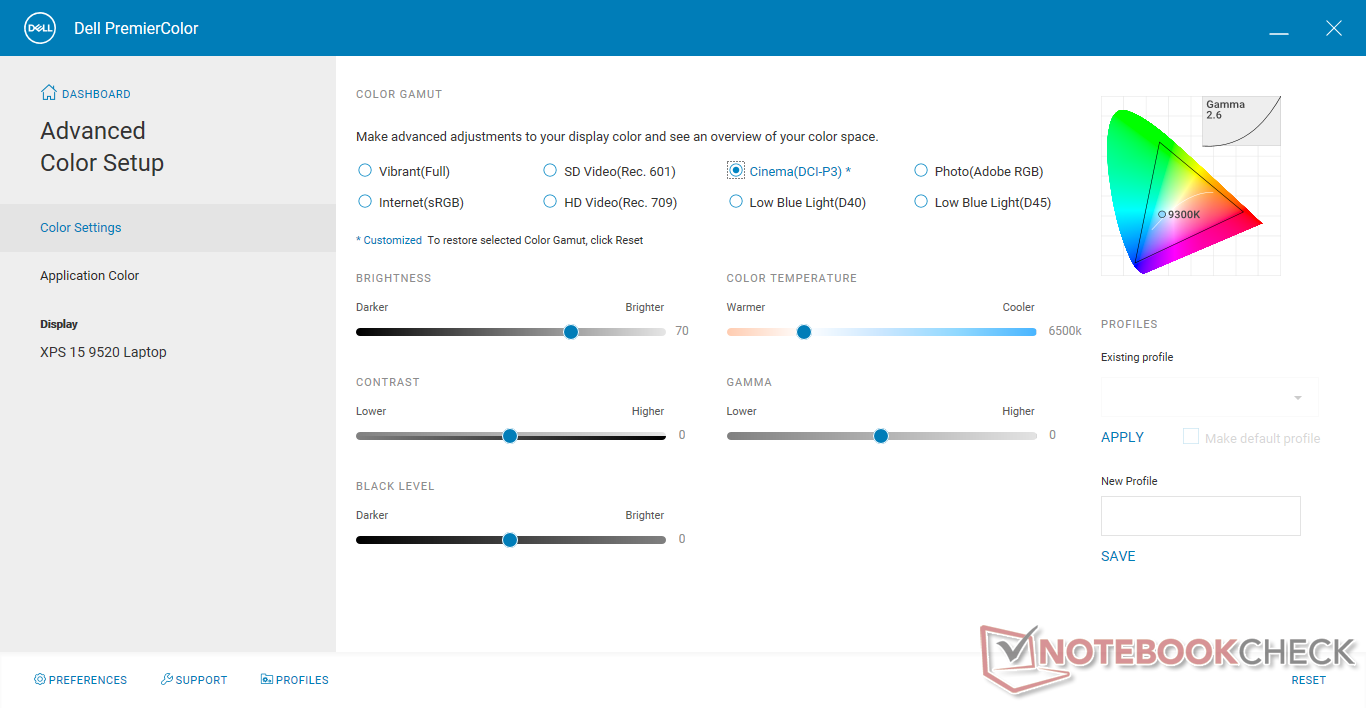
Även om vi kan bekräfta en DCI-P3-täckning på minst 98 procent, har färgerna på vår enhet inte kalibrerats väl mot standarden, även när de ställts in på DCI-P3 via PremierColor-programvaran.
Visa svarstider
| ↔ Svarstid svart till vitt | ||
|---|---|---|
| 1.9 ms ... stiga ↗ och falla ↘ kombinerat | ↗ 1.1 ms stiga | 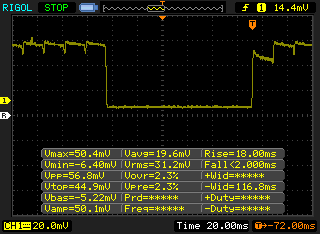 |
| ↘ 0.8 ms hösten | ||
| Skärmen visar väldigt snabba svarsfrekvenser i våra tester och borde vara mycket väl lämpad för fartfyllt spel. I jämförelse sträcker sig alla testade enheter från 0.1 (minst) till 240 (maximalt) ms. » 11 % av alla enheter är bättre. Det betyder att den uppmätta svarstiden är bättre än genomsnittet av alla testade enheter (19.8 ms). | ||
| ↔ Svarstid 50 % grått till 80 % grått | ||
| 1.9 ms ... stiga ↗ och falla ↘ kombinerat | ↗ 1.1 ms stiga | 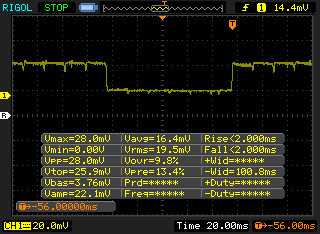 |
| ↘ 0.8 ms hösten | ||
| Skärmen visar väldigt snabba svarsfrekvenser i våra tester och borde vara mycket väl lämpad för fartfyllt spel. I jämförelse sträcker sig alla testade enheter från 0.165 (minst) till 636 (maximalt) ms. » 9 % av alla enheter är bättre. Det betyder att den uppmätta svarstiden är bättre än genomsnittet av alla testade enheter (31 ms). | ||
Skärmflimmer / PWM (Puls-Width Modulation)
| Skärmflimmer / PWM upptäckt | 59.52 Hz | ≤ 100 % ljusstyrka inställning | 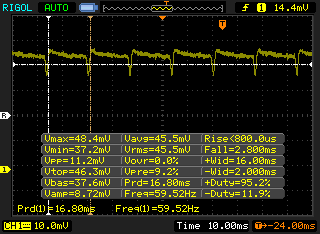 |
Displayens bakgrundsbelysning flimrar vid 59.52 Hz (i värsta fall, t.ex. med PWM) Flimrande upptäckt vid en ljusstyrkeinställning på 100 % och lägre. Det ska inte finnas något flimmer eller PWM över denna ljusstyrkeinställning. Frekvensen för 59.52 Hz är mycket låg, så flimmer kan orsaka ögon- och huvudvärk efter långvarig användning. Som jämförelse: 52 % av alla testade enheter använder inte PWM för att dämpa skärmen. Om PWM upptäcktes mättes ett medelvärde av 7757 (minst: 5 - maximum: 343500) Hz. | |||

Prestanda - Intel 12th Gen-alternativ
Provningsförhållanden
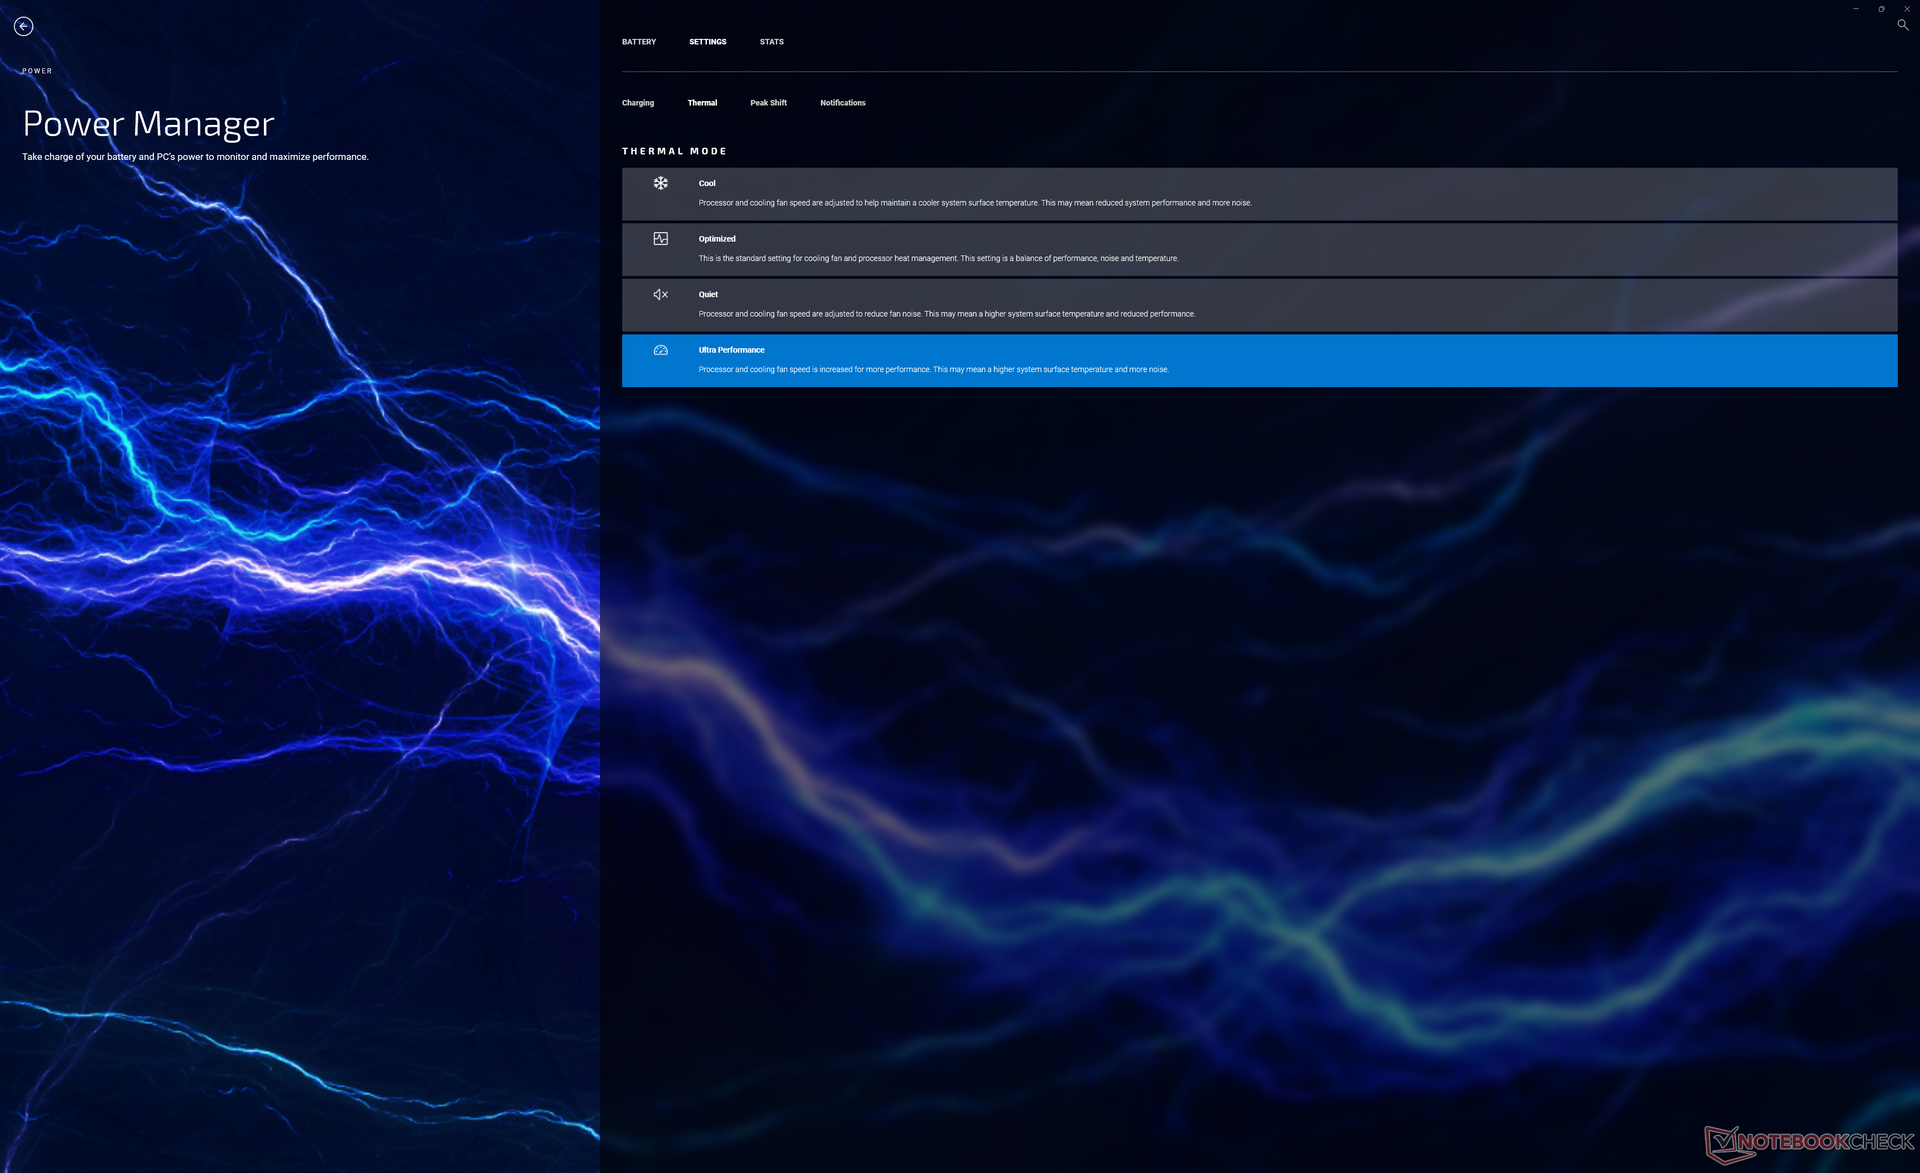
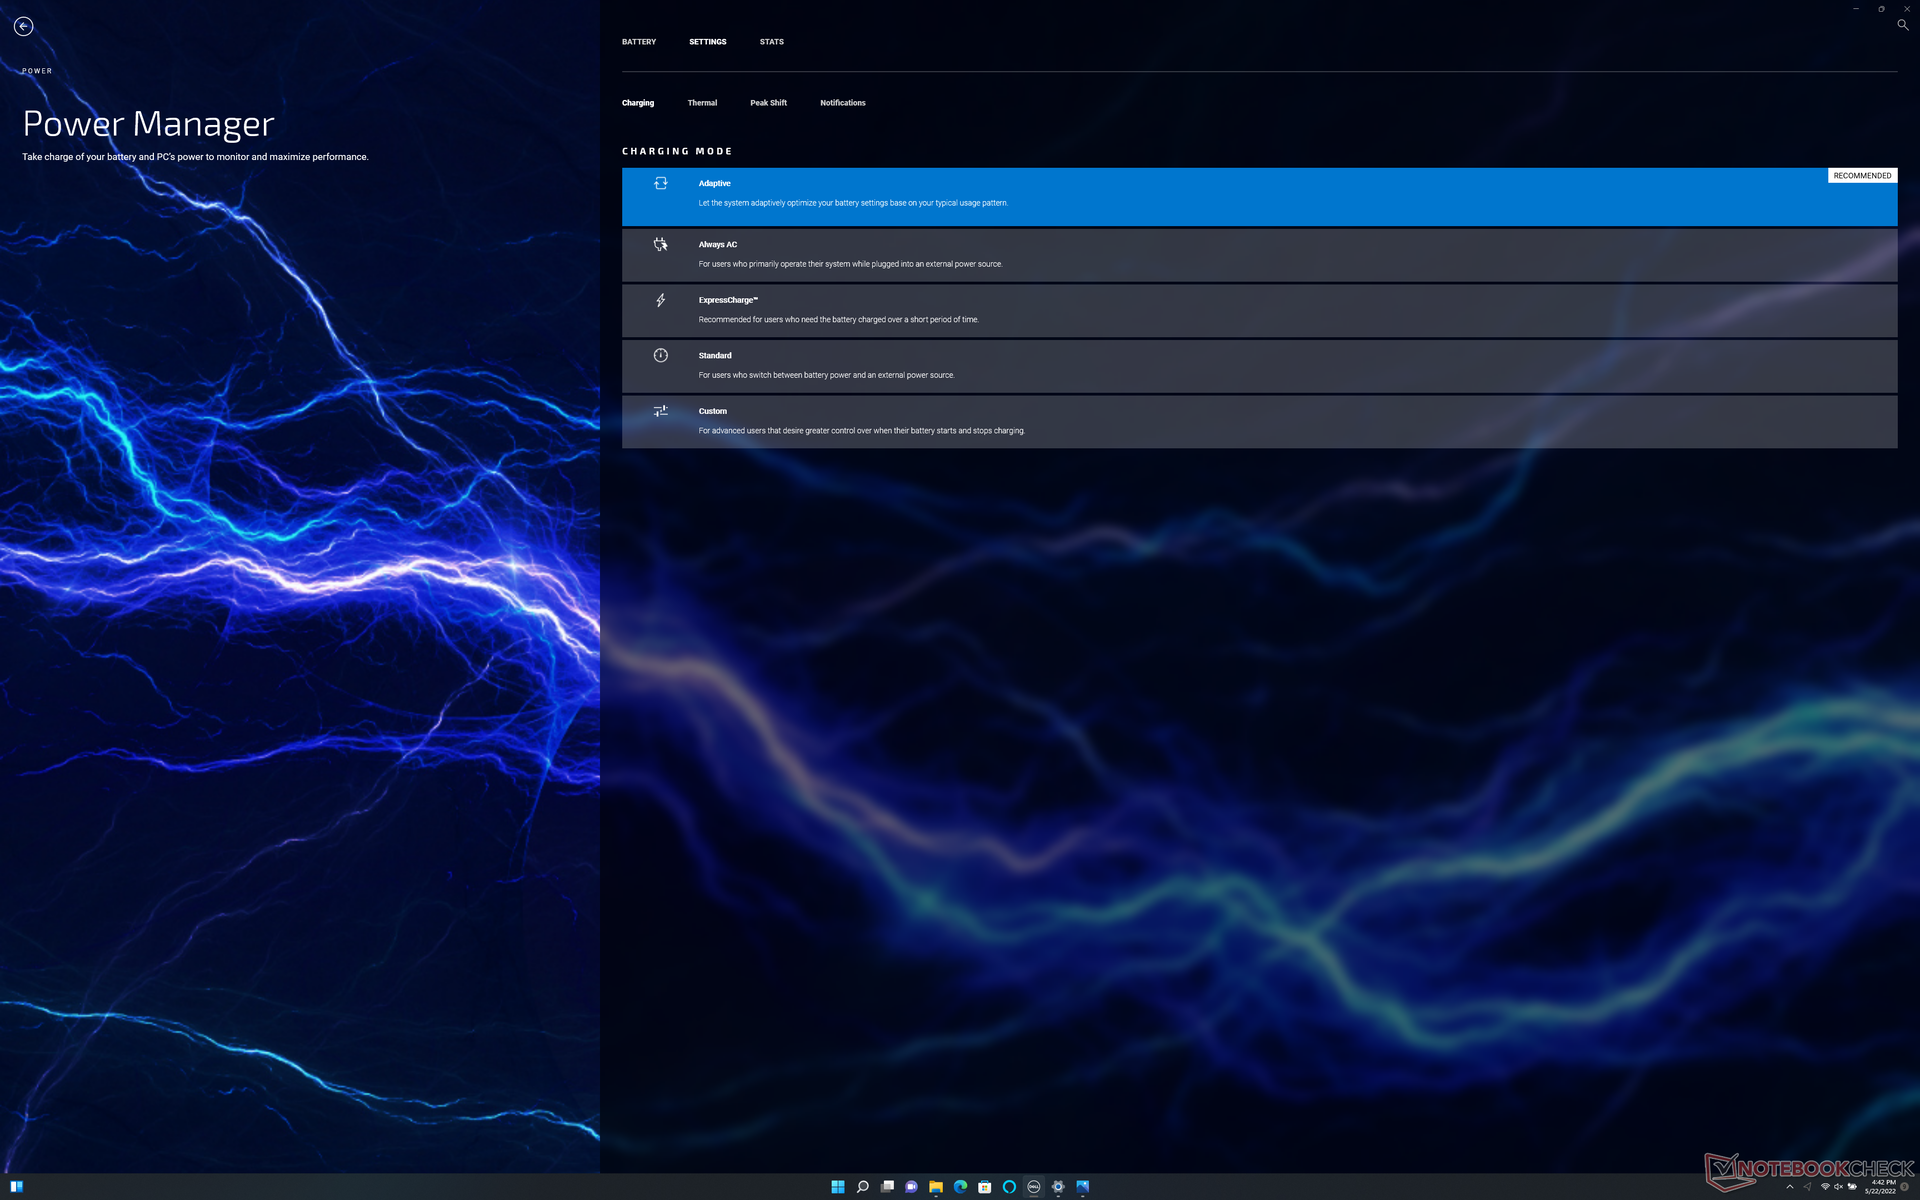
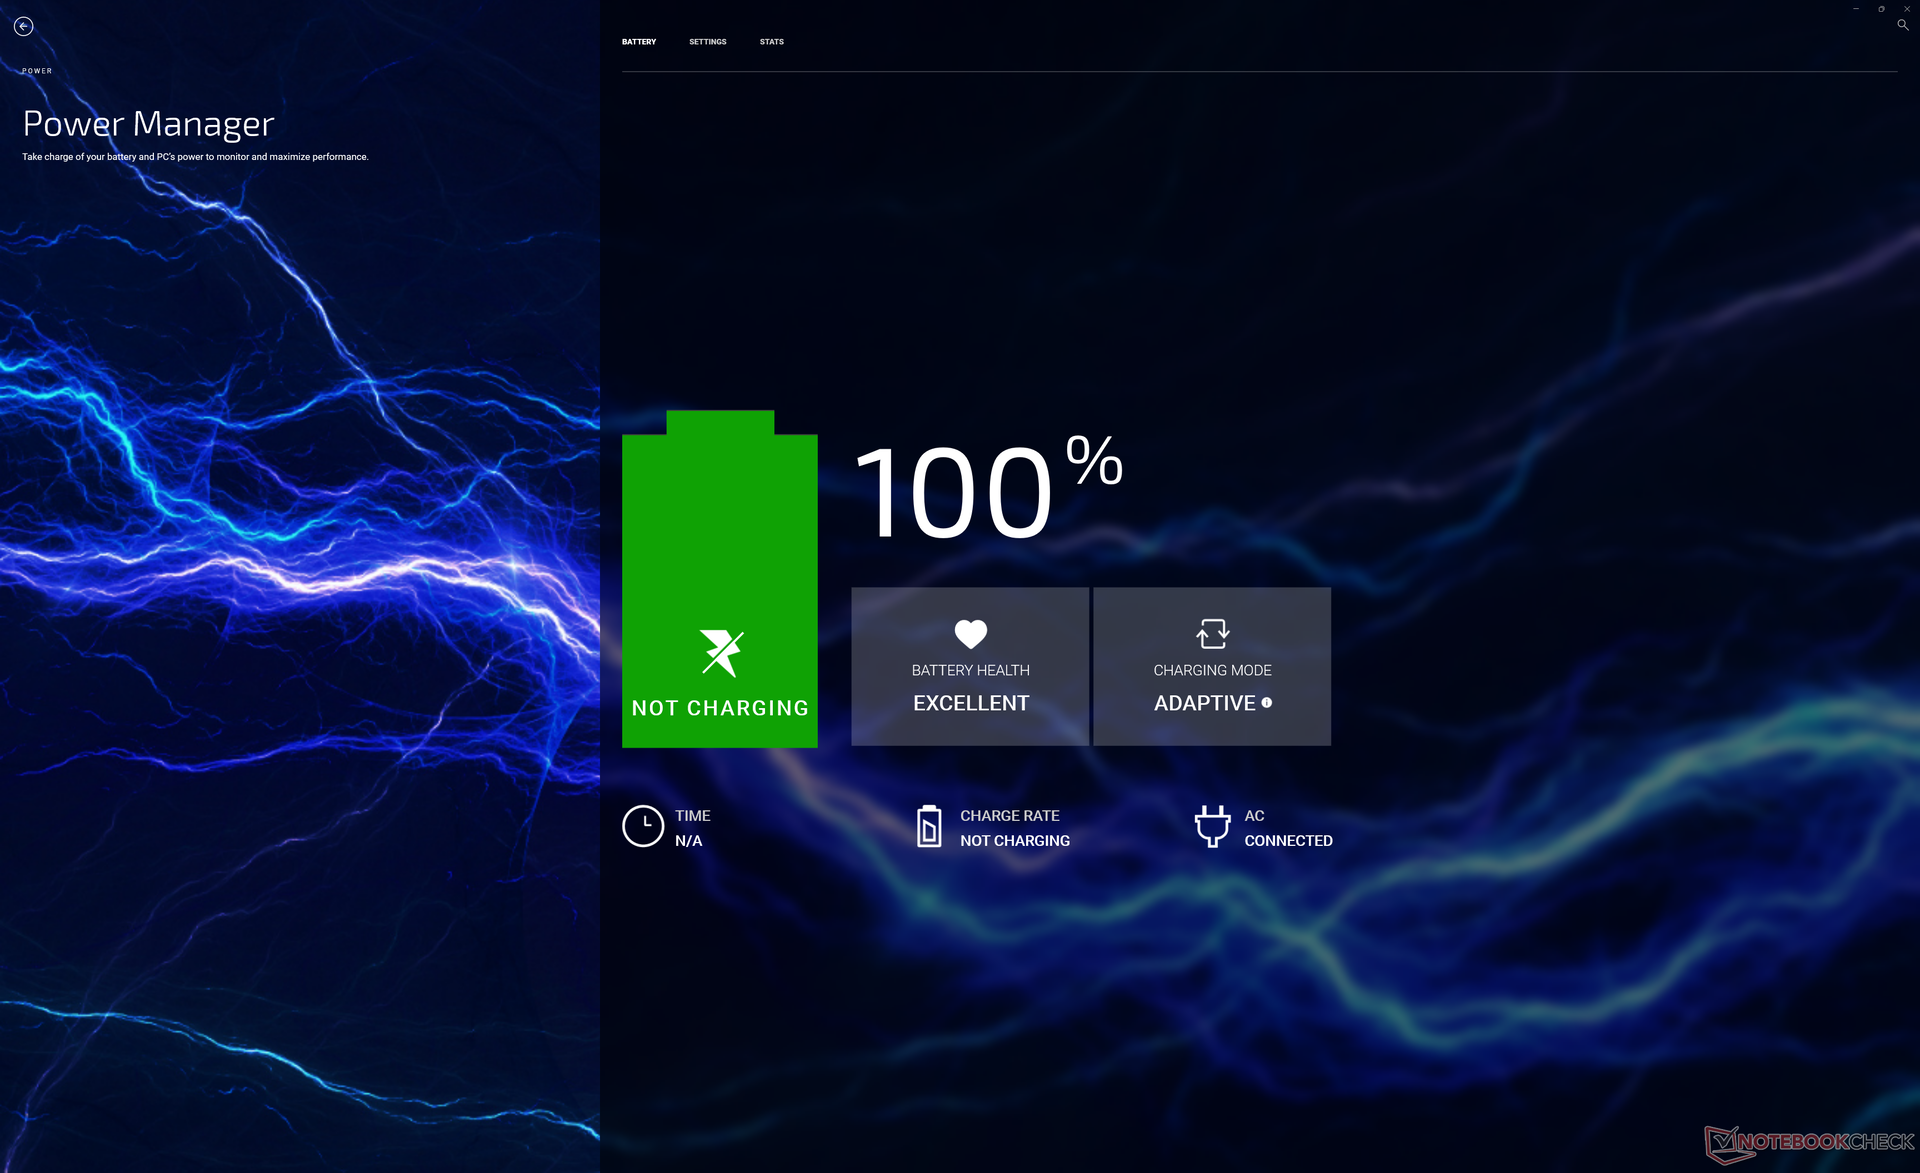
Vår enhet ställdes in i prestandaläge via Windows och Ultra Performance-läge via programmet My Dell innan vi körde de nedanstående riktmärkena för att få högsta möjliga poäng. Observera att My Dell i praktiken har ersatt den äldre Dell Power Manager-programvaran. Vi rekommenderar att användarna bekantar sig med det nya programmet eftersom det är en enda kontaktpunkt för Dell-uppdateringar och prestandainställningar
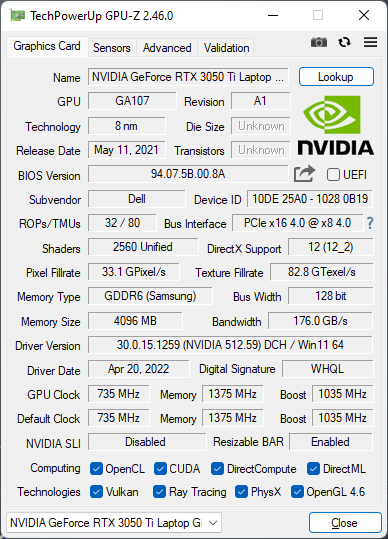
Den 45 W TGP GeForce RTX 3050 Ti GPU:n RTX 3050 Ti har inte ändrats från den tidigare XPS 15 9510. Det finns som väntat ingen MUX-switch eller adaptiv synkronisering eftersom XPS 15 inte är avsedd för spel.
Processor
Ökningen av CPU-prestanda från XPS 15 9510 till 9520 är större än ökningen av CPU-prestanda från XPS 9500 till 9510. Att hoppa frånCore i7-11800H i XPS 15 9510 till Core i7-12700H i vår 9520 ger en ökning på 35-40 procent av prestandan för flera trådar och en ökning på 15-20 procent av prestandan för enstaka trådar. Språnget är tillräckligt för att driva den 12:e generationens Intel CPU något före den populära Ryzen 7 5800H som ökänt nog har överträffat de flesta CPU:er i 11:e generationens Intel Core-H-serie i arbetsbelastningar med flera trådar
CPU-prestandan kunde ha varit bättre trots den ovan nämnda ökningen från år till år. När man jämför med de över 20 andra bärbara datorer som vi hittills har testat med samma Core i7-12700H CPU är den i vår XPS 15 9520 långsammare än genomsnittet med cirka 5 till 15 procent. Att köra CineBench R15 xT i en slinga visar att processorn i Dell inte kan upprätthålla höga Turbo Boost-klockfrekvenser lika länge som de flesta andra bärbara datorer med samma processor. Modeller somAsus TUF Gaming F15 FX507ZM kan köra samma processor upp till 36 procent snabbare än i vår Dell.
Cinebench R15 Multi Loop
Cinebench R23: Multi Core | Single Core
Cinebench R15: CPU Multi 64Bit | CPU Single 64Bit
Blender: v2.79 BMW27 CPU
7-Zip 18.03: 7z b 4 | 7z b 4 -mmt1
Geekbench 5.5: Multi-Core | Single-Core
HWBOT x265 Benchmark v2.2: 4k Preset
LibreOffice : 20 Documents To PDF
R Benchmark 2.5: Overall mean
| Cinebench R20 / CPU (Multi Core) | |
| Corsair One i300 | |
| Asus TUF Gaming F15 FX507ZM | |
| MSI Vector GP66 12UGS | |
| Genomsnitt Intel Core i7-12700H (1576 - 7407, n=64) | |
| Dell XPS 15 9520 RTX 3050 Ti | |
| Asus Zenbook Pro 15 OLED UM535Q | |
| MSI Alpha 15 B5EEK-008 | |
| Lenovo Legion 5 15ACH6A-82NW0010GE | |
| Dell XPS 15 9510 11800H RTX 3050 Ti OLED | |
| Dell XPS 15 9500 Core i7 4K UHD | |
| MSI Stealth 15M A11SEK | |
| HP Spectre X360 15-5ZV31AV | |
| Cinebench R20 / CPU (Single Core) | |
| Corsair One i300 | |
| MSI Vector GP66 12UGS | |
| Asus TUF Gaming F15 FX507ZM | |
| Dell XPS 15 9520 RTX 3050 Ti | |
| Genomsnitt Intel Core i7-12700H (300 - 704, n=64) | |
| Dell XPS 15 9510 11800H RTX 3050 Ti OLED | |
| MSI Stealth 15M A11SEK | |
| Asus Zenbook Pro 15 OLED UM535Q | |
| MSI Alpha 15 B5EEK-008 | |
| Lenovo Legion 5 15ACH6A-82NW0010GE | |
| Dell XPS 15 9500 Core i7 4K UHD | |
| HP Spectre X360 15-5ZV31AV | |
| Cinebench R23 / Multi Core | |
| Corsair One i300 | |
| Asus TUF Gaming F15 FX507ZM | |
| MSI Vector GP66 12UGS | |
| Genomsnitt Intel Core i7-12700H (4032 - 19330, n=64) | |
| Dell XPS 15 9520 RTX 3050 Ti | |
| Asus Zenbook Pro 15 OLED UM535Q | |
| MSI Alpha 15 B5EEK-008 | |
| Dell XPS 15 9510 11800H RTX 3050 Ti OLED | |
| Lenovo Legion 5 15ACH6A-82NW0010GE | |
| MSI Stealth 15M A11SEK | |
| Cinebench R23 / Single Core | |
| Corsair One i300 | |
| MSI Vector GP66 12UGS | |
| Dell XPS 15 9520 RTX 3050 Ti | |
| Asus TUF Gaming F15 FX507ZM | |
| Genomsnitt Intel Core i7-12700H (778 - 1826, n=63) | |
| MSI Stealth 15M A11SEK | |
| Dell XPS 15 9510 11800H RTX 3050 Ti OLED | |
| Asus Zenbook Pro 15 OLED UM535Q | |
| MSI Alpha 15 B5EEK-008 | |
| Lenovo Legion 5 15ACH6A-82NW0010GE | |
| Cinebench R15 / CPU Multi 64Bit | |
| Corsair One i300 | |
| Asus TUF Gaming F15 FX507ZM | |
| Genomsnitt Intel Core i7-12700H (1379 - 2916, n=70) | |
| MSI Vector GP66 12UGS | |
| Dell XPS 15 9520 RTX 3050 Ti | |
| Asus Zenbook Pro 15 OLED UM535Q | |
| Dell XPS 15 9510 11800H RTX 3050 Ti OLED | |
| Dell XPS 15 9510 11800H RTX 3050 Ti OLED | |
| MSI Alpha 15 B5EEK-008 | |
| Lenovo Legion 5 15ACH6A-82NW0010GE | |
| Dell XPS 15 9500 Core i7 4K UHD | |
| MSI Stealth 15M A11SEK | |
| HP Spectre X360 15-5ZV31AV | |
| Cinebench R15 / CPU Single 64Bit | |
| Corsair One i300 | |
| MSI Vector GP66 12UGS | |
| Asus TUF Gaming F15 FX507ZM | |
| Genomsnitt Intel Core i7-12700H (113 - 263, n=65) | |
| Dell XPS 15 9520 RTX 3050 Ti | |
| Asus Zenbook Pro 15 OLED UM535Q | |
| MSI Alpha 15 B5EEK-008 | |
| Dell XPS 15 9510 11800H RTX 3050 Ti OLED | |
| MSI Stealth 15M A11SEK | |
| Lenovo Legion 5 15ACH6A-82NW0010GE | |
| Dell XPS 15 9500 Core i7 4K UHD | |
| HP Spectre X360 15-5ZV31AV | |
| Blender / v2.79 BMW27 CPU | |
| MSI Stealth 15M A11SEK | |
| Dell XPS 15 9500 Core i7 4K UHD | |
| Lenovo Legion 5 15ACH6A-82NW0010GE | |
| Dell XPS 15 9510 11800H RTX 3050 Ti OLED | |
| MSI Alpha 15 B5EEK-008 | |
| Asus Zenbook Pro 15 OLED UM535Q | |
| Dell XPS 15 9520 RTX 3050 Ti | |
| Genomsnitt Intel Core i7-12700H (168 - 732, n=63) | |
| MSI Vector GP66 12UGS | |
| Asus TUF Gaming F15 FX507ZM | |
| Corsair One i300 | |
| 7-Zip 18.03 / 7z b 4 | |
| Corsair One i300 | |
| Asus TUF Gaming F15 FX507ZM | |
| MSI Vector GP66 12UGS | |
| Dell XPS 15 9520 RTX 3050 Ti | |
| Genomsnitt Intel Core i7-12700H (22844 - 73067, n=63) | |
| Asus Zenbook Pro 15 OLED UM535Q | |
| MSI Alpha 15 B5EEK-008 | |
| Lenovo Legion 5 15ACH6A-82NW0010GE | |
| Dell XPS 15 9510 11800H RTX 3050 Ti OLED | |
| Dell XPS 15 9500 Core i7 4K UHD | |
| MSI Stealth 15M A11SEK | |
| 7-Zip 18.03 / 7z b 4 -mmt1 | |
| Corsair One i300 | |
| MSI Vector GP66 12UGS | |
| Dell XPS 15 9520 RTX 3050 Ti | |
| Genomsnitt Intel Core i7-12700H (2743 - 5972, n=63) | |
| Asus Zenbook Pro 15 OLED UM535Q | |
| MSI Alpha 15 B5EEK-008 | |
| Dell XPS 15 9510 11800H RTX 3050 Ti OLED | |
| MSI Stealth 15M A11SEK | |
| Asus TUF Gaming F15 FX507ZM | |
| Dell XPS 15 9500 Core i7 4K UHD | |
| Lenovo Legion 5 15ACH6A-82NW0010GE | |
| Geekbench 5.5 / Multi-Core | |
| Corsair One i300 | |
| MSI Vector GP66 12UGS | |
| Asus TUF Gaming F15 FX507ZM | |
| Dell XPS 15 9520 RTX 3050 Ti | |
| Genomsnitt Intel Core i7-12700H (5144 - 13745, n=64) | |
| Asus Zenbook Pro 15 OLED UM535Q | |
| MSI Alpha 15 B5EEK-008 | |
| Dell XPS 15 9510 11800H RTX 3050 Ti OLED | |
| Dell XPS 15 9500 Core i7 4K UHD | |
| Lenovo Legion 5 15ACH6A-82NW0010GE | |
| MSI Stealth 15M A11SEK | |
| Geekbench 5.5 / Single-Core | |
| Corsair One i300 | |
| MSI Vector GP66 12UGS | |
| Dell XPS 15 9520 RTX 3050 Ti | |
| Asus TUF Gaming F15 FX507ZM | |
| Genomsnitt Intel Core i7-12700H (803 - 1851, n=64) | |
| MSI Stealth 15M A11SEK | |
| Dell XPS 15 9510 11800H RTX 3050 Ti OLED | |
| Asus Zenbook Pro 15 OLED UM535Q | |
| MSI Alpha 15 B5EEK-008 | |
| Lenovo Legion 5 15ACH6A-82NW0010GE | |
| Dell XPS 15 9500 Core i7 4K UHD | |
| HWBOT x265 Benchmark v2.2 / 4k Preset | |
| Corsair One i300 | |
| Asus TUF Gaming F15 FX507ZM | |
| MSI Vector GP66 12UGS | |
| Genomsnitt Intel Core i7-12700H (4.67 - 21.8, n=64) | |
| MSI Alpha 15 B5EEK-008 | |
| Asus Zenbook Pro 15 OLED UM535Q | |
| Dell XPS 15 9520 RTX 3050 Ti | |
| Lenovo Legion 5 15ACH6A-82NW0010GE | |
| Dell XPS 15 9510 11800H RTX 3050 Ti OLED | |
| Dell XPS 15 9500 Core i7 4K UHD | |
| MSI Stealth 15M A11SEK | |
| LibreOffice / 20 Documents To PDF | |
| MSI Alpha 15 B5EEK-008 | |
| Lenovo Legion 5 15ACH6A-82NW0010GE | |
| Dell XPS 15 9500 Core i7 4K UHD | |
| MSI Stealth 15M A11SEK | |
| Asus TUF Gaming F15 FX507ZM | |
| Asus Zenbook Pro 15 OLED UM535Q | |
| Dell XPS 15 9510 11800H RTX 3050 Ti OLED | |
| Genomsnitt Intel Core i7-12700H (34.2 - 95.3, n=63) | |
| Dell XPS 15 9520 RTX 3050 Ti | |
| MSI Vector GP66 12UGS | |
| Corsair One i300 | |
| R Benchmark 2.5 / Overall mean | |
| Dell XPS 15 9500 Core i7 4K UHD | |
| Dell XPS 15 9510 11800H RTX 3050 Ti OLED | |
| MSI Stealth 15M A11SEK | |
| Lenovo Legion 5 15ACH6A-82NW0010GE | |
| MSI Alpha 15 B5EEK-008 | |
| Asus Zenbook Pro 15 OLED UM535Q | |
| Genomsnitt Intel Core i7-12700H (0.4441 - 1.052, n=63) | |
| Asus TUF Gaming F15 FX507ZM | |
| Dell XPS 15 9520 RTX 3050 Ti | |
| MSI Vector GP66 12UGS | |
| Corsair One i300 | |
* ... mindre är bättre
AIDA64: FP32 Ray-Trace | FPU Julia | CPU SHA3 | CPU Queen | FPU SinJulia | FPU Mandel | CPU AES | CPU ZLib | FP64 Ray-Trace | CPU PhotoWorxx
| Performance rating | |
| Asus Zenbook Pro 15 OLED UM535Q | |
| Genomsnitt Intel Core i7-12700H | |
| Dell XPS 15 9520 RTX 3050 Ti | |
| Dell XPS 15 9500 Core i7 4K UHD | |
| Dell XPS 15 9510 11800H RTX 3050 Ti OLED -9! | |
| AIDA64 / FP32 Ray-Trace | |
| Asus Zenbook Pro 15 OLED UM535Q | |
| Genomsnitt Intel Core i7-12700H (2585 - 17957, n=64) | |
| Dell XPS 15 9500 Core i7 4K UHD | |
| Dell XPS 15 9520 RTX 3050 Ti | |
| AIDA64 / FPU Julia | |
| Asus Zenbook Pro 15 OLED UM535Q | |
| Dell XPS 15 9500 Core i7 4K UHD | |
| Genomsnitt Intel Core i7-12700H (12439 - 90760, n=64) | |
| Dell XPS 15 9520 RTX 3050 Ti | |
| AIDA64 / CPU SHA3 | |
| Asus Zenbook Pro 15 OLED UM535Q | |
| Genomsnitt Intel Core i7-12700H (833 - 4242, n=64) | |
| Dell XPS 15 9500 Core i7 4K UHD | |
| Dell XPS 15 9520 RTX 3050 Ti | |
| AIDA64 / CPU Queen | |
| Asus Zenbook Pro 15 OLED UM535Q | |
| Dell XPS 15 9520 RTX 3050 Ti | |
| Genomsnitt Intel Core i7-12700H (57923 - 103202, n=63) | |
| Dell XPS 15 9500 Core i7 4K UHD | |
| AIDA64 / FPU SinJulia | |
| Asus Zenbook Pro 15 OLED UM535Q | |
| Dell XPS 15 9500 Core i7 4K UHD | |
| Genomsnitt Intel Core i7-12700H (3249 - 9939, n=64) | |
| Dell XPS 15 9520 RTX 3050 Ti | |
| AIDA64 / FPU Mandel | |
| Asus Zenbook Pro 15 OLED UM535Q | |
| Dell XPS 15 9500 Core i7 4K UHD | |
| Genomsnitt Intel Core i7-12700H (7135 - 44760, n=64) | |
| Dell XPS 15 9520 RTX 3050 Ti | |
| AIDA64 / CPU AES | |
| Asus Zenbook Pro 15 OLED UM535Q | |
| Genomsnitt Intel Core i7-12700H (31839 - 144360, n=64) | |
| Dell XPS 15 9520 RTX 3050 Ti | |
| Dell XPS 15 9500 Core i7 4K UHD | |
| AIDA64 / CPU ZLib | |
| Genomsnitt Intel Core i7-12700H (305 - 1171, n=64) | |
| Dell XPS 15 9520 RTX 3050 Ti | |
| Asus Zenbook Pro 15 OLED UM535Q | |
| Dell XPS 15 9500 Core i7 4K UHD | |
| Dell XPS 15 9510 11800H RTX 3050 Ti OLED | |
| AIDA64 / FP64 Ray-Trace | |
| Asus Zenbook Pro 15 OLED UM535Q | |
| Genomsnitt Intel Core i7-12700H (1437 - 9692, n=64) | |
| Dell XPS 15 9520 RTX 3050 Ti | |
| Dell XPS 15 9500 Core i7 4K UHD | |
| AIDA64 / CPU PhotoWorxx | |
| Dell XPS 15 9520 RTX 3050 Ti | |
| Genomsnitt Intel Core i7-12700H (12863 - 52207, n=64) | |
| Dell XPS 15 9500 Core i7 4K UHD | |
| Asus Zenbook Pro 15 OLED UM535Q | |
Systemets prestanda
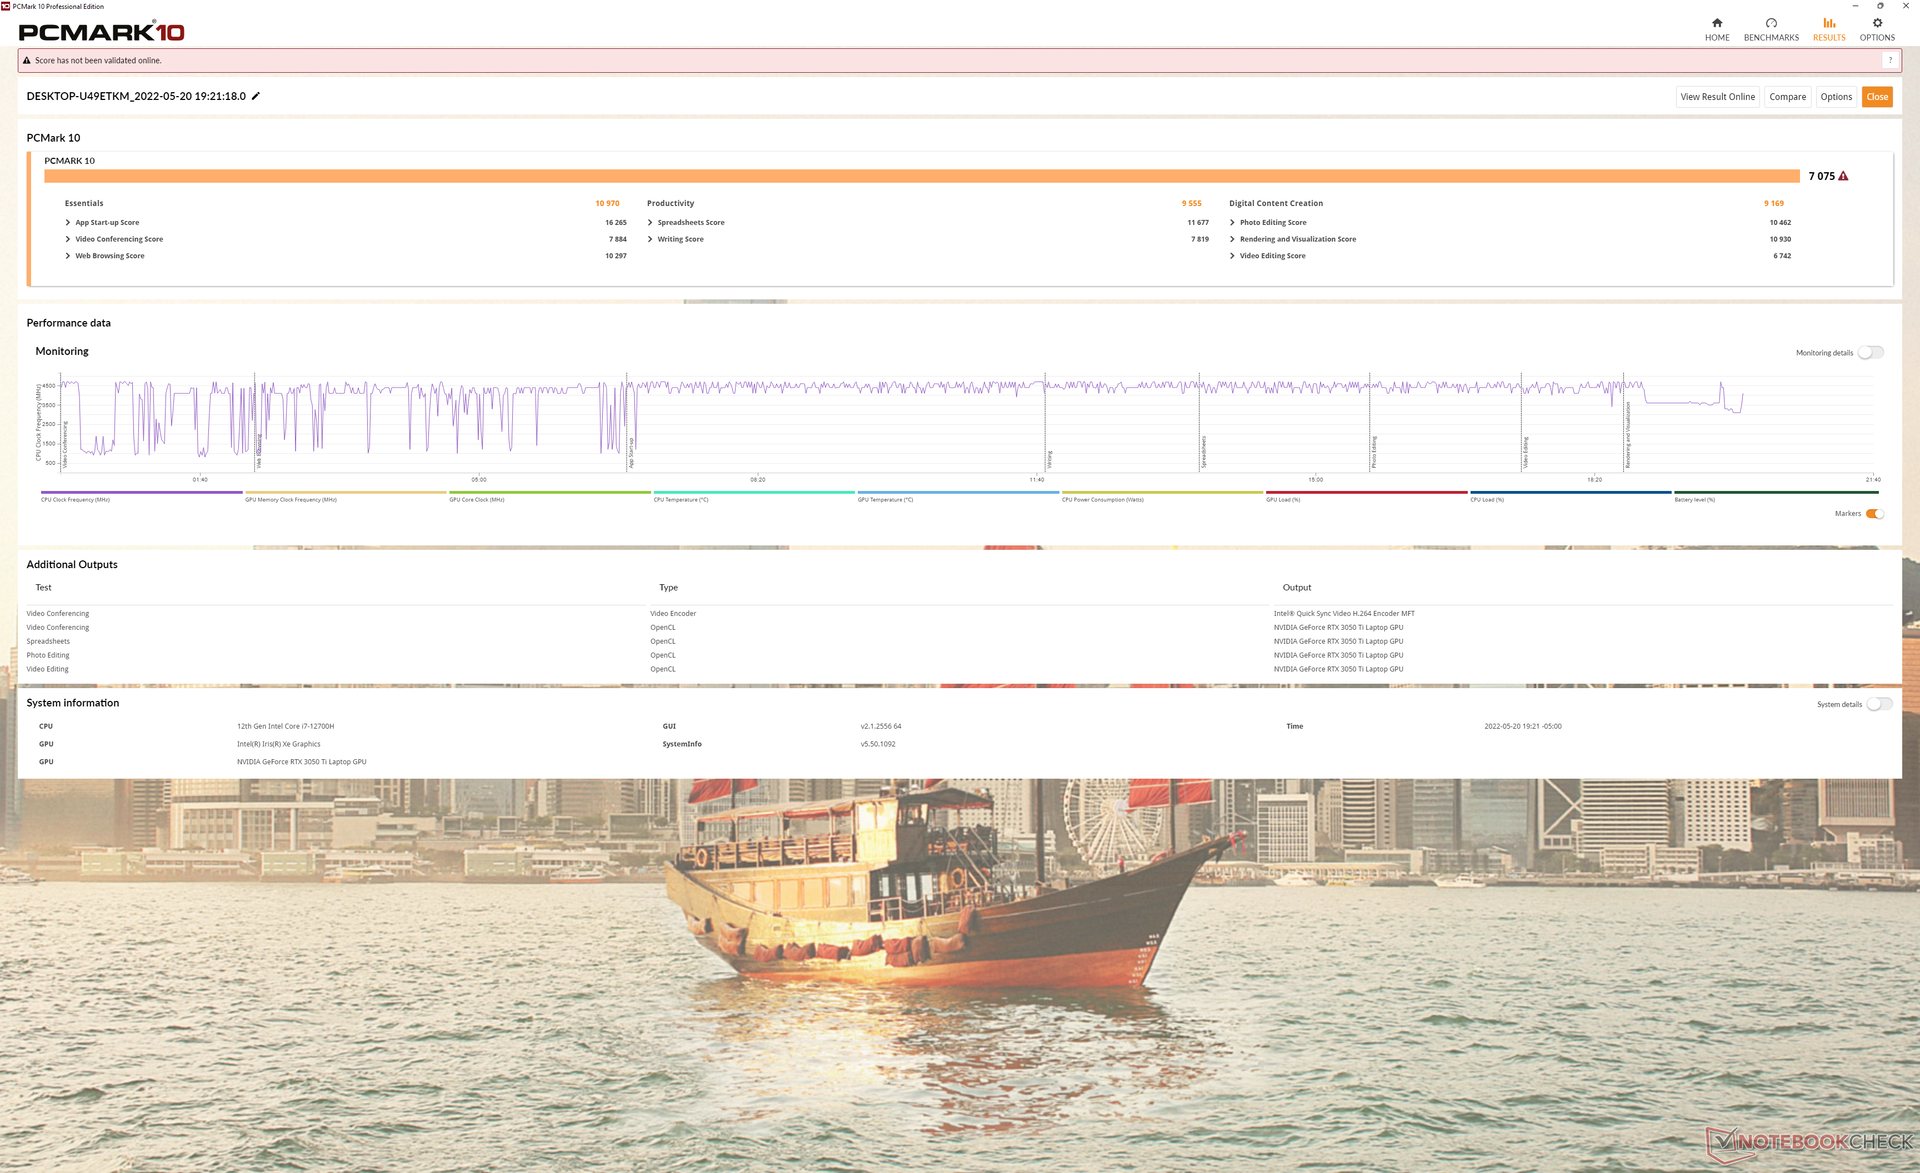
PCMark 10-resultaten är genomgående högre än vad vi noterade på de äldre XPS 15 9510 och 9500, vilket till stor del beror på den förbättrade CPU- och SSD-prestandan.
CrossMark: Overall | Productivity | Creativity | Responsiveness
| PCMark 10 / Score | |
| Dell XPS 15 9520 RTX 3050 Ti | |
| Genomsnitt Intel Core i7-12700H, NVIDIA GeForce RTX 3050 Ti Laptop GPU (6623 - 7075, n=5) | |
| Asus Zenbook Pro 15 OLED UM535Q | |
| Dell XPS 15 9510 11800H RTX 3050 Ti OLED | |
| MSI Stealth 15M A11SEK | |
| Dell XPS 15 9500 Core i7 4K UHD | |
| HP Spectre X360 15-5ZV31AV | |
| PCMark 10 / Essentials | |
| Dell XPS 15 9520 RTX 3050 Ti | |
| Asus Zenbook Pro 15 OLED UM535Q | |
| Genomsnitt Intel Core i7-12700H, NVIDIA GeForce RTX 3050 Ti Laptop GPU (9540 - 10970, n=5) | |
| Dell XPS 15 9500 Core i7 4K UHD | |
| MSI Stealth 15M A11SEK | |
| Dell XPS 15 9510 11800H RTX 3050 Ti OLED | |
| HP Spectre X360 15-5ZV31AV | |
| PCMark 10 / Productivity | |
| Asus Zenbook Pro 15 OLED UM535Q | |
| Dell XPS 15 9520 RTX 3050 Ti | |
| Genomsnitt Intel Core i7-12700H, NVIDIA GeForce RTX 3050 Ti Laptop GPU (8530 - 9555, n=5) | |
| MSI Stealth 15M A11SEK | |
| Dell XPS 15 9510 11800H RTX 3050 Ti OLED | |
| Dell XPS 15 9500 Core i7 4K UHD | |
| HP Spectre X360 15-5ZV31AV | |
| PCMark 10 / Digital Content Creation | |
| Genomsnitt Intel Core i7-12700H, NVIDIA GeForce RTX 3050 Ti Laptop GPU (8855 - 9542, n=5) | |
| Dell XPS 15 9520 RTX 3050 Ti | |
| Asus Zenbook Pro 15 OLED UM535Q | |
| Dell XPS 15 9510 11800H RTX 3050 Ti OLED | |
| MSI Stealth 15M A11SEK | |
| Dell XPS 15 9500 Core i7 4K UHD | |
| HP Spectre X360 15-5ZV31AV | |
| CrossMark / Overall | |
| Dell XPS 15 9520 RTX 3050 Ti | |
| Genomsnitt Intel Core i7-12700H, NVIDIA GeForce RTX 3050 Ti Laptop GPU (1654 - 1872, n=5) | |
| Asus Zenbook Pro 15 OLED UM535Q | |
| CrossMark / Productivity | |
| Dell XPS 15 9520 RTX 3050 Ti | |
| Genomsnitt Intel Core i7-12700H, NVIDIA GeForce RTX 3050 Ti Laptop GPU (1595 - 1792, n=5) | |
| Asus Zenbook Pro 15 OLED UM535Q | |
| CrossMark / Creativity | |
| Dell XPS 15 9520 RTX 3050 Ti | |
| Genomsnitt Intel Core i7-12700H, NVIDIA GeForce RTX 3050 Ti Laptop GPU (1699 - 1993, n=5) | |
| Asus Zenbook Pro 15 OLED UM535Q | |
| CrossMark / Responsiveness | |
| Dell XPS 15 9520 RTX 3050 Ti | |
| Genomsnitt Intel Core i7-12700H, NVIDIA GeForce RTX 3050 Ti Laptop GPU (1383 - 1768, n=5) | |
| Asus Zenbook Pro 15 OLED UM535Q | |
| PCMark 10 Score | 7075 poäng | |
Hjälp | ||
| AIDA64 / Memory Copy | |
| Dell XPS 15 9520 RTX 3050 Ti | |
| Genomsnitt Intel Core i7-12700H (25615 - 80511, n=64) | |
| Asus Zenbook Pro 15 OLED UM535Q | |
| Dell XPS 15 9500 Core i7 4K UHD | |
| AIDA64 / Memory Read | |
| Dell XPS 15 9520 RTX 3050 Ti | |
| Genomsnitt Intel Core i7-12700H (25586 - 79442, n=64) | |
| Asus Zenbook Pro 15 OLED UM535Q | |
| Dell XPS 15 9500 Core i7 4K UHD | |
| AIDA64 / Memory Write | |
| Dell XPS 15 9520 RTX 3050 Ti | |
| Genomsnitt Intel Core i7-12700H (23679 - 88660, n=64) | |
| Asus Zenbook Pro 15 OLED UM535Q | |
| Dell XPS 15 9500 Core i7 4K UHD | |
| AIDA64 / Memory Latency | |
| Dell XPS 15 9520 RTX 3050 Ti | |
| Asus Zenbook Pro 15 OLED UM535Q | |
| Genomsnitt Intel Core i7-12700H (76.2 - 133.9, n=62) | |
| Dell XPS 15 9500 Core i7 4K UHD | |
| Dell XPS 15 9510 11800H RTX 3050 Ti OLED | |
* ... mindre är bättre
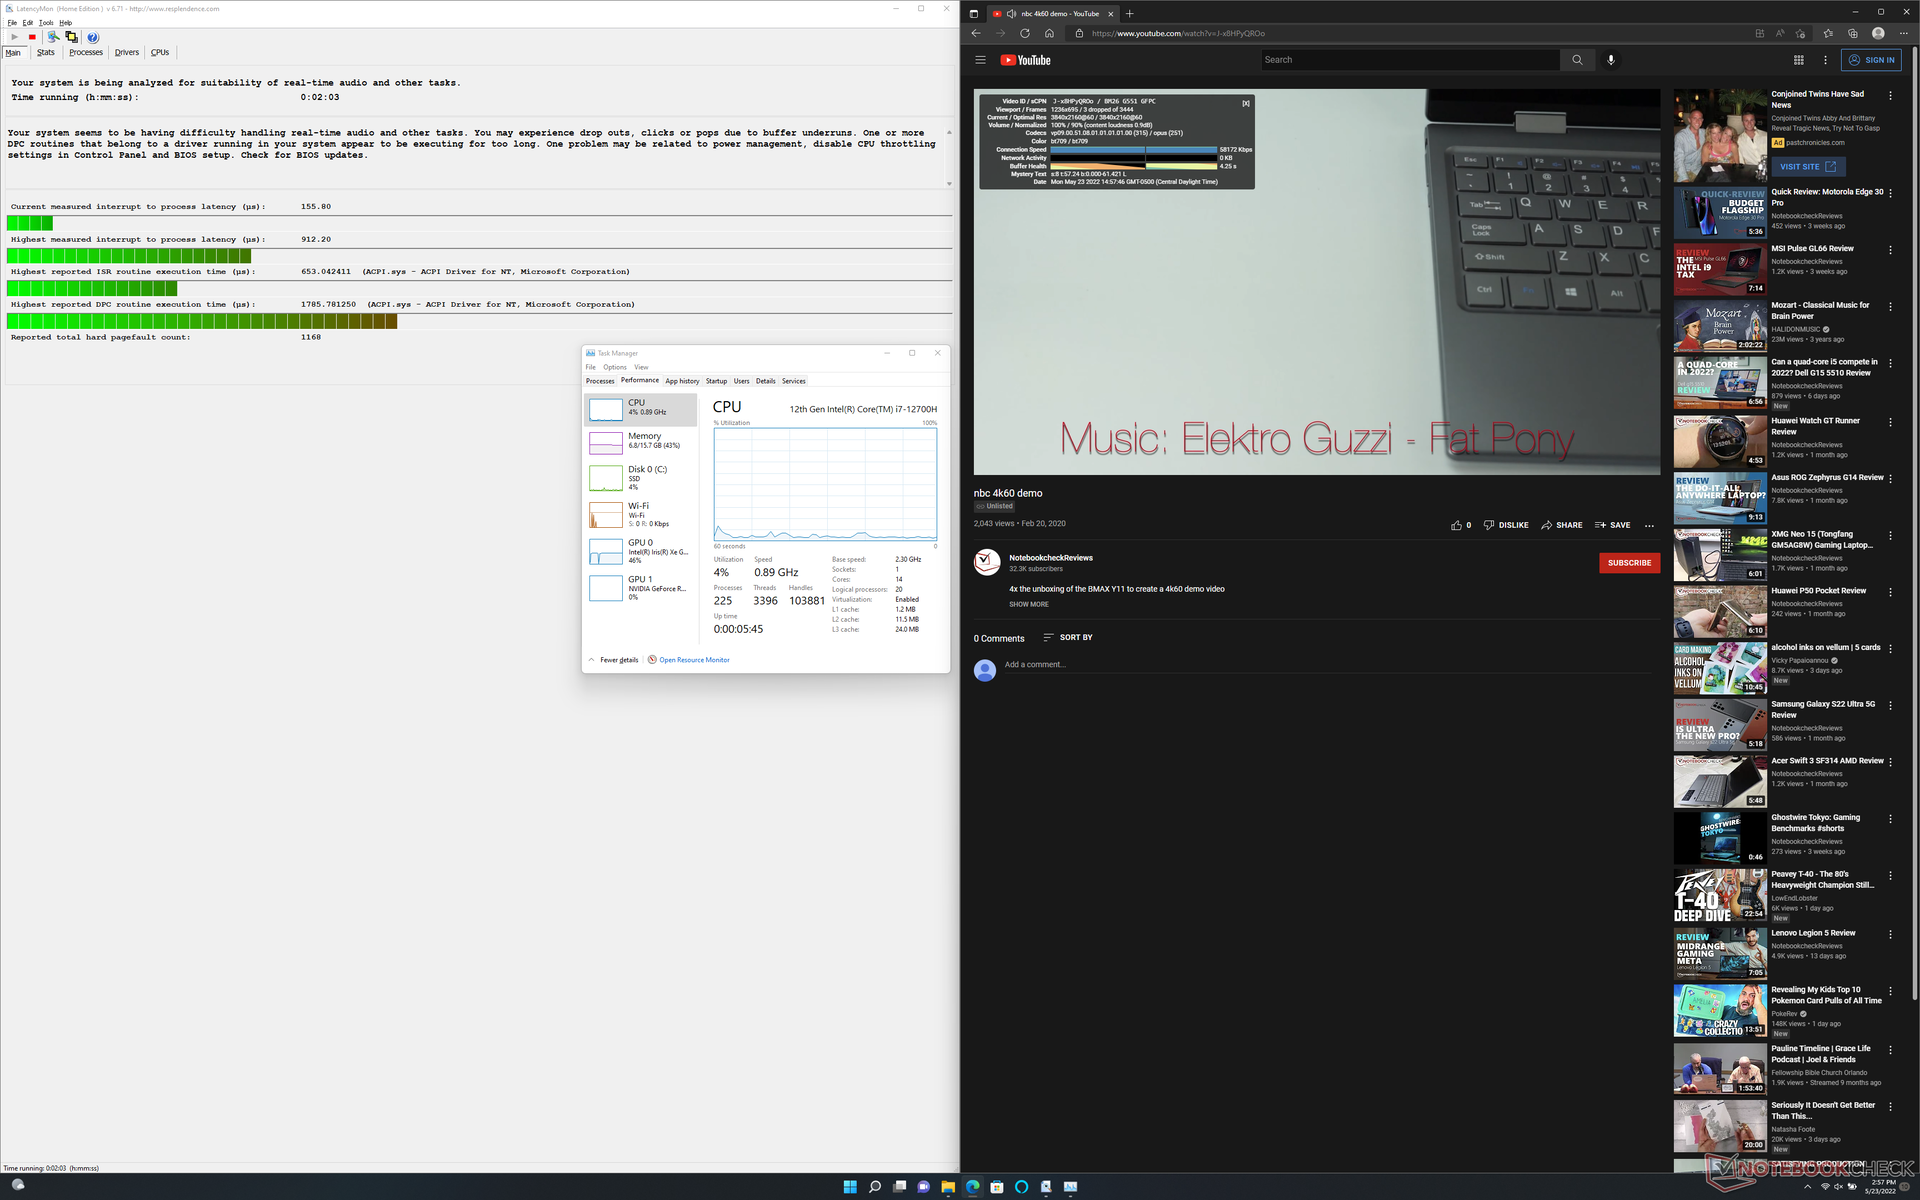
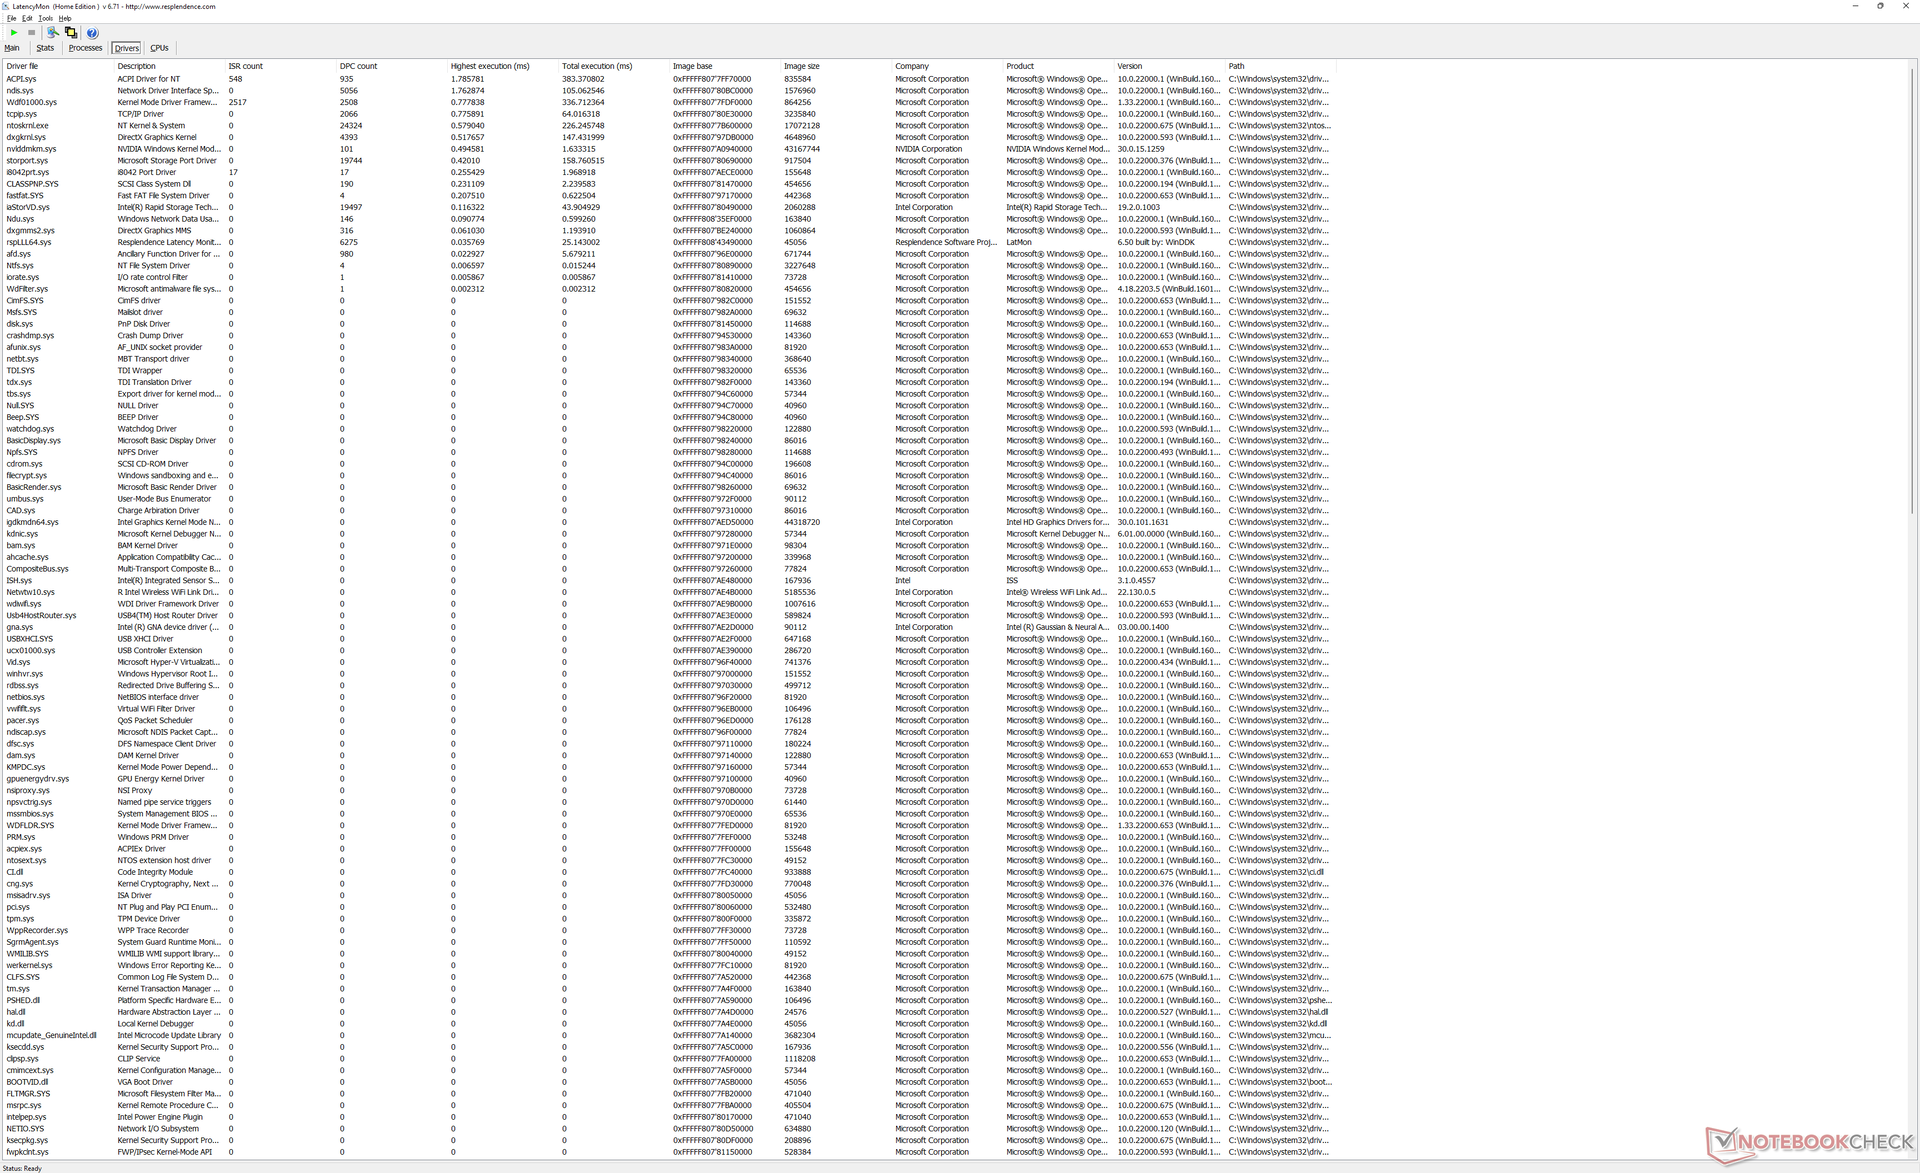
DPC-latenstid
LatencyMon avslöjar mindre DPC-problem när man öppnar flera webbläsarflikar på vår hemsida. uppspelning av 4K-video vid 60 FPS är annars smidig och med bara 3 tappade bilder under vårt minutlånga videotest.
| DPC Latencies / LatencyMon - interrupt to process latency (max), Web, Youtube, Prime95 | |
| Dell XPS 15 9500 Core i7 4K UHD | |
| Dell XPS 15 9510 11800H RTX 3050 Ti OLED | |
| Dell XPS 15 9520 RTX 3050 Ti | |
| MSI Stealth 15M A11SEK | |
| Asus Zenbook Pro 15 OLED UM535Q | |
* ... mindre är bättre
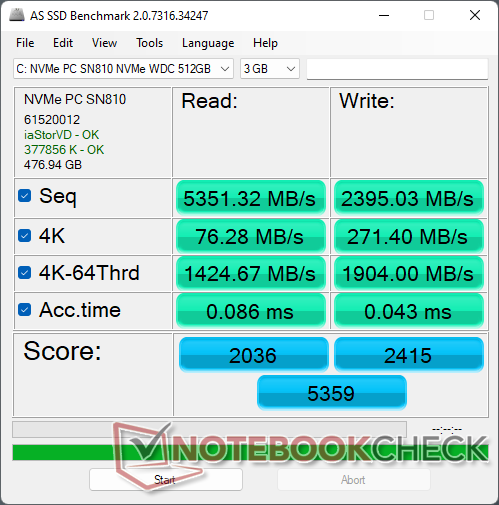
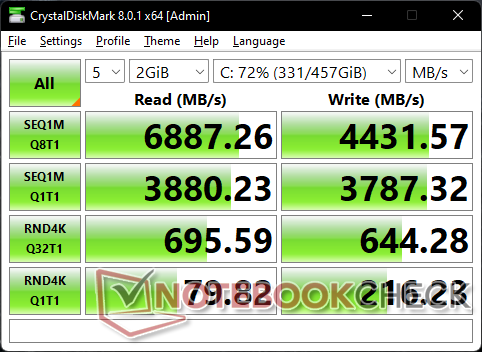
Lagringsenheter - Stödjer upp till två PCIe4 NVMe SSD-enheter
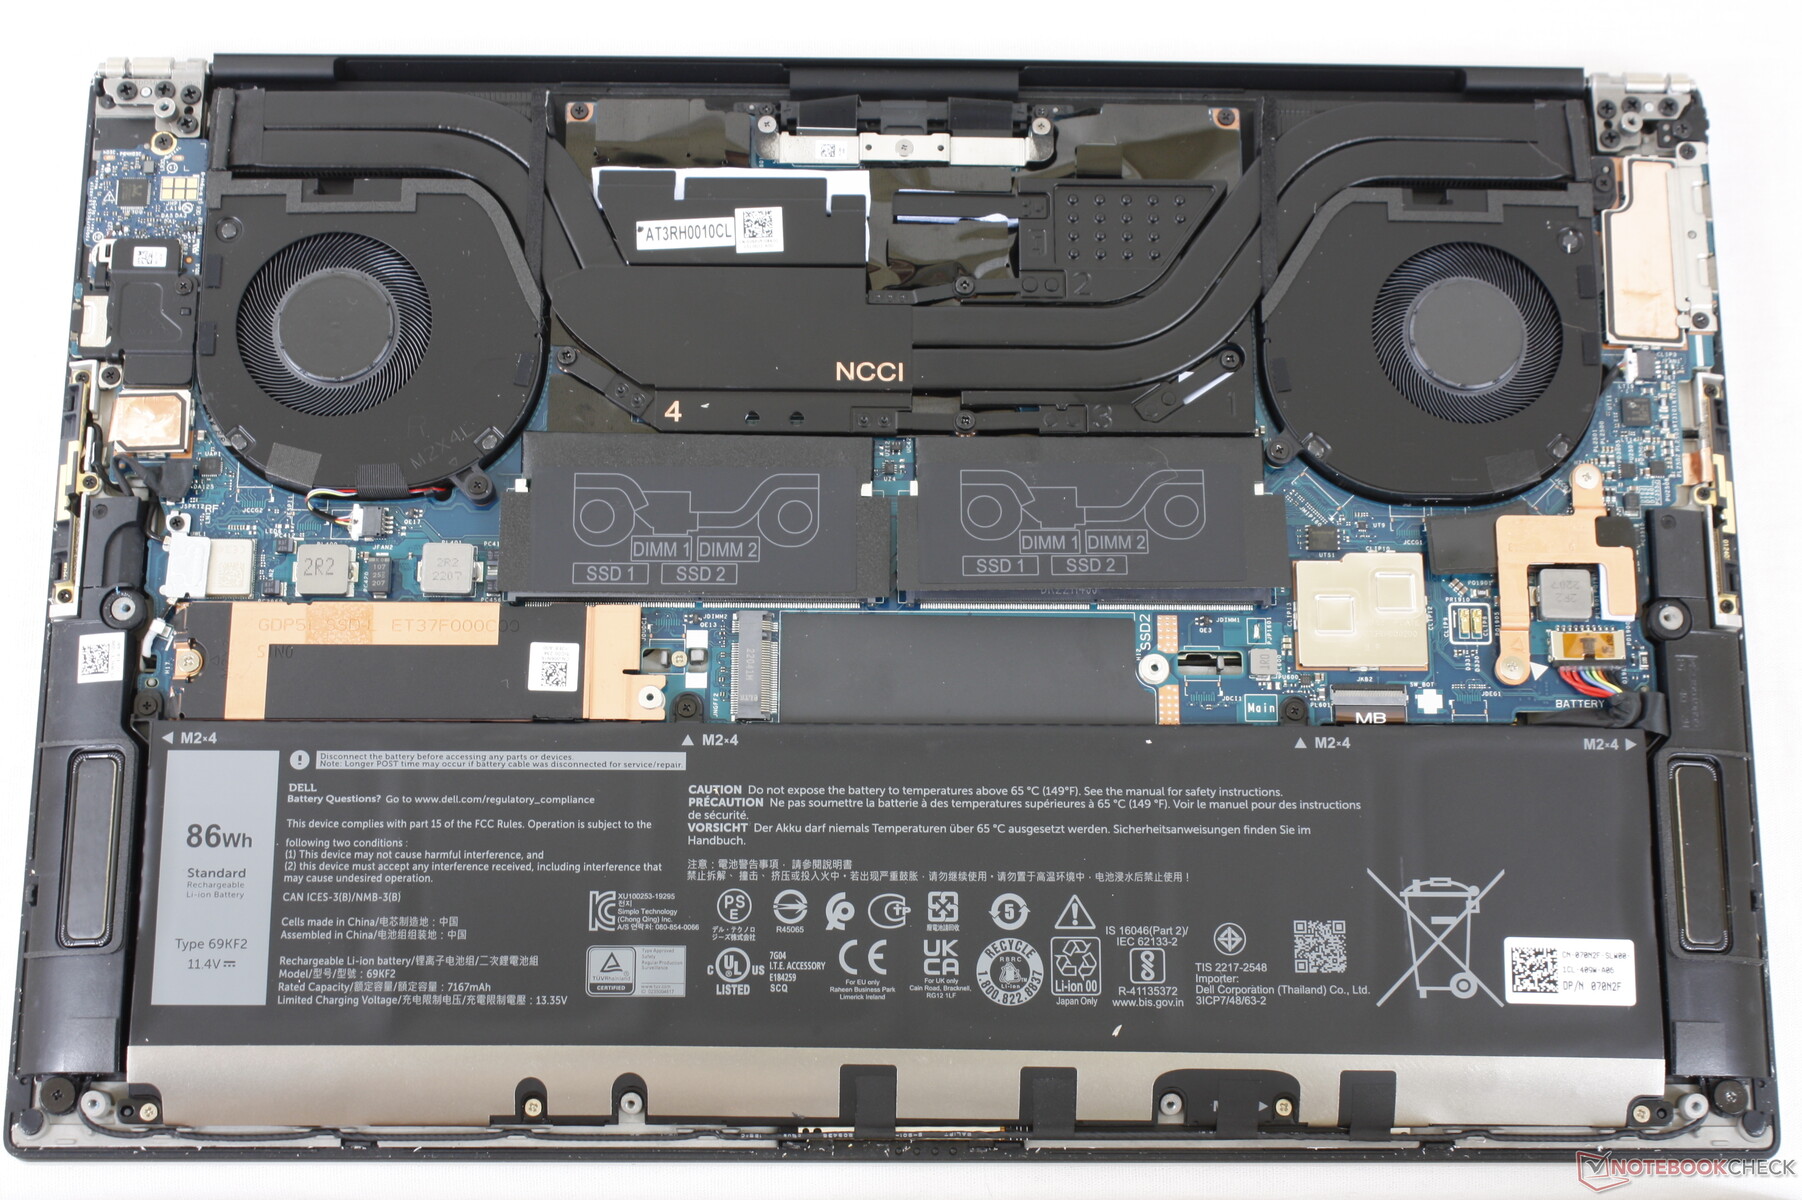
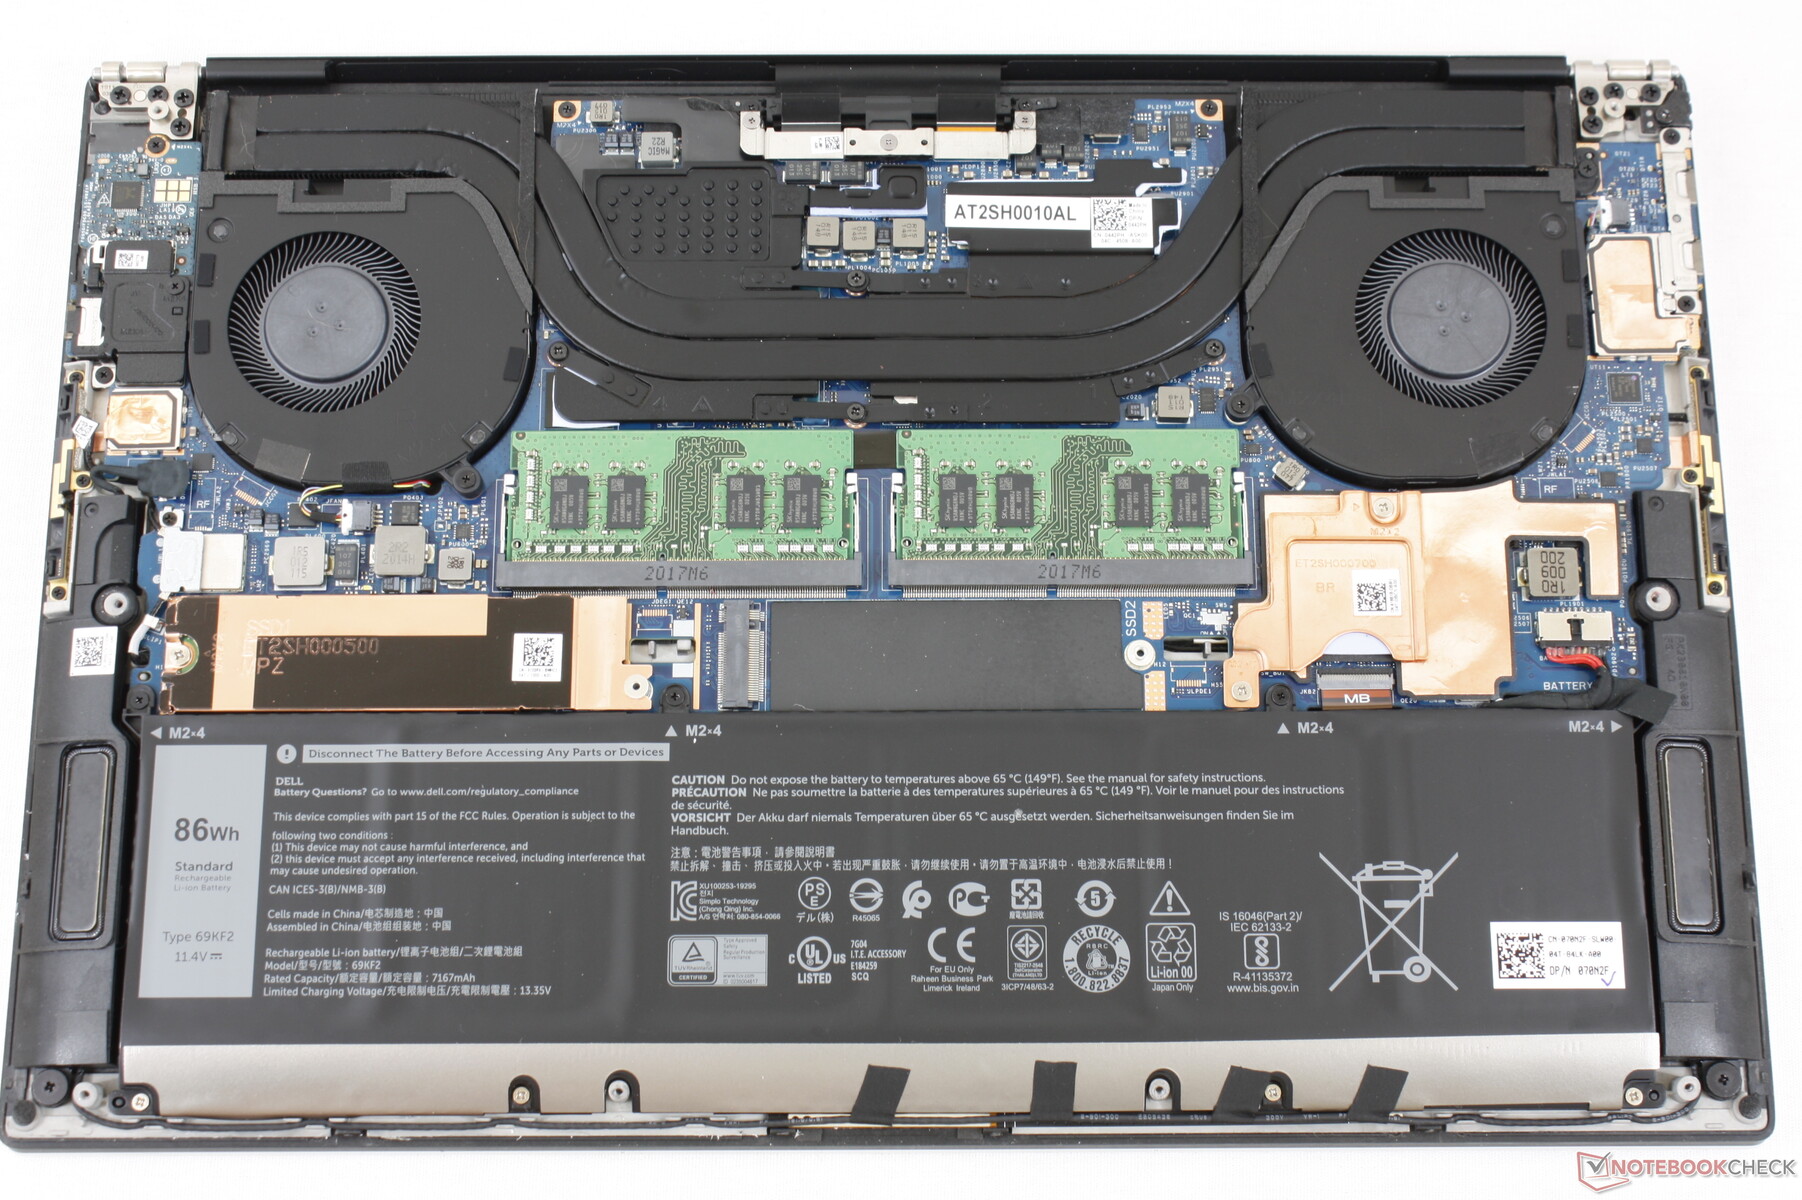
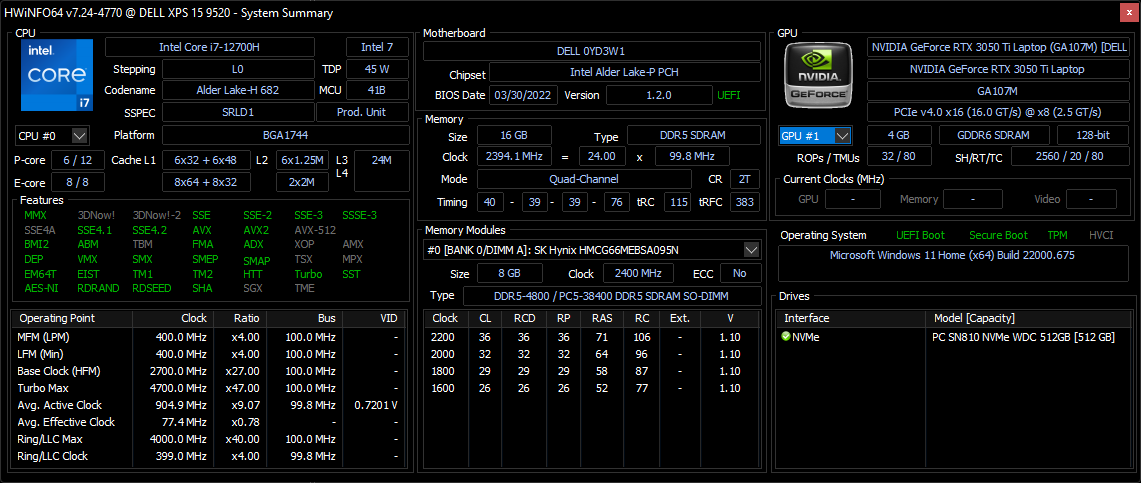
Vår testenhet levereras med en PCIe4 x4 Western Digital SN810 NVMe SSD till skillnad från PCIe3 x4-lösningarna på äldre modeller. Överföringshastigheterna är betydligt snabbare som ett resultat med upp till ~6700 MB/s eller mer än dubbelt så mycket som de flesta PCIe3-enheter. SN810 i vår enhet skulle inte ha några problem med att bibehålla sin maximala överföringshastighet under längre perioder när den stressades under DiskSpd, vilket tyder på utmärkt värmeavledning.

| Drive Performance rating - Percent | |
| Genomsnitt WDC PC SN810 512GB | |
| Dell XPS 15 9520 RTX 3050 Ti | |
| Asus Zenbook Pro 15 OLED UM535Q | |
| MSI Stealth 15M A11SEK | |
| Dell XPS 15 9500 Core i7 4K UHD | |
| Dell XPS 15 9510 11800H RTX 3050 Ti OLED | |
| HP Spectre X360 15-5ZV31AV -8! | |
* ... mindre är bättre
Disk Throttling: DiskSpd Read Loop, Queue Depth 8
GPU-prestanda - GeForce RTX 3050 Ti för andra året i rad
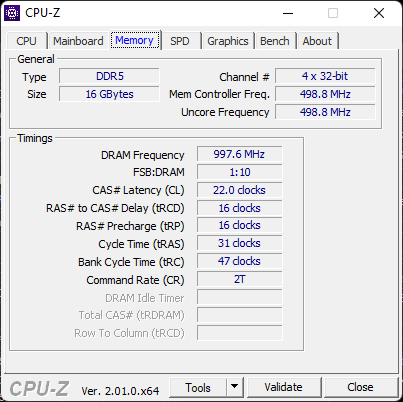
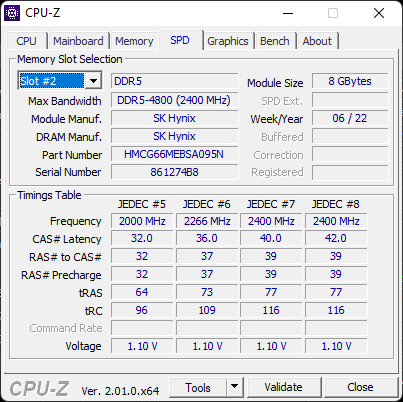
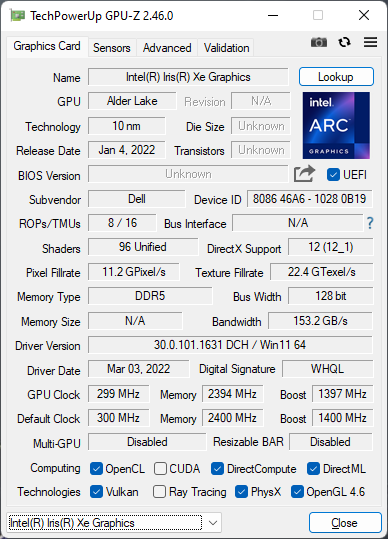
XPS 15 9520 har snabbare RAM-minne än XPS 15 9510 (DDR5-4800 mot DDR4-3200), vilket bör leda till något snabbare grafikprestanda. Tyvärr har Dell nedklockat GPU-klockfrekvensen från 1530 MHz på XPS 15 9510 till 1035 MHz på 9520, vilket gör att eventuella prestandavinster från det snabbare RAM-minnet har upphävts GeForce RTX 3050 Ti 3DMark-resultaten mellan XPS 15 9510 och 9520 är nästan identiska till följd av detta.
Grafikprestanda är fortfarande omkring 20 till 30 procent snabbare än GTX 1650 Ti på den äldre XPS 15 9500.
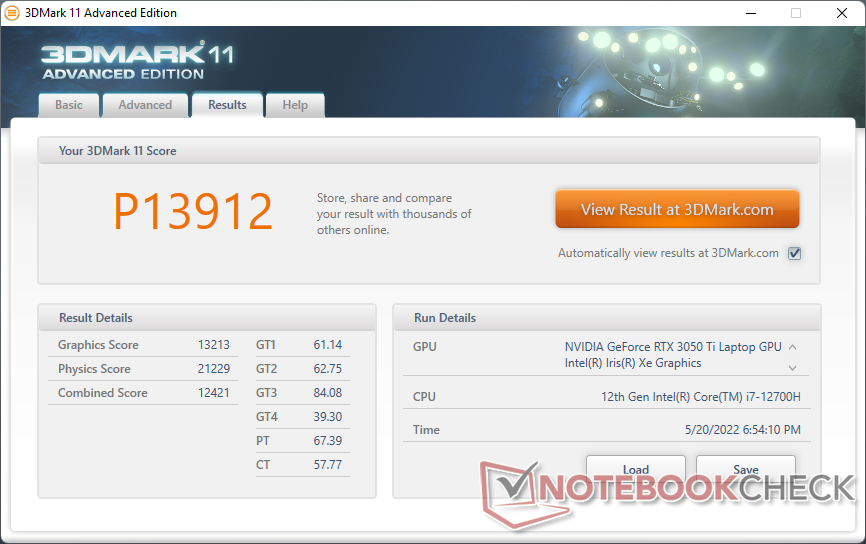
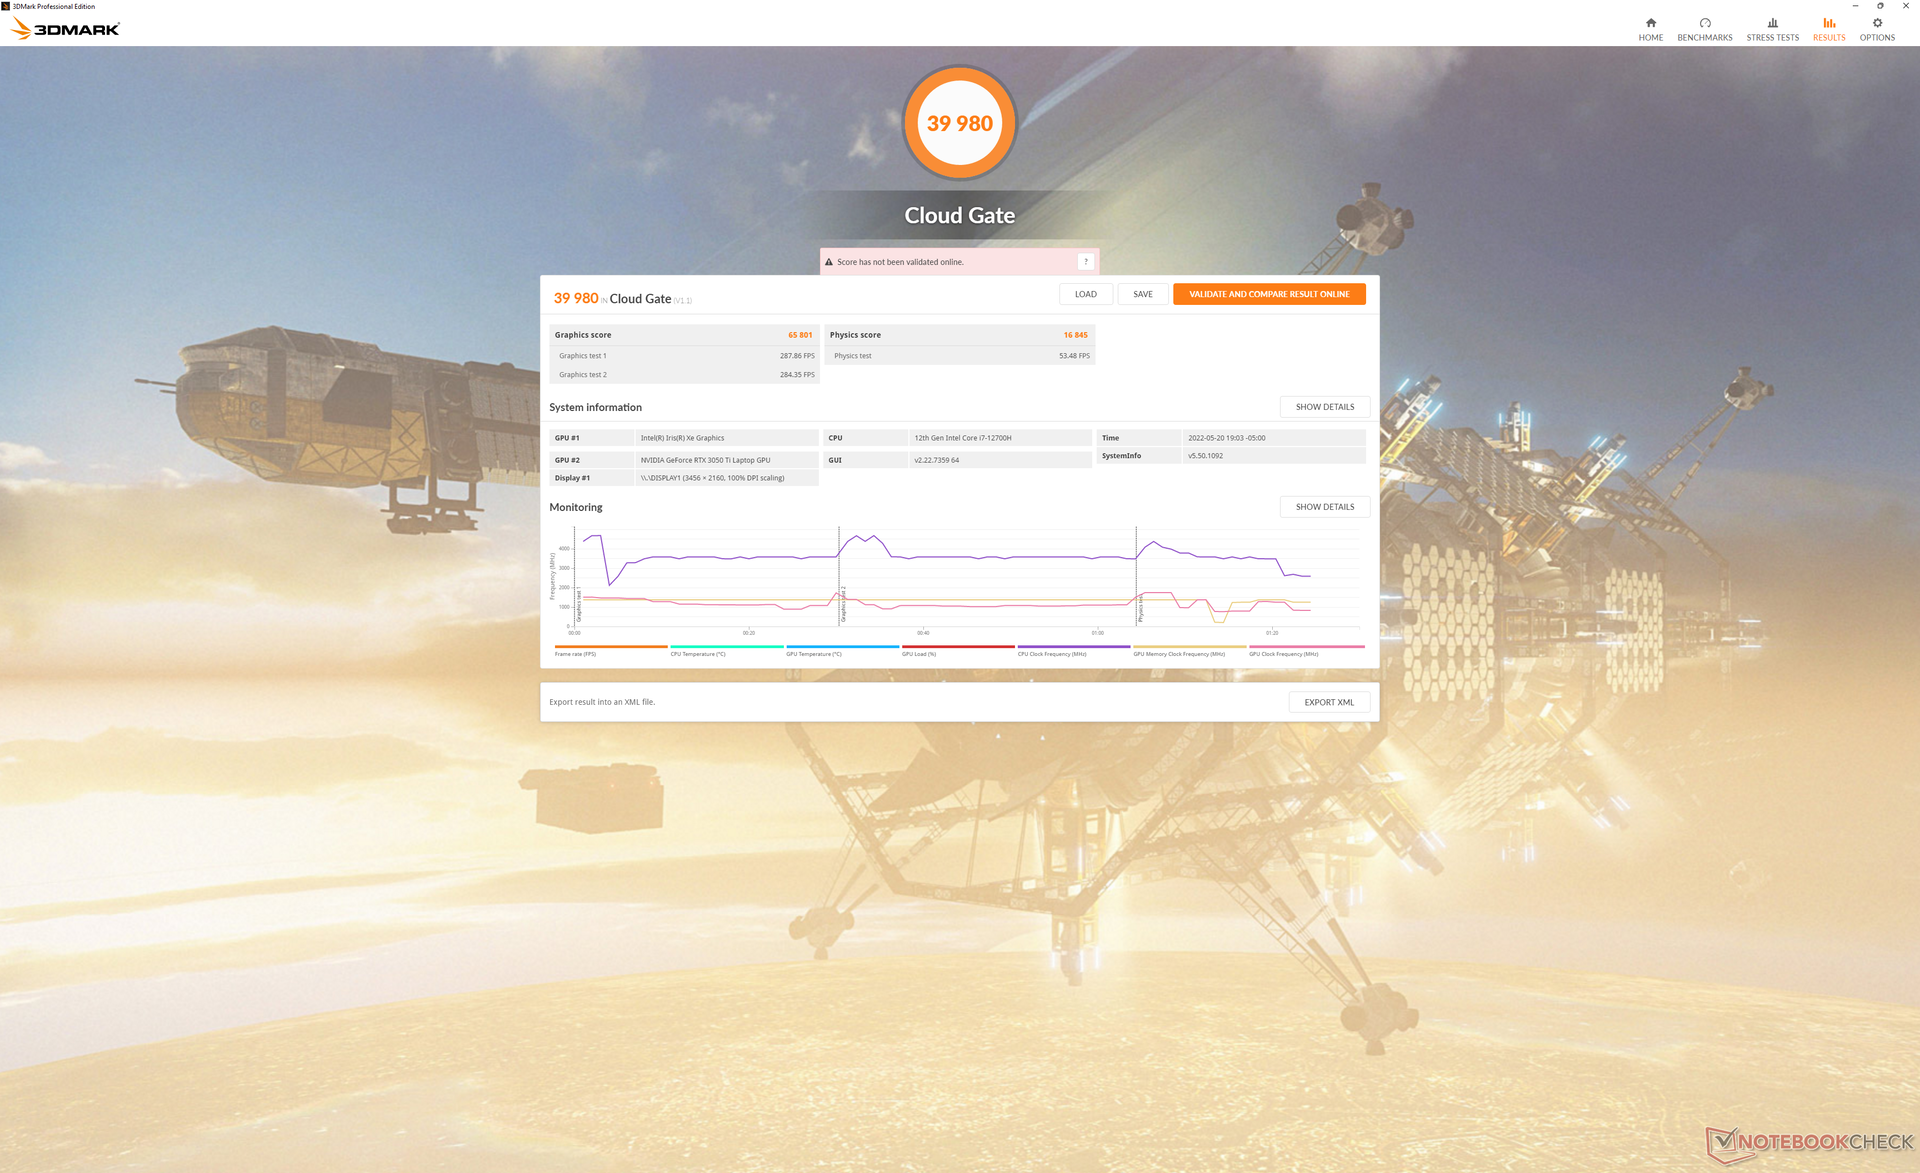
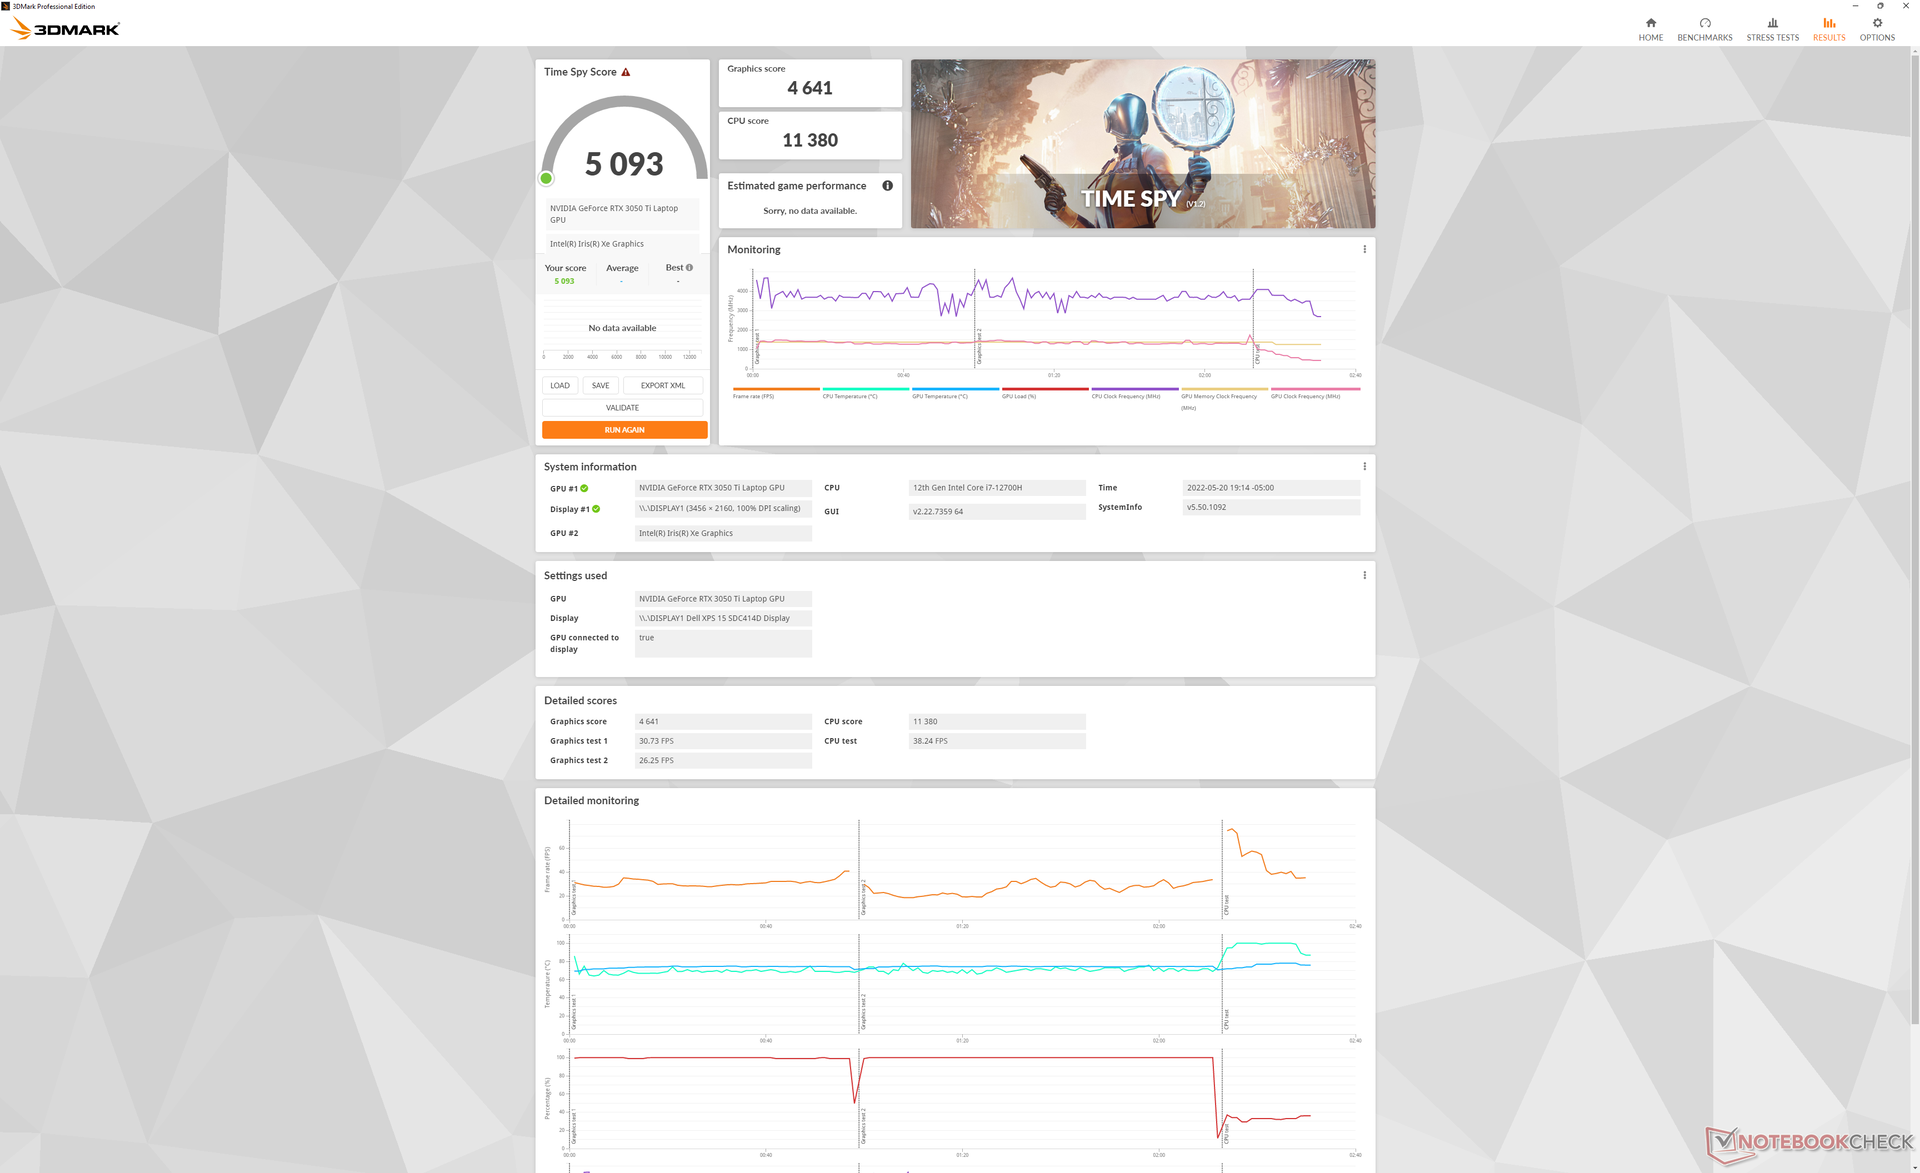
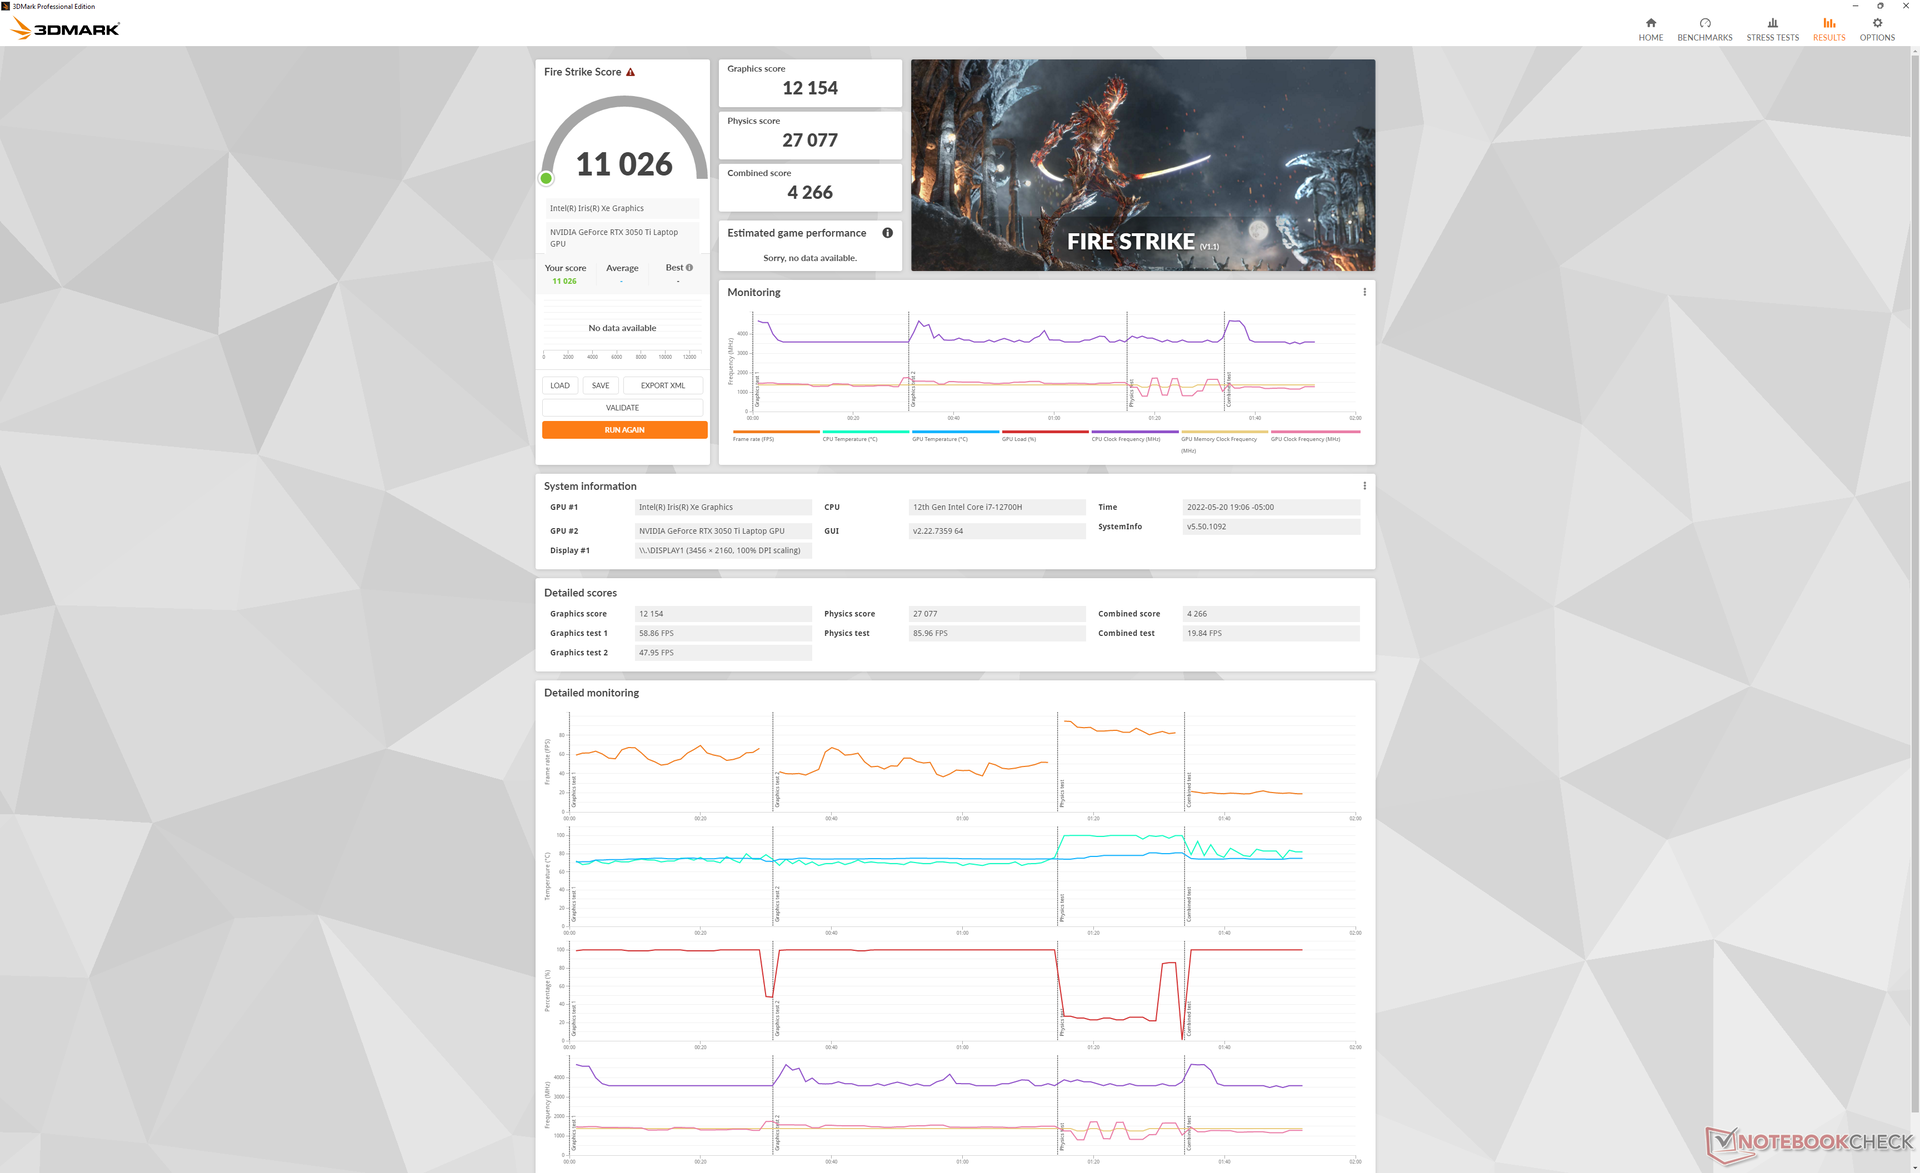
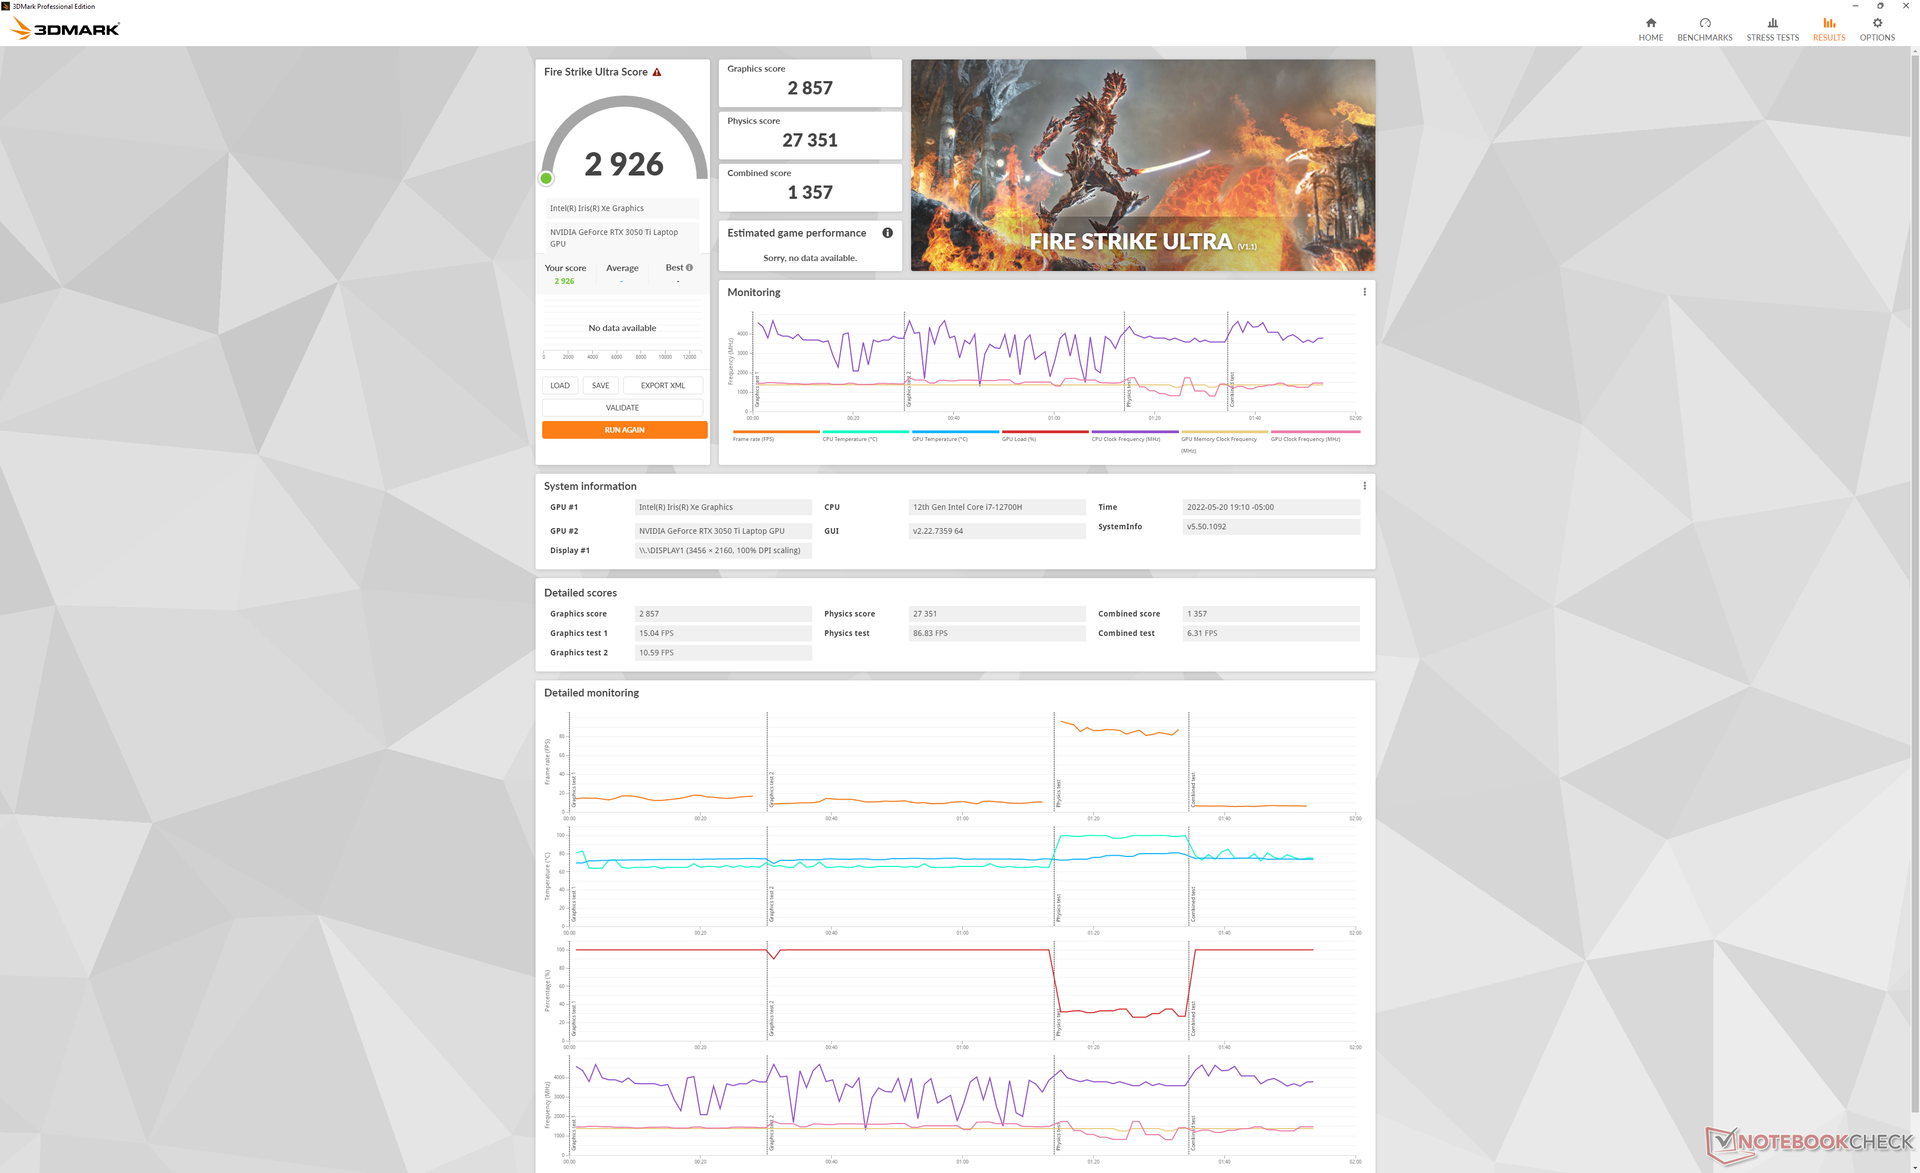
| 3DMark 11 Performance | 13912 poäng | |
| 3DMark Cloud Gate Standard Score | 39980 poäng | |
| 3DMark Fire Strike Score | 11026 poäng | |
| 3DMark Time Spy Score | 5093 poäng | |
Hjälp | ||
Witcher 3 FPS Chart
| låg | med. | hög | ultra | QHD | 4K | |
|---|---|---|---|---|---|---|
| GTA V (2015) | 185 | 181.3 | 90.3 | 49.9 | 37.4 | |
| The Witcher 3 (2015) | 226.5 | 127.1 | 62.4 | 34.2 | ||
| Dota 2 Reborn (2015) | 180.3 | 166.1 | 116.1 | 104.5 | 47.1 | |
| Final Fantasy XV Benchmark (2018) | 106.6 | 62.9 | 45.7 | 34.1 | ||
| X-Plane 11.11 (2018) | 137.6 | 117 | 100.6 | 73.7 | ||
| Strange Brigade (2018) | 206 | 109.6 | 91.1 | 79.4 | 60.4 | |
| Cyberpunk 2077 1.6 (2022) | 59.4 | 47.4 | 39.3 | 39.5 | 20.2 |
Utsläpp
Systembrus
Fläktljudet verkar vara tystare än på de äldre XPS-modellerna när de utsätts för liknande belastning. Eller så tar det åtminstone lite längre tid för fläktarna i 9520 att öka i varvtal när krävande belastningar introduceras. I slutet av den första 3DMark 06-jämförelsescenen skulle fläktljudet till exempel bara vara 31 dB(A) jämfört med 36 dB(A) och 46 dB(A) på XPS 15 9510 respektive 9500. Systemet är fortfarande tystare än förväntat under de flesta förhållanden även när det är inställt på Ultra Performance-läget.
Ljudnivå
| Låg belastning |
| 22.9 / 22.9 / 22.9 dB(A) |
| Hög belastning |
| 30.9 / 44.7 dB(A) |
 | ||
30 dB tyst 40 dB(A) hörbar 50 dB(A) högt ljud |
||
min: | ||
| Dell XPS 15 9520 RTX 3050 Ti GeForce RTX 3050 Ti Laptop GPU, i7-12700H, WDC PC SN810 512GB | Dell XPS 15 9510 11800H RTX 3050 Ti OLED GeForce RTX 3050 Ti Laptop GPU, i7-11800H, Micron 2300 512GB MTFDHBA512TDV | Dell XPS 15 9500 Core i7 4K UHD GeForce GTX 1650 Ti Mobile, i7-10875H, SK Hynix PC611 512GB | HP Spectre X360 15-5ZV31AV GeForce MX250, i7-10510U, Intel SSD 660p 2TB SSDPEKNW020T8 | Asus Zenbook Pro 15 OLED UM535Q GeForce RTX 3050 Ti Laptop GPU, R9 5900HX, WDC PC SN730 SDBPNTY-1T00 | MSI Stealth 15M A11SEK GeForce RTX 2060 Max-Q, i7-1185G7, WDC PC SN530 SDBPNPZ-1T00 | |
|---|---|---|---|---|---|---|
| Noise | -2% | -23% | -17% | -7% | -34% | |
| av / miljö * (dB) | 22.8 | 23.8 -4% | 28.4 -25% | 30.1 -32% | 22.8 -0% | 27.5 -21% |
| Idle Minimum * (dB) | 22.9 | 23.8 -4% | 28.4 -24% | 30.1 -31% | 22.9 -0% | 32.3 -41% |
| Idle Average * (dB) | 22.9 | 23.8 -4% | 28.4 -24% | 30.1 -31% | 22.9 -0% | 32.3 -41% |
| Idle Maximum * (dB) | 22.9 | 23.8 -4% | 28.4 -24% | 30.1 -31% | 22.9 -0% | 33.7 -47% |
| Load Average * (dB) | 30.9 | 36 -17% | 46 -49% | 30.1 3% | 33.2 -7% | 46.3 -50% |
| Witcher 3 ultra * (dB) | 37.8 | 36 5% | 42 -11% | 39.7 -5% | 47.3 -25% | 41.3 -9% |
| Load Maximum * (dB) | 44.7 | 38.2 15% | 47.1 -5% | 42 6% | 52.8 -18% | 56.2 -26% |
* ... mindre är bättre
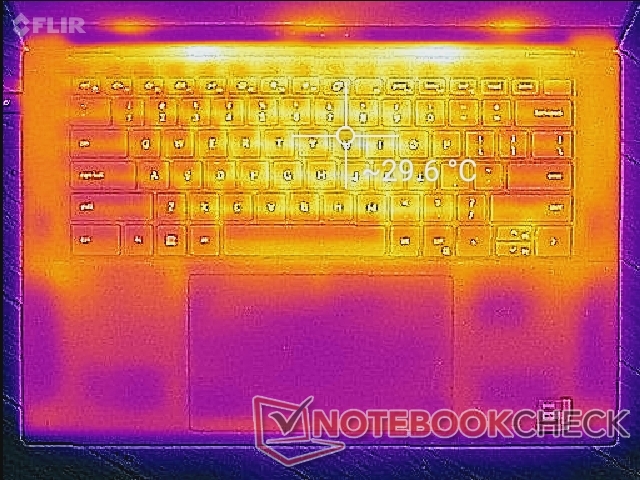
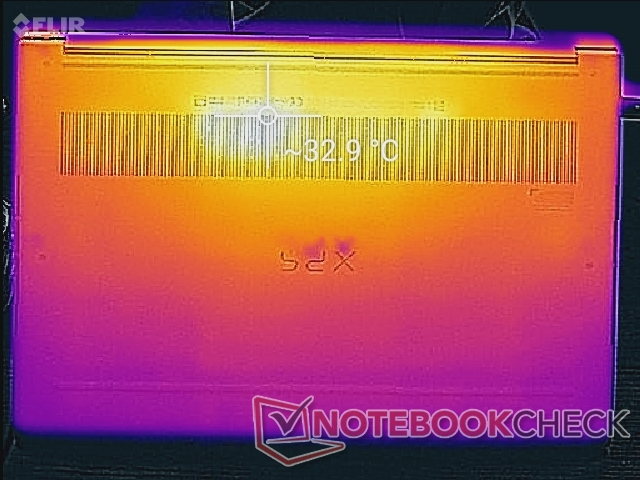
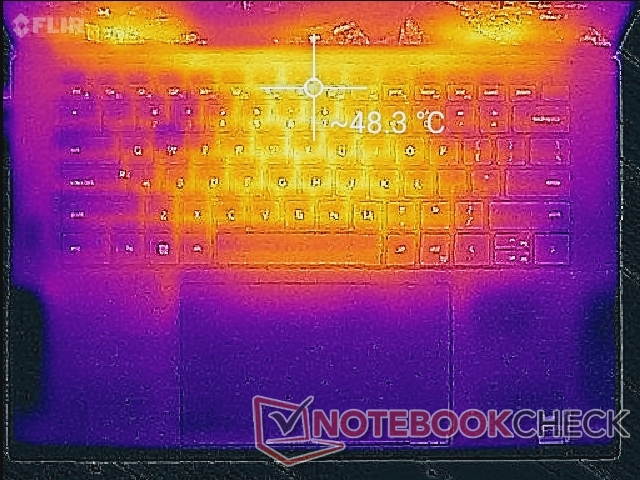
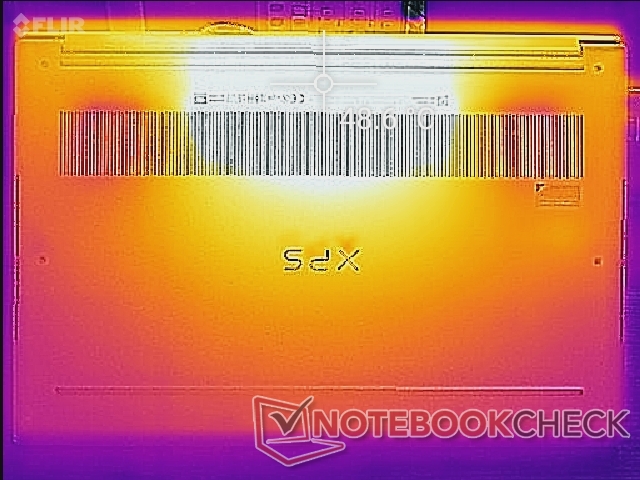
Temperatur - Något varmare totalt sett
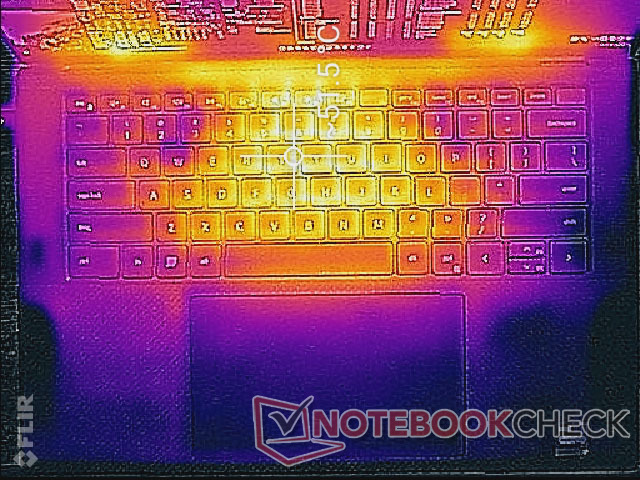
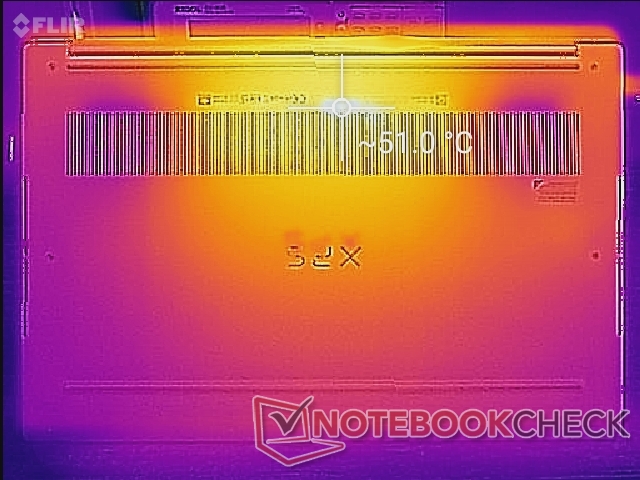
Yttemperaturerna under belastning är varmare än vad vi noterade på de äldre XPS 15 9510- och 9500-modellerna. Varma punkter kan nå 51 C till 52 C på ovansidan respektive undersidan, jämfört med 44 C till 47 C på var och en av de tidigare versionerna. Hot spots på konkurrenter som Zenbook Pro 15 OLED är svalare med några grader C under liknande förhållanden. XPS 9520 är trots allt en av de minsta bärbara 15,6-tumsdatorerna med Core H-drift på marknaden.
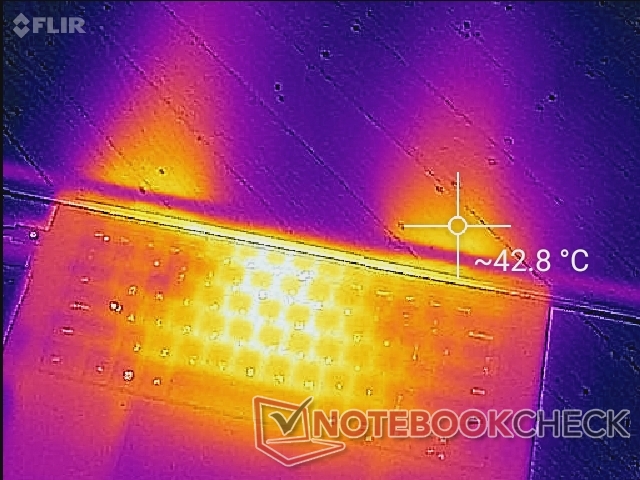
(-) Den maximala temperaturen på ovansidan är 51.4 °C / 125 F, jämfört med genomsnittet av 36.8 °C / 98 F , allt från 21 till 71 °C för klassen Multimedia.
(-) Botten värms upp till maximalt 51 °C / 124 F, jämfört med genomsnittet av 39.1 °C / 102 F
(+) Vid tomgångsbruk är medeltemperaturen för ovansidan 27.8 °C / 82 F, jämfört med enhetsgenomsnittet på 31.3 °C / ### class_avg_f### F.
(±) När du spelar The Witcher 3 är medeltemperaturen för ovansidan 35.2 °C / 95 F, jämfört med enhetsgenomsnittet på 31.3 °C / ## #class_avg_f### F.
(+) Handledsstöden och pekplattan är kallare än hudtemperaturen med maximalt 31.6 °C / 88.9 F och är därför svala att ta på.
(-) Medeltemperaturen för handledsstödsområdet på liknande enheter var 28.7 °C / 83.7 F (-2.9 °C / -5.2 F).
| Dell XPS 15 9520 RTX 3050 Ti Intel Core i7-12700H, NVIDIA GeForce RTX 3050 Ti Laptop GPU | Dell XPS 15 9510 11800H RTX 3050 Ti OLED Intel Core i7-11800H, NVIDIA GeForce RTX 3050 Ti Laptop GPU | Dell XPS 15 9500 Core i7 4K UHD Intel Core i7-10875H, NVIDIA GeForce GTX 1650 Ti Mobile | HP Spectre X360 15-5ZV31AV Intel Core i7-10510U, NVIDIA GeForce MX250 | Asus Zenbook Pro 15 OLED UM535Q AMD Ryzen 9 5900HX, NVIDIA GeForce RTX 3050 Ti Laptop GPU | MSI Stealth 15M A11SEK Intel Core i7-1185G7, NVIDIA GeForce RTX 2060 Max-Q | |
|---|---|---|---|---|---|---|
| Heat | 13% | 3% | 17% | -1% | 10% | |
| Maximum Upper Side * (°C) | 51.4 | 45.5 11% | 44 14% | 47 9% | 36 30% | 47.2 8% |
| Maximum Bottom * (°C) | 51 | 44.2 13% | 48.8 4% | 47.4 7% | 47.2 7% | 47.4 7% |
| Idle Upper Side * (°C) | 30 | 27 10% | 33 -10% | 22.8 24% | 37 -23% | 27.2 9% |
| Idle Bottom * (°C) | 33 | 26.7 19% | 32.4 2% | 23.6 28% | 39.2 -19% | 28.2 15% |
* ... mindre är bättre
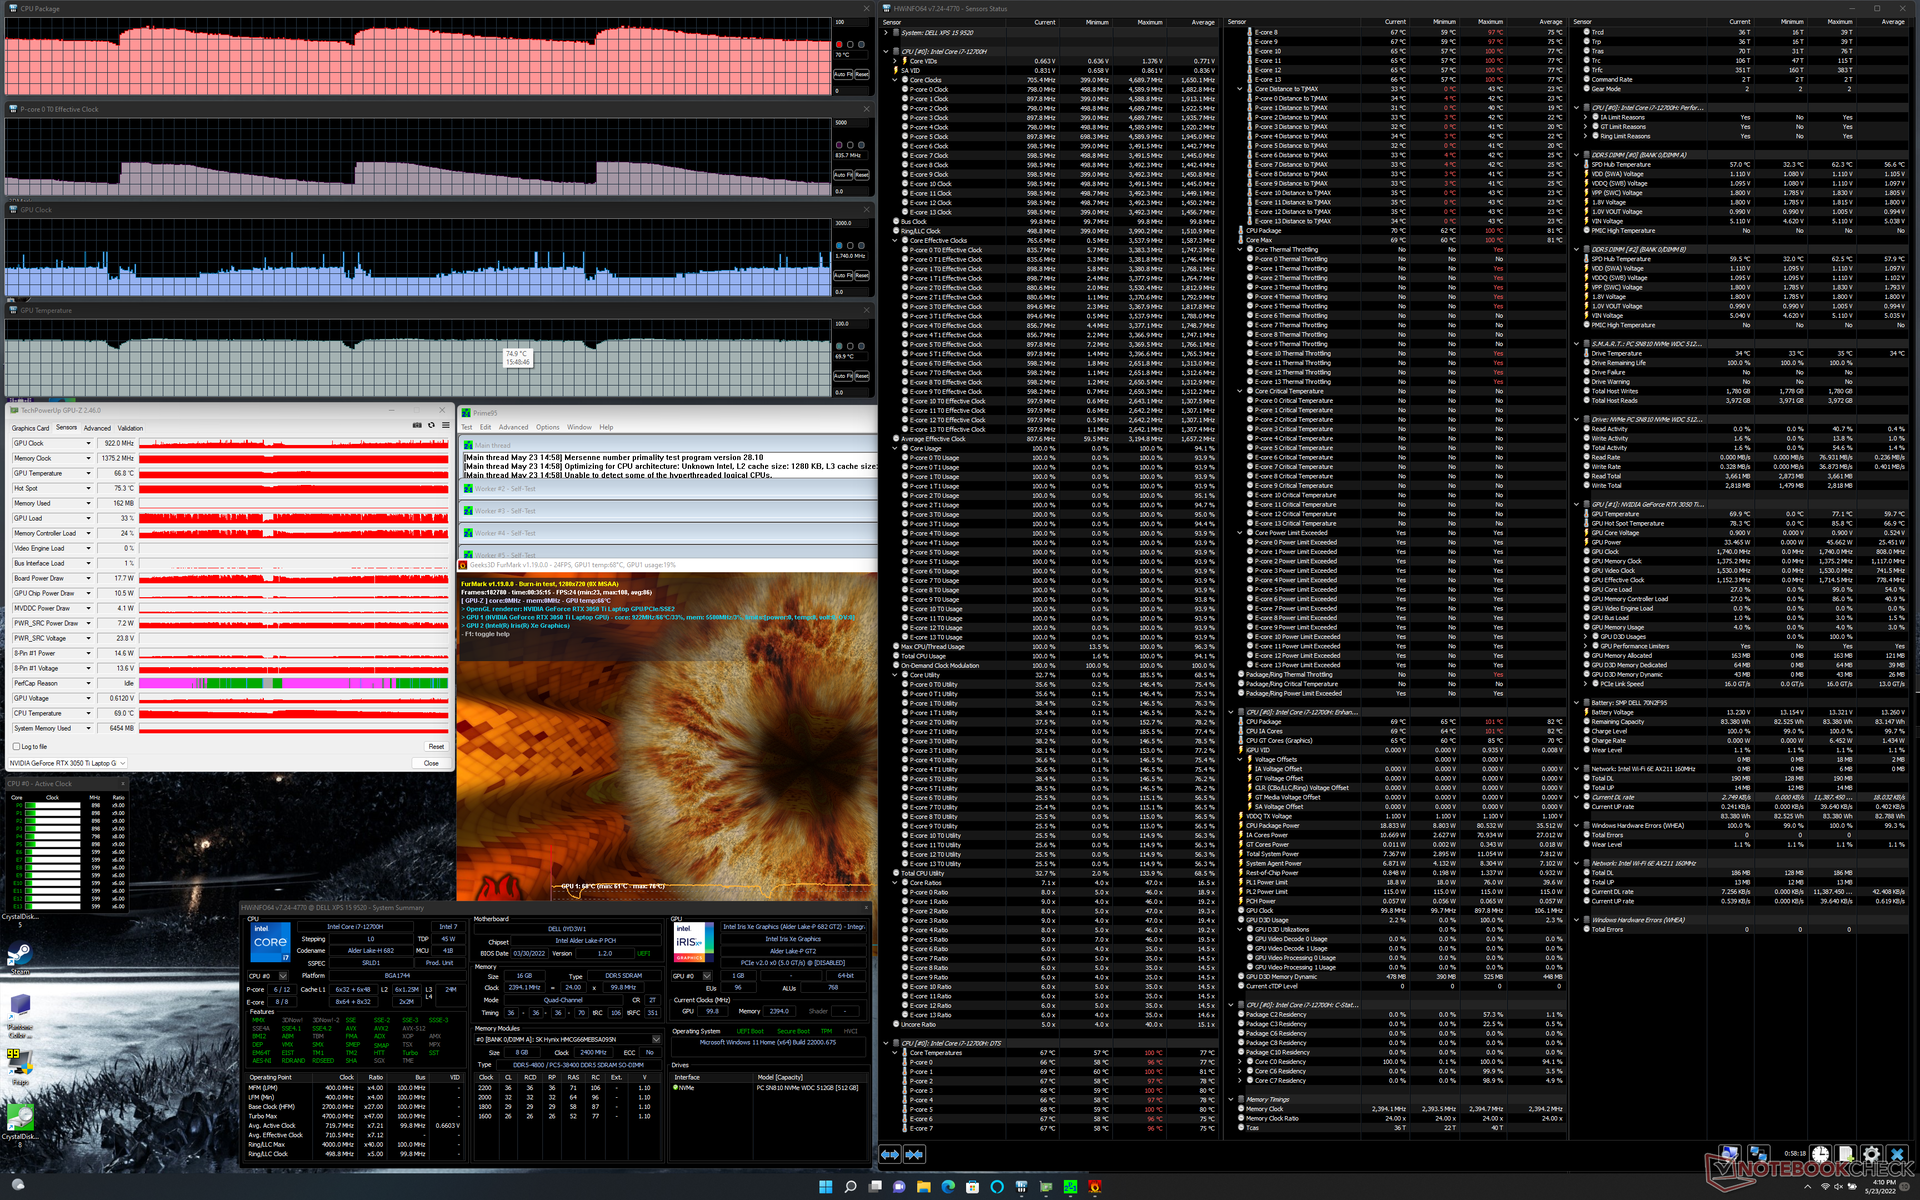
Stresstest
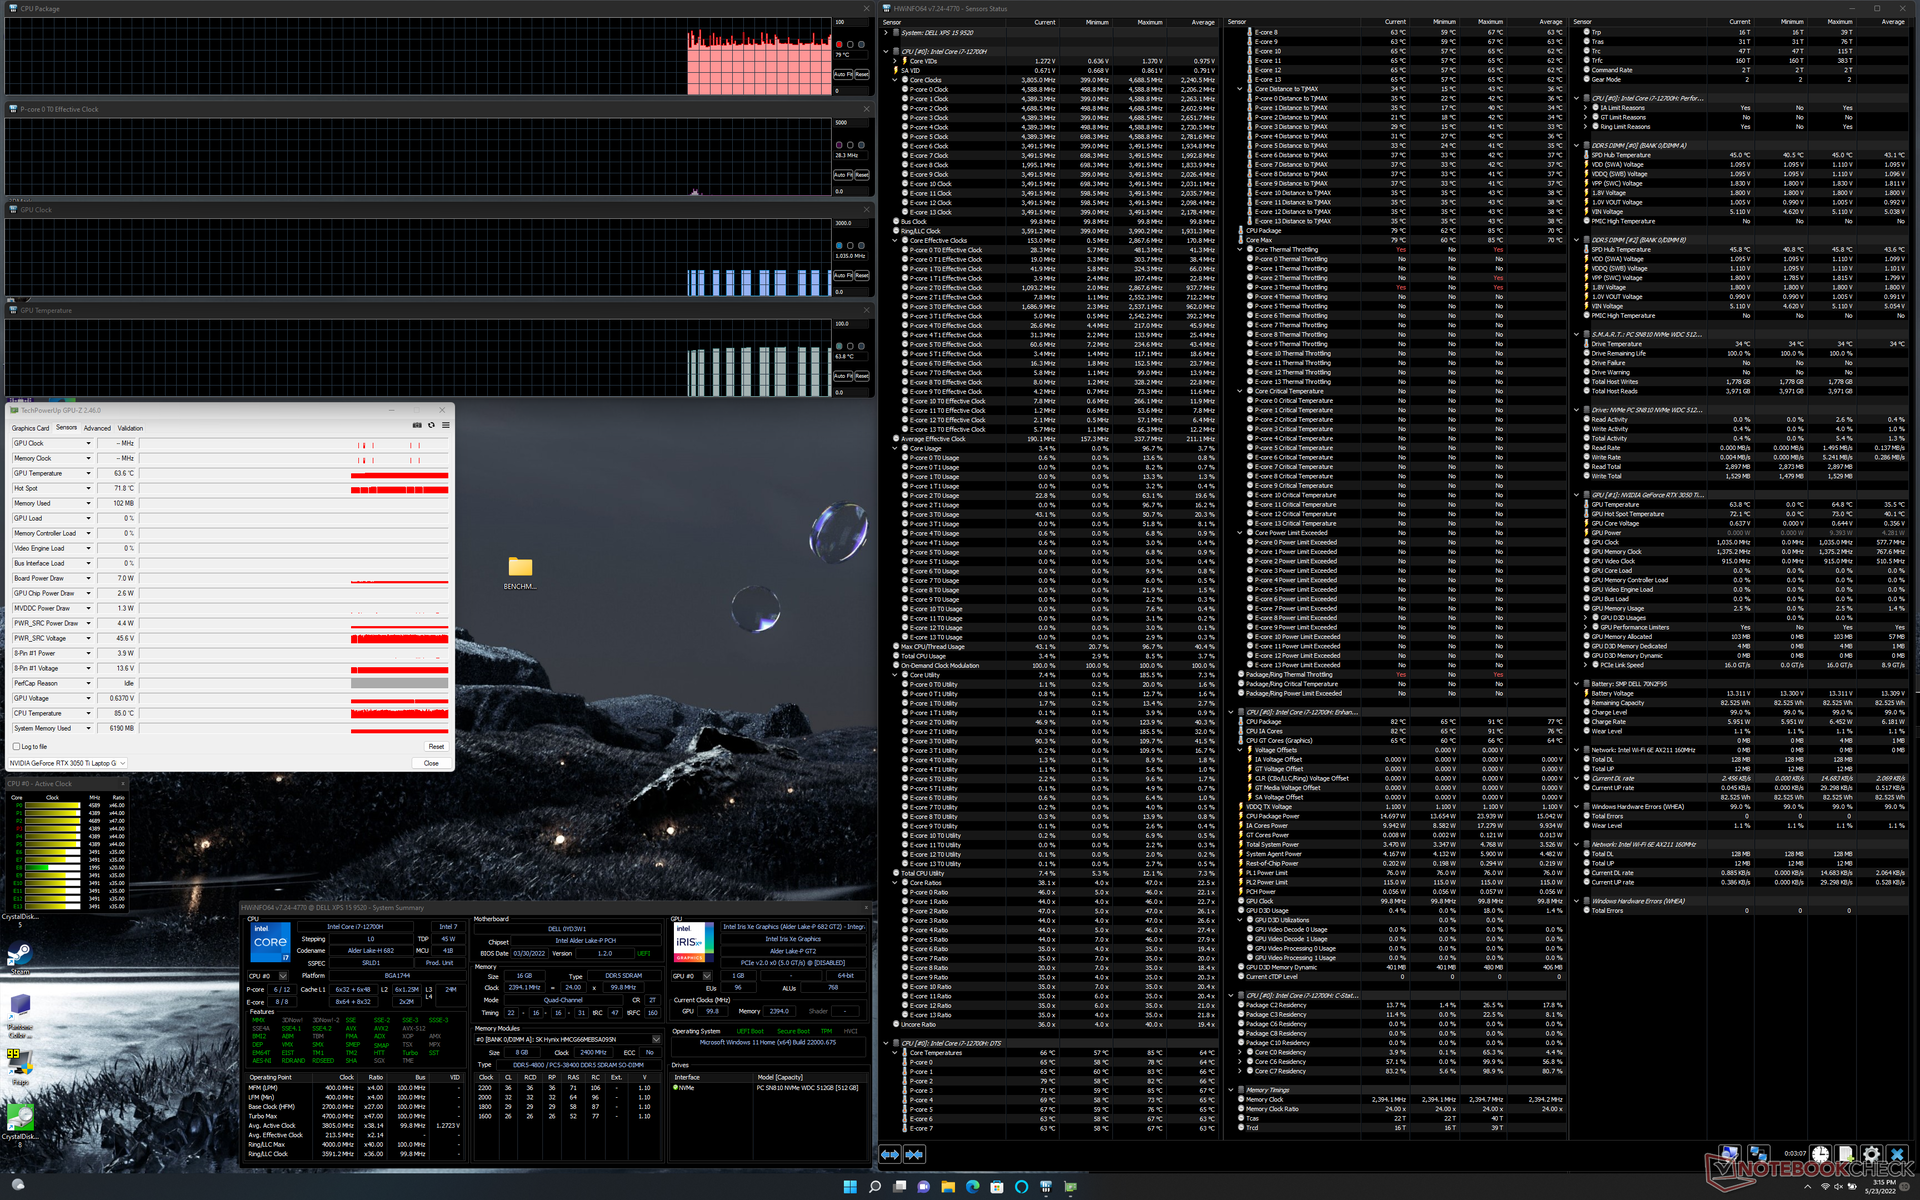
När processorn belastades med Prime95 ökade den till 81 W, 100 C och 3,3 GHz under de första 10 sekunderna eller så, innan den snabbt sjönk och stabiliserades på 45 W, 85 C och 2,5 GHz för att hålla temperaturen i schack. Att köra samma test på XPS 15 9500 skulle resultera i en stabil CPU-temperatur på 73 C i jämförelse. Det verkar alltså som om XPS 15 9520 körs varmare än sina föregångare för att få ut mer processorprestanda från samma övergripande chassidesign.
GPU:s klockfrekvens, strömförbrukning och temperatur skulle stabiliseras vid 1477 MHz, 46 W respektive 74 C när man kör Witcher 3 i läget Ultra Performance. Om systemet körs i optimerat läge skulle det resultera i något lägre klockfrekvenser och temperaturer, vilket framgår av tabellen nedan, samt en lägre strömförbrukning på 41 W. Användare måste köra systemet i Ultra Performance-läge om de vill få ut så mycket prestanda som möjligt från GPU:n. Att köra samma test på XPS 15 9500 med det långsammare GeForce GTX 1650 Ti skulle resultera i liknande CPU- och GPU-temperaturer.
Att köra på batteri begränsar prestandan. Ett Fire Strike -test på batterier skulle ge fysik- och grafikpoäng på 9450 respektive 8332 poäng, jämfört med 27077 respektive 12154 poäng när den är på strömförsörjning.
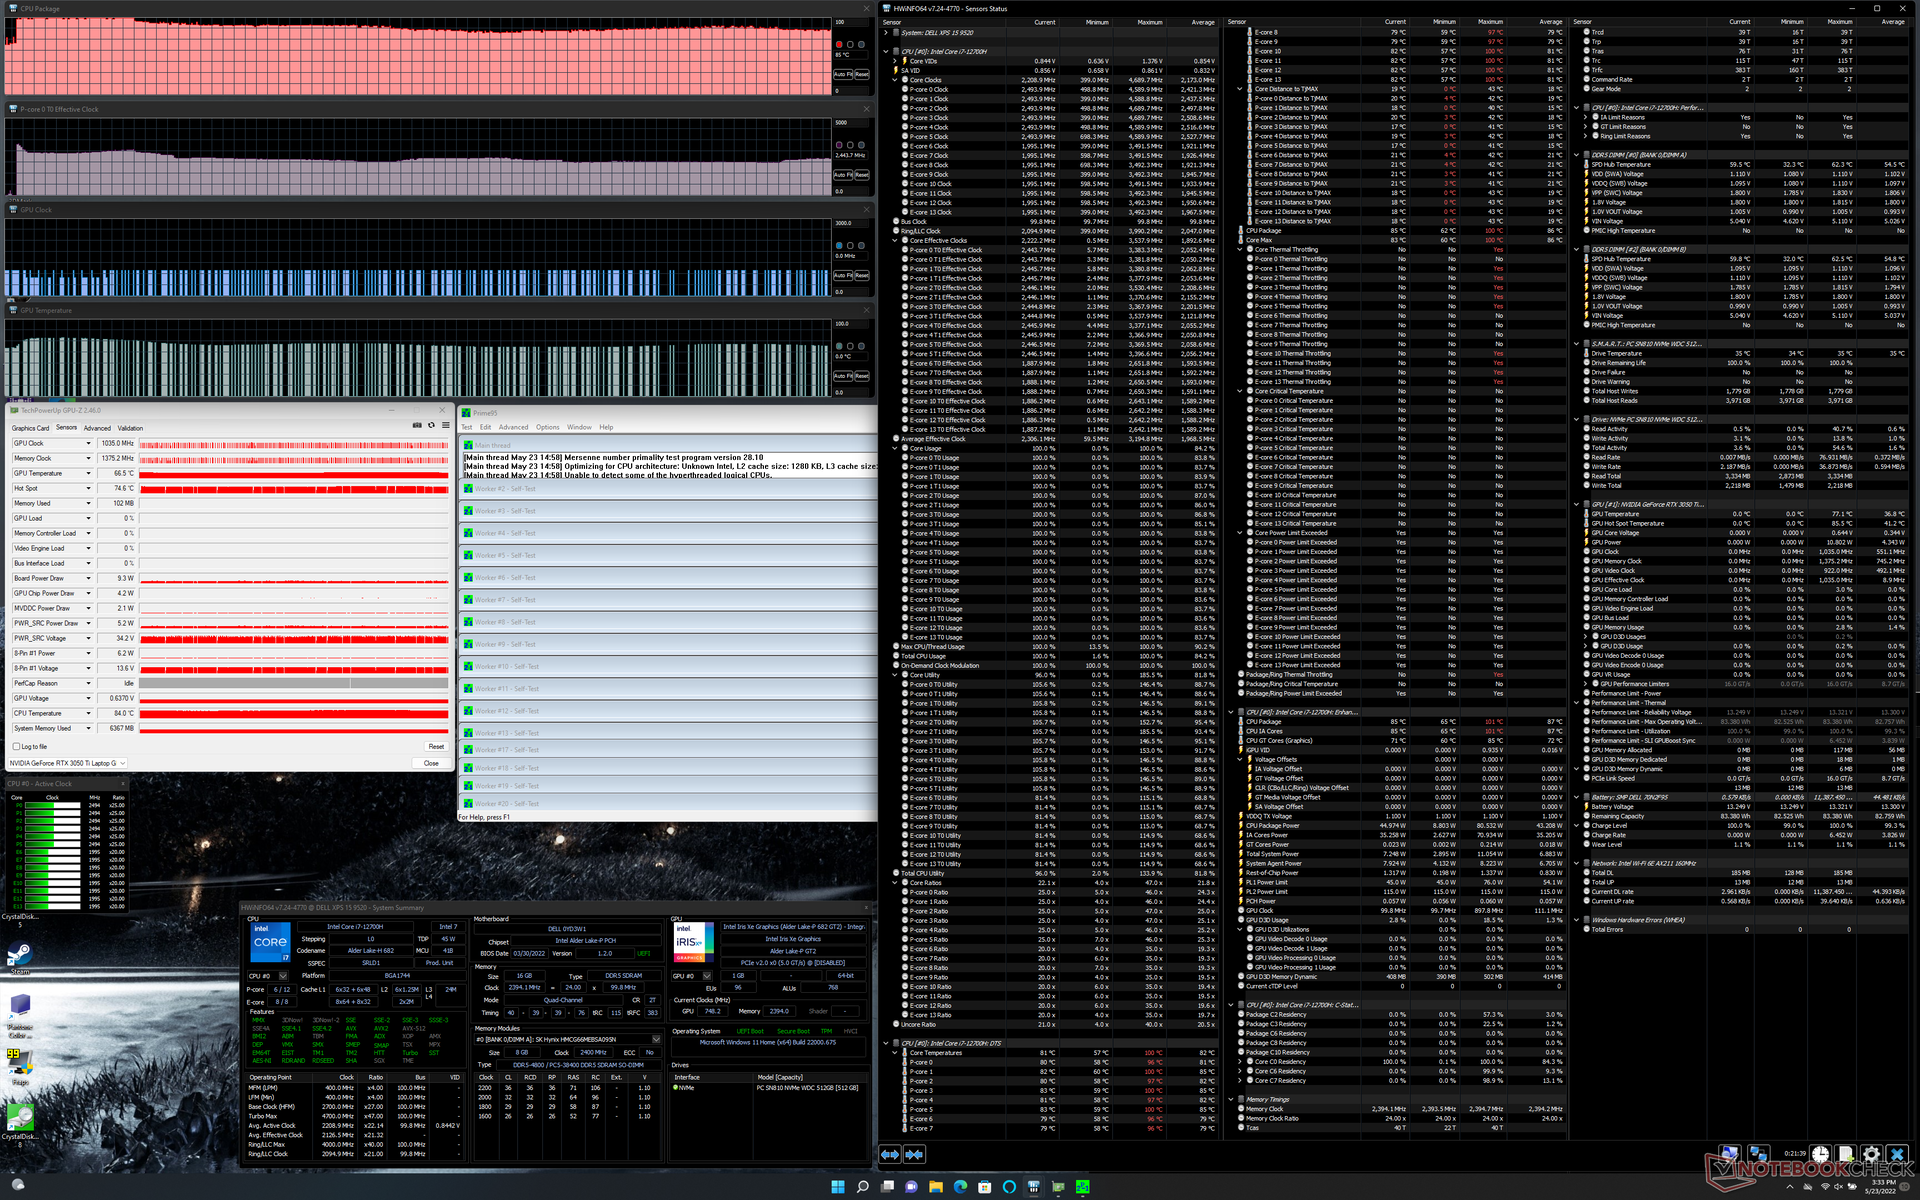
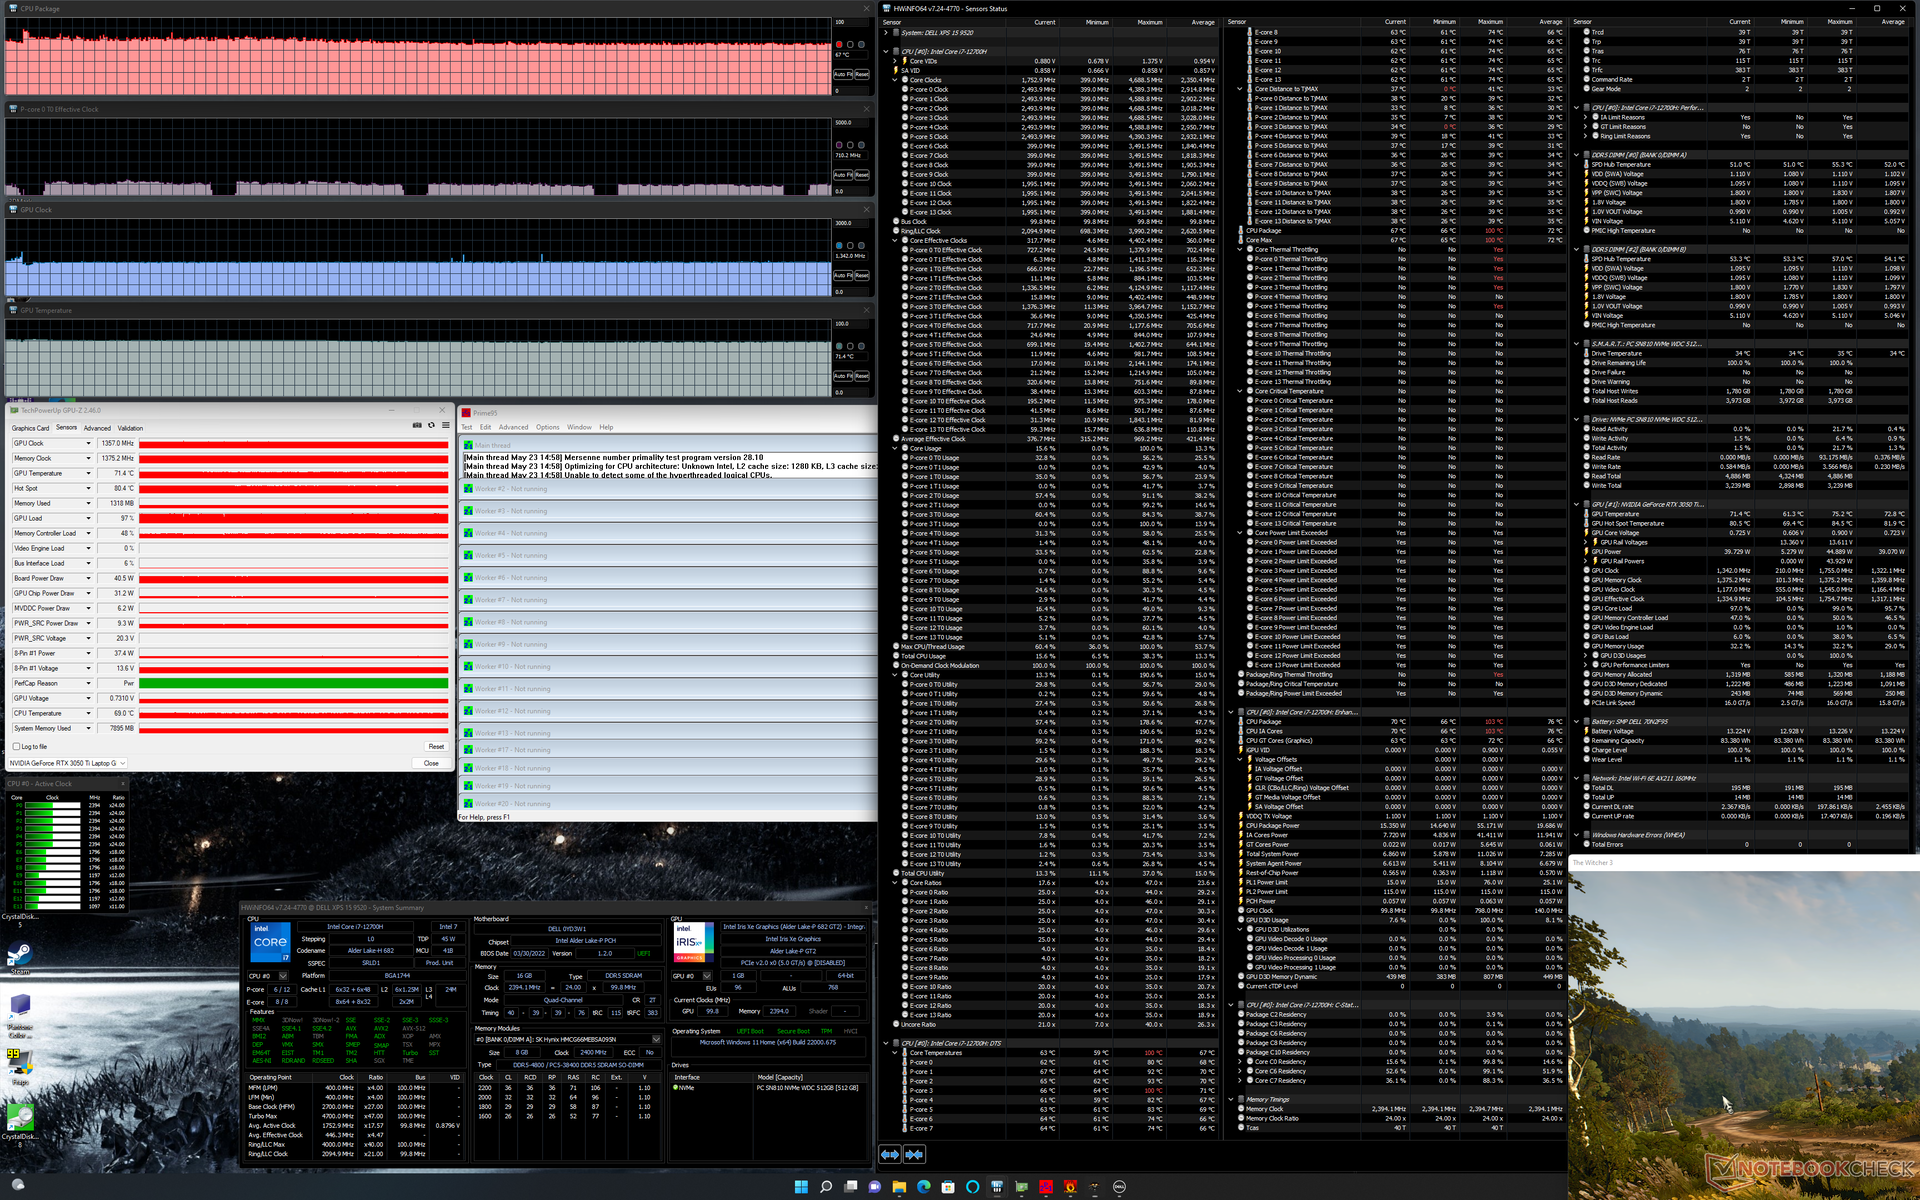
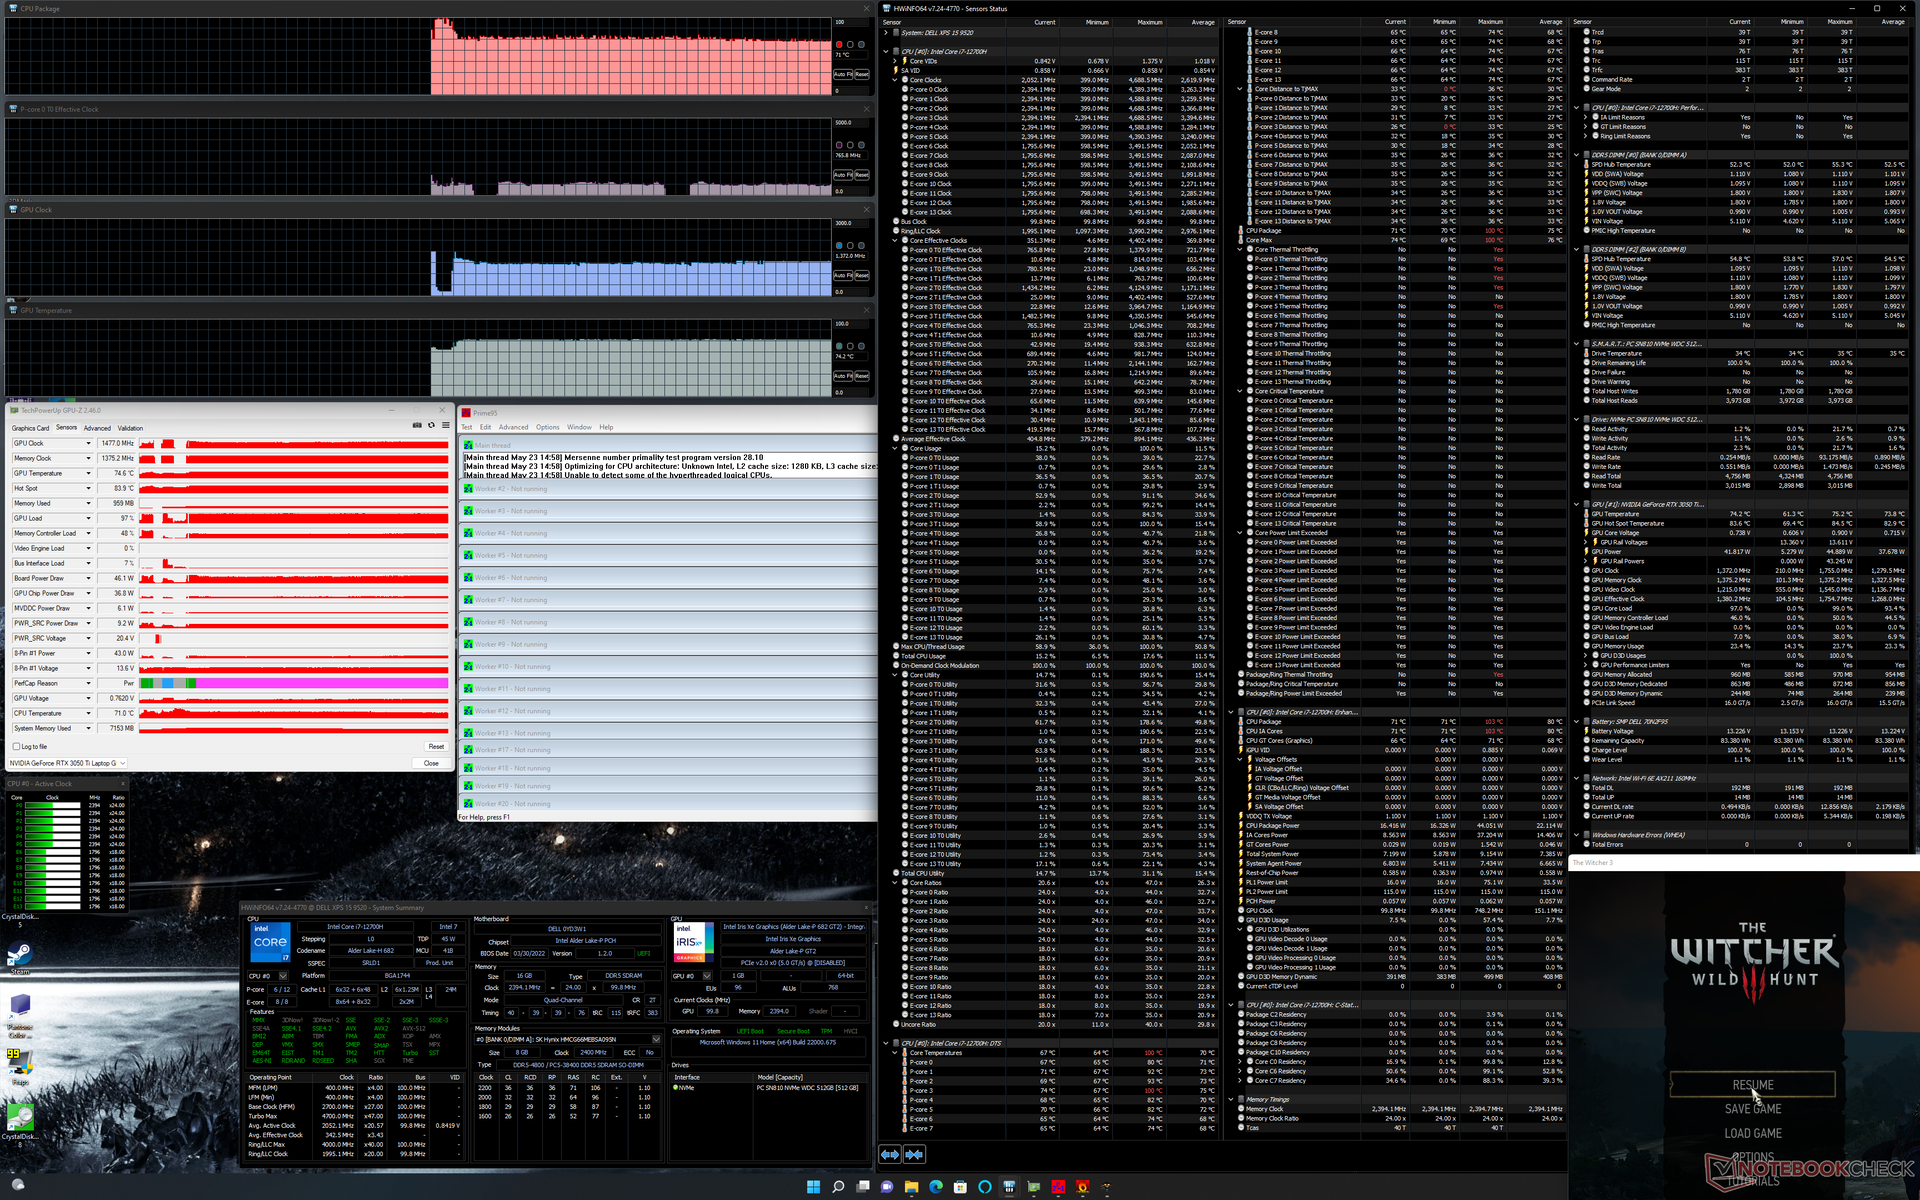
| CPU-klocka (GHz) | GPU-klocka (MHz) | Genomsnittlig CPU-temperatur (°C) | Genomsnittlig GPU-temperatur (°C) | |
| Systemets tomgång | -- | -- | 79 | 64 |
| Prime95 Stress | 2.4 | 85 | -- | 67 |
| Prime95 + FurMark Stress | 0,8 - 2,3 | 700 - 1100 | 79 - 86 | 62 - 75 |
| Witcher 3 Stress (balanserat läge) | 0,7 | 1357 | 67 | 71 |
| Witcher 3 Stress (prestationsläge) | 0,8 | 1477 | 71 | 74 |
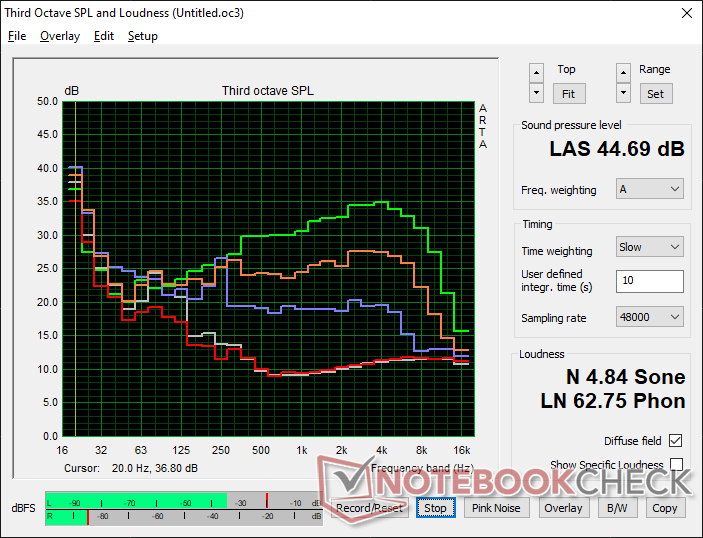
Högtalare
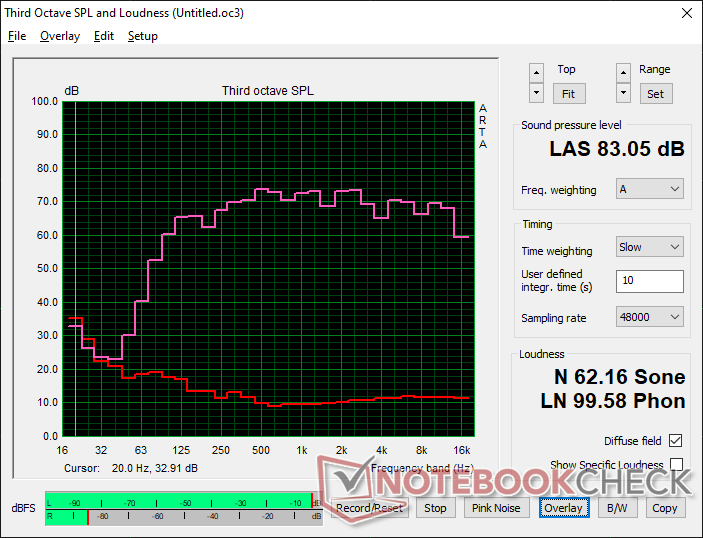
Dell XPS 15 9520 RTX 3050 Ti ljudanalys
(+) | högtalare kan spela relativt högt (83.1 dB)
Bas 100 - 315 Hz
(+) | bra bas - bara 4.4% från medianen
(+) | basen är linjär (6.8% delta till föregående frekvens)
Mellan 400 - 2000 Hz
(+) | balanserad mellan - endast 2.6% från medianen
(+) | mids är linjära (4.1% delta till föregående frekvens)
Högsta 2 - 16 kHz
(+) | balanserade toppar - endast 1.9% från medianen
(+) | toppar är linjära (5.4% delta till föregående frekvens)
Totalt 100 - 16 000 Hz
(+) | det totala ljudet är linjärt (6.4% skillnad mot median)
Jämfört med samma klass
» 4% av alla testade enheter i den här klassen var bättre, 1% liknande, 95% sämre
» Den bästa hade ett delta på 5%, genomsnittet var 17%, sämst var 45%
Jämfört med alla testade enheter
» 1% av alla testade enheter var bättre, 0% liknande, 99% sämre
» Den bästa hade ett delta på 4%, genomsnittet var 23%, sämst var 134%
Apple MacBook Pro 16 2021 M1 Pro ljudanalys
(+) | högtalare kan spela relativt högt (84.7 dB)
Bas 100 - 315 Hz
(+) | bra bas - bara 3.8% från medianen
(+) | basen är linjär (5.2% delta till föregående frekvens)
Mellan 400 - 2000 Hz
(+) | balanserad mellan - endast 1.3% från medianen
(+) | mids är linjära (2.1% delta till föregående frekvens)
Högsta 2 - 16 kHz
(+) | balanserade toppar - endast 1.9% från medianen
(+) | toppar är linjära (2.7% delta till föregående frekvens)
Totalt 100 - 16 000 Hz
(+) | det totala ljudet är linjärt (4.6% skillnad mot median)
Jämfört med samma klass
» 0% av alla testade enheter i den här klassen var bättre, 0% liknande, 100% sämre
» Den bästa hade ett delta på 5%, genomsnittet var 17%, sämst var 45%
Jämfört med alla testade enheter
» 0% av alla testade enheter var bättre, 0% liknande, 100% sämre
» Den bästa hade ett delta på 4%, genomsnittet var 23%, sämst var 134%
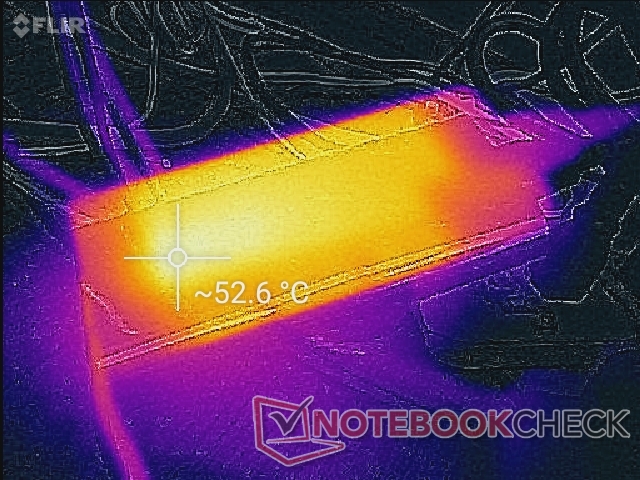
Energihantering - mer kraft
Effektförbrukning
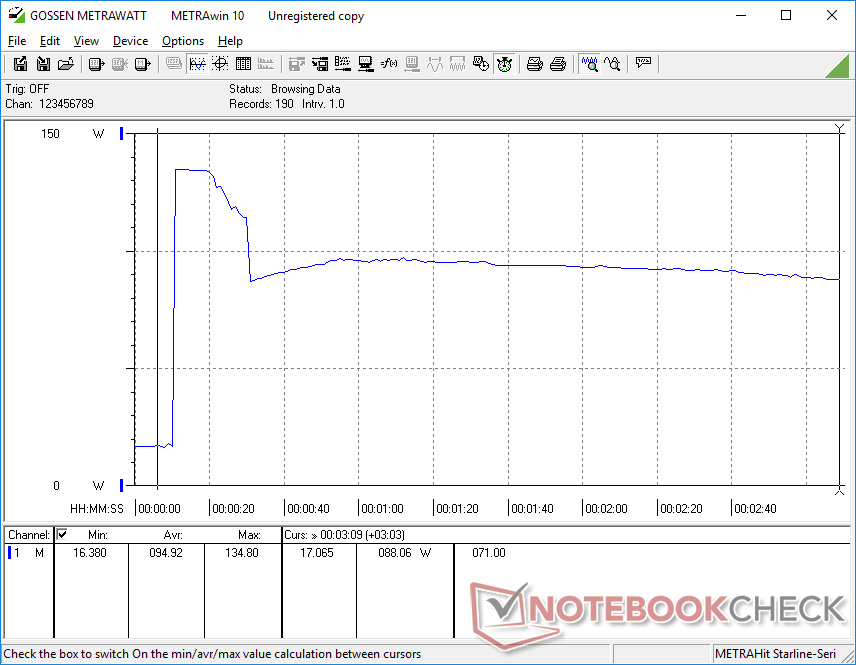
XPS 15 9500, 9510 och 9520 är de enda större bärbara datorerna på marknaden just nu med 130 W USB-C-adaptrar för att överträffa gränsen på 100 W USB-C Power Delivery som fastställts av USB-IF. Den högre overhead gör att batteriet kan fortsätta att laddas i hygglig takt även när man kör krävande belastningar som spel. Det är också värt att notera att vår testenhet inte skulle uppvisa några laddningsproblem som vi upplevde på XPS 17 9700.
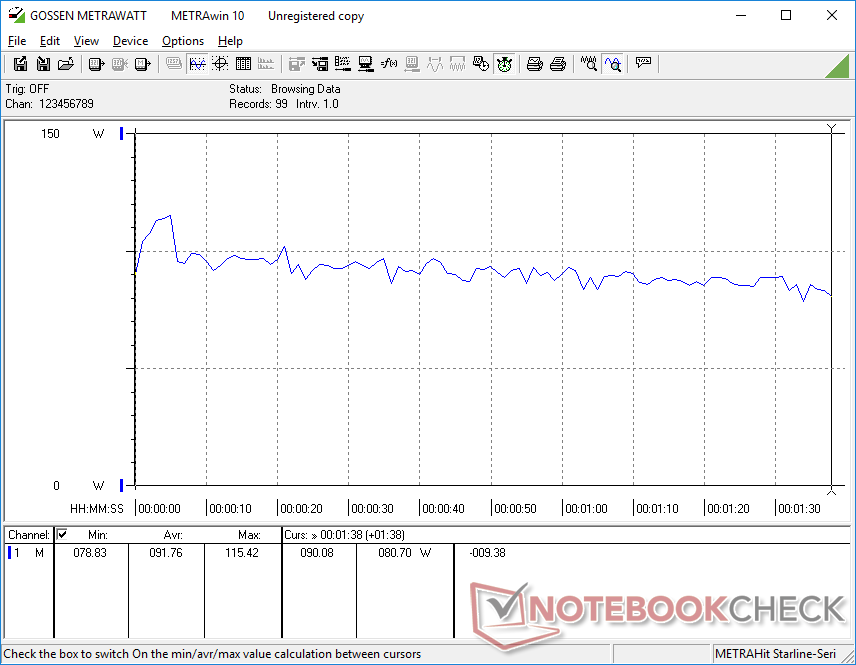
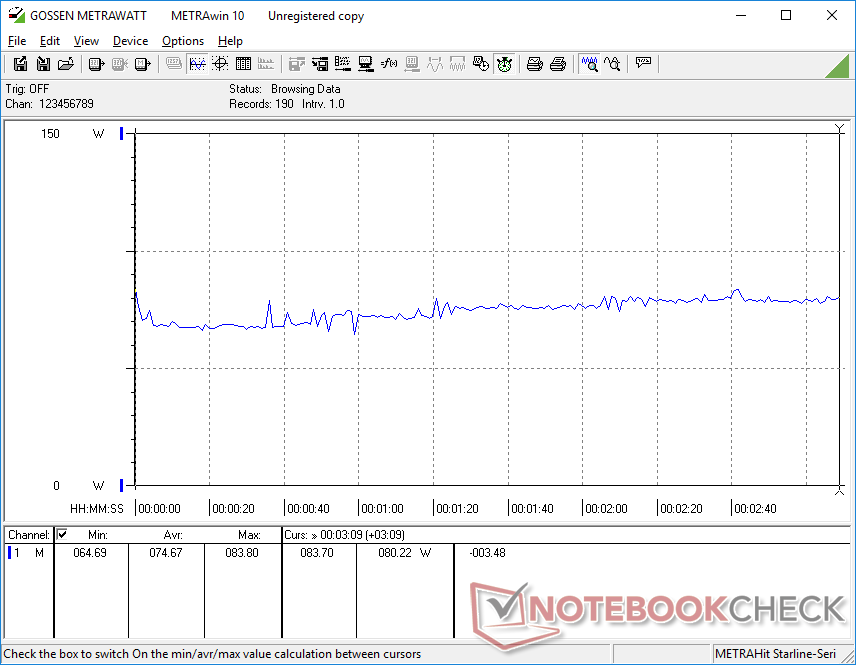
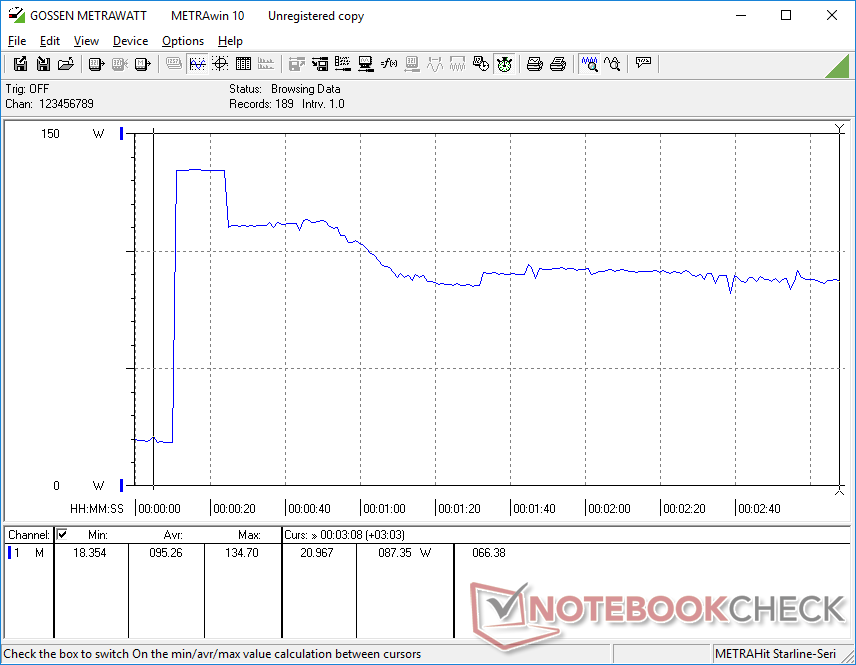
Körning av Witcher 3 förbrukar 75 W för att ligga nära vad vi registrerade på XPS 15 9510 eller konkurrerande AMD-drivna Zenbook Pro 15 OLED. Kanske mer intressant är att köra Prime95 som förbrukar 88 W jämfört med 65 W på den Core 7-11800H-drivna XPS 15 9510. Således har strömförbrukningen ökat med cirka 35 procent för den 35 till 42 procent årliga ökning av flertrådsprestanda som vi noterade ovan. Den generellt högre strömförbrukningen stämmer överens med vad vi observerar på Alder Lake-plattformen som helhet
Den lilla-medelstora (~14,3 x 6,6 x 2,3 cm) 130 W USB-C-växelströmsadaptern som levereras med XPS 15 9520 är identisk med den som levererades med XPS 9500 och 9510.
| Av/Standby | |
| Låg belastning | |
| Hög belastning |
|
Förklaring:
min: | |
| Dell XPS 15 9520 RTX 3050 Ti i7-12700H, GeForce RTX 3050 Ti Laptop GPU, WDC PC SN810 512GB, OLED, 3456x2160, 15.6" | Dell XPS 15 9510 11800H RTX 3050 Ti OLED i7-11800H, GeForce RTX 3050 Ti Laptop GPU, Micron 2300 512GB MTFDHBA512TDV, OLED, 3456x2160, 15.6" | Dell XPS 15 9500 Core i7 4K UHD i7-10875H, GeForce GTX 1650 Ti Mobile, SK Hynix PC611 512GB, IPS, 3840x2400, 15.6" | HP Spectre X360 15-5ZV31AV i7-10510U, GeForce MX250, Intel SSD 660p 2TB SSDPEKNW020T8, IPS, 3840x2160, 15.6" | Asus Zenbook Pro 15 OLED UM535Q R9 5900HX, GeForce RTX 3050 Ti Laptop GPU, WDC PC SN730 SDBPNTY-1T00, OLED, 1920x1080, 15.6" | MSI Stealth 15M A11SEK i7-1185G7, GeForce RTX 2060 Max-Q, WDC PC SN530 SDBPNPZ-1T00, IPS, 1920x1080, 15.6" | |
|---|---|---|---|---|---|---|
| Power Consumption | -5% | -27% | 20% | 5% | -25% | |
| Idle Minimum * (Watt) | 5.5 | 7.6 -38% | 5.7 -4% | 5.2 5% | 5.5 -0% | 7.3 -33% |
| Idle Average * (Watt) | 7.2 | 9.9 -38% | 13.5 -88% | 8.5 -18% | 7.4 -3% | 10.1 -40% |
| Idle Maximum * (Watt) | 16 | 10.8 32% | 19.6 -23% | 8.7 46% | 14.9 7% | 17.6 -10% |
| Load Average * (Watt) | 91.8 | 81 12% | 114.1 -24% | 65.6 29% | 78.2 15% | 106.6 -16% |
| Witcher 3 ultra * (Watt) | 74.6 | 76.2 -2% | 93 -25% | 56.5 24% | 80.1 -7% | 105.4 -41% |
| Load Maximum * (Watt) | 134.7 | 131 3% | 135.2 -0% | 92.4 31% | 110.9 18% | 151.2 -12% |
* ... mindre är bättre
Power Consumption Witcher 3 / Stresstest
Power Consumption external Monitor
Batteritid
Med nästan 9 timmars konstant WLAN-användning i den verkliga världen är körtiderna i stort sett lika långa som de vi registrerade på XPS 9500 och nästan 2 timmar längre än på XPS 9510. Tänk dock på att vita färger kommer att kräva några watt mer än mörkare färger vid samma ljusstyrka eftersom vår konfiguration använder en OLED-panel.
Laddning från tom till full kapacitet med den medföljande nätadaptern. tar ungefär 2 till 2,5 timmar vid tomgång eller låg belastning.
| Dell XPS 15 9520 RTX 3050 Ti i7-12700H, GeForce RTX 3050 Ti Laptop GPU, 86 Wh | Dell XPS 15 9510 11800H RTX 3050 Ti OLED i7-11800H, GeForce RTX 3050 Ti Laptop GPU, 86 Wh | Dell XPS 15 9500 Core i7 4K UHD i7-10875H, GeForce GTX 1650 Ti Mobile, 86 Wh | HP Spectre X360 15-5ZV31AV i7-10510U, GeForce MX250, 84 Wh | Asus Zenbook Pro 15 OLED UM535Q R9 5900HX, GeForce RTX 3050 Ti Laptop GPU, 96 Wh | MSI Stealth 15M A11SEK i7-1185G7, GeForce RTX 2060 Max-Q, 52 Wh | |
|---|---|---|---|---|---|---|
| Batteridrifttid | -32% | 7% | 22% | 45% | -42% | |
| Reader / Idle (h) | 14.8 | 23 55% | 22.6 53% | 26.2 77% | 10.5 -29% | |
| WiFi v1.3 (h) | 8.8 | 7 -20% | 9.1 3% | 10.8 23% | 12.8 45% | 6.3 -28% |
| Load (h) | 3.2 | 1.8 -44% | 2 -37% | 2.9 -9% | 3.6 13% | 1 -69% |
| H.264 (h) | 10.4 |
För
Emot
Omdöme - Skillnaden med Alder Lake
Om processorerna i XPS 15 9500 eller 9510 är för långsamma för dina specifika tillämpningar kan 9520 vara värd att överväga. Dess 12:e generations Core i7-12700H kan erbjuda 70 procent respektive 40 procent högre prestanda för flera trådar än 10:e generationens Core i7-10875H och 11:e generationens Core i7-11800H utan att det påverkar batteritiden nämnvärt. Den inneboende ökningen av den integrerade grafikprestandan kan också vara tillräcklig för att tillfredsställa de flesta kontorsanvändare utan att behöva uppgradera till några dyra diskreta Nvidia-alternativ.
Avancerade användare kommer att uppskatta den betydande ökningen av processornprestanda jämfört med alternativen från Intels 11:e eller 10:e generationen. För mer grundläggande eller måttliga kontorsuppgifter är de extra hästkrafterna i 12:e generationens serie däremot kanske inte värda prishöjningen.
Förutom CPU-prestandan är upplevelsen samma som på XPS 9510 eller till och med 9500. Nvidias grafikprocessor har nedklockats från 9510 och därför har fördelarna med snabbare DDR5 RAM-minne minimerats. Vissa förändringar som vi gärna hade velat se som skärmar med högre uppdatering, en webbkamera med högre upplösning, ordentligt stöd för Wi-Fi 6E eller ett integritetsskydd på webbkameran saknas fortfarande. Om den snabbare 12:e generationens CPU inte intresserar dig kan du istället köpa XPS 15 9510 som har exakt samma skärm- och GPU-alternativ som vår 9520 men till lägre priser.
Pris och tillgänglighet
Dell XPS 15 9520-serien kostar för närvarande från ca 15 000 kronor för basmodellen och upp till 35 000 kronor om den är konfigurerad med allt till max.
Dell XPS 15 9520 RTX 3050 Ti
- 08/30/2022 v7 (old)
Allen Ngo
Price comparison

