Test: Dell XPS 15 2017 9560 (7300HQ, Full-HD) (sammanfattning)

| SD Card Reader | |
| average JPG Copy Test (av. of 3 runs) | |
| Dell XPS 13 9360 QHD+ i7 | |
| Dell XPS 15-9550 i7 | |
| Dell XPS 13 9360 FHD i5 | |
| Dell XPS 15 2017 9560 (7300HQ, Full-HD) | |
| maximum AS SSD Seq Read Test (1GB) | |
| Dell XPS 13 9360 FHD i5 | |
| Dell XPS 13 9360 QHD+ i7 | |
| Dell XPS 15-9550 i7 | |
| Dell XPS 15 2017 9560 (7300HQ, Full-HD) | |
| Networking | |
| iperf3 transmit AX12 | |
| Apple MacBook Pro 15 2016 (2.6 GHz, 450) (Klaus I211) | |
| Apple MacBook Pro 13 2016 (2.9 GHz) | |
| Dell XPS 15 2017 9560 (7300HQ, Full-HD) | |
| Dell XPS 13 9360 FHD i5 | |
| Dell Inspiron 15 7000 7567 (jseb) | |
| iperf3 receive AX12 | |
| Apple MacBook Pro 13 2016 (2.9 GHz) | |
| Apple MacBook Pro 15 2016 (2.6 GHz, 450) (Klaus I211) | |
| Dell XPS 15 2017 9560 (7300HQ, Full-HD) | |
| Dell XPS 13 9360 FHD i5 | |
| Dell Inspiron 15 7000 7567 (jseb) | |
| |||||||||||||||||||||||||
Distribution av ljusstyrkan: 89 %
Mitt på batteriet: 400 cd/m²
Kontrast: 1538:1 (Svärta: 0.26 cd/m²)
ΔE ColorChecker Calman: 4.9 | ∀{0.5-29.43 Ø4.72}
ΔE Greyscale Calman: 7.2 | ∀{0.09-98 Ø4.97}
98.9% sRGB (Argyll 1.6.3 3D)
64.2% AdobeRGB 1998 (Argyll 1.6.3 3D)
70.9% AdobeRGB 1998 (Argyll 3D)
98.9% sRGB (Argyll 3D)
68.9% Display P3 (Argyll 3D)
Gamma: 2.11
CCT: 6911 K
| Dell XPS 15 2017 9560 (7300HQ, Full-HD) Sharp SHP1453 LQ156M1, , 1920x1080, 15.6" | Dell XPS 15 9550 i7 FHD 1920x1080, 15.6" | Dell XPS 15-9550 i7 SHARP LQ156D1JX01 Dell PN: 7PHPT, , 3840x2160, 15.6" | Apple MacBook Pro 15 2016 (2.9 GHz, 460) Apple APPA030, , 2880x1800, 15.4" | Asus Zenbook UX510UW-CN044T LG Philips LP156WF6-SPB6, , 1920x1080, 15.6" | Dell XPS 13 9360 FHD i5 Sharp SHP1449 LQ133M1, , 1920x1080, 13.3" | Asus ZenBook Pro UX501VW-DS71T 3840x2160, 15.6" | |
|---|---|---|---|---|---|---|---|
| Display | -1% | 23% | 23% | -16% | -28% | -8% | |
| Display P3 Coverage (%) | 68.9 | 68.5 -1% | 87.8 27% | 99 44% | 61.5 -11% | 48.94 -29% | 64.3 -7% |
| sRGB Coverage (%) | 98.9 | 97.2 -2% | 100 1% | 100 1% | 80.4 -19% | 73.3 -26% | 89.9 -9% |
| AdobeRGB 1998 Coverage (%) | 70.9 | 70.4 -1% | 99.4 40% | 87.3 23% | 58.8 -17% | 50.5 -29% | 65.4 -8% |
| Response Times | -7% | 13% | 4% | 38% | 38% | 34% | |
| Response Time Grey 50% / Grey 80% * (ms) | 54 ? | 64 ? -19% | 58 ? -7% | 46 ? 15% | 40 ? 26% | 32.8 ? 39% | 43.2 ? 20% |
| Response Time Black / White * (ms) | 52.4 ? | 50 ? 5% | 35 ? 33% | 56 ? -7% | 26 ? 50% | 33.2 ? 37% | 27.2 ? 48% |
| PWM Frequency (Hz) | 119000 ? | ||||||
| Screen | -3% | -5% | 16% | -14% | -6% | -23% | |
| Brightness middle (cd/m²) | 400 | 371.5 -7% | 361 -10% | 420 5% | 326 -18% | 351.2 -12% | 252.9 -37% |
| Brightness (cd/m²) | 392 | 356 -9% | 344 -12% | 401 2% | 316 -19% | 325 -17% | 250 -36% |
| Brightness Distribution (%) | 89 | 92 3% | 90 1% | 90 1% | 80 -10% | 89 0% | 89 0% |
| Black Level * (cd/m²) | 0.26 | 0.252 3% | 0.38 -46% | 0.3 -15% | 0.35 -35% | 0.195 25% | 0.5 -92% |
| Contrast (:1) | 1538 | 1474 -4% | 950 -38% | 1400 -9% | 931 -39% | 1801 17% | 506 -67% |
| Colorchecker dE 2000 * | 4.9 | 5.55 -13% | 5.34 -9% | 3.33 32% | 5.49 -12% | 7.4 -51% | 5.22 -7% |
| Colorchecker dE 2000 max. * | 11 | 10.95 -0% | 5.11 54% | 11.36 -3% | 9.08 17% | 8.33 24% | |
| Greyscale dE 2000 * | 7.2 | 7.1 1% | 4.84 33% | 2.73 62% | 4.84 33% | 6.71 7% | 6.74 6% |
| Gamma | 2.11 104% | 2.1 105% | 2.21 100% | 2.48 89% | 2.23 99% | 2.74 80% | 2.45 90% |
| CCT | 6911 94% | 7395 88% | 6457 101% | 5971 109% | 7222 90% | 6026 108% | |
| Color Space (Percent of AdobeRGB 1998) (%) | 64.2 | 63.4 -1% | 89 39% | 78.09 22% | 53 -17% | 50.48 -21% | 58.4 -9% |
| Color Space (Percent of sRGB) (%) | 98.9 | 97.9 -1% | 100 1% | 99.97 1% | 80 -19% | 73.31 -26% | 89.7 -9% |
| Totalt genomsnitt (program/inställningar) | -4% /
-3% | 10% /
4% | 14% /
15% | 3% /
-7% | 1% /
-5% | 1% /
-12% |
* ... mindre är bättre
Visa svarstider
| ↔ Svarstid svart till vitt | ||
|---|---|---|
| 52.4 ms ... stiga ↗ och falla ↘ kombinerat | ↗ 33.2 ms stiga |  |
| ↘ 19.2 ms hösten | ||
| Skärmen visar långsamma svarsfrekvenser i våra tester och kommer att vara otillfredsställande för spelare. I jämförelse sträcker sig alla testade enheter från 0.1 (minst) till 240 (maximalt) ms. » 99 % av alla enheter är bättre. Detta innebär att den uppmätta svarstiden är sämre än genomsnittet av alla testade enheter (19.8 ms). | ||
| ↔ Svarstid 50 % grått till 80 % grått | ||
| 54 ms ... stiga ↗ och falla ↘ kombinerat | ↗ 33.2 ms stiga |  |
| ↘ 20 ms hösten | ||
| Skärmen visar långsamma svarsfrekvenser i våra tester och kommer att vara otillfredsställande för spelare. I jämförelse sträcker sig alla testade enheter från 0.165 (minst) till 636 (maximalt) ms. » 91 % av alla enheter är bättre. Detta innebär att den uppmätta svarstiden är sämre än genomsnittet av alla testade enheter (31 ms). | ||
Skärmflimmer / PWM (Puls-Width Modulation)
| Skärmflimmer / PWM upptäcktes inte |  | ||
Som jämförelse: 52 % av alla testade enheter använder inte PWM för att dämpa skärmen. Om PWM upptäcktes mättes ett medelvärde av 7781 (minst: 5 - maximum: 343500) Hz. | |||
| PCMark 8 | |
| Home Score Accelerated v2 | |
| Apple MacBook Pro 15 2016 (2.9 GHz, 460) | |
| Dell Inspiron 15 7000 7567 | |
| Dell XPS 15 2017 9560 (7300HQ, Full-HD) | |
| Dell XPS 15 2016 9550 | |
| Dell XPS 13 9360 FHD i5 | |
| Asus Zenbook UX510UW-CN044T | |
| Asus ZenBook Pro UX501VW-DS71T | |
| Work Score Accelerated v2 | |
| Dell Inspiron 15 7000 7567 | |
| Dell XPS 15 2017 9560 (7300HQ, Full-HD) | |
| Apple MacBook Pro 15 2016 (2.9 GHz, 460) | |
| Dell XPS 13 9360 FHD i5 | |
| Asus Zenbook UX510UW-CN044T | |
| Asus ZenBook Pro UX501VW-DS71T | |
| PCMark 8 Home Score Accelerated v2 | 3659 poäng | |
| PCMark 8 Work Score Accelerated v2 | 4884 poäng | |
Hjälp | ||
| Dell XPS 15 2017 9560 (7300HQ, Full-HD) WDC WD10SPCX-75KHST0 + SanDisk Z400s M.2 2242 32 GB Cache | Dell XPS 13 9360 FHD i5 Toshiba NVMe THNSN5256GPUK | Apple MacBook Pro 15 2016 (2.9 GHz, 460) Apple SSD SM1024L | Asus Zenbook UX510UW-CN044T SanDisk SD8SNAT256G1002 | Dell XPS 15 9550 i7 FHD Samsung PM951 NVMe 512 GB | Dell XPS 15-9550 i7 Samsung PM951 NVMe 512 GB | |
|---|---|---|---|---|---|---|
| CrystalDiskMark 3.0 | 4538% | 7627% | 3855% | 6213% | 4766% | |
| Read Seq (MB/s) | 123 | 1233 902% | 1458 1085% | 459.3 273% | 1291 950% | 1274 936% |
| Write Seq (MB/s) | 74.2 | 733 888% | 1440 1841% | 325.5 339% | 590 695% | 594 701% |
| Read 512 (MB/s) | 101.7 | 1036 919% | 914 799% | 279.2 175% | 632 521% | 674 563% |
| Write 512 (MB/s) | 42.51 | 439.9 935% | 1058 2389% | 280.1 559% | 588 1283% | 596 1302% |
| Read 4k (MB/s) | 10.84 | 29.31 170% | 9.786 -10% | 22.43 107% | 41.4 282% | 37.02 242% |
| Write 4k (MB/s) | 1.021 | 116.9 11350% | 10.9 968% | 74.9 7236% | 132.4 12868% | 129.7 12603% |
| Read 4k QD32 (MB/s) | 69.8 | 479.2 587% | 679 873% | 149 113% | 542 677% | 457.9 556% |
| Write 4k QD32 (MB/s) | 1.057 | 218.3 20553% | 562 53069% | 234 22038% | 343.8 32426% | 225.4 21225% |

| 3DMark 11 Performance | 7504 poäng | |
| 3DMark Cloud Gate Standard Score | 14758 poäng | |
| 3DMark Fire Strike Score | 5458 poäng | |
| 3DMark Fire Strike Extreme Score | 2715 poäng | |
Hjälp | ||
| The Witcher 3 | |
| 1920x1080 High Graphics & Postprocessing (Nvidia HairWorks Off) | |
| Razer Blade (2016) | |
| MSI GE72 7RE-046 | |
| Dell XPS 15 2017 9560 (7300HQ, Full-HD) | |
| Apple MacBook Pro 15 2016 (2.9 GHz, 460) | |
| Schenker XMG A505 | |
| Asus GL552VW-DK725T | |
| 1920x1080 Ultra Graphics & Postprocessing (HBAO+) | |
| Razer Blade (2016) | |
| MSI GE72 7RE-046 | |
| Dell XPS 15 2017 9560 (7300HQ, Full-HD) | |
| Apple MacBook Pro 15 2016 (2.9 GHz, 460) | |
| Asus GL552VW-DK725T | |
| Schenker XMG A505 | |
| Battlefield 1 | |
| 1920x1080 High Preset AA:T | |
| Razer Blade (2016) | |
| Dell Inspiron 15 7000 7567 | |
| MSI GE72 7RE-046 | |
| Dell XPS 15 2017 9560 (7300HQ, Full-HD) | |
| Apple MacBook Pro 15 2016 (2.9 GHz, 460) | |
| Schenker XMG A505 | |
| 1920x1080 Ultra Preset AA:T | |
| Razer Blade (2016) | |
| Dell Inspiron 15 7000 7567 | |
| MSI GE72 7RE-046 | |
| Dell XPS 15 2017 9560 (7300HQ, Full-HD) | |
| Apple MacBook Pro 15 2016 (2.9 GHz, 460) | |
| Schenker XMG A505 | |
| Titanfall 2 | |
| 1920x1080 High / Enabled AA:TS AF:8x | |
| Dell Inspiron 15 7000 7567 | |
| MSI GE72 7RE-046 | |
| Dell XPS 15 2017 9560 (7300HQ, Full-HD) | |
| Schenker XMG A505 | |
| Apple MacBook Pro 15 2016 (2.9 GHz, 460) | |
| 1920x1080 Very High (Insane Texture Quality) / Enabled AA:TS AF:16x | |
| Dell Inspiron 15 7000 7567 | |
| MSI GE72 7RE-046 | |
| Dell XPS 15 2017 9560 (7300HQ, Full-HD) | |
| Apple MacBook Pro 15 2016 (2.9 GHz, 460) | |
| Schenker XMG A505 | |
| FIFA 17 | |
| 1920x1080 High Preset | |
| Apple MacBook Pro 15 2016 (2.9 GHz, 460) | |
| Dell XPS 15 2017 9560 (7300HQ, Full-HD) | |
| MSI GE72 7RE-046 | |
| Schenker XMG A505 | |
| 1920x1080 Ultra Preset AA:4xMS | |
| Apple MacBook Pro 15 2016 (2.9 GHz, 460) | |
| Dell XPS 15 2017 9560 (7300HQ, Full-HD) | |
| MSI GE72 7RE-046 | |
| Schenker XMG A505 | |
| låg | med. | hög | ultra | |
|---|---|---|---|---|
| The Witcher 3 (2015) | 125.5 | 77.3 | 34.6 | 24.9 |
| FIFA 17 (2016) | 184.3 | 183.7 | 146.2 | 146 |
| Battlefield 1 (2016) | 121.4 | 103.2 | 50.1 | 47 |
| Titanfall 2 (2016) | 141.3 | 110.5 | 52.8 | 48.4 |
Ljudnivå
| Låg belastning |
| 31.6 / 31.6 / 33.4 dB(A) |
| Hårddisk |
| 31.6 dB(A) |
| Hög belastning |
| 47.8 / 47.8 dB(A) |
 | ||
30 dB tyst 40 dB(A) hörbar 50 dB(A) högt ljud |
||
min: | ||
(-) Den maximala temperaturen på ovansidan är 47.6 °C / 118 F, jämfört med genomsnittet av 36.8 °C / 98 F , allt från 21 till 71 °C för klassen Multimedia.
(±) Botten värms upp till maximalt 42.1 °C / 108 F, jämfört med genomsnittet av 39.1 °C / 102 F
(+) Vid tomgångsbruk är medeltemperaturen för ovansidan 28.4 °C / 83 F, jämfört med enhetsgenomsnittet på 31.3 °C / ### class_avg_f### F.
(-) När du spelar The Witcher 3 är medeltemperaturen för ovansidan 38.1 °C / 101 F, jämfört med enhetsgenomsnittet på 31.3 °C / ## #class_avg_f### F.
(+) Handledsstöden och pekplattan når maximal hudtemperatur (32.2 °C / 90 F) och är därför inte varma.
(-) Medeltemperaturen för handledsstödsområdet på liknande enheter var 28.7 °C / 83.7 F (-3.5 °C / -6.3 F).
Dell XPS 15 2017 9560 (7300HQ, Full-HD) ljudanalys
(+) | högtalare kan spela relativt högt (87 dB)
Bas 100 - 315 Hz
(-) | nästan ingen bas - i genomsnitt 15.8% lägre än medianen
(±) | linjäriteten för basen är genomsnittlig (13.9% delta till föregående frekvens)
Mellan 400 - 2000 Hz
(+) | balanserad mellan - endast 4.3% från medianen
(±) | linjäriteten för mids är genomsnittlig (7.1% delta till föregående frekvens)
Högsta 2 - 16 kHz
(+) | balanserade toppar - endast 3.1% från medianen
(±) | linjäriteten för toppar är genomsnittlig (7.9% delta till föregående frekvens)
Totalt 100 - 16 000 Hz
(+) | det totala ljudet är linjärt (13.5% skillnad mot median)
Jämfört med samma klass
» 29% av alla testade enheter i den här klassen var bättre, 4% liknande, 67% sämre
» Den bästa hade ett delta på 5%, genomsnittet var 17%, sämst var 45%
Jämfört med alla testade enheter
» 14% av alla testade enheter var bättre, 4% liknande, 82% sämre
» Den bästa hade ett delta på 4%, genomsnittet var 24%, sämst var 134%
Apple MacBook Pro 15 2016 (2.6 GHz, 450) ljudanalys
(+) | högtalare kan spela relativt högt (86 dB)
Bas 100 - 315 Hz
(±) | reducerad bas - i genomsnitt 6.9% lägre än medianen
(±) | linjäriteten för basen är genomsnittlig (12.7% delta till föregående frekvens)
Mellan 400 - 2000 Hz
(±) | högre mellan - i genomsnitt 5% högre än median
(±) | linjäriteten för mids är genomsnittlig (9.5% delta till föregående frekvens)
Högsta 2 - 16 kHz
(+) | balanserade toppar - endast 2% från medianen
(+) | toppar är linjära (4.3% delta till föregående frekvens)
Totalt 100 - 16 000 Hz
(+) | det totala ljudet är linjärt (9.7% skillnad mot median)
Jämfört med samma klass
» 13% av alla testade enheter i den här klassen var bättre, 1% liknande, 85% sämre
» Den bästa hade ett delta på 5%, genomsnittet var 17%, sämst var 45%
Jämfört med alla testade enheter
» 4% av alla testade enheter var bättre, 1% liknande, 95% sämre
» Den bästa hade ett delta på 4%, genomsnittet var 24%, sämst var 134%
| Av/Standby | |
| Låg belastning | |
| Hög belastning |
|
Förklaring:
min: | |
| Dell XPS 15 2017 9560 (7300HQ, Full-HD) | Dell XPS 15 2016 9550 | Dell XPS 15-9550 i7 | Apple MacBook Pro 15 2016 (2.9 GHz, 460) | Dell XPS 13 9360 FHD i5 | Asus Zenbook UX510UW-CN044T | Razer Blade (2016) FHD | |
|---|---|---|---|---|---|---|---|
| Power Consumption | -25% | -67% | 13% | 58% | 14% | -62% | |
| Idle Minimum * (Watt) | 6.6 | 9.9 -50% | 12.5 -89% | 3 55% | 4.1 38% | 5 24% | 14 -112% |
| Idle Average * (Watt) | 9 | 12.6 -40% | 19.6 -118% | 9.9 -10% | 4.2 53% | 8.9 1% | 18 -100% |
| Idle Maximum * (Watt) | 10.7 | 16.8 -57% | 22.8 -113% | 12.5 -17% | 5.1 52% | 11.8 -10% | 21 -96% |
| Load Average * (Watt) | 77.5 | 70 10% | 102 -32% | 70.6 9% | 22.1 71% | 55 29% | 70 10% |
| Load Maximum * (Watt) | 130 | 114 12% | 107 18% | 90.8 30% | 29.4 77% | 93 28% | 146 -12% |
* ... mindre är bättre
| Dell XPS 15 2017 9560 (7300HQ, Full-HD) i5-7300HQ, GeForce GTX 1050 Mobile, 56 Wh | Dell XPS 15 2016 9550 6300HQ, GeForce GTX 960M, 56 Wh | Dell XPS 15-9550 i7 6700HQ, GeForce GTX 960M, 84 Wh | Apple MacBook Pro 15 2016 (2.9 GHz, 460) 6920HQ, Radeon Pro 460, 76 Wh | Asus ZenBook Pro UX501VW-DS71T 6700HQ, GeForce GTX 960M, 96 Wh | Asus Zenbook UX510UW-CN044T 6500U, GeForce GTX 960M, 48 Wh | Dell Inspiron 15 7000 7567 i7-7700HQ, GeForce GTX 1050 Ti Mobile, 74 Wh | Razer Blade (2016) FHD 6700HQ, GeForce GTX 1060 Mobile, 70 Wh | Dell XPS 13 9360 FHD i5 i5-7200U, HD Graphics 620, 60 Wh | |
|---|---|---|---|---|---|---|---|---|---|
| Batteridrifttid | 20% | 12% | 24% | 26% | 29% | 65% | 11% | 106% | |
| Reader / Idle (h) | 9.4 | 9.1 -3% | 8.8 -6% | 11.5 22% | 13.6 45% | 19.6 109% | 12.7 35% | 21.6 130% | |
| WiFi v1.3 (h) | 5.6 | 5.5 -2% | 5.2 -7% | 10.3 84% | 6.3 13% | 7.2 29% | 10.4 86% | 7.1 27% | 11.3 102% |
| Load (h) | 1.4 | 2.3 64% | 2.1 50% | 0.9 -36% | 2 43% | 1.6 14% | 1.4 0% | 1 -29% | 2.6 86% |
| H.264 (h) | 6 | 5.3 | 9.1 | 7.1 | 7.6 | 5.2 |
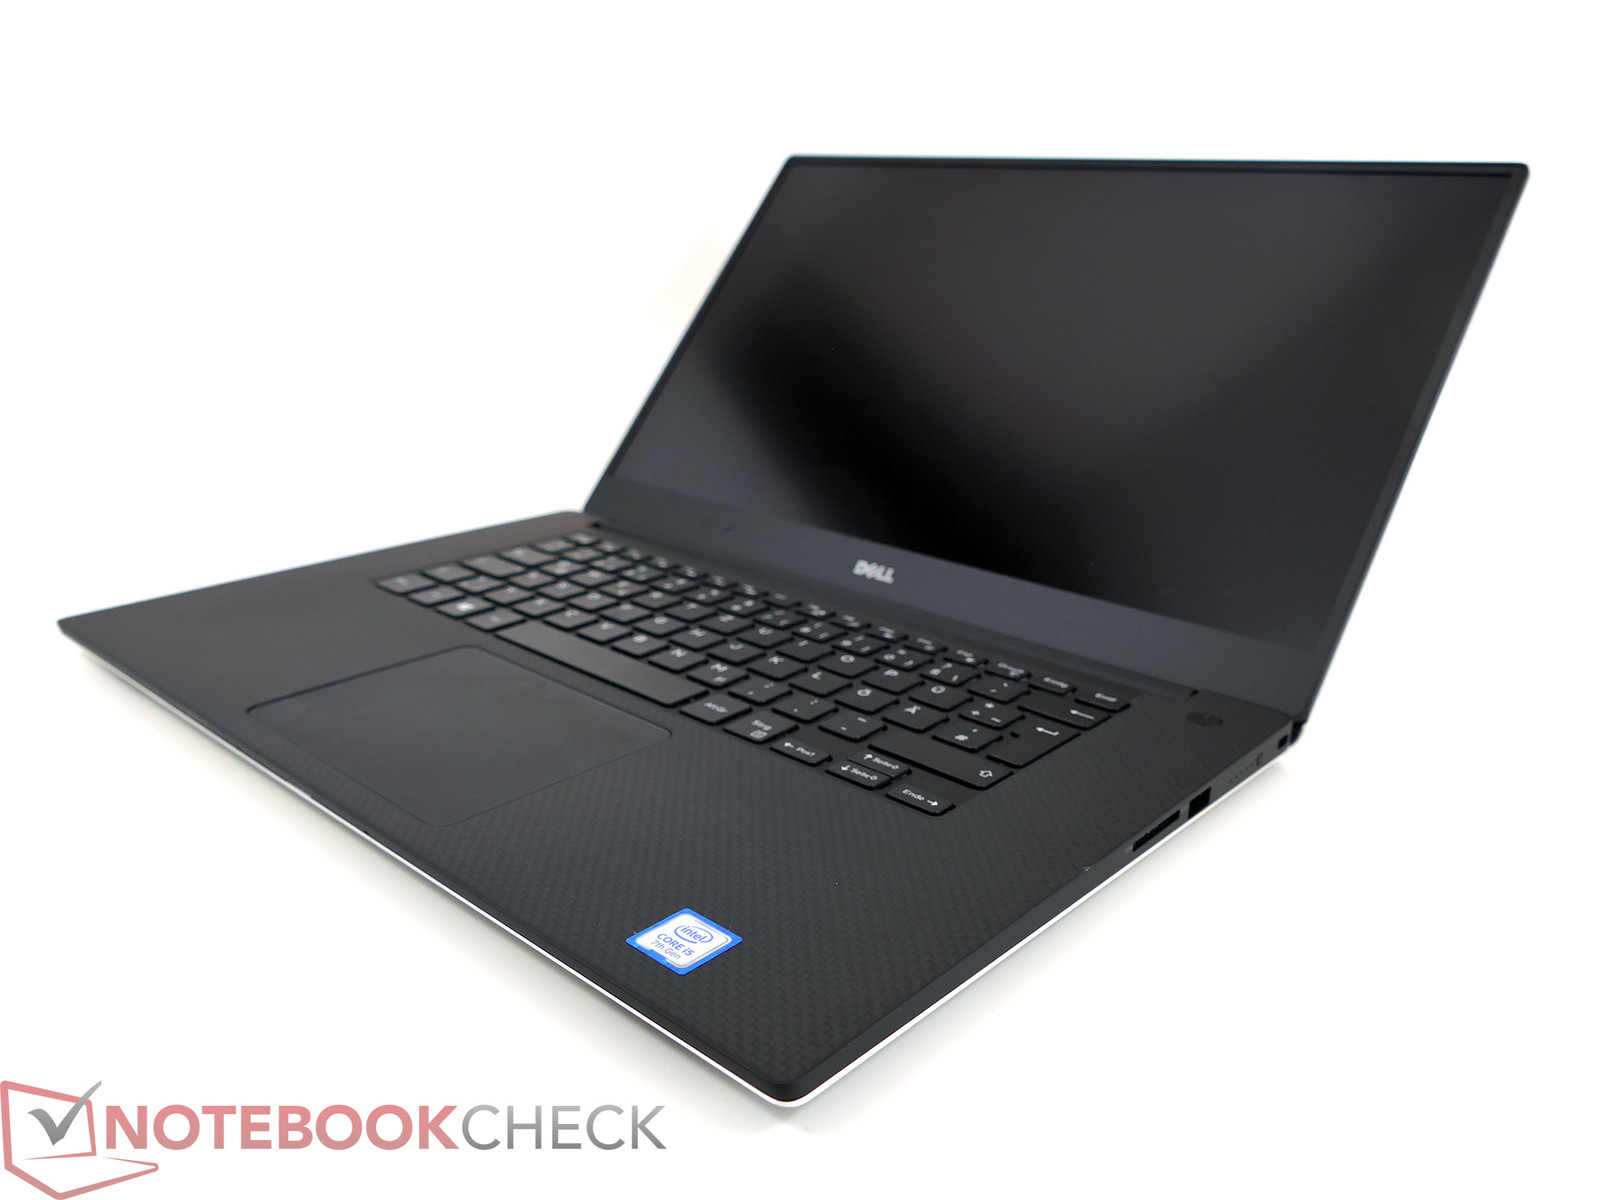
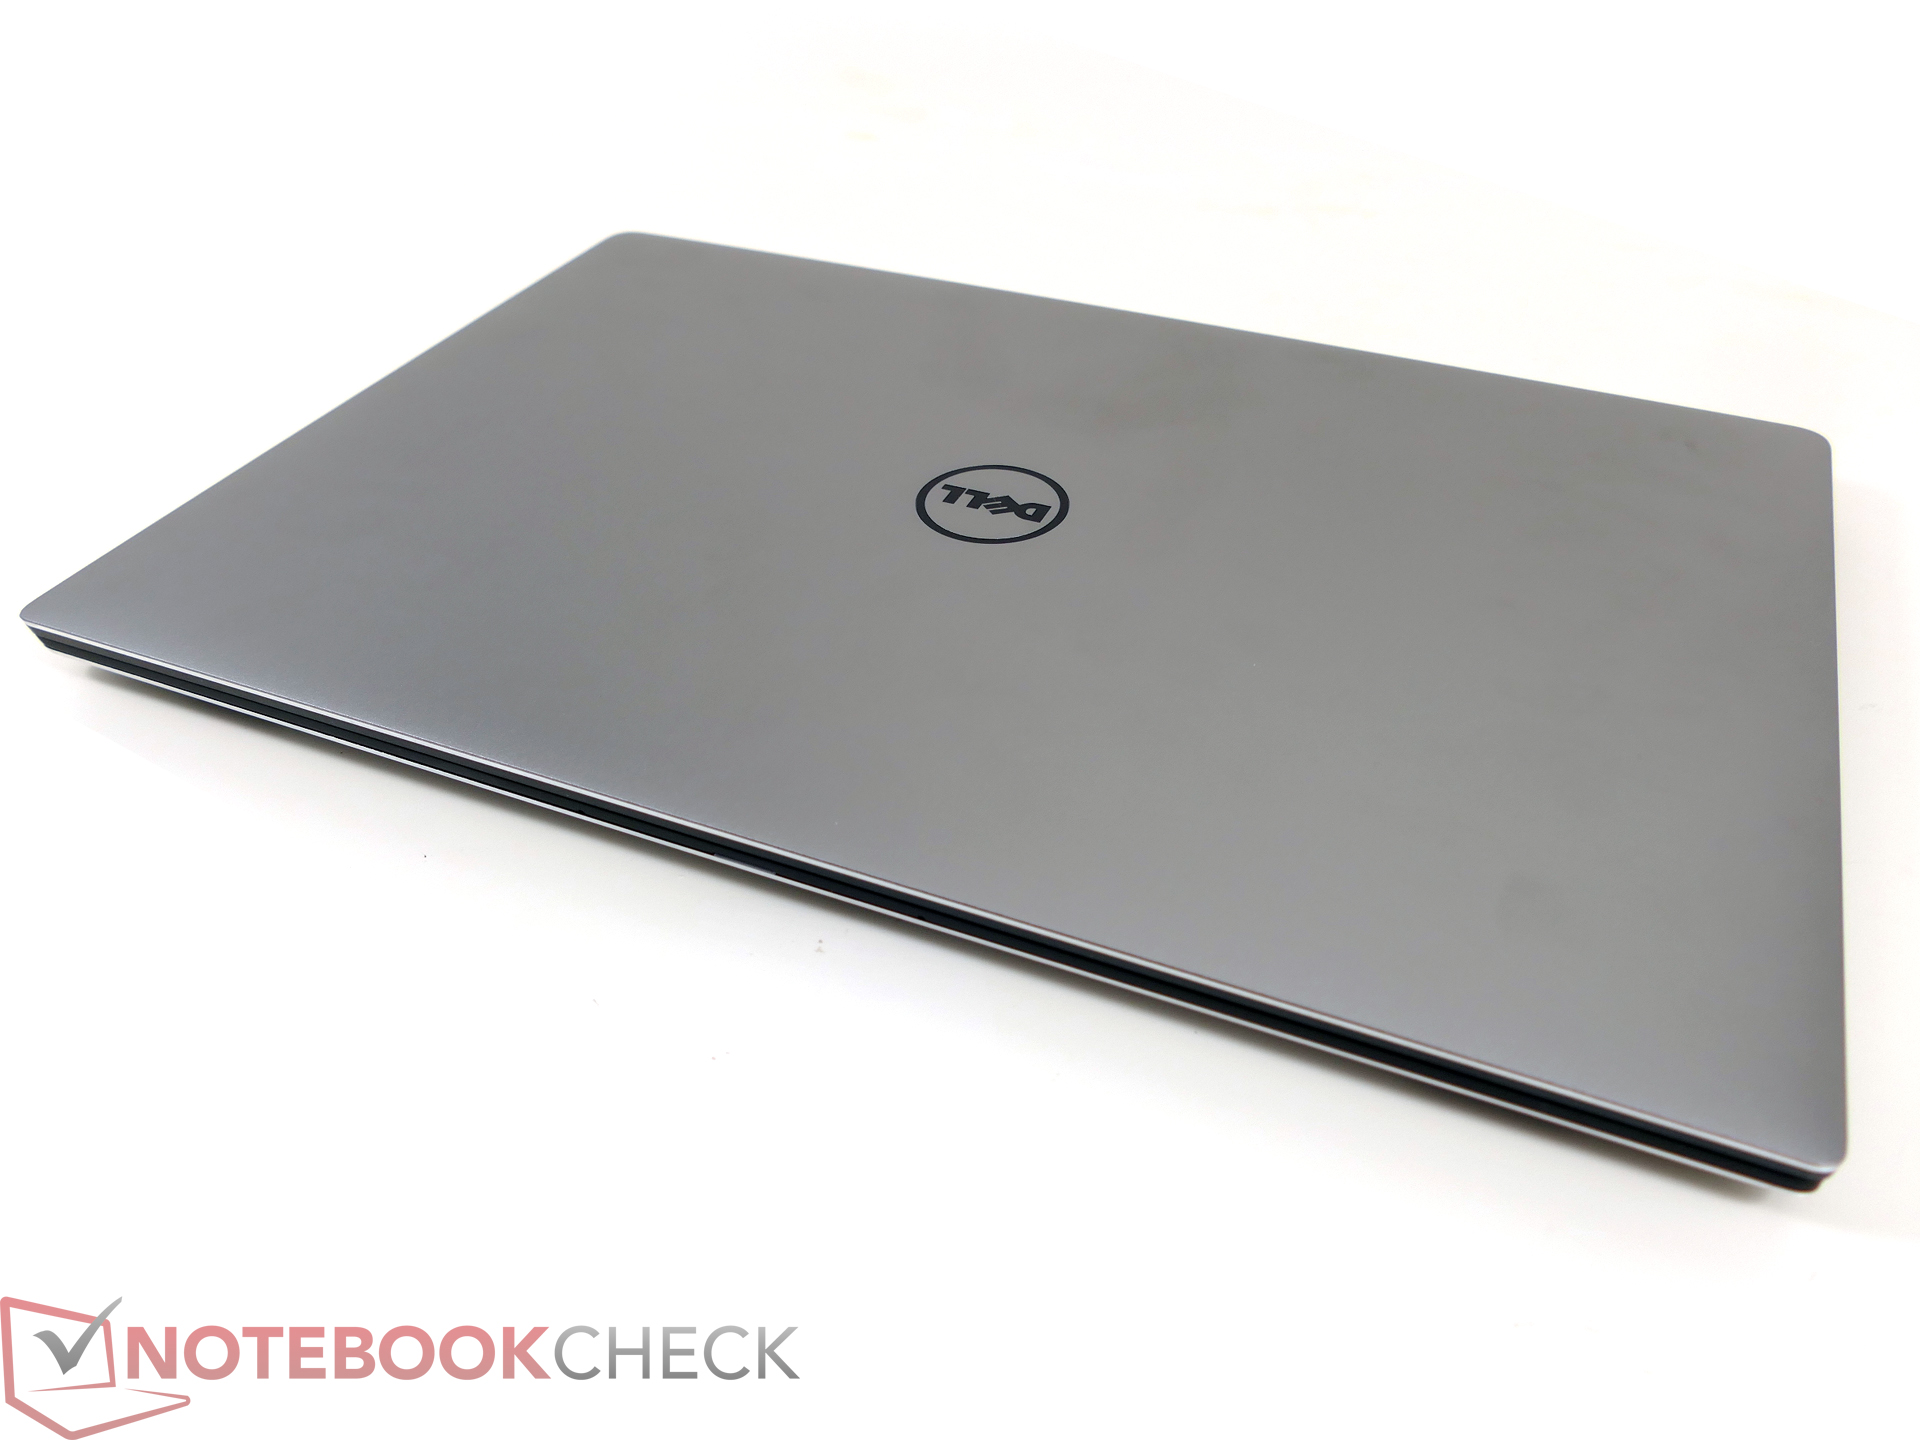
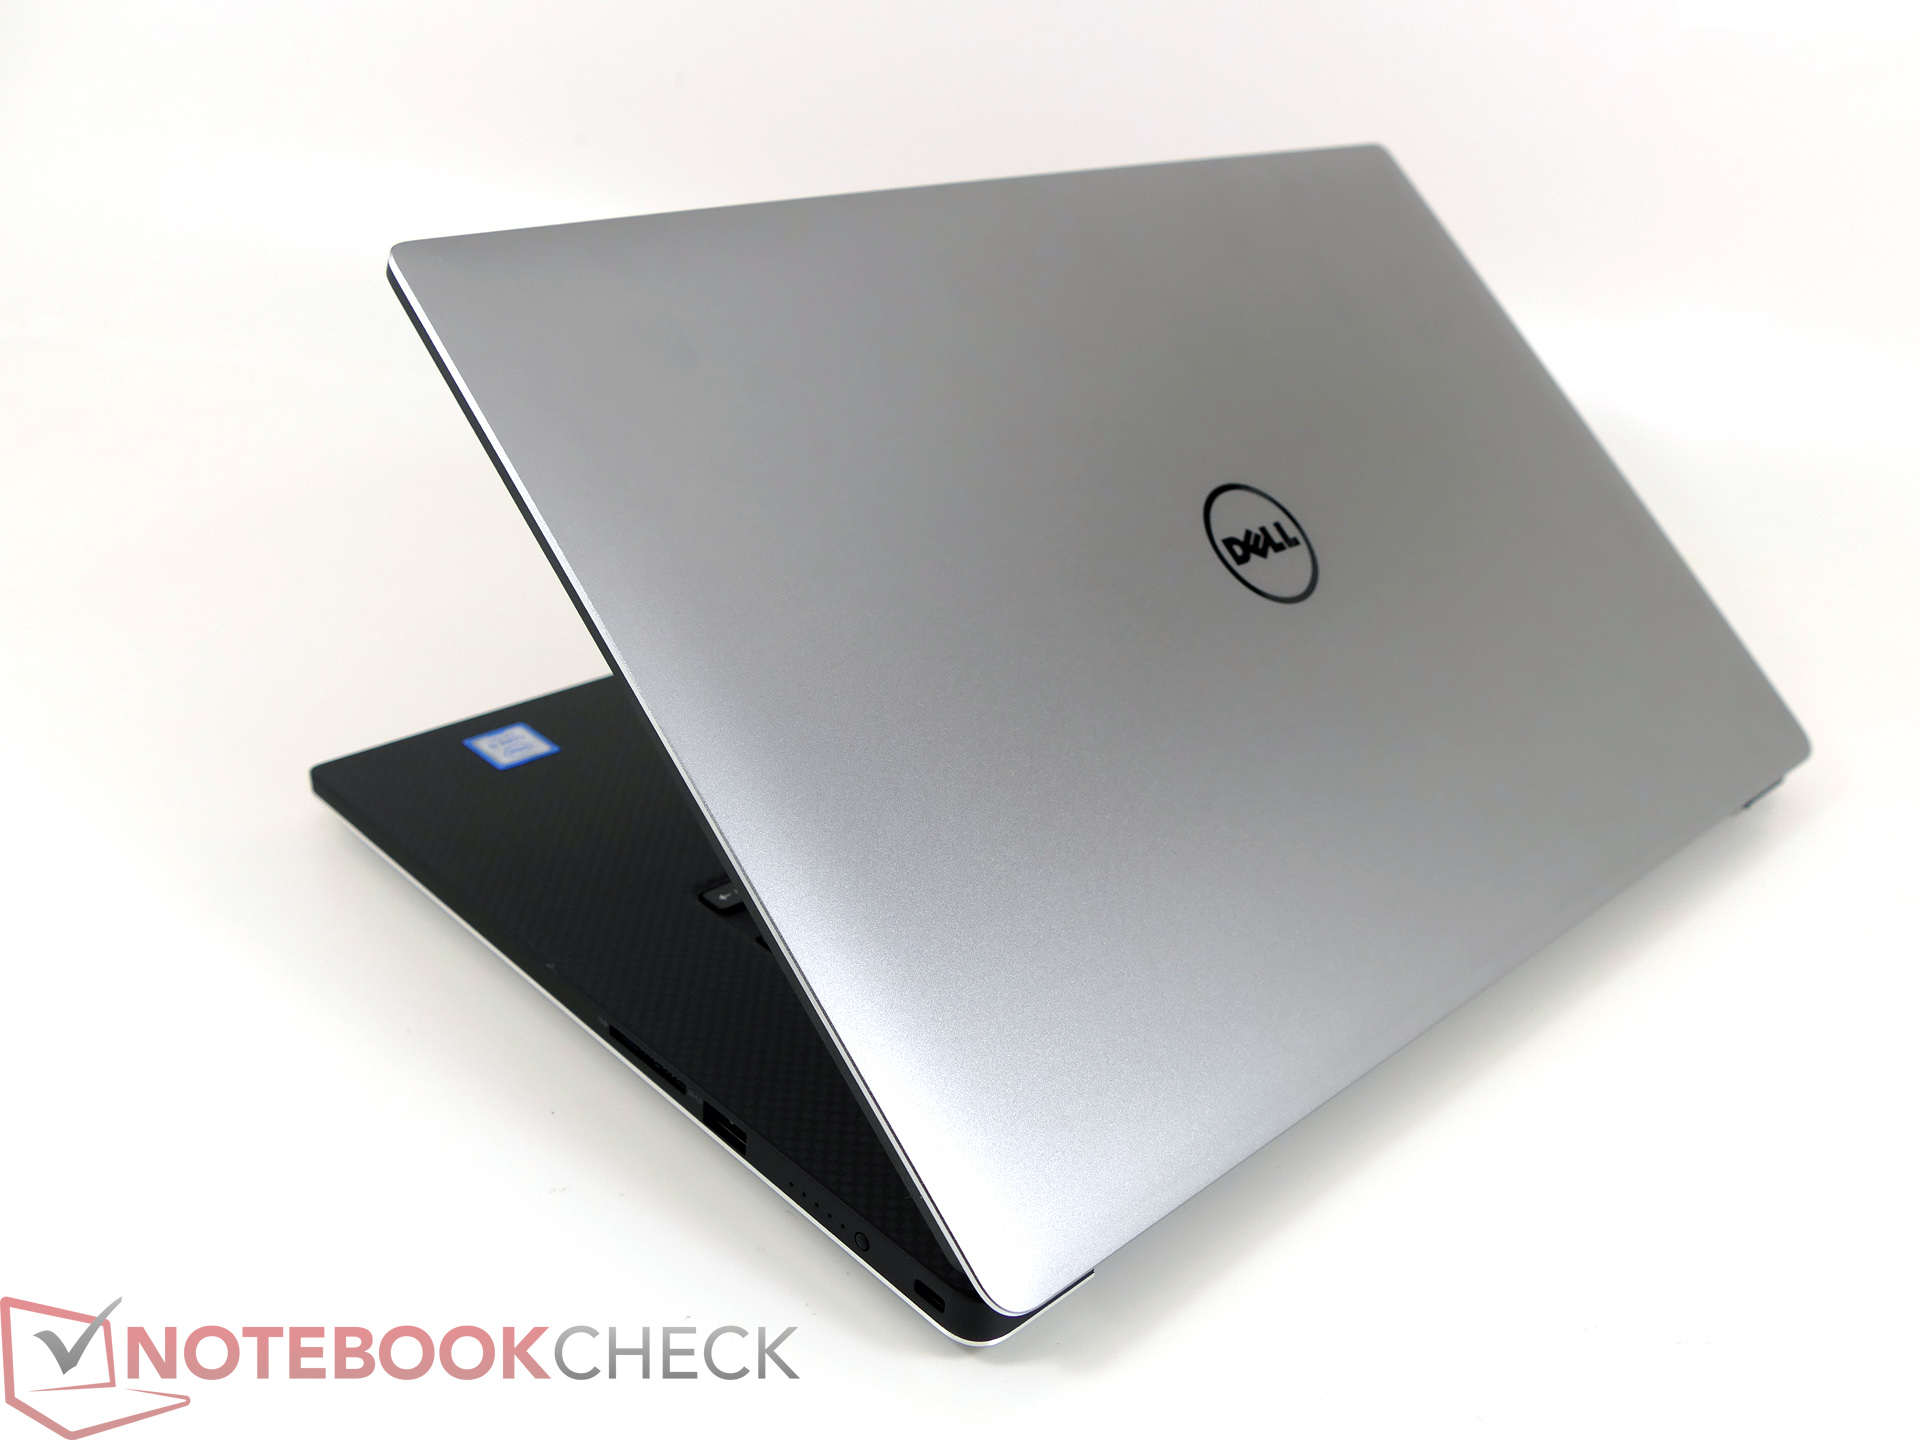
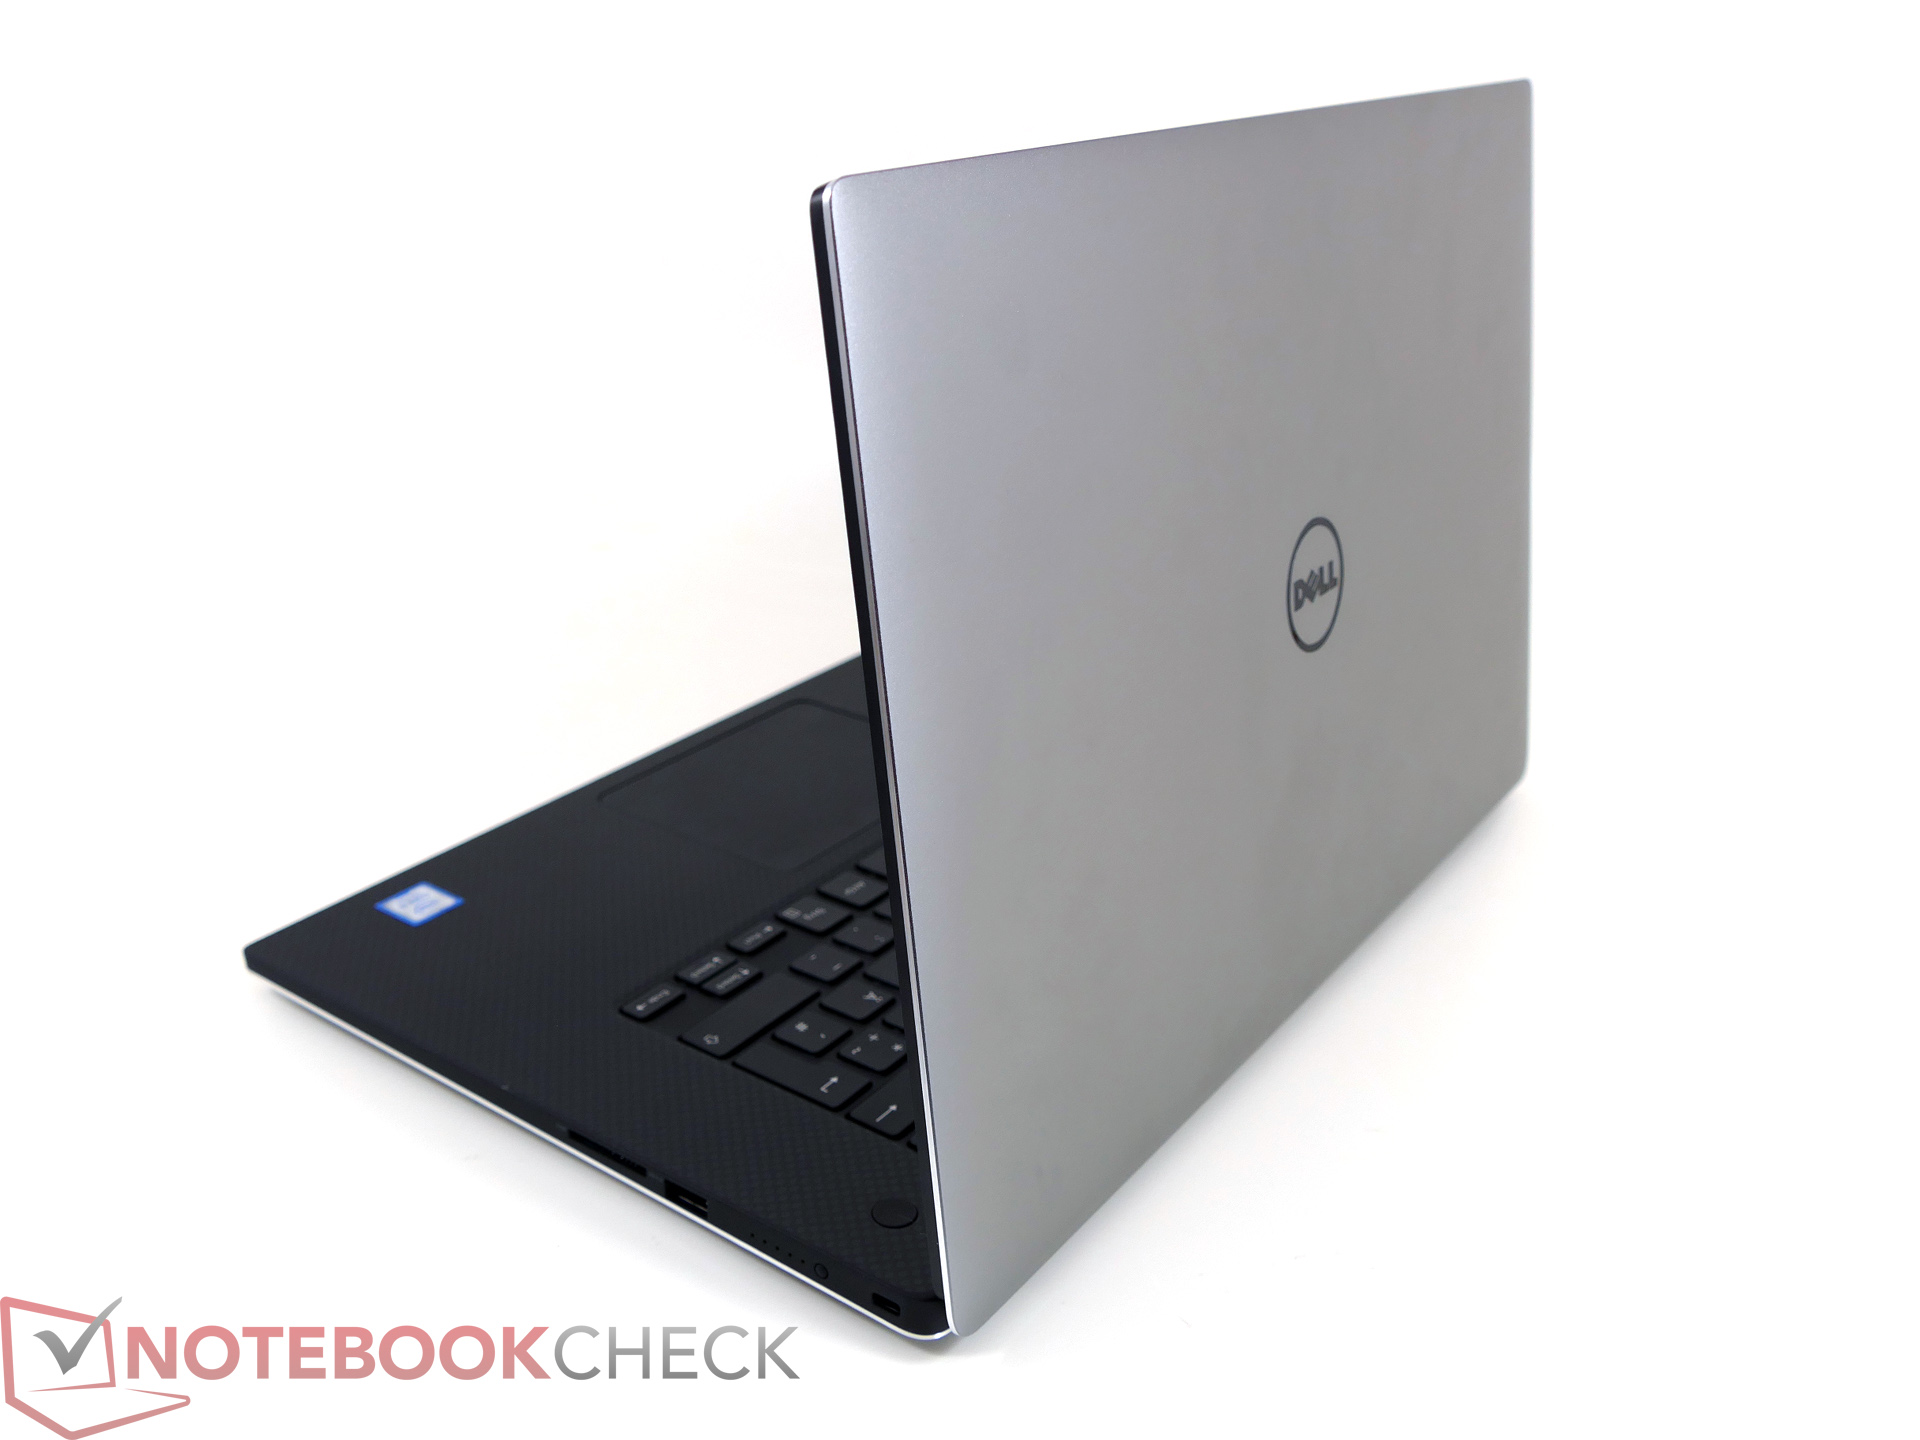
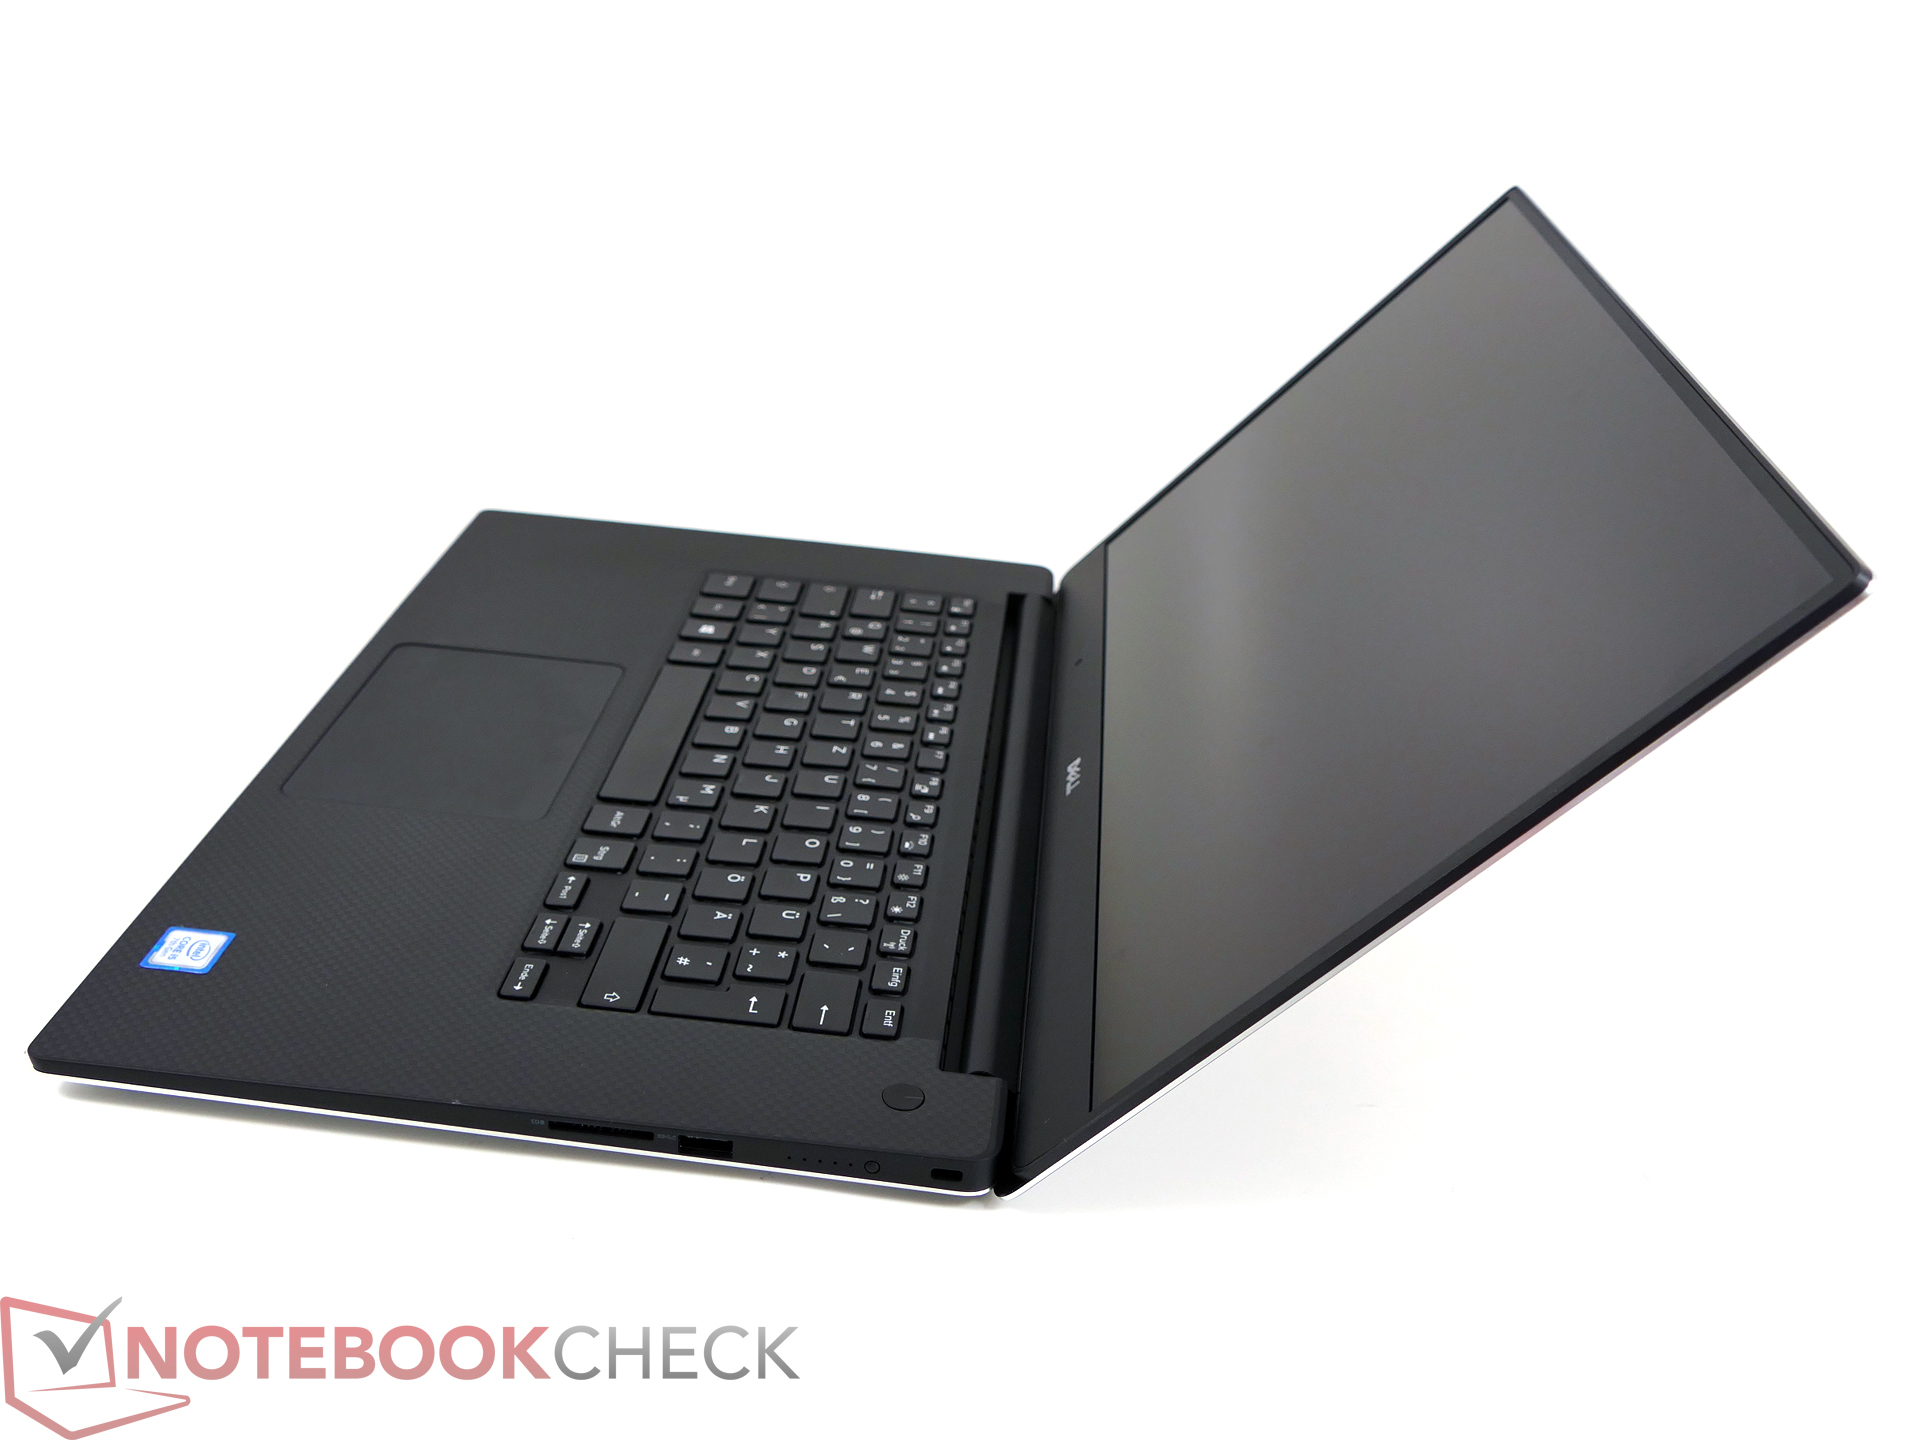
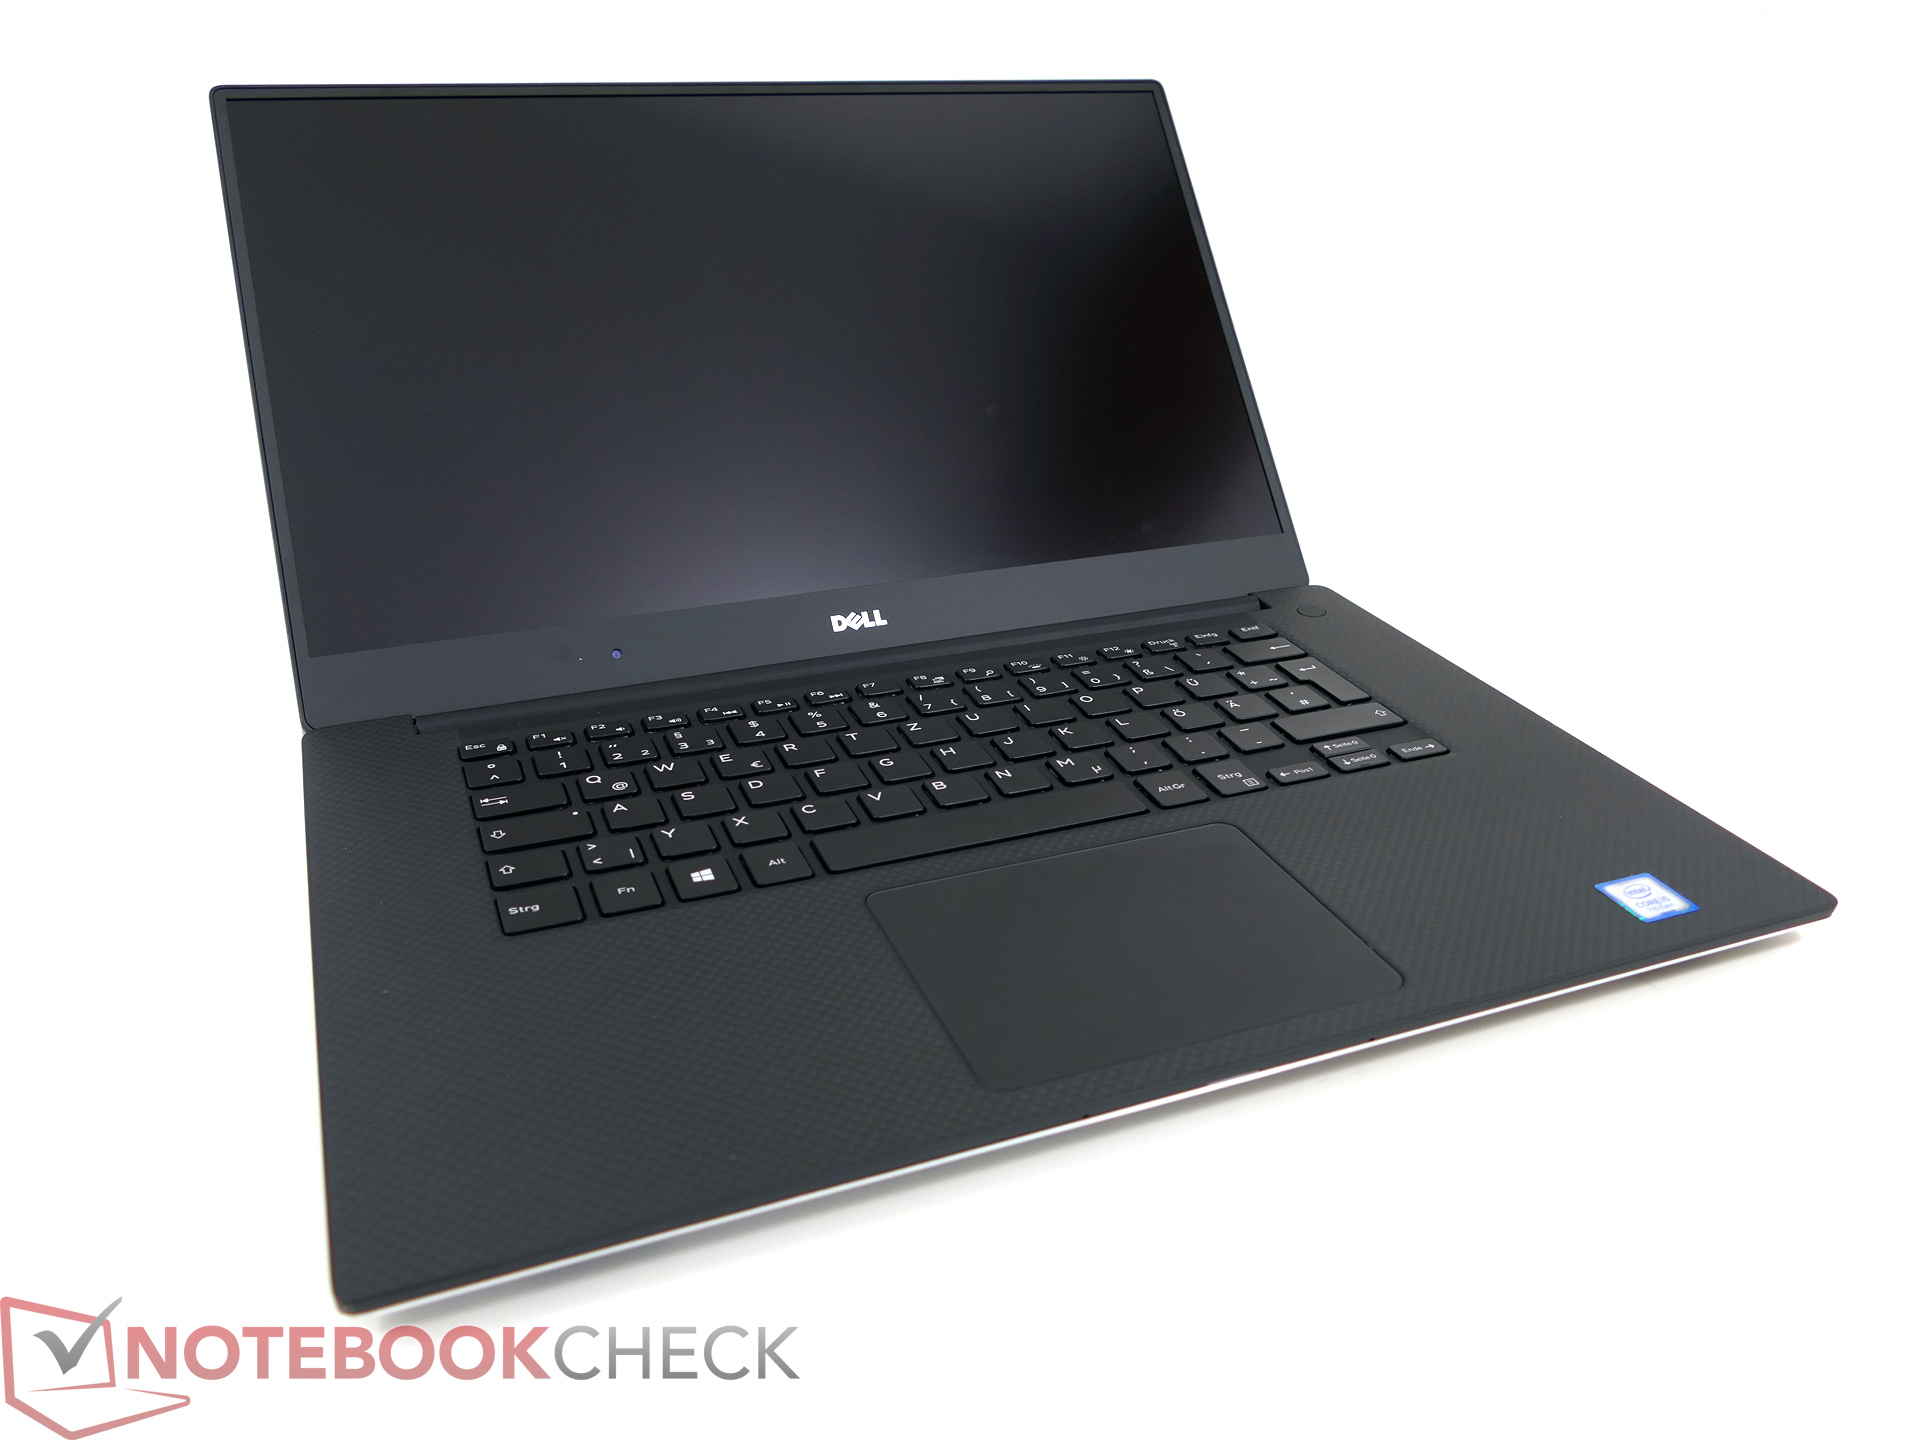
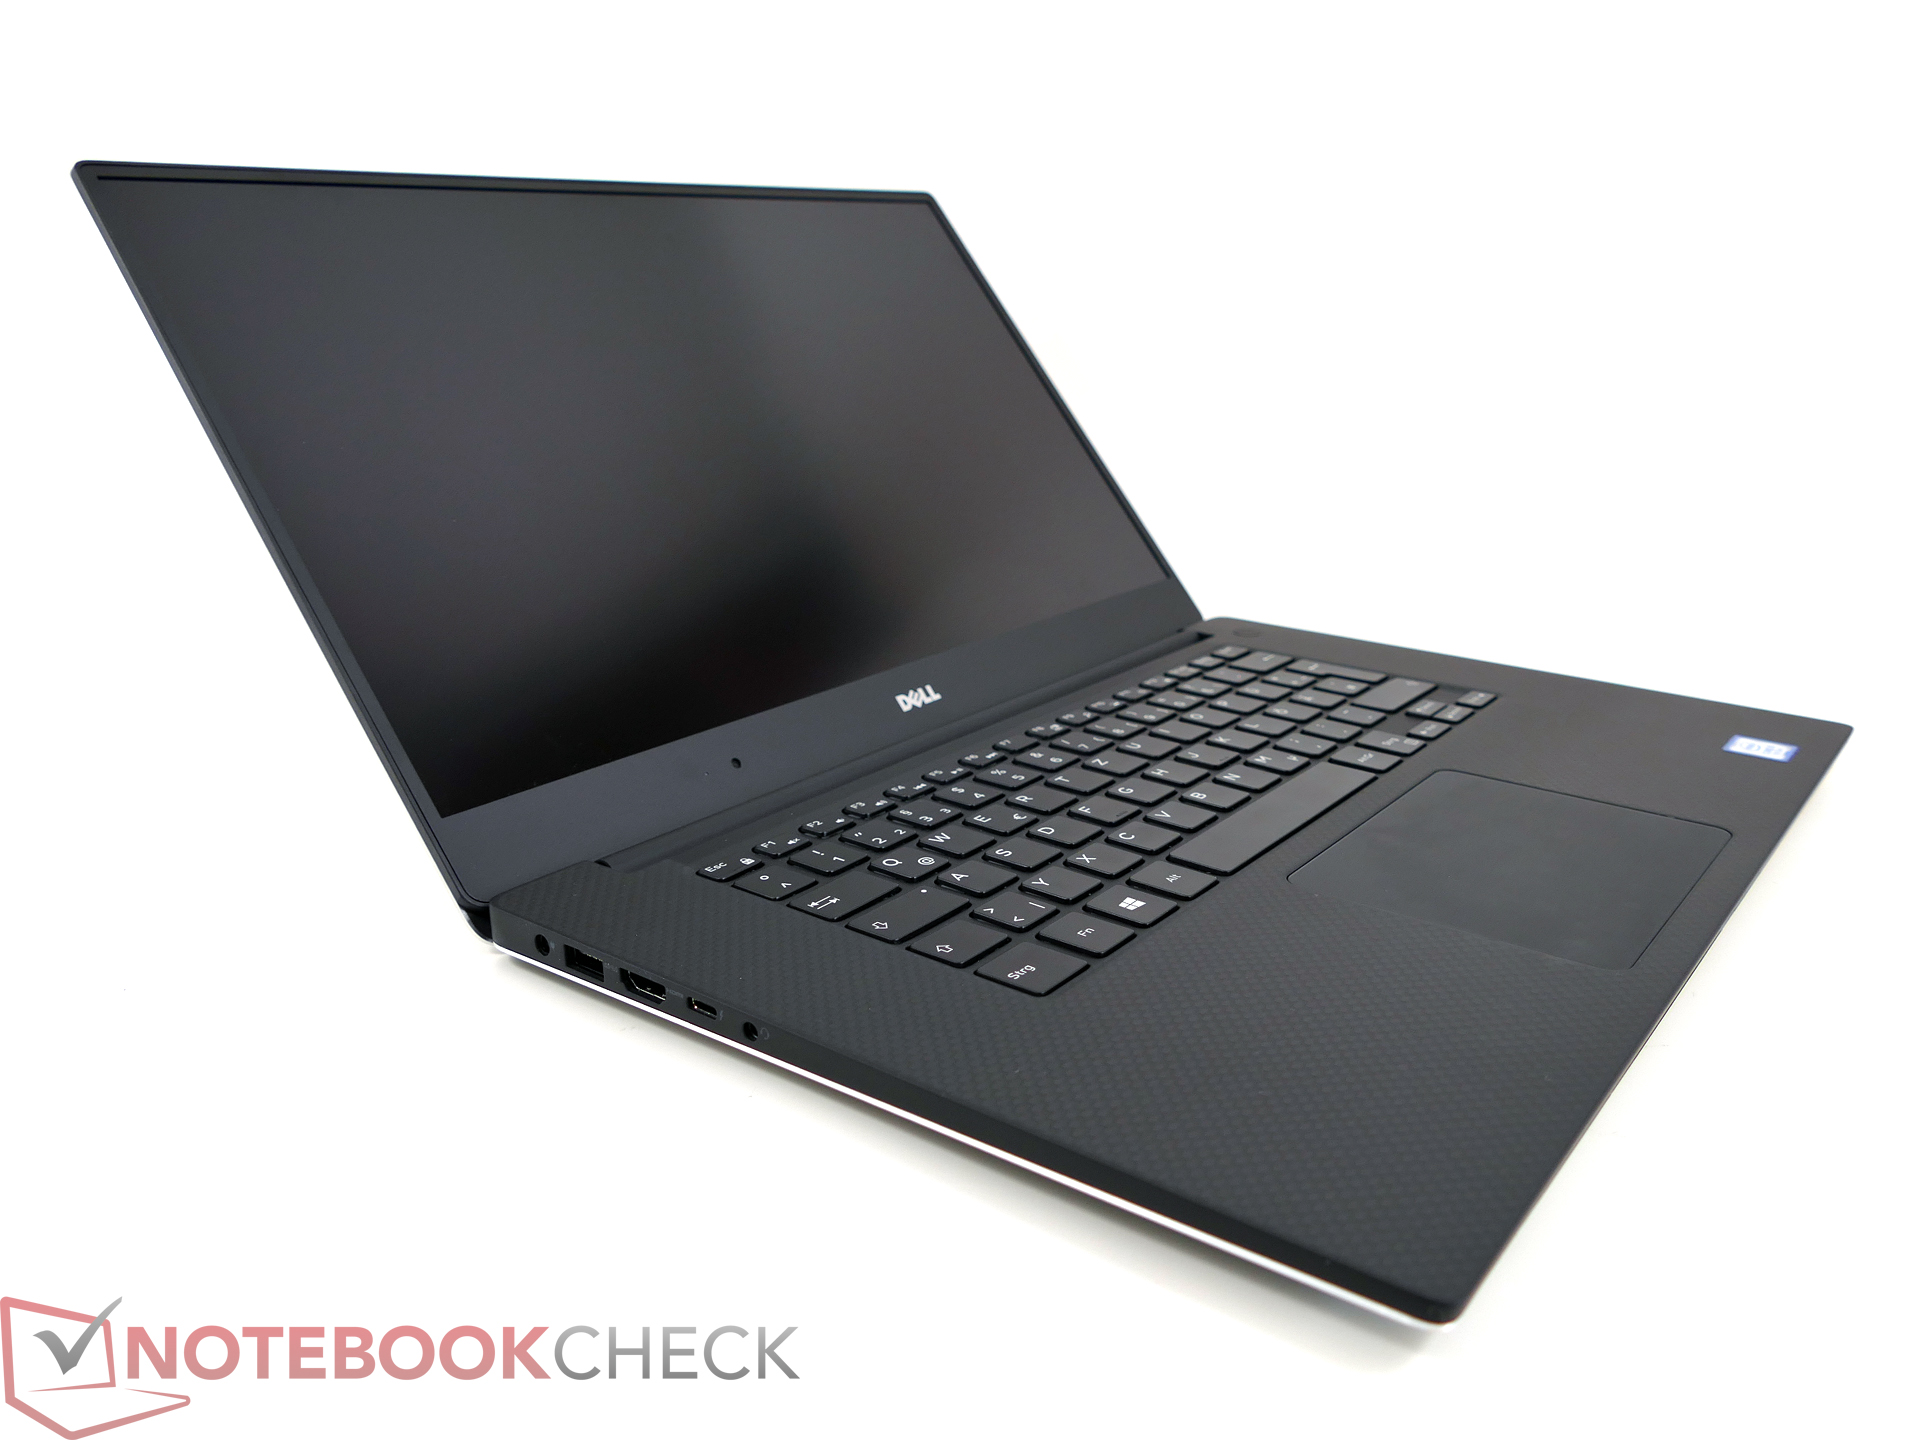
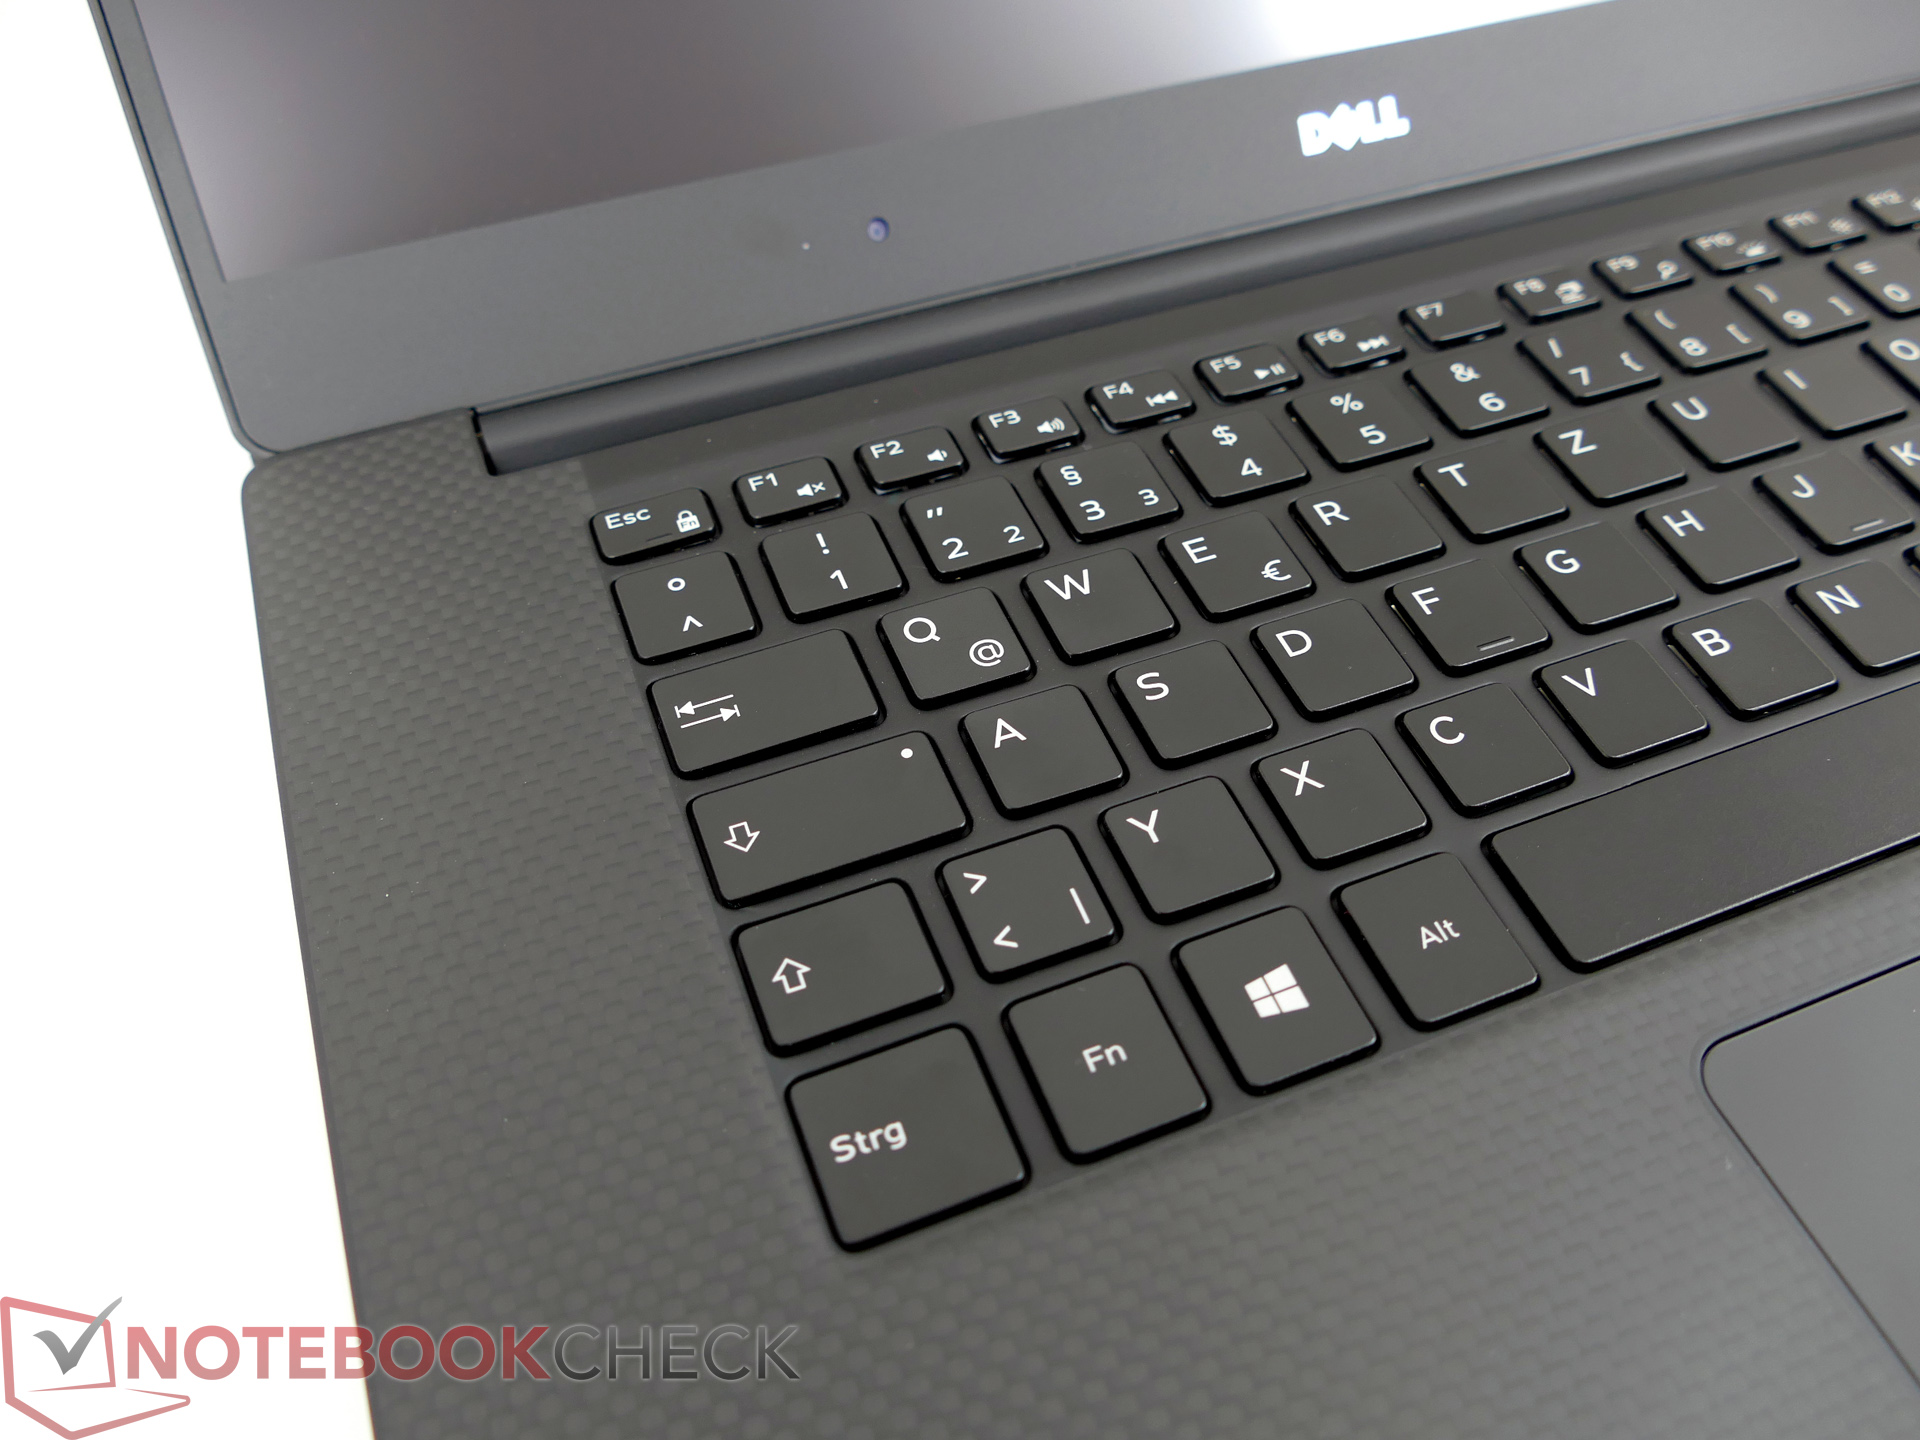
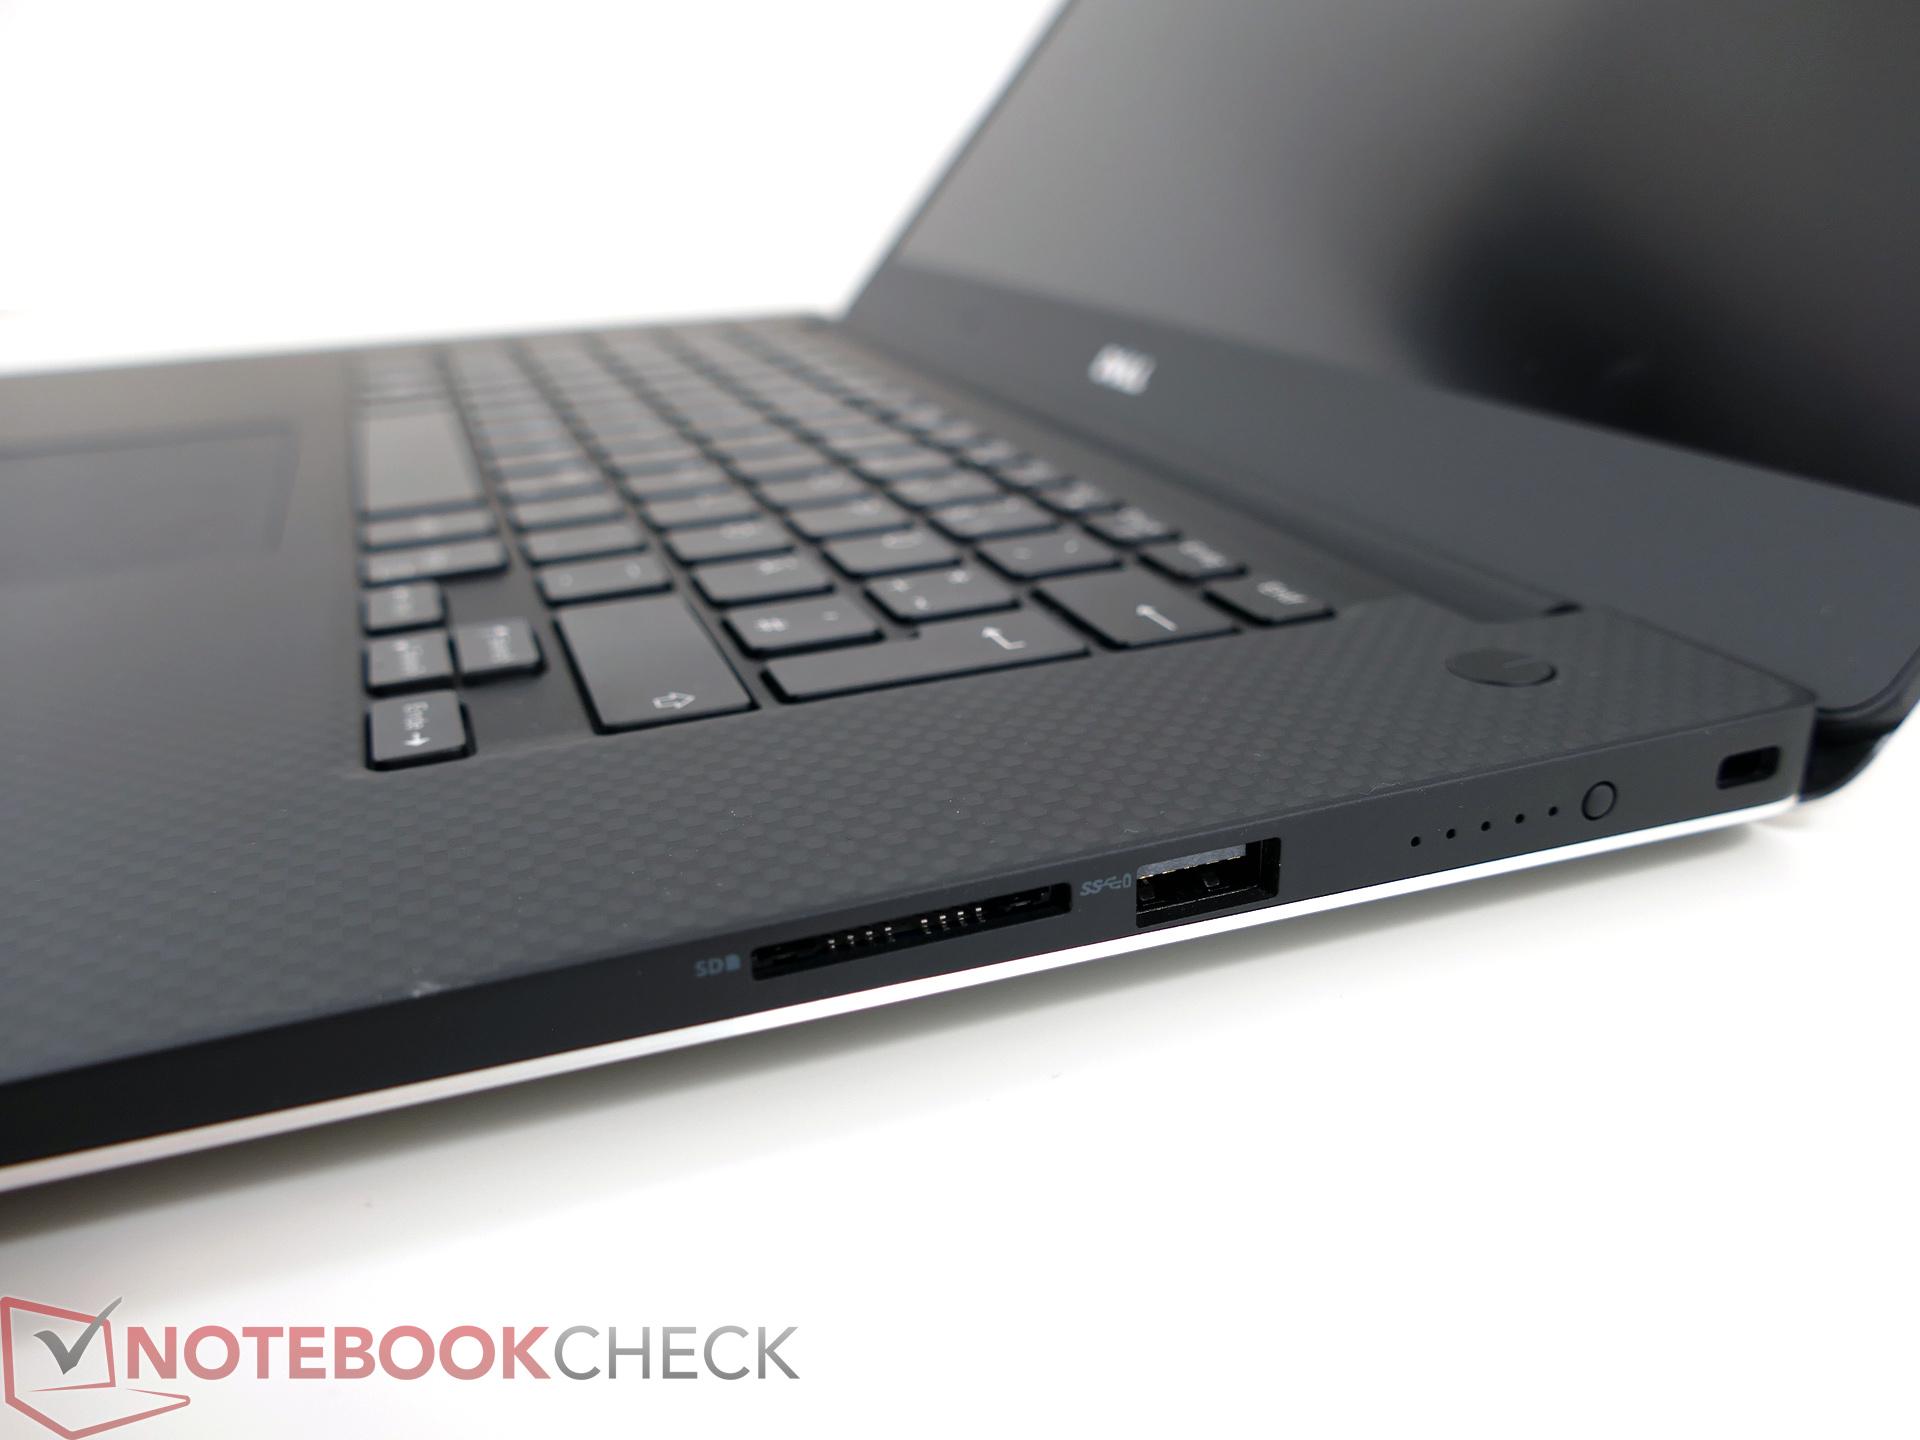
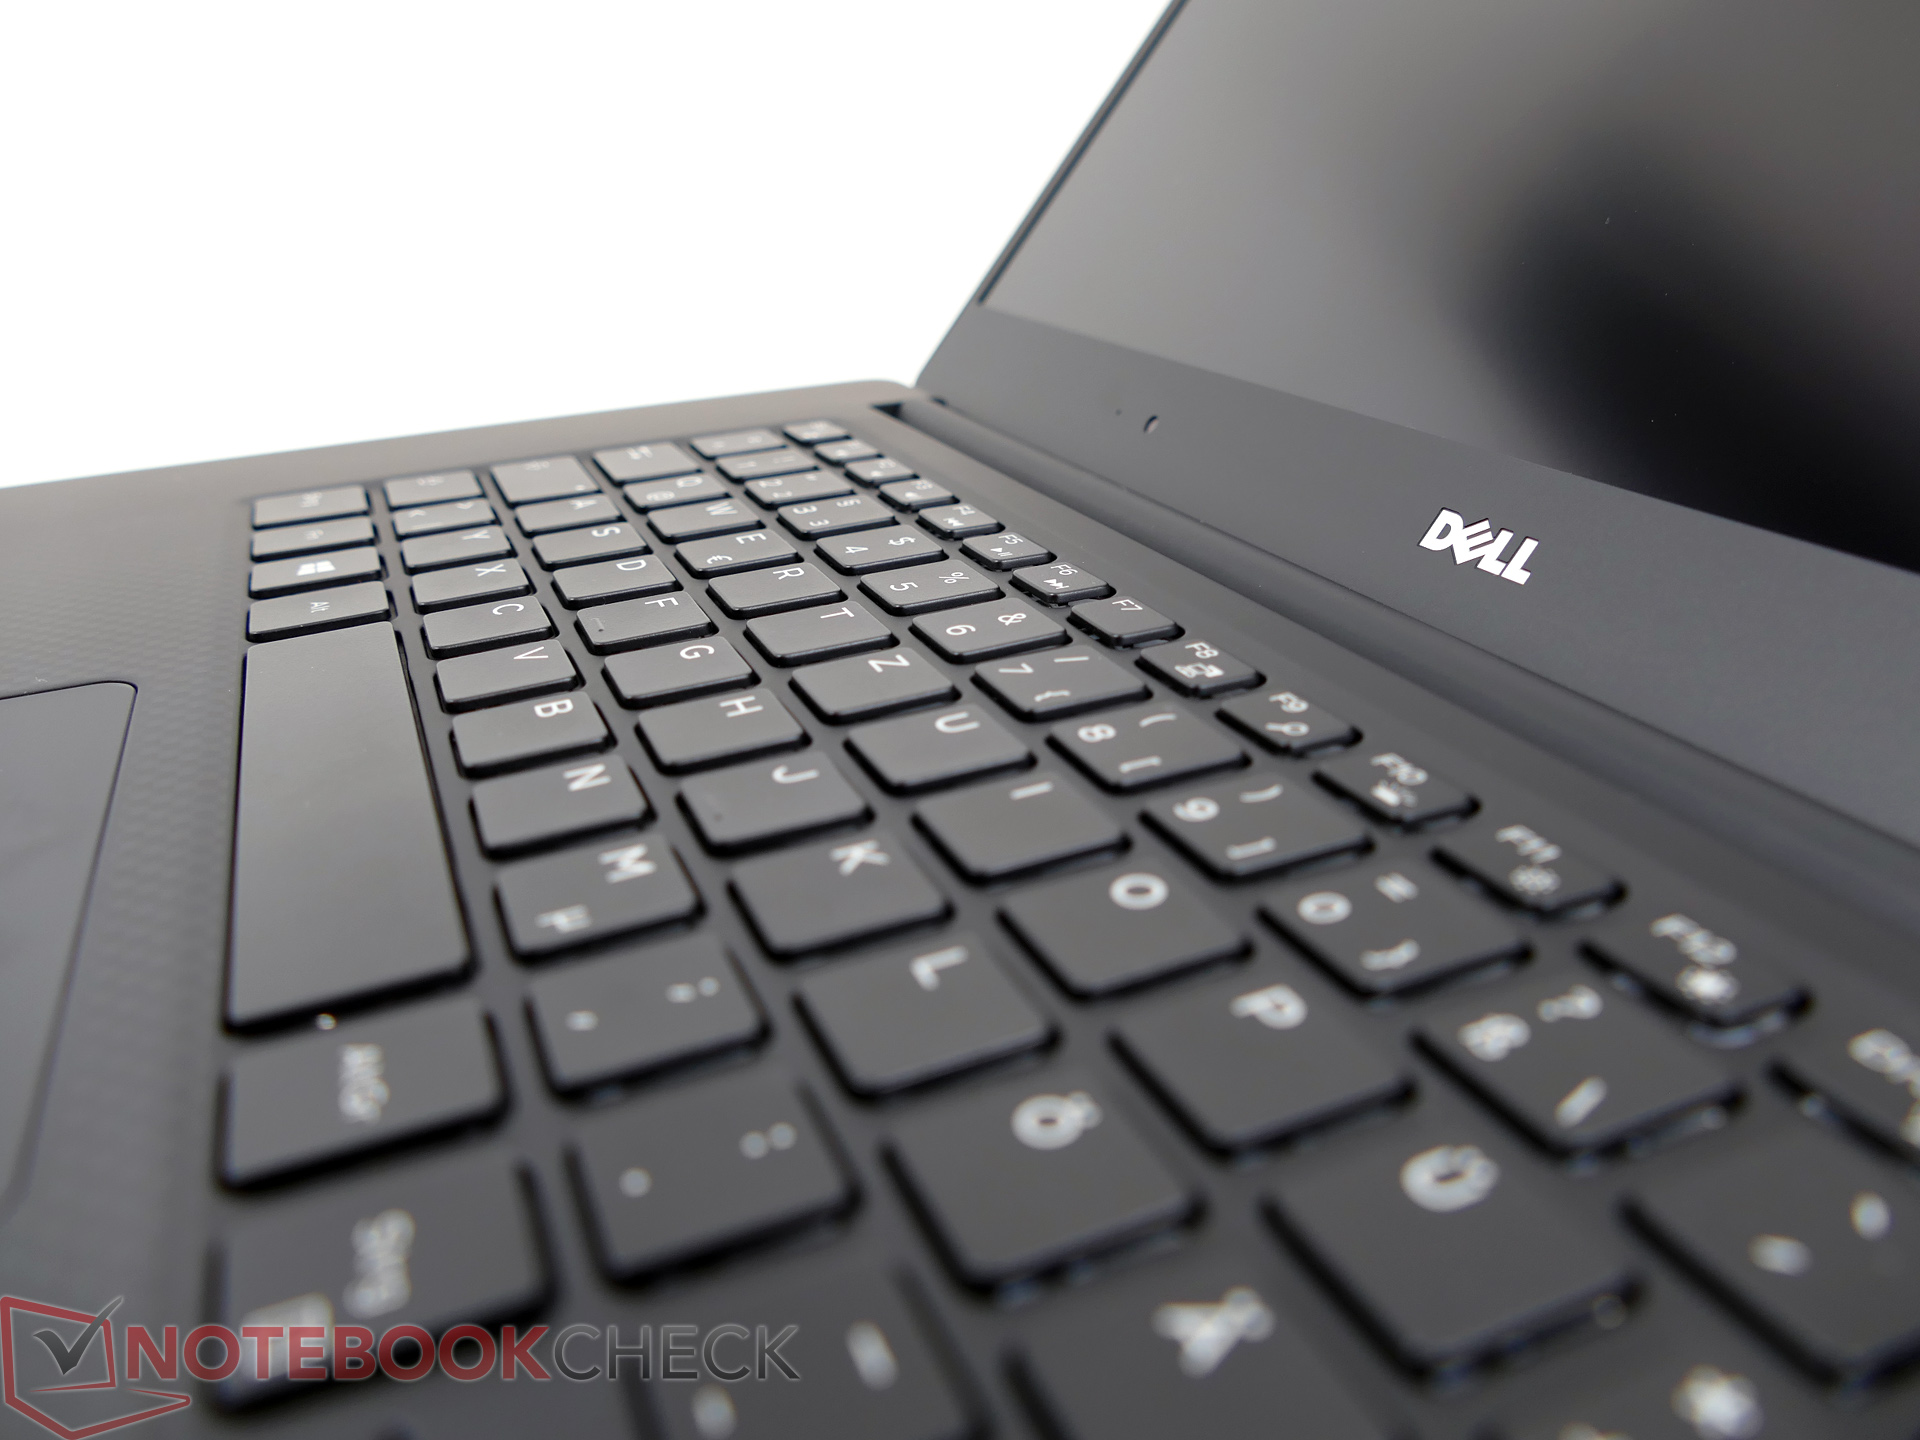
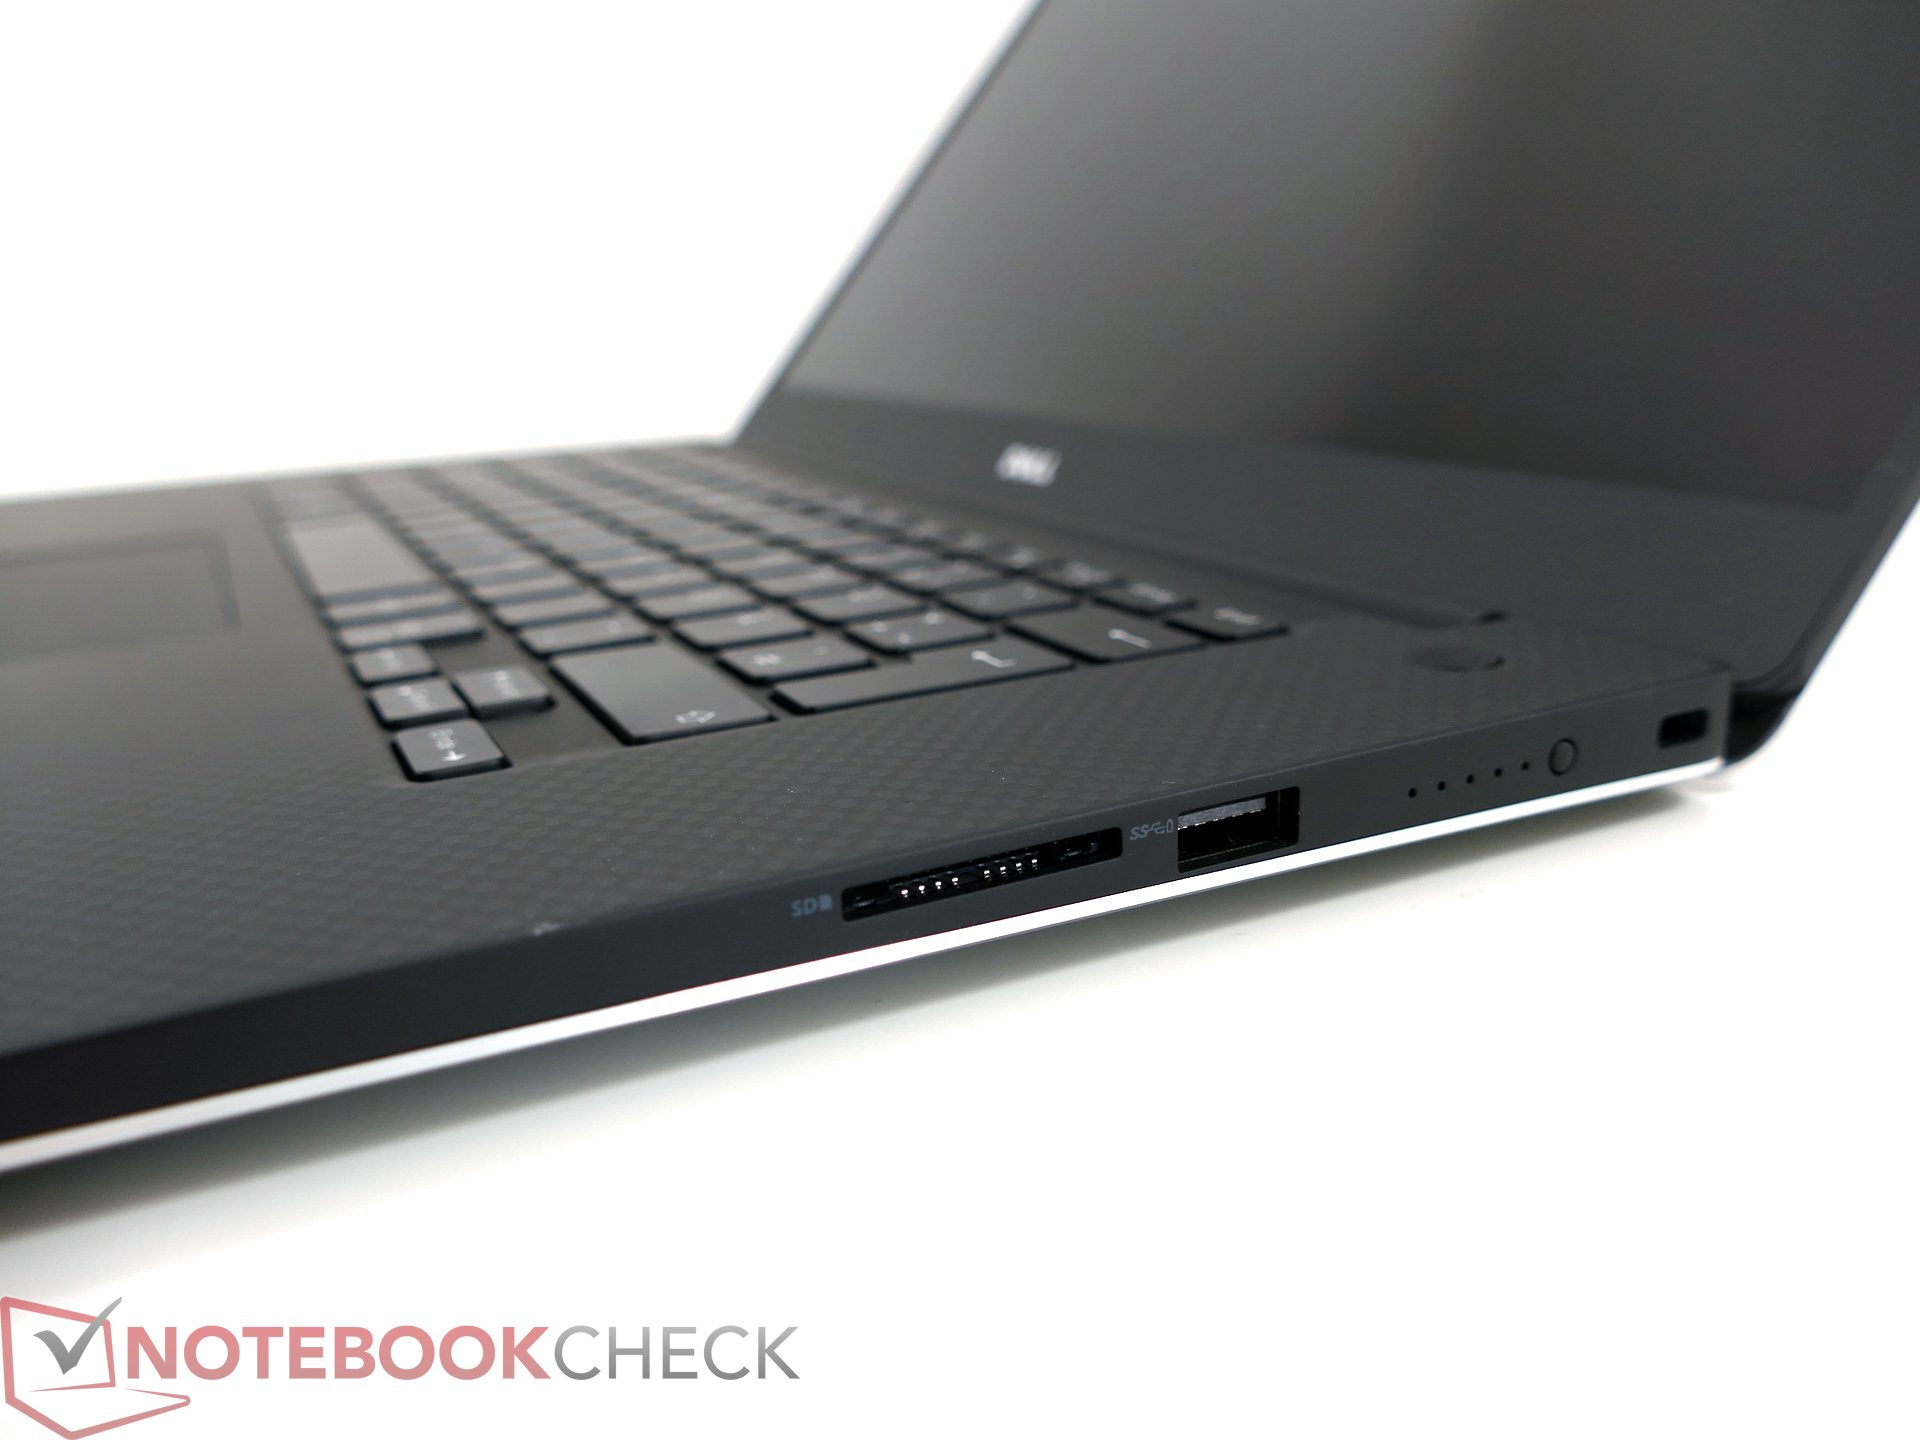
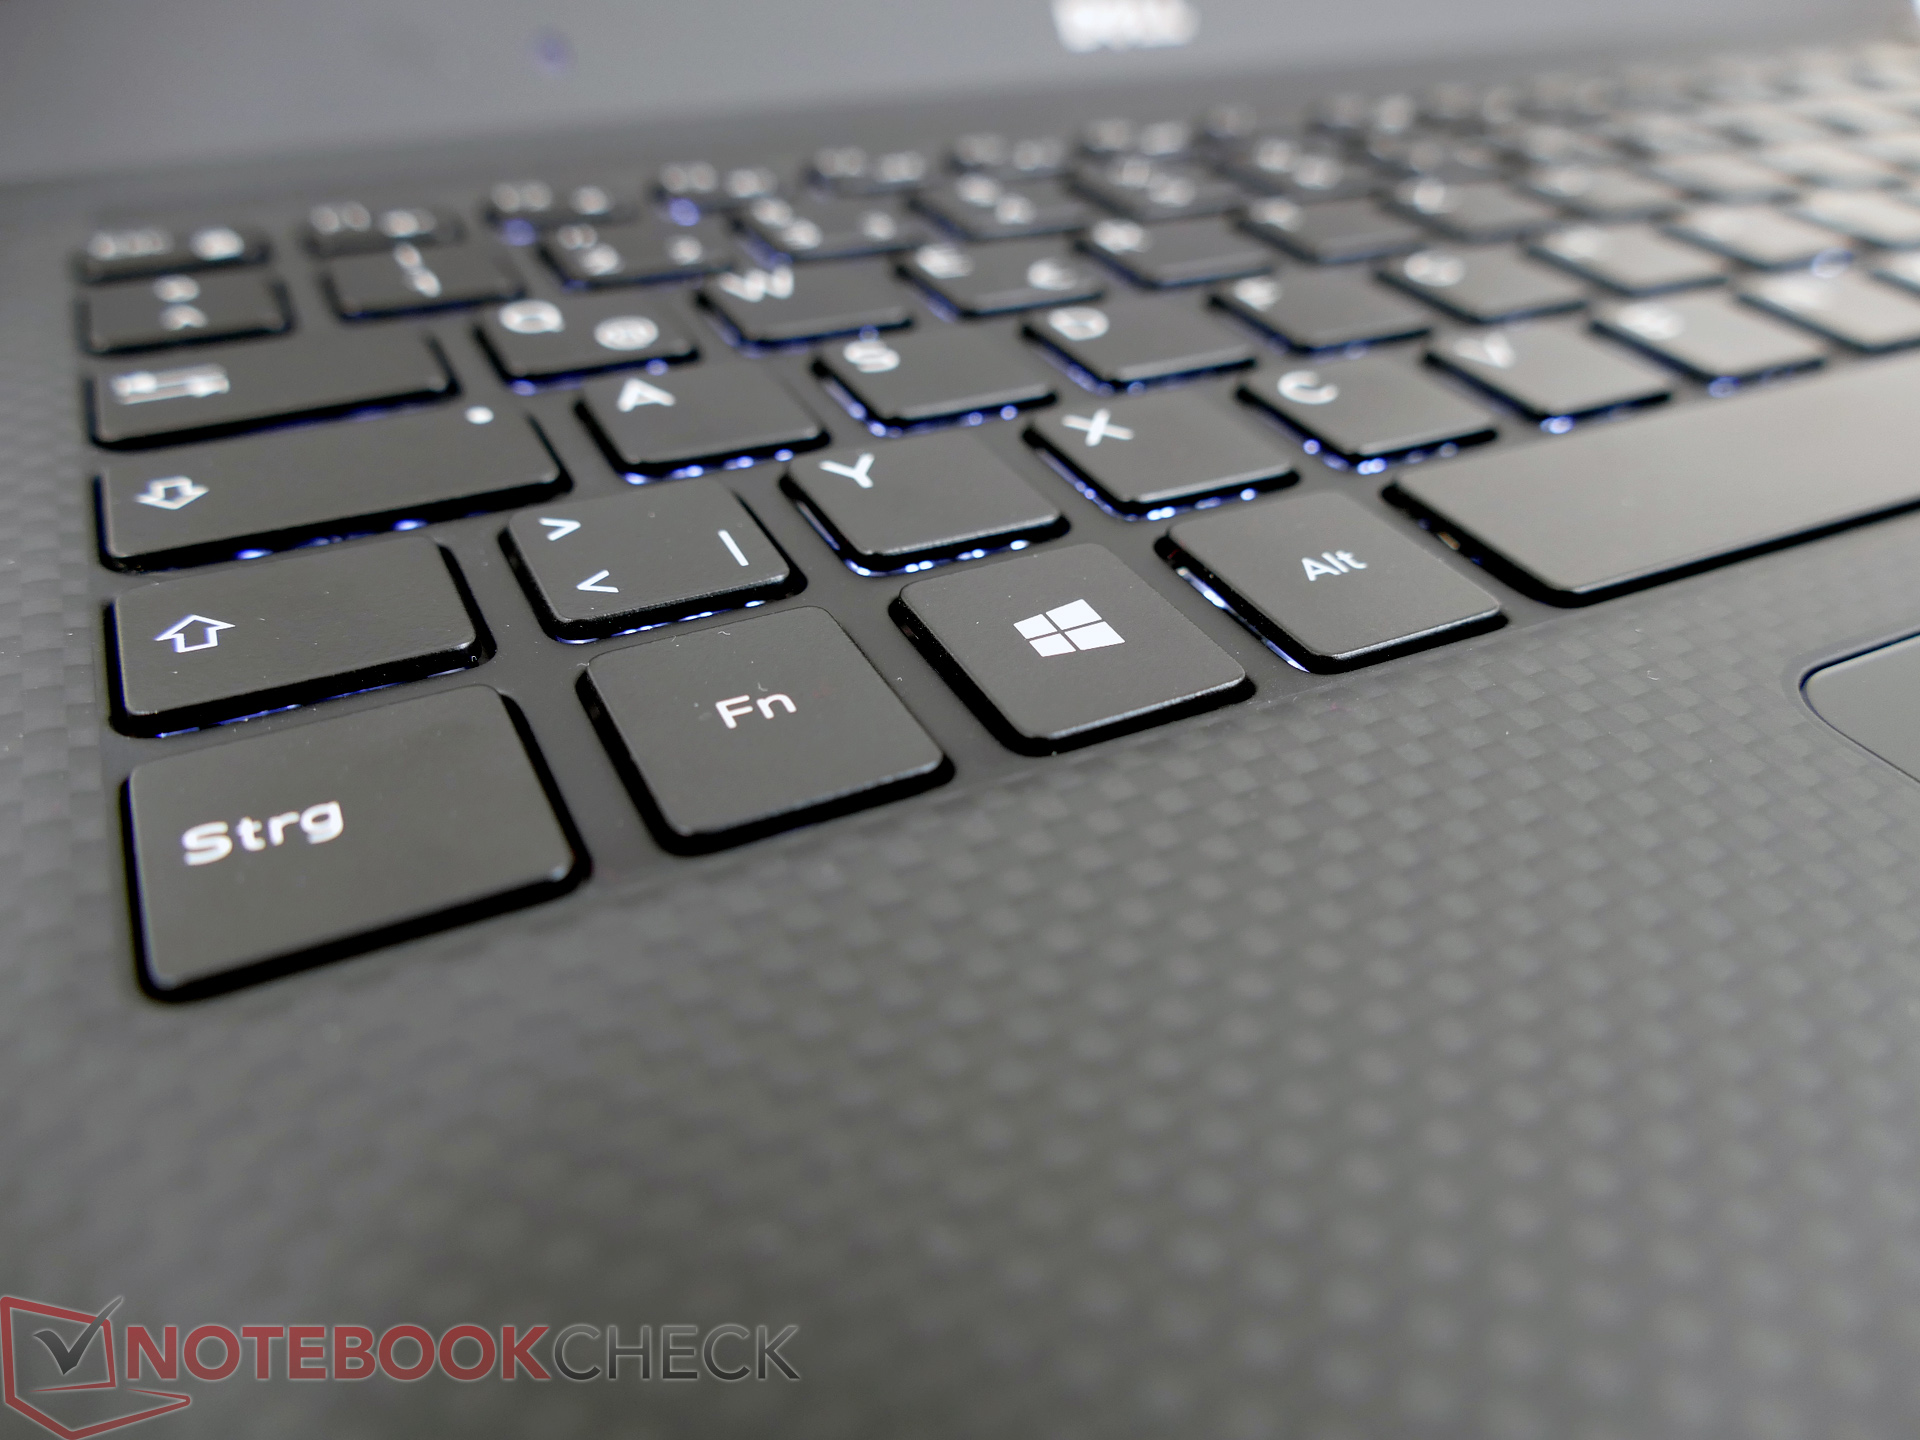
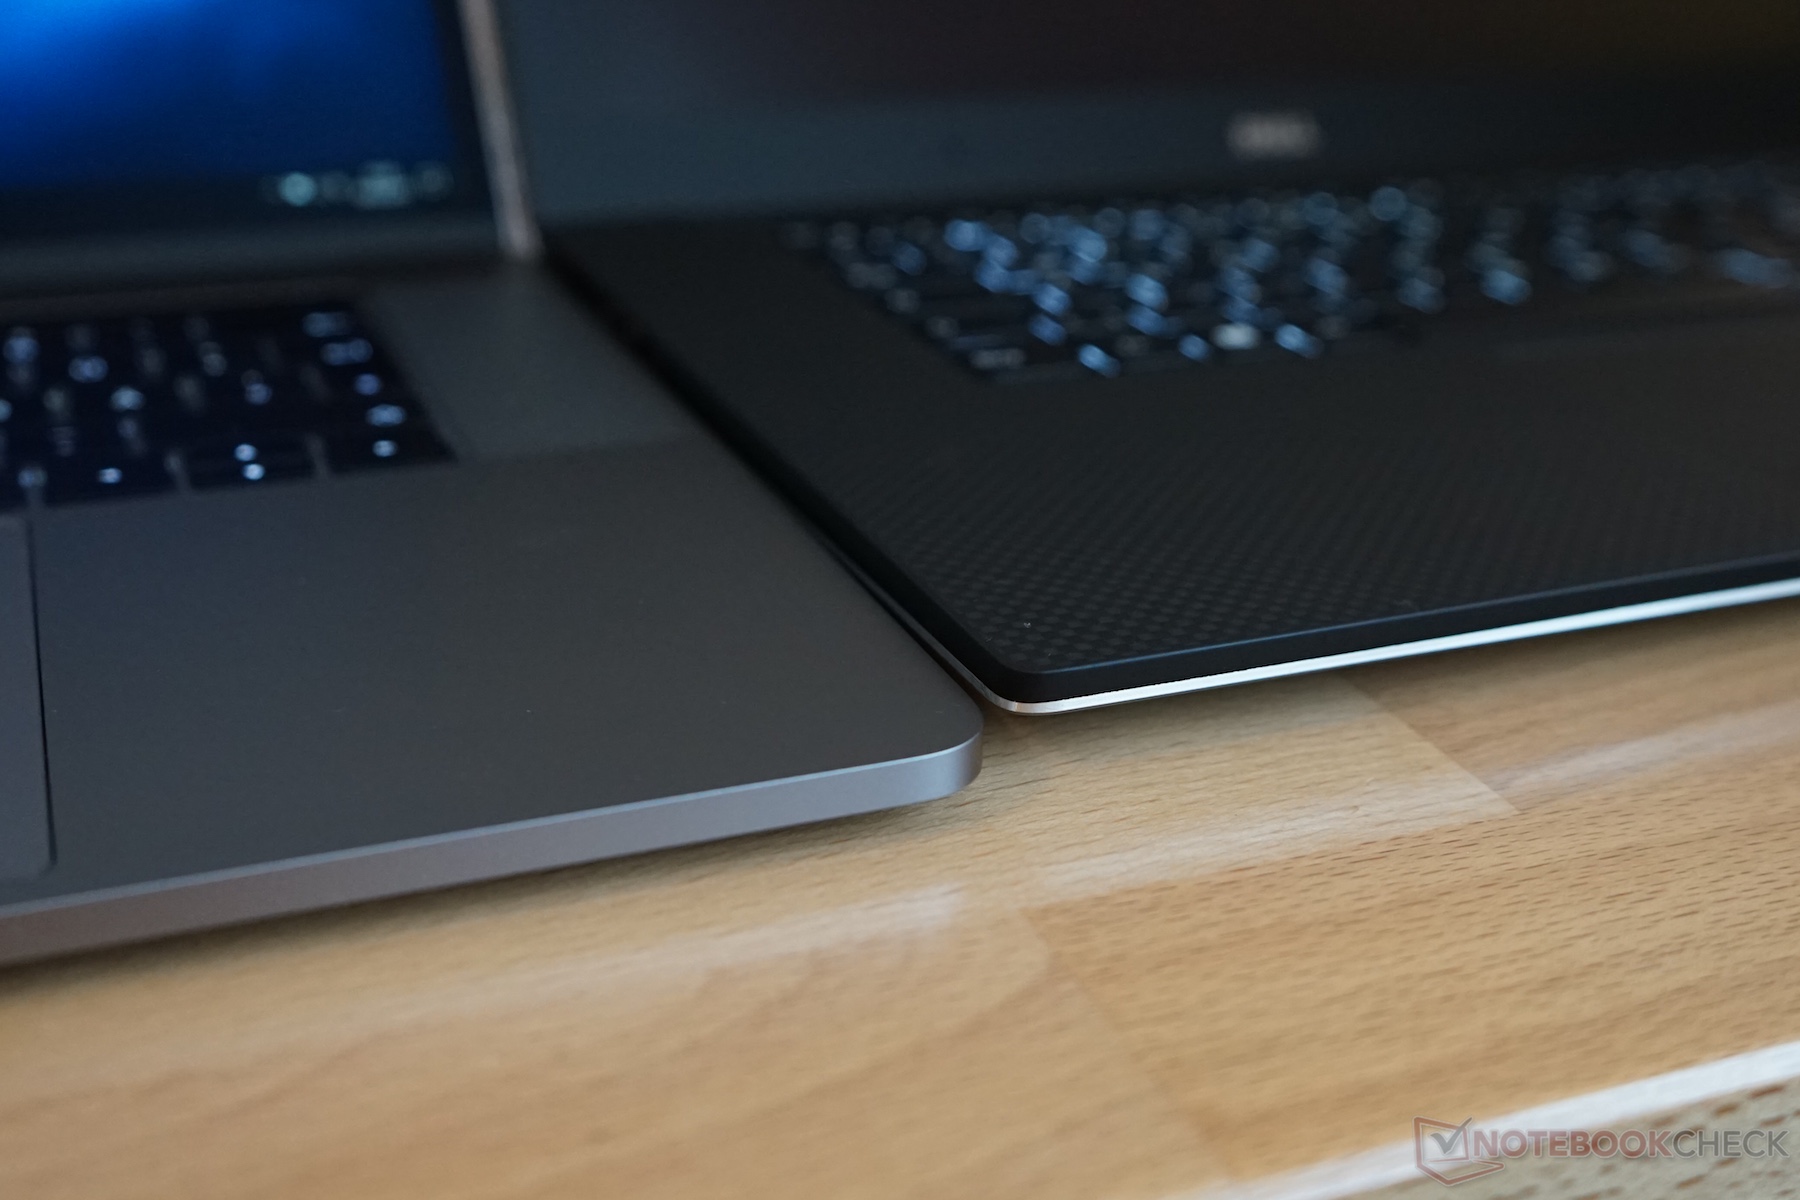
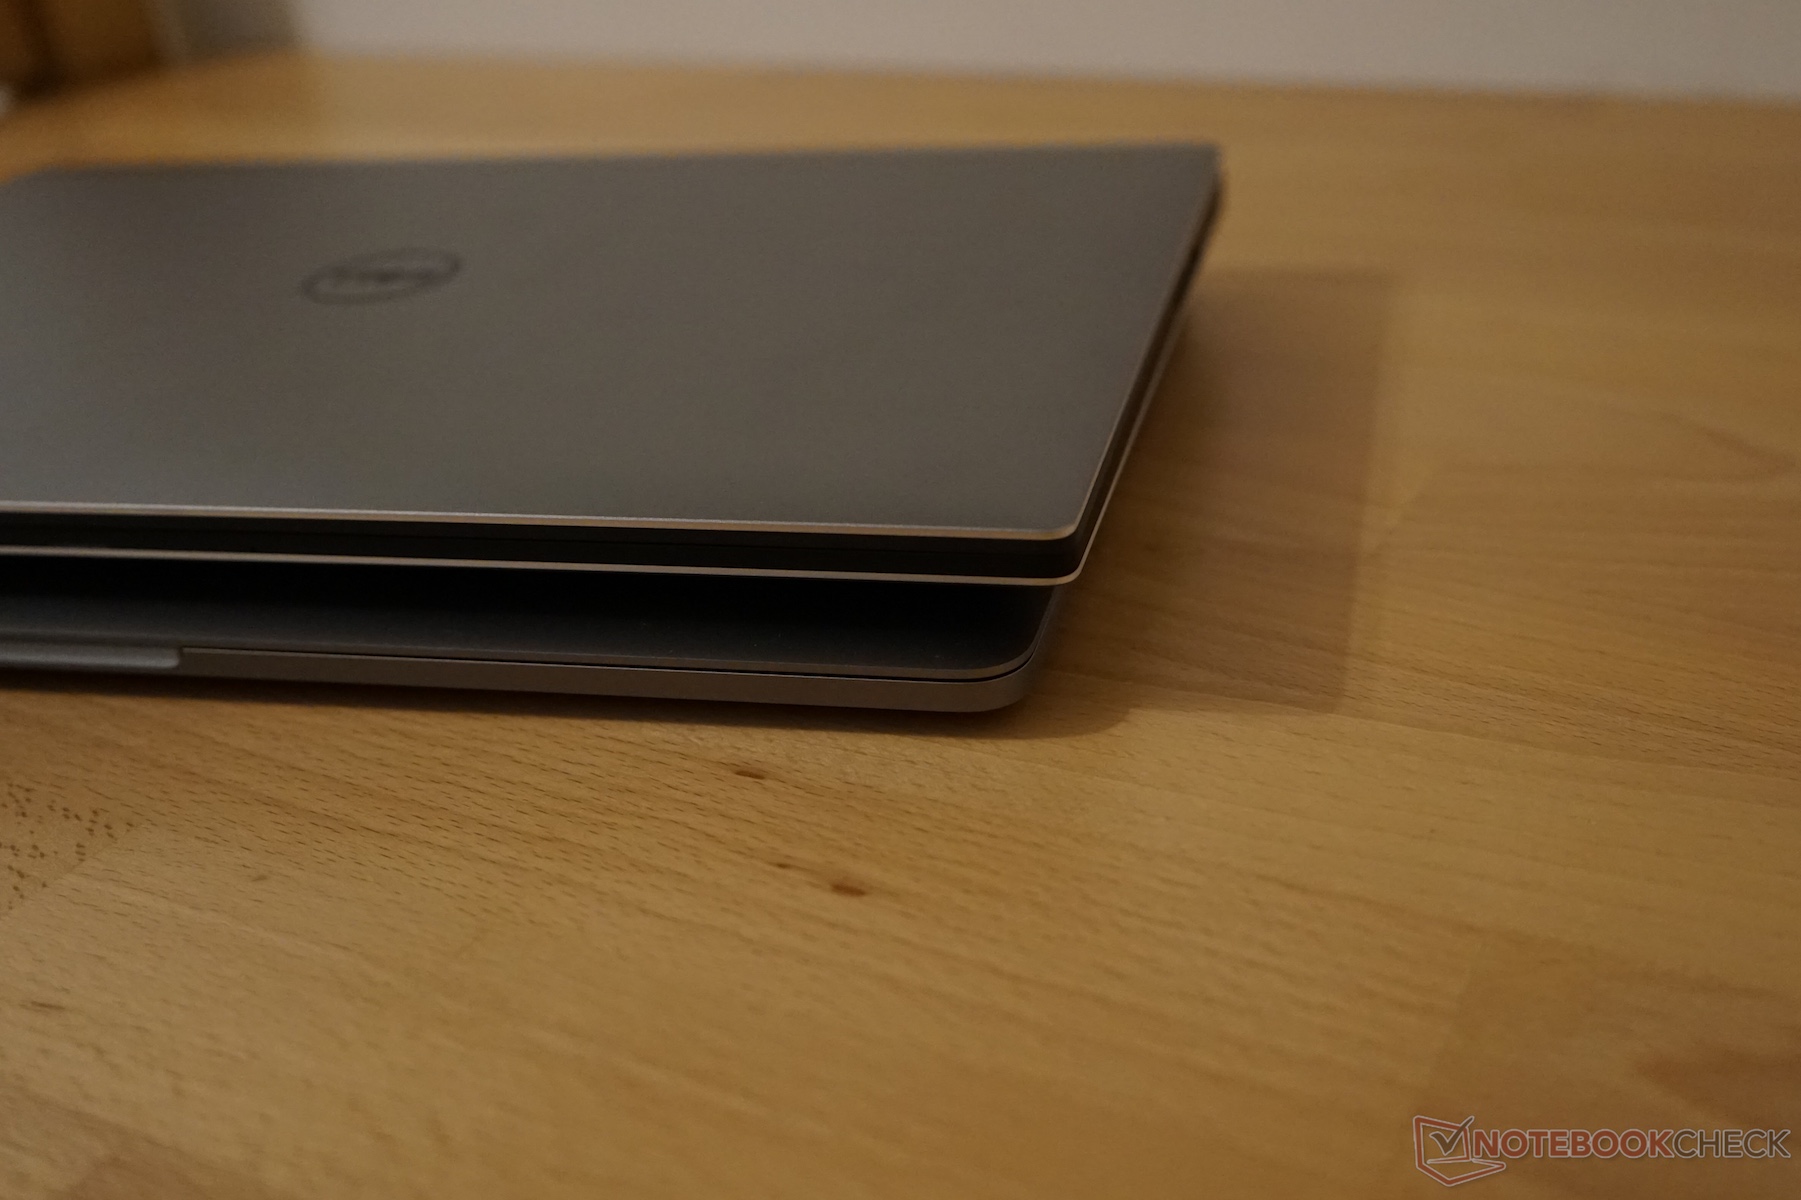
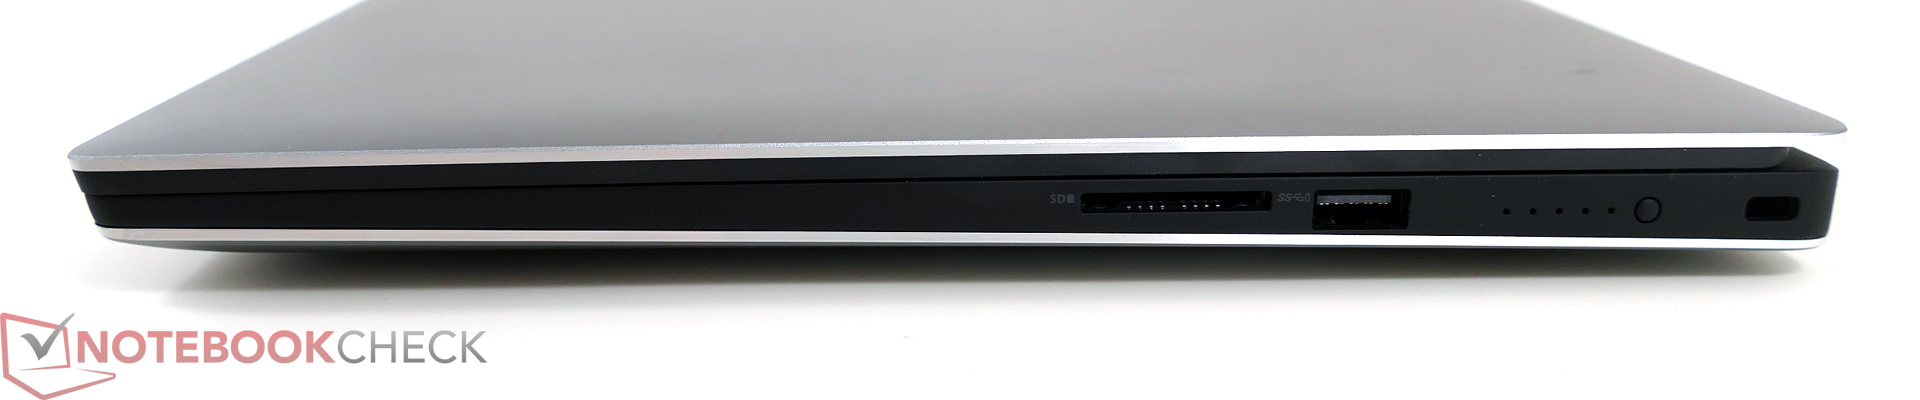
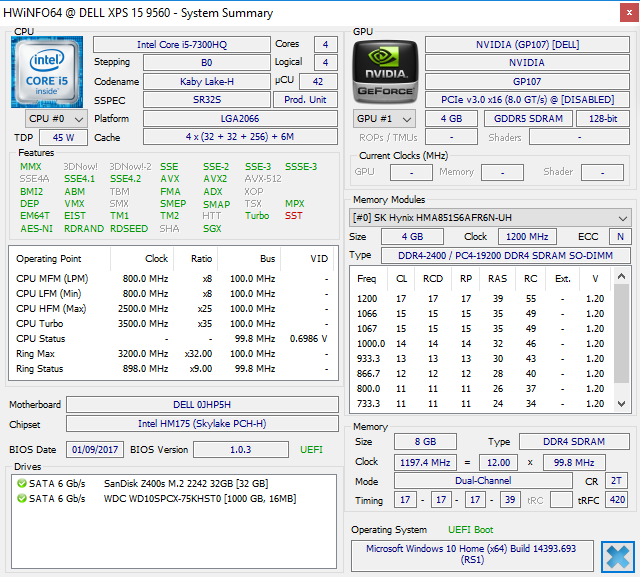
The performance of our Dell XPS 9560 in the mainstream configuration with the Intel i5-7300HQ and hybrid storage solution is very similar to the previous XPS 15 9550 in the areas of case, input devices, and connectivity. We still like the chassis with its combination of sophisticated materials that also provide good stability. The only drawback is still the sensitivity to dirt and grease around the palm rests and the touchpad, which are not easy to clean due to the soft-touch surfaces. The XPS is still one of the most compact 15-inch multimedia laptops thanks to the InfinityEdge display. The biggest problem of this solution is still the unfavorable position of the webcam at the lower display frame.
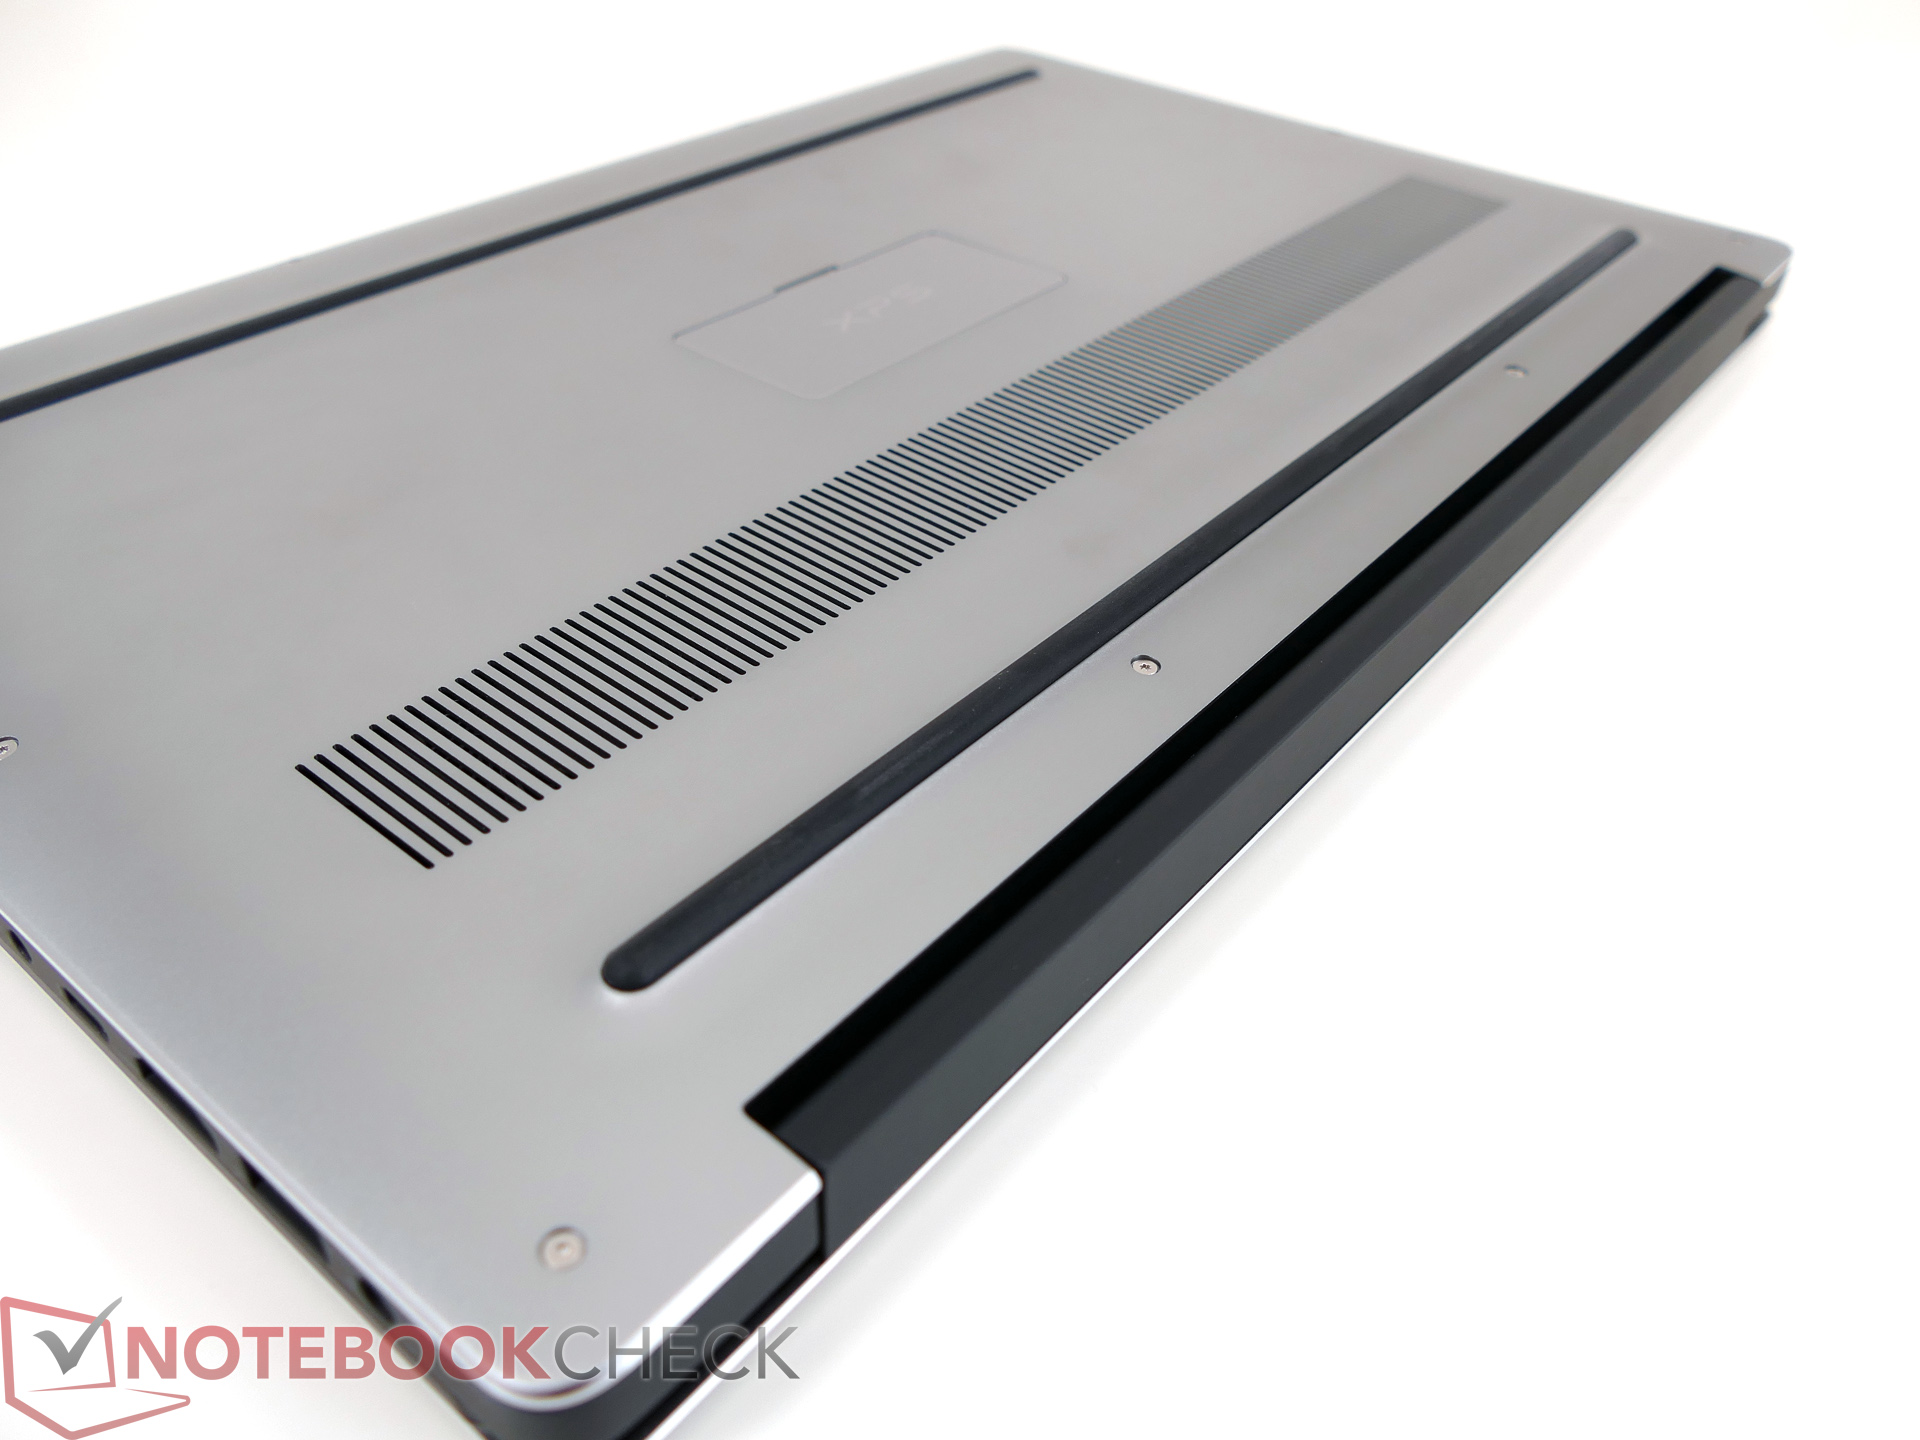
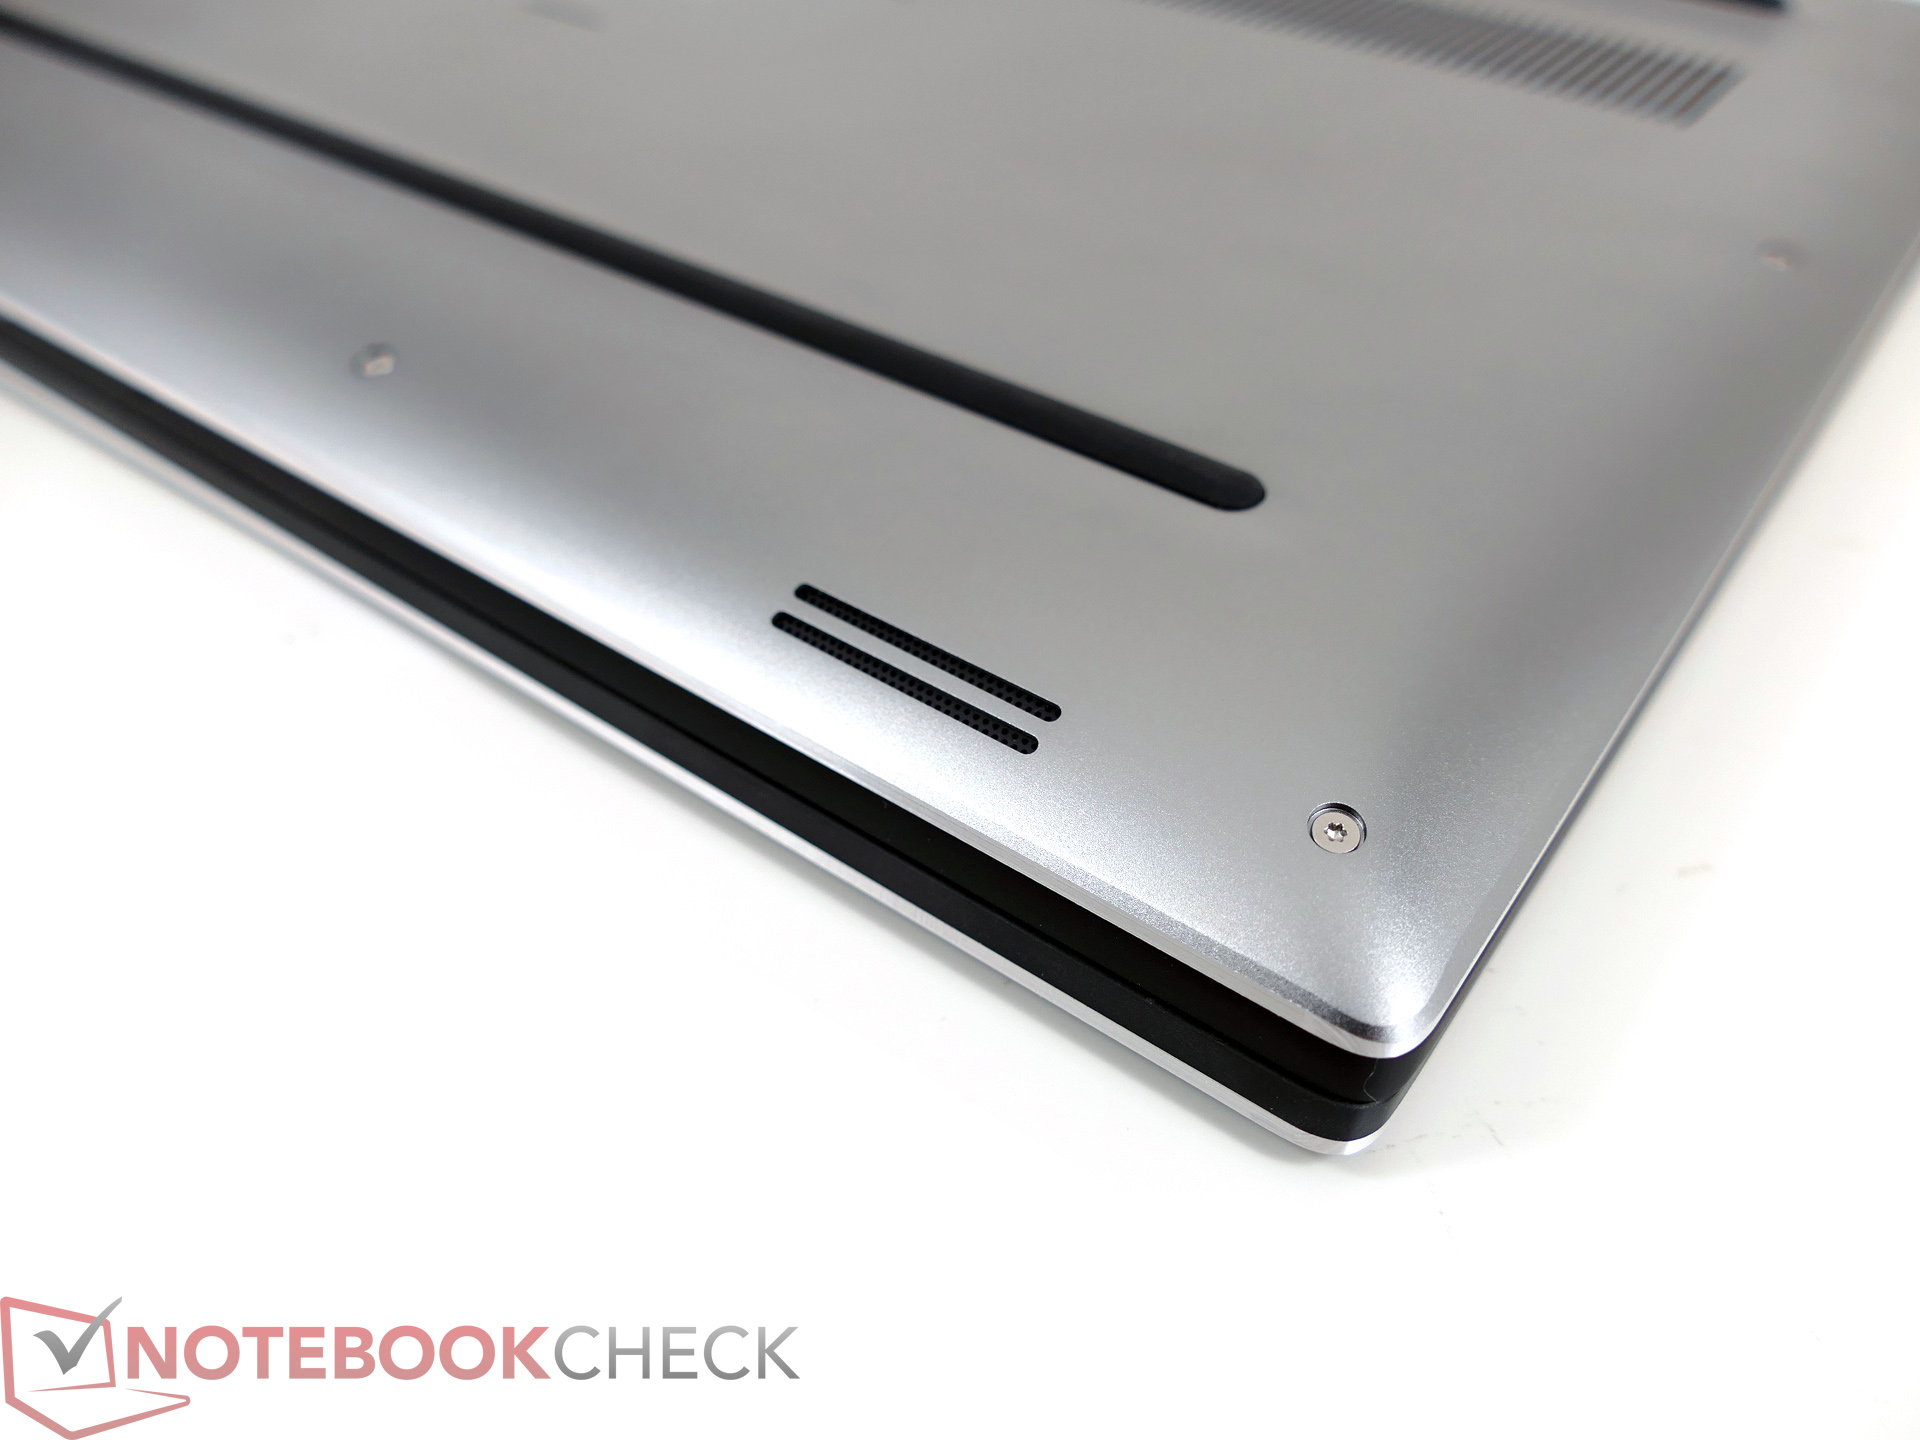
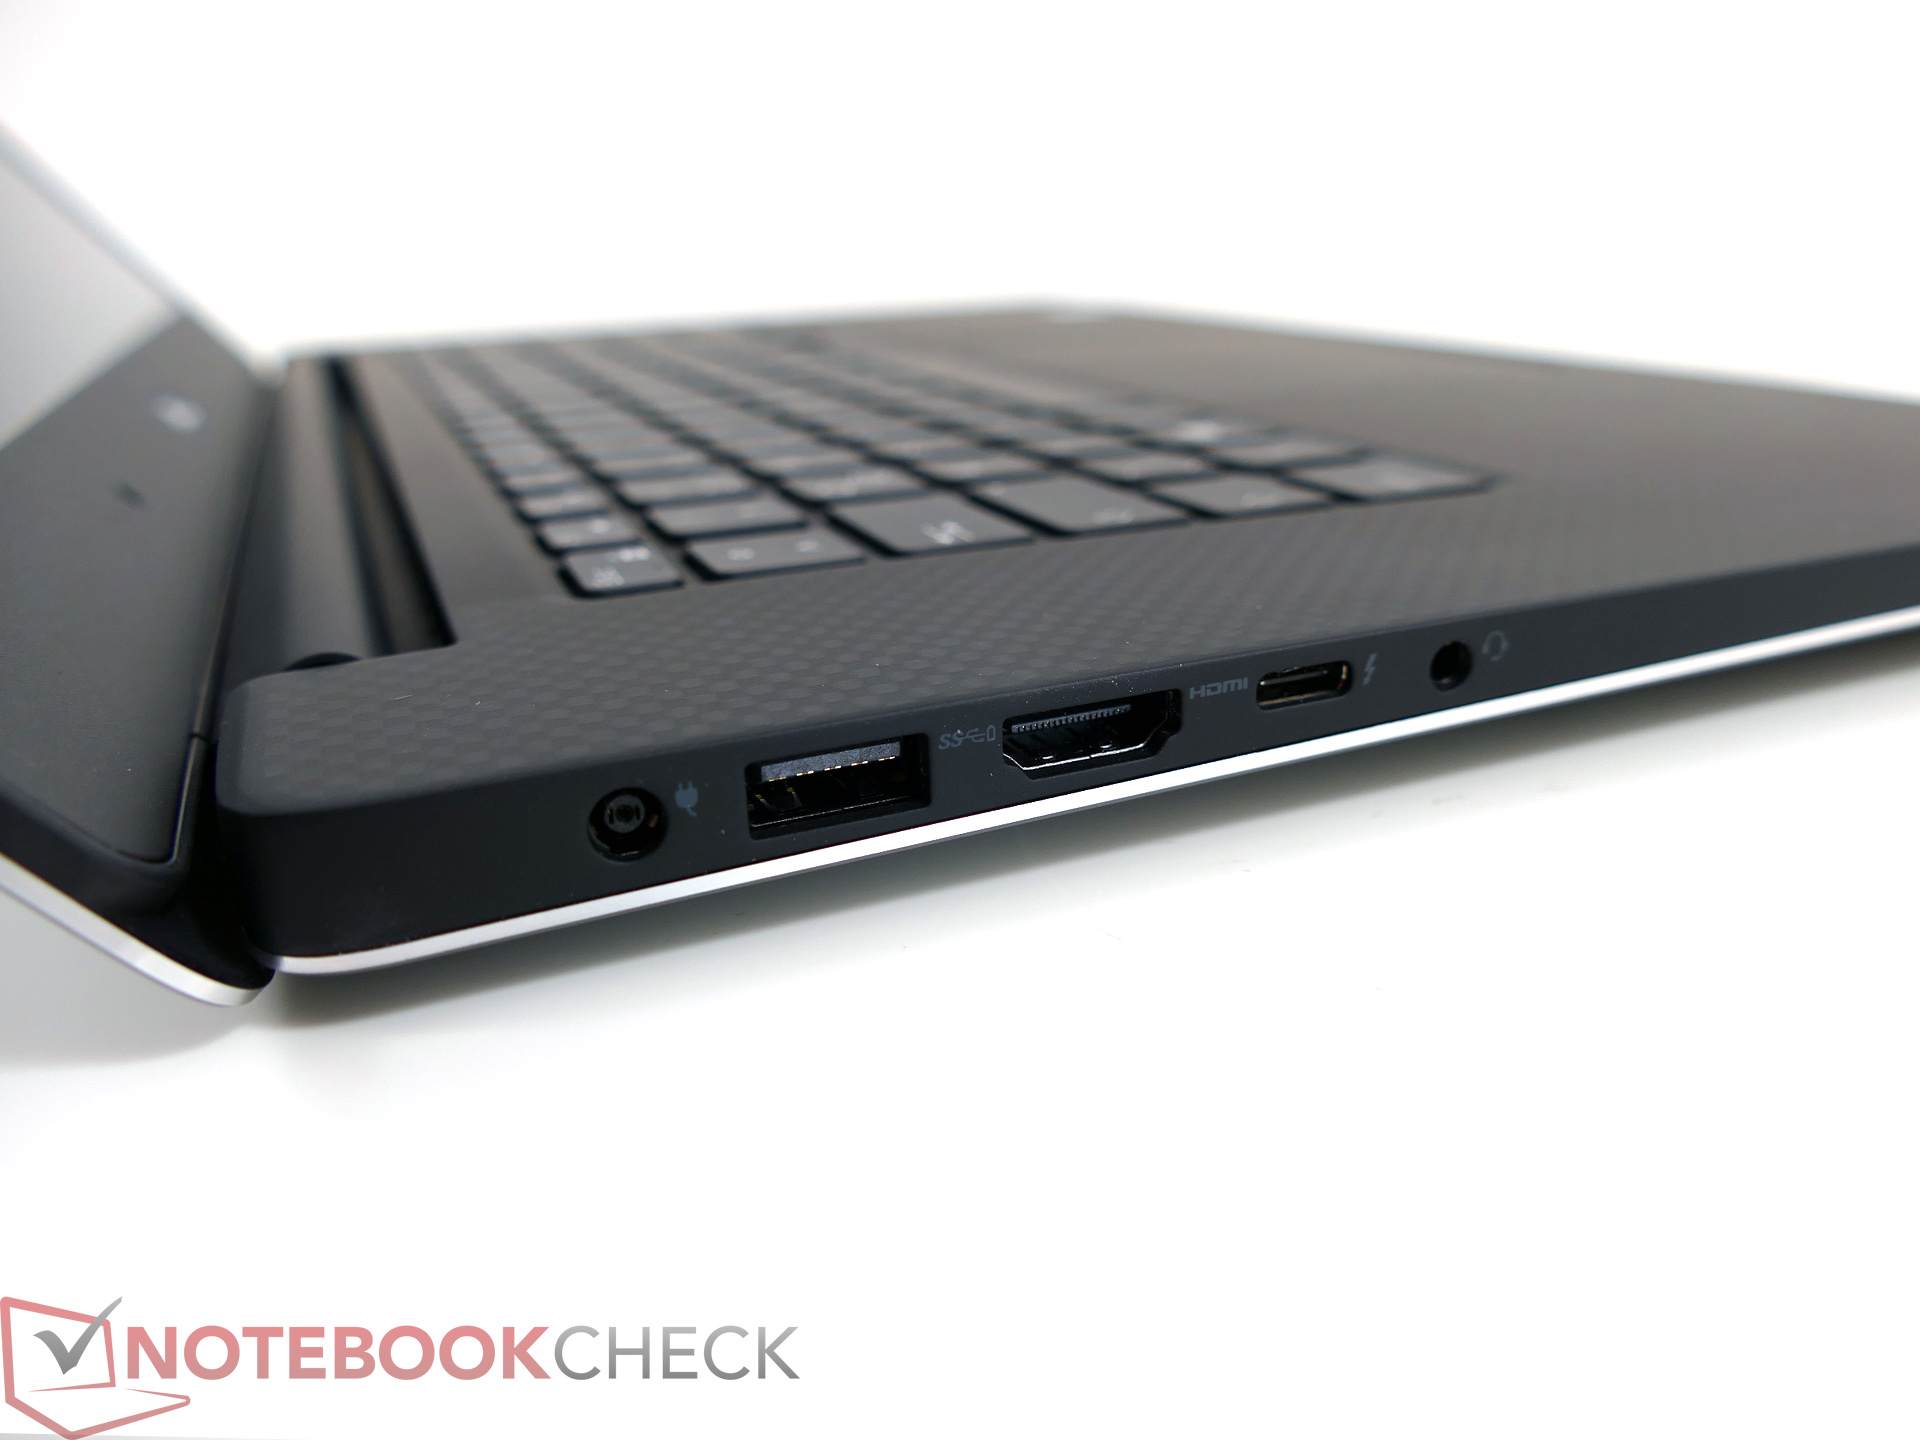
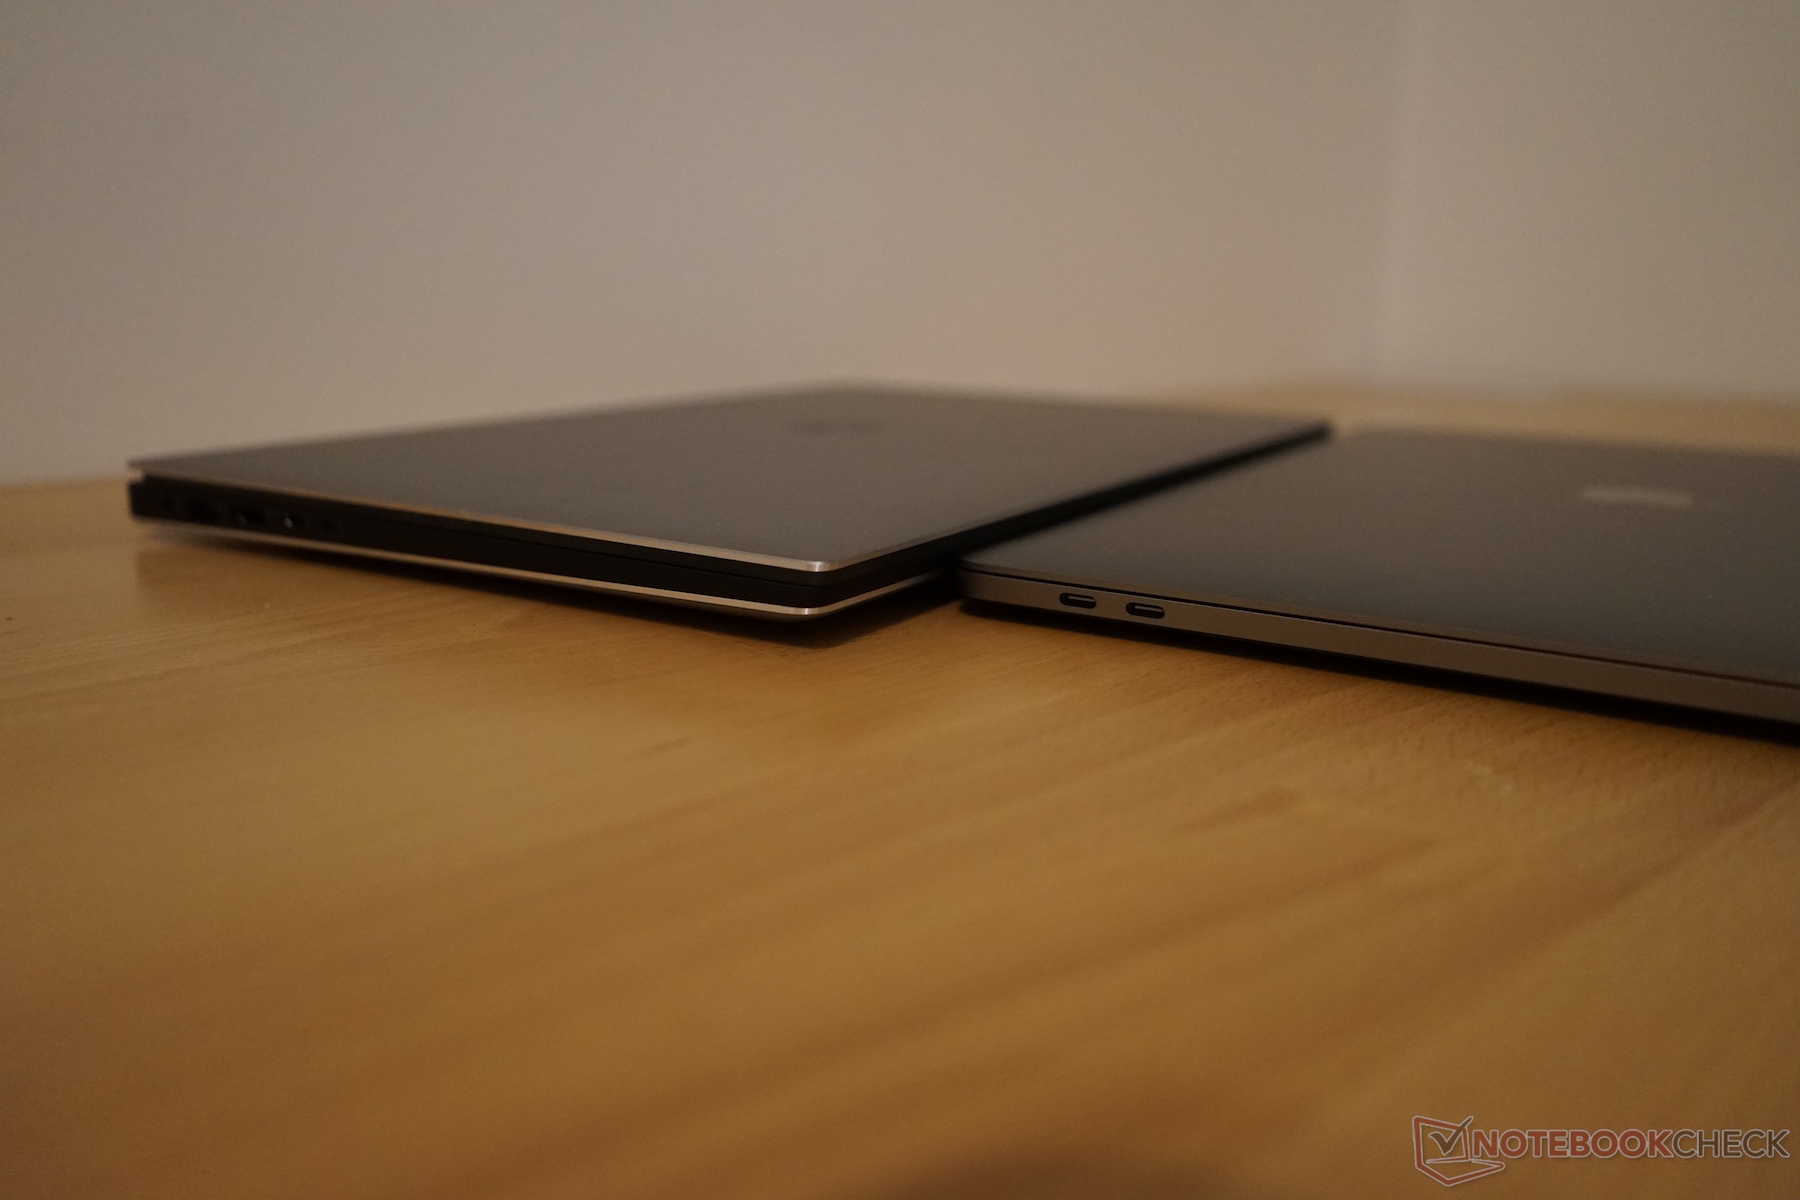
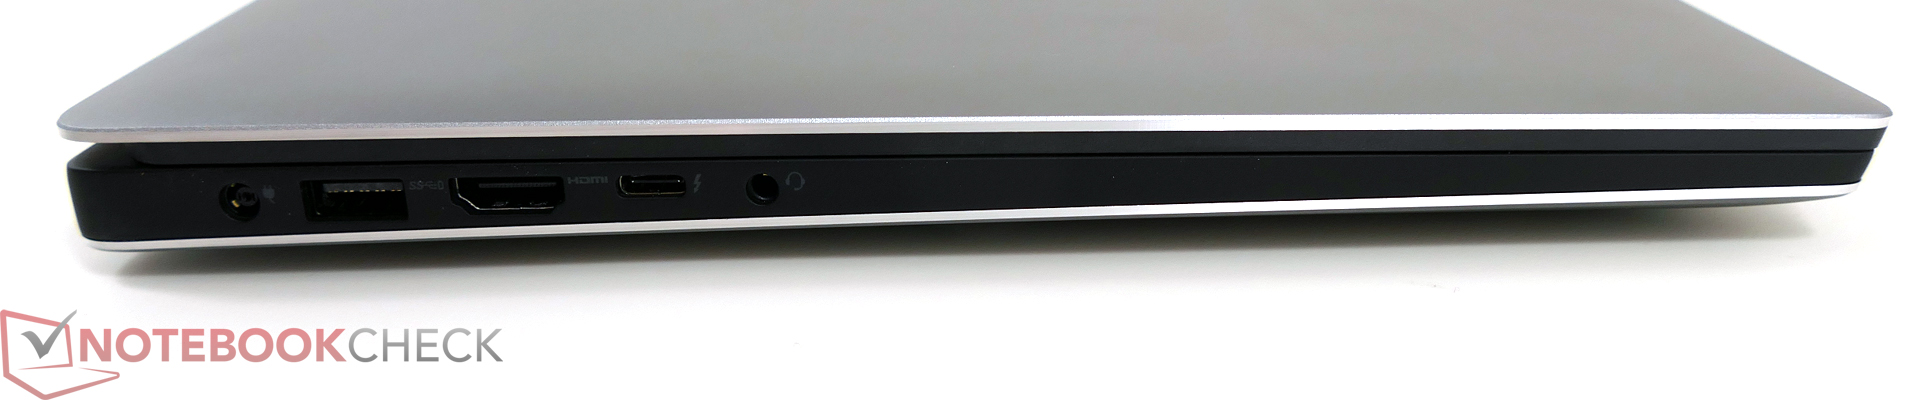
The accessibility of the internal components is exemplary. Even inexperienced users can easily replace the storage solution, RAM, or the battery with the right screwdriver. However, it is unfortunate that the Thunderbolt 3 port is only attached via two PCIe lanes. We will try to check the impact on external graphics cards in an upcoming review.
The matte Full HD display is a good overall package and suits the other components of the Dell XPS 15 9560. You can enjoy the high luminance and the good contrast by default, but correct colors require the use of the calibrated profile (linked above). The optional 4K display provides sharper pictures and the previous model also manage a wider color gamut, which might be interesting for some users.
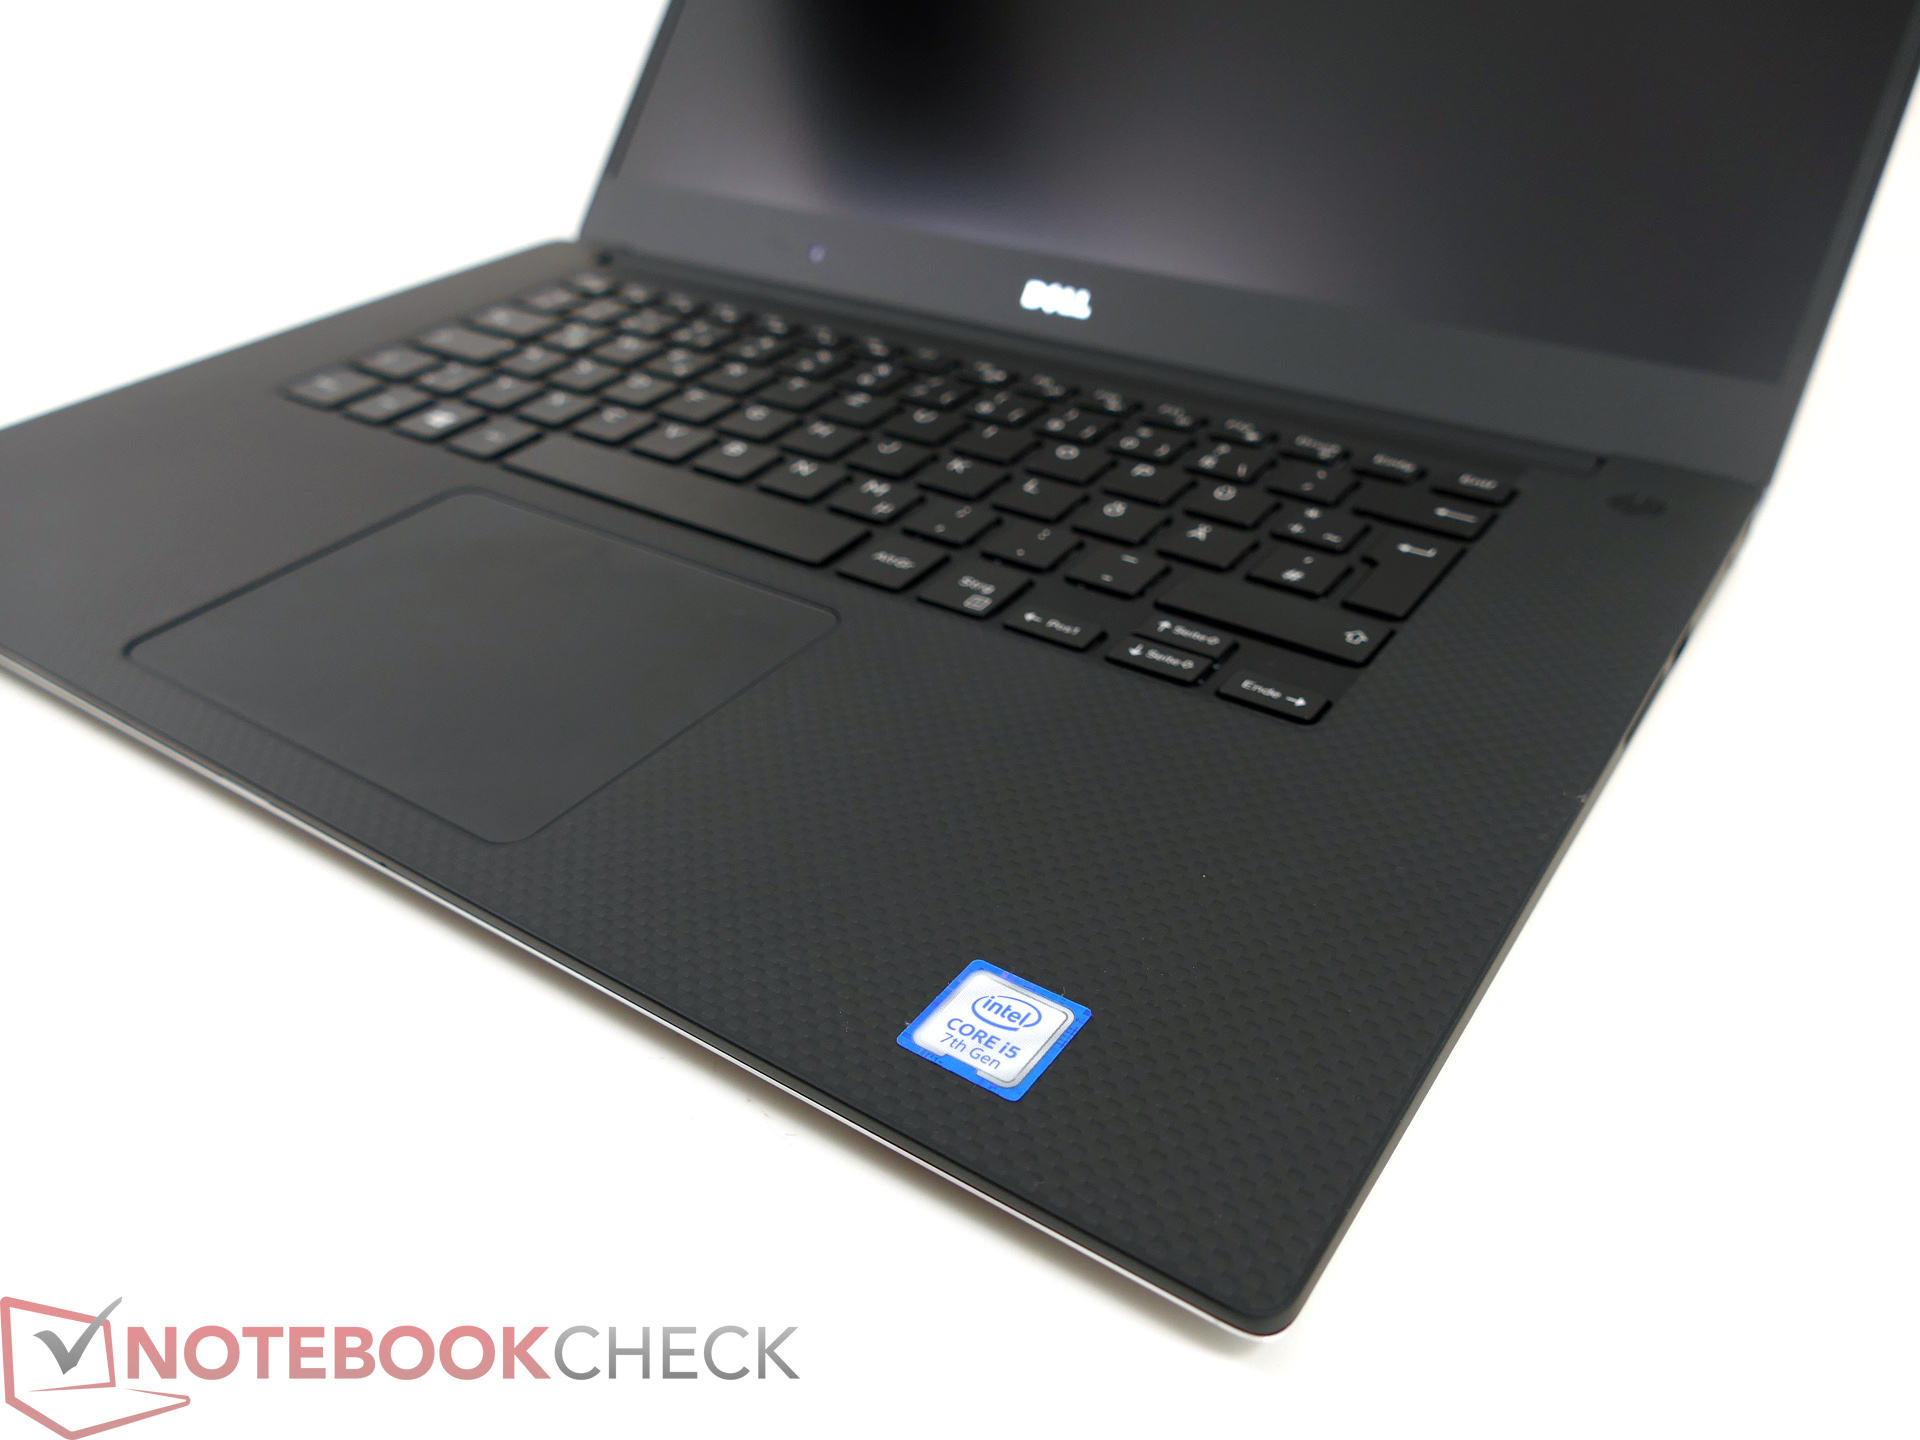
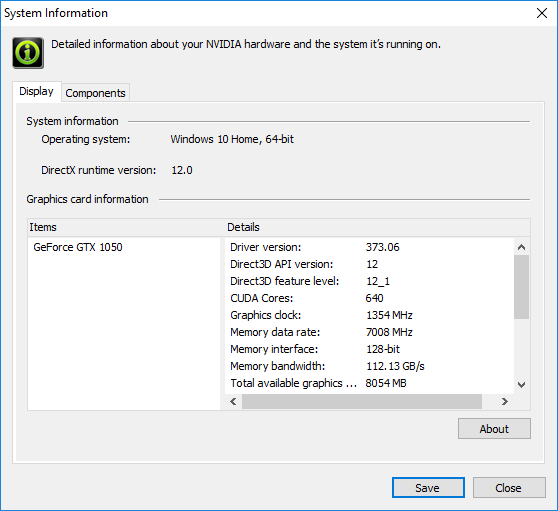
The upgrade to the GeForce GTX 1050 is the highlight when we have a look at the performance. Depending on the application, we can see performance advantages of more than 50% over the previous model. The i5-7300HQ of our test model can close the gap to the i7-6700HQ of the predecessor when you only use one core, but is still much slower in multi-core scenarios. However, the i5 is sufficient for everyday applications as well as gaming. You should not skip a full-fledged PCIe-SSD in combination with a larger battery though. The hybrid solution on our test model (SSD cache + HDD) cannot compete with an SSD-only solution in terms of subjective performance impression. The HDD also creates a constant murmur.
Full HD or 4K display, Intel i5 or i7 – all models have their advantages. However, you should always get a model with a faster PCIe-SSD and the larger 97-Wh battery.
Speaking of audible: We can sometimes hear electronic noises, but our ears had to be very close to the device. This should not be an inconvenience though. The maximum fan noise during gaming, for example, is a bigger issue and can be annoying for noise-sensitive users. The speakers on the other hand deliver a good sound.
Battery runtimes of around 5.5 hours (Wi-Fi test) can compensate some periods without a socket, but we expect a bit more. The configuration with the Full HD display in combination with the large 97-Wh battery (SSD-only) should provide the best results. We are currently waiting for the test model of the high-end spec with the 4K display, 512 GB SSD, and Intel i7-7700HQ, and we will also try to get an SKU with FHD, SSD, and i7-7700HQ for another review. We will also further investigate the predecessor issues with overheating VRMs (voltage regulator modules) with the 7700HQ. Our current test model with the i5-7300HQ did not suffer from any significant performance drops in long-term tests with Cinebench or The Witcher 3.
Dell XPS 15 2017 9560 (7300HQ, Full-HD)
- 02/14/2017 v6 (old)
J. Simon Leitner
Price comparison
