Test: Lenovo Yoga Creator 7 15IMH05 - Dolby Vision, riktigt bra batteritid och tre års garanti (Sammanfattning)
Testgrupp
Gradering | Datum | Modell | Vikt | Höjd | Storlek | Upplösning | Pris |
|---|---|---|---|---|---|---|---|
| 87.1 % v7 (old) | 04/2021 | Lenovo Yoga Creator 7 15IMH05 82DS000VGE i7-10750H, GeForce GTX 1650 Mobile | 1.8 kg | 17.5 mm | 15.60" | 1920x1080 | |
| 87 % v7 (old) | 12/2020 | Asus ZenBook UX535-M01440 i7-10750H, GeForce GTX 1650 Ti Max-Q | 2 kg | 20 mm | 15.60" | 3840x2160 | |
| 83 % v7 (old) | 08/2020 | HP Envy 15-ep0098nr i7-10750H, GeForce RTX 2060 Max-Q | 2 kg | 19 mm | 15.60" | 3840x2160 | |
| 87.7 % v7 (old) | 12/2020 | Schenker Vision 15 i7-1165G7, Iris Xe G7 96EUs | 1.7 kg | 15 mm | 15.60" | 1920x1080 | |
| 90.1 % v7 (old) | 06/2020 | Dell XPS 15 9500 Core i7 4K UHD i7-10875H, GeForce GTX 1650 Ti Mobile | 2 kg | 18 mm | 15.60" | 3840x2400 | |
| 83.7 % v7 (old) | 02/2021 | MSI Summit E15 A11SCST i7-1185G7, GeForce GTX 1650 Ti Max-Q | 1.8 kg | 16.9 mm | 15.60" | 1920x1080 |


| SD Card Reader | |
| average JPG Copy Test (av. of 3 runs) | |
| Dell XPS 15 9500 Core i7 4K UHD (Toshiba Exceria Pro SDXC 64 GB UHS-II) | |
| Genomsnitt av klass Multimedia (23 - 531, n=43, senaste 2 åren) | |
| Asus ZenBook UX535-M01440 (Toshiba Exceria Pro M501 microSDXC 64GB) | |
| HP Envy 15-ep0098nr (Toshiba Exceria Pro M501 UHS-II) | |
| Lenovo Yoga Creator 7 15IMH05 82DS000VGE (Toshiba Exceria Pro SDXC 64 GB UHS-II) | |
| maximum AS SSD Seq Read Test (1GB) | |
| Dell XPS 15 9500 Core i7 4K UHD (Toshiba Exceria Pro SDXC 64 GB UHS-II) | |
| Genomsnitt av klass Multimedia (27.9 - 1455, n=42, senaste 2 åren) | |
| HP Envy 15-ep0098nr (Toshiba Exceria Pro M501 UHS-II) | |
| Asus ZenBook UX535-M01440 (Toshiba Exceria Pro M501 microSDXC 64GB) | |
| Lenovo Yoga Creator 7 15IMH05 82DS000VGE (Toshiba Exceria Pro SDXC 64 GB UHS-II) | |


")
")


| |||||||||||||||||||||||||
Distribution av ljusstyrkan: 81 %
Mitt på batteriet: 363 cd/m²
Kontrast: 2000:1 (Svärta: 0.18 cd/m²)
ΔE ColorChecker Calman: 6.84 | ∀{0.5-29.43 Ø4.73}
calibrated: 2.54
ΔE Greyscale Calman: 12.94 | ∀{0.09-98 Ø4.97}
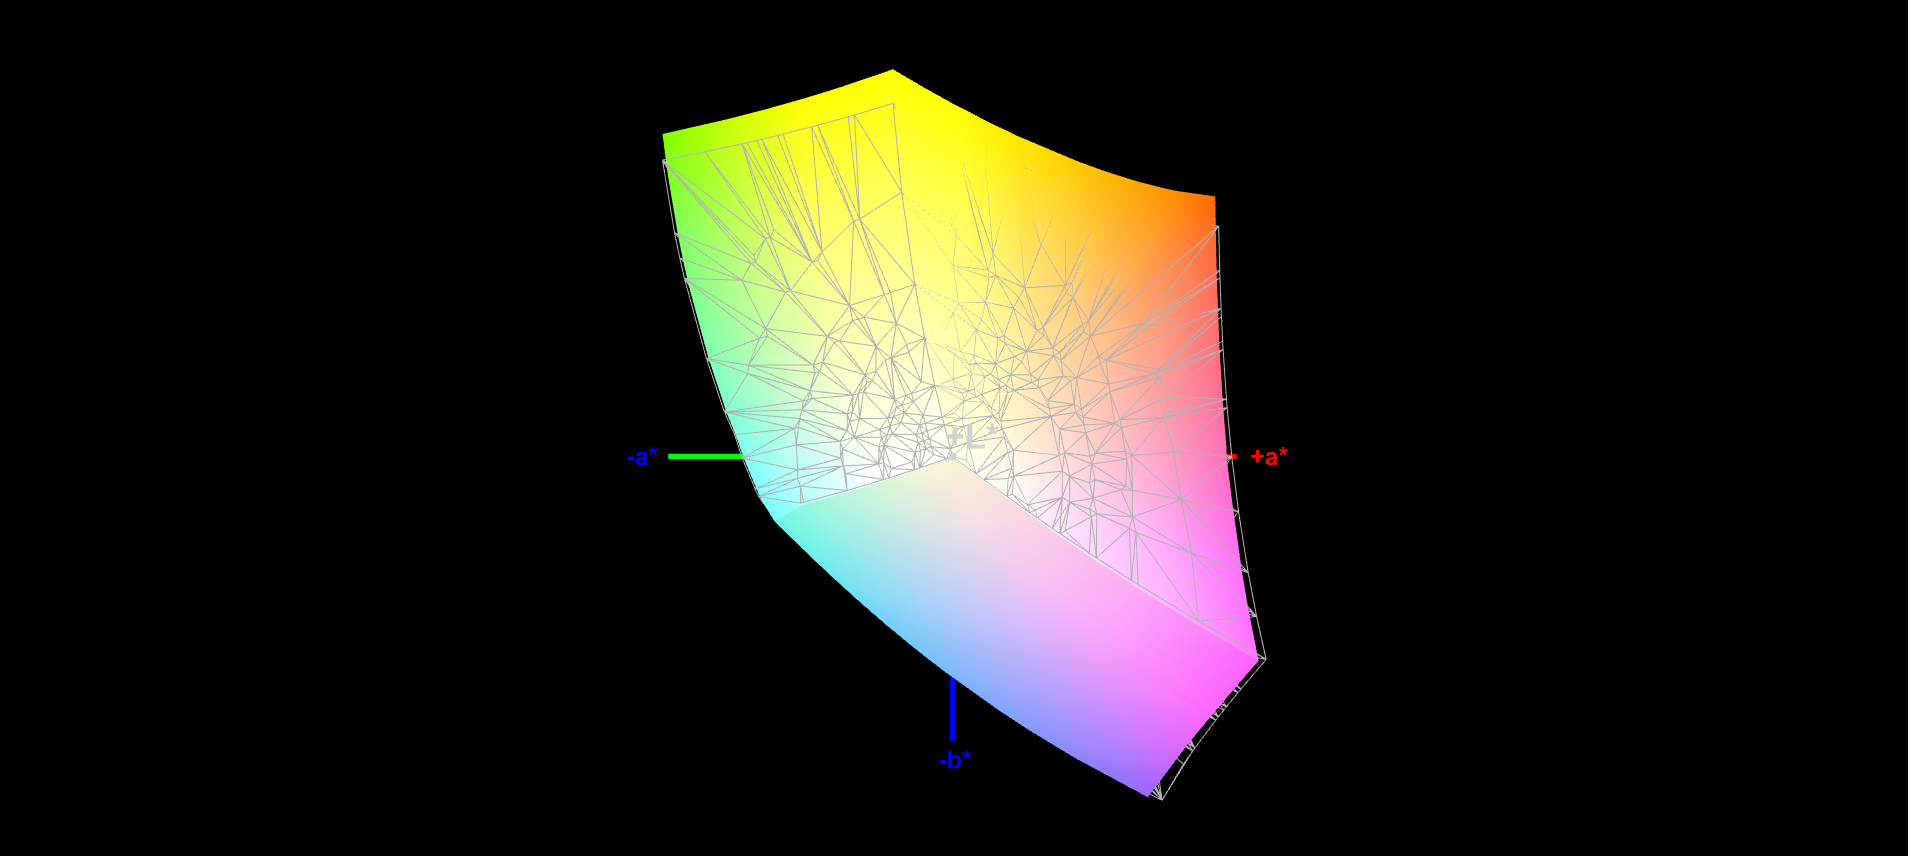
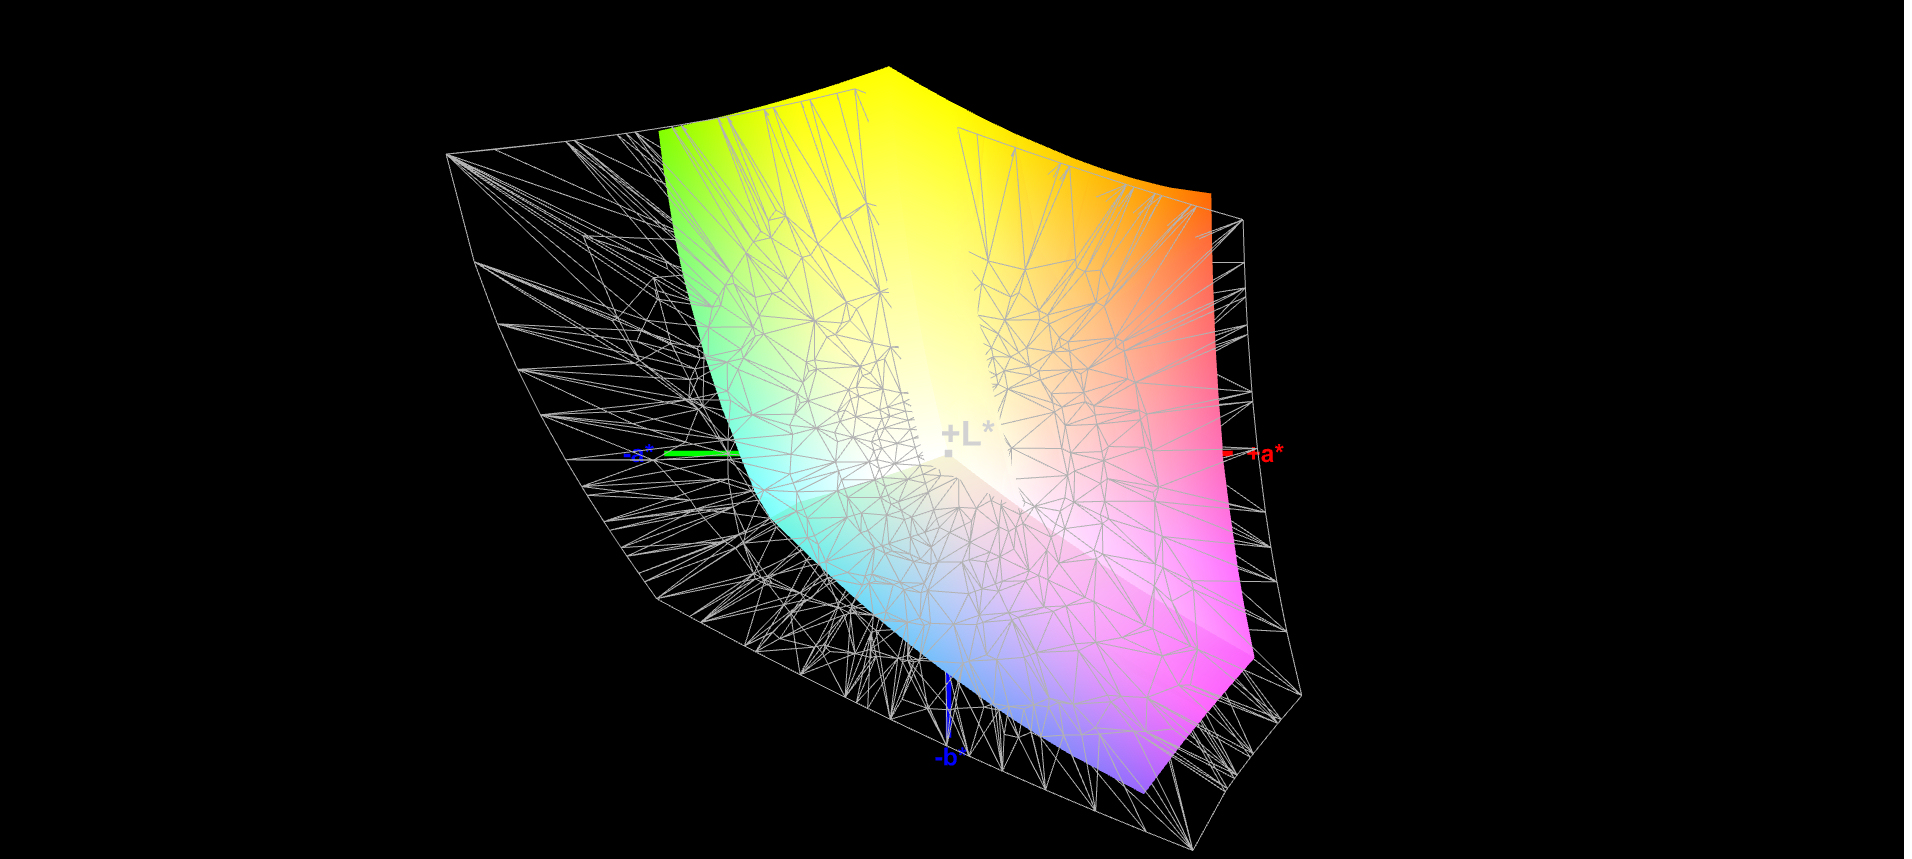
6973% sRGB (Calman 2D)
97% sRGB (Argyll 1.6.3 3D)
63% AdobeRGB 1998 (Argyll 1.6.3 3D)
70.3% AdobeRGB 1998 (Argyll 3D)
97.1% sRGB (Argyll 3D)
68.7% Display P3 (Argyll 3D)
Gamma: 2.55
CCT: 6973 K
| Lenovo Yoga Creator 7 15IMH05 82DS000VGE BOE CQ NV156FHM-N69, IPS, 1920x1080, 15.6" | Asus ZenBook UX535-M01440 BOE0866, IPS, 3840x2160, 15.6" | HP Envy 15-ep0098nr Samsung SDC4145, AMOLED, 3840x2160, 15.6" | Schenker Vision 15 BOE08F5, IPS, 1920x1080, 15.6" | Dell XPS 15 9500 Core i7 4K UHD Sharp LQ156R1, IPS, 3840x2400, 15.6" | MSI Summit E15 A11SCST AU Optronics B156HAB03.1, IPS, 1920x1080, 15.6" | |
|---|---|---|---|---|---|---|
| Display | 1% | 25% | -0% | 25% | -7% | |
| Display P3 Coverage (%) | 68.7 | 68.8 0% | 88.5 29% | 69.3 1% | 89.7 31% | 64.5 -6% |
| sRGB Coverage (%) | 97.1 | 99.5 2% | 100 3% | 94 -3% | 100 3% | 89.3 -8% |
| AdobeRGB 1998 Coverage (%) | 70.3 | 70.1 0% | 99.9 42% | 70.8 1% | 99.8 42% | 65.3 -7% |
| Response Times | -440% | 70% | -825% | -717% | -589% | |
| Response Time Grey 50% / Grey 80% * (ms) | 5 ? | 34 ? -580% | 0.8 ? 84% | 60 ? -1100% | 54 ? -980% | 43.2 ? -764% |
| Response Time Black / White * (ms) | 6 ? | 24 ? -300% | 2.7 ? 55% | 39 ? -550% | 33.2 ? -453% | 30.8 ? -413% |
| PWM Frequency (Hz) | 242.7 ? | |||||
| Screen | 17% | 15% | 18% | 12% | 2% | |
| Brightness middle (cd/m²) | 360 | 402 12% | 374.3 4% | 478 33% | 557.9 55% | 298 -17% |
| Brightness (cd/m²) | 320 | 375 17% | 379 18% | 462 44% | 541 69% | 280 -12% |
| Brightness Distribution (%) | 81 | 84 4% | 91 12% | 94 16% | 91 12% | 90 11% |
| Black Level * (cd/m²) | 0.18 | 0.35 -94% | 0.27 -50% | 0.39 -117% | 0.22 -22% | |
| Contrast (:1) | 2000 | 1149 -43% | 1770 -11% | 1431 -28% | 1355 -32% | |
| Colorchecker dE 2000 * | 6.84 | 2.47 64% | 5.47 20% | 3.2 53% | 4.54 34% | 5.41 21% |
| Colorchecker dE 2000 max. * | 12.52 | 4.32 65% | 8.22 34% | 8.4 33% | 7.92 37% | 8.59 31% |
| Colorchecker dE 2000 calibrated * | 2.54 | 2.36 7% | 4.61 -81% | 2 21% | 3.82 -50% | 2.97 -17% |
| Greyscale dE 2000 * | 12.94 | 2.26 83% | 2.3 82% | 4.5 65% | 3.2 75% | 4.1 68% |
| Gamma | 2.55 86% | 2.49 88% | 2.09 105% | 2.16 102% | 1.99 111% | 2.334 94% |
| CCT | 6973 93% | 6285 103% | 6340 103% | 6788 96% | 6451 101% | 7025 93% |
| Color Space (Percent of AdobeRGB 1998) (%) | 63 | 99 57% | 87.8 39% | 63.1 0% | 89.5 42% | 65 3% |
| Color Space (Percent of sRGB) (%) | 97 | 100 3% | 93.6 -4% | 100 3% | 90 -7% | |
| Totalt genomsnitt (program/inställningar) | -141% /
-47% | 37% /
25% | -269% /
-91% | -227% /
-77% | -198% /
-73% |
* ... mindre är bättre
Visa svarstider
| ↔ Svarstid svart till vitt | ||
|---|---|---|
| 6 ms ... stiga ↗ och falla ↘ kombinerat | ↗ 1 ms stiga |  |
| ↘ 5 ms hösten | ||
| Skärmen visar väldigt snabba svarsfrekvenser i våra tester och borde vara mycket väl lämpad för fartfyllt spel. I jämförelse sträcker sig alla testade enheter från 0.1 (minst) till 240 (maximalt) ms. » 18 % av alla enheter är bättre. Det betyder att den uppmätta svarstiden är bättre än genomsnittet av alla testade enheter (19.9 ms). | ||
| ↔ Svarstid 50 % grått till 80 % grått | ||
| 5 ms ... stiga ↗ och falla ↘ kombinerat | ↗ 2 ms stiga |  |
| ↘ 3 ms hösten | ||
| Skärmen visar väldigt snabba svarsfrekvenser i våra tester och borde vara mycket väl lämpad för fartfyllt spel. I jämförelse sträcker sig alla testade enheter från 0.165 (minst) till 636 (maximalt) ms. » 17 % av alla enheter är bättre. Det betyder att den uppmätta svarstiden är bättre än genomsnittet av alla testade enheter (31.1 ms). | ||
Skärmflimmer / PWM (Puls-Width Modulation)
| Skärmflimmer / PWM upptäcktes inte |  | ||
Som jämförelse: 52 % av alla testade enheter använder inte PWM för att dämpa skärmen. Om PWM upptäcktes mättes ett medelvärde av 7798 (minst: 5 - maximum: 343500) Hz. | |||
| Cinebench R15 | |
| CPU Single 64Bit | |
| Genomsnitt av klass Multimedia (184.8 - 326, n=66, senaste 2 åren) | |
| Schenker Vision 15 | |
| Dell XPS 15 9500 Core i7 4K UHD | |
| Lenovo Yoga Creator 7 15IMH05 82DS000VGE | |
| Asus ZenBook UX535-M01440 | |
| HP Envy 15-ep0098nr | |
| MSI Summit E15 A11SCST | |
| Genomsnitt Intel Core i7-10750H (184 - 213, n=45) | |
| CPU Multi 64Bit | |
| Genomsnitt av klass Multimedia (856 - 5224, n=68, senaste 2 åren) | |
| Dell XPS 15 9500 Core i7 4K UHD | |
| Asus ZenBook UX535-M01440 | |
| HP Envy 15-ep0098nr | |
| Genomsnitt Intel Core i7-10750H (804 - 1418, n=50) | |
| Lenovo Yoga Creator 7 15IMH05 82DS000VGE (Hoechstleistung) | |
| Lenovo Yoga Creator 7 15IMH05 82DS000VGE | |
| Schenker Vision 15 | |
| Lenovo Yoga Creator 7 15IMH05 82DS000VGE (Akkusparmodus) | |
| MSI Summit E15 A11SCST | |
| Blender - v2.79 BMW27 CPU | |
| Lenovo Yoga Creator 7 15IMH05 82DS000VGE (Akkusparmodus) | |
| MSI Summit E15 A11SCST | |
| Schenker Vision 15 | |
| Lenovo Yoga Creator 7 15IMH05 82DS000VGE | |
| Lenovo Yoga Creator 7 15IMH05 82DS000VGE (Hoechstleistung) | |
| Asus ZenBook UX535-M01440 | |
| Genomsnitt Intel Core i7-10750H (322 - 587, n=43) | |
| Dell XPS 15 9500 Core i7 4K UHD | |
| HP Envy 15-ep0098nr | |
| Genomsnitt av klass Multimedia (100 - 557, n=65, senaste 2 åren) | |
| 7-Zip 18.03 | |
| 7z b 4 -mmt1 | |
| Genomsnitt av klass Multimedia (3666 - 7545, n=63, senaste 2 åren) | |
| Dell XPS 15 9500 Core i7 4K UHD | |
| Lenovo Yoga Creator 7 15IMH05 82DS000VGE (Akkusparmodus) | |
| Lenovo Yoga Creator 7 15IMH05 82DS000VGE (Hoechstleistung) | |
| Lenovo Yoga Creator 7 15IMH05 82DS000VGE | |
| Asus ZenBook UX535-M01440 | |
| MSI Summit E15 A11SCST | |
| Genomsnitt Intel Core i7-10750H (4504 - 5470, n=43) | |
| Schenker Vision 15 | |
| HP Envy 15-ep0098nr | |
| 7z b 4 | |
| Genomsnitt av klass Multimedia (29095 - 130368, n=62, senaste 2 åren) | |
| Dell XPS 15 9500 Core i7 4K UHD | |
| Lenovo Yoga Creator 7 15IMH05 82DS000VGE (Hoechstleistung) | |
| Lenovo Yoga Creator 7 15IMH05 82DS000VGE | |
| Genomsnitt Intel Core i7-10750H (26040 - 37345, n=43) | |
| Asus ZenBook UX535-M01440 | |
| HP Envy 15-ep0098nr | |
| Lenovo Yoga Creator 7 15IMH05 82DS000VGE (Akkusparmodus) | |
| Schenker Vision 15 | |
| MSI Summit E15 A11SCST | |
| Cinebench R20 | |
| CPU (Single Core) | |
| Genomsnitt av klass Multimedia (425 - 853, n=64, senaste 2 åren) | |
| MSI Summit E15 A11SCST | |
| Schenker Vision 15 | |
| Dell XPS 15 9500 Core i7 4K UHD | |
| Lenovo Yoga Creator 7 15IMH05 82DS000VGE (Hoechstleistung) | |
| Genomsnitt Intel Core i7-10750H (431 - 504, n=43) | |
| Asus ZenBook UX535-M01440 | |
| Lenovo Yoga Creator 7 15IMH05 82DS000VGE | |
| Lenovo Yoga Creator 7 15IMH05 82DS000VGE (Akkusparmodus) | |
| HP Envy 15-ep0098nr | |
| CPU (Multi Core) | |
| Genomsnitt av klass Multimedia (1887 - 12912, n=64, senaste 2 åren) | |
| Dell XPS 15 9500 Core i7 4K UHD | |
| HP Envy 15-ep0098nr | |
| Asus ZenBook UX535-M01440 | |
| Genomsnitt Intel Core i7-10750H (1749 - 3325, n=43) | |
| Lenovo Yoga Creator 7 15IMH05 82DS000VGE (Hoechstleistung) | |
| Lenovo Yoga Creator 7 15IMH05 82DS000VGE | |
| MSI Summit E15 A11SCST | |
| Schenker Vision 15 | |
| Lenovo Yoga Creator 7 15IMH05 82DS000VGE (Akkusparmodus) | |
| Geekbench 5.5 | |
| Single-Core | |
| Genomsnitt av klass Multimedia (805 - 2974, n=62, senaste 2 åren) | |
| Schenker Vision 15 | |
| MSI Summit E15 A11SCST | |
| Dell XPS 15 9500 Core i7 4K UHD | |
| HP Envy 15-ep0098nr | |
| Asus ZenBook UX535-M01440 | |
| Lenovo Yoga Creator 7 15IMH05 82DS000VGE (Akkusparmodus) | |
| Lenovo Yoga Creator 7 15IMH05 82DS000VGE (Hoechstleistung) | |
| Genomsnitt Intel Core i7-10750H (1114 - 1333, n=43) | |
| Lenovo Yoga Creator 7 15IMH05 82DS000VGE | |
| Multi-Core | |
| Genomsnitt av klass Multimedia (4652 - 20422, n=62, senaste 2 åren) | |
| Dell XPS 15 9500 Core i7 4K UHD | |
| HP Envy 15-ep0098nr | |
| Genomsnitt Intel Core i7-10750H (4443 - 6674, n=43) | |
| Lenovo Yoga Creator 7 15IMH05 82DS000VGE (Hoechstleistung) | |
| Lenovo Yoga Creator 7 15IMH05 82DS000VGE | |
| Schenker Vision 15 | |
| Asus ZenBook UX535-M01440 | |
| MSI Summit E15 A11SCST | |
| Lenovo Yoga Creator 7 15IMH05 82DS000VGE (Akkusparmodus) | |
| HWBOT x265 Benchmark v2.2 - 4k Preset | |
| Genomsnitt av klass Multimedia (5.26 - 36.1, n=63, senaste 2 åren) | |
| HP Envy 15-ep0098nr | |
| Dell XPS 15 9500 Core i7 4K UHD | |
| Asus ZenBook UX535-M01440 | |
| Genomsnitt Intel Core i7-10750H (5.54 - 11.6, n=43) | |
| Lenovo Yoga Creator 7 15IMH05 82DS000VGE (Hoechstleistung) | |
| Lenovo Yoga Creator 7 15IMH05 82DS000VGE | |
| Schenker Vision 15 | |
| MSI Summit E15 A11SCST | |
| Lenovo Yoga Creator 7 15IMH05 82DS000VGE (Akkusparmodus) | |
| LibreOffice - 20 Documents To PDF | |
| Asus ZenBook UX535-M01440 | |
| MSI Summit E15 A11SCST | |
| Lenovo Yoga Creator 7 15IMH05 82DS000VGE | |
| Genomsnitt Intel Core i7-10750H (43.1 - 99.2, n=43) | |
| Dell XPS 15 9500 Core i7 4K UHD | |
| Genomsnitt av klass Multimedia (23.9 - 146.7, n=64, senaste 2 åren) | |
| Lenovo Yoga Creator 7 15IMH05 82DS000VGE (Akkusparmodus) | |
| HP Envy 15-ep0098nr | |
| Schenker Vision 15 | |
| Lenovo Yoga Creator 7 15IMH05 82DS000VGE (Hoechstleistung) | |
| R Benchmark 2.5 - Overall mean | |
| MSI Summit E15 A11SCST | |
| Lenovo Yoga Creator 7 15IMH05 82DS000VGE (Akkusparmodus) | |
| Genomsnitt Intel Core i7-10750H (0.578 - 0.708, n=42) | |
| HP Envy 15-ep0098nr | |
| Asus ZenBook UX535-M01440 | |
| Lenovo Yoga Creator 7 15IMH05 82DS000VGE | |
| Lenovo Yoga Creator 7 15IMH05 82DS000VGE (Hoechstleistung) | |
| Dell XPS 15 9500 Core i7 4K UHD | |
| Schenker Vision 15 | |
| Genomsnitt av klass Multimedia (0.3604 - 0.947, n=63, senaste 2 åren) | |
* ... mindre är bättre
| PCMark 8 Home Score Accelerated v2 | 3980 poäng | |
| PCMark 8 Creative Score Accelerated v2 | 5185 poäng | |
| PCMark 8 Work Score Accelerated v2 | 5217 poäng | |
| PCMark 10 Score | 5333 poäng | |
Hjälp | ||
| DPC Latencies / LatencyMon - interrupt to process latency (max), Web, Youtube, Prime95 | |
| Dell XPS 15 9500 Core i7 4K UHD | |
| Schenker Vision 15 | |
| HP Envy 15-ep0098nr | |
| MSI Summit E15 A11SCST | |
| Asus ZenBook UX535-M01440 | |
| Lenovo Yoga Creator 7 15IMH05 82DS000VGE | |
* ... mindre är bättre

| Lenovo Yoga Creator 7 15IMH05 82DS000VGE Samsung PM981a MZVLB1T0HBLR | Asus ZenBook UX535-M01440 WDC PC SN730 SDBPNTY-1T00 | HP Envy 15-ep0098nr Intel Optane Memory H10 with Solid State Storage 32GB + 512GB HBRPEKNX0202A(L/H) | Schenker Vision 15 Samsung SSD 980 Pro 1TB MZ-V8P1T0BW | Dell XPS 15 9500 Core i7 4K UHD SK Hynix PC611 512GB | MSI Summit E15 A11SCST Phison 1TB SM2801T24GKBB4S-E162 | Genomsnitt Samsung PM981a MZVLB1T0HBLR | |
|---|---|---|---|---|---|---|---|
| CrystalDiskMark 5.2 / 6 | -11% | -10% | 85% | -8% | 25% | 4% | |
| Write 4K (MB/s) | 125.9 | 110 -13% | 100.2 -20% | 238.1 89% | 123.3 -2% | 242.9 93% | 139.7 ? 11% |
| Read 4K (MB/s) | 45.78 | 43.44 -5% | 112.8 146% | 79.2 73% | 41.85 -9% | 54.6 19% | 49.9 ? 9% |
| Write Seq (MB/s) | 2311 | 1957 -15% | 537 -77% | 4139 79% | 2054 -11% | 2420 5% | 2036 ? -12% |
| Read Seq (MB/s) | 1511 | 1615 7% | 1270 -16% | 4133 174% | 1617 7% | 2300 52% | 2014 ? 33% |
| Write 4K Q32T1 (MB/s) | 446.7 | 341.6 -24% | 480.6 8% | 697 56% | 413 -8% | 392.7 -12% | 461 ? 3% |
| Read 4K Q32T1 (MB/s) | 548 | 364.3 -34% | 364.9 -33% | 758 38% | 377.5 -31% | 667 22% | 499 ? -9% |
| Write Seq Q32T1 (MB/s) | 3020 | 3081 2% | 1224 -59% | 5187 72% | 2705 -10% | 2424 -20% | 2903 ? -4% |
| Read Seq Q32T1 (MB/s) | 3518 | 3251 -8% | 2635 -25% | 7117 102% | 3442 -2% | 4944 41% | 3479 ? -1% |
| AS SSD | -16% | -57% | 62% | -28% | 16% | 6% | |
| Seq Read (MB/s) | 2078 | 1886 -9% | 1005 -52% | 5427 161% | 2072 0% | 3597 73% | 2553 ? 23% |
| Seq Write (MB/s) | 2441 | 1221 -50% | 436.8 -82% | 3886 59% | 1486 -39% | 2101 -14% | 2084 ? -15% |
| 4K Read (MB/s) | 53.2 | 41.16 -23% | 51.5 -3% | 72.9 37% | 47.41 -11% | 62.5 17% | 53.1 ? 0% |
| 4K Write (MB/s) | 107 | 101.2 -5% | 88 -18% | 219.3 105% | 117.6 10% | 208.9 95% | 131.2 ? 23% |
| 4K-64 Read (MB/s) | 1533 | 1022 -33% | 517 -66% | 2209 44% | 967 -37% | 1145 -25% | 1477 ? -4% |
| 4K-64 Write (MB/s) | 1526 | 1618 6% | 839 -45% | 2265 48% | 715 -53% | 1482 -3% | 1805 ? 18% |
| Access Time Read * (ms) | 0.051 | 0.058 -14% | 0.088 -73% | 0.033 35% | 0.057 -12% | 0.05 2% | 0.04983 ? 2% |
| Access Time Write * (ms) | 0.036 | 0.037 -3% | 0.151 -319% | 0.02 44% | 0.096 -167% | 0.019 47% | 0.04222 ? -17% |
| Score Read (Points) | 1794 | 1252 -30% | 669 -63% | 2825 57% | 1222 -32% | 1567 -13% | 1786 ? 0% |
| Score Write (Points) | 1877 | 1841 -2% | 970 -48% | 2873 53% | 981 -48% | 1901 1% | 2144 ? 14% |
| Score Total (Points) | 4613 | 3706 -20% | 1972 -57% | 7069 53% | 2809 -39% | 4207 -9% | 4826 ? 5% |
| Copy ISO MB/s (MB/s) | 1633 | 1611 -1% | 1173 -28% | 2775 70% | 1999 22% | 2209 35% | 2098 ? 28% |
| Copy Program MB/s (MB/s) | 549 | 509 -7% | 769 40% | 662 21% | 627 14% | 455.2 -17% | 500 ? -9% |
| Copy Game MB/s (MB/s) | 940 | 677 -28% | 1045 11% | 1655 76% | 1001 6% | 1225 30% | 1132 ? 20% |
| Totalt genomsnitt (program/inställningar) | -14% /
-14% | -34% /
-40% | 74% /
70% | -18% /
-21% | 21% /
19% | 5% /
5% |
* ... mindre är bättre
DiskSpd Read Loop, Queue Depth 8
| 3DMark 11 Performance | 11667 poäng | |
| 3DMark Cloud Gate Standard Score | 29483 poäng | |
| 3DMark Fire Strike Score | 7859 poäng | |
| 3DMark Time Spy Score | 3386 poäng | |
Hjälp | ||
| The Witcher 3 - 1920x1080 High Graphics & Postprocessing (Nvidia HairWorks Off) | |
| HP Envy 15-ep0098nr | |
| Genomsnitt av klass Multimedia (22 - 224, n=13, senaste 2 åren) | |
| Lenovo IdeaPad Gaming 3i 15IMH05 | |
| Dell XPS 15 9500 Core i7 4K UHD | |
| Lenovo Yoga Creator 7 15IMH05 82DS000VGE | |
| Genomsnitt NVIDIA GeForce GTX 1650 Mobile (45 - 70.4, n=29) | |
| Asus ZenBook UX535-M01440 | |
| MSI Summit E15 A11SCST | |
| Schenker Vision 15 | |
| Dota 2 Reborn - 1920x1080 high (2/3) | |
| Dell XPS 15 9500 Core i7 4K UHD | |
| Lenovo Yoga Creator 7 15IMH05 82DS000VGE | |
| Lenovo Yoga Creator 7 15IMH05 82DS000VGE (Hoechstleistung) | |
| HP Envy 15-ep0098nr | |
| Lenovo IdeaPad Gaming 3i 15IMH05 | |
| Asus ZenBook UX535-M01440 | |
| MSI Summit E15 A11SCST | |
| Lenovo Yoga Creator 7 15IMH05 82DS000VGE (Akkusparmodus) | |
| Genomsnitt NVIDIA GeForce GTX 1650 Mobile (63.3 - 127, n=20) | |
| Genomsnitt av klass Multimedia (31.1 - 196.9, n=68, senaste 2 åren) | |
| Schenker Vision 15 | |
| X-Plane 11.11 - 1920x1080 high (fps_test=3) | |
| HP Envy 15-ep0098nr | |
| Lenovo Yoga Creator 7 15IMH05 82DS000VGE (Hoechstleistung) | |
| Asus ZenBook UX535-M01440 | |
| Lenovo Yoga Creator 7 15IMH05 82DS000VGE | |
| MSI Summit E15 A11SCST | |
| Lenovo IdeaPad Gaming 3i 15IMH05 | |
| Dell XPS 15 9500 Core i7 4K UHD | |
| Genomsnitt NVIDIA GeForce GTX 1650 Mobile (44.5 - 77.3, n=18) | |
| Lenovo Yoga Creator 7 15IMH05 82DS000VGE (Akkusparmodus) | |
| Genomsnitt av klass Multimedia (16.9 - 141.1, n=62, senaste 2 åren) | |
| Schenker Vision 15 | |
| Shadow of the Tomb Raider - 1920x1080 Highest Preset AA:T | |
| Genomsnitt av klass Multimedia (23 - 129, n=8, senaste 2 åren) | |
| Dell XPS 15 9500 Core i7 4K UHD | |
| Lenovo IdeaPad Gaming 3i 15IMH05 | |
| Genomsnitt NVIDIA GeForce GTX 1650 Mobile (34 - 47, n=15) | |
| Lenovo Yoga Creator 7 15IMH05 82DS000VGE | |
| Lenovo Yoga Creator 7 15IMH05 82DS000VGE (Hoechstleistung) | |
| Asus ZenBook UX535-M01440 | |
| MSI Summit E15 A11SCST | |
| Dirt 5 - 1920x1080 Medium Preset | |
| Lenovo Yoga Creator 7 15IMH05 82DS000VGE | |
| Genomsnitt NVIDIA GeForce GTX 1650 Mobile (44.4 - 46.8, n=3) | |
| Hitman 3 - 1920x1080 Maximum Settings AF:16x | |
| Genomsnitt NVIDIA GeForce GTX 1650 Mobile (50.2 - 58.3, n=2) | |
| Lenovo Yoga Creator 7 15IMH05 82DS000VGE | |
| låg | med. | hög | ultra | |
|---|---|---|---|---|
| The Witcher 3 (2015) | 185 | 107 | 61.8 | 35.3 |
| Dota 2 Reborn (2015) | 146 | 136 | 121 | 110 |
| X-Plane 11.11 (2018) | 95.2 | 83.3 | 67.1 | |
| Far Cry 5 (2018) | 115 | 59 | 54 | 50 |
| Strange Brigade (2018) | 195 | 78.8 | 63.9 | 55.3 |
| Shadow of the Tomb Raider (2018) | 122 | 57 | 49 | 43 |
| Watch Dogs Legion (2020) | 80.4 | 48 | 41.6 | 18 |
| Dirt 5 (2020) | 95.4 | 46.6 | 36.3 | 29.4 |
| Assassin´s Creed Valhalla (2020) | 68 | 41 | 27 | 10 |
| Immortals Fenyx Rising (2020) | 85 | 50 | 42 | 36 |
| Cyberpunk 2077 1.0 (2020) | 54 | 28.5 | 23.6 | 19 |
| Hitman 3 (2021) | 153.4 | 63.5 | 55.3 | 50.2 |
Ljudnivå
| Låg belastning |
| 24.9 / 24.9 / 30.8 dB(A) |
| Hög belastning |
| 41.9 / 41.7 dB(A) |
 | ||
30 dB tyst 40 dB(A) hörbar 50 dB(A) högt ljud |
||
min: | ||
| Lenovo Yoga Creator 7 15IMH05 82DS000VGE i7-10750H, GeForce GTX 1650 Mobile | Asus ZenBook UX535-M01440 i7-10750H, GeForce GTX 1650 Ti Max-Q | HP Envy 15-ep0098nr i7-10750H, GeForce RTX 2060 Max-Q | Schenker Vision 15 i7-1165G7, Iris Xe G7 96EUs | Dell XPS 15 9500 Core i7 4K UHD i7-10875H, GeForce GTX 1650 Ti Mobile | MSI Summit E15 A11SCST i7-1185G7, GeForce GTX 1650 Ti Max-Q | Genomsnitt NVIDIA GeForce GTX 1650 Mobile | Genomsnitt av klass Multimedia | |
|---|---|---|---|---|---|---|---|---|
| Noise | 4% | -22% | -7% | -8% | -5% | -9% | 3% | |
| av / miljö * (dB) | 24.9 | 24.6 1% | 26.4 -6% | 29.8 -20% | 28.4 -14% | 24 4% | 27.6 ? -11% | 24.2 ? 3% |
| Idle Minimum * (dB) | 24.9 | 24.6 1% | 32.2 -29% | 29.8 -20% | 28.4 -14% | 28 -12% | 28.1 ? -13% | 24.4 ? 2% |
| Idle Average * (dB) | 24.9 | 24.6 1% | 32.2 -29% | 29.8 -20% | 28.4 -14% | 29 -16% | 28.8 ? -16% | 24.8 ? -0% |
| Idle Maximum * (dB) | 30.8 | 24.6 20% | 32.2 -5% | 31.1 -1% | 28.4 8% | 32 -4% | 31 ? -1% | 26.5 ? 14% |
| Load Average * (dB) | 41.9 | 41.3 1% | 48.3 -15% | 40.5 3% | 46 -10% | 43 -3% | 41.7 ? -0% | 37.6 ? 10% |
| Witcher 3 ultra * (dB) | 41.9 | 42 -0% | 53.7 -28% | 40.5 3% | 42 -0% | 41 2% | ||
| Load Maximum * (dB) | 41.7 | 41.4 1% | 58.8 -41% | 40.5 3% | 47.1 -13% | 44 -6% | 46.4 ? -11% | 45.9 ? -10% |
* ... mindre är bättre
(+) Den maximala temperaturen på ovansidan är 39.8 °C / 104 F, jämfört med genomsnittet av 36.8 °C / 98 F , allt från 21 till 71 °C för klassen Multimedia.
(+) Botten värms upp till maximalt 36.5 °C / 98 F, jämfört med genomsnittet av 39.1 °C / 102 F
(+) Vid tomgångsbruk är medeltemperaturen för ovansidan 22.3 °C / 72 F, jämfört med enhetsgenomsnittet på 31.3 °C / ### class_avg_f### F.
(±) När du spelar The Witcher 3 är medeltemperaturen för ovansidan 32.6 °C / 91 F, jämfört med enhetsgenomsnittet på 31.3 °C / ## #class_avg_f### F.
(+) Handledsstöden och pekplattan är kallare än hudtemperaturen med maximalt 29.2 °C / 84.6 F och är därför svala att ta på.
(±) Medeltemperaturen för handledsstödsområdet på liknande enheter var 28.7 °C / 83.7 F (-0.5 °C / -0.9 F).
| Lenovo Yoga Creator 7 15IMH05 82DS000VGE i7-10750H, GeForce GTX 1650 Mobile | Asus ZenBook UX535-M01440 i7-10750H, GeForce GTX 1650 Ti Max-Q | HP Envy 15-ep0098nr i7-10750H, GeForce RTX 2060 Max-Q | Schenker Vision 15 i7-1165G7, Iris Xe G7 96EUs | Dell XPS 15 9500 Core i7 4K UHD i7-10875H, GeForce GTX 1650 Ti Mobile | MSI Summit E15 A11SCST i7-1185G7, GeForce GTX 1650 Ti Max-Q | Genomsnitt NVIDIA GeForce GTX 1650 Mobile | Genomsnitt av klass Multimedia | |
|---|---|---|---|---|---|---|---|---|
| Heat | -15% | -31% | -12% | -33% | -34% | -25% | -16% | |
| Maximum Upper Side * (°C) | 39.8 | 37.8 5% | 47.6 -20% | 42.4 -7% | 44 -11% | 56 -41% | 46 ? -16% | 41.5 ? -4% |
| Maximum Bottom * (°C) | 36.5 | 44.2 -21% | 52 -42% | 46.8 -28% | 48.8 -34% | 60 -64% | 49.2 ? -35% | 44.1 ? -21% |
| Idle Upper Side * (°C) | 22.9 | 28.1 -23% | 28.6 -25% | 24.6 -7% | 33 -44% | 26 -14% | 28.3 ? -24% | 27.1 ? -18% |
| Idle Bottom * (°C) | 23 | 27.7 -20% | 31 -35% | 24.4 -6% | 32.4 -41% | 27 -17% | 28.9 ? -26% | 28 ? -22% |
* ... mindre är bättre
Lenovo Yoga Creator 7 15IMH05 82DS000VGE ljudanalys
(-) | inte särskilt höga högtalare (71.4 dB)
Bas 100 - 315 Hz
(±) | reducerad bas - i genomsnitt 12% lägre än medianen
(±) | linjäriteten för basen är genomsnittlig (11.3% delta till föregående frekvens)
Mellan 400 - 2000 Hz
(+) | balanserad mellan - endast 3.9% från medianen
(±) | linjäriteten för mids är genomsnittlig (7.9% delta till föregående frekvens)
Högsta 2 - 16 kHz
(+) | balanserade toppar - endast 2% från medianen
(±) | linjäriteten för toppar är genomsnittlig (8% delta till föregående frekvens)
Totalt 100 - 16 000 Hz
(+) | det totala ljudet är linjärt (11.9% skillnad mot median)
Jämfört med samma klass
» 20% av alla testade enheter i den här klassen var bättre, 4% liknande, 76% sämre
» Den bästa hade ett delta på 5%, genomsnittet var 17%, sämst var 45%
Jämfört med alla testade enheter
» 9% av alla testade enheter var bättre, 2% liknande, 89% sämre
» Den bästa hade ett delta på 4%, genomsnittet var 24%, sämst var 134%
| Av/Standby | |
| Låg belastning | |
| Hög belastning |
|
Förklaring:
min: | |
| Lenovo Yoga Creator 7 15IMH05 82DS000VGE i7-10750H, GeForce GTX 1650 Mobile | Asus ZenBook UX535-M01440 i7-10750H, GeForce GTX 1650 Ti Max-Q | HP Envy 15-ep0098nr i7-10750H, GeForce RTX 2060 Max-Q | Schenker Vision 15 i7-1165G7, Iris Xe G7 96EUs | Dell XPS 15 9500 Core i7 4K UHD i7-10875H, GeForce GTX 1650 Ti Mobile | MSI Summit E15 A11SCST i7-1185G7, GeForce GTX 1650 Ti Max-Q | Genomsnitt NVIDIA GeForce GTX 1650 Mobile | Genomsnitt av klass Multimedia | |
|---|---|---|---|---|---|---|---|---|
| Power Consumption | 9% | -42% | 45% | -20% | 7% | 8% | 13% | |
| Idle Minimum * (Watt) | 6.9 | 4.4 36% | 9.2 -33% | 3.5 49% | 5.7 17% | 6 13% | 4.96 ? 28% | 5.71 ? 17% |
| Idle Average * (Watt) | 10 | 9.8 2% | 14.5 -45% | 6.3 37% | 13.5 -35% | 10 -0% | 8.61 ? 14% | 10.1 ? -1% |
| Idle Maximum * (Watt) | 12.6 | 14.5 -15% | 18 -43% | 6.8 46% | 19.6 -56% | 16 -27% | 14.8 ? -17% | 12.4 ? 2% |
| Load Average * (Watt) | 96 | 83 14% | 110.9 -16% | 43.2 55% | 114.1 -19% | 84 12% | 81.7 ? 15% | 65 ? 32% |
| Witcher 3 ultra * (Watt) | 75 | 67 11% | 125.5 -67% | 52 31% | 93 -24% | 69 8% | ||
| Load Maximum * (Watt) | 134 | 123 8% | 194.6 -45% | 67.7 49% | 135.2 -1% | 90 33% | 131.9 ? 2% | 112.2 ? 16% |
* ... mindre är bättre
| Lenovo Yoga Creator 7 15IMH05 82DS000VGE i7-10750H, GeForce GTX 1650 Mobile, 70 Wh | Asus ZenBook UX535-M01440 i7-10750H, GeForce GTX 1650 Ti Max-Q, 96 Wh | HP Envy 15-ep0098nr i7-10750H, GeForce RTX 2060 Max-Q, 83 Wh | Schenker Vision 15 i7-1165G7, Iris Xe G7 96EUs, 73 Wh | Dell XPS 15 9500 Core i7 4K UHD i7-10875H, GeForce GTX 1650 Ti Mobile, 86 Wh | MSI Summit E15 A11SCST i7-1185G7, GeForce GTX 1650 Ti Max-Q, 80.25 Wh | Genomsnitt av klass Multimedia | |
|---|---|---|---|---|---|---|---|
| Batteridrifttid | 17% | -5% | 45% | 30% | 8% | 29% | |
| Reader / Idle (h) | 25.7 | 18.3 -29% | 15 -42% | 23 -11% | 19.5 -24% | 25.2 ? -2% | |
| H.264 (h) | 13.9 | 11.9 -14% | 18.7 35% | 10.1 -27% | 16.4 ? 18% | ||
| WiFi v1.3 (h) | 9 | 10.1 12% | 6 -33% | 15.2 69% | 9.1 1% | 9.1 1% | 12 ? 33% |
| Load (h) | 1 | 2 100% | 1.6 60% | 1.3 30% | 2 100% | 1.8 80% | 1.675 ? 68% |
För
Emot

Läs den fullständiga versionen av den här recensionen på engelska här.
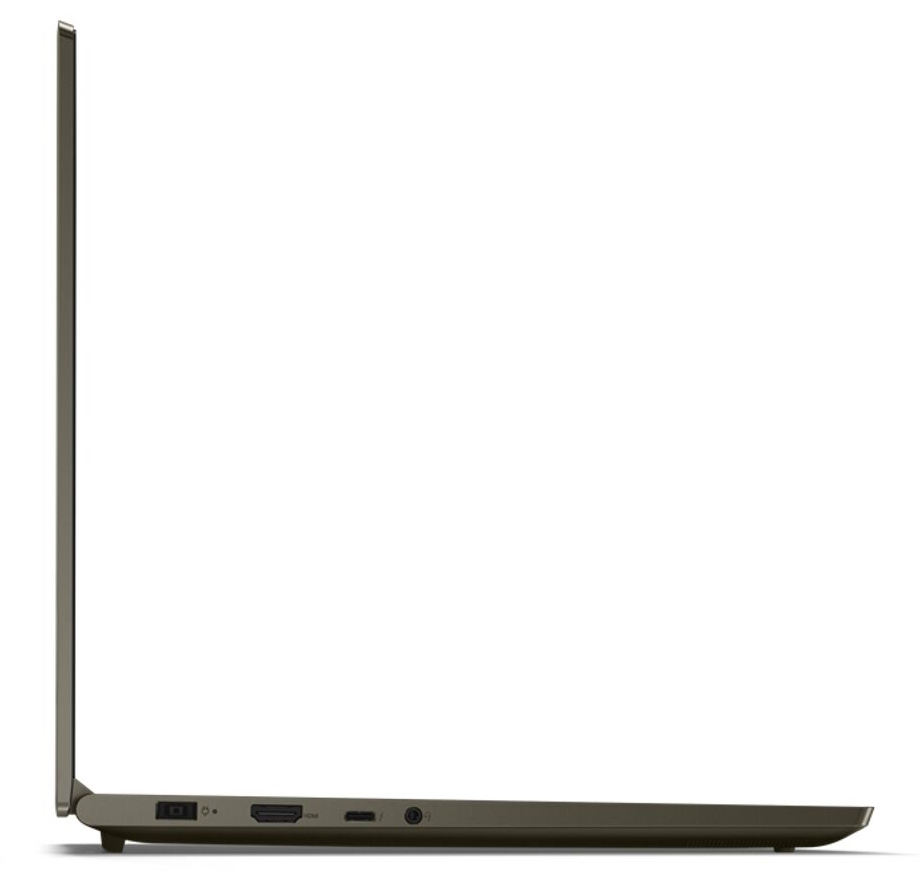
Kombinationen av relativt låg vikt och ett batteri på 70 Wh resulterar i en väldigt mobil laptop. Yoga Creator 7 uppnår en realistisk batteritid på 9 till 13 timmar. Den går att ladda med både den medföljande propretiära nätadaptern eller, tack vare Thunderbolt 3-porten, via en USB-C laddare (minst 45 Watt).
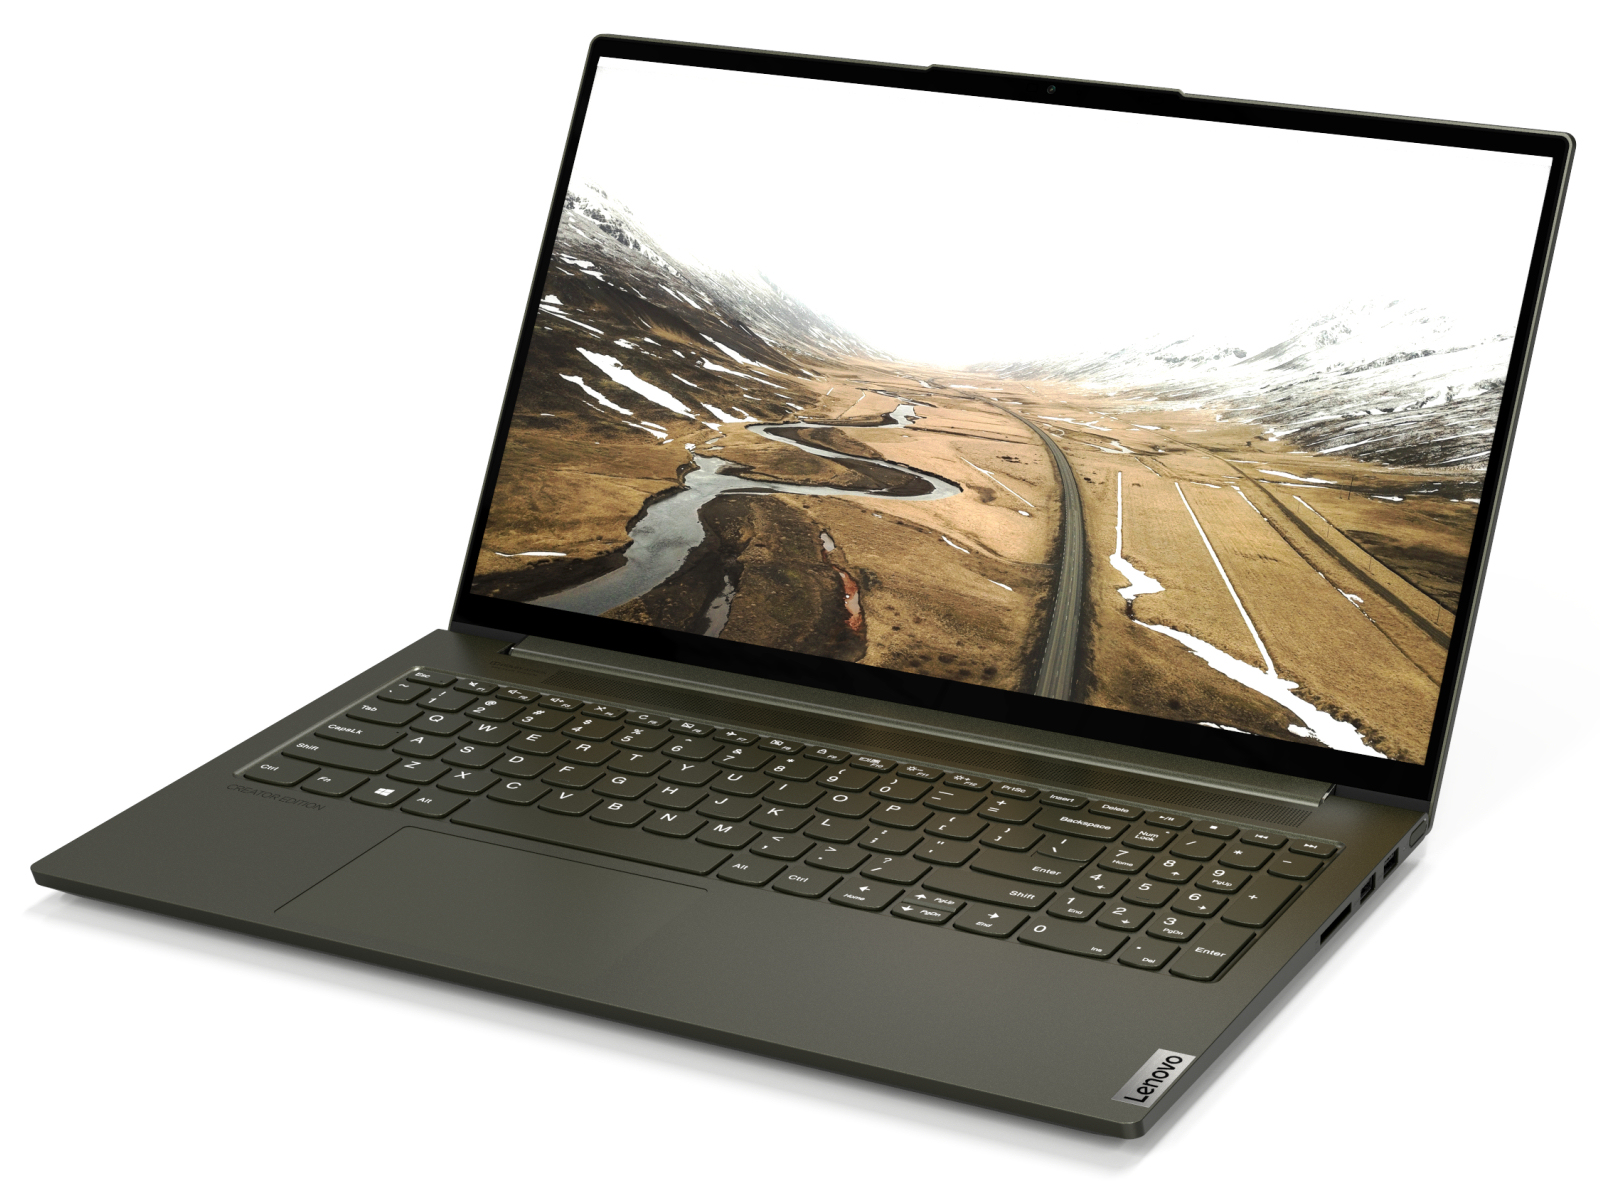
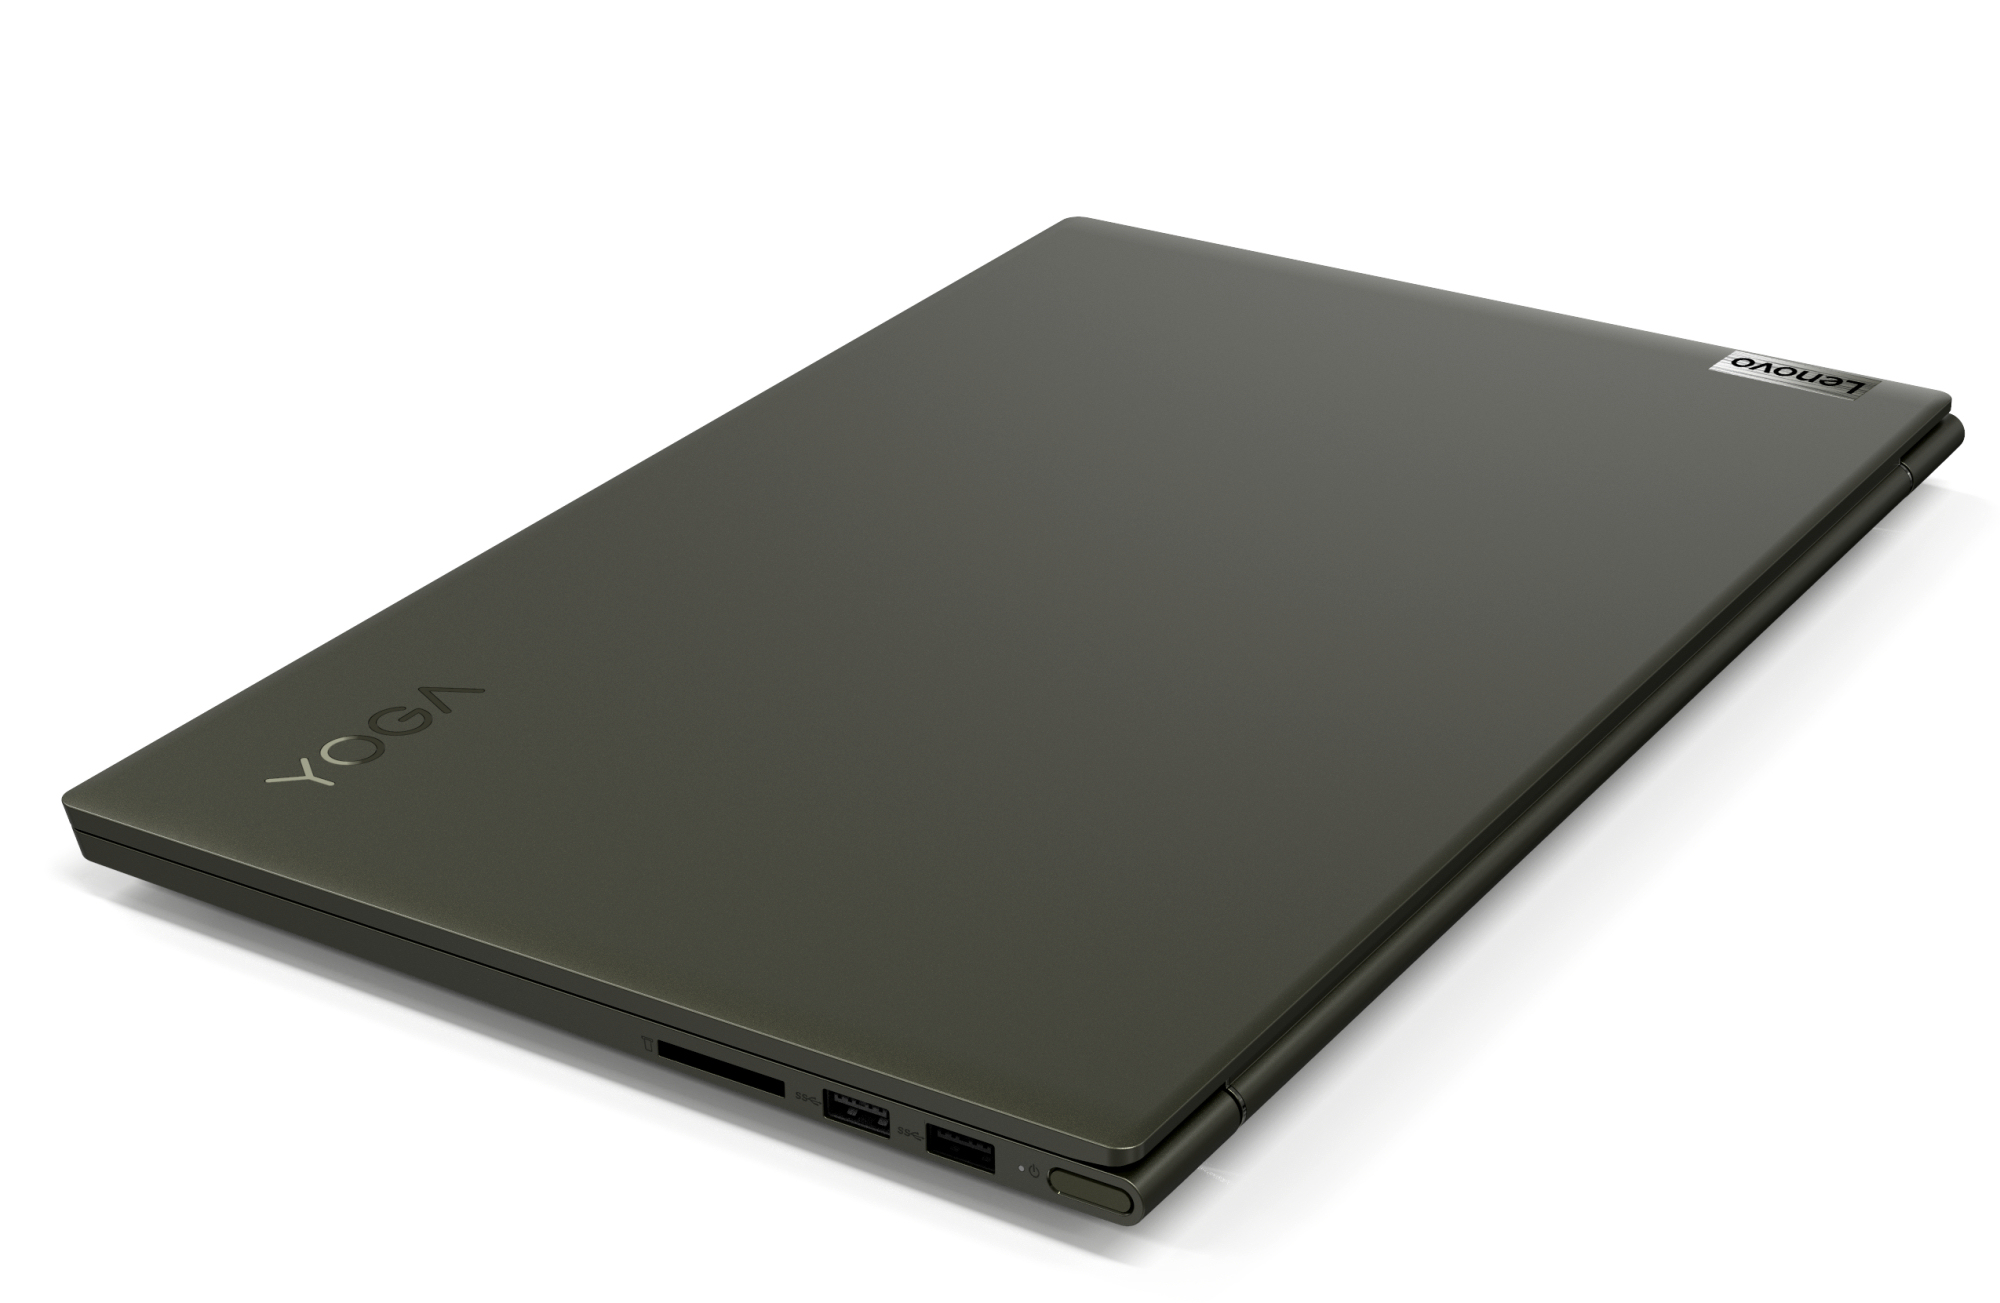
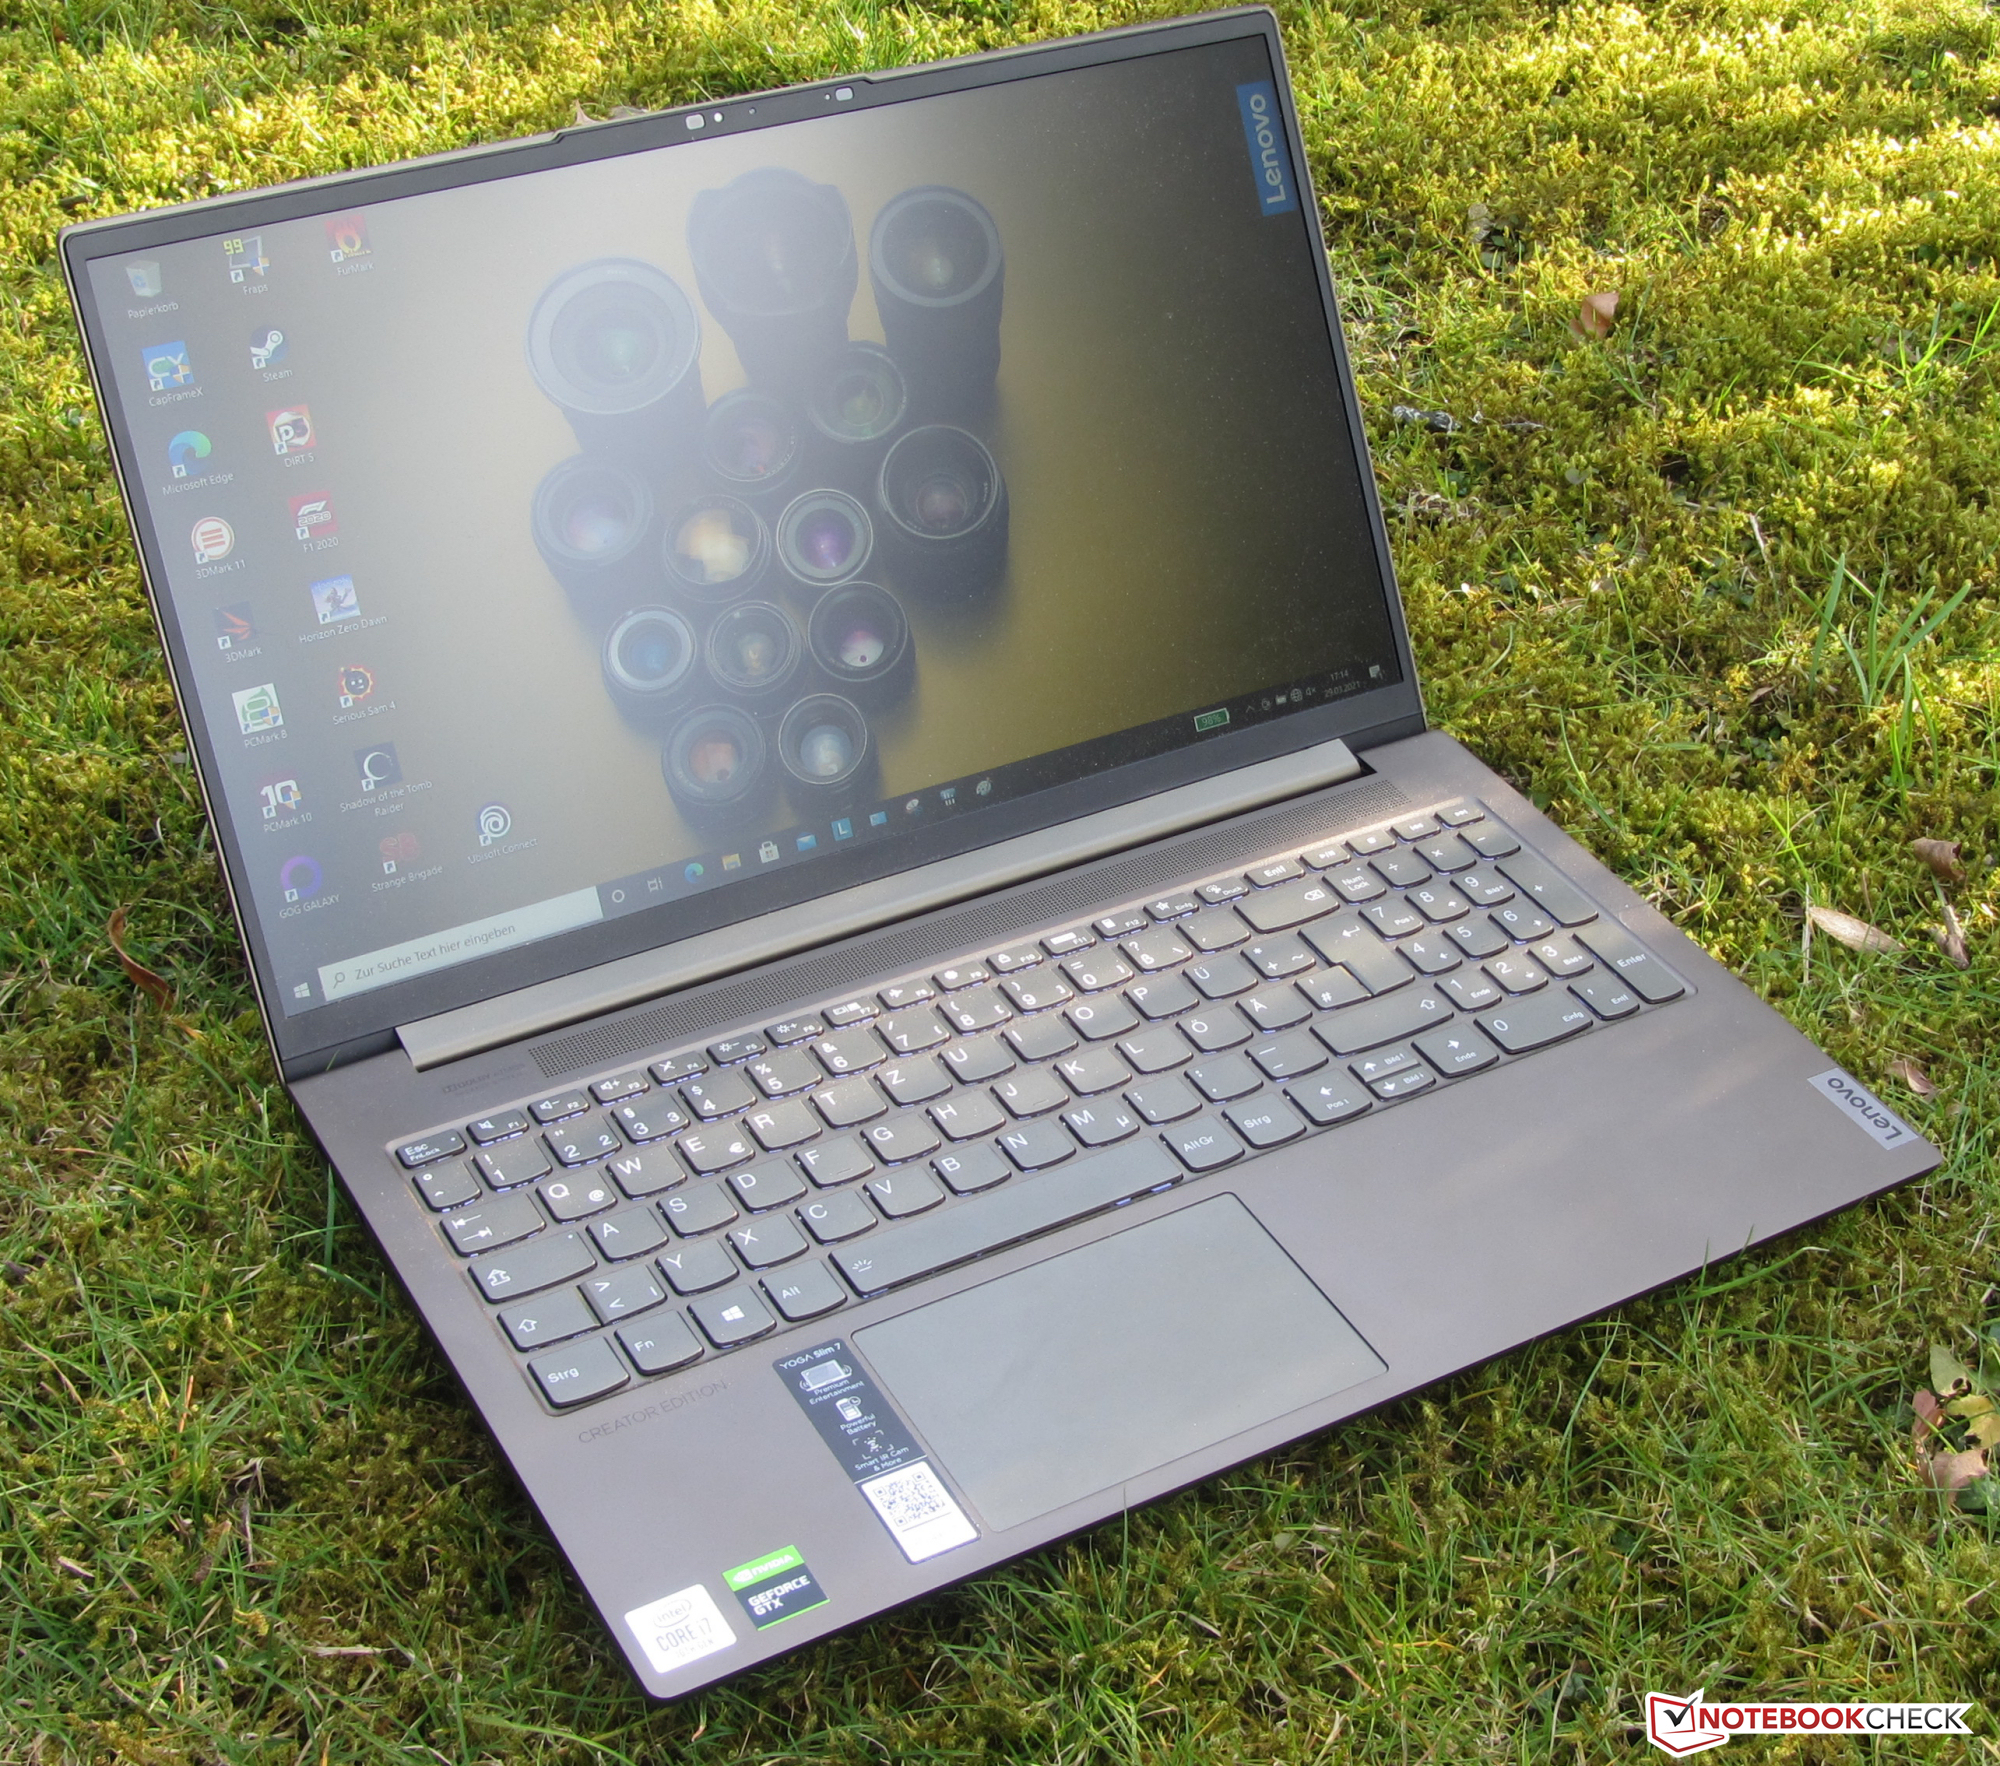
Lenovo Yoga Creator 7 15IMH05 är en välavrundad multimedialaptop som inte har några större svagheter.
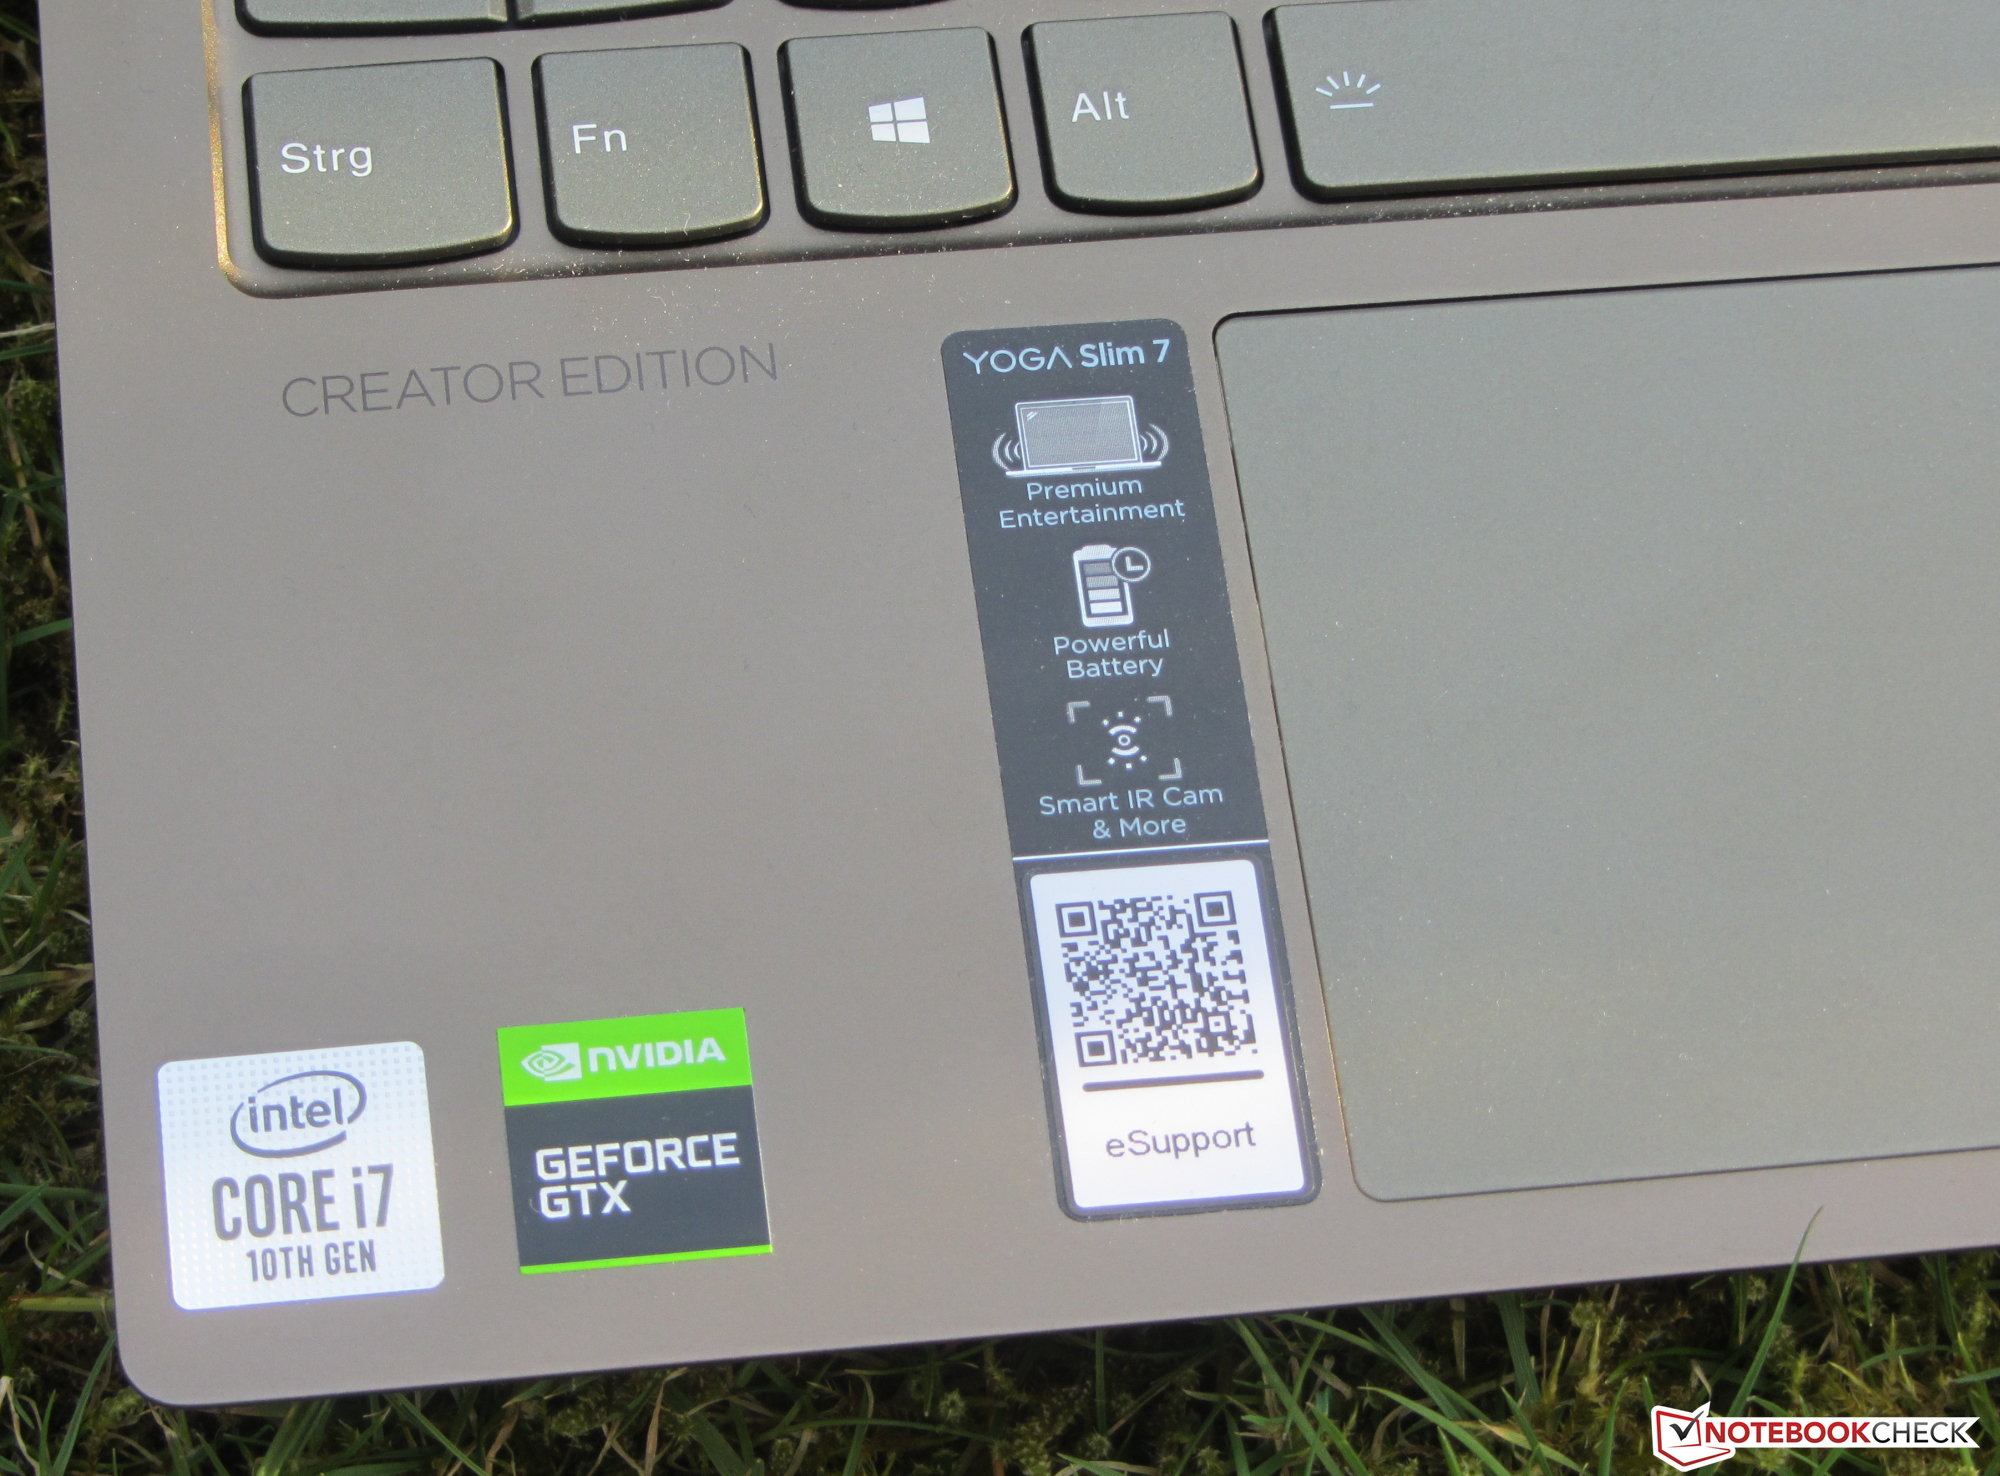
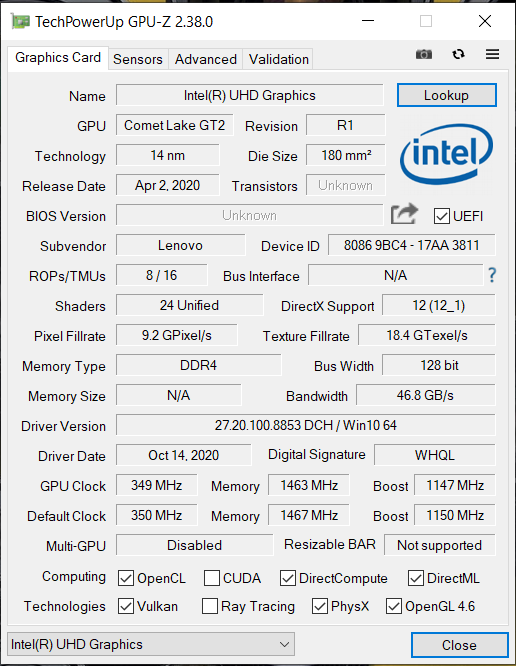
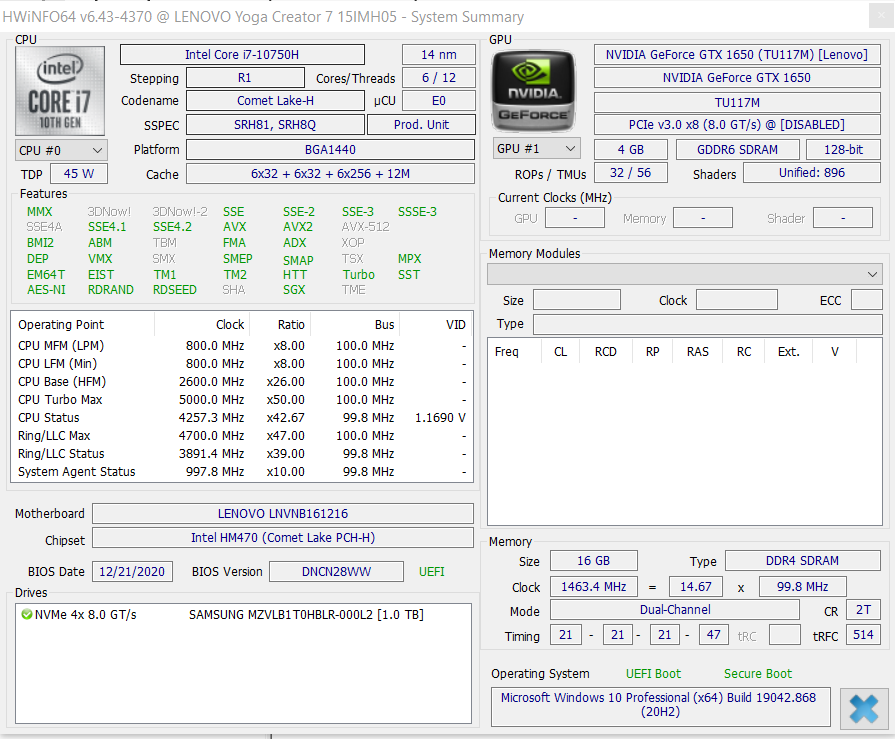
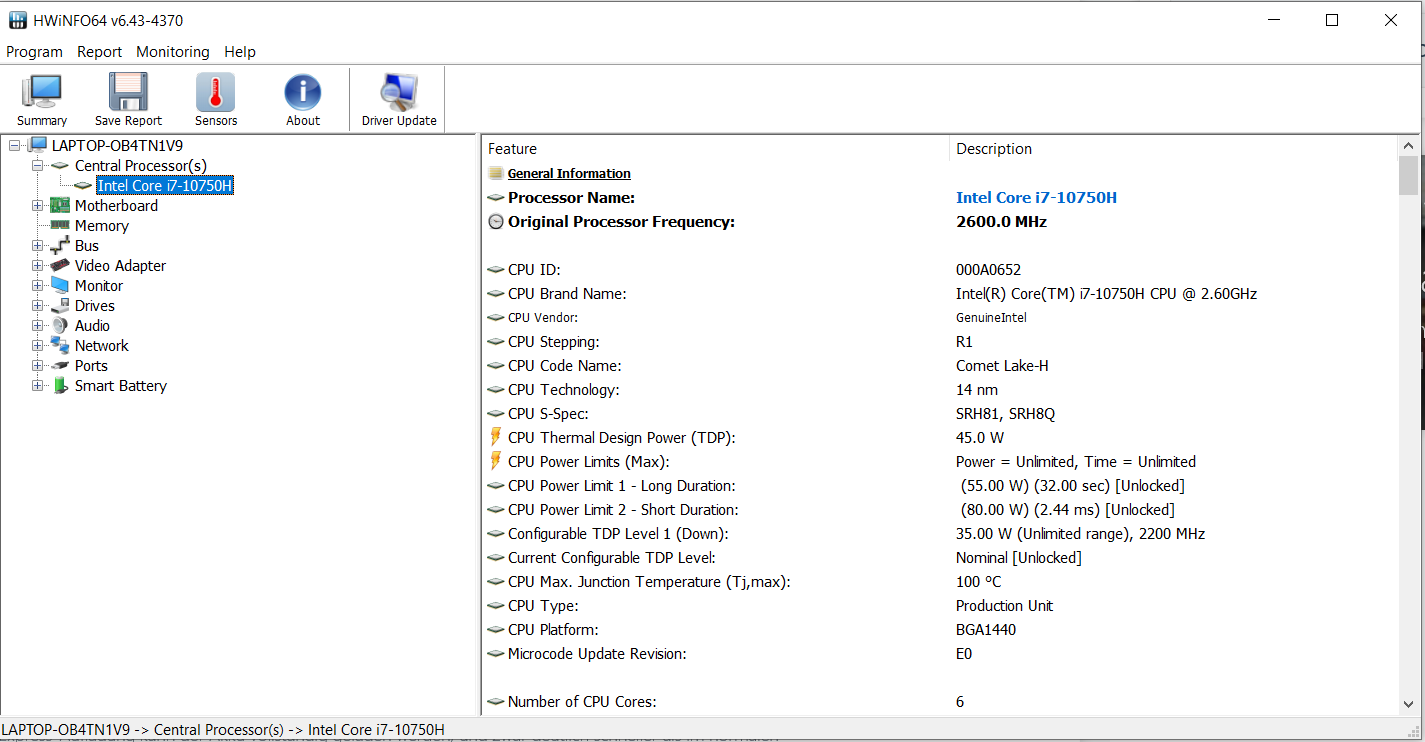
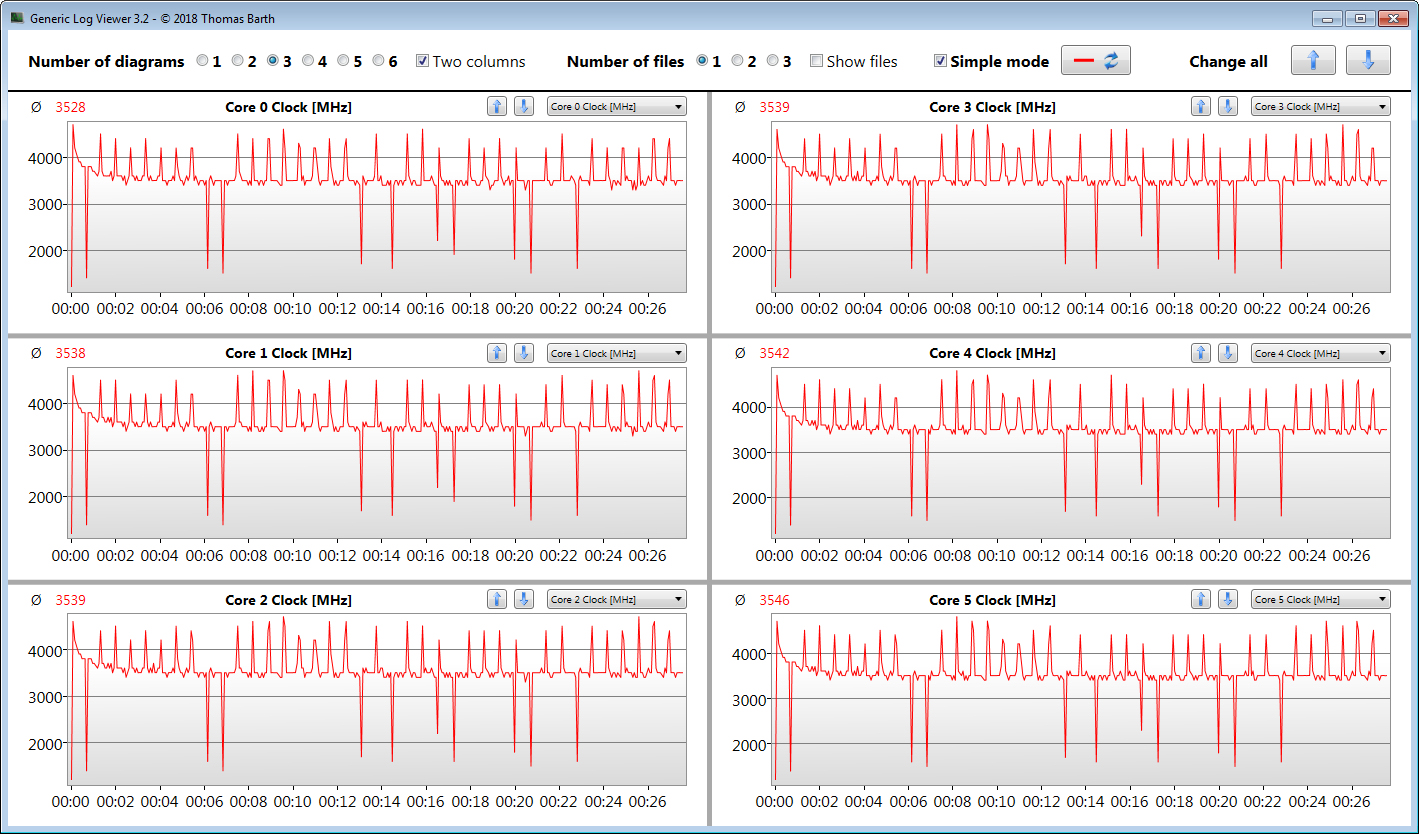
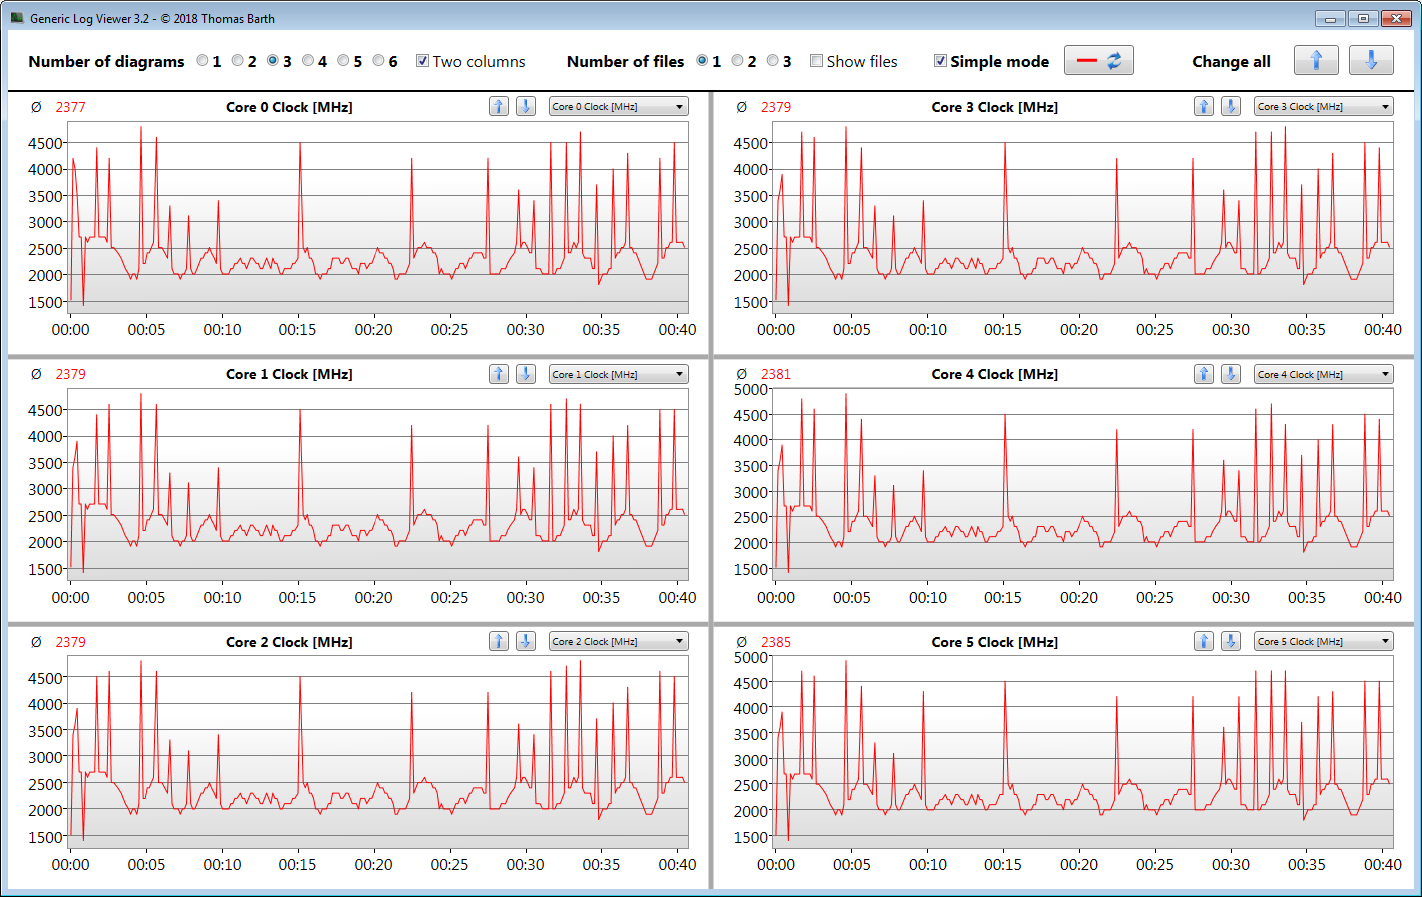
En Core i7-10750H processor, en GeForce GTX-1650 GPU, 16 GB arbetsminne (dubbla kanaler, går ej att utöka) samt en NVMe SSD på 1 TB förbereder enheten för alla vanliga programområden. Den klarar utan problem kontorsprogram, video- och bildredigering, strömning samt spel. Ytterligare en fördel är att värmen och ljudnivån håller sig inom gränserna.
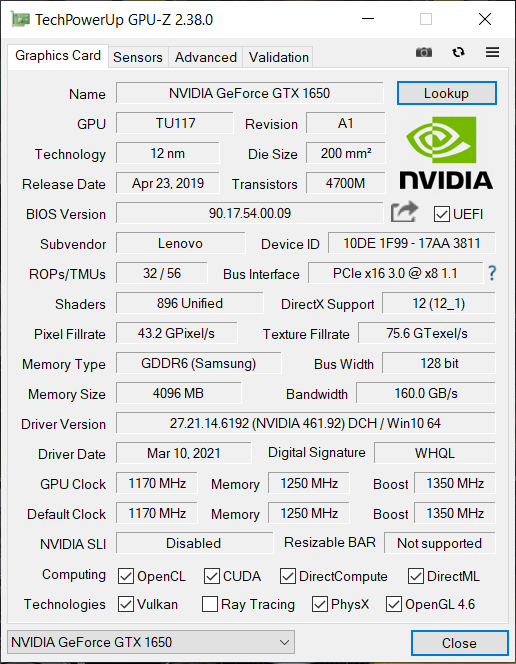
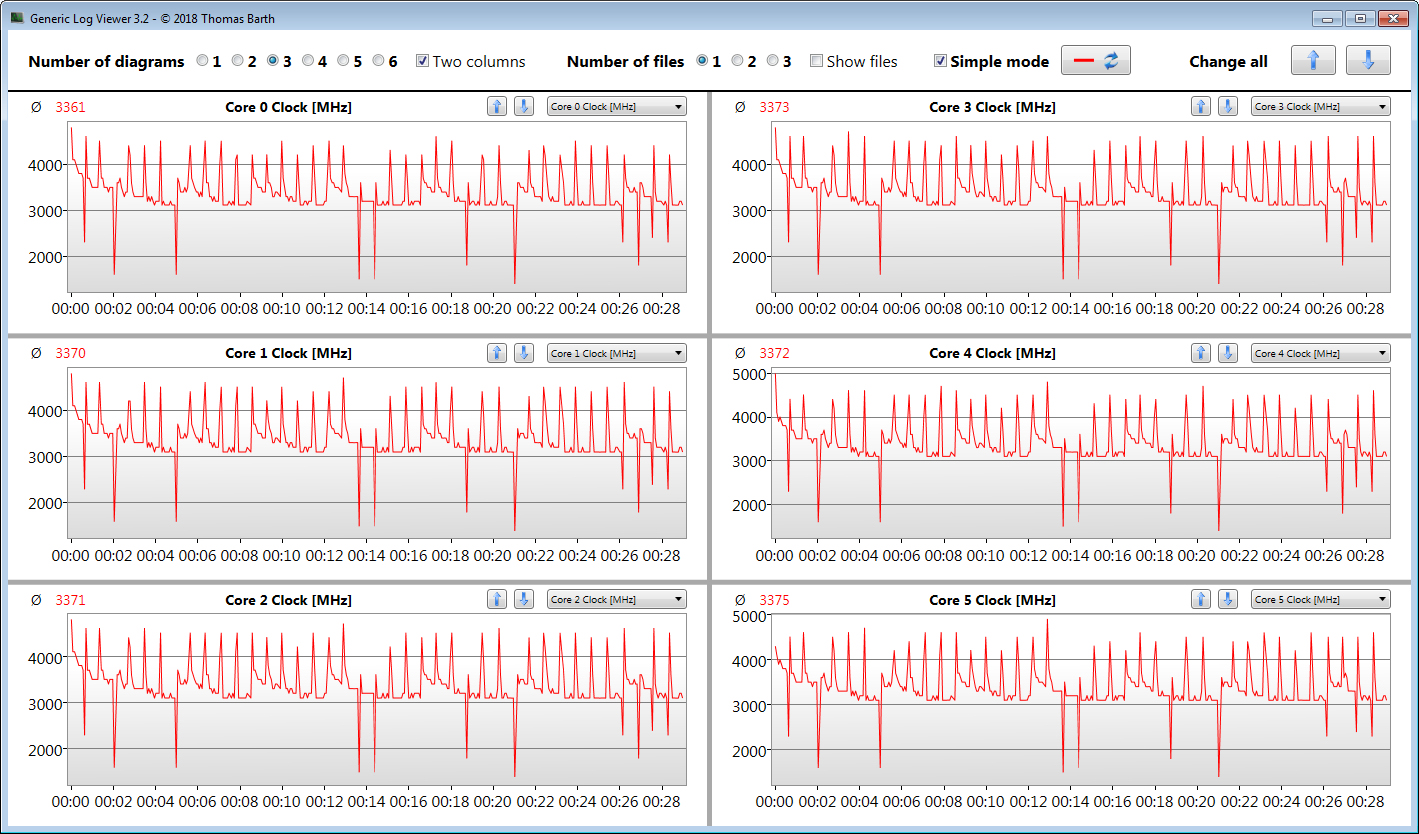
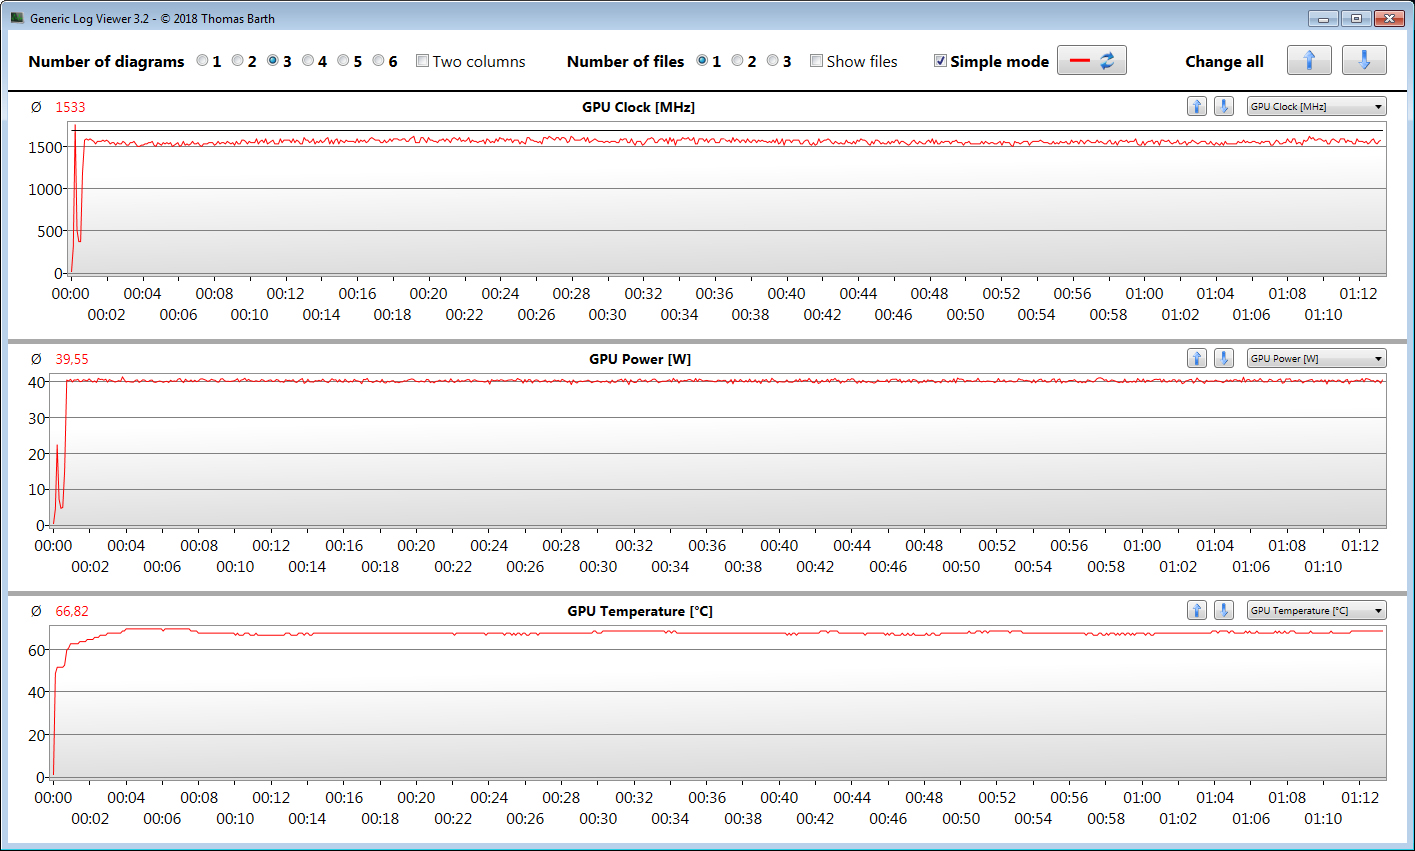
GTX 1650-kärnan använder inte sin fulla kapacitet eftersom dess TGP-värde är begränsat till 40 Watt (Standard TGP är 50 Watt). I fråga om prestanda hamnar GPU:n därför närmare GTX 1650 Max-Q (TGP: 35 Watt). Om du behöver högre grafikprestanda kan du ansluta en extern GPU via Thunderbolt 3-porten.
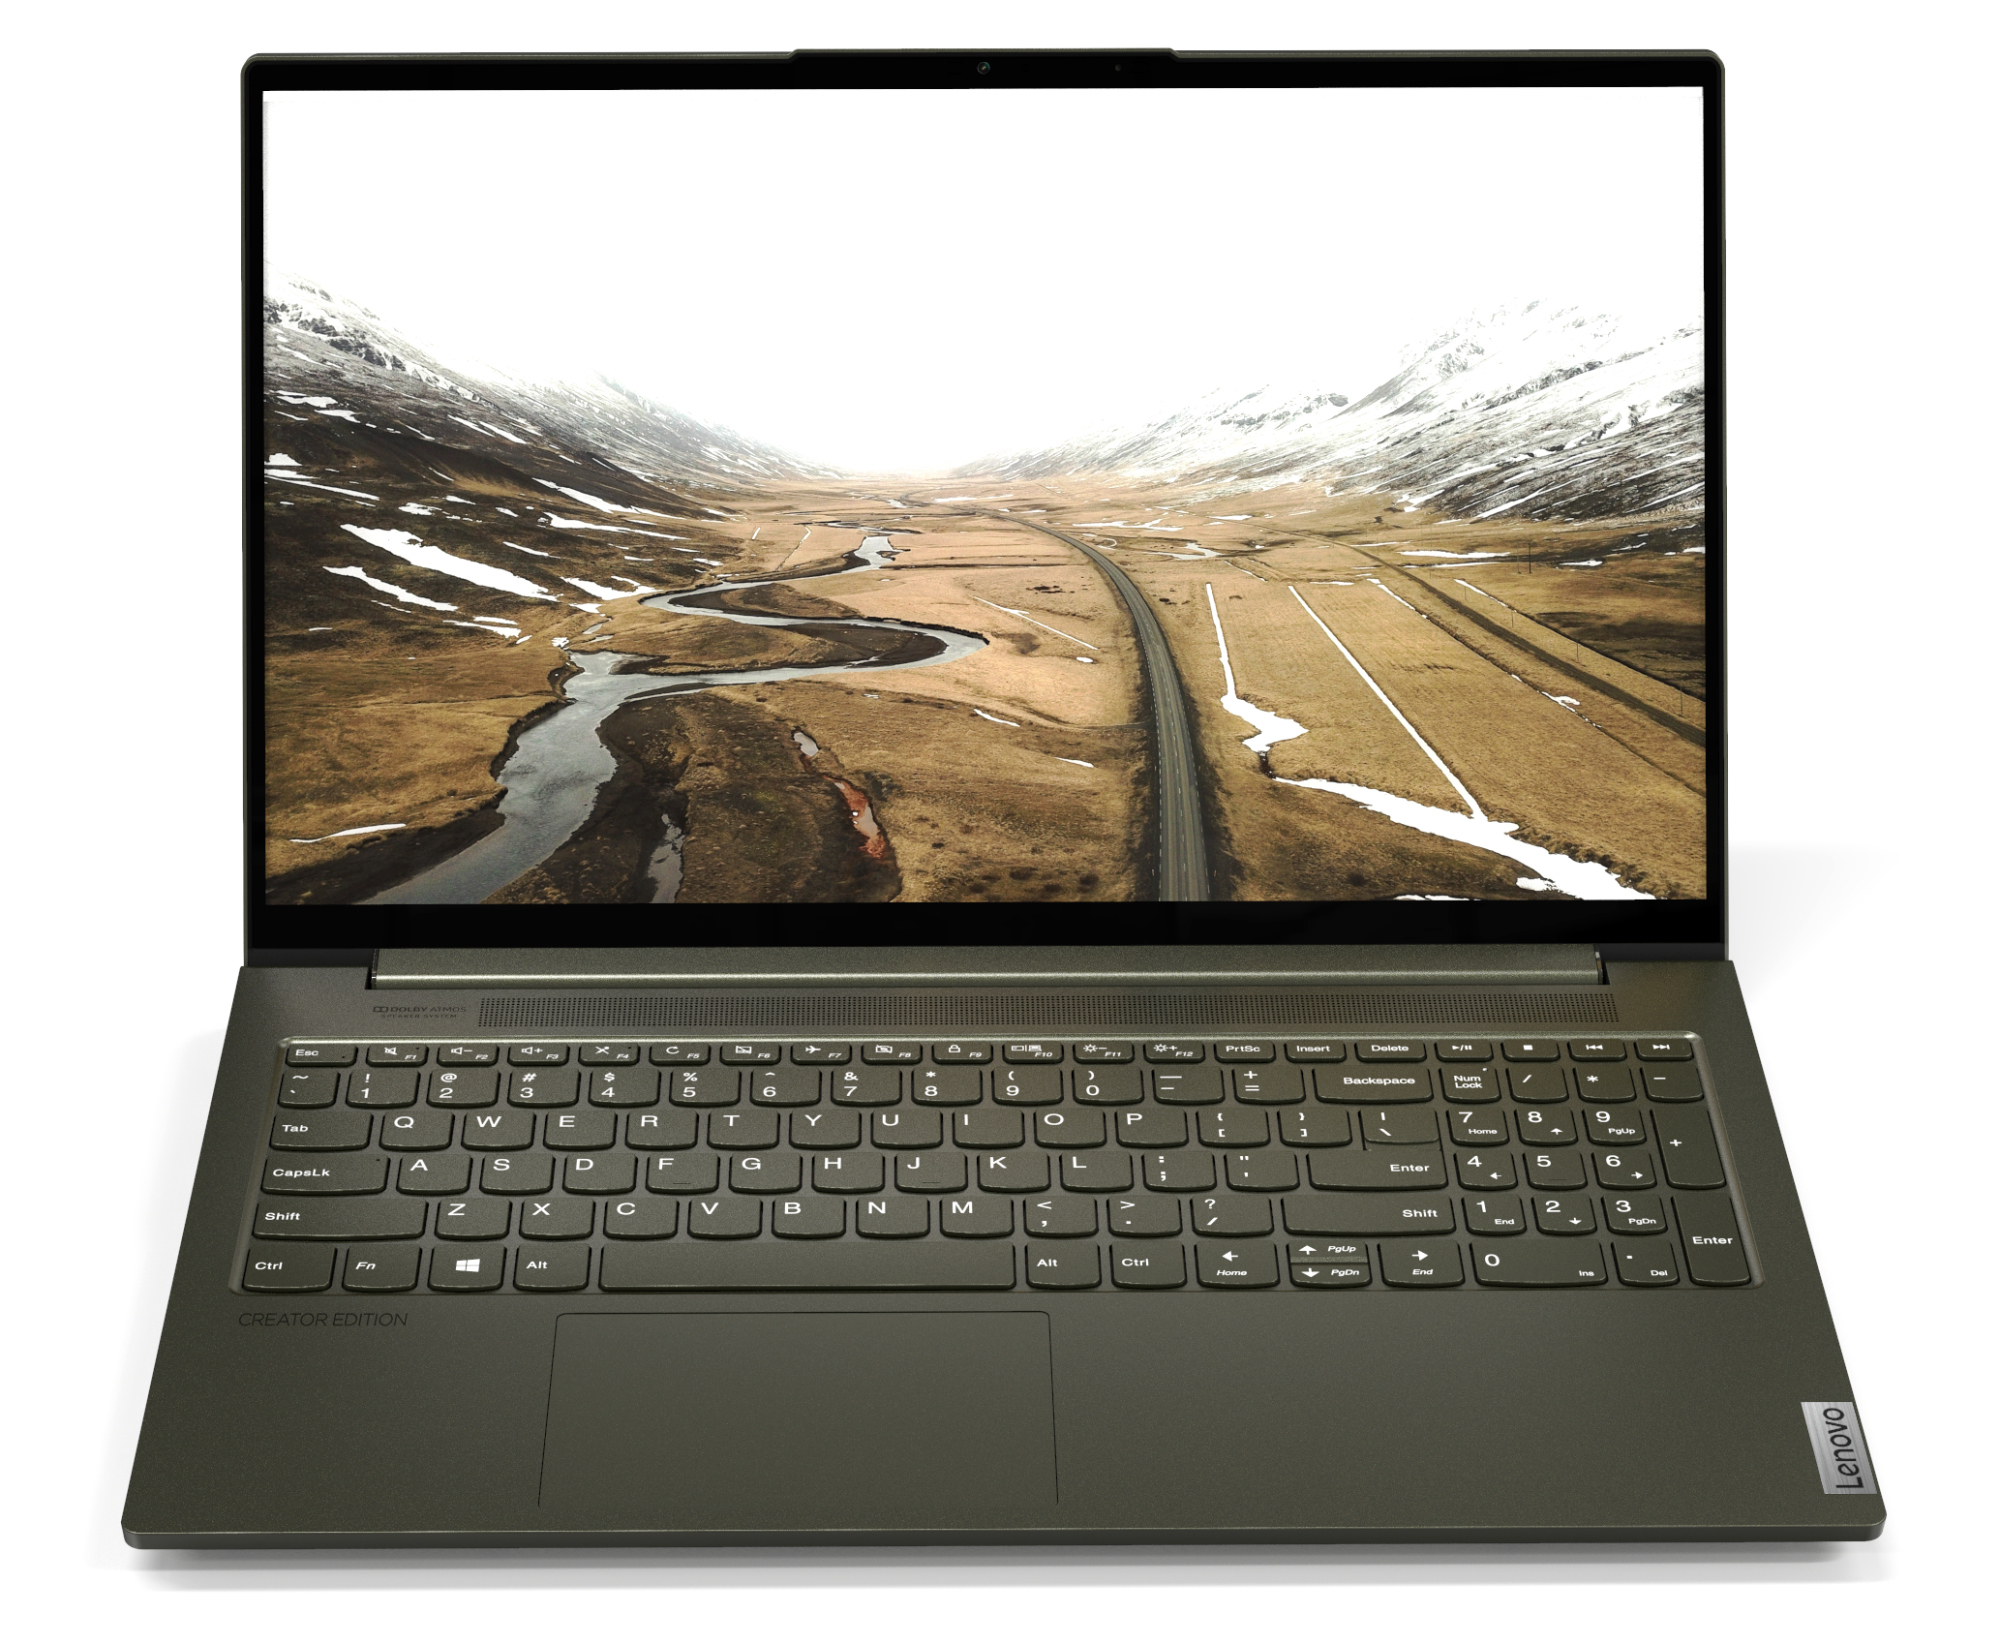
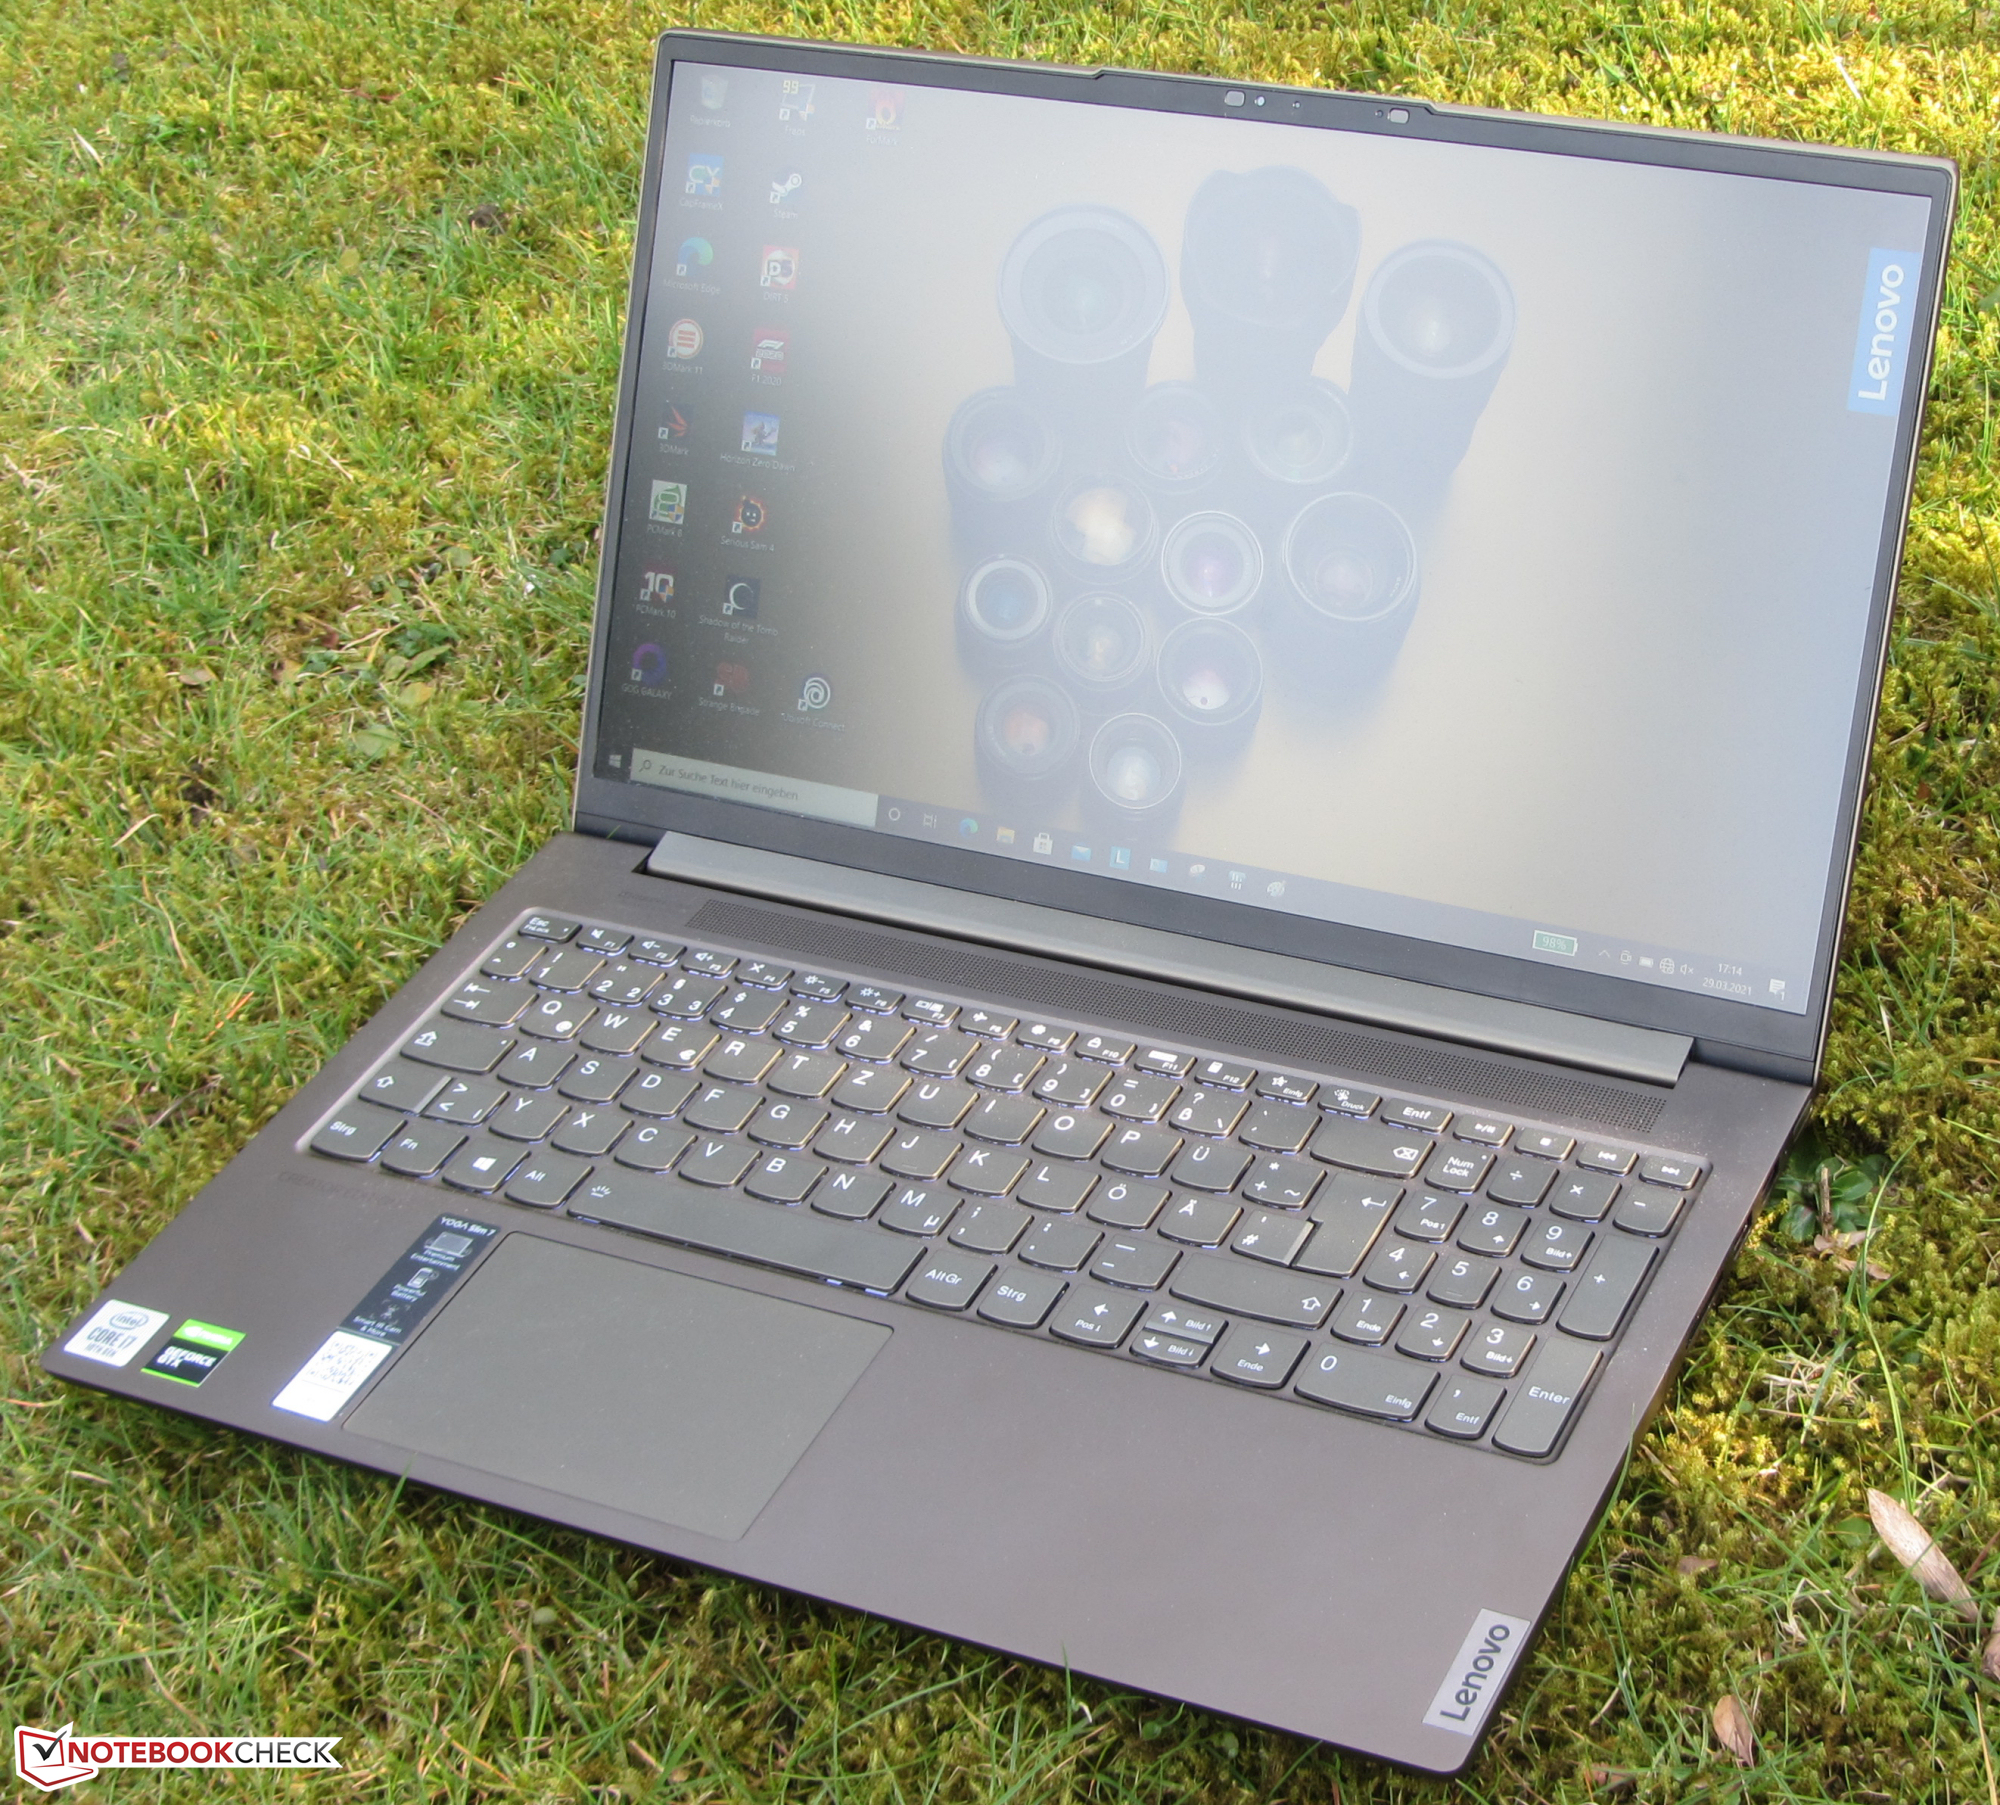
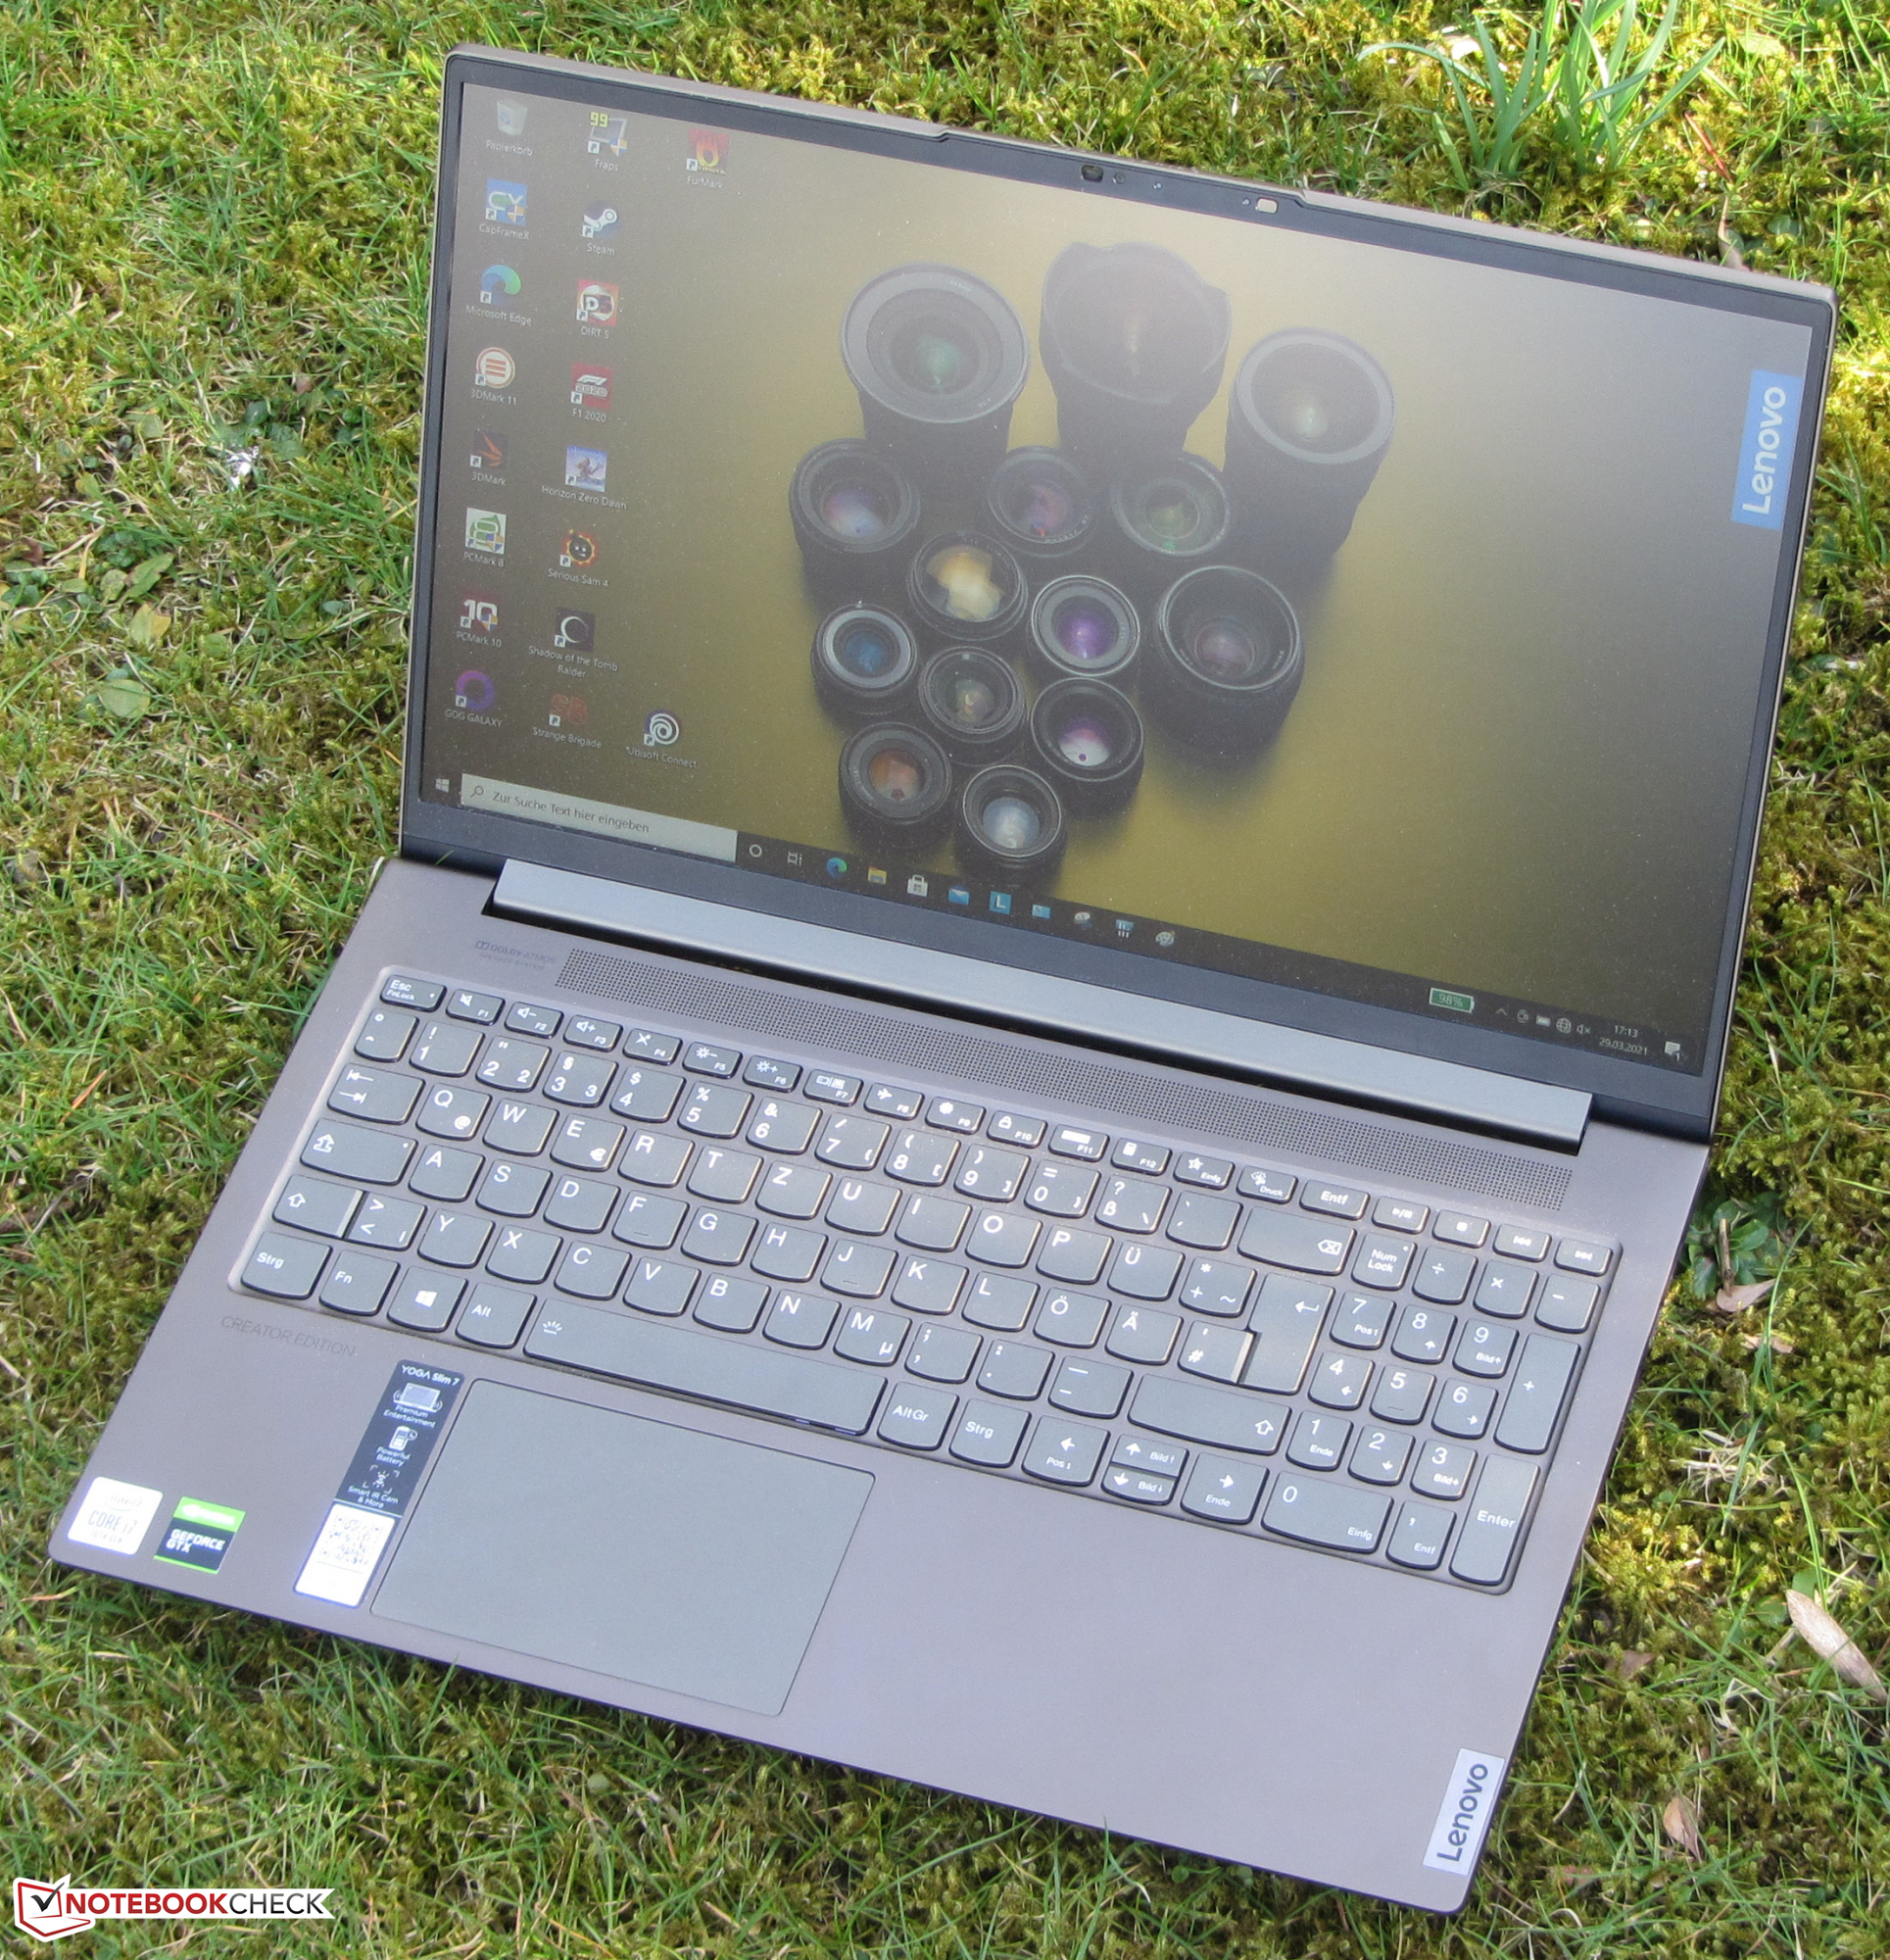
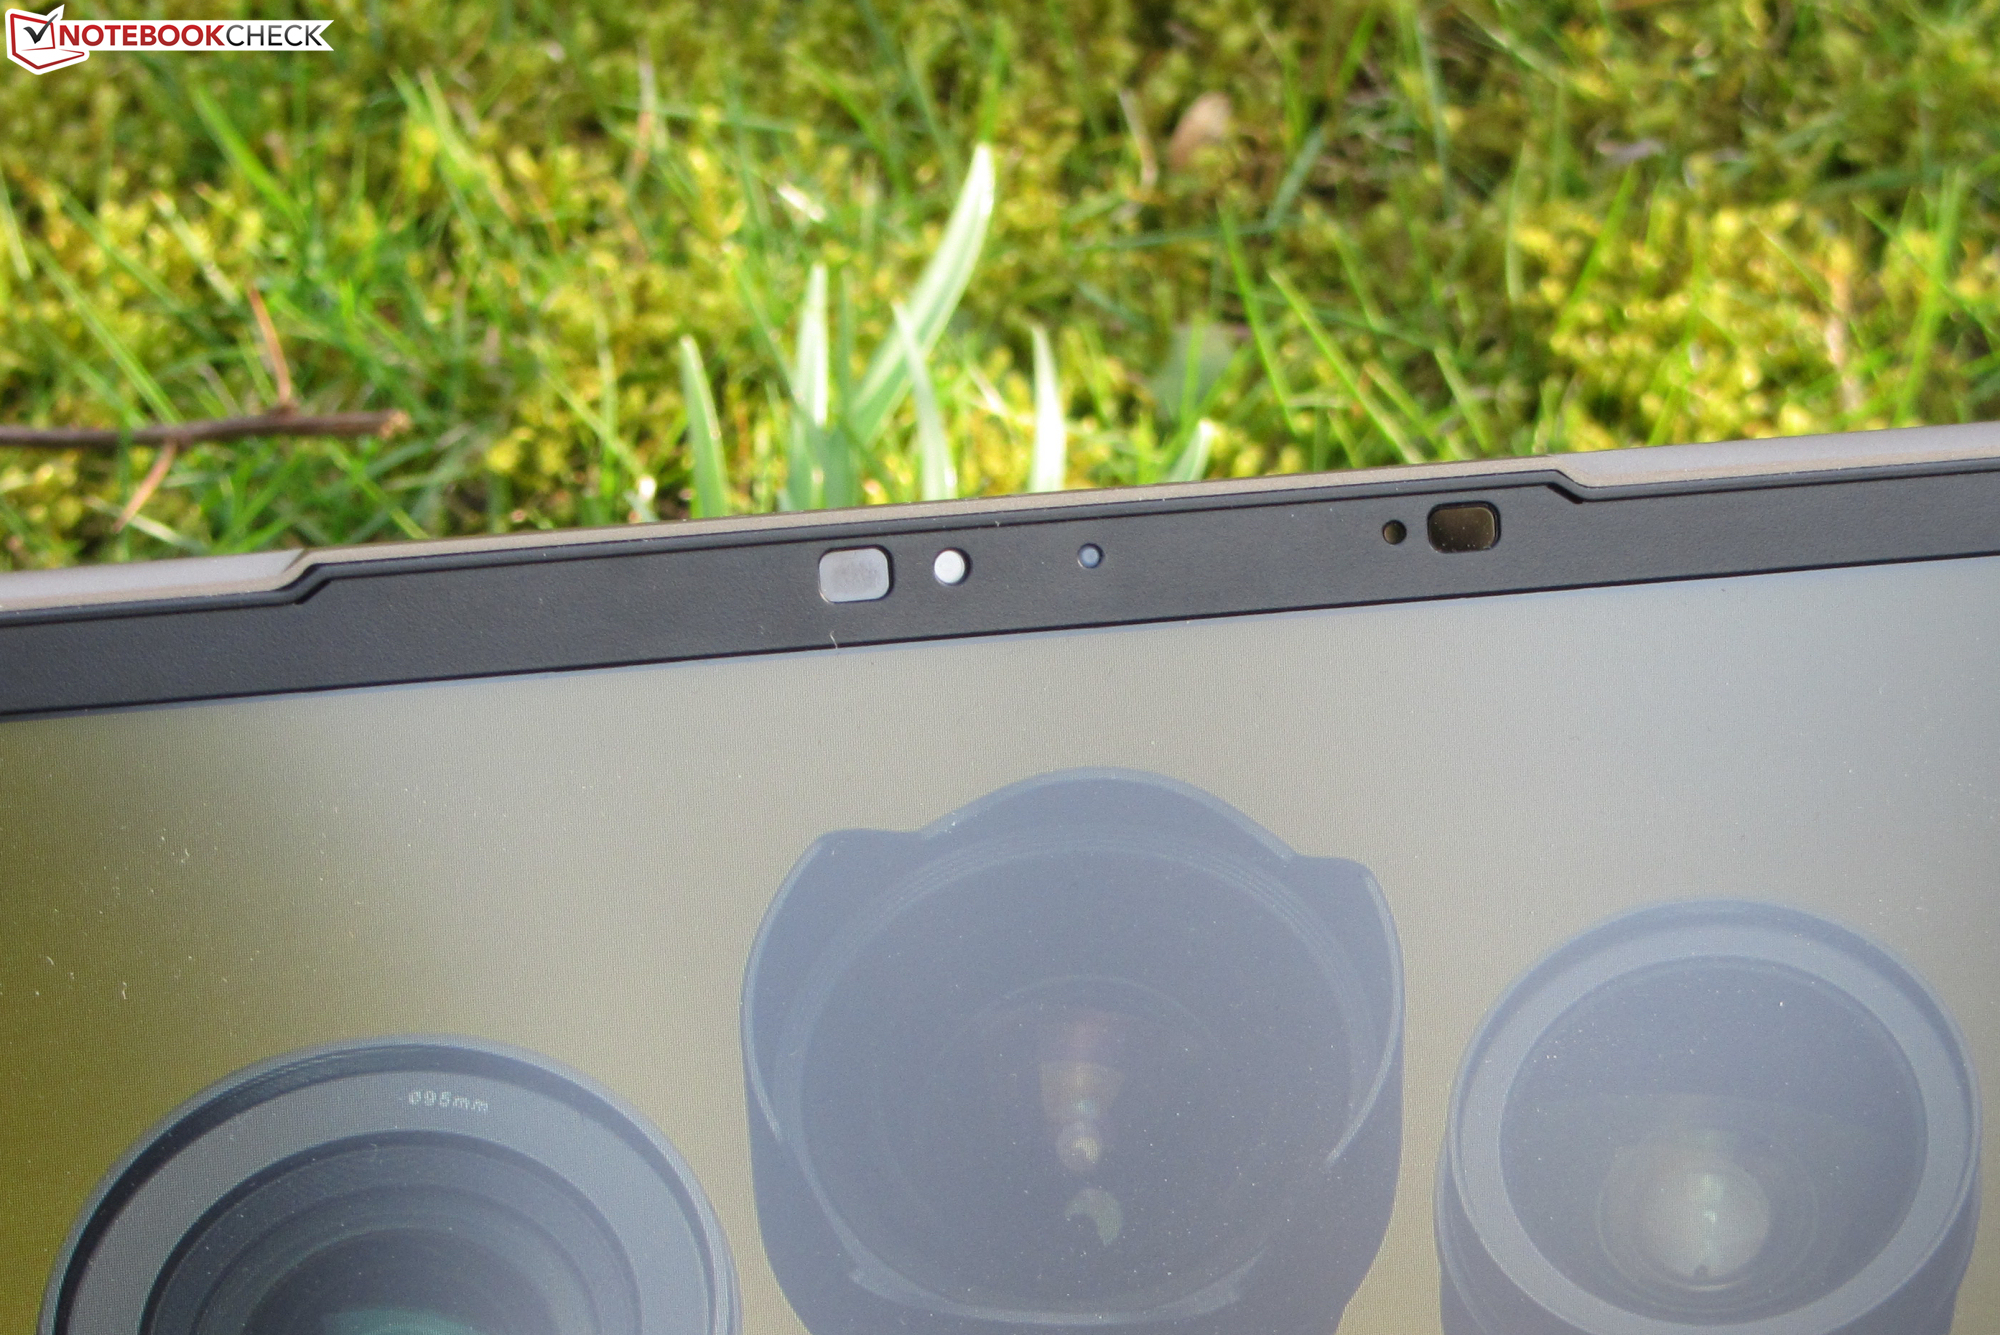
Skärmen (FHD, IPS, Dolby Vision) har en matt yta, stabila betraktningsvinklar, snabba responstider samt ett riktigt skapligt färgomfång. Ljusstyrka och kontrast uppfyller kraven. Det bakgrundsbelysta tangentbordet lämnade ett gott intryck och vi måste också nämna att Lenovo lämnar tre års på plats-garanti på datorn.
Lenovo Yoga Creator 7 15IMH05 82DS000VGE
- 04/04/2021 v7 (old)
Sascha Mölck
Price comparison
