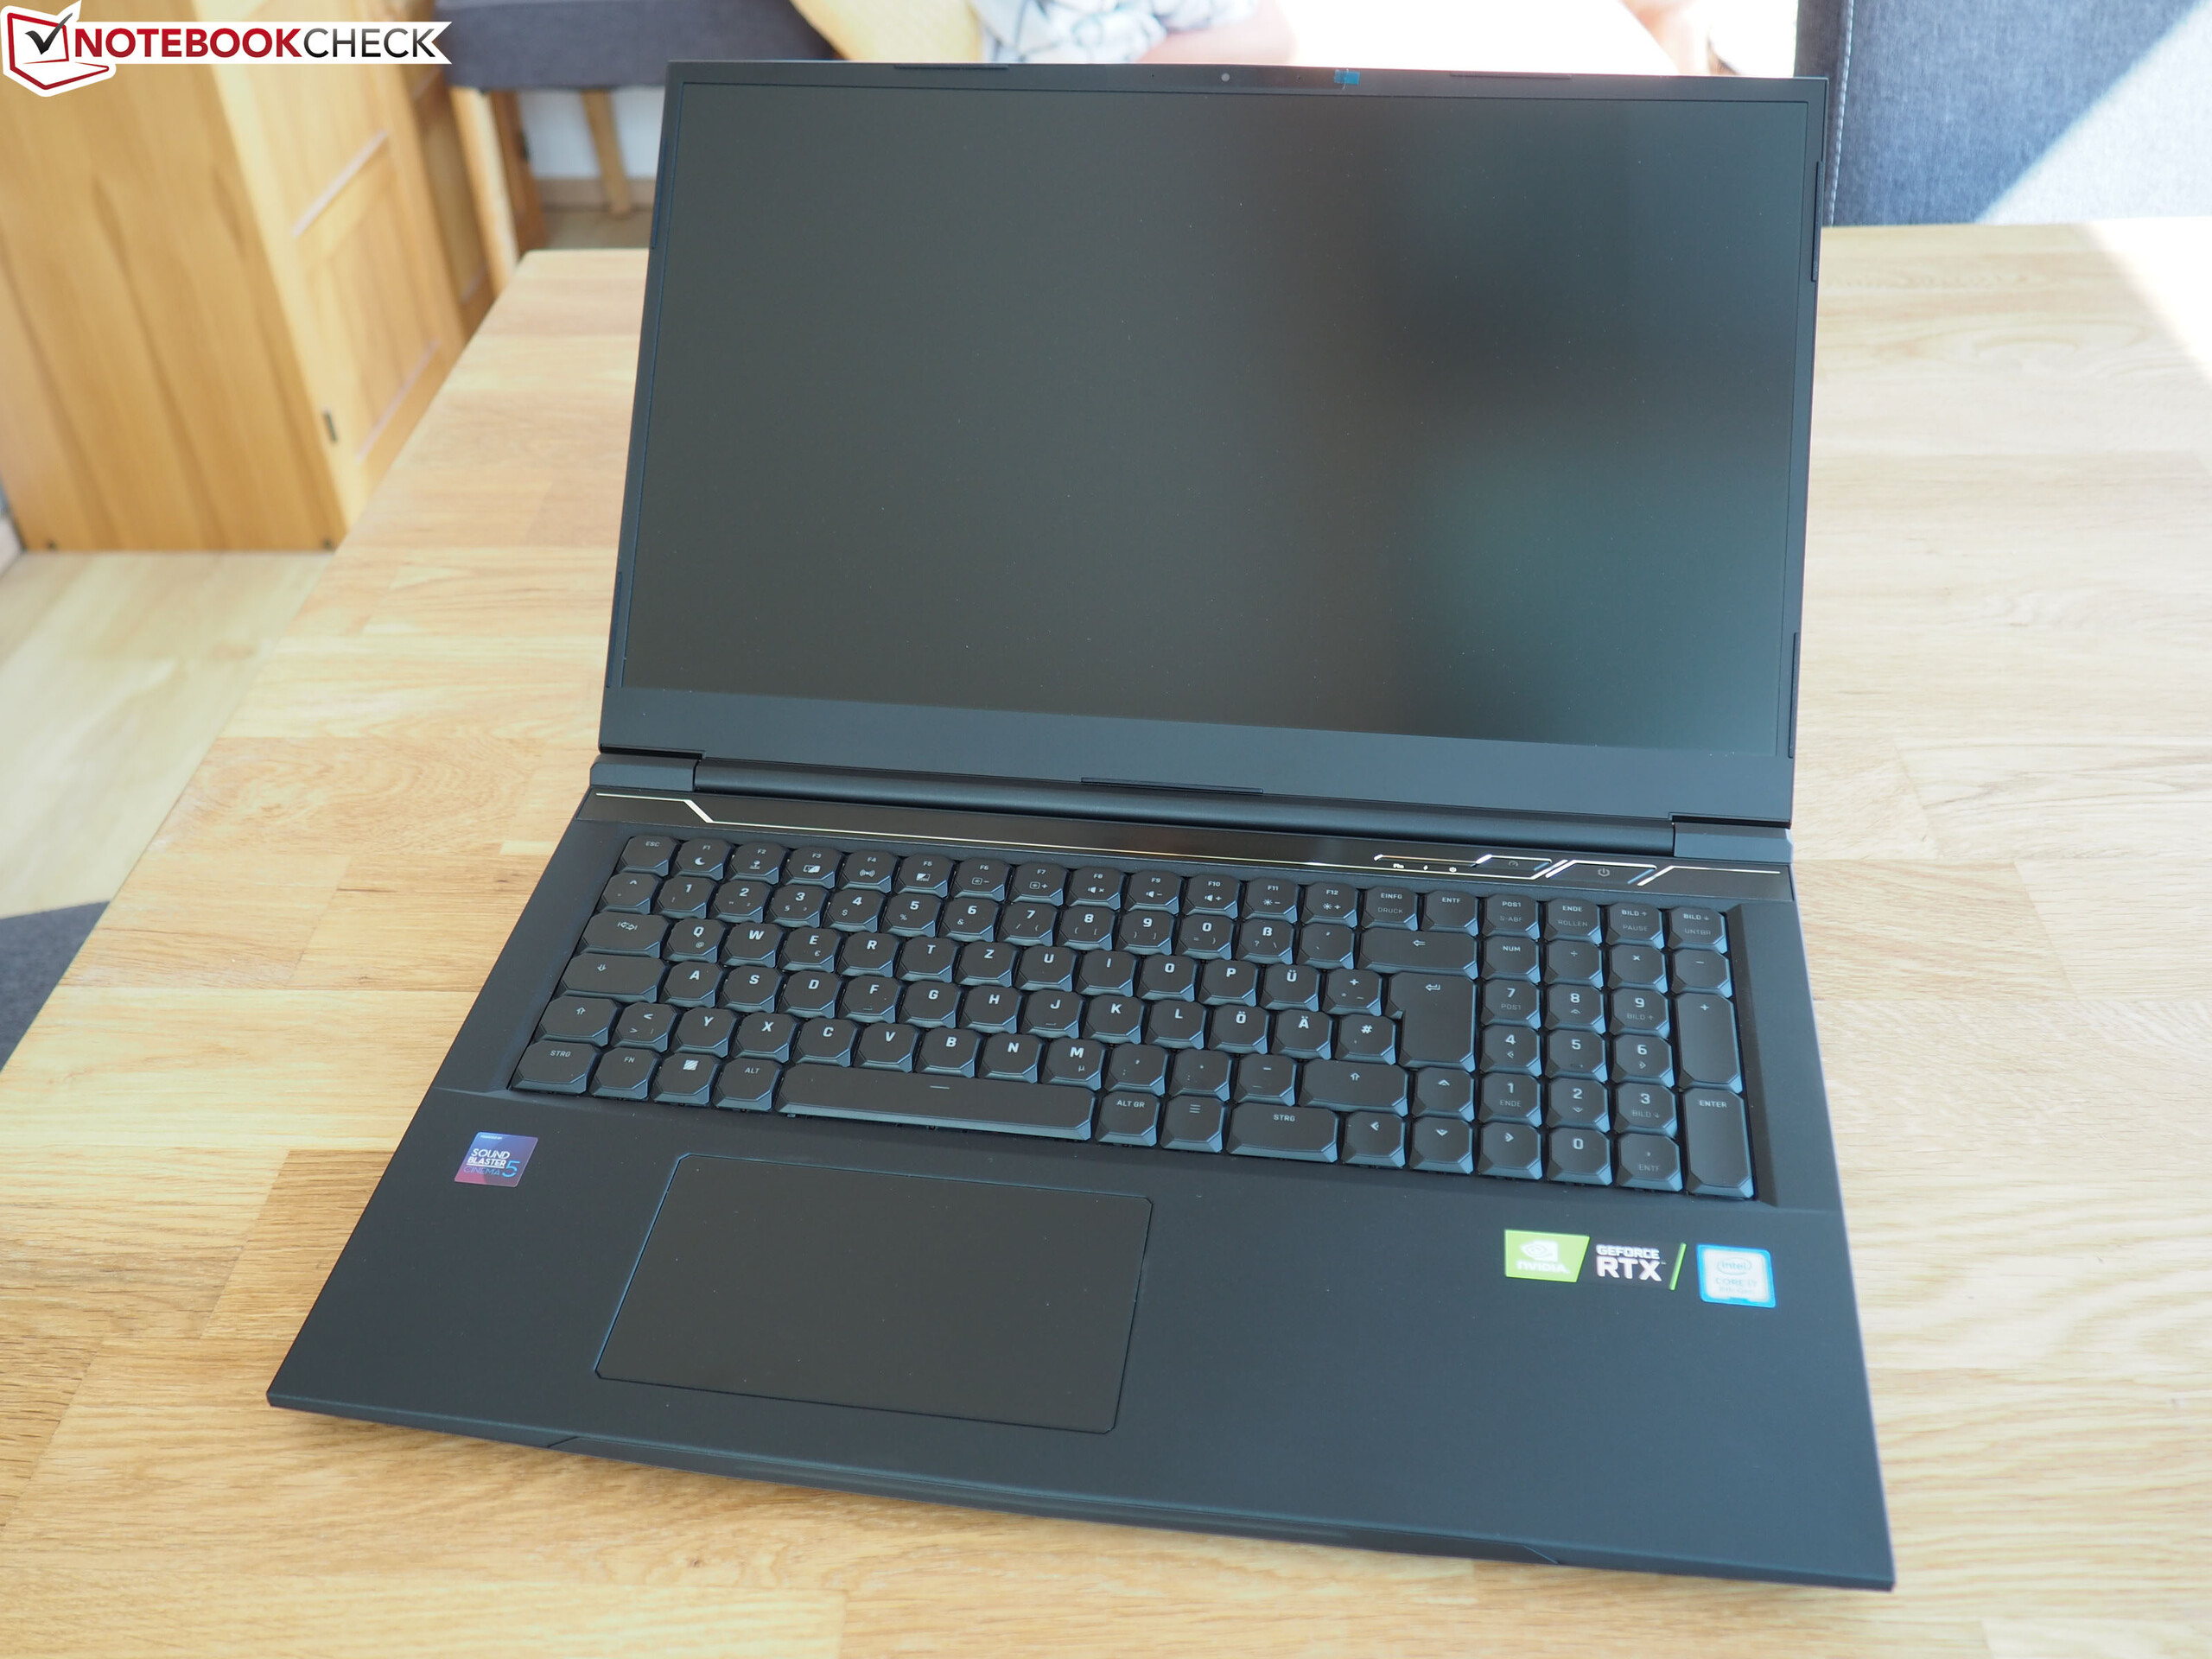
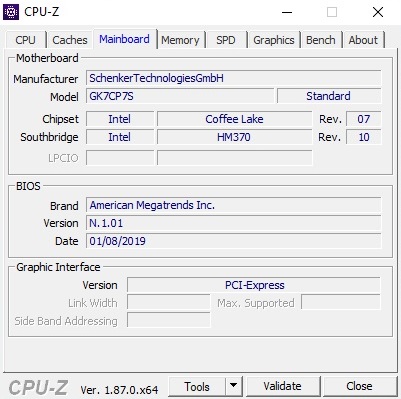
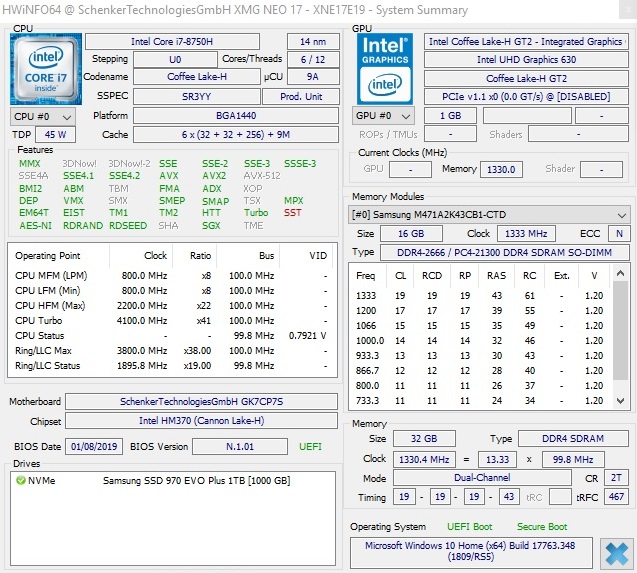
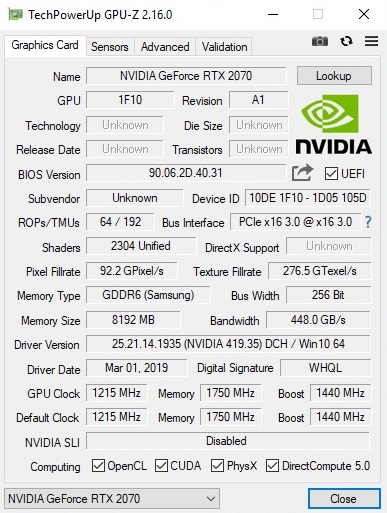
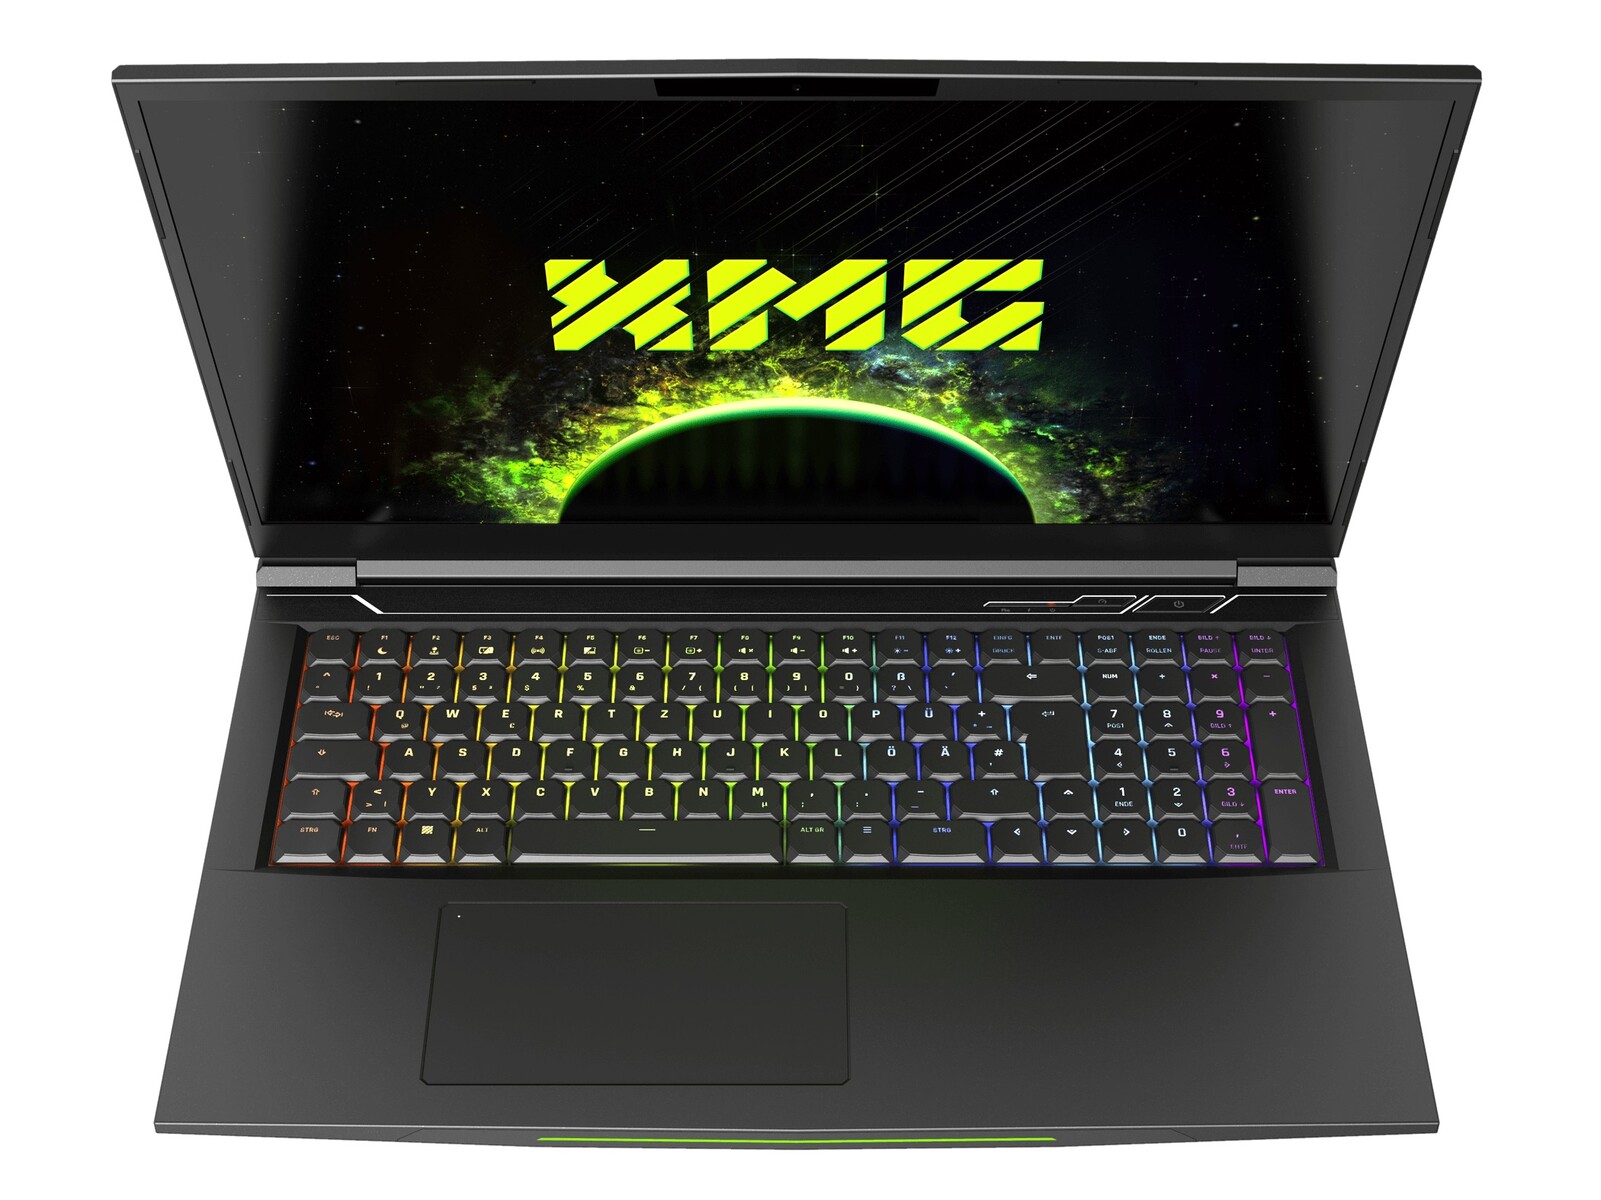
Test: Schenker XMG Neo 17 (Core i7-8750H, GeForce RTX 2070) Tongfang GK7CP7S Laptop (Sammanfattning)
| SD Card Reader | |
| average JPG Copy Test (av. of 3 runs) | |
| Genomsnitt av klass Gaming (20.9 - 210, n=55, senaste 2 åren) | |
| Asus ROG Strix Scar II GL704GW (Toshiba Exceria Pro SDXC 64 GB UHS-II) | |
| Schenker XMG Neo 17 (Toshiba Exceria Pro SDXC 64 GB UHS-II) | |
| MSI GE75 8SF (Toshiba Exceria Pro SDXC 64 GB UHS-II) | |
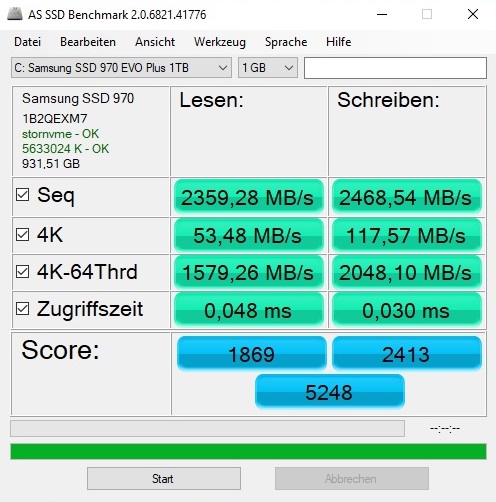
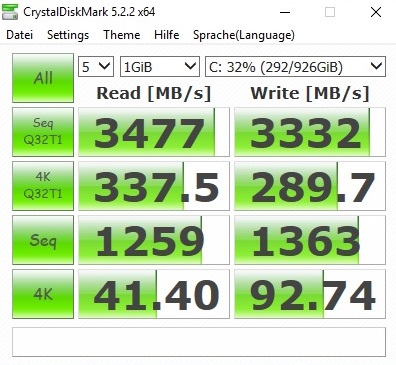
| maximum AS SSD Seq Read Test (1GB) | |
| Genomsnitt av klass Gaming (25.5 - 261, n=52, senaste 2 åren) | |
| Schenker XMG Neo 17 (Toshiba Exceria Pro SDXC 64 GB UHS-II) | |
| Asus ROG Strix Scar II GL704GW (Toshiba Exceria Pro SDXC 64 GB UHS-II) | |
| MSI GE75 8SF (Toshiba Exceria Pro SDXC 64 GB UHS-II) | |
| |||||||||||||||||||||||||
Distribution av ljusstyrkan: 90 %
Mitt på batteriet: 304 cd/m²
Kontrast: 1169:1 (Svärta: 0.26 cd/m²)
ΔE ColorChecker Calman: 2.65 | ∀{0.5-29.43 Ø4.71}
calibrated: 1.5
ΔE Greyscale Calman: 2.75 | ∀{0.09-98 Ø4.96}
92% sRGB (Argyll 1.6.3 3D)
60% AdobeRGB 1998 (Argyll 1.6.3 3D)
66.5% AdobeRGB 1998 (Argyll 3D)
92.2% sRGB (Argyll 3D)
65.2% Display P3 (Argyll 3D)
Gamma: 2.46
CCT: 6763 K
| Schenker XMG Neo 17 BOEhydis NV173FHM-N44 (BOE07B6), IPS, 1920x1080 | Asus ROG Strix Scar II GL704GW B173HAN04.0 (AUO409D), AHVA, 1920x1080 | MSI GE75 8SF Chi Mei N173HCE-G33, IPS, 1920x1080 | Lenovo Legion Y740-17ICH AU Optronics B173HAN03.2, IPS, 1920x1080 | Asus Zephyrus S GX701GX B173HAN04.0 (AUO409D), IPS, 1920x1080 | |
|---|---|---|---|---|---|
| Display | -5% | -1% | -2% | -4% | |
| Display P3 Coverage (%) | 65.2 | 62.9 -4% | 63.1 -3% | 64 -2% | 62.9 -4% |
| sRGB Coverage (%) | 92.2 | 87.1 -6% | 94.4 2% | 90.4 -2% | 87.8 -5% |
| AdobeRGB 1998 Coverage (%) | 66.5 | 63.7 -4% | 65.2 -2% | 64.8 -3% | 63.9 -4% |
| Response Times | 7% | 31% | 5% | 41% | |
| Response Time Grey 50% / Grey 80% * (ms) | 18.8 ? | 17.6 ? 6% | 9.6 ? 49% | 15.6 ? 17% | 7.2 ? 62% |
| Response Time Black / White * (ms) | 12 ? | 11.2 ? 7% | 10.4 ? 13% | 12.8 ? -7% | 9.6 ? 20% |
| PWM Frequency (Hz) | 971 ? | 25770 ? | |||
| Screen | -6% | 19% | -42% | 4% | |
| Brightness middle (cd/m²) | 304 | 295 -3% | 370.4 22% | 299.1 -2% | 288 -5% |
| Brightness (cd/m²) | 289 | 291 1% | 348 20% | 273 -6% | 287 -1% |
| Brightness Distribution (%) | 90 | 96 7% | 89 -1% | 81 -10% | 91 1% |
| Black Level * (cd/m²) | 0.26 | 0.24 8% | 0.29 -12% | 0.27 -4% | 0.2 23% |
| Contrast (:1) | 1169 | 1229 5% | 1277 9% | 1108 -5% | 1440 23% |
| Colorchecker dE 2000 * | 2.65 | 3.2 -21% | 1.26 52% | 5.07 -91% | 2.33 12% |
| Colorchecker dE 2000 max. * | 6.11 | 6.64 -9% | 3.02 51% | 10.55 -73% | 5.34 13% |
| Colorchecker dE 2000 calibrated * | 1.5 | 2.52 -68% | 1.21 19% | 3.31 -121% | 2.47 -65% |
| Greyscale dE 2000 * | 2.75 | 2.16 21% | 1.4 49% | 6.8 -147% | 1.19 57% |
| Gamma | 2.46 89% | 2.46 89% | 2.2 100% | 2.46 89% | 2.41 91% |
| CCT | 6763 96% | 6872 95% | 6747 96% | 7805 83% | 6710 97% |
| Color Space (Percent of AdobeRGB 1998) (%) | 60 | 57 -5% | 59.7 0% | 58.5 -2% | 57 -5% |
| Color Space (Percent of sRGB) (%) | 92 | 87 -5% | 94.4 3% | 89.9 -2% | 88 -4% |
| Totalt genomsnitt (program/inställningar) | -1% /
-4% | 16% /
17% | -13% /
-29% | 14% /
7% |
* ... mindre är bättre
Visa svarstider
| ↔ Svarstid svart till vitt | ||
|---|---|---|
| 12 ms ... stiga ↗ och falla ↘ kombinerat | ↗ 6.8 ms stiga | 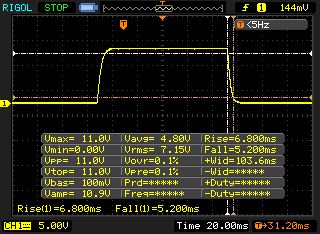 |
| ↘ 5.2 ms hösten | ||
| Skärmen visar bra svarsfrekvens i våra tester, men kan vara för långsam för konkurrenskraftiga spelare. I jämförelse sträcker sig alla testade enheter från 0.1 (minst) till 240 (maximalt) ms. » 32 % av alla enheter är bättre. Det betyder att den uppmätta svarstiden är bättre än genomsnittet av alla testade enheter (19.8 ms). | ||
| ↔ Svarstid 50 % grått till 80 % grått | ||
| 18.8 ms ... stiga ↗ och falla ↘ kombinerat | ↗ 9.6 ms stiga | 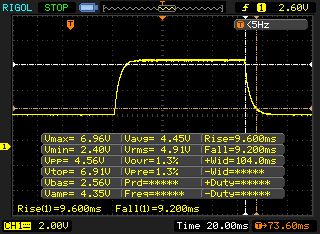 |
| ↘ 9.2 ms hösten | ||
| Skärmen visar bra svarsfrekvens i våra tester, men kan vara för långsam för konkurrenskraftiga spelare. I jämförelse sträcker sig alla testade enheter från 0.165 (minst) till 636 (maximalt) ms. » 32 % av alla enheter är bättre. Det betyder att den uppmätta svarstiden är bättre än genomsnittet av alla testade enheter (30.9 ms). | ||
Skärmflimmer / PWM (Puls-Width Modulation)
| Skärmflimmer / PWM upptäckt | 971 Hz | ≤ 99 % ljusstyrka inställning | 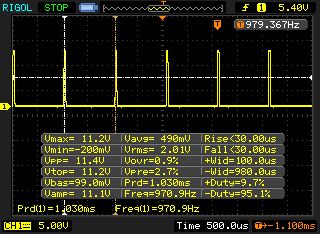 |
Displayens bakgrundsbelysning flimrar vid 971 Hz (i värsta fall, t.ex. med PWM) Flimrande upptäckt vid en ljusstyrkeinställning på 99 % och lägre. Det ska inte finnas något flimmer eller PWM över denna ljusstyrkeinställning. Frekvensen för 971 Hz är ganska hög, så de flesta användare som är känsliga för PWM bör inte märka något flimmer. Som jämförelse: 52 % av alla testade enheter använder inte PWM för att dämpa skärmen. Om PWM upptäcktes mättes ett medelvärde av 7748 (minst: 5 - maximum: 343500) Hz. | |||
| Cinebench R11.5 | |
| CPU Single 64Bit | |
| Genomsnitt av klass Gaming (3.3 - 4.16, n=9, senaste 2 åren) | |
| Schenker XMG Neo 17 | |
| Asus Zephyrus S GX701GX | |
| CPU Multi 64Bit | |
| Genomsnitt av klass Gaming (29.8 - 76.7, n=9, senaste 2 åren) | |
| Asus Zephyrus S GX701GX | |
| Schenker XMG Neo 17 | |
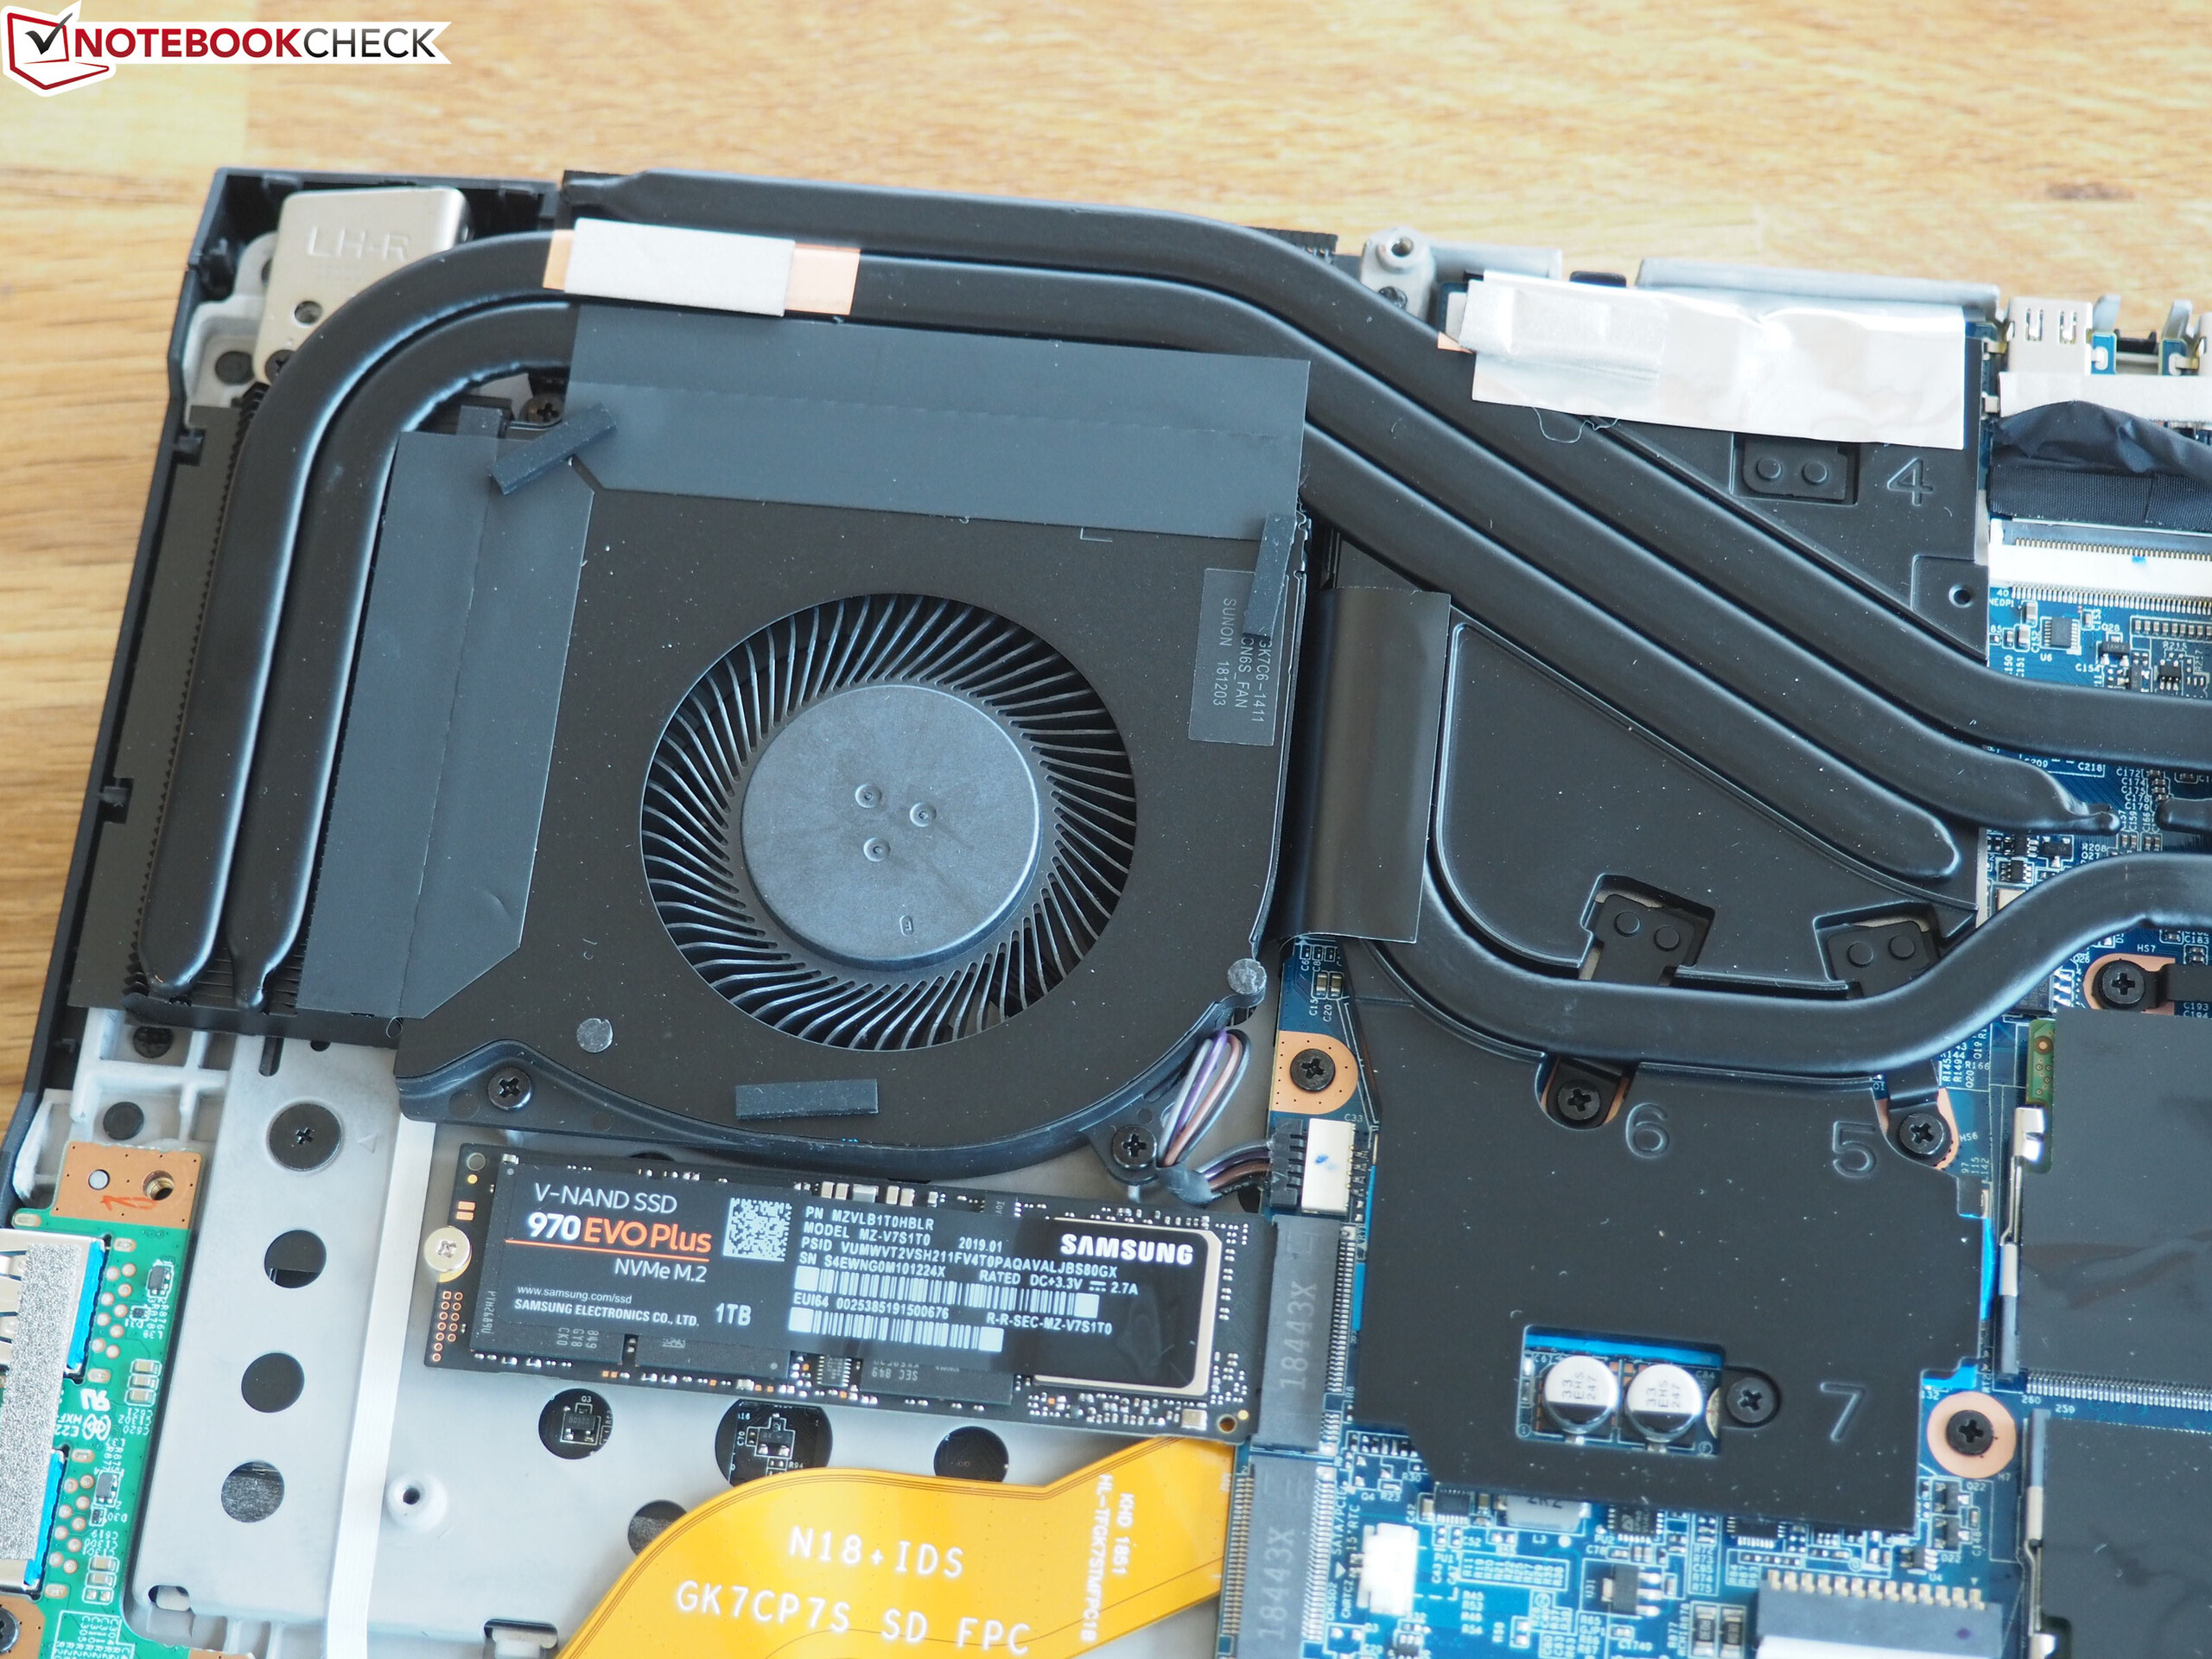
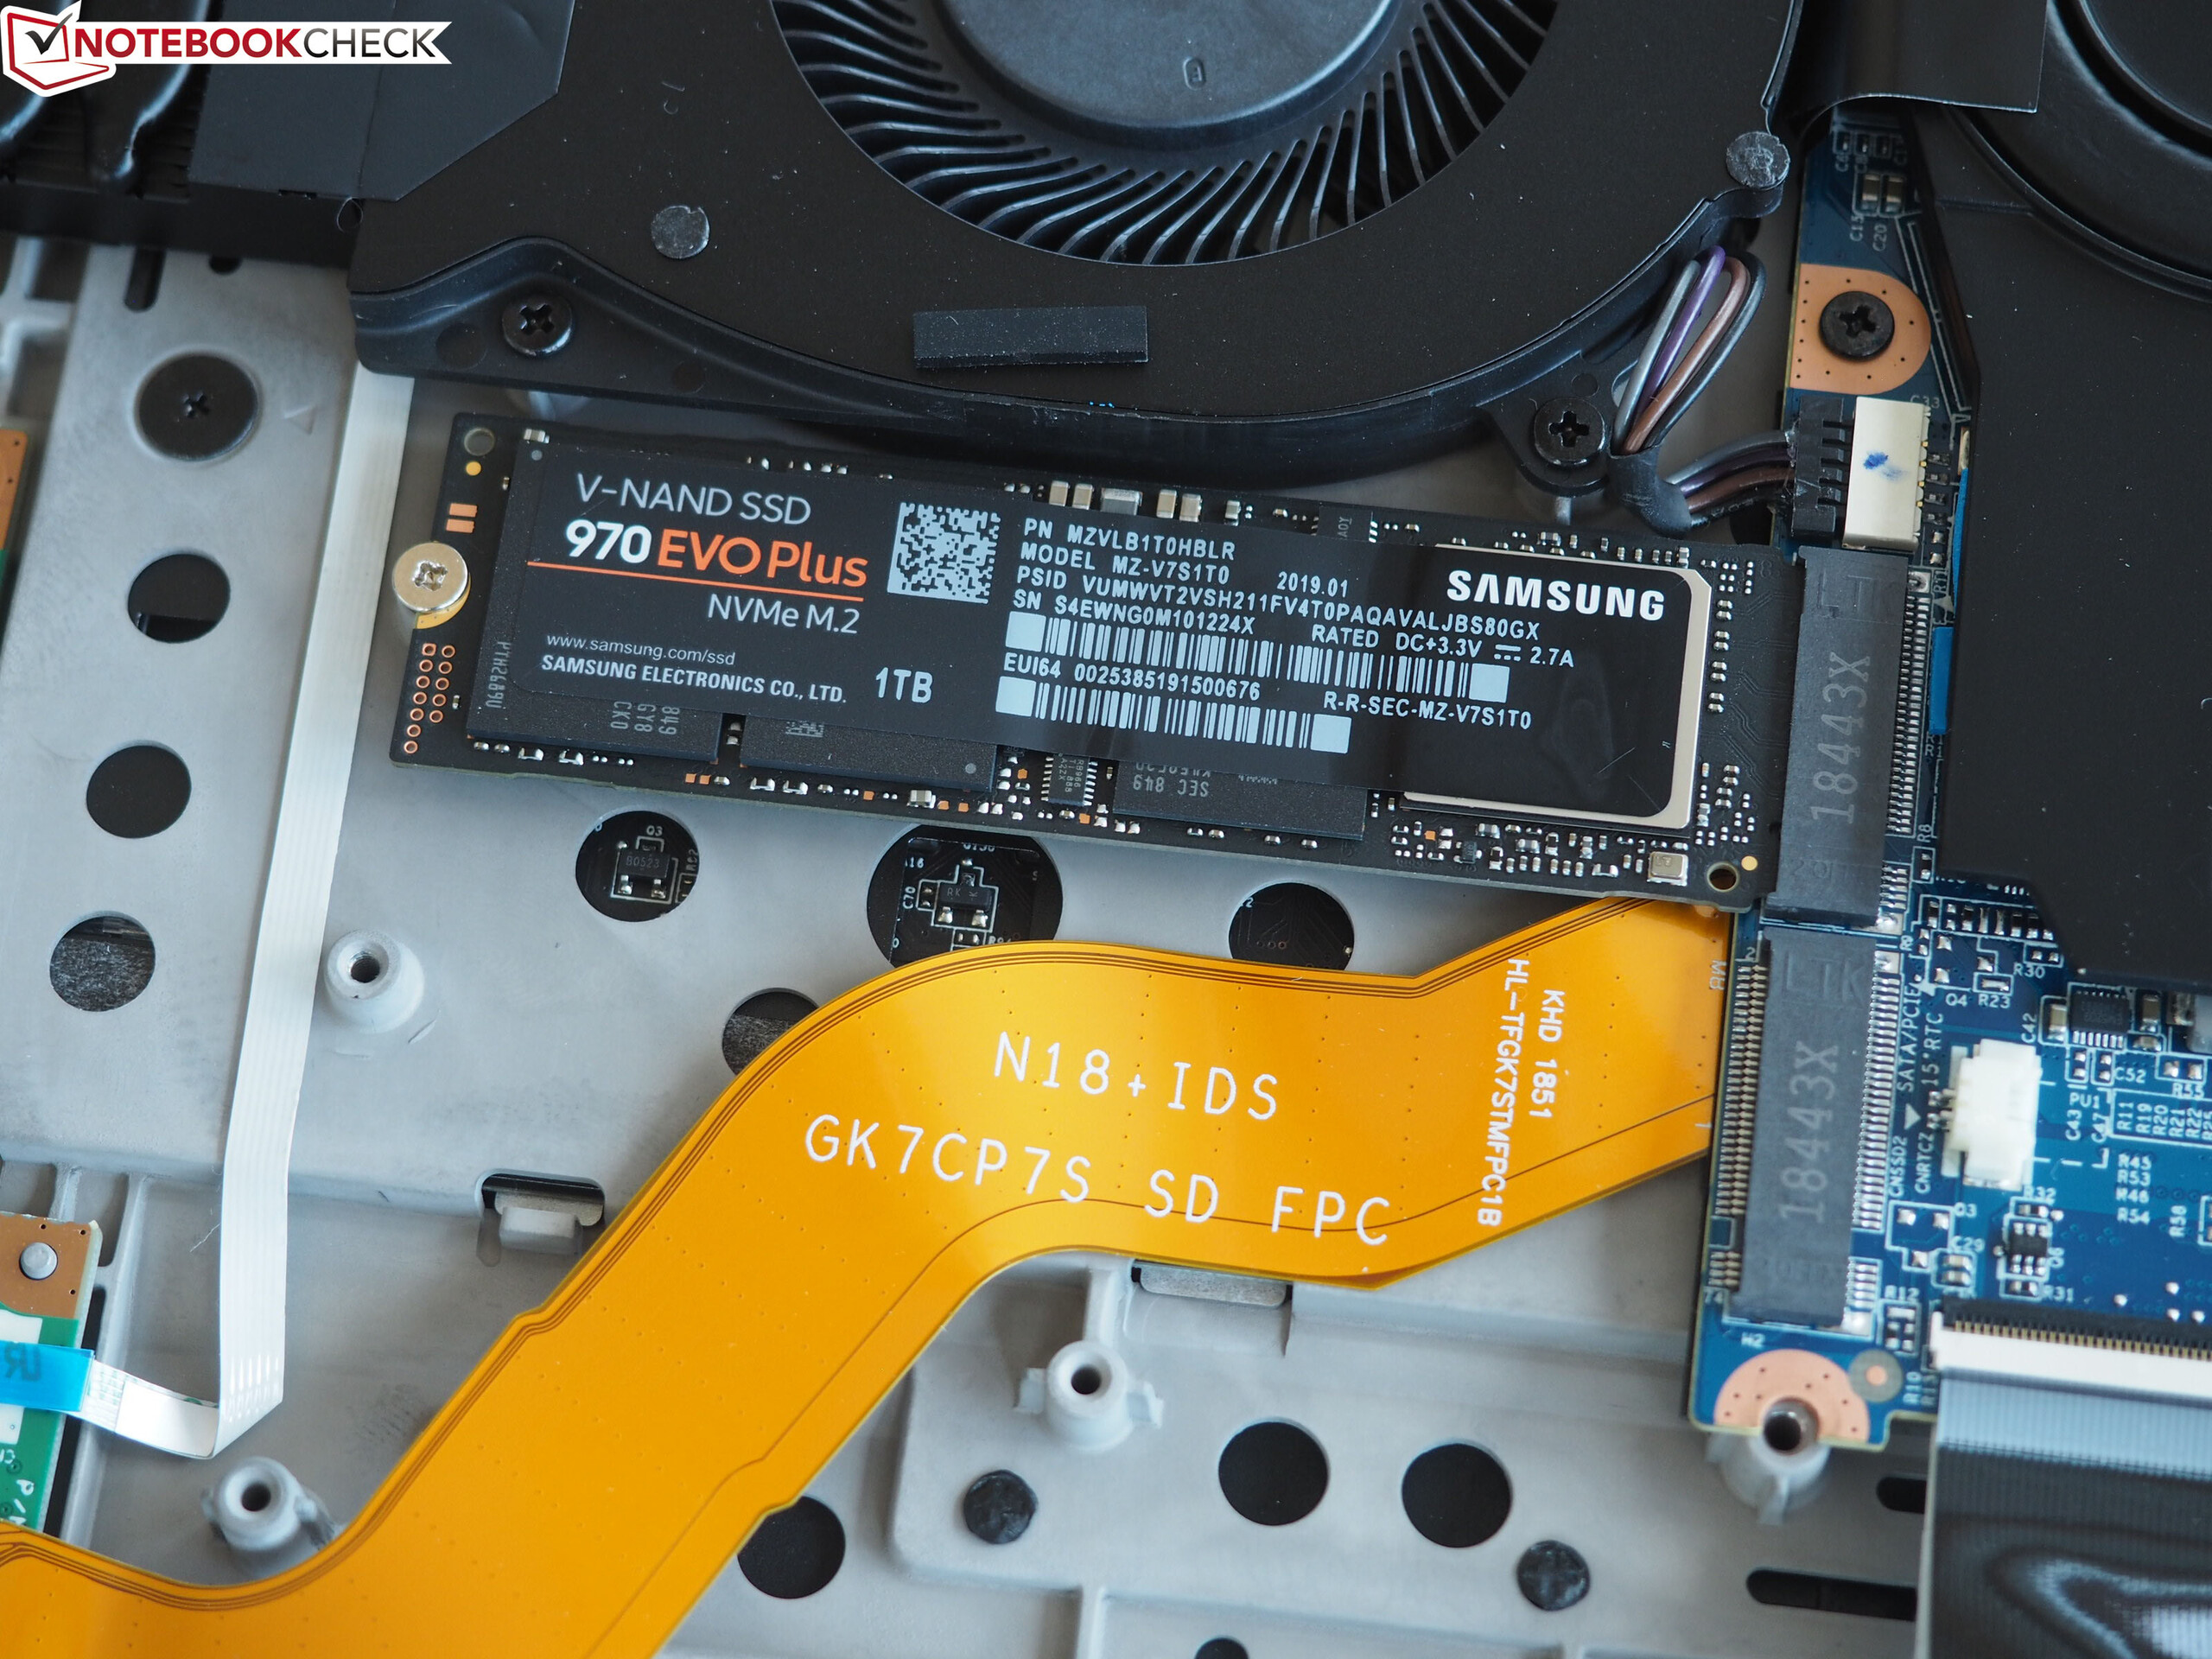
| Schenker XMG Neo 17 Samsung SSD 970 EVO Plus 1TB | Asus ROG Strix Scar II GL704GW Intel SSD 660p SSDPEKNW512G8 | MSI GE75 8SF Kingston RBUSNS8154P3256GJ1 | Lenovo Legion Y740-17ICH Samsung SSD PM981 MZVLB256HAHQ | Asus Zephyrus S GX701GX Samsung SSD PM981 MZVLB1T0HALR | |
|---|---|---|---|---|---|
| AS SSD | -57% | -80% | -41% | -16% | |
| Seq Read (MB/s) | 2359 | 1315 -44% | 949 -60% | 1153 -51% | 911 -61% |
| Seq Write (MB/s) | 2469 | 927 -62% | 823 -67% | 1328 -46% | 2347 -5% |
| 4K Read (MB/s) | 53.5 | 52.4 -2% | 25.36 -53% | 35.05 -34% | 53 -1% |
| 4K Write (MB/s) | 117.6 | 122.8 4% | 67.1 -43% | 96 -18% | 122.5 4% |
| 4K-64 Read (MB/s) | 1579 | 326.5 -79% | 748 -53% | 727 -54% | 1577 0% |
| 4K-64 Write (MB/s) | 2048 | 727 -65% | 650 -68% | 1212 -41% | 1734 -15% |
| Access Time Read * (ms) | 0.048 | 0.11 -129% | 0.173 -260% | 0.063 -31% | 0.08 -67% |
| Access Time Write * (ms) | 0.03 | 0.045 -50% | 0.059 -97% | 0.04 -33% | 0.031 -3% |
| Score Read (Points) | 1869 | 510 -73% | 869 -54% | 878 -53% | 1721 -8% |
| Score Write (Points) | 2413 | 942 -61% | 799 -67% | 1441 -40% | 2091 -13% |
| Score Total (Points) | 5248 | 1715 -67% | 2109 -60% | 2784 -47% | 4771 -9% |
* ... mindre är bättre

| 3DMark 11 Performance | 18150 poäng | |
| 3DMark Cloud Gate Standard Score | 29348 poäng | |
| 3DMark Fire Strike Score | 15686 poäng | |
Hjälp | ||
| The Witcher 3 | |
| 1920x1080 High Graphics & Postprocessing (Nvidia HairWorks Off) | |
| Genomsnitt av klass Gaming (341 - 404, n=2, senaste 2 åren) | |
| Asus Zephyrus S GX701GX | |
| Lenovo Legion Y740-17ICH | |
| Schenker XMG Neo 17 | |
| Asus ROG Strix Scar II GL704GW | |
| MSI GE75 8SF | |
| 1920x1080 Ultra Graphics & Postprocessing (HBAO+) | |
| Genomsnitt av klass Gaming (104.7 - 240, n=7, senaste 2 åren) | |
| Asus Zephyrus S GX701GX | |
| Lenovo Legion Y740-17ICH | |
| Schenker XMG Neo 17 | |
| Asus ROG Strix Scar II GL704GW | |
| MSI GE75 8SF | |
| låg | med. | hög | ultra | QHD | 4K | |
|---|---|---|---|---|---|---|
| The Witcher 3 (2015) | 137 | 73 | 49.5 | |||
| Apex Legends (2019) | 143 | 134 | 132 | 88.2 | 45.4 | |
| Far Cry New Dawn (2019) | 94 | 92 | 82 | 74 | 42 | |
| Metro Exodus (2019) | 87.9 | 66.4 | 54.1 | 42 | 26.1 | |
| Anthem (2019) | 88.8 | 85.4 | 79.8 | 62 | 35.5 | |
| Dirt Rally 2.0 (2019) | 143 | 117 | 75.2 | 62.1 | ||
| The Division 2 (2019) | 113 | 95 | 78 | 60 | 33 |
Ljudnivå
| Låg belastning |
| 29 / 32 / 33 dB(A) |
| Hög belastning |
| 42 / 49 dB(A) |
 | ||
30 dB tyst 40 dB(A) hörbar 50 dB(A) högt ljud |
||
min: | ||
| Schenker XMG Neo 17 GeForce RTX 2070 Mobile, i7-8750H | Asus ROG Strix Scar II GL704GW GeForce RTX 2070 Mobile, i7-8750H | MSI GE75 8SF GeForce RTX 2070 Mobile, i7-8750H | Lenovo Legion Y740-17ICH GeForce RTX 2080 Max-Q, i7-8750H | Asus Zephyrus S GX701GX GeForce RTX 2080 Max-Q, i7-8750H | Genomsnitt av klass Gaming | |
|---|---|---|---|---|---|---|
| Noise | -6% | -5% | 6% | -2% | 6% | |
| av / miljö * (dB) | 29 | 29 -0% | 28.3 2% | 28.3 2% | 29 -0% | 24.1 ? 17% |
| Idle Minimum * (dB) | 29 | 29 -0% | 33.5 -16% | 31.5 -9% | 29 -0% | 26 ? 10% |
| Idle Average * (dB) | 32 | 32 -0% | 33.6 -5% | 31.6 1% | 32 -0% | 27.5 ? 14% |
| Idle Maximum * (dB) | 33 | 40 -21% | 35 -6% | 31.6 4% | 33 -0% | 30.1 ? 9% |
| Load Average * (dB) | 42 | 46 -10% | 38 10% | 32.3 23% | 47 -12% | 43.8 ? -4% |
| Witcher 3 ultra * (dB) | 49 | 51 -4% | 50 -2% | 43 12% | 49 -0% | |
| Load Maximum * (dB) | 49 | 52 -6% | 56.9 -16% | 45.5 7% | 51 -4% | 54.3 ? -11% |
* ... mindre är bättre
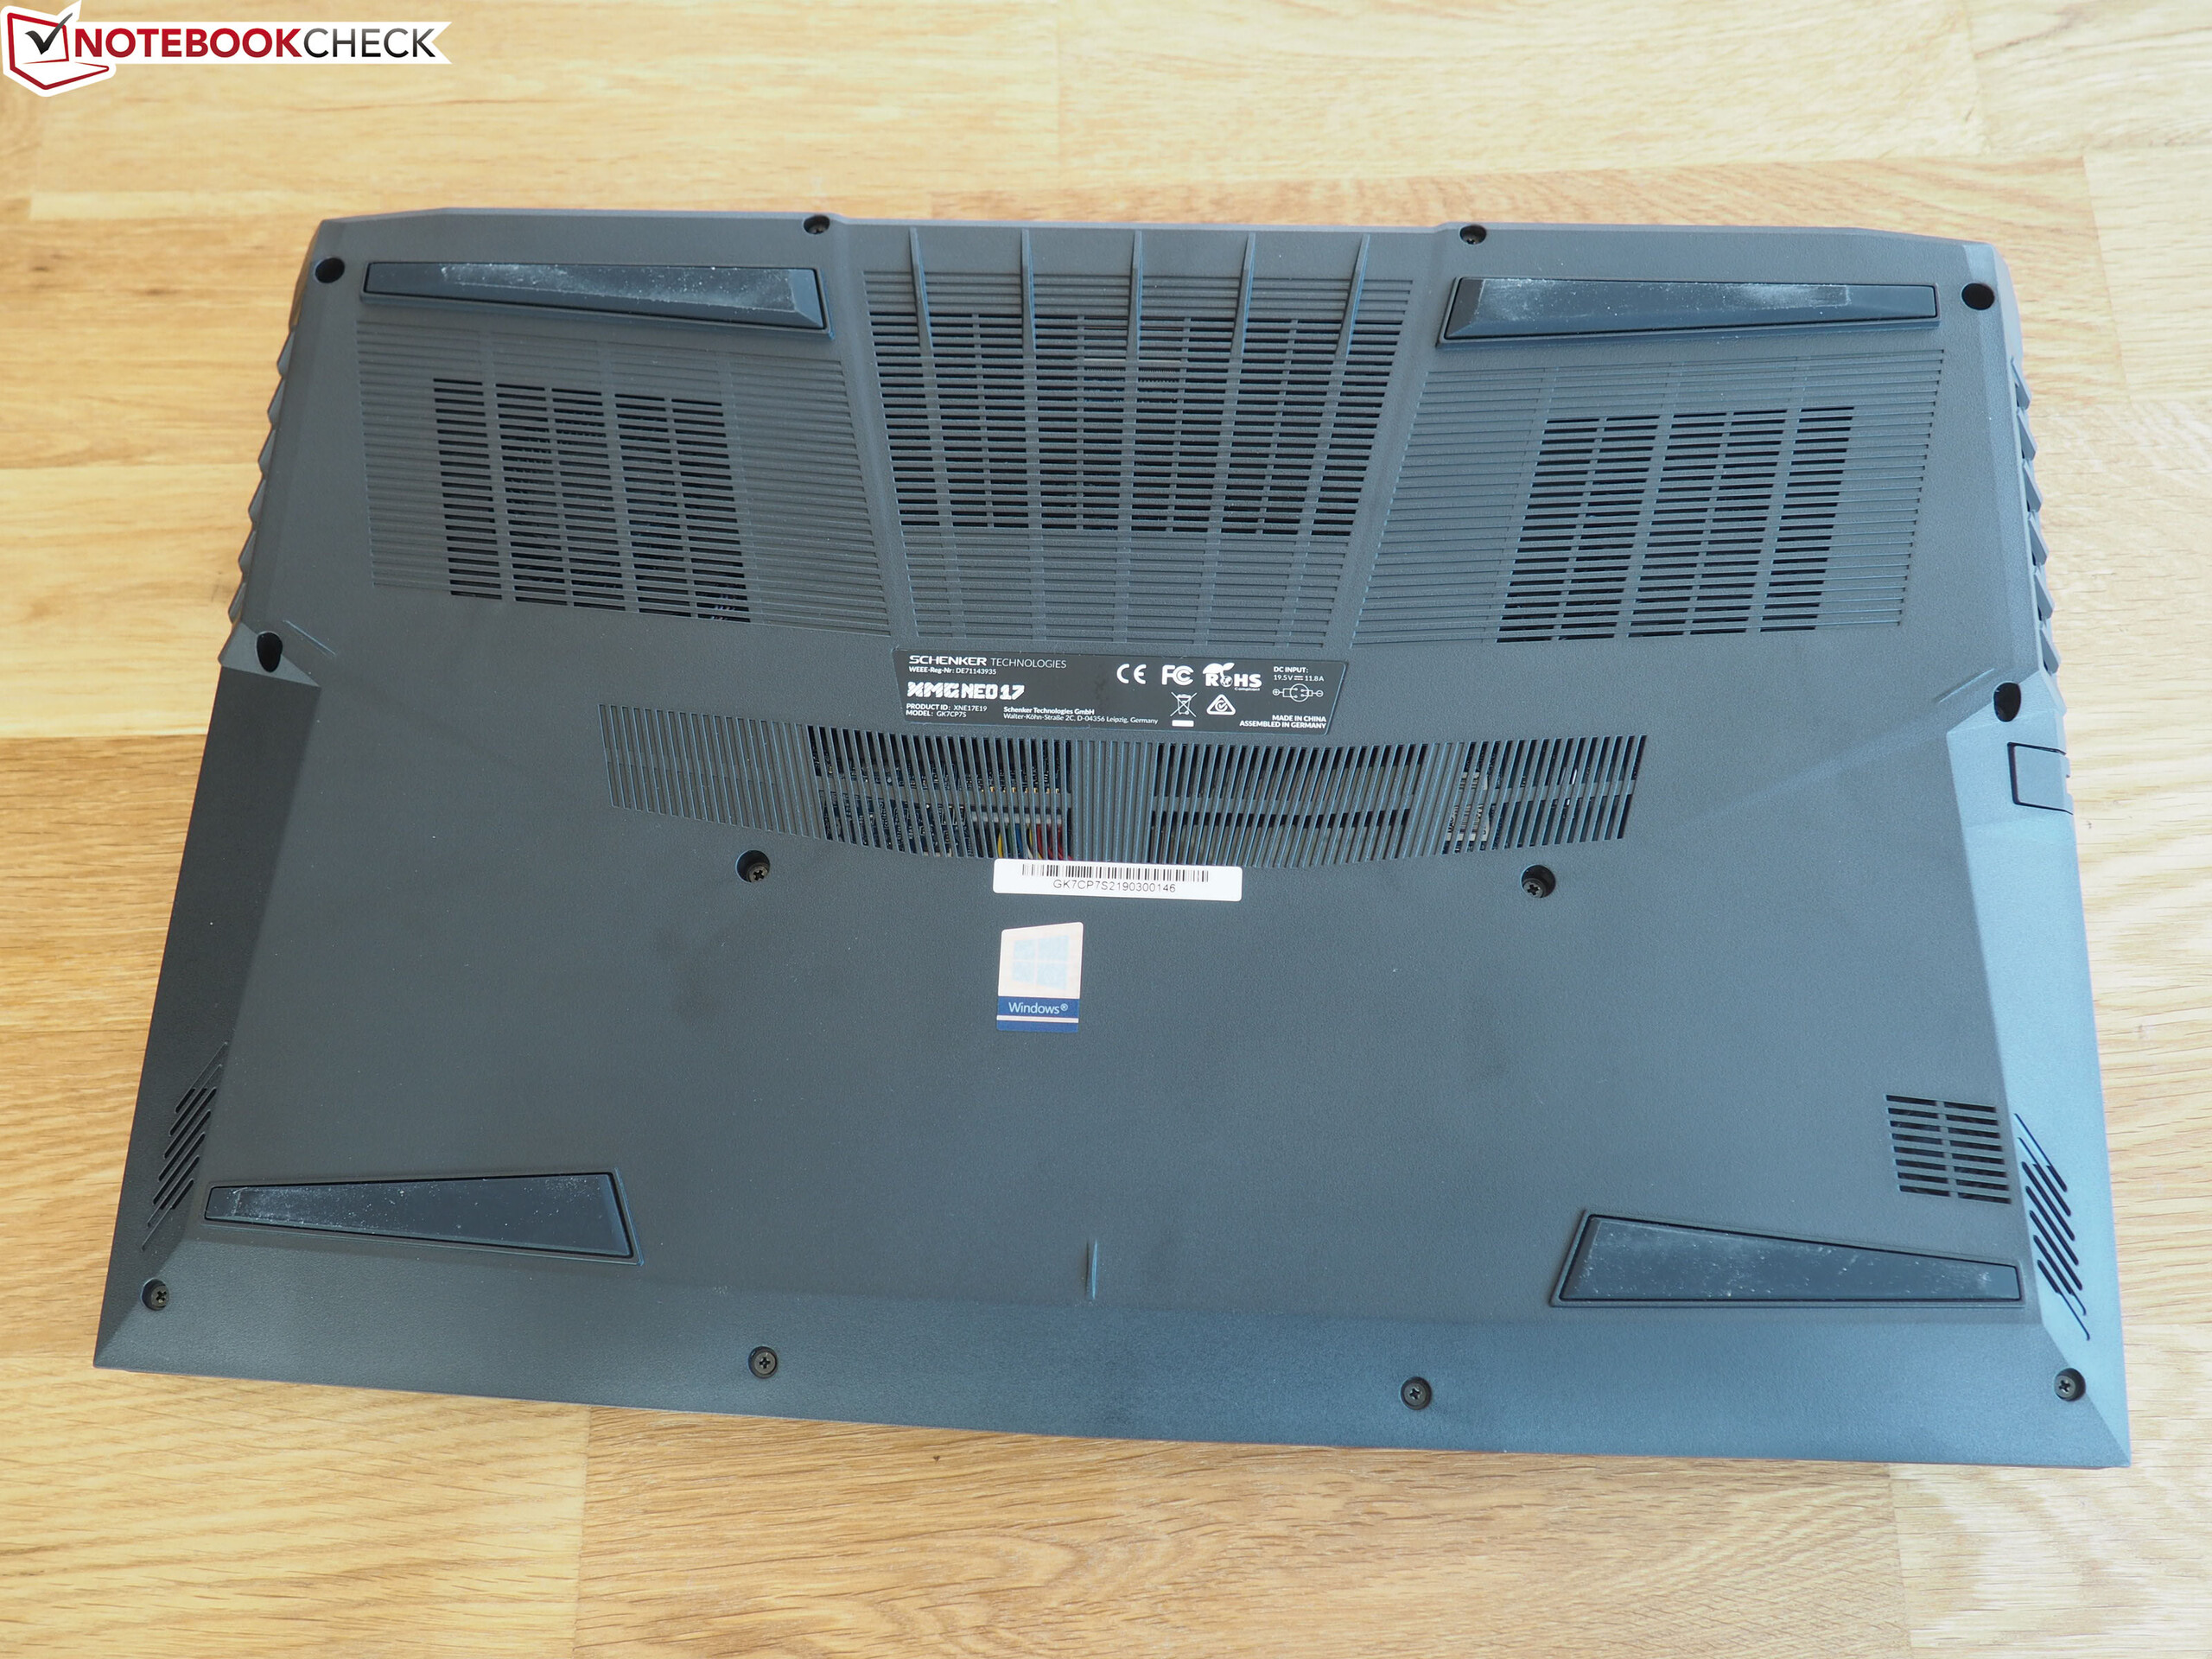
(-) Den maximala temperaturen på ovansidan är 47 °C / 117 F, jämfört med genomsnittet av 40.4 °C / 105 F , allt från 21.2 till 68.8 °C för klassen Gaming.
(-) Botten värms upp till maximalt 56 °C / 133 F, jämfört med genomsnittet av 43.2 °C / 110 F
(+) Vid tomgångsbruk är medeltemperaturen för ovansidan 26.6 °C / 80 F, jämfört med enhetsgenomsnittet på 33.9 °C / ### class_avg_f### F.
(-) När du spelar The Witcher 3 är medeltemperaturen för ovansidan 39.2 °C / 103 F, jämfört med enhetsgenomsnittet på 33.9 °C / ## #class_avg_f### F.
(+) Handledsstöden och pekplattan når maximal hudtemperatur (35 °C / 95 F) och är därför inte varma.
(-) Medeltemperaturen för handledsstödsområdet på liknande enheter var 28.8 °C / 83.8 F (-6.2 °C / -11.2 F).
| Schenker XMG Neo 17 GeForce RTX 2070 Mobile, i7-8750H | Asus ROG Strix Scar II GL704GW GeForce RTX 2070 Mobile, i7-8750H | MSI GE75 8SF GeForce RTX 2070 Mobile, i7-8750H | Lenovo Legion Y740-17ICH GeForce RTX 2080 Max-Q, i7-8750H | Asus Zephyrus S GX701GX GeForce RTX 2080 Max-Q, i7-8750H | Genomsnitt av klass Gaming | |
|---|---|---|---|---|---|---|
| Heat | -14% | 9% | 4% | 1% | -2% | |
| Maximum Upper Side * (°C) | 47 | 59 -26% | 41.2 12% | 38.6 18% | 53 -13% | 45.2 ? 4% |
| Maximum Bottom * (°C) | 56 | 54 4% | 46 18% | 43.6 22% | 50 11% | 48.2 ? 14% |
| Idle Upper Side * (°C) | 28 | 33 -18% | 26.2 6% | 30.2 -8% | 27 4% | 31 ? -11% |
| Idle Bottom * (°C) | 30 | 35 -17% | 30.2 -1% | 35 -17% | 30 -0% | 34.2 ? -14% |
* ... mindre är bättre
Schenker XMG Neo 17 ljudanalys
(-) | inte särskilt höga högtalare (70 dB)
Bas 100 - 315 Hz
(±) | reducerad bas - i genomsnitt 8.2% lägre än medianen
(±) | linjäriteten för basen är genomsnittlig (14.3% delta till föregående frekvens)
Mellan 400 - 2000 Hz
(±) | högre mellan - i genomsnitt 6.4% högre än median
(+) | mids är linjära (6.9% delta till föregående frekvens)
Högsta 2 - 16 kHz
(+) | balanserade toppar - endast 2.6% från medianen
(±) | linjäriteten för toppar är genomsnittlig (10.1% delta till föregående frekvens)
Totalt 100 - 16 000 Hz
(±) | linjäriteten för det totala ljudet är genomsnittlig (19.1% skillnad mot median)
Jämfört med samma klass
» 64% av alla testade enheter i den här klassen var bättre, 7% liknande, 28% sämre
» Den bästa hade ett delta på 6%, genomsnittet var 18%, sämst var 132%
Jämfört med alla testade enheter
» 46% av alla testade enheter var bättre, 7% liknande, 47% sämre
» Den bästa hade ett delta på 4%, genomsnittet var 23%, sämst var 134%
Asus ROG Strix Scar II GL704GW ljudanalys
(±) | högtalarljudstyrkan är genomsnittlig men bra (77 dB)
Bas 100 - 315 Hz
(±) | reducerad bas - i genomsnitt 6.1% lägre än medianen
(±) | linjäriteten för basen är genomsnittlig (10.4% delta till föregående frekvens)
Mellan 400 - 2000 Hz
(+) | balanserad mellan - endast 2.2% från medianen
(+) | mids är linjära (2.4% delta till föregående frekvens)
Högsta 2 - 16 kHz
(+) | balanserade toppar - endast 3.1% från medianen
(+) | toppar är linjära (4% delta till föregående frekvens)
Totalt 100 - 16 000 Hz
(+) | det totala ljudet är linjärt (12.3% skillnad mot median)
Jämfört med samma klass
» 13% av alla testade enheter i den här klassen var bättre, 5% liknande, 82% sämre
» Den bästa hade ett delta på 6%, genomsnittet var 18%, sämst var 132%
Jämfört med alla testade enheter
» 10% av alla testade enheter var bättre, 3% liknande, 87% sämre
» Den bästa hade ett delta på 4%, genomsnittet var 23%, sämst var 134%
| Av/Standby | |
| Låg belastning | |
| Hög belastning |
|
Förklaring:
min: | |
| Schenker XMG Neo 17 GeForce RTX 2070 Mobile, i7-8750H | Asus ROG Strix Scar II GL704GW GeForce RTX 2070 Mobile, i7-8750H | MSI GE75 8SF GeForce RTX 2070 Mobile, i7-8750H | Lenovo Legion Y740-17ICH GeForce RTX 2080 Max-Q, i7-8750H | Asus Zephyrus S GX701GX GeForce RTX 2080 Max-Q, i7-8750H | Genomsnitt av klass Gaming | |
|---|---|---|---|---|---|---|
| Power Consumption | -27% | -19% | -22% | -23% | -18% | |
| Idle Minimum * (Watt) | 13 | 19 -46% | 16.4 -26% | 20.2 -55% | 19 -46% | 13 ? -0% |
| Idle Average * (Watt) | 16 | 22 -38% | 21.9 -37% | 27.2 -70% | 22 -38% | 19 ? -19% |
| Idle Maximum * (Watt) | 21 | 29 -38% | 25.4 -21% | 28.7 -37% | 30 -43% | 24.5 ? -17% |
| Load Average * (Watt) | 96 | 102 -6% | 90.7 6% | 90.8 5% | 104 -8% | 111.1 ? -16% |
| Witcher 3 ultra * (Watt) | 172 | 190 -10% | 203.3 -18% | 152.1 12% | 167 3% | |
| Load Maximum * (Watt) | 191 | 231 -21% | 222.9 -17% | 165.4 13% | 203 -6% | 260 ? -36% |
* ... mindre är bättre
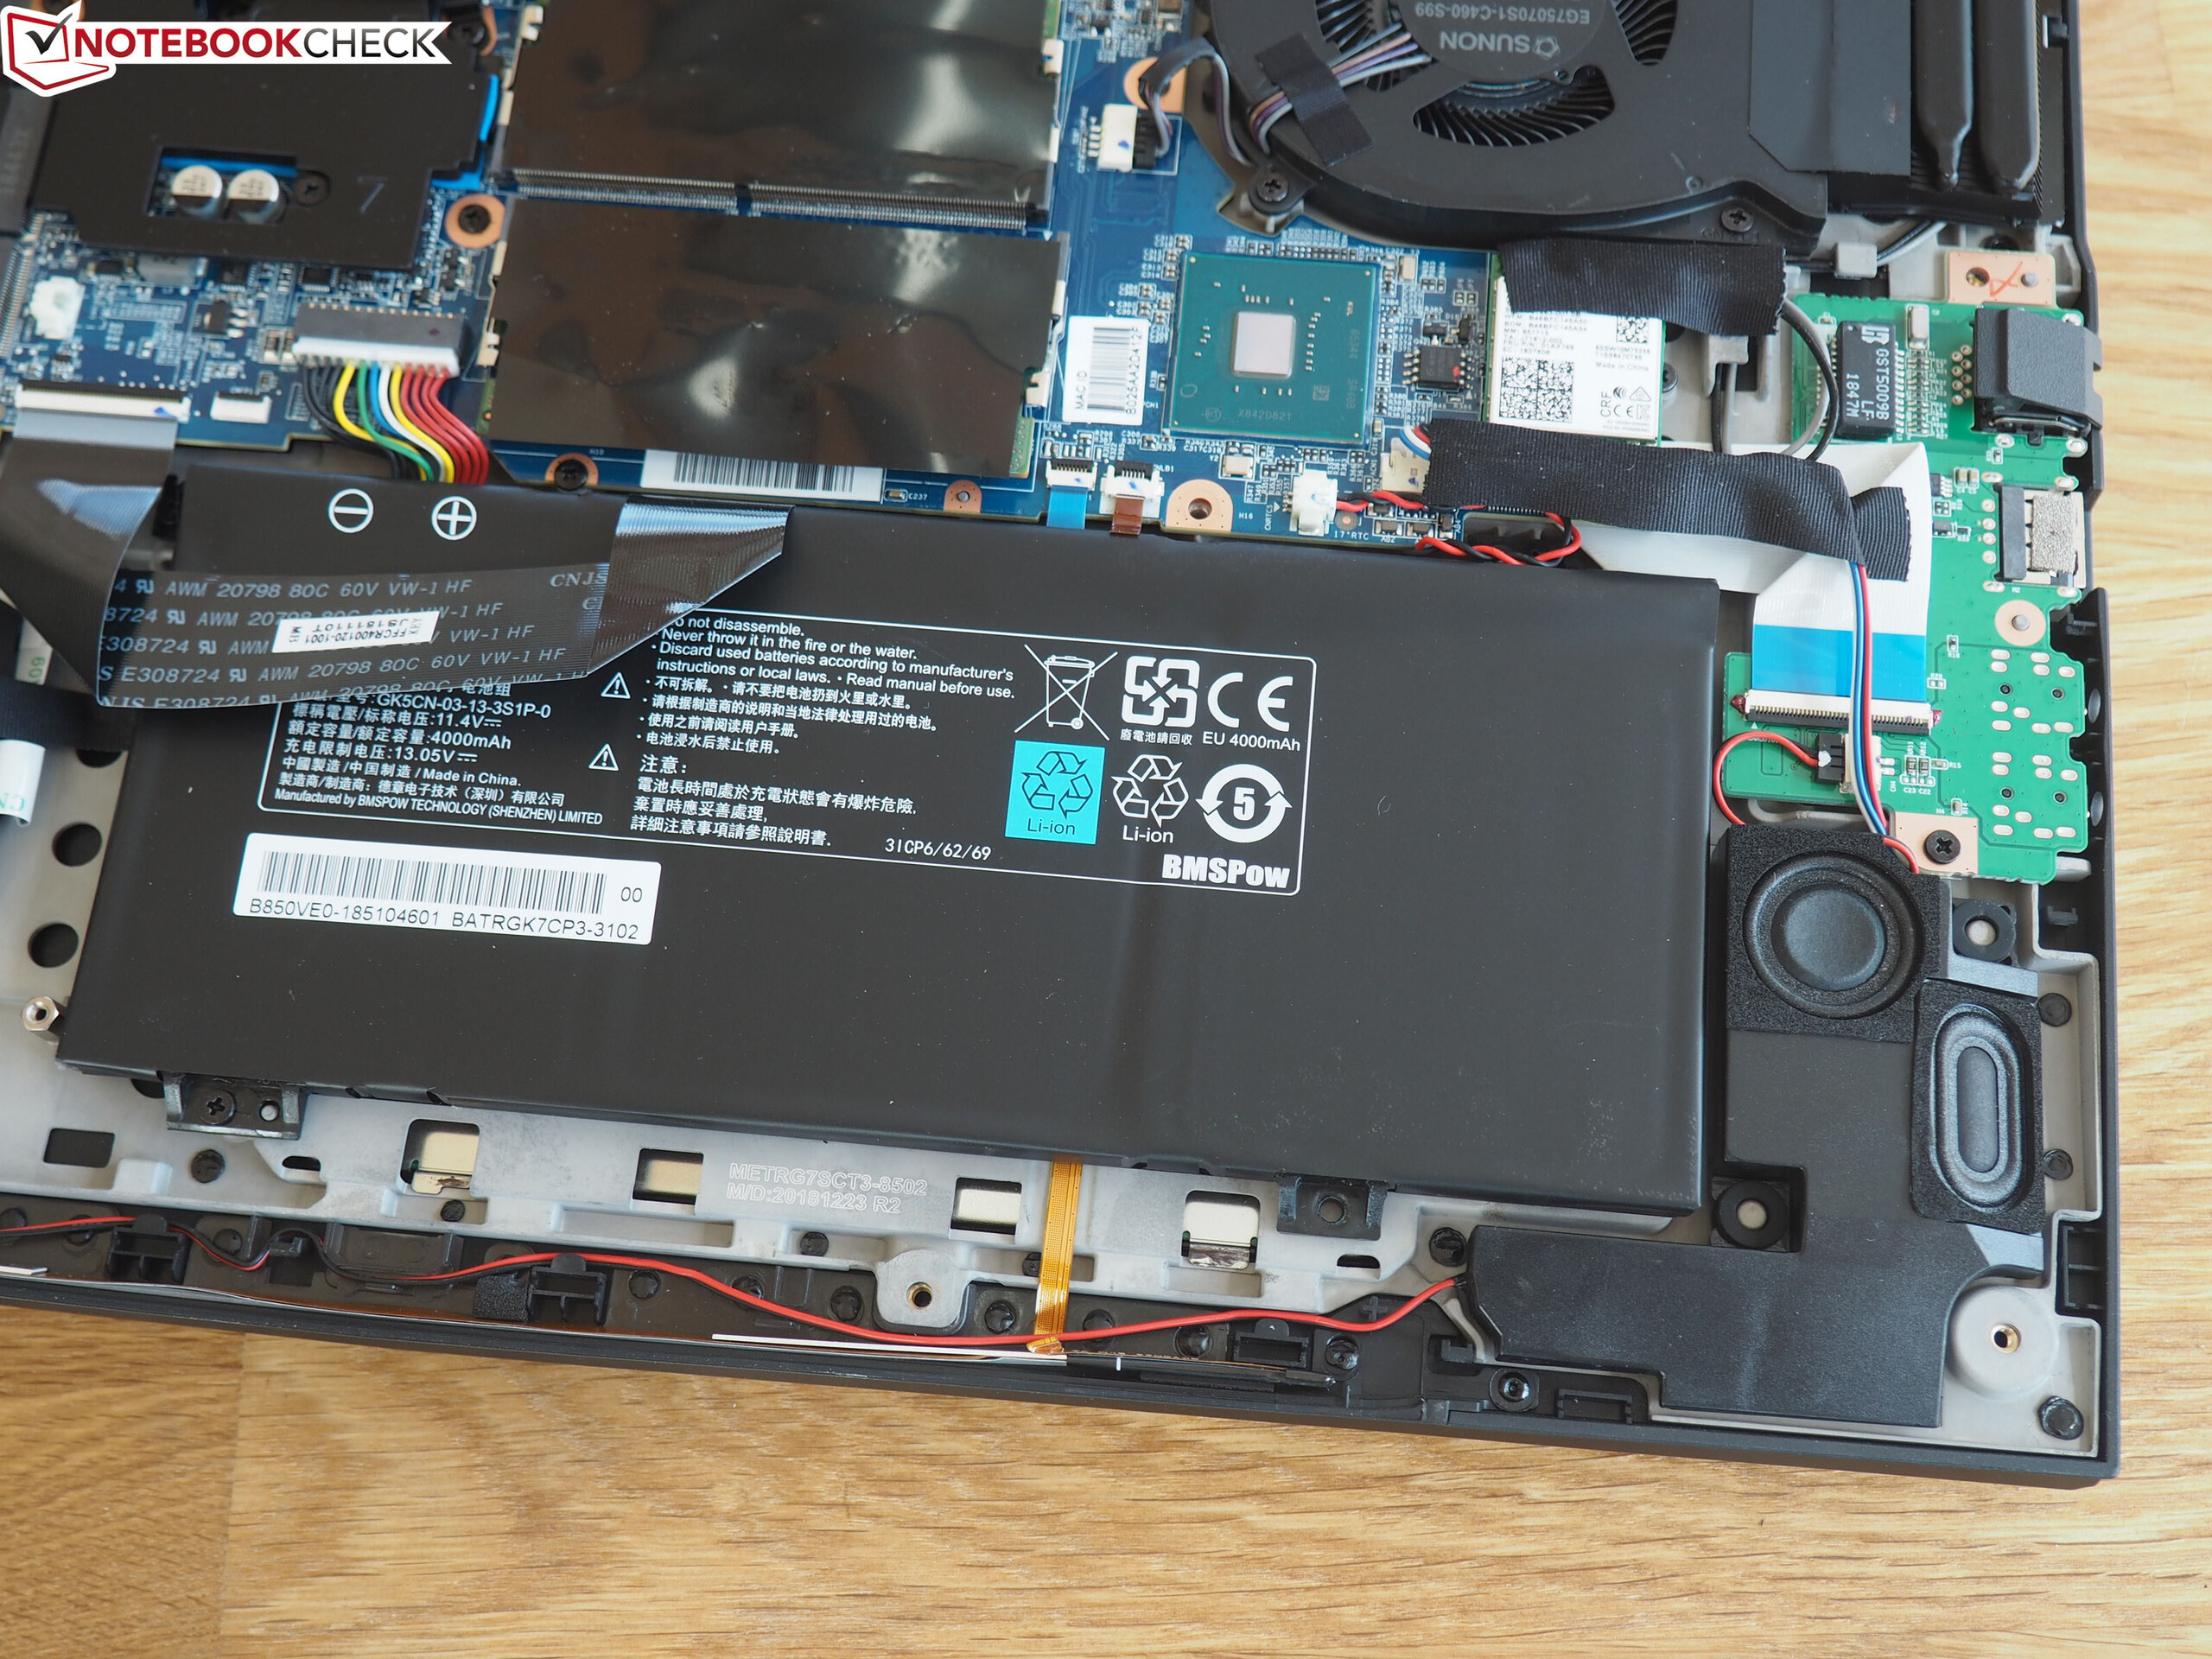
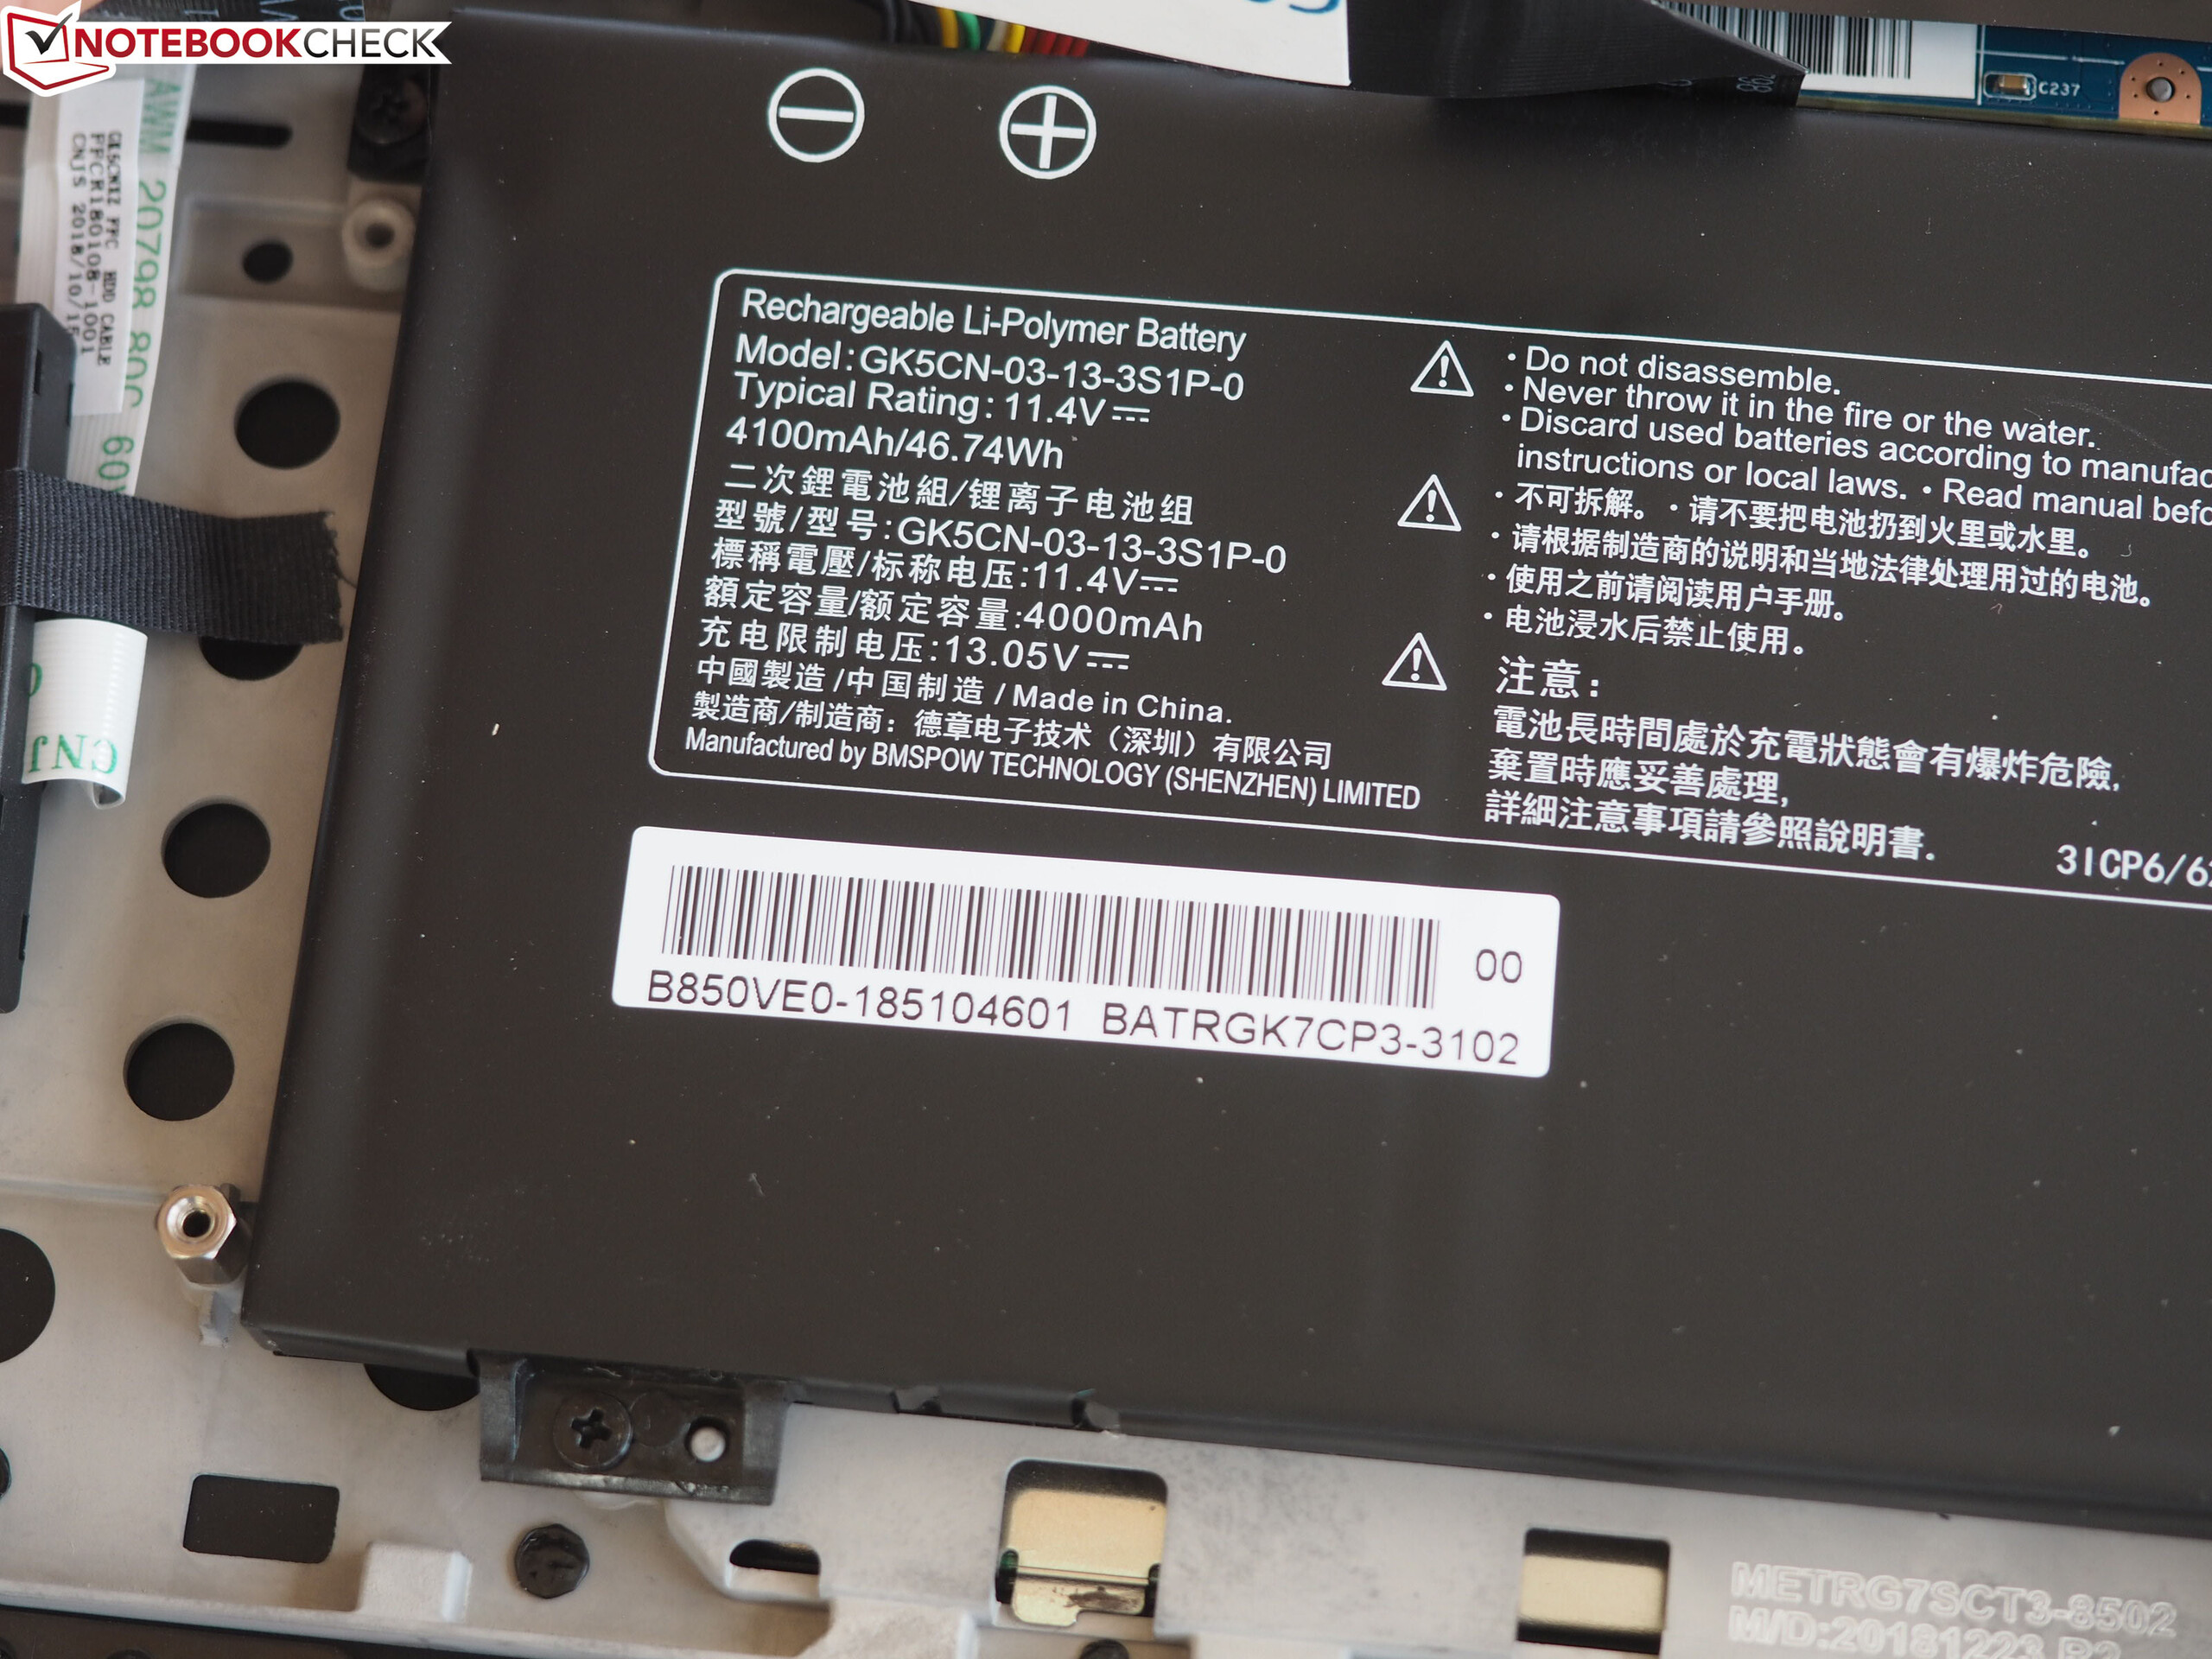
| Schenker XMG Neo 17 GeForce RTX 2070 Mobile, i7-8750H, 46.74 Wh | Asus ROG Strix Scar II GL704GW GeForce RTX 2070 Mobile, i7-8750H, 66 Wh | MSI GE75 8SF GeForce RTX 2070 Mobile, i7-8750H, 65 Wh | Lenovo Legion Y740-17ICH GeForce RTX 2080 Max-Q, i7-8750H, 76 Wh | Asus Zephyrus S GX701GX GeForce RTX 2080 Max-Q, i7-8750H, 76 Wh | Genomsnitt av klass Gaming | |
|---|---|---|---|---|---|---|
| Batteridrifttid | 15% | -5% | -14% | -1% | 72% | |
| Reader / Idle (h) | 5.3 | 6.2 17% | 5 -6% | 8.27 ? 56% | ||
| WiFi v1.3 (h) | 3.7 | 3.9 5% | 3.5 -5% | 3.2 -14% | 3.8 3% | 7.11 ? 92% |
| Load (h) | 0.9 | 1.1 22% | 0.9 0% | 1.502 ? 67% | ||
| Witcher 3 ultra (h) | 0.9 |
För
Emot
Läs den fullständiga versionen av den här recensionen på engelska här.
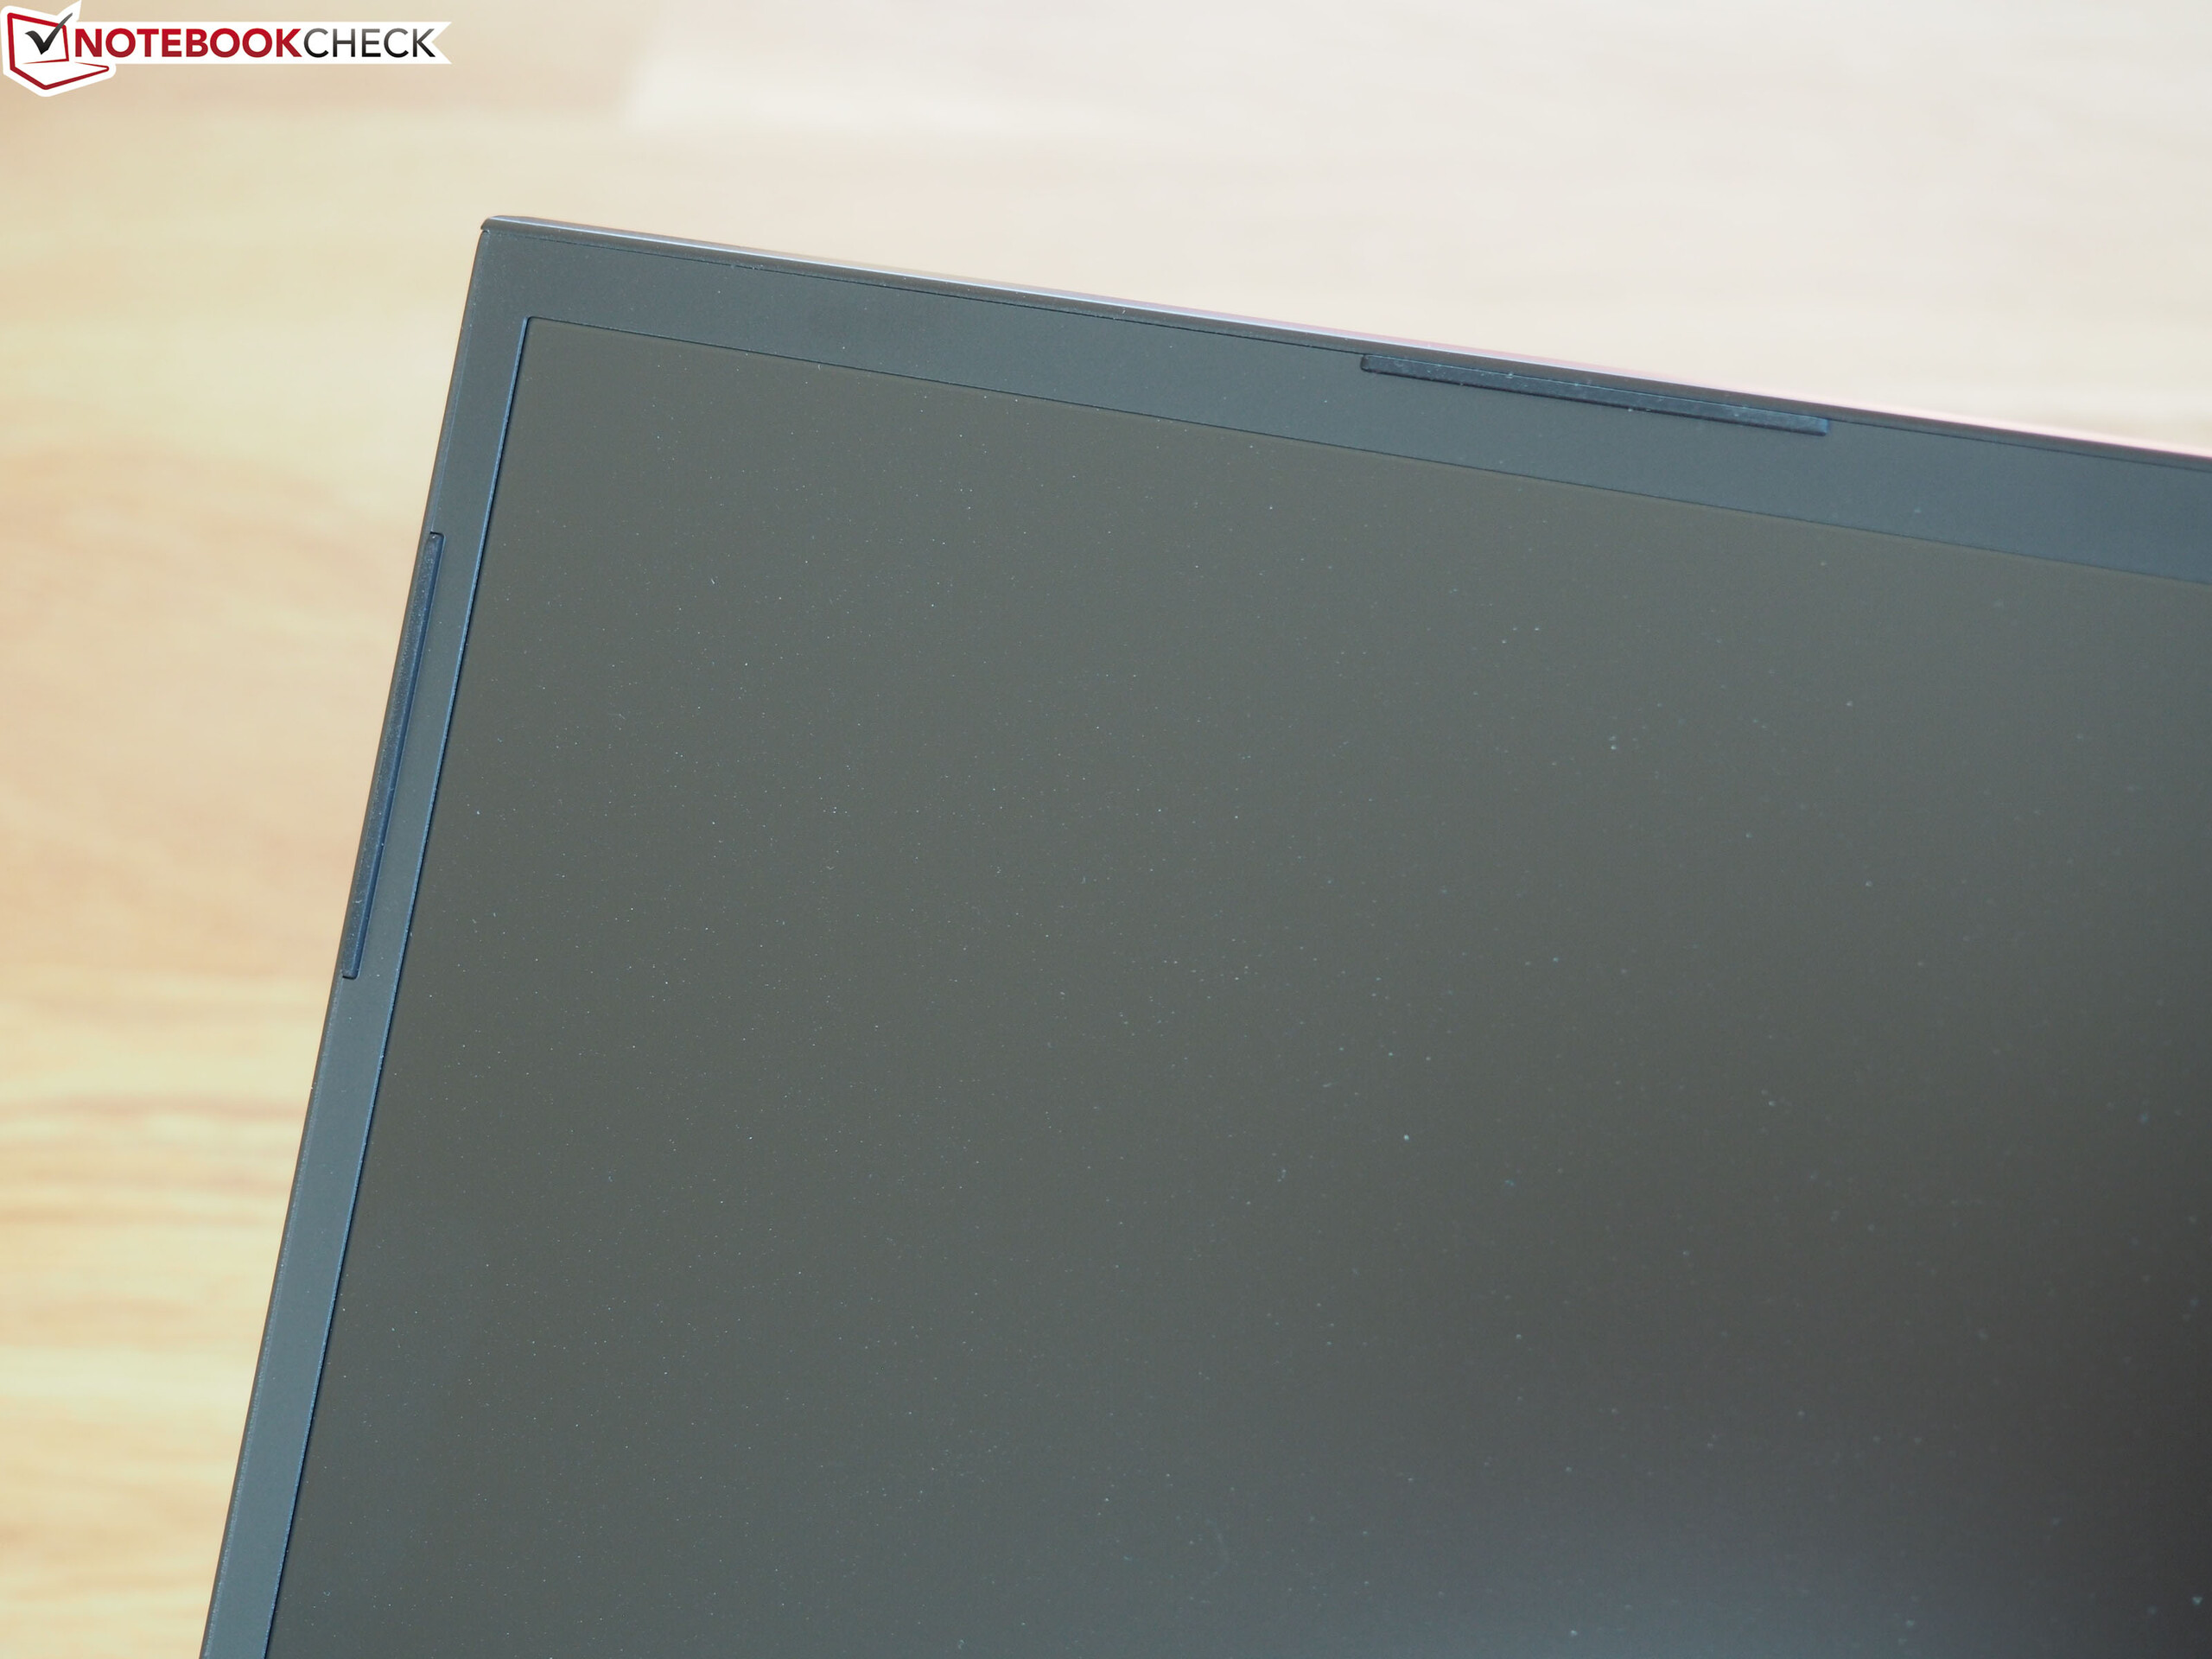
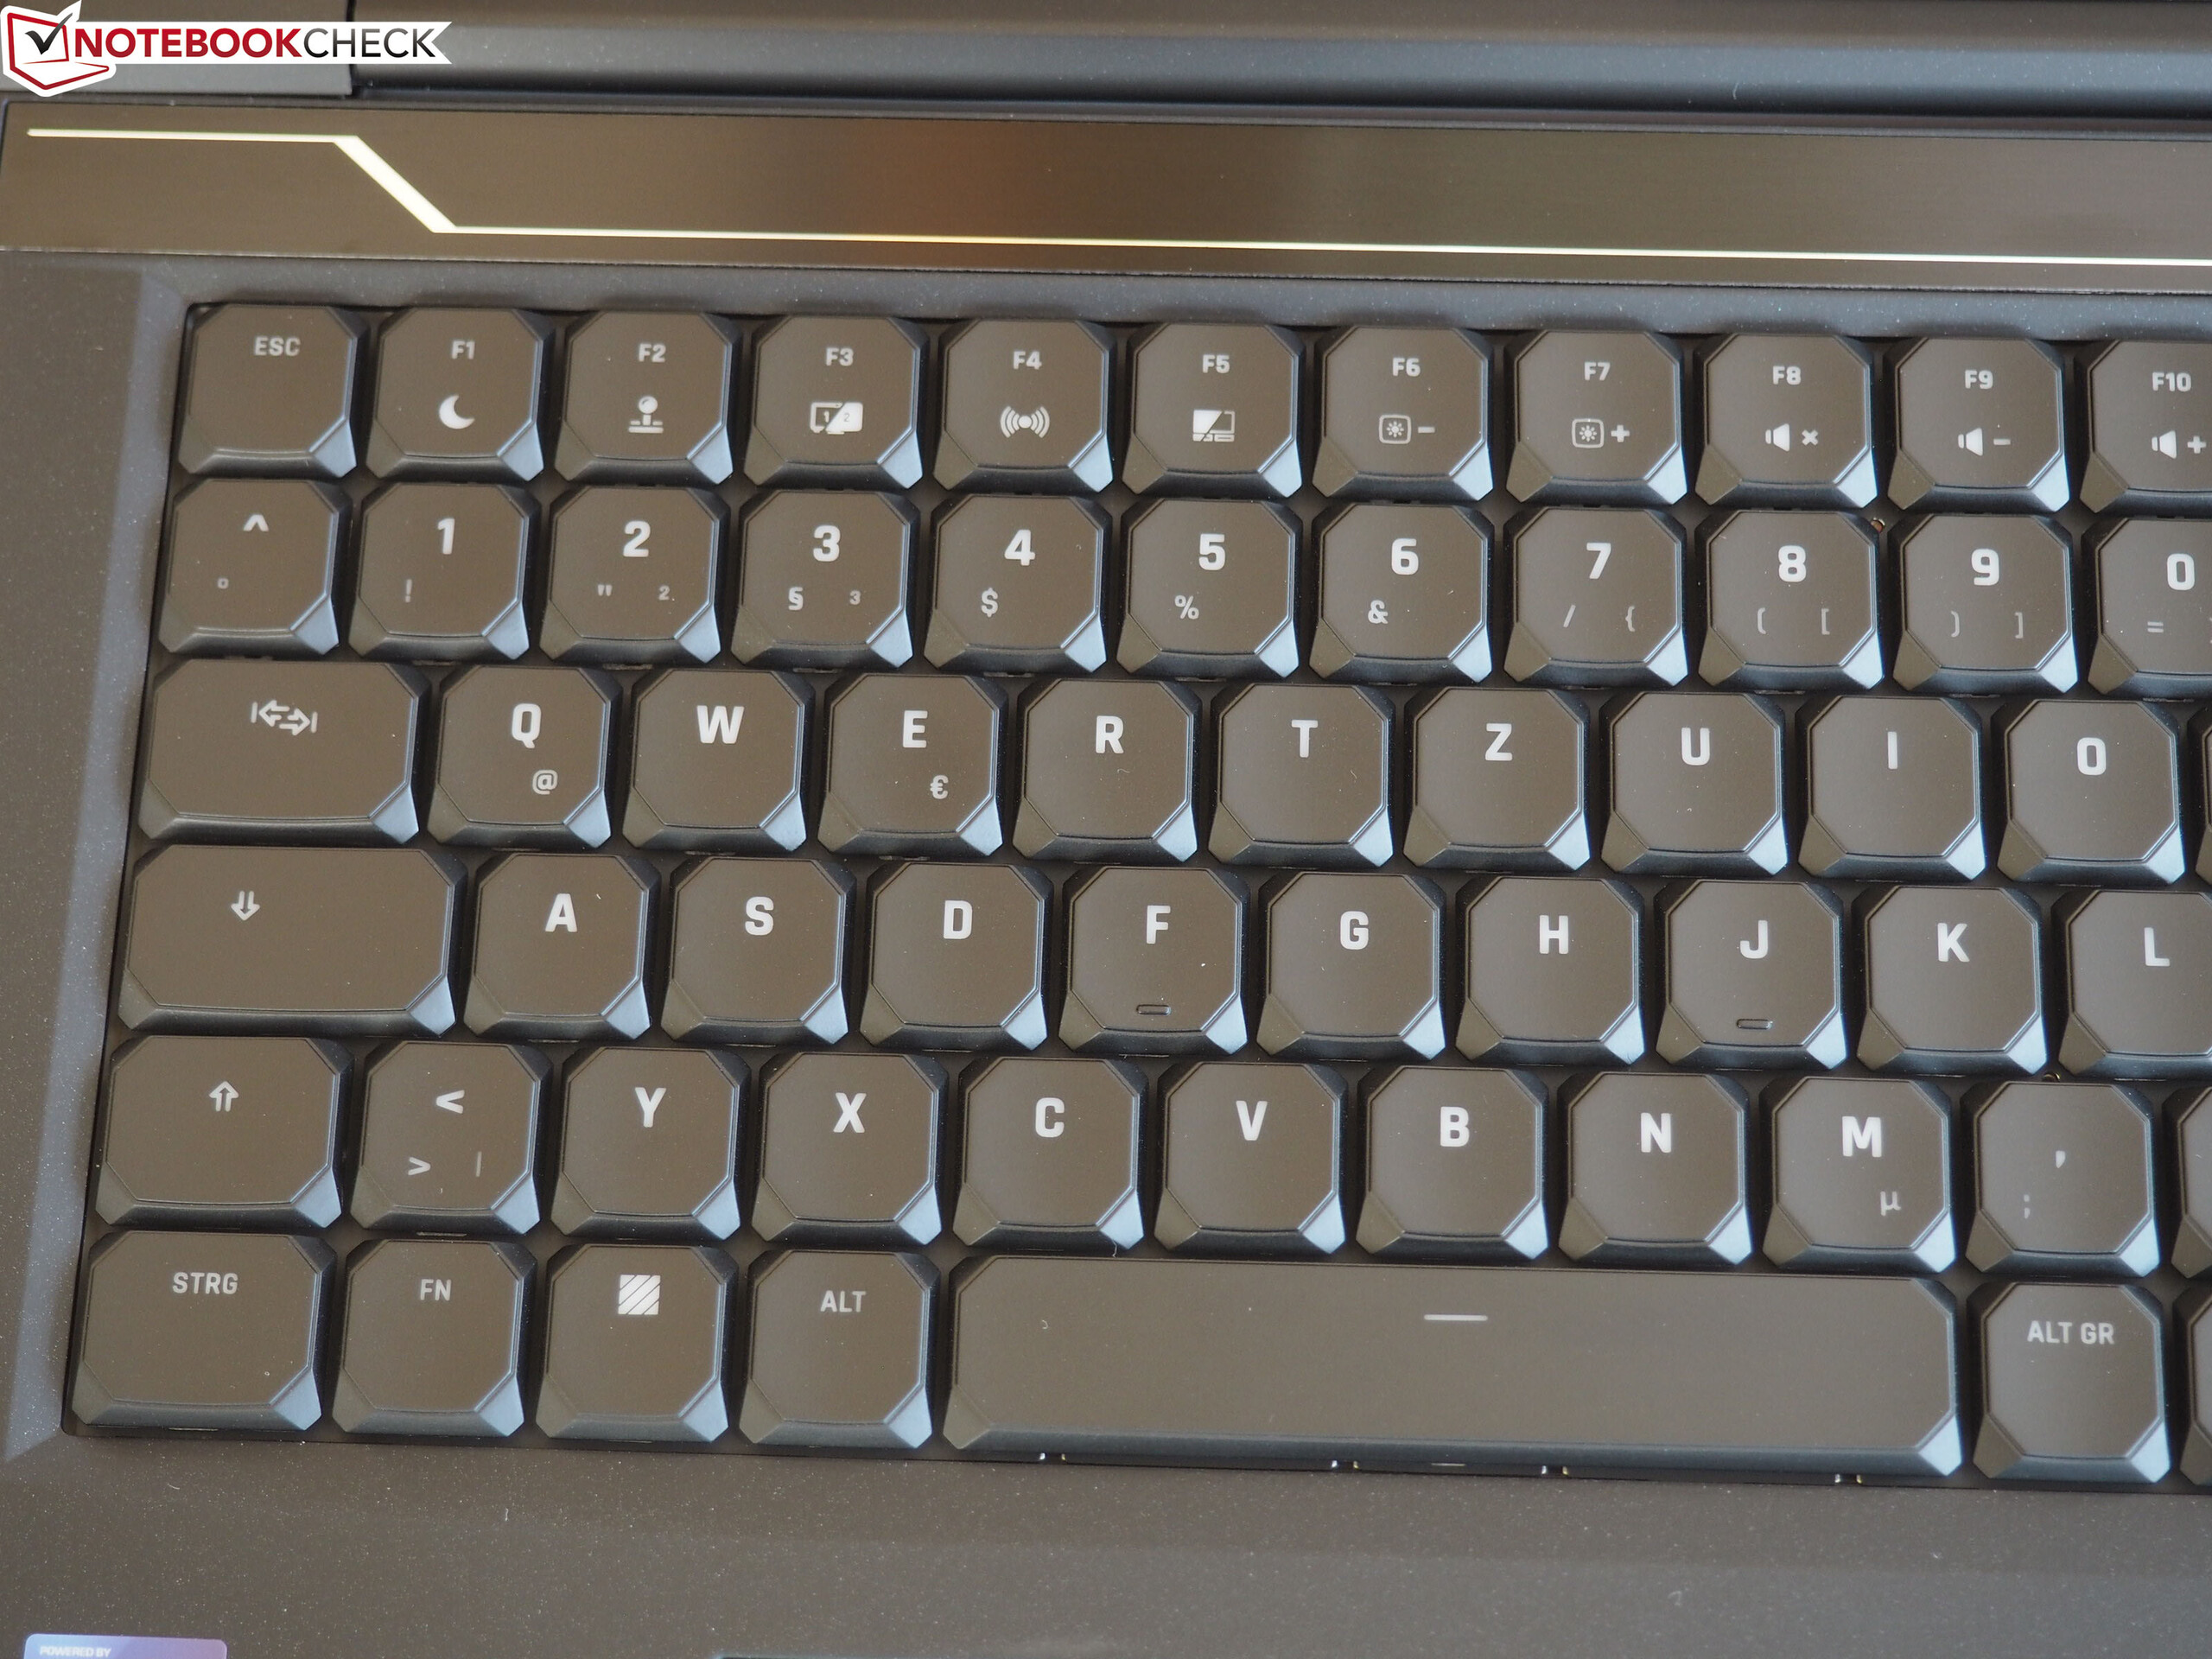
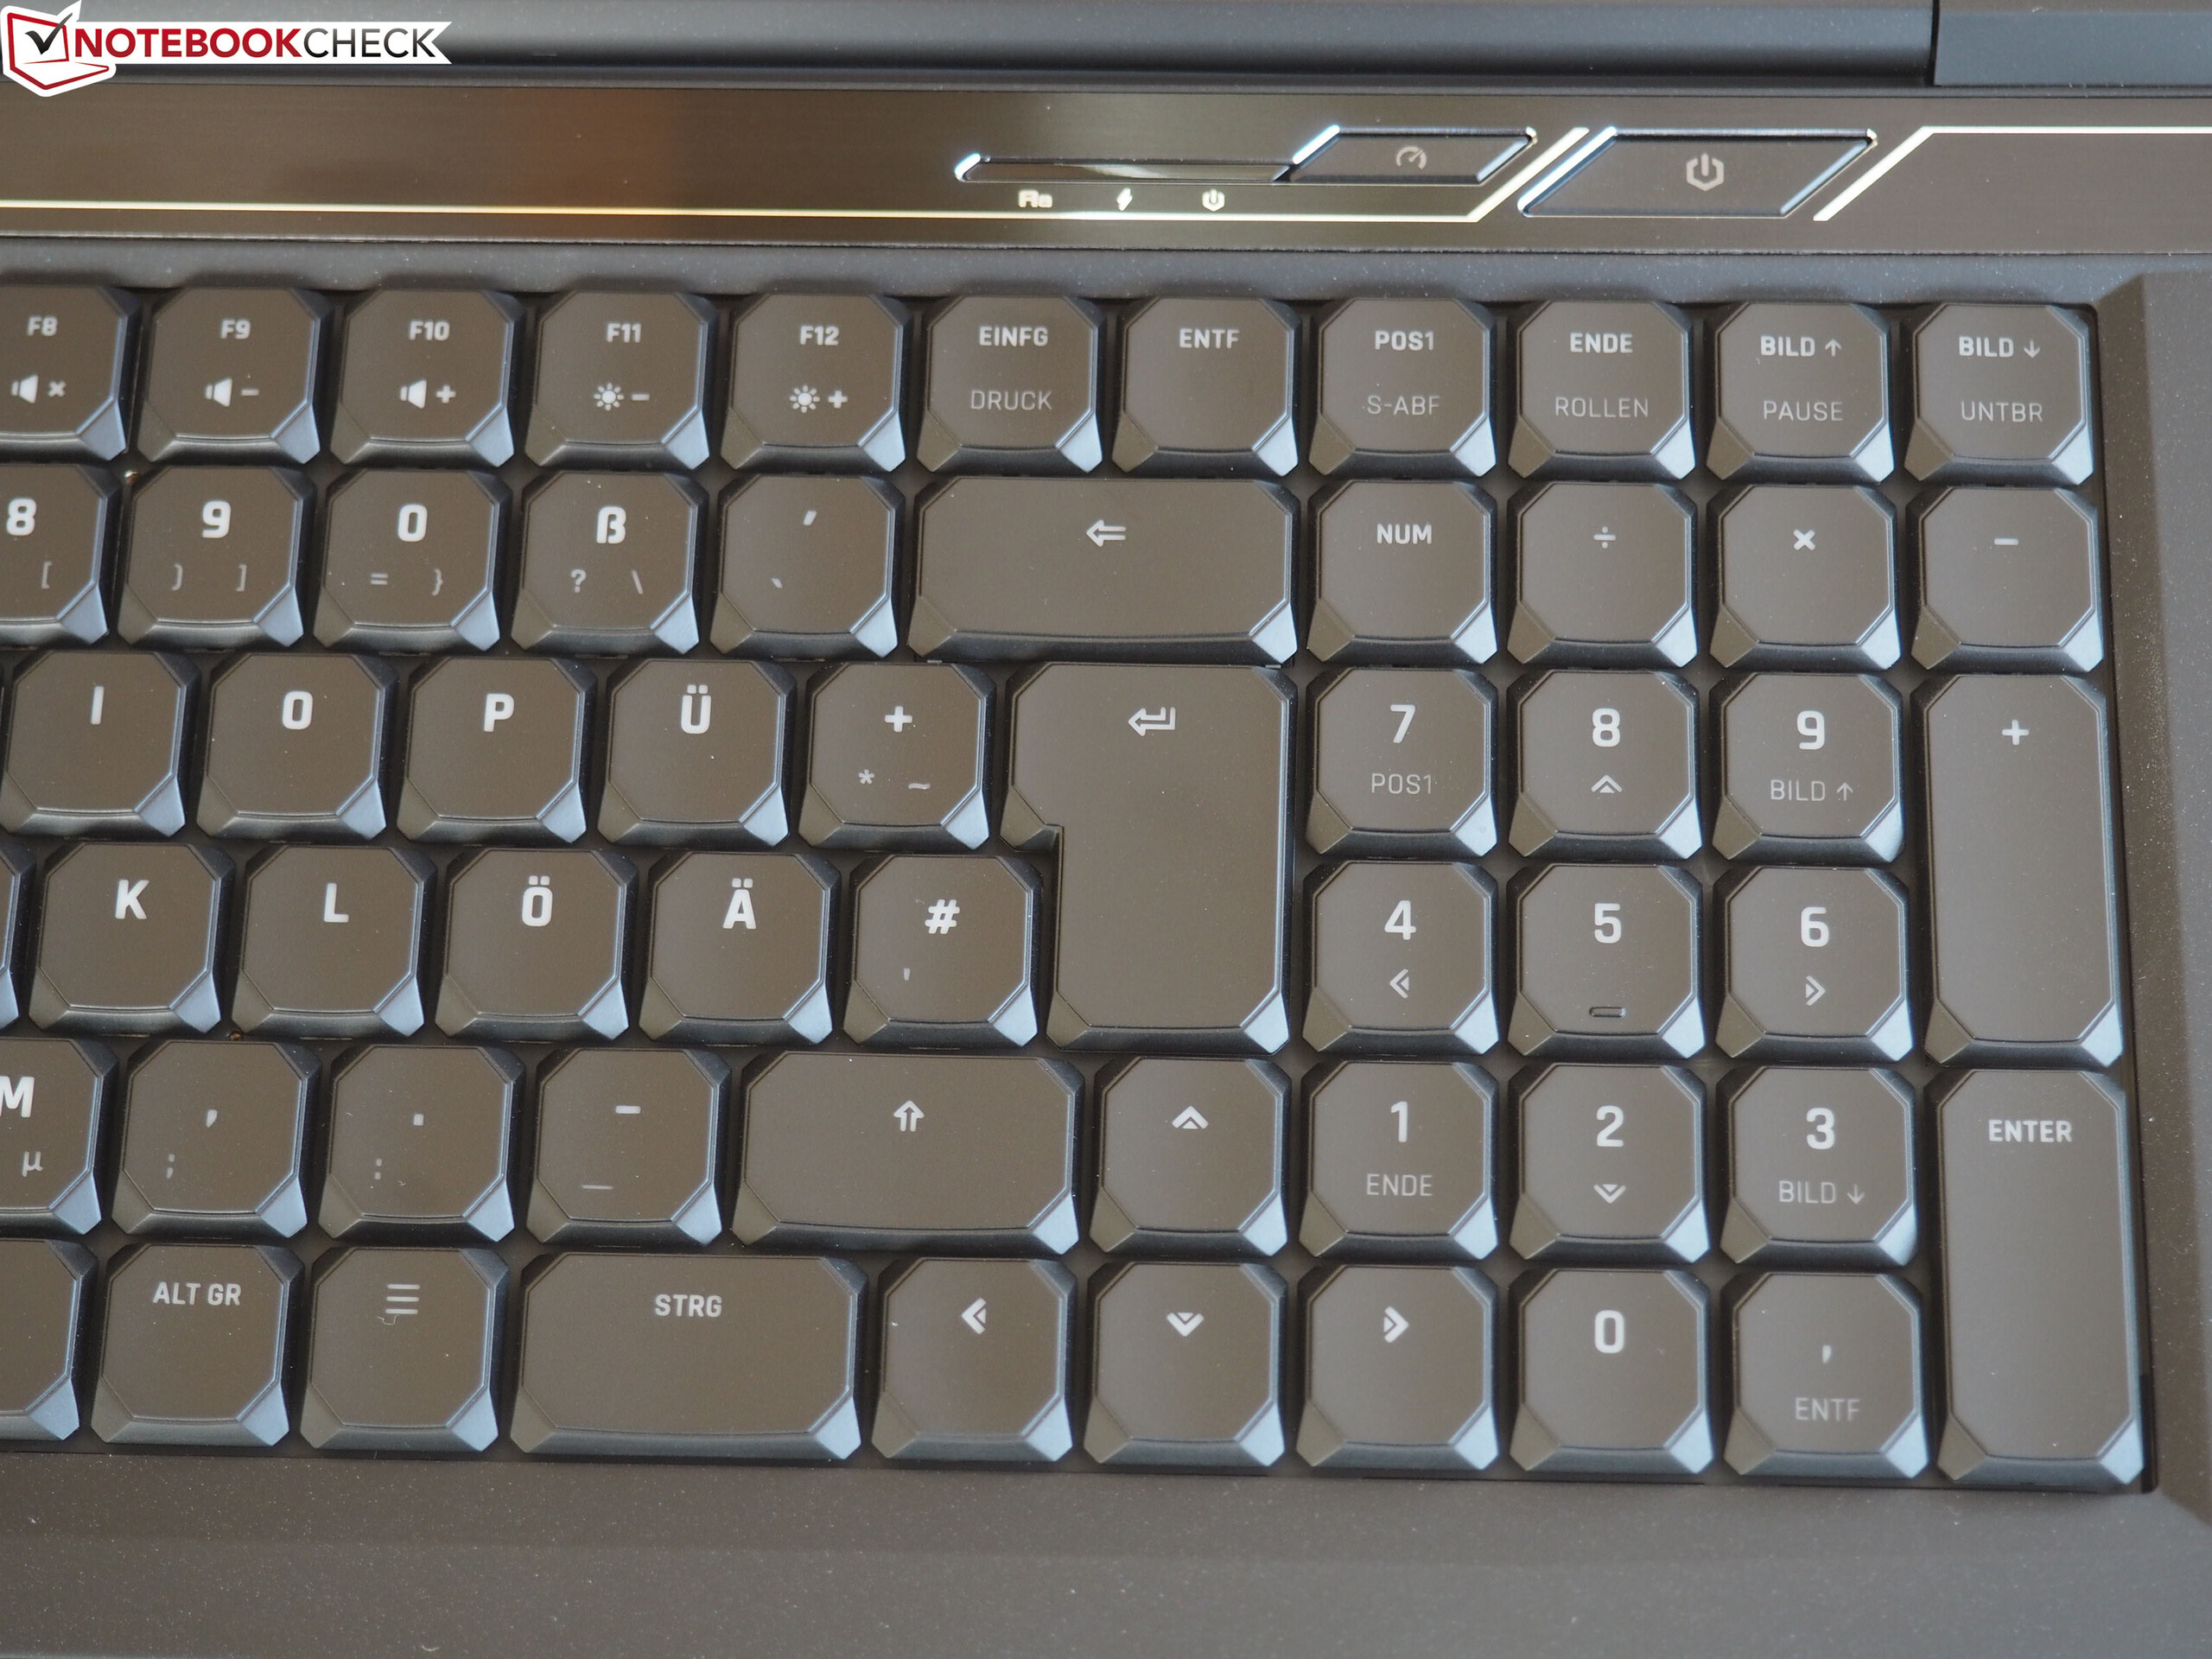
Schenker XMG Neo 17 är i stort en utmärkt spellaptop på 17 tum. Skärmen är en fröjd för ögat med ett högt kontrastförhållande och bilduppdatering i 144 Hz tillsammans med en tunn infattning. Vidare imponerande den på oss i våra speltester tack vare en RTX 2070 GPU samtidigt som det mekaniska RGB-belysta tangentbordet var ett nöje att skriva på.
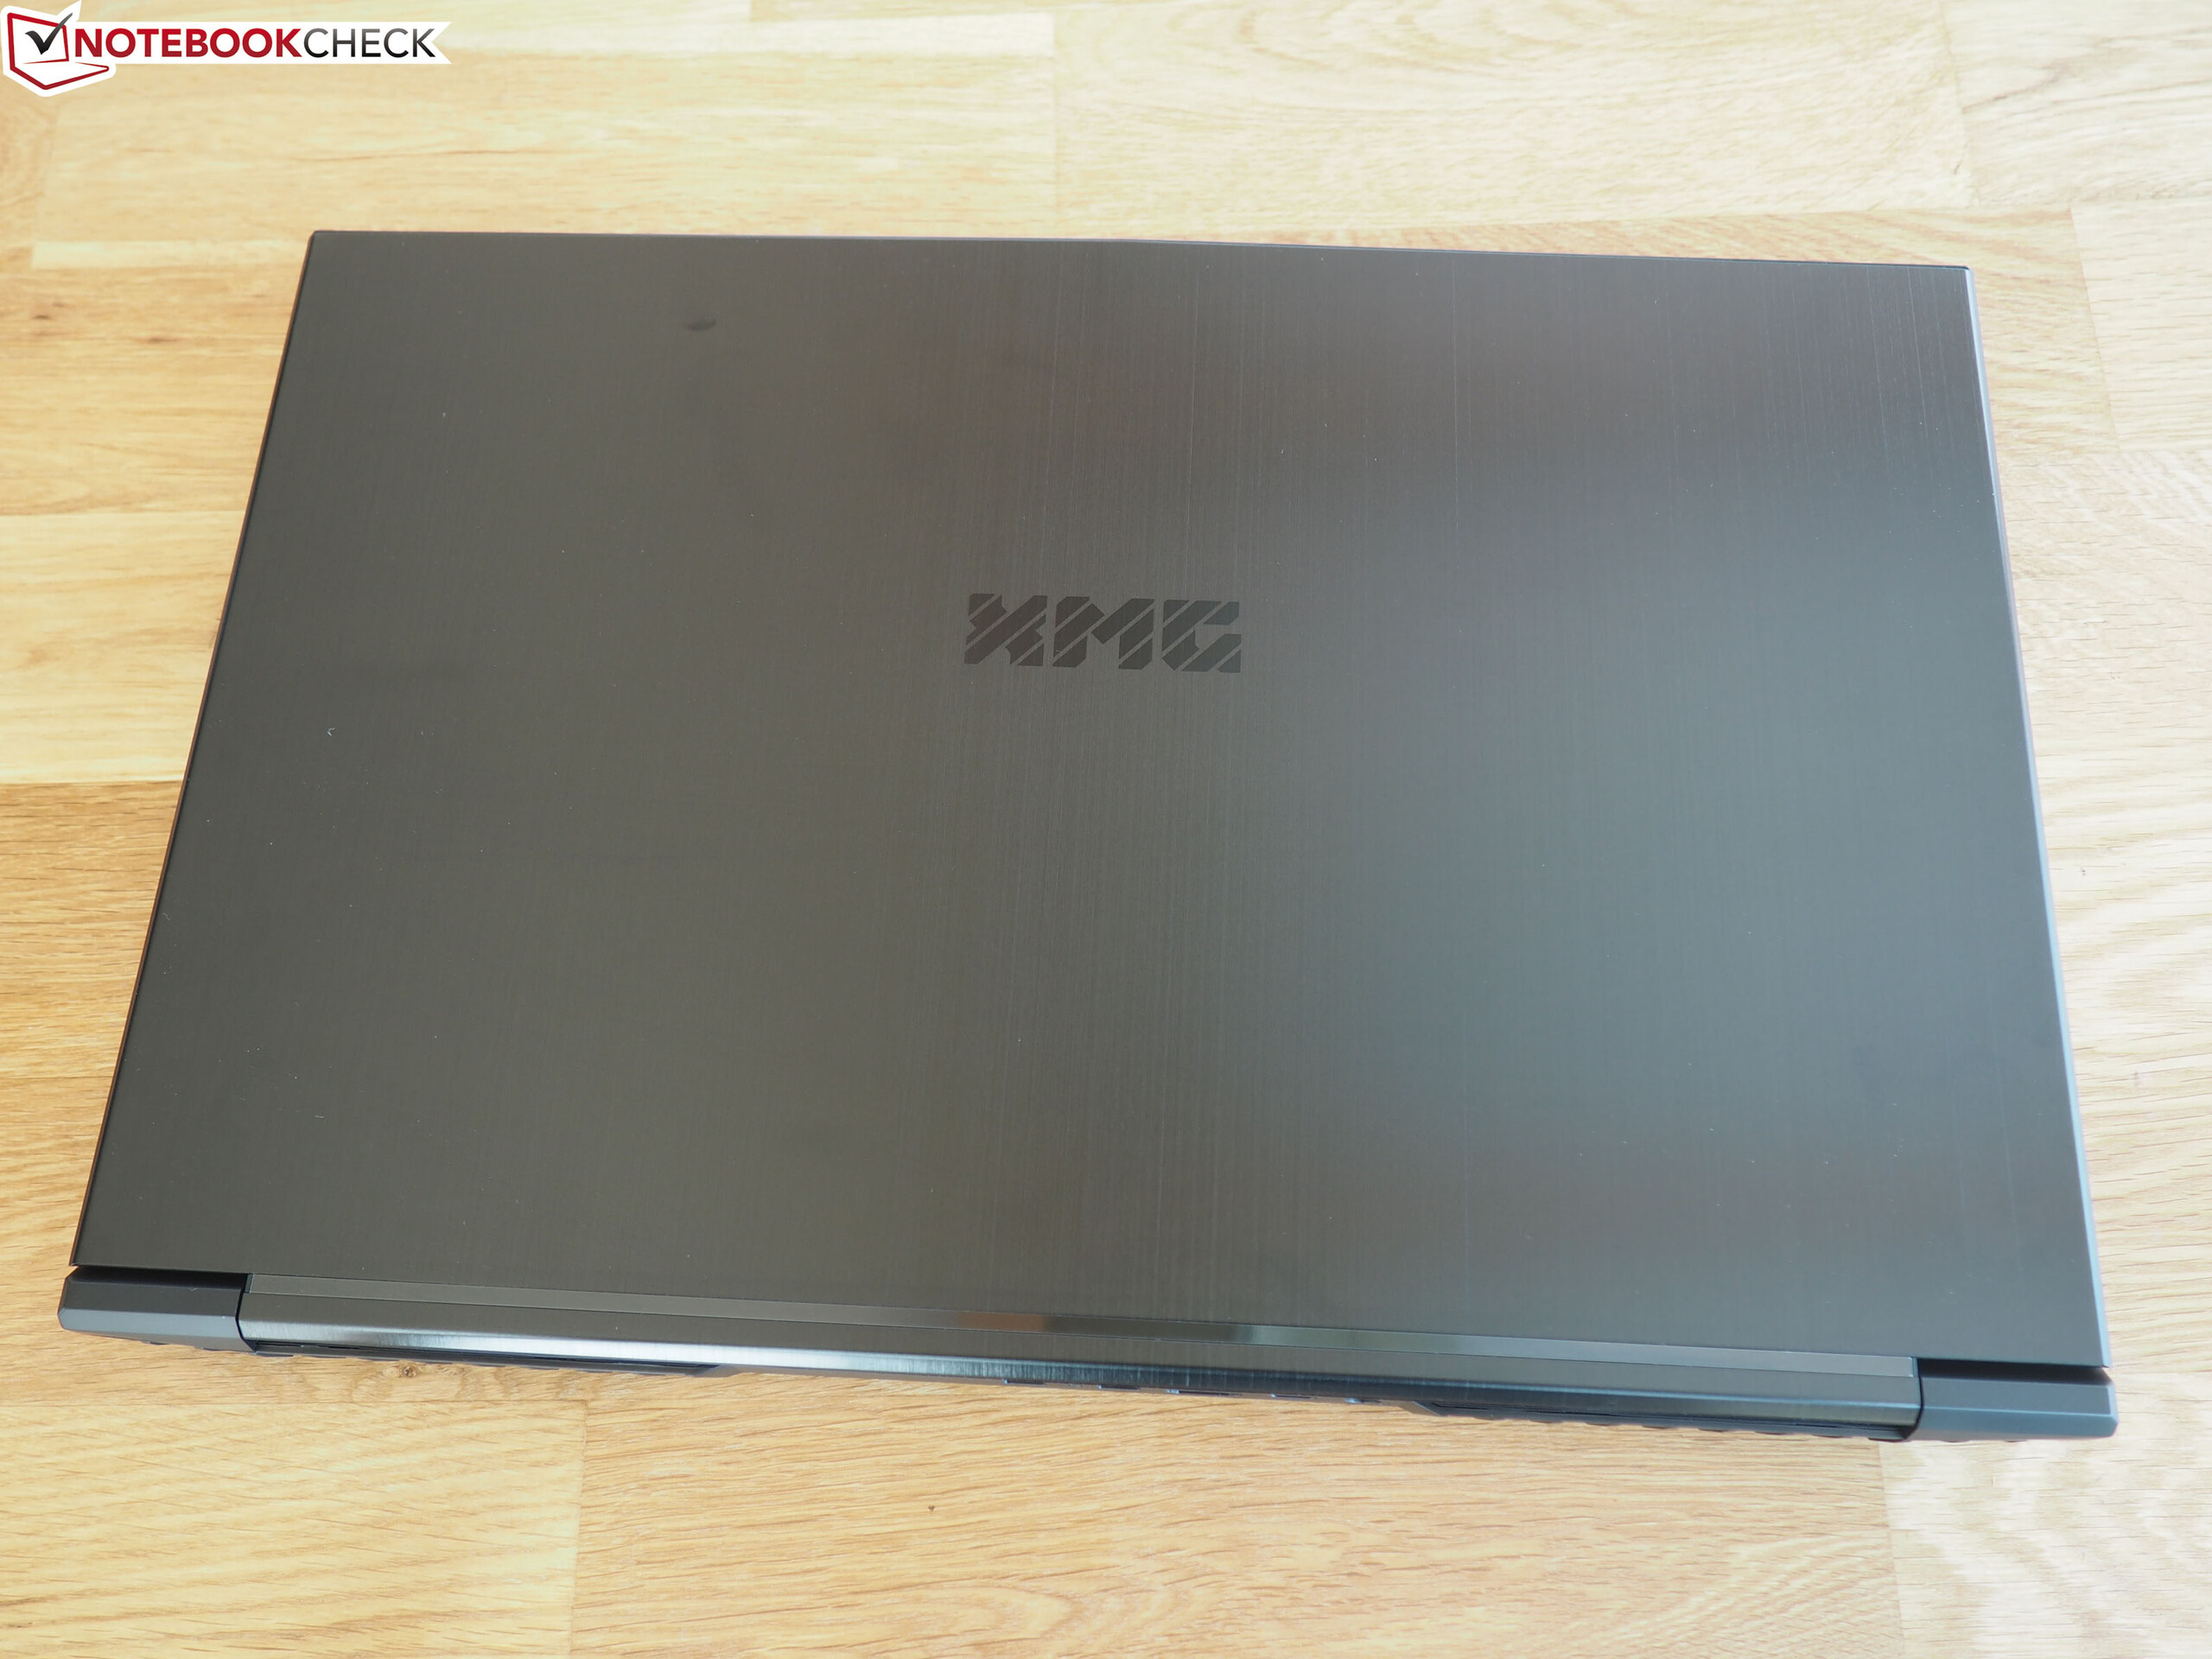
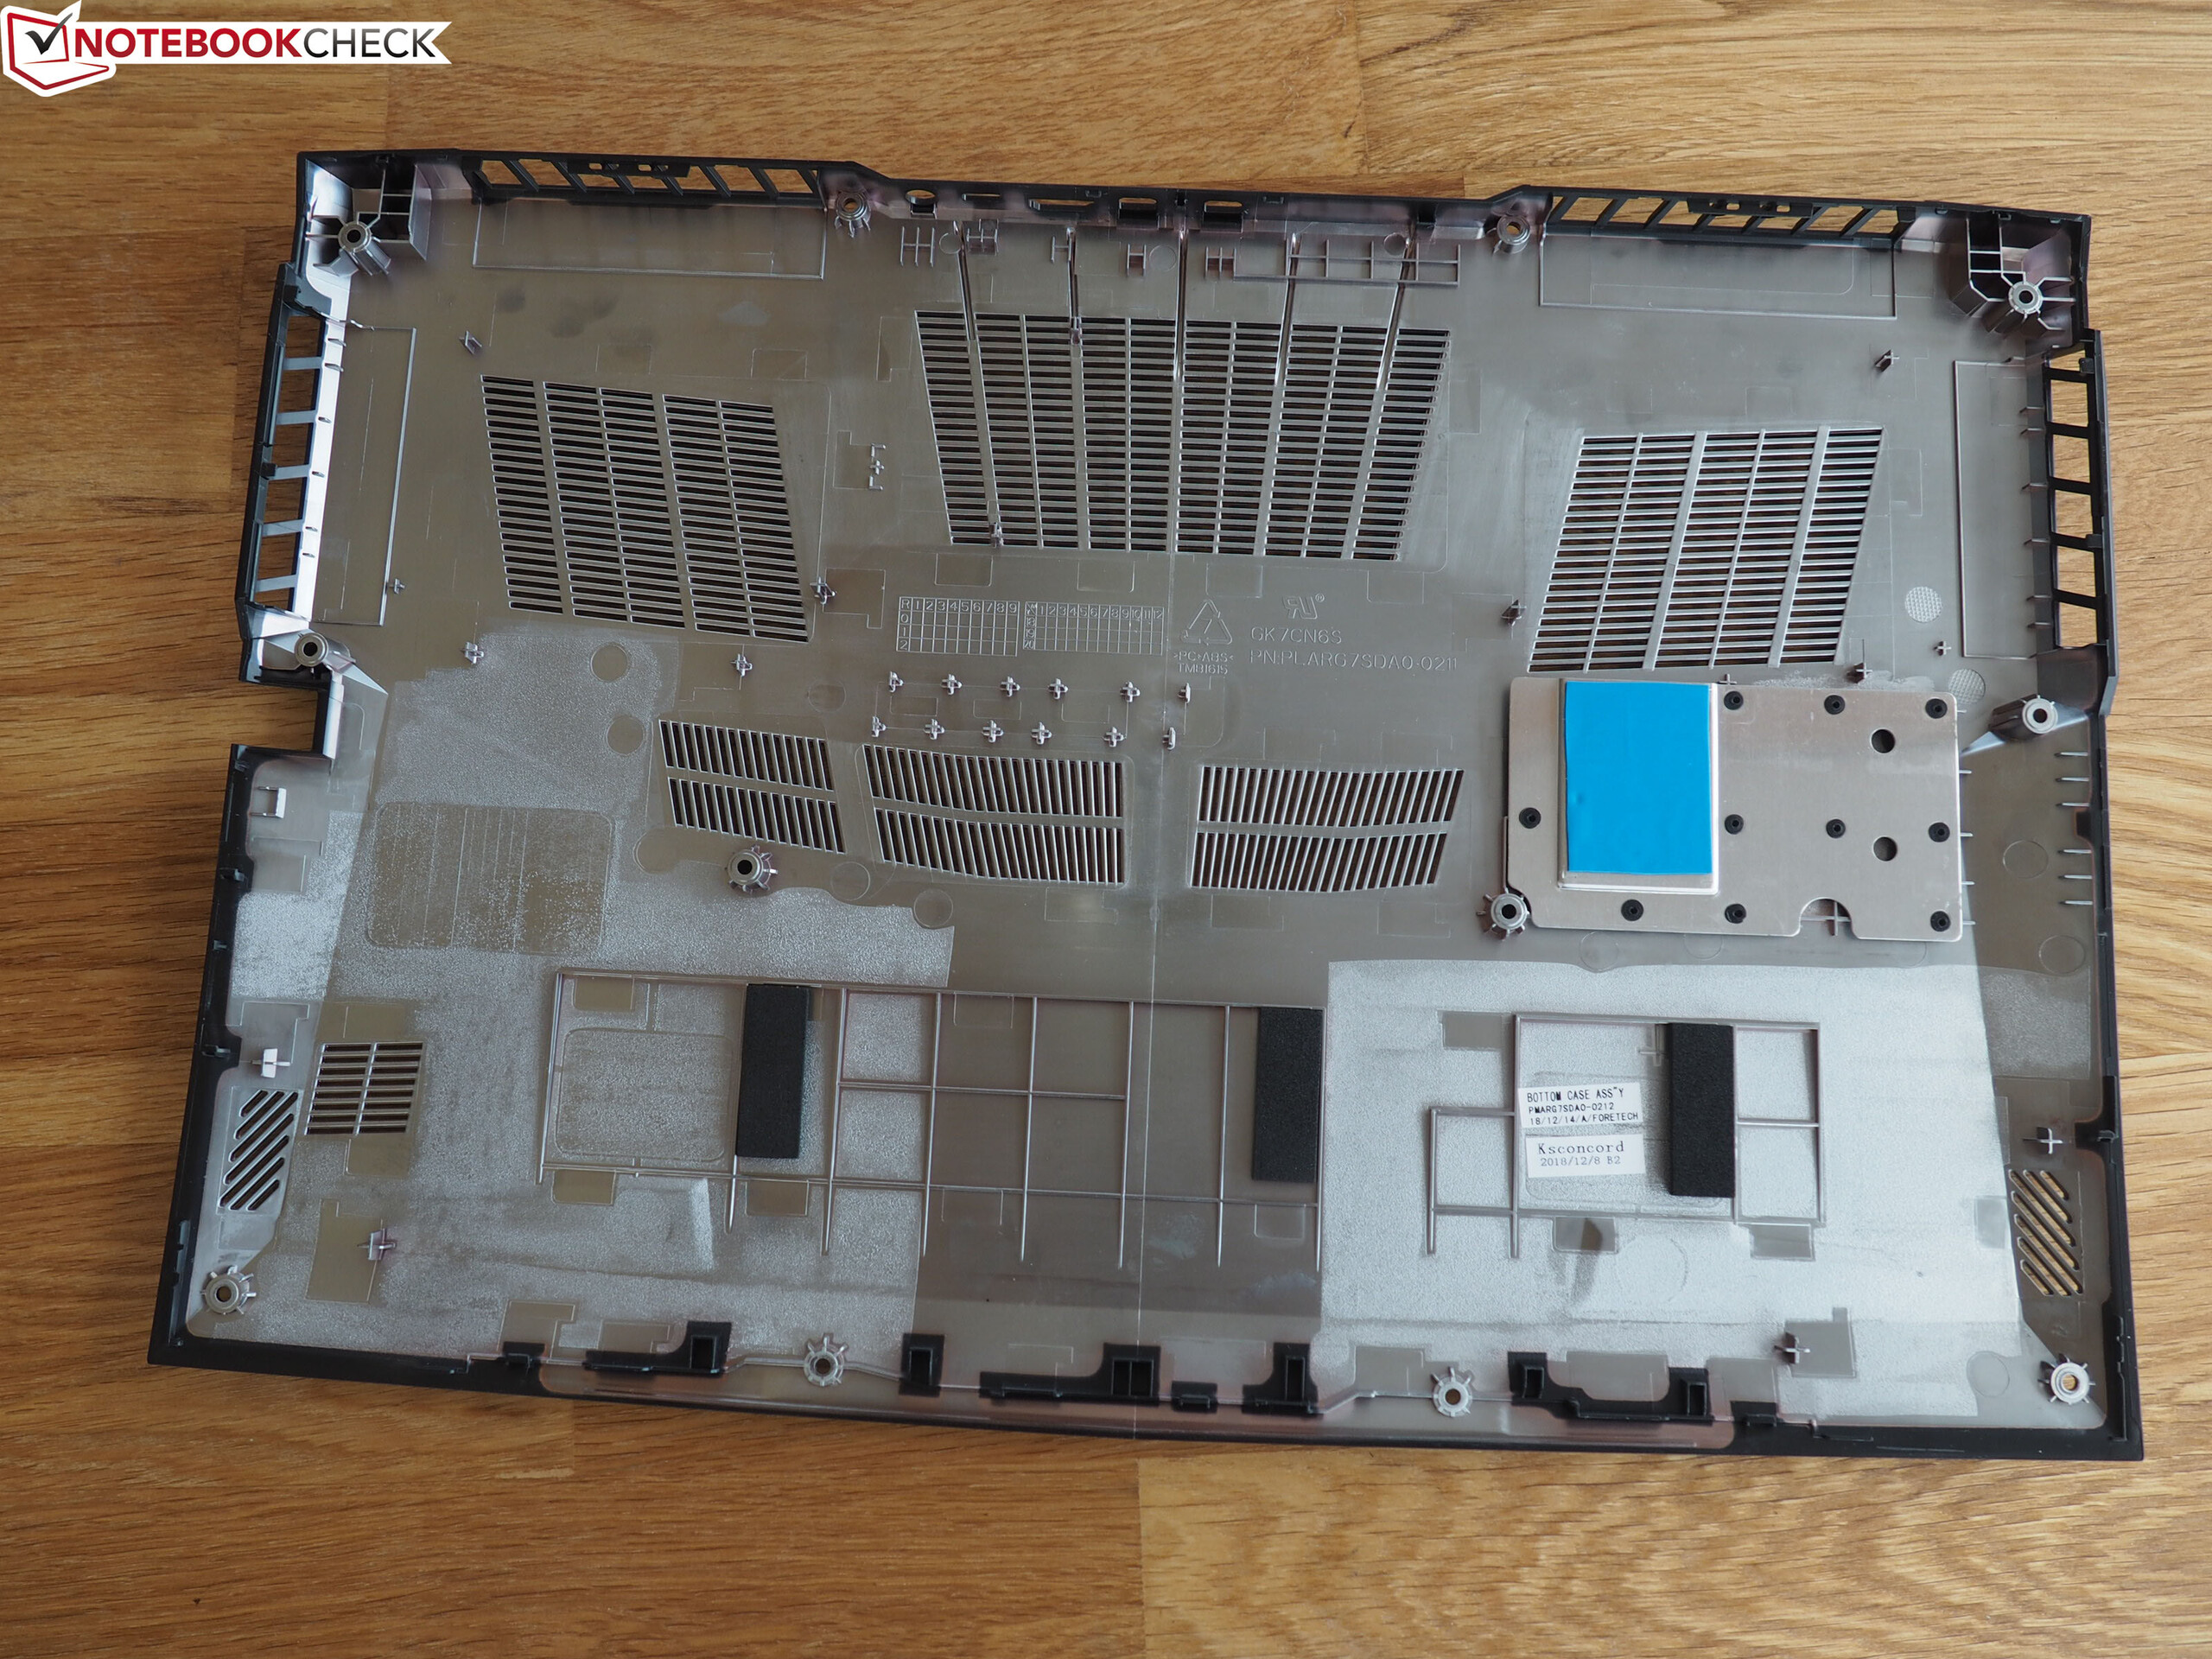
Neo 17 går dessutom att konfigurera så gott som helt fritt och den kommer med massor av tillbehör, vilket alltid är välkommet. Höljet från Tongfang Barebone är dessutom jämförelsevis kompakt och lätt även om det är en aning tjockt.
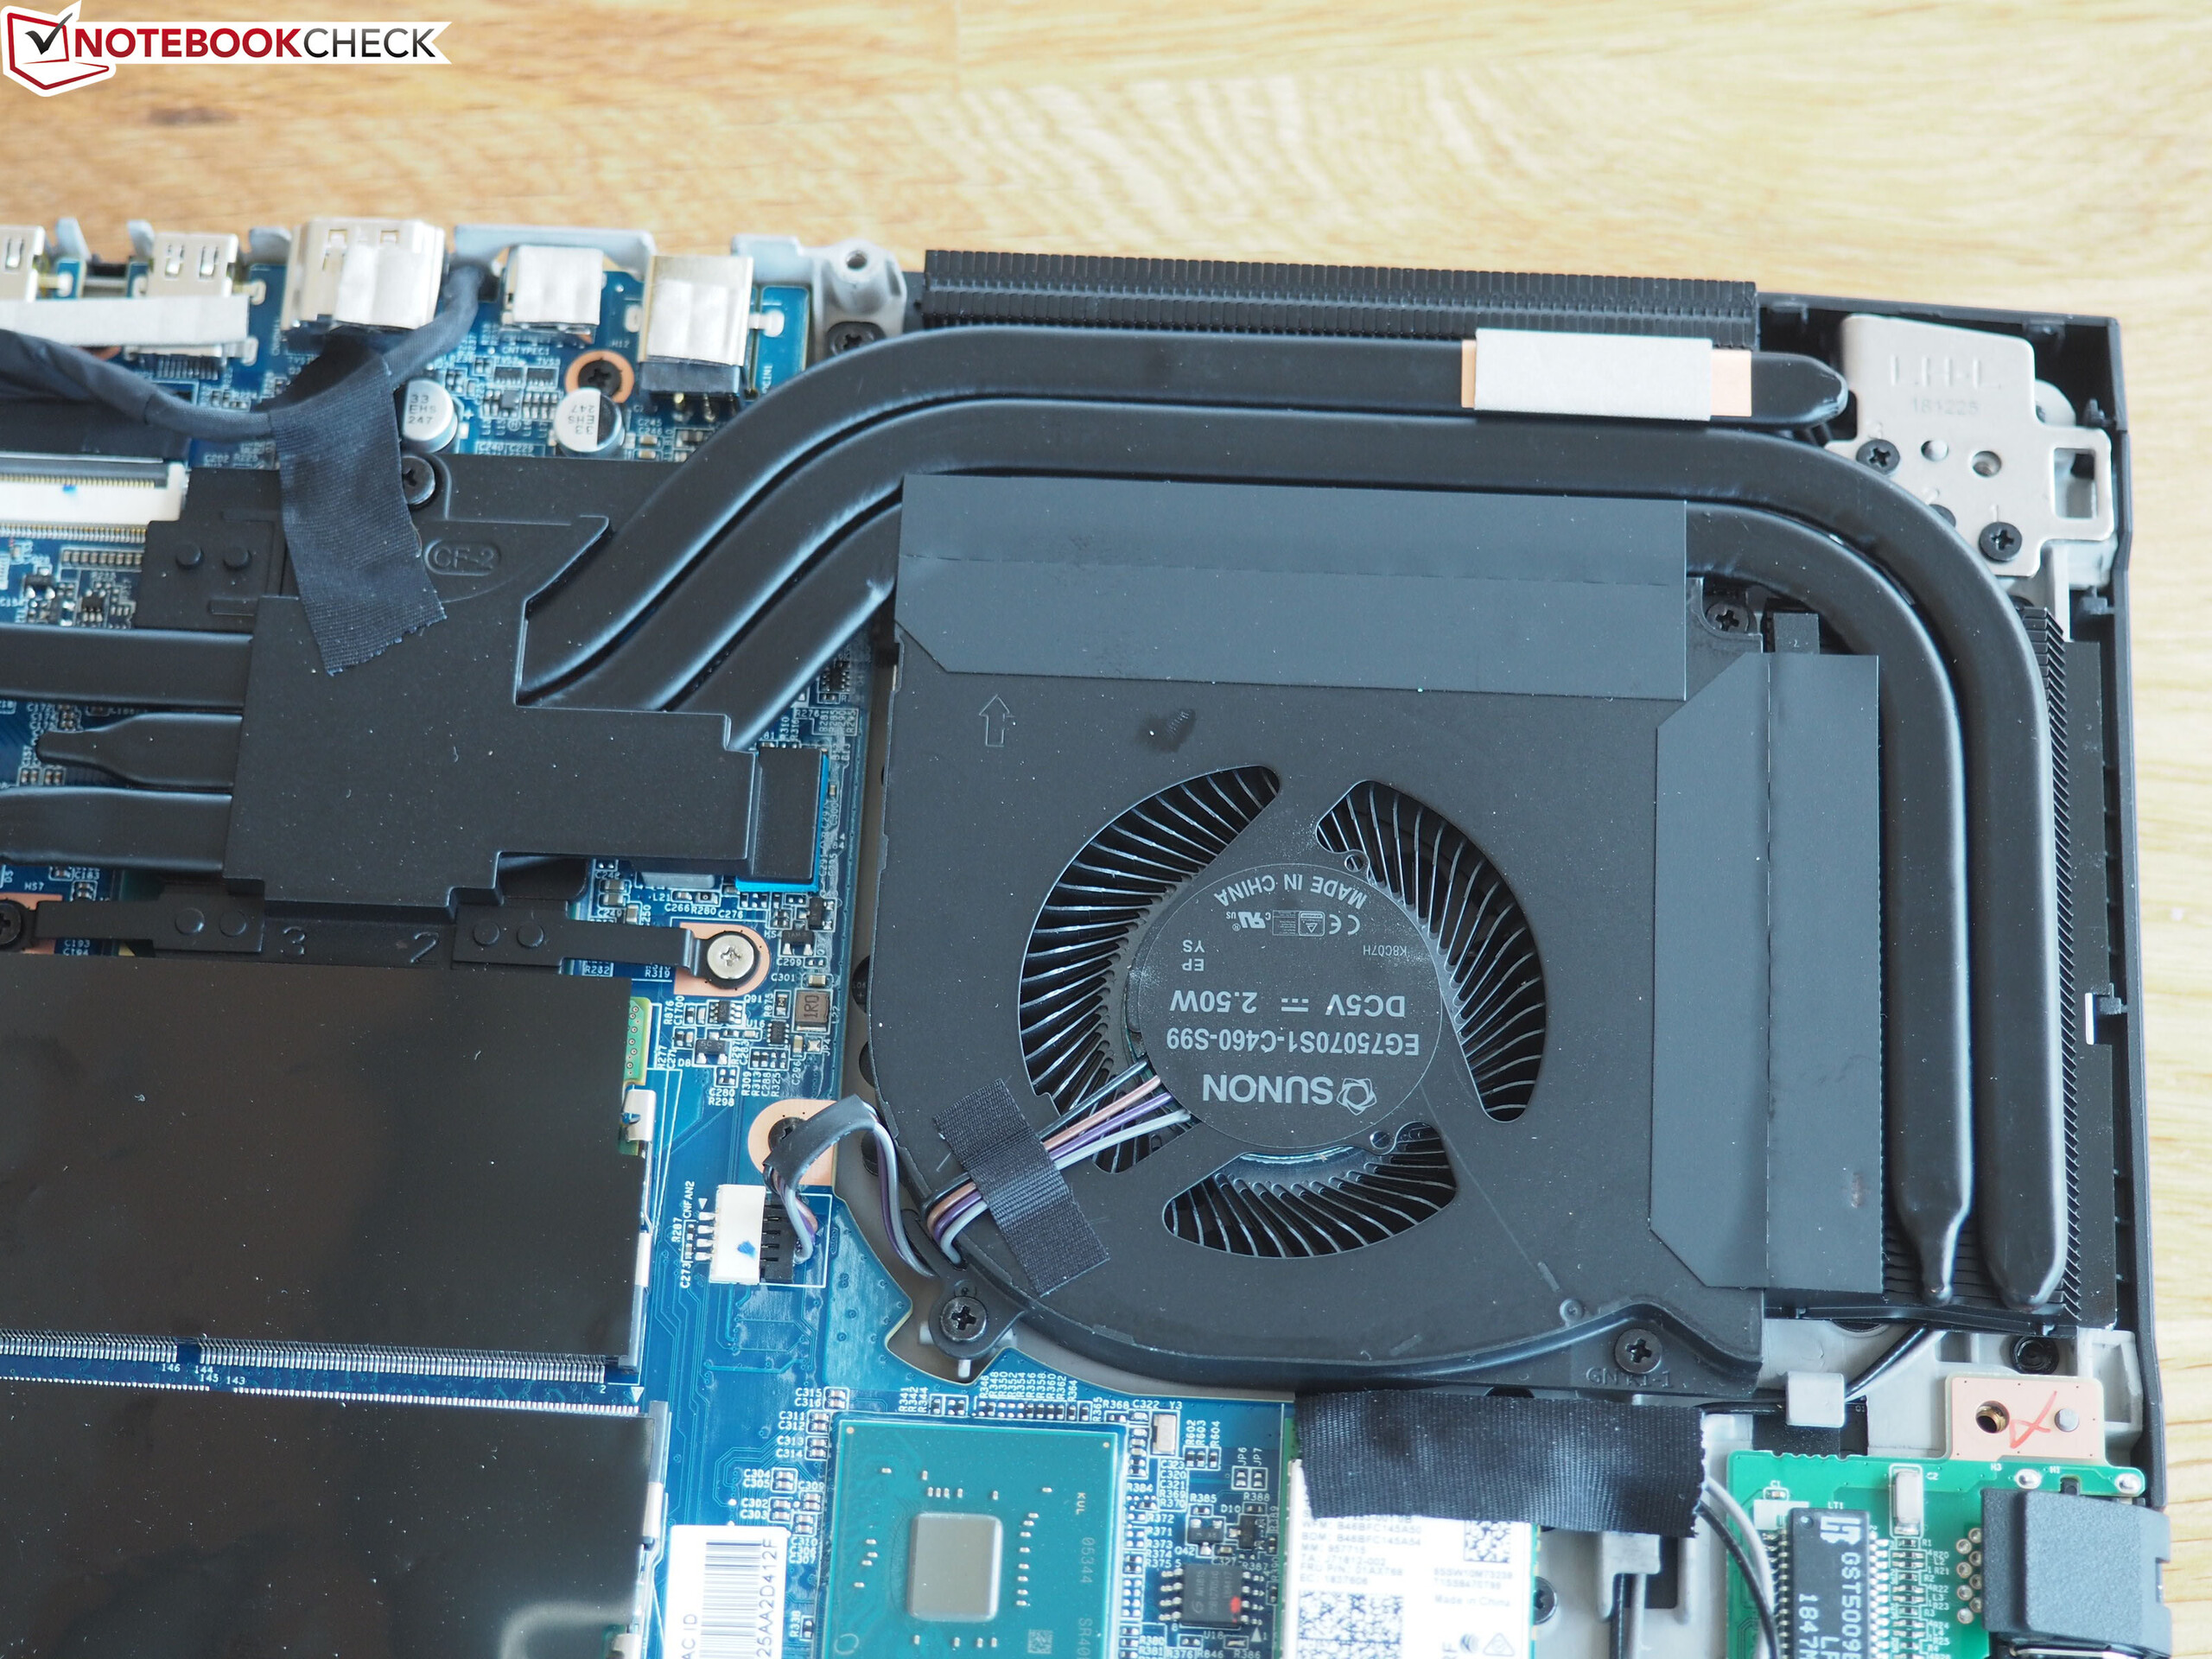
Men Schenker behöver åtgärda ett antal saker för att få toppbetyg. För det första behöver efterföljaren till Neo 17 åtminstone ett större batteri som alternativ tillsammans med en bättra styrplatta och bättre högtalare. Vidare skulle de behöva byta plats på WiFi-kortet så att det kan få ut mer av sin potential samt justera fläktkontrollen så att datorn kan använda CPU-turbo i det balanserade fläktläget. Totalt sett hindrar inte dessa brister XMG Neo 17 från att få ett skapligt genomsnittsbetyg, men de hindrar den från att vara den spellaptop på 17 tum som andra kommer att se upp till under året.
Schenker XMG Neo 17
- 05/14/2020 v7 (old)
Florian Glaser
Price comparison