Test: Lenovo ThinkPad X380 Yoga (i7-8550U, FHD) Omvandlingsbar (Recension)
| SD Card Reader | |
| average JPG Copy Test (av. of 3 runs) | |
| Genomsnitt av klass Convertible (28.1 - 197, n=23, senaste 2 åren) | |
| Lenovo ThinkPad Yoga 370-20JJS00100 (Toshiba Exceria Pro M401) | |
| Lenovo ThinkPad X380 Yoga 20LJS02W00 (Toshiba Exceria Pro SDXC 64 GB UHS-II) | |
| maximum AS SSD Seq Read Test (1GB) | |
| Genomsnitt av klass Convertible (28.9 - 254, n=22, senaste 2 åren) | |
| Lenovo ThinkPad X380 Yoga 20LJS02W00 (Toshiba Exceria Pro SDXC 64 GB UHS-II) | |
| Lenovo ThinkPad Yoga 370-20JJS00100 (Toshiba Exceria Pro M401) | |
| |||||||||||||||||||||||||
Distribution av ljusstyrkan: 84 %
Mitt på batteriet: 314 cd/m²
Kontrast: 1963:1 (Svärta: 0.16 cd/m²)
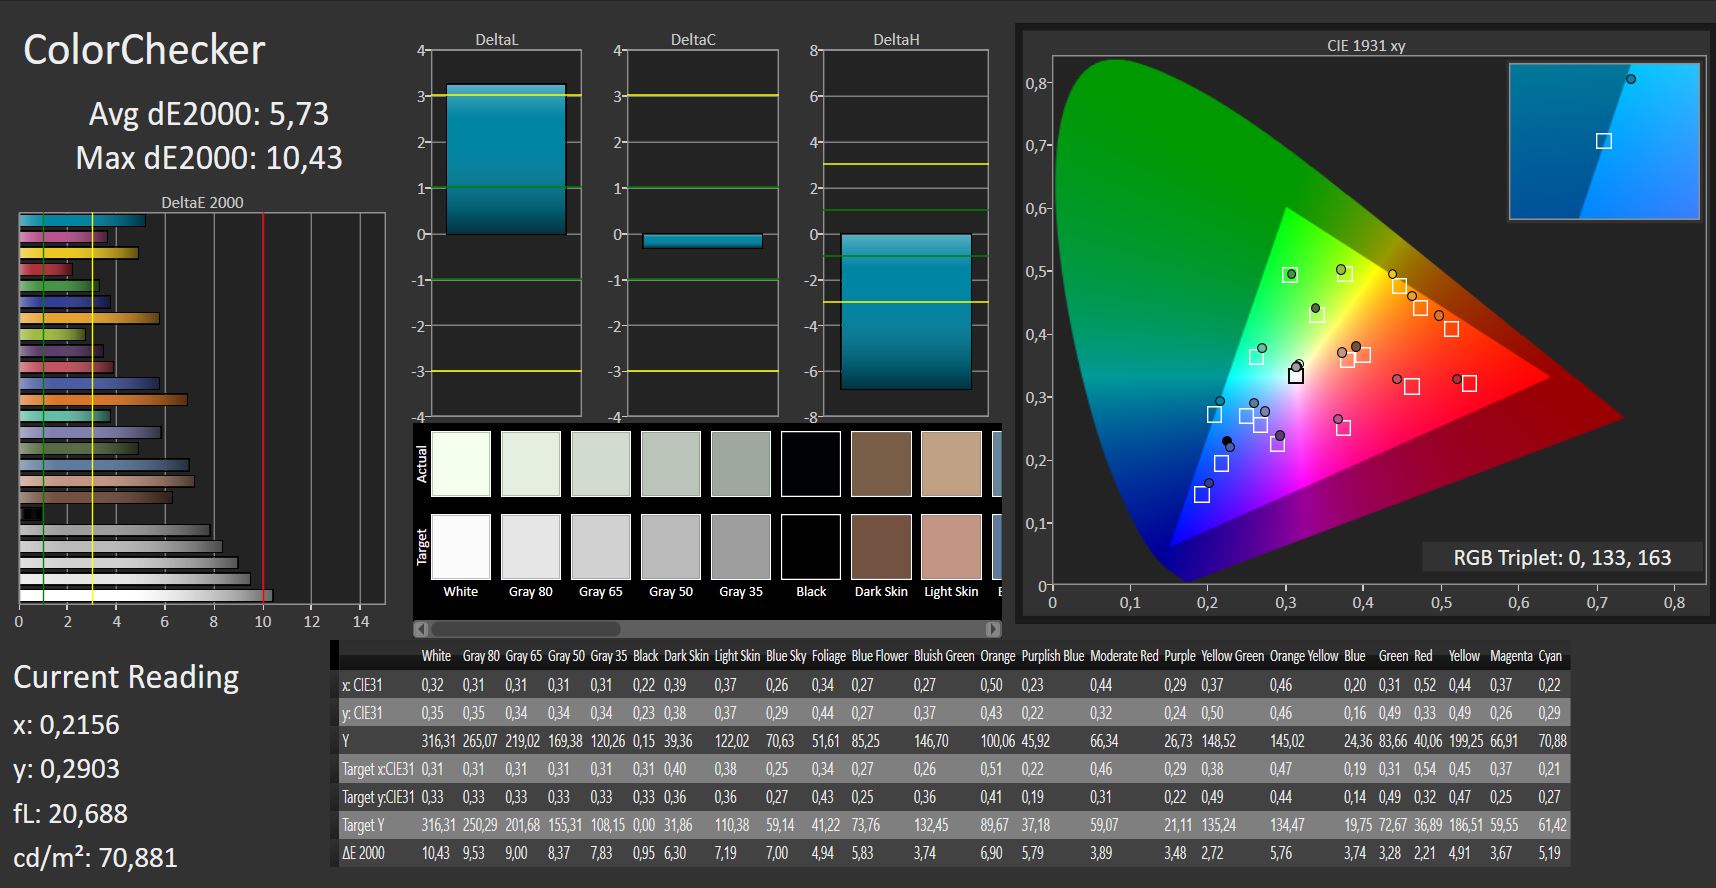
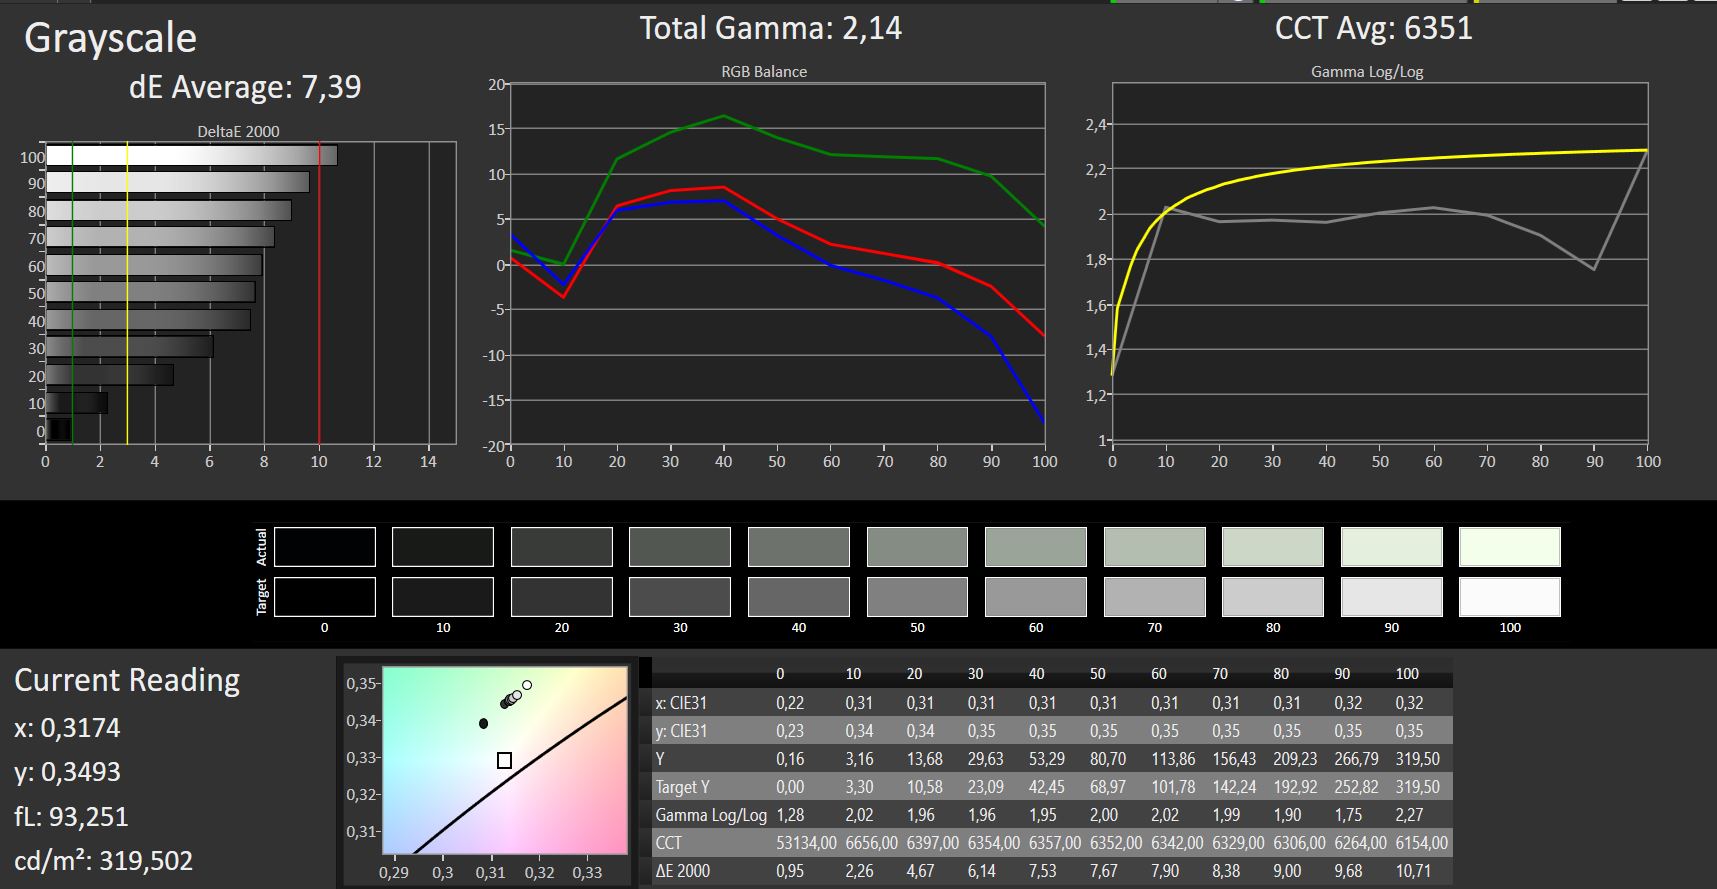
ΔE ColorChecker Calman: 5.73 | ∀{0.5-29.43 Ø4.73}
ΔE Greyscale Calman: 7.39 | ∀{0.09-98 Ø4.97}
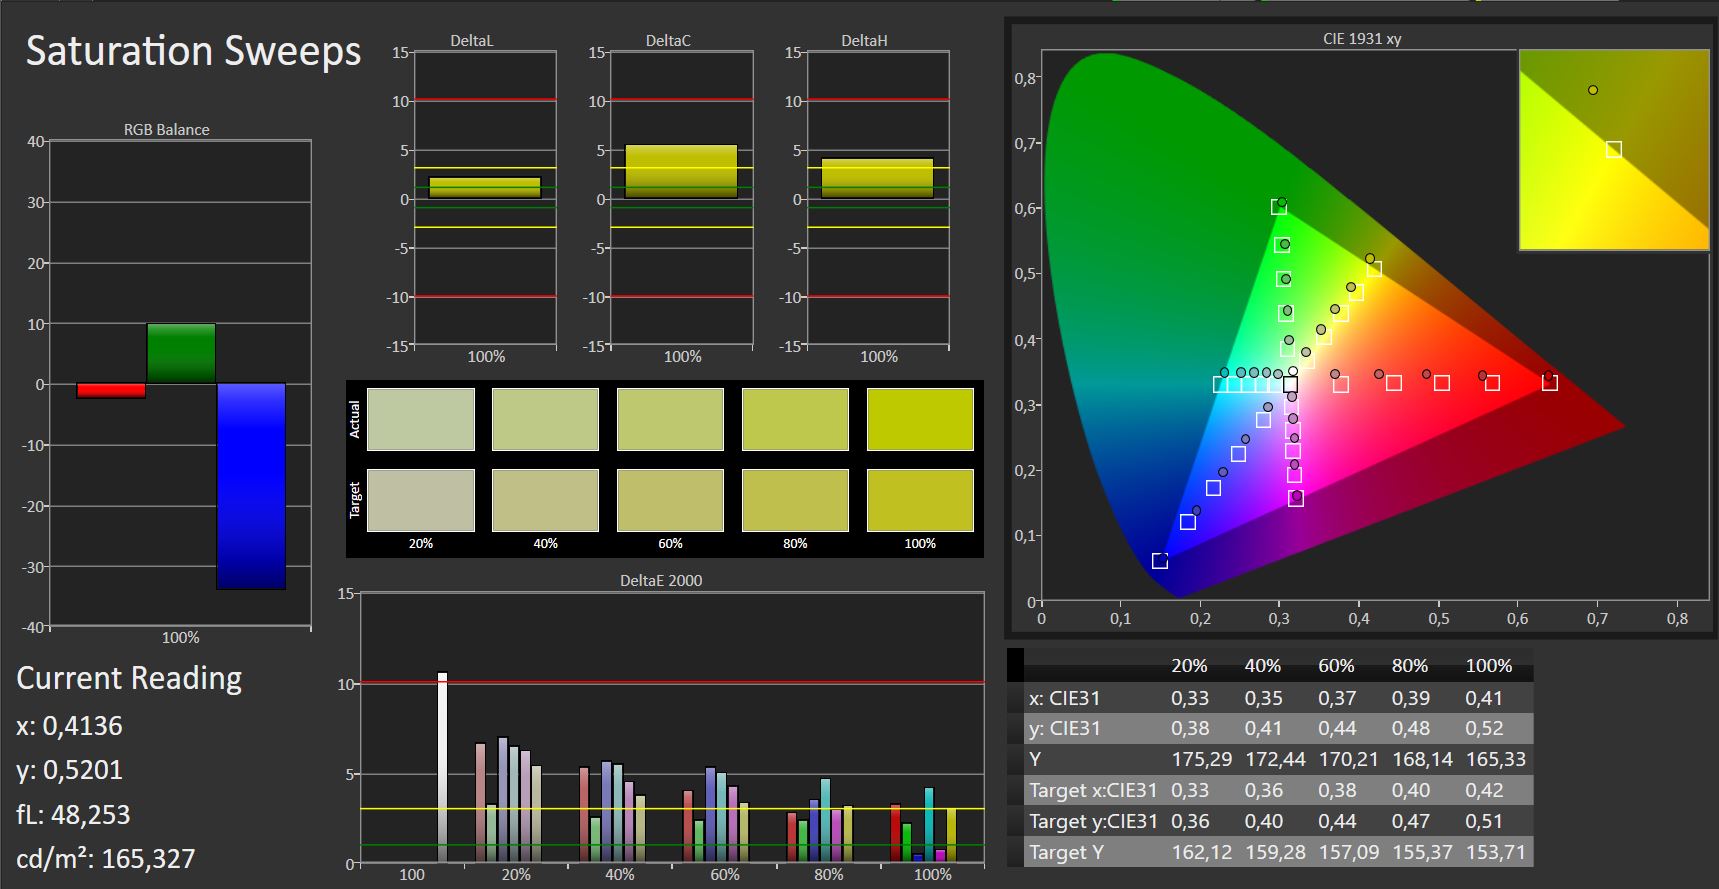
96% sRGB (Argyll 1.6.3 3D)
61% AdobeRGB 1998 (Argyll 1.6.3 3D)
67.8% AdobeRGB 1998 (Argyll 3D)
95.8% sRGB (Argyll 3D)
65.9% Display P3 (Argyll 3D)
Gamma: 2.14
CCT: 6351 K
| Lenovo ThinkPad X380 Yoga 20LJS02W00 IPS, 1920x1080, 13.3" | Lenovo ThinkPad Yoga 370-20JJS00100 IPS LED, 1920x1080, 13.3" | Dell XPS 13 9365-4537 2-in-1 IPS, 3200x1800, 13.3" | HP EliteBook x360 1030 G2 IPS, 1920x1080, 13.3" | |
|---|---|---|---|---|
| Display | 3% | -3% | -4% | |
| Display P3 Coverage (%) | 65.9 | 67.9 3% | 64.4 -2% | 65.5 -1% |
| sRGB Coverage (%) | 95.8 | 97.3 2% | 92.9 -3% | 88.8 -7% |
| AdobeRGB 1998 Coverage (%) | 67.8 | 69.9 3% | 66.1 -3% | 64.9 -4% |
| Response Times | 2% | 4% | -2% | |
| Response Time Grey 50% / Grey 80% * (ms) | 50 ? | 42 ? 16% | 48 ? 4% | 55.2 ? -10% |
| Response Time Black / White * (ms) | 29 ? | 32.8 ? -13% | 28 ? 3% | 27.2 ? 6% |
| PWM Frequency (Hz) | 1000 ? | 217.4 ? | ||
| Screen | -6% | 12% | -11% | |
| Brightness middle (cd/m²) | 314 | 374 19% | 348 11% | 262 -17% |
| Brightness (cd/m²) | 302 | 356 18% | 306 1% | 256 -15% |
| Brightness Distribution (%) | 84 | 87 4% | 78 -7% | 83 -1% |
| Black Level * (cd/m²) | 0.16 | 0.33 -106% | 0.2 -25% | 0.25 -56% |
| Contrast (:1) | 1963 | 1133 -42% | 1740 -11% | 1048 -47% |
| Colorchecker dE 2000 * | 5.73 | 4.7 18% | 2.79 51% | 5.13 10% |
| Colorchecker dE 2000 max. * | 10.43 | 9.5 9% | 5.53 47% | 9.46 9% |
| Greyscale dE 2000 * | 7.39 | 6.5 12% | 3.47 53% | 6.23 16% |
| Gamma | 2.14 103% | 2.19 100% | 2.54 87% | 2.45 90% |
| CCT | 6351 102% | 7086 92% | 6564 99% | 6413 101% |
| Color Space (Percent of AdobeRGB 1998) (%) | 61 | 63.1 3% | 60 -2% | 57.84 -5% |
| Color Space (Percent of sRGB) (%) | 96 | 97.2 1% | 93 -3% | 88.57 -8% |
| Totalt genomsnitt (program/inställningar) | -0% /
-4% | 4% /
8% | -6% /
-9% |
* ... mindre är bättre
Skärmflimmer / PWM (Puls-Width Modulation)
| Skärmflimmer / PWM upptäckt | 1000 Hz | ≤ 90 % ljusstyrka inställning | 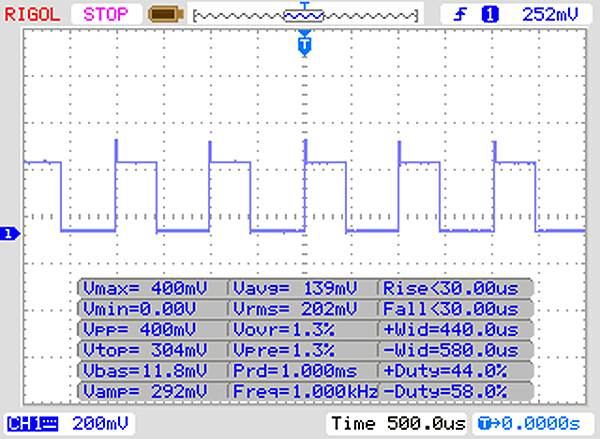 |
Displayens bakgrundsbelysning flimrar vid 1000 Hz (i värsta fall, t.ex. med PWM) Flimrande upptäckt vid en ljusstyrkeinställning på 90 % och lägre. Det ska inte finnas något flimmer eller PWM över denna ljusstyrkeinställning. Frekvensen för 1000 Hz är ganska hög, så de flesta användare som är känsliga för PWM bör inte märka något flimmer. Som jämförelse: 52 % av alla testade enheter använder inte PWM för att dämpa skärmen. Om PWM upptäcktes mättes ett medelvärde av 7801 (minst: 5 - maximum: 343500) Hz. | |||
Visa svarstider
| ↔ Svarstid svart till vitt | ||
|---|---|---|
| 29 ms ... stiga ↗ och falla ↘ kombinerat | ↗ 15 ms stiga | 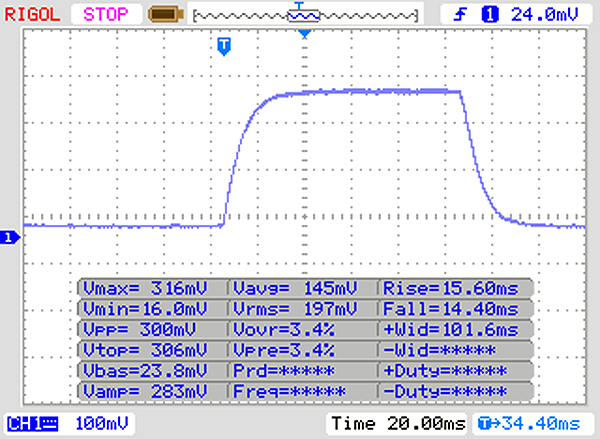 |
| ↘ 14 ms hösten | ||
| Skärmen visar relativt långsamma svarsfrekvenser i våra tester och kan vara för långsam för spelare. I jämförelse sträcker sig alla testade enheter från 0.1 (minst) till 240 (maximalt) ms. » 77 % av alla enheter är bättre. Detta innebär att den uppmätta svarstiden är sämre än genomsnittet av alla testade enheter (19.9 ms). | ||
| ↔ Svarstid 50 % grått till 80 % grått | ||
| 50 ms ... stiga ↗ och falla ↘ kombinerat | ↗ 24 ms stiga | 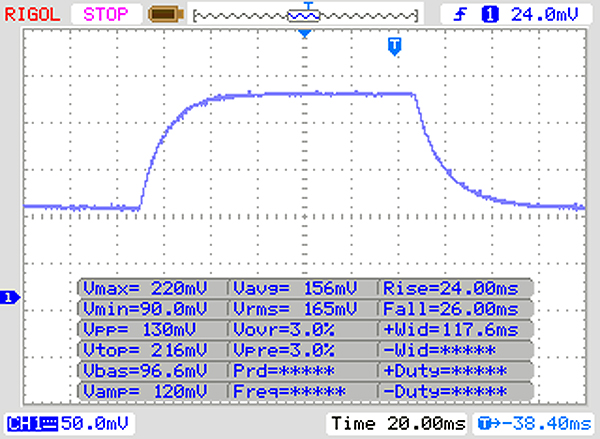 |
| ↘ 26 ms hösten | ||
| Skärmen visar långsamma svarsfrekvenser i våra tester och kommer att vara otillfredsställande för spelare. I jämförelse sträcker sig alla testade enheter från 0.165 (minst) till 636 (maximalt) ms. » 86 % av alla enheter är bättre. Detta innebär att den uppmätta svarstiden är sämre än genomsnittet av alla testade enheter (31.1 ms). | ||
| Geekbench 3 | |
| 32 Bit Multi-Core Score | |
| Genomsnitt Intel Core i7-8550U (8918 - 14144, n=12) | |
| Lenovo ThinkPad X380 Yoga 20LJS02W00 | |
| Dell XPS 13 9365-4537 2-in-1 | |
| 32 Bit Single-Core Score | |
| Lenovo ThinkPad X380 Yoga 20LJS02W00 | |
| Genomsnitt Intel Core i7-8550U (2471 - 4020, n=12) | |
| Dell XPS 13 9365-4537 2-in-1 | |
| JetStream 1.1 - 1.1 Total | |
| Acer Spin 5 SP515-51GN-80A3 (Edge 41.16299.15.0) | |
| Lenovo ThinkPad X380 Yoga 20LJS02W00 (Ede 41) | |
| Genomsnitt Intel Core i7-8550U (141.9 - 288, n=61) | |
| HP EliteBook x360 1030 G2 (Edge 38.14393.0.0) | |
| HP Spectre x360 13t-ae000 | |
| Lenovo ThinkPad Yoga 370-20JJS00100 (Edge) | |
| Dell XPS 13 9365-4537 2-in-1 (Edge 40) | |
| PCMark 7 Score | 5898 poäng | |
| PCMark 8 Home Score Accelerated v2 | 3687 poäng | |
| PCMark 8 Creative Score Accelerated v2 | 4788 poäng | |
| PCMark 8 Work Score Accelerated v2 | 4656 poäng | |
| PCMark 10 Score | 3632 poäng | |
Hjälp | ||

| Lenovo ThinkPad X380 Yoga 20LJS02W00 Samsung SSD PM981 MZVLB512HAJQ | Lenovo ThinkPad Yoga 370-20JJS00100 Toshiba NVMe THNSF5512GPUK | Dell XPS 13 9365-4537 2-in-1 Toshiba NVMe THNSN5256GPUK | HP EliteBook x360 1030 G2 Sandisk SD8TN8U-256G-1006 | Genomsnitt Samsung SSD PM981 MZVLB512HAJQ | |
|---|---|---|---|---|---|
| CrystalDiskMark 3.0 | -41% | -53% | -63% | -9% | |
| Read Seq (MB/s) | 2486 | 1070 -57% | 1159 -53% | 467.1 -81% | 2002 ? -19% |
| Write Seq (MB/s) | 1341 | 484.5 -64% | 324.1 -76% | 443.6 -67% | 1656 ? 23% |
| Read 512 (MB/s) | 1788 | 680 -62% | 528 -70% | 312.3 -83% | 1213 ? -32% |
| Write 512 (MB/s) | 1885 | 483.1 -74% | 373.7 -80% | 372.5 -80% | 1641 ? -13% |
| Read 4k (MB/s) | 62.3 | 30.55 -51% | 29.26 -53% | 29.43 -53% | 61.4 ? -1% |
| Write 4k (MB/s) | 145.6 | 127.3 -13% | 108.3 -26% | 56.5 -61% | 131.3 ? -10% |
| Read 4k QD32 (MB/s) | 385.5 | 460.8 20% | 335.9 -13% | 311.3 -19% | 407 ? 6% |
| Write 4k QD32 (MB/s) | 535 | 414.5 -23% | 234.1 -56% | 225.2 -58% | 402 ? -25% |
| 3DMark 06 Standard Score | 8282 poäng | |
| 3DMark 11 Performance | 1801 poäng | |
| 3DMark Cloud Gate Standard Score | 5821 poäng | |
| 3DMark Fire Strike Score | 786 poäng | |
Hjälp | ||
| låg | med. | hög | ultra | |
|---|---|---|---|---|
| Tomb Raider (2013) | 85.8 | 43.3 | 28.2 | 12.5 |
| BioShock Infinite (2013) | 62.9 | 32.4 | 26.7 | 9.3 |
| Rise of the Tomb Raider (2016) | 15.5 | 9.5 | 4.9 | 3.1 |
Ljudnivå
| Låg belastning |
| 30.4 / 30.4 / 30.4 dB(A) |
| Hög belastning |
| 34.2 / 35.2 dB(A) |
 | ||
30 dB tyst 40 dB(A) hörbar 50 dB(A) högt ljud |
||
min: | ||
| Lenovo ThinkPad X380 Yoga 20LJS02W00 i5-8550U, UHD Graphics 620 | Lenovo ThinkPad Yoga 370-20JJS00100 i5-7200U, HD Graphics 620 | HP EliteBook x360 1030 G2 i5-7300U, HD Graphics 620 | |
|---|---|---|---|
| Noise | 2% | 3% | |
| av / miljö * (dB) | 30.4 | 28.6 6% | 29 5% |
| Idle Minimum * (dB) | 30.4 | 28.6 6% | 29 5% |
| Idle Average * (dB) | 30.4 | 28.6 6% | 29 5% |
| Idle Maximum * (dB) | 30.4 | 31.2 -3% | 29 5% |
| Load Average * (dB) | 34.2 | 33.7 1% | 33.6 2% |
| Load Maximum * (dB) | 35.2 | 36.7 -4% | 35.8 -2% |
* ... mindre är bättre
(±) Den maximala temperaturen på ovansidan är 40.2 °C / 104 F, jämfört med genomsnittet av 35.4 °C / 96 F , allt från 19.6 till 60 °C för klassen Convertible.
(-) Botten värms upp till maximalt 46 °C / 115 F, jämfört med genomsnittet av 36.9 °C / 98 F
(+) Vid tomgångsbruk är medeltemperaturen för ovansidan 24.3 °C / 76 F, jämfört med enhetsgenomsnittet på 30.3 °C / ### class_avg_f### F.
(+) Handledsstöden och pekplattan är kallare än hudtemperaturen med maximalt 29.7 °C / 85.5 F och är därför svala att ta på.
(±) Medeltemperaturen för handledsstödsområdet på liknande enheter var 28 °C / 82.4 F (-1.7 °C / -3.1 F).
| Lenovo ThinkPad X380 Yoga 20LJS02W00 i5-8550U, UHD Graphics 620 | Lenovo ThinkPad Yoga 370-20JJS00100 i5-7200U, HD Graphics 620 | Dell XPS 13 9365-4537 2-in-1 i5-7Y54, HD Graphics 615 | HP EliteBook x360 1030 G2 i5-7300U, HD Graphics 620 | |
|---|---|---|---|---|
| Heat | -9% | 4% | 5% | |
| Maximum Upper Side * (°C) | 40.2 | 42 -4% | 43.1 -7% | 36.1 10% |
| Maximum Bottom * (°C) | 46 | 48 -4% | 41.7 9% | 36.7 20% |
| Idle Upper Side * (°C) | 25.2 | 28 -11% | 23.8 6% | 26.8 -6% |
| Idle Bottom * (°C) | 25.8 | 29.7 -15% | 23.7 8% | 26.5 -3% |
* ... mindre är bättre
Lenovo ThinkPad X380 Yoga 20LJS02W00 ljudanalys
(-) | inte särskilt höga högtalare (69.6 dB)
Bas 100 - 315 Hz
(-) | nästan ingen bas - i genomsnitt 29.7% lägre än medianen
(±) | linjäriteten för basen är genomsnittlig (8.9% delta till föregående frekvens)
Mellan 400 - 2000 Hz
(+) | balanserad mellan - endast 3.5% från medianen
(±) | linjäriteten för mids är genomsnittlig (10.2% delta till föregående frekvens)
Högsta 2 - 16 kHz
(±) | högre toppar - i genomsnitt 5.1% högre än medianen
(±) | linjäriteten för toppar är genomsnittlig (7.3% delta till föregående frekvens)
Totalt 100 - 16 000 Hz
(-) | det totala ljudet är inte linjärt (30.7% skillnad mot median)
Jämfört med samma klass
» 89% av alla testade enheter i den här klassen var bättre, 2% liknande, 9% sämre
» Den bästa hade ett delta på 6%, genomsnittet var 20%, sämst var 57%
Jämfört med alla testade enheter
» 89% av alla testade enheter var bättre, 3% liknande, 8% sämre
» Den bästa hade ett delta på 4%, genomsnittet var 24%, sämst var 134%
Apple MacBook 12 (Early 2016) 1.1 GHz ljudanalys
(+) | högtalare kan spela relativt högt (83.6 dB)
Bas 100 - 315 Hz
(±) | reducerad bas - i genomsnitt 11.3% lägre än medianen
(±) | linjäriteten för basen är genomsnittlig (14.2% delta till föregående frekvens)
Mellan 400 - 2000 Hz
(+) | balanserad mellan - endast 2.4% från medianen
(+) | mids är linjära (5.5% delta till föregående frekvens)
Högsta 2 - 16 kHz
(+) | balanserade toppar - endast 2% från medianen
(+) | toppar är linjära (4.5% delta till föregående frekvens)
Totalt 100 - 16 000 Hz
(+) | det totala ljudet är linjärt (10.2% skillnad mot median)
Jämfört med samma klass
» 7% av alla testade enheter i den här klassen var bättre, 2% liknande, 91% sämre
» Den bästa hade ett delta på 5%, genomsnittet var 18%, sämst var 53%
Jämfört med alla testade enheter
» 5% av alla testade enheter var bättre, 1% liknande, 94% sämre
» Den bästa hade ett delta på 4%, genomsnittet var 24%, sämst var 134%
| Av/Standby | |
| Låg belastning | |
| Hög belastning |
|
Förklaring:
min: | |
| Lenovo ThinkPad X380 Yoga 20LJS02W00 i5-8550U, UHD Graphics 620 | Lenovo ThinkPad Yoga 370-20JJS00100 i5-7200U, HD Graphics 620 | Dell XPS 13 9365-4537 2-in-1 i5-7Y54, HD Graphics 615 | HP EliteBook x360 1030 G2 i5-7300U, HD Graphics 620 | |
|---|---|---|---|---|
| Power Consumption | -7% | -49% | 2% | |
| Idle Minimum * (Watt) | 4 | 3.6 10% | 8.2 -105% | 3.2 20% |
| Idle Average * (Watt) | 4.9 | 7.2 -47% | 10.8 -120% | 5.5 -12% |
| Idle Maximum * (Watt) | 6.9 | 8.4 -22% | 12.7 -84% | 6.5 6% |
| Load Average * (Watt) | 36 | 29.9 17% | 22.6 37% | 29.7 17% |
| Load Maximum * (Watt) | 34.4 | 32.2 6% | 24.6 28% | 41.3 -20% |
* ... mindre är bättre
| Lenovo ThinkPad X380 Yoga 20LJS02W00 i5-8550U, UHD Graphics 620, 51 Wh | Lenovo ThinkPad Yoga 370-20JJS00100 i5-7200U, HD Graphics 620, 51 Wh | Dell XPS 13 9365-4537 2-in-1 i5-7Y54, HD Graphics 615, 46 Wh | HP EliteBook x360 1030 G2 i5-7300U, HD Graphics 620, 57 Wh | |
|---|---|---|---|---|
| Batteridrifttid | -4% | -20% | 33% | |
| Reader / Idle (h) | 20.8 | 19.4 -7% | 23.1 11% | |
| H.264 (h) | 9.2 | 9.6 4% | 11 20% | |
| WiFi v1.3 (h) | 8.5 | 8.1 -5% | 6.8 -20% | 10.5 24% |
| Load (h) | 2.3 | 2.1 -9% | 4.1 78% |
För
Emot
Läs den fullständiga versionen av den här recensionen på engelska här.
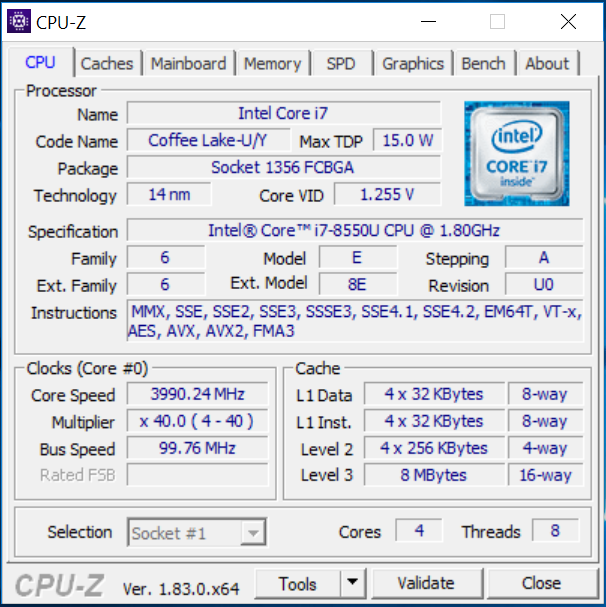
Inga fundamentala ändringar har gjorts med ThinkPad X380 Yoga jämfört med dess föregångare (ThinkPad Yoga 370). Utöver ett nytt namn så har Lenovo också lagt till en ny fyrkärnig ULV-processor från Intel.
Den inbyggda Core i7-8550U processorn erbjuder mer än tillräckligt med prestanda för kontorsarbete och internet-surfande. Processorn kan använda sin Turbo Boost till en viss grad och för en kort stund.
Totalt sett kan Lenovo ThinkPad X380 Yoga beskrivas som lyckad. Därför framstår bristerna (PWM-flimmer, ett års garanti, inga WWAN-antenner) ännu mer irriterande. Faktum är att i detta prisskiktet så borde sådana nackdelar inte ens dyka upp överhuvudtaget.
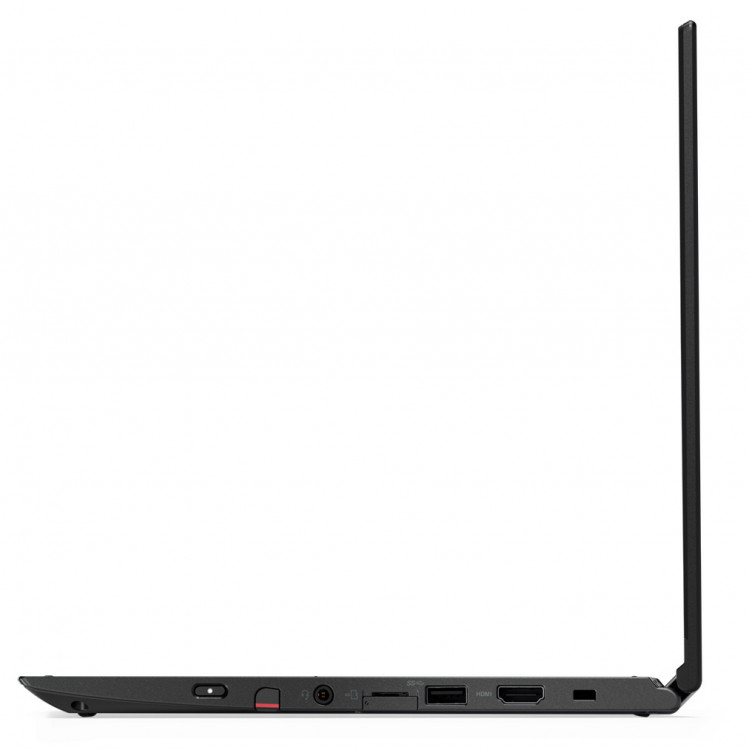
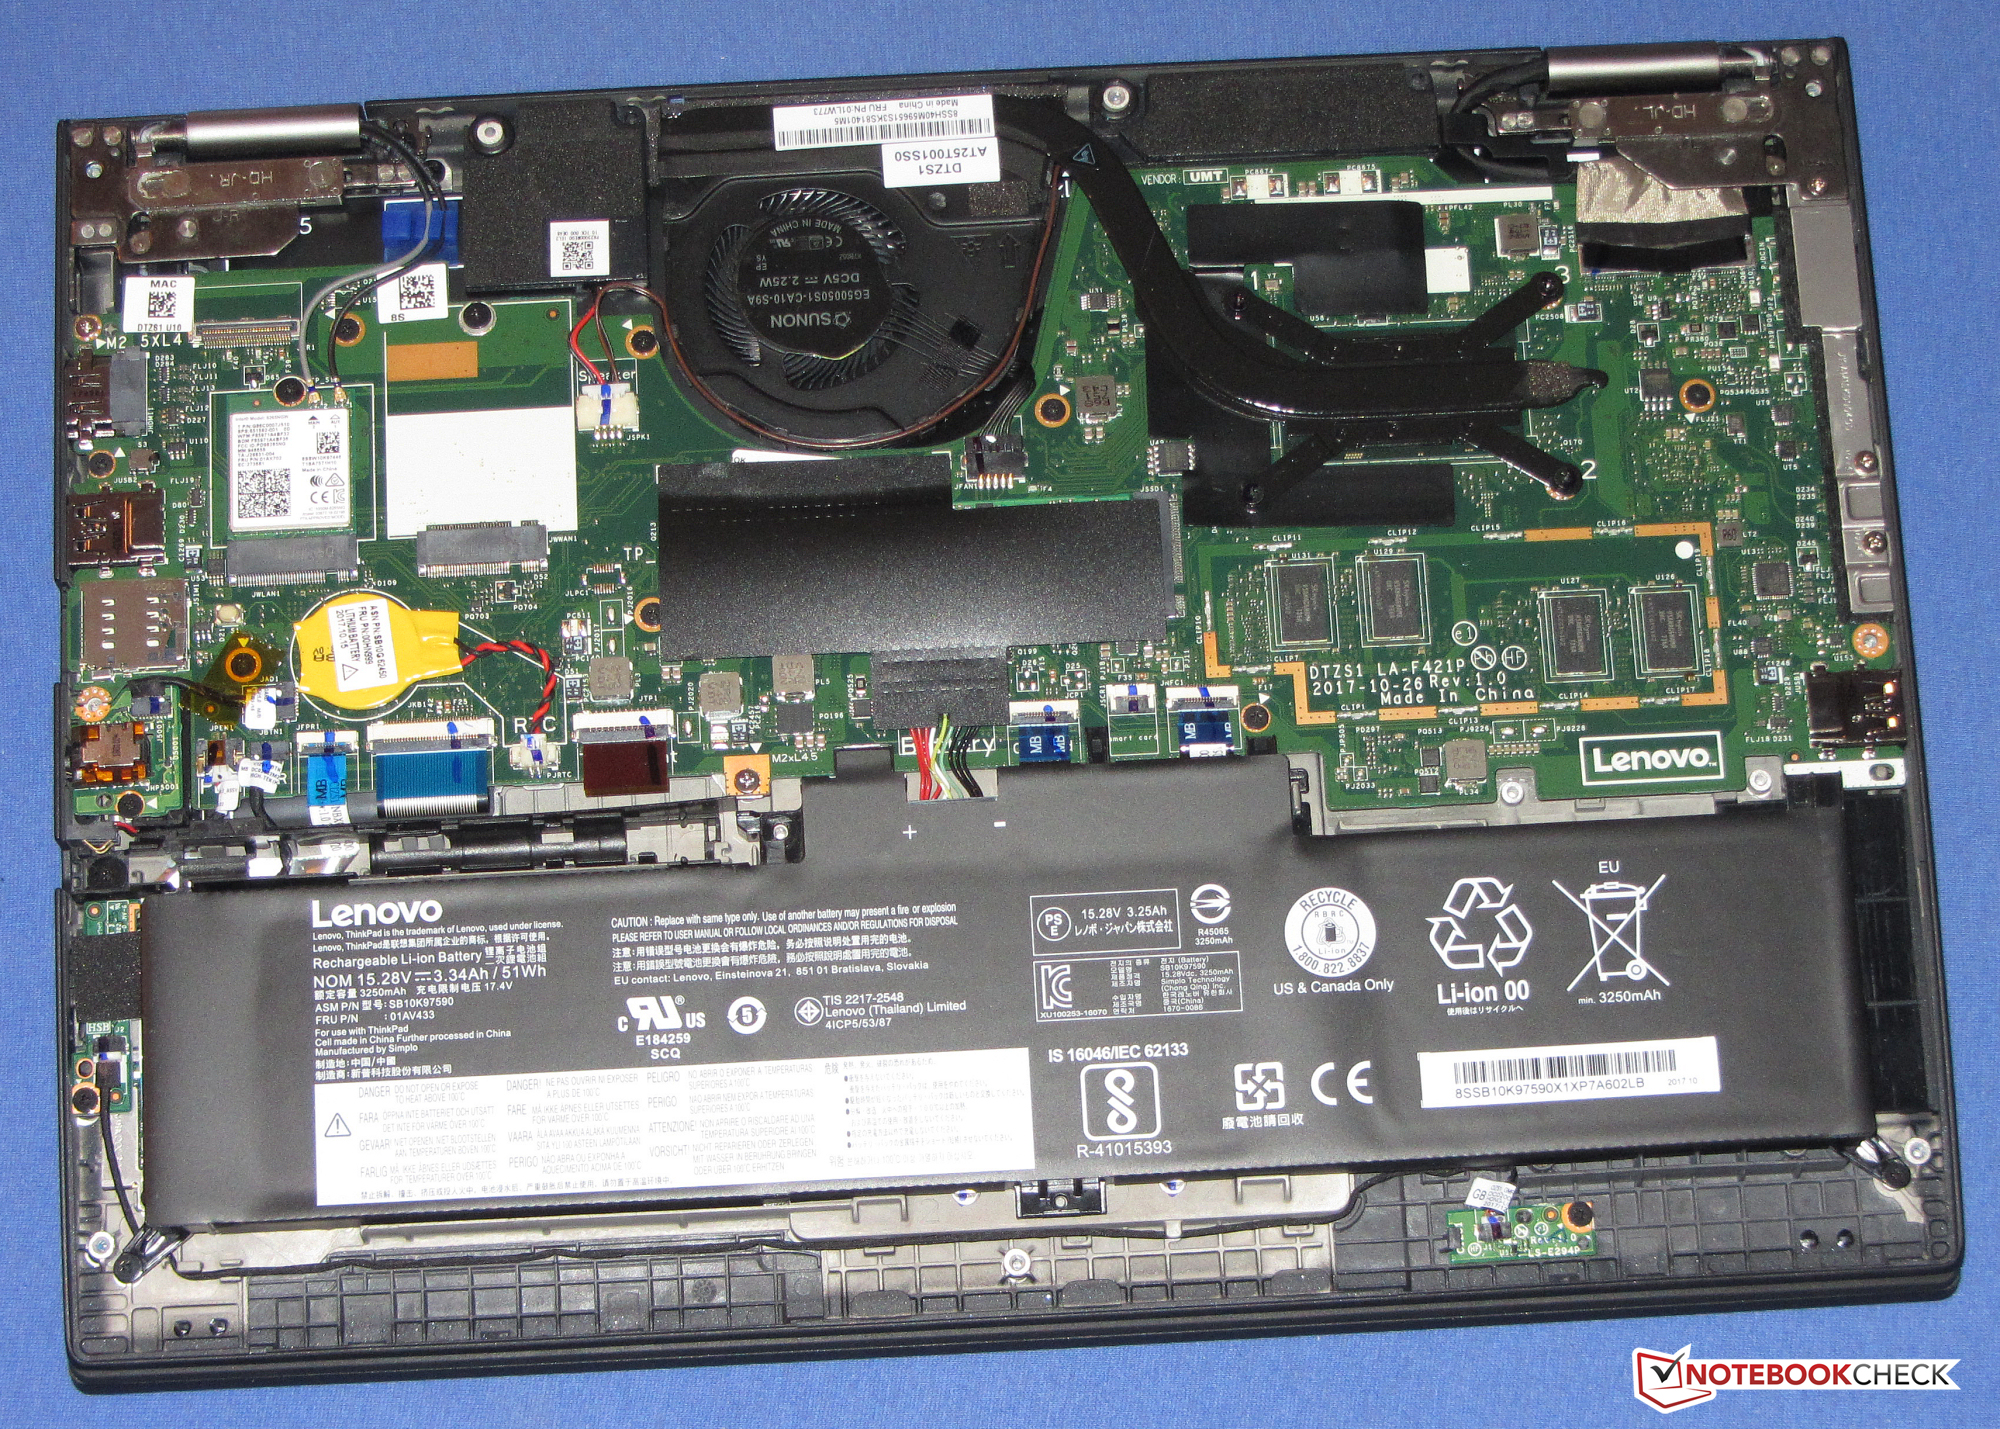
En väldigt snabb NVMe SSD resulterar i ett väldigt responsivt system. SSD-enheten kan bytas ut. För att göra det behöver du öppna upp höljet, men detta borde inte vara ett problem. När höljet väl är öppet har du tillgång till platsen för ett LTE-modem. En SIM-kortsplats finns också. Men att faktiskt installera ett LTE-modem är uteslutet då vår recensionsenhet saknar WWAN-antenner.
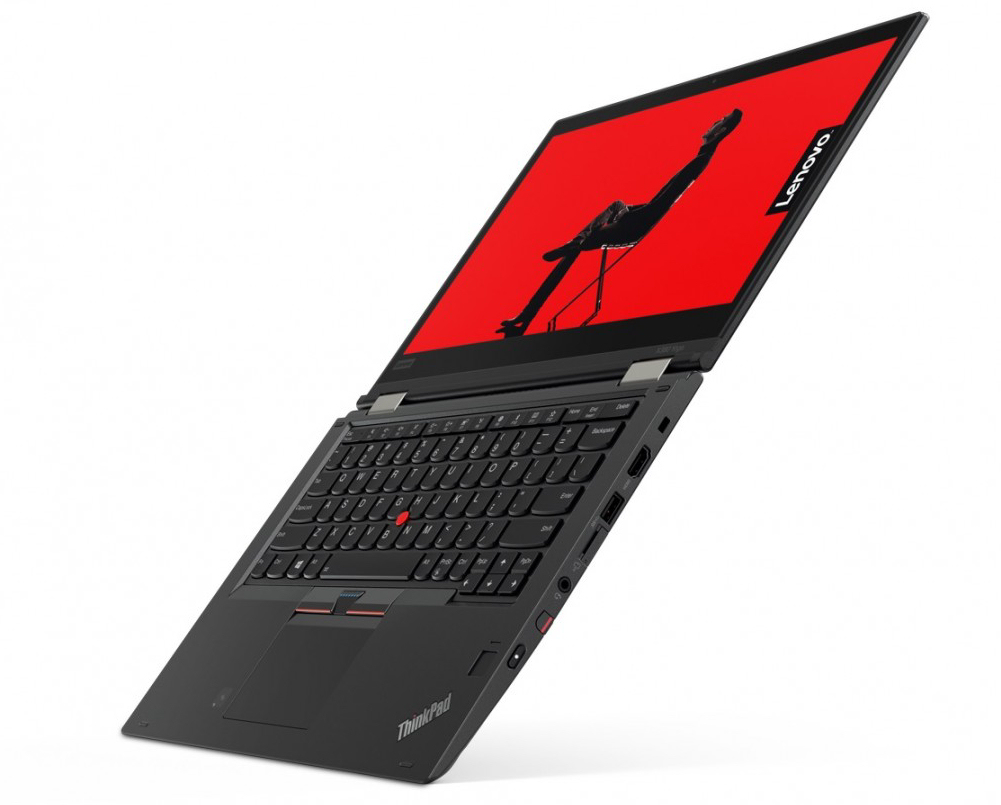
Det bakgrundsbelysta tangentbordet lämnade ett gott intryck. Vi är inte förvånade: vi känner redan till det här tangentbordet från ThinkPad Yoga 370. Vidare så måste vi nämna den bra batteritiden. Vi förväntar oss dock inte att se PWM-flimmer på en enhet med en sån här prislapp.
Lenovo borde verkligen tänka om kring sin ettåriga garantipolicy. Det är uppenbart att grosshandlare förhandlar om sina egna villkor för support. Men detta hjälper inte slutkonsumenten alls. ThinkPad X380 Yoga-modellerna som säljs i butik eller online borde, åtminstone, komma med tre års garanti. Prislappen på denna omvandlingsbara och dom syften som Lenovo påstår att enheten är till för kräver en sådan garanti.
Lenovo ThinkPad X380 Yoga 20LJS02W00
- 03/09/2018 v6 (old)
Sascha Mölck