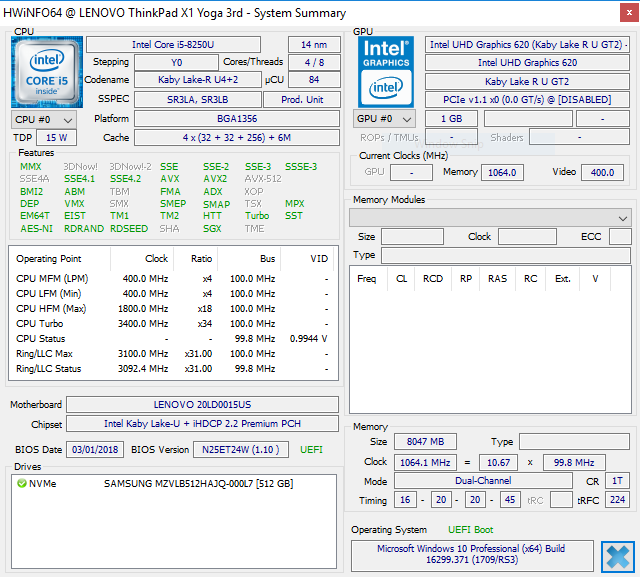
Test: Lenovo ThinkPad X1 Yoga 2018 (Core i5-8250U, FHD) Omvandlingsbar (Sammanfattning)
| |||||||||||||||||||||||||
Distribution av ljusstyrkan: 75 %
Mitt på batteriet: 267.2 cd/m²
Kontrast: 990:1 (Svärta: 0.27 cd/m²)
ΔE ColorChecker Calman: 3.5 | ∀{0.5-29.43 Ø4.72}
calibrated: 3.81
ΔE Greyscale Calman: 1.3 | ∀{0.09-98 Ø4.97}
86% sRGB (Argyll 1.6.3 3D)
56% AdobeRGB 1998 (Argyll 1.6.3 3D)
61.9% AdobeRGB 1998 (Argyll 3D)
86.4% sRGB (Argyll 3D)
60.9% Display P3 (Argyll 3D)
Gamma: 2.146
CCT: 6523 K
| Lenovo ThinkPad X1 Yoga 2018-20LD0015US Lenovo LEN40A9, IPS, 14", 1920x1080 | Lenovo ThinkPad X1 Yoga 2018-20LES01W00 Lenovo 40AE / B140QAN02.0, IPS Dolby Vision HDR, 14", 2560x1440 | Lenovo Yoga 920-13IKB-80Y7 AU Optronics B139HAN03.0, IPS, 13.9", 1920x1080 | Dell XPS 13-9365 2-in-1 IPS, 13.3", 1920x1080 | HP EliteBook x360 1030 G2 CMN1374, IPS, 13.3", 1920x1080 | Microsoft Surface Pro (2017) i5 LG Display LP123WQ112604, IPS, 12.3", 2736x1824 | Asus ZenBook Flip 14 UX461UA BOE NV140FHM-N62, IPS, 14", 1920x1080 | |
|---|---|---|---|---|---|---|---|
| Display | 40% | 4% | -20% | 5% | 13% | 1% | |
| Display P3 Coverage (%) | 60.9 | 86.5 42% | 62.5 3% | 47.32 -22% | 65.5 8% | 67.6 11% | 64.4 6% |
| sRGB Coverage (%) | 86.4 | 100 16% | 91.7 6% | 71.1 -18% | 88.8 3% | 99 15% | 84.6 -2% |
| AdobeRGB 1998 Coverage (%) | 61.9 | 99.4 61% | 64.1 4% | 48.83 -21% | 64.9 5% | 69.1 12% | 61.8 0% |
| Response Times | -12% | -12% | -17% | -16% | -3% | -12% | |
| Response Time Grey 50% / Grey 80% * (ms) | 40.4 ? | 56.8 ? -41% | 46 ? -14% | 48 ? -19% | 55.2 ? -37% | 42 ? -4% | 44 ? -9% |
| Response Time Black / White * (ms) | 28.8 ? | 24 ? 17% | 31.6 ? -10% | 32.8 ? -14% | 27.2 ? 6% | 29 ? -1% | 33 ? -15% |
| PWM Frequency (Hz) | 1042 ? | 21000 | 200 ? | ||||
| Screen | 18% | -57% | -57% | -44% | 13% | -33% | |
| Brightness middle (cd/m²) | 267.2 | 562 110% | 297.9 11% | 322.6 21% | 262 -2% | 417 56% | 302 13% |
| Brightness (cd/m²) | 239 | 522 118% | 278 16% | 306 28% | 256 7% | 401 68% | 288 21% |
| Brightness Distribution (%) | 75 | 86 15% | 81 8% | 91 21% | 83 11% | 88 17% | 90 20% |
| Black Level * (cd/m²) | 0.27 | 0.3 -11% | 0.44 -63% | 0.19 30% | 0.25 7% | 0.29 -7% | 0.57 -111% |
| Contrast (:1) | 990 | 1873 89% | 677 -32% | 1698 72% | 1048 6% | 1438 45% | 530 -46% |
| Colorchecker dE 2000 * | 3.5 | 2.8 20% | 5.1 -46% | 7.7 -120% | 5.13 -47% | 3.63 -4% | 5.17 -48% |
| Colorchecker dE 2000 max. * | 6.4 | 5.8 9% | 11 -72% | 11.1 -73% | 9.46 -48% | 6.74 -5% | 7.68 -20% |
| Colorchecker dE 2000 calibrated * | 3.81 | ||||||
| Greyscale dE 2000 * | 1.3 | 4.5 -246% | 6.7 -415% | 7.9 -508% | 6.23 -379% | 2.18 -68% | 3.26 -151% |
| Gamma | 2.146 103% | 2.16 102% | 2.9 76% | 2.88 76% | 2.45 90% | 3.09 71% | 2.45 90% |
| CCT | 6523 100% | 7205 90% | 6839 95% | 7044 92% | 6413 101% | 6767 96% | 7142 91% |
| Color Space (Percent of AdobeRGB 1998) (%) | 56 | 88.9 59% | 64.1 14% | 44.1 -21% | 57.84 3% | 63 13% | 55 -2% |
| Color Space (Percent of sRGB) (%) | 86 | 100 16% | 91.7 7% | 69.9 -19% | 88.57 3% | 99 15% | 85 -1% |
| Totalt genomsnitt (program/inställningar) | 15% /
18% | -22% /
-39% | -31% /
-44% | -18% /
-30% | 8% /
11% | -15% /
-23% |
* ... mindre är bättre
Visa svarstider
| ↔ Svarstid svart till vitt | ||
|---|---|---|
| 28.8 ms ... stiga ↗ och falla ↘ kombinerat | ↗ 17.2 ms stiga | 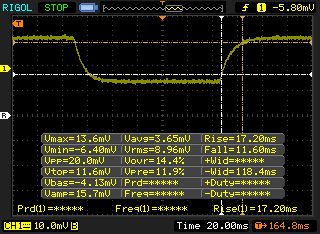 |
| ↘ 11.6 ms hösten | ||
| Skärmen visar relativt långsamma svarsfrekvenser i våra tester och kan vara för långsam för spelare. I jämförelse sträcker sig alla testade enheter från 0.1 (minst) till 240 (maximalt) ms. » 76 % av alla enheter är bättre. Detta innebär att den uppmätta svarstiden är sämre än genomsnittet av alla testade enheter (19.8 ms). | ||
| ↔ Svarstid 50 % grått till 80 % grått | ||
| 40.4 ms ... stiga ↗ och falla ↘ kombinerat | ↗ 22.4 ms stiga | 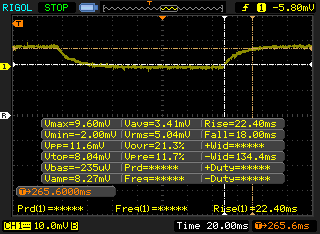 |
| ↘ 18 ms hösten | ||
| Skärmen visar långsamma svarsfrekvenser i våra tester och kommer att vara otillfredsställande för spelare. I jämförelse sträcker sig alla testade enheter från 0.165 (minst) till 636 (maximalt) ms. » 63 % av alla enheter är bättre. Detta innebär att den uppmätta svarstiden är sämre än genomsnittet av alla testade enheter (31 ms). | ||
Skärmflimmer / PWM (Puls-Width Modulation)
| Skärmflimmer / PWM upptäcktes inte | 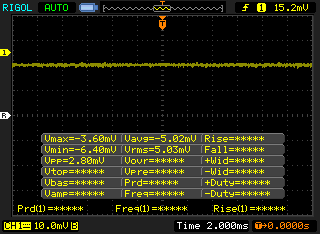 | ||
Som jämförelse: 52 % av alla testade enheter använder inte PWM för att dämpa skärmen. Om PWM upptäcktes mättes ett medelvärde av 7778 (minst: 5 - maximum: 343500) Hz. | |||
* ... mindre är bättre
| PCMark 8 Home Score Accelerated v2 | 3946 poäng | |
| PCMark 8 Creative Score Accelerated v2 | 4879 poäng | |
| PCMark 8 Work Score Accelerated v2 | 4823 poäng | |
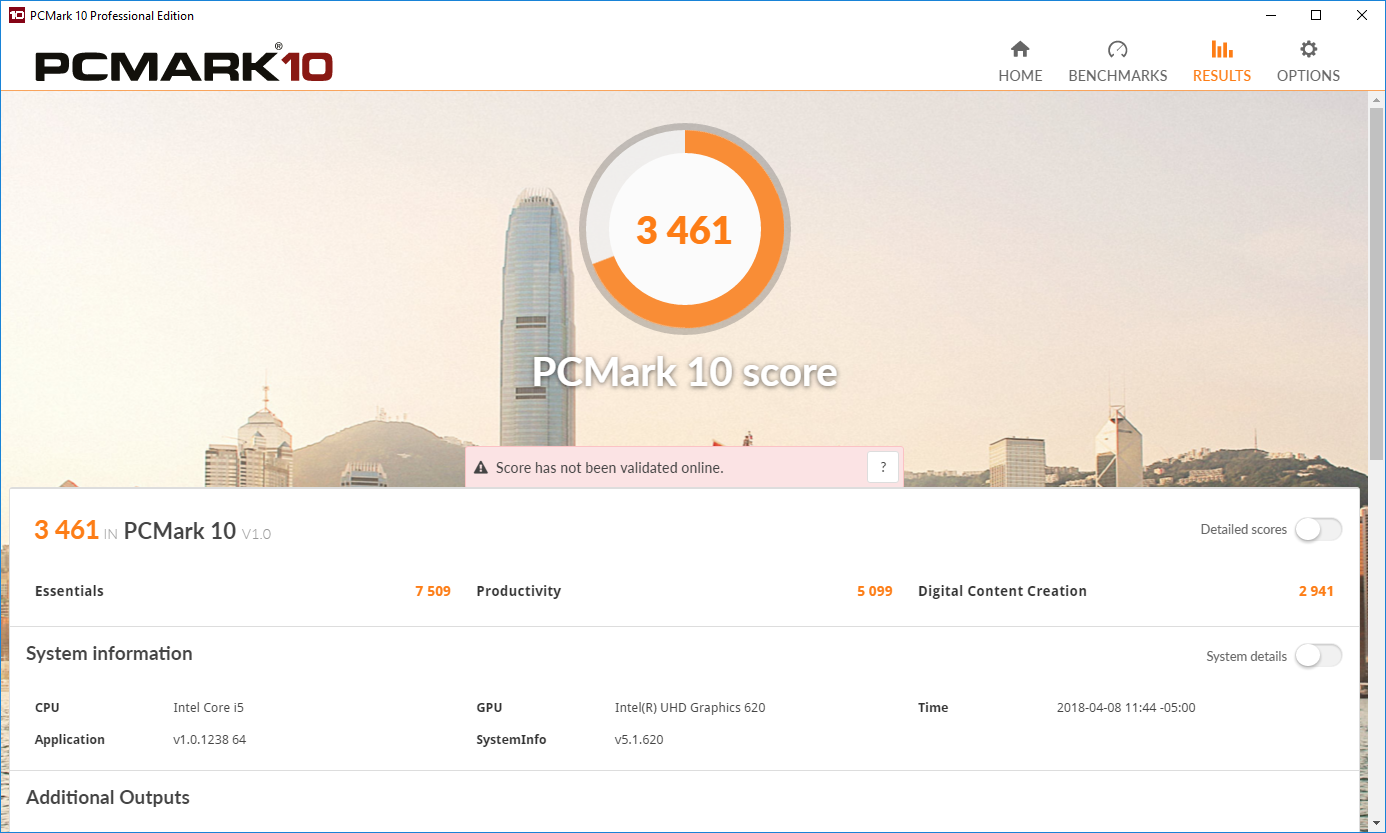
| PCMark 10 Score | 3461 poäng | |
Hjälp | ||
| Lenovo ThinkPad X1 Yoga 2018-20LD0015US Samsung SSD PM981 MZVLB512HAJQ | Lenovo Yoga 920-13IKB-80Y7 Samsung PM961 MZVLW256HEHP | Dell XPS 13-9365 2-in-1 Toshiba NVMe THNSN5256GPUK | HP EliteBook x360 1030 G2 Sandisk SD8TN8U-256G-1006 | Microsoft Surface Pro (2017) i5 Samsung PM971 KUS030202M | Asus ZenBook Flip 14 UX461UA SanDisk SD8SN8U256G1002 | Genomsnitt Samsung SSD PM981 MZVLB512HAJQ | |
|---|---|---|---|---|---|---|---|
| AS SSD | -6% | -29% | -86% | -6942% | -81% | 13% | |
| Copy Game MB/s (MB/s) | 607 | 319.2 -47% | 726 20% | 178.5 -71% | 389 -36% | 186.1 -69% | 1057 ? 74% |
| Copy Program MB/s (MB/s) | 233.5 | 463.3 98% | 263.8 13% | 110.6 -53% | 141 -40% | 118.6 -49% | 454 ? 94% |
| Copy ISO MB/s (MB/s) | 917 | 1341 46% | 950 4% | 255.9 -72% | 572 -38% | 324.1 -65% | 1755 ? 91% |
| Score Total (Points) | 3594 | 2536 -29% | 1495 -58% | 736 -80% | 908 -75% | 3966 ? 10% | |
| Score Write (Points) | 1359 | 608 -55% | 375 -72% | 194 -86% | 236 -83% | 1780 ? 31% | |
| Score Read (Points) | 1487 | 1316 -11% | 752 -49% | 362 -76% | 441 -70% | 1451 ? -2% | |
| Access Time Write * (ms) | 0.037 | 0.028 24% | 0.037 -0% | 0.075 -103% | 23 -62062% | 0.086 -132% | 0.08337 ? -125% |
| Access Time Read * (ms) | 0.043 | 0.044 -2% | 0.045 -5% | 0.143 -233% | 0.071 -65% | 0.123 -186% | 0.05092 ? -18% |
| 4K-64 Write (MB/s) | 1072 | 391.3 -63% | 204.7 -81% | 120.9 -89% | 75 -93% | 146.4 -86% | 1504 ? 40% |
| 4K-64 Read (MB/s) | 1216 | 1039 -15% | 586 -52% | 286.2 -76% | 1222 0% | 368.3 -70% | 1203 ? -1% |
| 4K Write (MB/s) | 102.3 | 128.1 25% | 96.9 -5% | 52.6 -49% | 50.7 -50% | 112 ? 9% | |
| 4K Read (MB/s) | 49.11 | 48.46 -1% | 37.69 -23% | 27.37 -44% | 26.93 -45% | 50.5 ? 3% | |
| Seq Write (MB/s) | 1840 | 885 -52% | 735 -60% | 201.9 -89% | 156.7 -91% | 388.2 -79% | 1637 ? -11% |
| Seq Read (MB/s) | 2218 | 2282 3% | 1283 -42% | 486.9 -78% | 1037 -53% | 459.9 -79% | 1976 ? -11% |
* ... mindre är bättre

| 3DMark 06 Standard Score | 12344 poäng | |
| 3DMark 11 Performance | 2040 poäng | |
| 3DMark Cloud Gate Standard Score | 9206 poäng | |
| 3DMark Fire Strike Score | 1119 poäng | |
Hjälp | ||
| låg | med. | hög | ultra | |
|---|---|---|---|---|
| BioShock Infinite (2013) | 56 | 35 | 30 | 10 |
| Civilization 6 (2016) | 37 | 16 | 7 | 6 |
| Farming Simulator 17 (2016) | 65 | 44 | 25 | 10 |
Ljudnivå
| Låg belastning |
| 27.8 / 27.8 / 27.8 dB(A) |
| Hög belastning |
| 33.9 / 39.9 dB(A) |
 | ||
30 dB tyst 40 dB(A) hörbar 50 dB(A) högt ljud |
||
min: | ||
| Lenovo ThinkPad X1 Yoga 2018-20LD0015US UHD Graphics 620, i5-8250U, Samsung SSD PM981 MZVLB512HAJQ | Lenovo ThinkPad X1 Yoga 2018-20LES01W00 UHD Graphics 620, i5-8550U, Samsung SSD PM981 MZVLB512HAJQ | Lenovo Yoga 920-13IKB-80Y7 UHD Graphics 620, i5-8550U, Samsung PM961 MZVLW256HEHP | HP EliteBook x360 1030 G2 HD Graphics 620, i5-7300U, Sandisk SD8TN8U-256G-1006 | Asus ZenBook Flip 14 UX461UA UHD Graphics 620, i5-8250U, SanDisk SD8SN8U256G1002 | |
|---|---|---|---|---|---|
| Noise | -6% | -1% | -1% | -4% | |
| av / miljö * (dB) | 27.8 | 29.1 -5% | 28 -1% | 29 -4% | 30.4 -9% |
| Idle Minimum * (dB) | 27.8 | 29.1 -5% | 28 -1% | 29 -4% | 30.4 -9% |
| Idle Average * (dB) | 27.8 | 29.1 -5% | 28.8 -4% | 29 -4% | 30.4 -9% |
| Idle Maximum * (dB) | 27.8 | 31.3 -13% | 30.3 -9% | 29 -4% | 32 -15% |
| Load Average * (dB) | 33.9 | 37.6 -11% | 34.5 -2% | 33.6 1% | 31.7 6% |
| Load Maximum * (dB) | 39.9 | 37.6 6% | 34.3 14% | 35.8 10% | 35.9 10% |
* ... mindre är bättre
(±) Den maximala temperaturen på ovansidan är 43 °C / 109 F, jämfört med genomsnittet av 35.4 °C / 96 F , allt från 19.6 till 60 °C för klassen Convertible.
(-) Botten värms upp till maximalt 47.4 °C / 117 F, jämfört med genomsnittet av 36.9 °C / 98 F
(+) Vid tomgångsbruk är medeltemperaturen för ovansidan 22.8 °C / 73 F, jämfört med enhetsgenomsnittet på 30.3 °C / ### class_avg_f### F.
(+) Handledsstöden och pekplattan är kallare än hudtemperaturen med maximalt 26 °C / 78.8 F och är därför svala att ta på.
(±) Medeltemperaturen för handledsstödsområdet på liknande enheter var 28 °C / 82.4 F (+2 °C / 3.6 F).
Lenovo ThinkPad X1 Yoga 2018-20LD0015US ljudanalys
(±) | högtalarljudstyrkan är genomsnittlig men bra (72.9 dB)
Bas 100 - 315 Hz
(-) | nästan ingen bas - i genomsnitt 15.2% lägre än medianen
(±) | linjäriteten för basen är genomsnittlig (14.1% delta till föregående frekvens)
Mellan 400 - 2000 Hz
(+) | balanserad mellan - endast 3.9% från medianen
(±) | linjäriteten för mids är genomsnittlig (9.4% delta till föregående frekvens)
Högsta 2 - 16 kHz
(+) | balanserade toppar - endast 2.3% från medianen
(±) | linjäriteten för toppar är genomsnittlig (9.9% delta till föregående frekvens)
Totalt 100 - 16 000 Hz
(±) | linjäriteten för det totala ljudet är genomsnittlig (19% skillnad mot median)
Jämfört med samma klass
» 45% av alla testade enheter i den här klassen var bättre, 7% liknande, 48% sämre
» Den bästa hade ett delta på 6%, genomsnittet var 20%, sämst var 57%
Jämfört med alla testade enheter
» 45% av alla testade enheter var bättre, 7% liknande, 48% sämre
» Den bästa hade ett delta på 4%, genomsnittet var 24%, sämst var 134%
HP EliteBook x360 1030 G2 ljudanalys
(+) | högtalare kan spela relativt högt (86.3 dB)
Analysis not possible as minimum curve is missing or too high
| Av/Standby | |
| Låg belastning | |
| Hög belastning |
|
Förklaring:
min: | |
| Lenovo ThinkPad X1 Yoga 2018-20LD0015US i5-8250U, UHD Graphics 620, Samsung SSD PM981 MZVLB512HAJQ, IPS, 1920x1080, 14" | Lenovo ThinkPad X1 Yoga 2018-20LES01W00 i5-8550U, UHD Graphics 620, Samsung SSD PM981 MZVLB512HAJQ, IPS Dolby Vision HDR, 2560x1440, 14" | Lenovo Yoga 920-13IKB-80Y7 i5-8550U, UHD Graphics 620, Samsung PM961 MZVLW256HEHP, IPS, 1920x1080, 13.9" | Dell XPS 13-9365 2-in-1 i7-7Y75, HD Graphics 615, Toshiba NVMe THNSN5256GPUK, IPS, 1920x1080, 13.3" | HP EliteBook x360 1030 G2 i5-7300U, HD Graphics 620, Sandisk SD8TN8U-256G-1006, IPS, 1920x1080, 13.3" | Microsoft Surface Pro (2017) i5 i5-7300U, HD Graphics 620, Samsung PM971 KUS030202M, IPS, 2736x1824, 12.3" | Asus ZenBook Flip 14 UX461UA i5-8250U, UHD Graphics 620, SanDisk SD8SN8U256G1002, IPS, 1920x1080, 14" | |
|---|---|---|---|---|---|---|---|
| Power Consumption | -37% | 7% | 30% | 12% | 2% | -2% | |
| Idle Minimum * (Watt) | 3 | 3.4 -13% | 3.1 -3% | 3.1 -3% | 3.2 -7% | 3.6 -20% | 3.3 -10% |
| Idle Average * (Watt) | 5.4 | 8.8 -63% | 6.6 -22% | 4.3 20% | 5.5 -2% | 8.1 -50% | 6.3 -17% |
| Idle Maximum * (Watt) | 7.5 | 11.9 -59% | 7 7% | 4.9 35% | 6.5 13% | 8.7 -16% | 11 -47% |
| Load Average * (Watt) | 40.1 | 50.4 -26% | 35.2 12% | 24.3 39% | 29.7 26% | 25.5 36% | 30 25% |
| Load Maximum * (Watt) | 57.1 | 71.2 -25% | 34.6 39% | 22.8 60% | 41.3 28% | 23.5 59% | 35.4 38% |
* ... mindre är bättre
| Lenovo ThinkPad X1 Yoga 2018-20LD0015US i5-8250U, UHD Graphics 620, 54 Wh | Lenovo ThinkPad X1 Yoga 2018-20LES01W00 i5-8550U, UHD Graphics 620, 54 Wh | Lenovo Yoga 920-13IKB-80Y7 i5-8550U, UHD Graphics 620, 70 Wh | Dell XPS 13-9365 2-in-1 i7-7Y75, HD Graphics 615, 46 Wh | HP EliteBook x360 1030 G2 i5-7300U, HD Graphics 620, 57 Wh | Microsoft Surface Pro (2017) i5 i5-7300U, HD Graphics 620, 45 Wh | Asus ZenBook Flip 14 UX461UA i5-8250U, UHD Graphics 620, 57 Wh | |
|---|---|---|---|---|---|---|---|
| Batteridrifttid | -19% | 14% | 4% | 29% | 8% | -10% | |
| Reader / Idle (h) | 20.3 | 20.1 -1% | 27.6 36% | 16.2 -20% | 23.1 14% | 17.6 -13% | 18.9 -7% |
| WiFi v1.3 (h) | 10.9 | 8.6 -21% | 11.4 5% | 11.4 5% | 10.5 -4% | 12.4 14% | 9.4 -14% |
| Load (h) | 2.3 | 1.5 -35% | 2.3 0% | 2.9 26% | 4.1 78% | 2.8 22% | 2.1 -9% |
För
Emot
Läs den fullständiga versionen av den här recensionen på engelska här.
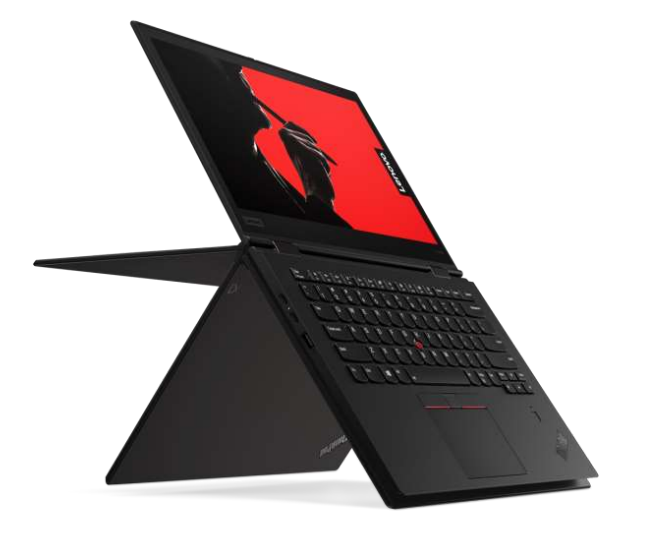
Vi framhöll Core i7 HDR-varianten av 2018 års modell av X1 Yoga som ett lysande exempel. Vi lovordade dess välbyggda chassi, bra prestanda och tysta drift men hade problem med dess höga pris. För ca 20 000 kronor kan den modellen av X1 Yoga vara över många användares prisnivå. För 5 000 kronor mindre är Core i5 FHD-modellen bättre för budgeten samtidigt som den behåller dom flesta trevligheterna som finns hos den dyrare modellen.
Prestandaskillnaden mellan Core i5-8250U och Core i7-8550U är försumbar. På så sätt kommer användaren inte märka någon nämnvärd skillnad genom att byta ner CPU:n. Snarare än att investera i en aningen snabbare processor så borde intresserade köpare lägga pengarna på HDR WQHD-skärmen, som kostar runt 1 500 kronor mer. Den dyrare panelen dubblerar ljusstyrkan och har en nästan omatchad kontrast och färgåtergivning. Den bästa konfigurationen som finns är en kombination av Core i5-8250U och WQHD HDR-skärmen.
Core i5-varianten av X1 Yoga behåller dom bästa delarna från sitt dyrare syskon samtidigt som den håller kostnaden nere. För 5 000 kronor mindre erbjuder Core i5 FHD X1 Yoga likvärdig prestanda insvept i samma utmärkta chassi. Om du letar efter en omvandlingsbar i företagsklass och kan tänka dig avstå en ökning på 5% i prestanda i utbyte mot HDR-skärmen så är det här maskinen att skaffa.
Lenovo ThinkPad X1 Yoga 2018-20LD0015US
- 04/15/2018 v6 (old)
Sam Medley
Price comparison
