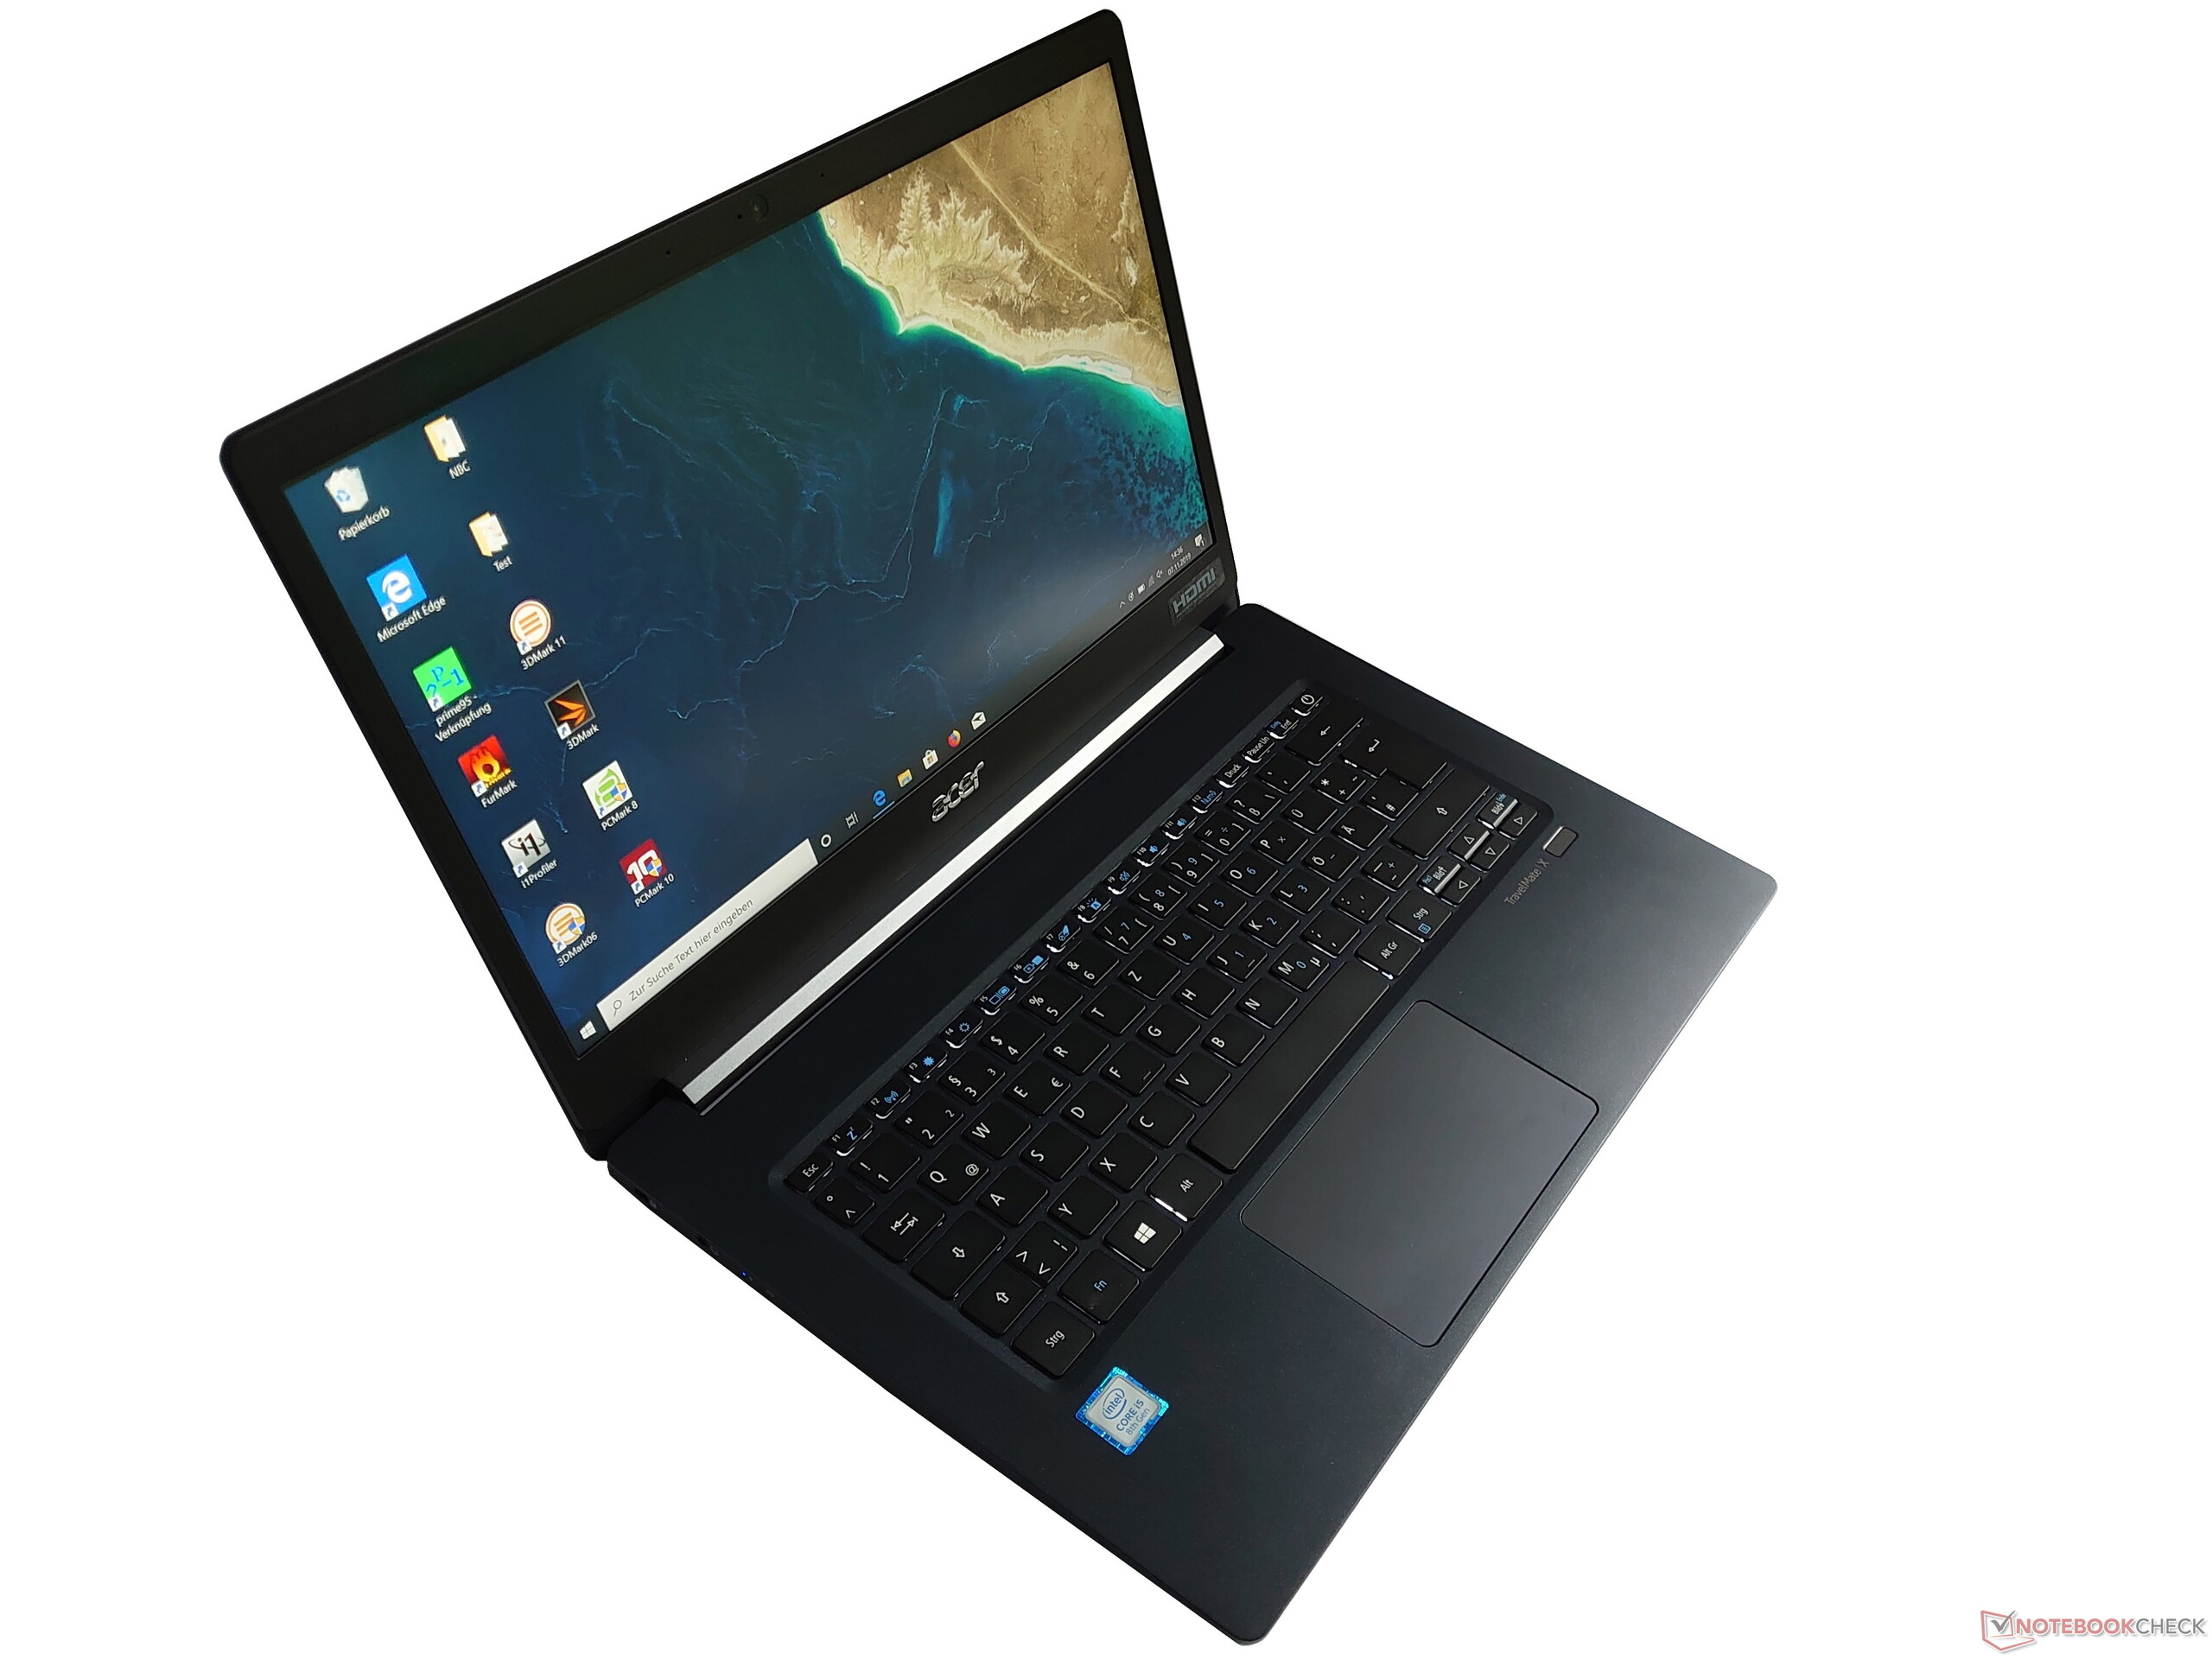
Test: Acer TravelMate X514 - En liten 14-tumsmaskin för proffs (Sammanfattning)
Gradering | Datum | Modell | Vikt | Höjd | Storlek | Upplösning | Pris |
|---|---|---|---|---|---|---|---|
| 83.9 % v7 (old) | 11/2019 | Acer TravelMate X514-51-511Q i5-8265U, UHD Graphics 620 | 980 g | 15 mm | 14.00" | 1920x1080 | |
| 88.4 % v7 (old) | 10/2019 | Lenovo ThinkPad T495s-20QKS01E00 R7 PRO 3700U, Vega 10 | 1.3 kg | 16.1 mm | 14.00" | 1920x1080 | |
| 86.2 % v6 (old) | 06/2019 | Acer Swift 3 SF314-55G-768V i7-8565U, GeForce MX250 | 1.5 kg | 14.9 mm | 14.00" | 1920x1080 | |
| 84.6 % v6 (old) | Asus VivoBook 14 F412FJ-EB084T i5-8265U, GeForce MX230 | 1.5 kg | 19 mm | 14.00" | 1920x1080 | ||
| 84.8 % v6 (old) | 04/2019 | Dell Latitude 14 5495 R7 2700U, Vega 10 | 1.7 kg | 22.45 mm | 14.00" | 1920x1080 |


| Networking | |
| iperf3 transmit AX12 | |
| Asus VivoBook 14 F412FJ-EB084T | |
| Lenovo ThinkPad T495s-20QKS01E00 | |
| Acer TravelMate X514-51-511Q | |
| Acer Swift 3 SF314-55G-768V | |
| Dell Latitude 14 5495 | |
| iperf3 receive AX12 | |
| Lenovo ThinkPad T495s-20QKS01E00 | |
| Asus VivoBook 14 F412FJ-EB084T | |
| Acer Swift 3 SF314-55G-768V | |
| Acer TravelMate X514-51-511Q | |
| Dell Latitude 14 5495 | |
| |||||||||||||||||||||||||
Distribution av ljusstyrkan: 82 %
Mitt på batteriet: 288 cd/m²
Kontrast: 1372:1 (Svärta: 0.215 cd/m²)
ΔE ColorChecker Calman: 2.6 | ∀{0.5-29.43 Ø4.72}
ΔE Greyscale Calman: 3.4 | ∀{0.09-98 Ø4.97}
99% sRGB (Argyll 1.6.3 3D)
63% AdobeRGB 1998 (Argyll 1.6.3 3D)
68.6% AdobeRGB 1998 (Argyll 3D)
98.9% sRGB (Argyll 3D)
67% Display P3 (Argyll 3D)
Gamma: 2.08
CCT: 7192 K
| Acer TravelMate X514-51-511Q Chi mei CMN14D5, IPS, 1920x1080, 14" | Lenovo ThinkPad T495s-20QKS01E00 B140HAN05.7, IPS, 1920x1080, 14" | Acer Swift 3 SF314-55G-768V Chi Mei CMN14D5, IPS, 1920x1080, 14" | Asus VivoBook 14 F412FJ-EB084T AU Optronics AUO403D B140HAN04.0, IPS, 1920x1080, 14" | Dell Latitude 14 5495 CMN14C9, IPS LED, 1920x1080, 14" | |
|---|---|---|---|---|---|
| Display | -1% | 0% | -40% | -38% | |
| Display P3 Coverage (%) | 67 | 67 0% | 67.3 0% | 39.71 -41% | 40.94 -39% |
| sRGB Coverage (%) | 98.9 | 96.8 -2% | 98.9 0% | 59.6 -40% | 61.4 -38% |
| AdobeRGB 1998 Coverage (%) | 68.6 | 68.3 0% | 69.5 1% | 41.04 -40% | 42.32 -38% |
| Response Times | -46% | -2% | -4% | -7% | |
| Response Time Grey 50% / Grey 80% * (ms) | 40 ? | 60.8 ? -52% | 40 ? -0% | 40 ? -0% | 41 ? -2% |
| Response Time Black / White * (ms) | 27 ? | 37.6 ? -39% | 28 ? -4% | 29 ? -7% | 30 ? -11% |
| PWM Frequency (Hz) | 250 ? | 250 | 25000 ? | ||
| Screen | 1% | -14% | -12% | -27% | |
| Brightness middle (cd/m²) | 295 | 380 29% | 323 9% | 267 -9% | 212 -28% |
| Brightness (cd/m²) | 276 | 381 38% | 299 8% | 257 -7% | 200 -28% |
| Brightness Distribution (%) | 82 | 87 6% | 87 6% | 91 11% | 89 9% |
| Black Level * (cd/m²) | 0.215 | 0.22 -2% | 0.35 -63% | 0.2 7% | 0.23 -7% |
| Contrast (:1) | 1372 | 1727 26% | 923 -33% | 1335 -3% | 922 -33% |
| Colorchecker dE 2000 * | 2.6 | 4 -54% | 3.13 -20% | 3.79 -46% | 4.34 -67% |
| Colorchecker dE 2000 max. * | 5.6 | 5.7 -2% | 6.96 -24% | 8.18 -46% | 9.01 -61% |
| Greyscale dE 2000 * | 3.4 | 4.4 -29% | 4.32 -27% | 1.49 56% | 2.81 17% |
| Gamma | 2.08 106% | 2.54 87% | 2.29 96% | 2.48 89% | 2.22 99% |
| CCT | 7192 90% | 6963 93% | 7436 87% | 6659 98% | 6286 103% |
| Color Space (Percent of AdobeRGB 1998) (%) | 63 | 62.2 -1% | 64 2% | 38 -40% | 39 -38% |
| Color Space (Percent of sRGB) (%) | 99 | 96.6 -2% | 99 0% | 59 -40% | 61 -38% |
| Colorchecker dE 2000 calibrated * | 1.2 | 0.9 | 4.71 | ||
| Totalt genomsnitt (program/inställningar) | -15% /
-6% | -5% /
-10% | -19% /
-16% | -24% /
-27% |
* ... mindre är bättre
Visa svarstider
| ↔ Svarstid svart till vitt | ||
|---|---|---|
| 27 ms ... stiga ↗ och falla ↘ kombinerat | ↗ 16 ms stiga | 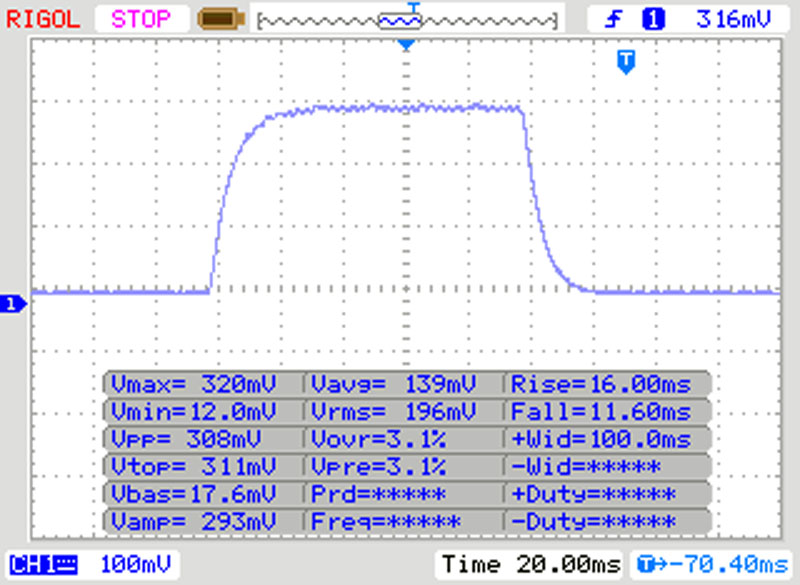 |
| ↘ 11 ms hösten | ||
| Skärmen visar relativt långsamma svarsfrekvenser i våra tester och kan vara för långsam för spelare. I jämförelse sträcker sig alla testade enheter från 0.1 (minst) till 240 (maximalt) ms. » 67 % av alla enheter är bättre. Detta innebär att den uppmätta svarstiden är sämre än genomsnittet av alla testade enheter (19.8 ms). | ||
| ↔ Svarstid 50 % grått till 80 % grått | ||
| 40 ms ... stiga ↗ och falla ↘ kombinerat | ↗ 21 ms stiga | 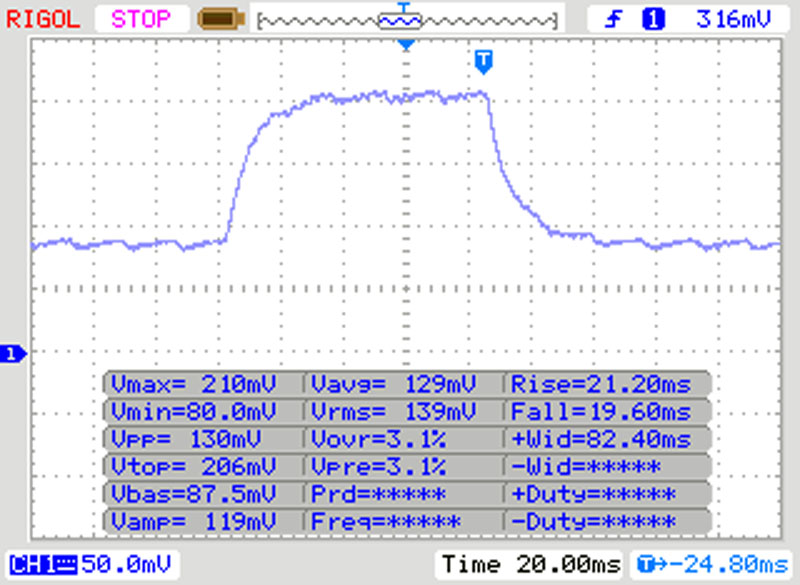 |
| ↘ 19 ms hösten | ||
| Skärmen visar långsamma svarsfrekvenser i våra tester och kommer att vara otillfredsställande för spelare. I jämförelse sträcker sig alla testade enheter från 0.165 (minst) till 636 (maximalt) ms. » 61 % av alla enheter är bättre. Detta innebär att den uppmätta svarstiden är sämre än genomsnittet av alla testade enheter (31 ms). | ||
Skärmflimmer / PWM (Puls-Width Modulation)
| Skärmflimmer / PWM upptäckt | 250 Hz | ≤ 10 % ljusstyrka inställning | 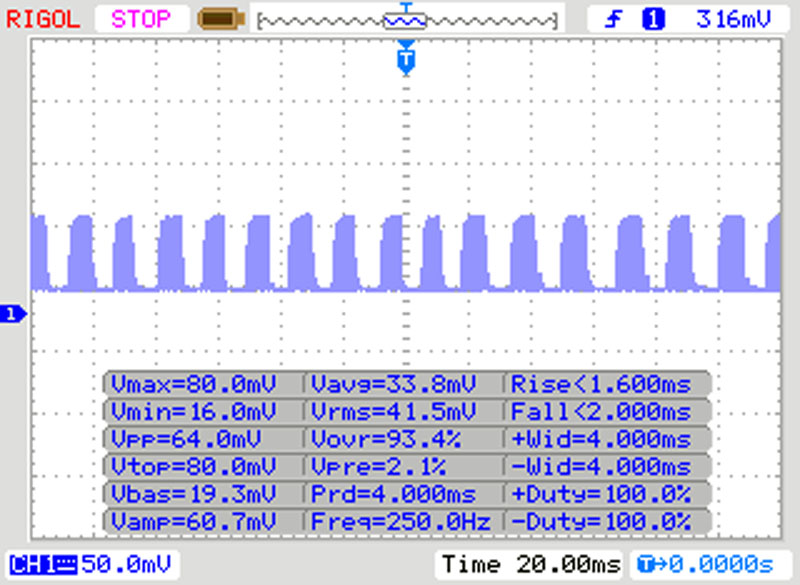 |
Displayens bakgrundsbelysning flimrar vid 250 Hz (i värsta fall, t.ex. med PWM) Flimrande upptäckt vid en ljusstyrkeinställning på 10 % och lägre. Det ska inte finnas något flimmer eller PWM över denna ljusstyrkeinställning. Frekvensen för 250 Hz är relativt låg, så känsliga användare kommer sannolikt att märka flimmer och uppleva ansträngda ögon vid den angivna ljusstyrkeinställningen och nedan. Som jämförelse: 52 % av alla testade enheter använder inte PWM för att dämpa skärmen. Om PWM upptäcktes mättes ett medelvärde av 7772 (minst: 5 - maximum: 343500) Hz. | |||
| Cinebench R15 | |
| CPU Single 64Bit | |
| Genomsnitt av klass Subnotebook (72.4 - 322, n=57, senaste 2 åren) | |
| Acer Swift 3 SF314-55G-768V | |
| Acer TravelMate X514-51-511Q | |
| Asus VivoBook 14 F412FJ-EB084T | |
| Genomsnitt Intel Core i5-8265U (111 - 164, n=35) | |
| Lenovo ThinkPad T495s-20QKS01E00 | |
| Dell Latitude 14 5495 | |
| CPU Multi 64Bit | |
| Genomsnitt av klass Subnotebook (327 - 3345, n=57, senaste 2 åren) | |
| Dell Latitude 14 5495 | |
| Lenovo ThinkPad T495s-20QKS01E00 | |
| Asus VivoBook 14 F412FJ-EB084T | |
| Genomsnitt Intel Core i5-8265U (457 - 750, n=38) | |
| Acer Swift 3 SF314-55G-768V | |
| Acer TravelMate X514-51-511Q | |
| PCMark 8 Home Score Accelerated v2 | 3170 poäng | |
| PCMark 8 Work Score Accelerated v2 | 4698 poäng | |
| PCMark 10 Score | 3725 poäng | |
Hjälp | ||
| Acer TravelMate X514-51-511Q Kingston RBUSNS8154P3256GJ1 | Lenovo ThinkPad T495s-20QKS01E00 Samsung PM981a MZVLB1T0HBLR | Acer Swift 3 SF314-55G-768V WDC PC SN520 SDAPNUW-512G | Asus VivoBook 14 F412FJ-EB084T Kingston RBU-SNS8180DS3512GJ | Dell Latitude 14 5495 Intel SSDSCKKF256G8 | Genomsnitt Kingston RBUSNS8154P3256GJ1 | |
|---|---|---|---|---|---|---|
| CrystalDiskMark 5.2 / 6 | 51% | 37% | -55% | -52% | 14% | |
| Write 4K (MB/s) | 122.3 | 142.3 16% | 185.5 52% | 55 -55% | 48.45 -60% | 141.1 ? 15% |
| Read 4K (MB/s) | 45.51 | 46.69 3% | 50.2 10% | 28.79 -37% | 25.11 -45% | 82.4 ? 81% |
| Write Seq (MB/s) | 667 | 1175 76% | 307.5 -54% | 341.2 -49% | 722 ? 8% | |
| Read Seq (MB/s) | 713 | 1132 59% | 430 -40% | 521 -27% | 974 ? 37% | |
| Write 4K Q32T1 (MB/s) | 411.8 | 268.3 -35% | 472.6 15% | 149.5 -64% | 202 -51% | 418 ? 2% |
| Read 4K Q32T1 (MB/s) | 559 | 359.6 -36% | 642 15% | 207.2 -63% | 243.5 -56% | 571 ? 2% |
| Write Seq Q32T1 (MB/s) | 892 | 3033 240% | 1453 63% | 389.2 -56% | 320.8 -64% | 717 ? -20% |
| Read Seq Q32T1 (MB/s) | 1639 | 3561 117% | 1738 6% | 497.1 -70% | 555 -66% | 1413 ? -14% |
| Write 4K Q8T8 (MB/s) | 1491 | 247.5 | 483 ? | |||
| Read 4K Q8T8 (MB/s) | 1499 | 253.4 | 684 ? | |||
| AS SSD | 93% | 42% | -139% | -73% | -20% | |
| Seq Read (MB/s) | 1222 | 2661 118% | 1438 18% | 487.6 -60% | 507 -59% | 1195 ? -2% |
| Seq Write (MB/s) | 775 | 2314 199% | 1352 74% | 392.7 -49% | 286.5 -63% | 668 ? -14% |
| 4K Read (MB/s) | 54.8 | 45.52 -17% | 47.35 -14% | 36.4 -34% | 19.76 -64% | 33.6 ? -39% |
| 4K Write (MB/s) | 114.4 | 105.3 -8% | 167.9 47% | 26.46 -77% | 34.58 -70% | 82.6 ? -28% |
| 4K-64 Read (MB/s) | 896 | 1806 102% | 1051 17% | 325.4 -64% | 238.4 -73% | 667 ? -26% |
| 4K-64 Write (MB/s) | 604 | 1650 173% | 1211 100% | 87.2 -86% | 225.2 -63% | 561 ? -7% |
| Access Time Read * (ms) | 0.04 | 0.432 | 0.128 | 0.117 ? | ||
| Access Time Write * (ms) | 0.044 | 0.041 7% | 0.03 32% | 0.4 -809% | 0.101 -130% | 0.05571 ? -27% |
| Score Read (Points) | 1073 | 2118 97% | 1242 16% | 411 -62% | 309 -71% | 820 ? -24% |
| Score Write (Points) | 796 | 1986 149% | 1514 90% | 153 -81% | 288 -64% | 710 ? -11% |
| Score Total (Points) | 2411 | 5169 114% | 3397 41% | 782 -68% | 751 -69% | 1931 ? -20% |
| Copy ISO MB/s (MB/s) | 1131 | 441.3 | 773 ? | |||
| Copy Program MB/s (MB/s) | 267.1 | 152.1 | 375 ? | |||
| Copy Game MB/s (MB/s) | 691 | 260 | 509 ? | |||
| Totalt genomsnitt (program/inställningar) | 72% /
77% | 40% /
40% | -97% /
-102% | -63% /
-64% | -3% /
-5% |
* ... mindre är bättre

| 3DMark 11 - 1280x720 Performance GPU | |
| Genomsnitt av klass Subnotebook (995 - 18489, n=55, senaste 2 åren) | |
| Lenovo ThinkPad T495s-20QKS01E00 | |
| Acer Swift 3 SF314-55G-768V | |
| Asus VivoBook 14 F412FJ-EB084T | |
| Dell Latitude 14 5495 | |
| Genomsnitt Intel UHD Graphics 620 (1144 - 3432, n=244) | |
| Acer TravelMate X514-51-511Q | |
| 3DMark | |
| 1280x720 Cloud Gate Standard Graphics | |
| Genomsnitt av klass Subnotebook (5577 - 61591, n=28, senaste 2 åren) | |
| Acer Swift 3 SF314-55G-768V | |
| Lenovo ThinkPad T495s-20QKS01E00 | |
| Asus VivoBook 14 F412FJ-EB084T | |
| Dell Latitude 14 5495 | |
| Acer TravelMate X514-51-511Q | |
| Genomsnitt Intel UHD Graphics 620 (6205 - 16400, n=225) | |
| 1920x1080 Fire Strike Graphics | |
| Genomsnitt av klass Subnotebook (832 - 16347, n=56, senaste 2 åren) | |
| Acer Swift 3 SF314-55G-768V | |
| Lenovo ThinkPad T495s-20QKS01E00 | |
| Asus VivoBook 14 F412FJ-EB084T | |
| Dell Latitude 14 5495 | |
| Genomsnitt Intel UHD Graphics 620 (557 - 2608, n=213) | |
| Acer TravelMate X514-51-511Q | |
| 2560x1440 Time Spy Graphics | |
| Genomsnitt av klass Subnotebook (804 - 6288, n=55, senaste 2 åren) | |
| Lenovo ThinkPad T495s-20QKS01E00 | |
| Asus VivoBook 14 F412FJ-EB084T | |
| Genomsnitt Intel UHD Graphics 620 (299 - 797, n=88) | |
| 3DMark 11 Performance | 1917 poäng | |
| 3DMark Cloud Gate Standard Score | 7933 poäng | |
| 3DMark Fire Strike Score | 1035 poäng | |
Hjälp | ||
| BioShock Infinite | |
| 1280x720 Very Low Preset | |
| Acer Swift 3 SF314-55G-768V | |
| Asus VivoBook 14 F412FJ-EB084T | |
| Lenovo ThinkPad T495s-20QKS01E00 | |
| Dell Latitude 14 5495 | |
| Genomsnitt Intel UHD Graphics 620 (18.3 - 90.2, n=187) | |
| Acer TravelMate X514-51-511Q | |
| 1366x768 Medium Preset | |
| Acer Swift 3 SF314-55G-768V | |
| Asus VivoBook 14 F412FJ-EB084T | |
| Acer TravelMate X514-51-511Q | |
| Genomsnitt Intel UHD Graphics 620 (11.5 - 45.5, n=187) | |
| 1366x768 High Preset | |
| Acer Swift 3 SF314-55G-768V | |
| Asus VivoBook 14 F412FJ-EB084T | |
| Acer TravelMate X514-51-511Q | |
| Genomsnitt Intel UHD Graphics 620 (8.1 - 35.9, n=187) | |
| 1920x1080 Ultra Preset, DX11 (DDOF) | |
| Acer Swift 3 SF314-55G-768V | |
| Asus VivoBook 14 F412FJ-EB084T | |
| Lenovo ThinkPad T495s-20QKS01E00 | |
| Dell Latitude 14 5495 | |
| Genomsnitt Intel UHD Graphics 620 (4.5 - 17, n=176) | |
| Acer TravelMate X514-51-511Q | |
| Anno 1800 | |
| 1280x720 Low Graphics Quality (DX11) | |
| Genomsnitt Intel UHD Graphics 620 (19.9 - 23.8, n=2) | |
| Acer TravelMate X514-51-511Q | |
| 1920x1080 Medium Graphics Quality (DX11) | |
| Genomsnitt Intel UHD Graphics 620 (5.7 - 8, n=2) | |
| Acer TravelMate X514-51-511Q | |
| låg | med. | hög | ultra | |
|---|---|---|---|---|
| BioShock Infinite (2013) | 59.9 | 34.3 | 30.26 | 8.98 |
| Dota 2 Reborn (2015) | 73.9 | 46.7 | 20 | 17.7 |
| Anno 1800 (2019) | 19.9 | 5.7 |
Ljudnivå
| Låg belastning |
| 30.4 / 30.4 / 30.4 dB(A) |
| Hög belastning |
| 34.1 / 34.4 dB(A) |
 | ||
30 dB tyst 40 dB(A) hörbar 50 dB(A) högt ljud |
||
min: | ||
(±) Den maximala temperaturen på ovansidan är 44.9 °C / 113 F, jämfört med genomsnittet av 35.9 °C / 97 F , allt från 21.4 till 59 °C för klassen Subnotebook.
(±) Botten värms upp till maximalt 44.2 °C / 112 F, jämfört med genomsnittet av 39.2 °C / 103 F
(+) Vid tomgångsbruk är medeltemperaturen för ovansidan 24.8 °C / 77 F, jämfört med enhetsgenomsnittet på 30.8 °C / ### class_avg_f### F.
(+) Handledsstöden och pekplattan är kallare än hudtemperaturen med maximalt 29.2 °C / 84.6 F och är därför svala att ta på.
(±) Medeltemperaturen för handledsstödsområdet på liknande enheter var 28.2 °C / 82.8 F (-1 °C / -1.8 F).
Acer TravelMate X514-51-511Q ljudanalys
(-) | inte särskilt höga högtalare (66.8 dB)
Bas 100 - 315 Hz
(-) | nästan ingen bas - i genomsnitt 17.4% lägre än medianen
(±) | linjäriteten för basen är genomsnittlig (10.9% delta till föregående frekvens)
Mellan 400 - 2000 Hz
(±) | högre mellan - i genomsnitt 6.8% högre än median
(±) | linjäriteten för mids är genomsnittlig (7.1% delta till föregående frekvens)
Högsta 2 - 16 kHz
(+) | balanserade toppar - endast 1.5% från medianen
(+) | toppar är linjära (6.6% delta till föregående frekvens)
Totalt 100 - 16 000 Hz
(±) | linjäriteten för det totala ljudet är genomsnittlig (25.7% skillnad mot median)
Jämfört med samma klass
» 86% av alla testade enheter i den här klassen var bättre, 3% liknande, 11% sämre
» Den bästa hade ett delta på 5%, genomsnittet var 18%, sämst var 53%
Jämfört med alla testade enheter
» 79% av alla testade enheter var bättre, 4% liknande, 17% sämre
» Den bästa hade ett delta på 4%, genomsnittet var 24%, sämst var 134%
Apple MacBook 12 (Early 2016) 1.1 GHz ljudanalys
(+) | högtalare kan spela relativt högt (83.6 dB)
Bas 100 - 315 Hz
(±) | reducerad bas - i genomsnitt 11.3% lägre än medianen
(±) | linjäriteten för basen är genomsnittlig (14.2% delta till föregående frekvens)
Mellan 400 - 2000 Hz
(+) | balanserad mellan - endast 2.4% från medianen
(+) | mids är linjära (5.5% delta till föregående frekvens)
Högsta 2 - 16 kHz
(+) | balanserade toppar - endast 2% från medianen
(+) | toppar är linjära (4.5% delta till föregående frekvens)
Totalt 100 - 16 000 Hz
(+) | det totala ljudet är linjärt (10.2% skillnad mot median)
Jämfört med samma klass
» 7% av alla testade enheter i den här klassen var bättre, 2% liknande, 91% sämre
» Den bästa hade ett delta på 5%, genomsnittet var 18%, sämst var 53%
Jämfört med alla testade enheter
» 5% av alla testade enheter var bättre, 1% liknande, 94% sämre
» Den bästa hade ett delta på 4%, genomsnittet var 24%, sämst var 134%
| Av/Standby | |
| Låg belastning | |
| Hög belastning |
|
Förklaring:
min: | |
| Acer TravelMate X514-51-511Q i5-8265U, UHD Graphics 620, Kingston RBUSNS8154P3256GJ1, IPS, 1920x1080, 14" | Lenovo ThinkPad T495s-20QKS01E00 R7 PRO 3700U, Vega 10, Samsung PM981a MZVLB1T0HBLR, IPS, 1920x1080, 14" | Acer Swift 3 SF314-55G-768V i7-8565U, GeForce MX250, WDC PC SN520 SDAPNUW-512G, IPS, 1920x1080, 14" | Asus VivoBook 14 F412FJ-EB084T i5-8265U, GeForce MX230, Kingston RBU-SNS8180DS3512GJ, IPS, 1920x1080, 14" | Dell Latitude 14 5495 R7 2700U, Vega 10, Intel SSDSCKKF256G8, IPS LED, 1920x1080, 14" | Genomsnitt Intel UHD Graphics 620 | Genomsnitt av klass Subnotebook | |
|---|---|---|---|---|---|---|---|
| Power Consumption | -75% | -109% | -68% | -49% | -58% | -72% | |
| Idle Minimum * (Watt) | 2.3 | 4.7 -104% | 7.4 -222% | 3.7 -61% | 4.3 -87% | 3.81 ? -66% | 3.86 ? -68% |
| Idle Average * (Watt) | 4.6 | 7.28 -58% | 9.9 -115% | 6.1 -33% | 6.6 -43% | 6.94 ? -51% | 6.61 ? -44% |
| Idle Maximum * (Watt) | 5.8 | 9.48 -63% | 11.7 -102% | 8.3 -43% | 7.7 -33% | 8.75 ? -51% | 8 ? -38% |
| Load Average * (Watt) | 22.4 | 35.3 -58% | 29 -29% | 43 -92% | 32 -43% | 35 ? -56% | 42.2 ? -88% |
| Load Maximum * (Watt) | 29 | 55.5 -91% | 52 -79% | 61.6 -112% | 40 -38% | 47.5 ? -64% | 64.5 ? -122% |
* ... mindre är bättre
| Acer TravelMate X514-51-511Q i5-8265U, UHD Graphics 620, 36 Wh | Lenovo ThinkPad T495s-20QKS01E00 R7 PRO 3700U, Vega 10, 57 Wh | Acer Swift 3 SF314-55G-768V i7-8565U, GeForce MX250, 50.7 Wh | Asus VivoBook 14 F412FJ-EB084T i5-8265U, GeForce MX230, 37 Wh | Dell Latitude 14 5495 R7 2700U, Vega 10, 61 Wh | Genomsnitt av klass Subnotebook | |
|---|---|---|---|---|---|---|
| Batteridrifttid | 79% | 11% | -13% | 35% | 71% | |
| Reader / Idle (h) | 17.9 | 16.1 -10% | 18.2 2% | 28.6 ? 60% | ||
| WiFi v1.3 (h) | 6.3 | 11.3 79% | 8.1 29% | 5.5 -13% | 9.4 49% | 14 ? 122% |
| Load (h) | 1.5 | 1.7 13% | 2.3 53% | 1.969 ? 31% |
För
Emot
Omdöme - En bra kontorslaptop för resan
Läs den fullständiga versionen av den här recensionen på engelska här.
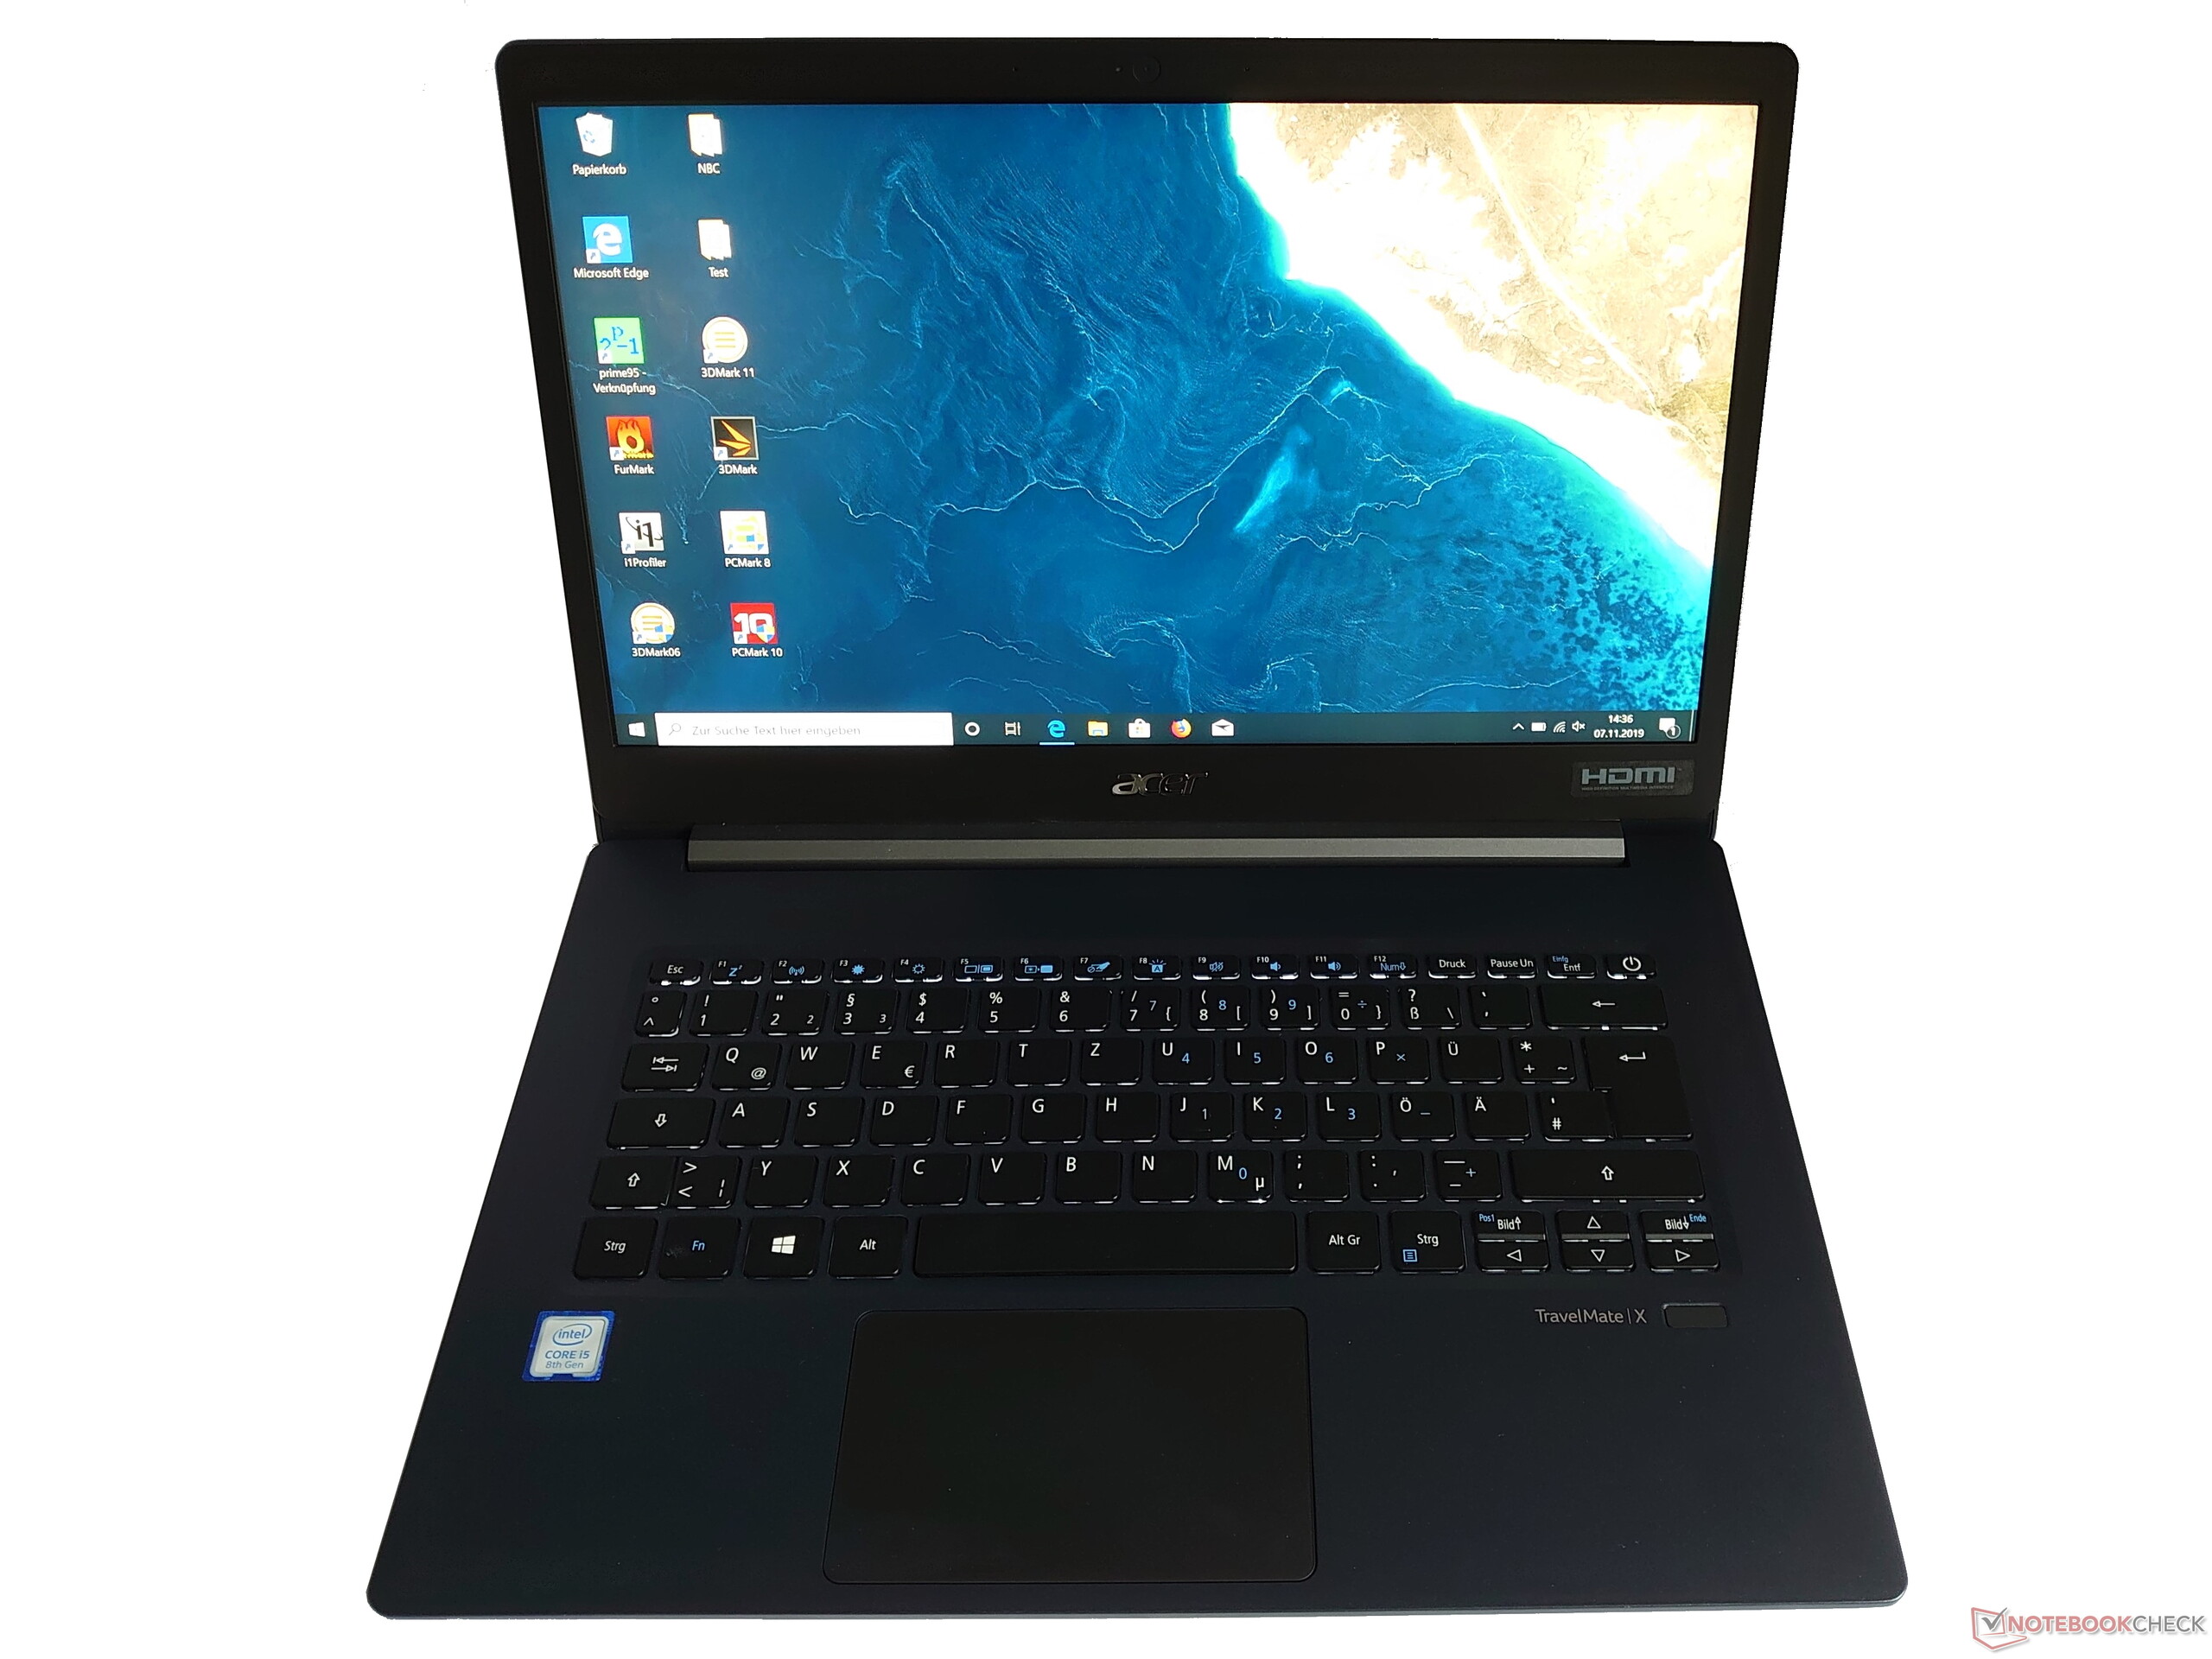
TravelMate X514 lever upp till reklamen och antagligen även till Acers intentioner. Den uppnår en bra balans mellan att vara kompakt och lätt men ändå ha tillräckligt med kraft för alla genomsnittliga kontorsuppgifter. Den har dessutom hyfsad batteritid utan att behöva förlita sig på ett batteri med hög kapacitet som hade ökat på vikten.
Skärmen är dock en blandad kompott. Å ena sidan återger den färger på ett levande vis samtidigt som den har hög färgprecision, någon som lär imponera på kreatörer och personer vill strömma film på resan. Å andra sidan har den alldeles för låg ljusstyrka för en portabel enhet, vilket är synd.
Acer TravelMate X514-51-511Q är en kompetent, lätt och kompakt kontorslaptop som för det mesta gör bra ifrån sig.
Men den kompakta designen kommer med en del brister. För det första har Acer valt att inte inkludera kontorsfunktioner som en Ethernet-port, så du behöver en adapter om du vill ha en trådbunden internetanslutning. Vidare har Acer utrustat enheten med ett jämförelsevis litet batteri som tyvärr inte räcker en hel dag utan tillgång till eluttag. Även om ett batteri på 36 Wh hjälper till att hålla enheten under 1 kg har LG lyckats utrusta sin Gram-serie på 14 tum med betydligt större batterier samtidigt som man lyckats hålla vikten under samma nivå.
Acer TravelMate X514-51-511Q
- 11/11/2019 v7 (old)
Mike Wobker
Price comparison
