Test: Acer Predator Helios 500 (GTX 1070, i9-8950HK) Laptop (Sammanfattning)
| |||||||||||||||||||||||||
Distribution av ljusstyrkan: 86 %
Mitt på batteriet: 370 cd/m²
Kontrast: 796:1 (Svärta: 0.46 cd/m²)
ΔE ColorChecker Calman: 2.9 | ∀{0.5-29.43 Ø4.71}
calibrated: 3.1
ΔE Greyscale Calman: 3.5 | ∀{0.09-98 Ø4.96}
100% sRGB (Argyll 1.6.3 3D)
88.1% AdobeRGB 1998 (Argyll 1.6.3 3D)
99.4% AdobeRGB 1998 (Argyll 3D)
100% sRGB (Argyll 3D)
86.7% Display P3 (Argyll 3D)
Gamma: 2.37
CCT: 6616 K
| Acer Predator Helios 500 PH517-51-93LS B173ZAN01.0, IPS LED, 3840x2160, 17.3" | Acer Predator Helios 500 PH517-51-79BY AUO_B173HAN03, IPS, 1920x1080, 17.3" | MSI GT75 8RG-090 Titan CMN N173HHE-G32 (CMN1747), TN, 1920x1080, 17.3" | Asus G703 AUO B173HAN03.0 (AUO309D), IPS, 1920x1080, 17.3" | Acer Predator 17 G9-793-70PJ AU Optronics B173ZAN01.0 (AUO109B), IPS, 3840x2160, 17.3" | HP Omen X 17-ap0xx AU Optronics B173HW01, IPS, 1920x1080, 17.3" | Acer Predator Helios 300 PH317-52-51M6 LG Philips LP173WF4-SPF5 (LGD056D), IPS, 1920x1080, 17.3" | Razer Blade Pro RZ09-0220 ID: AUO169D, Name: AU Optronics B173HAN01.6, IPS, 1920x1080, 17.3" | Genomsnitt av klass Gaming | |
|---|---|---|---|---|---|---|---|---|---|
| Screen | -29% | 13% | -8% | -1% | 1% | -31% | -9% | 14% | |
| Brightness middle (cd/m²) | 366 | 335 -8% | 240 -34% | 274 -25% | 343 -6% | 343 -6% | 365 0% | 367.4 0% | 469 ? 28% |
| Brightness (cd/m²) | 349 | 300 -14% | 248 -29% | 268 -23% | 328 -6% | 332 -5% | 341 -2% | 363 4% | |
| Brightness Distribution (%) | 86 | 82 -5% | 83 -3% | 80 -7% | 84 -2% | 83 -3% | 89 3% | 86 0% | |
| Black Level * (cd/m²) | 0.46 | 0.7 -52% | 0.22 52% | 0.29 37% | 0.29 37% | 0.35 24% | 0.32 30% | 0.32 30% | 0.2307 ? 50% |
| Contrast (:1) | 796 | 479 -40% | 1091 37% | 945 19% | 1183 49% | 980 23% | 1141 43% | 1148 44% | |
| Colorchecker dE 2000 * | 2.9 | 4.99 -72% | 2.14 26% | 3.99 -38% | 4.01 -38% | 3.35 -16% | 6.51 -124% | 3.8 -31% | 3 ? -3% |
| Colorchecker dE 2000 max. * | 5.4 | 9.32 -73% | 5.04 7% | 7.33 -36% | 6.03 -12% | 5.62 -4% | 12.32 -128% | 10.4 -93% | 7.63 ? -41% |
| Colorchecker dE 2000 calibrated * | 3.1 | 1.93 38% | 1.54 50% | 1.79 42% | 2.5 19% | 2.9 6% | 1.813 ? 42% | ||
| Greyscale dE 2000 * | 3.5 | 5.2 -49% | 1.62 54% | 4.14 -18% | 4.7 -34% | 2.4 31% | 7.65 -119% | 3.5 -0% | 3.18 ? 9% |
| Gamma | 2.37 93% | 2.49 88% | 2.28 96% | 2.58 85% | 2.4 92% | 2.35 94% | 2.64 83% | 2.18 101% | 2.24 98% ? |
| CCT | 6616 98% | 7719 84% | 6846 95% | 7352 88% | 6451 101% | 6495 100% | 8066 81% | 6467 101% | 6683 97% ? |
| Color Space (Percent of AdobeRGB 1998) (%) | 88.1 | 59 -33% | 77 -13% | 60 -32% | 88 0% | 57 -35% | 56 -36% | 58.1 -34% | |
| Color Space (Percent of sRGB) (%) | 100 | 91 -9% | 100 0% | 92 -8% | 100 0% | 88 -12% | 86 -14% | 89.3 -11% |
* ... mindre är bättre
Visa svarstider
| ↔ Svarstid svart till vitt | ||
|---|---|---|
| 24.4 ms ... stiga ↗ och falla ↘ kombinerat | ↗ 14 ms stiga | 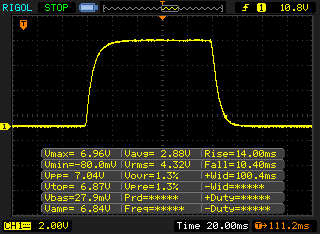 |
| ↘ 10.4 ms hösten | ||
| Skärmen visar bra svarsfrekvens i våra tester, men kan vara för långsam för konkurrenskraftiga spelare. I jämförelse sträcker sig alla testade enheter från 0.1 (minst) till 240 (maximalt) ms. » 58 % av alla enheter är bättre. Detta innebär att den uppmätta svarstiden är sämre än genomsnittet av alla testade enheter (19.8 ms). | ||
| ↔ Svarstid 50 % grått till 80 % grått | ||
| 36 ms ... stiga ↗ och falla ↘ kombinerat | ↗ 18 ms stiga | 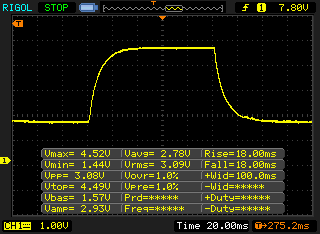 |
| ↘ 18 ms hösten | ||
| Skärmen visar långsamma svarsfrekvenser i våra tester och kommer att vara otillfredsställande för spelare. I jämförelse sträcker sig alla testade enheter från 0.165 (minst) till 636 (maximalt) ms. » 51 % av alla enheter är bättre. Detta innebär att den uppmätta svarstiden är sämre än genomsnittet av alla testade enheter (31 ms). | ||
Skärmflimmer / PWM (Puls-Width Modulation)
| Skärmflimmer / PWM upptäcktes inte | 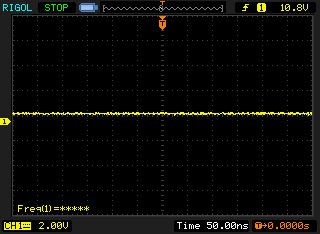 | ||
Som jämförelse: 52 % av alla testade enheter använder inte PWM för att dämpa skärmen. Om PWM upptäcktes mättes ett medelvärde av 7754 (minst: 5 - maximum: 343500) Hz. | |||
| PCMark 8 Home Score Accelerated v2 | 4882 poäng | |
| PCMark 10 Score | 4576 poäng | |
Hjälp | ||
| Acer Predator Helios 500 PH517-51-93LS GeForce GTX 1070 Mobile, i9-8950HK, Liteon CA1-8D512 | MSI GT75 8RG-090 Titan GeForce GTX 1080 Mobile, i9-8950HK, 2x Samsung PM961 MZVLW256HEHP (RAID 0) | Asus G703 GeForce GTX 1080 Mobile, i7-7820HK, 2x Samsung SM961 MZVKW512HMJP NVMe (RAID 0) | HP Omen X 17-ap0xx GeForce GTX 1080 Mobile, i7-7820HK, Samsung PM961 MZVLW256HEHP | Acer Predator Helios 300 PH317-52-51M6 GeForce GTX 1050 Ti Mobile, i5-8300H, Hynix HFS128G39TND | Razer Blade Pro RZ09-0220 GeForce GTX 1060 Mobile, i7-7700HQ, Samsung SSD PM951 MZVLV256HCHP | Acer Predator Helios 500 PH517-51-79BY GeForce GTX 1070 Mobile, i7-8750H, SK hynix SSD Canvas SC300 HFS256GD9MNE-6200A | Genomsnitt Liteon CA1-8D512 | |
|---|---|---|---|---|---|---|---|---|
| CrystalDiskMark 5.2 / 6 | 146% | 211% | 82% | -53% | 13% | 17% | 0% | |
| Write 4K (MB/s) | 95 | 111.8 18% | 160.7 69% | 148.8 57% | 61.9 -35% | 155.1 63% | 79.2 -17% | 95 ? 0% |
| Read 4K (MB/s) | 37.56 | 42.09 12% | 54.8 46% | 46.64 24% | 22.78 -39% | 44.22 18% | 39.69 6% | 37.6 ? 0% |
| Write Seq (MB/s) | 484.1 | 2288 373% | 2738 466% | 1216 151% | 136.1 -72% | 311.2 -36% | 950 96% | 484 ? 0% |
| Read Seq (MB/s) | 1001 | 3321 232% | 3346 234% | 1461 46% | 490.1 -51% | 1247 25% | 1087 9% | 1001 ? 0% |
| Write 4K Q32T1 (MB/s) | 278.2 | 308.3 11% | 612 120% | 444 60% | 136.2 -51% | 310.3 12% | 189.6 -32% | 278 ? 0% |
| Read 4K Q32T1 (MB/s) | 346.3 | 364.9 5% | 709 105% | 535 54% | 208.4 -40% | 551 59% | 304 -12% | 346 ? 0% |
| Write Seq Q32T1 (MB/s) | 489 | 2440 399% | 3082 530% | 1210 147% | 136 -72% | 311.5 -36% | 948 94% | 489 ? 0% |
| Read Seq Q32T1 (MB/s) | 1586 | 3485 120% | 3505 121% | 3450 118% | 553 -65% | 1560 -2% | 1488 -6% | 1586 ? 0% |

| 3DMark 06 Standard Score | 40048 poäng | |
| 3DMark 11 Performance | 18687 poäng | |
| 3DMark Cloud Gate Standard Score | 34455 poäng | |
| 3DMark Fire Strike Score | 14734 poäng | |
Hjälp | ||
| låg | med. | hög | ultra | 4K | |
|---|---|---|---|---|---|
| The Witcher 3 (2015) | 259 | 185.5 | 111.2 | 63 | 40.4 |
| Doom (2016) | 147.4 | 143.2 | 126.8 | 121.3 | 55.9 |
| Civilization 6 (2016) | 128.8 | 106.9 | 91.3 | 89.3 | 80 |
| Rocket League (2017) | 202.8 | ||||
| Call of Duty WWII (2017) | 248.7 | 214.6 | 136.9 | 111.8 | 47.8 |
| Star Wars Battlefront 2 (2017) | 179.5 | 157.2 | 134.8 | 98.5 | 31.6 |
Ljudnivå
| Låg belastning |
| 29.4 / 29.4 / 30.1 dB(A) |
| Hårddisk |
| 30.3 dB(A) |
| Hög belastning |
| 36 / 42.2 dB(A) |
 | ||
30 dB tyst 40 dB(A) hörbar 50 dB(A) högt ljud |
||
min: | ||
(±) Den maximala temperaturen på ovansidan är 41 °C / 106 F, jämfört med genomsnittet av 40.4 °C / 105 F , allt från 21.2 till 68.8 °C för klassen Gaming.
(-) Botten värms upp till maximalt 45.2 °C / 113 F, jämfört med genomsnittet av 43.2 °C / 110 F
(+) Vid tomgångsbruk är medeltemperaturen för ovansidan 30.3 °C / 87 F, jämfört med enhetsgenomsnittet på 33.9 °C / ### class_avg_f### F.
(±) När du spelar The Witcher 3 är medeltemperaturen för ovansidan 33.8 °C / 93 F, jämfört med enhetsgenomsnittet på 33.9 °C / ## #class_avg_f### F.
(+) Handledsstöden och pekplattan är kallare än hudtemperaturen med maximalt 28.5 °C / 83.3 F och är därför svala att ta på.
(±) Medeltemperaturen för handledsstödsområdet på liknande enheter var 28.8 °C / 83.8 F (+0.3 °C / 0.5 F).
Acer Predator Helios 500 PH517-51-79BY ljudanalys
(-) | inte särskilt höga högtalare (65 dB)
Bas 100 - 315 Hz
(±) | reducerad bas - i genomsnitt 6.5% lägre än medianen
(±) | linjäriteten för basen är genomsnittlig (7.6% delta till föregående frekvens)
Mellan 400 - 2000 Hz
(+) | balanserad mellan - endast 2.3% från medianen
(+) | mids är linjära (5.2% delta till föregående frekvens)
Högsta 2 - 16 kHz
(+) | balanserade toppar - endast 1.9% från medianen
(±) | linjäriteten för toppar är genomsnittlig (7.9% delta till föregående frekvens)
Totalt 100 - 16 000 Hz
(+) | det totala ljudet är linjärt (11.7% skillnad mot median)
Jämfört med samma klass
» 11% av alla testade enheter i den här klassen var bättre, 4% liknande, 85% sämre
» Den bästa hade ett delta på 6%, genomsnittet var 18%, sämst var 132%
Jämfört med alla testade enheter
» 8% av alla testade enheter var bättre, 3% liknande, 89% sämre
» Den bästa hade ett delta på 4%, genomsnittet var 23%, sämst var 134%
MSI GT75 8RG-090 Titan ljudanalys
(+) | högtalare kan spela relativt högt (94 dB)
Bas 100 - 315 Hz
(±) | reducerad bas - i genomsnitt 9.4% lägre än medianen
(±) | linjäriteten för basen är genomsnittlig (8.7% delta till föregående frekvens)
Mellan 400 - 2000 Hz
(±) | högre mellan - i genomsnitt 6.8% högre än median
(±) | linjäriteten för mids är genomsnittlig (8.4% delta till föregående frekvens)
Högsta 2 - 16 kHz
(±) | högre toppar - i genomsnitt 5% högre än medianen
(±) | linjäriteten för toppar är genomsnittlig (7.8% delta till föregående frekvens)
Totalt 100 - 16 000 Hz
(+) | det totala ljudet är linjärt (14.4% skillnad mot median)
Jämfört med samma klass
» 27% av alla testade enheter i den här klassen var bättre, 7% liknande, 66% sämre
» Den bästa hade ett delta på 6%, genomsnittet var 18%, sämst var 132%
Jämfört med alla testade enheter
» 18% av alla testade enheter var bättre, 4% liknande, 78% sämre
» Den bästa hade ett delta på 4%, genomsnittet var 23%, sämst var 134%
| Av/Standby | |
| Låg belastning | |
| Hög belastning |
|
Förklaring:
min: | |
För
Emot
Läs den fullständiga versionen av den här recensionen på enhär.
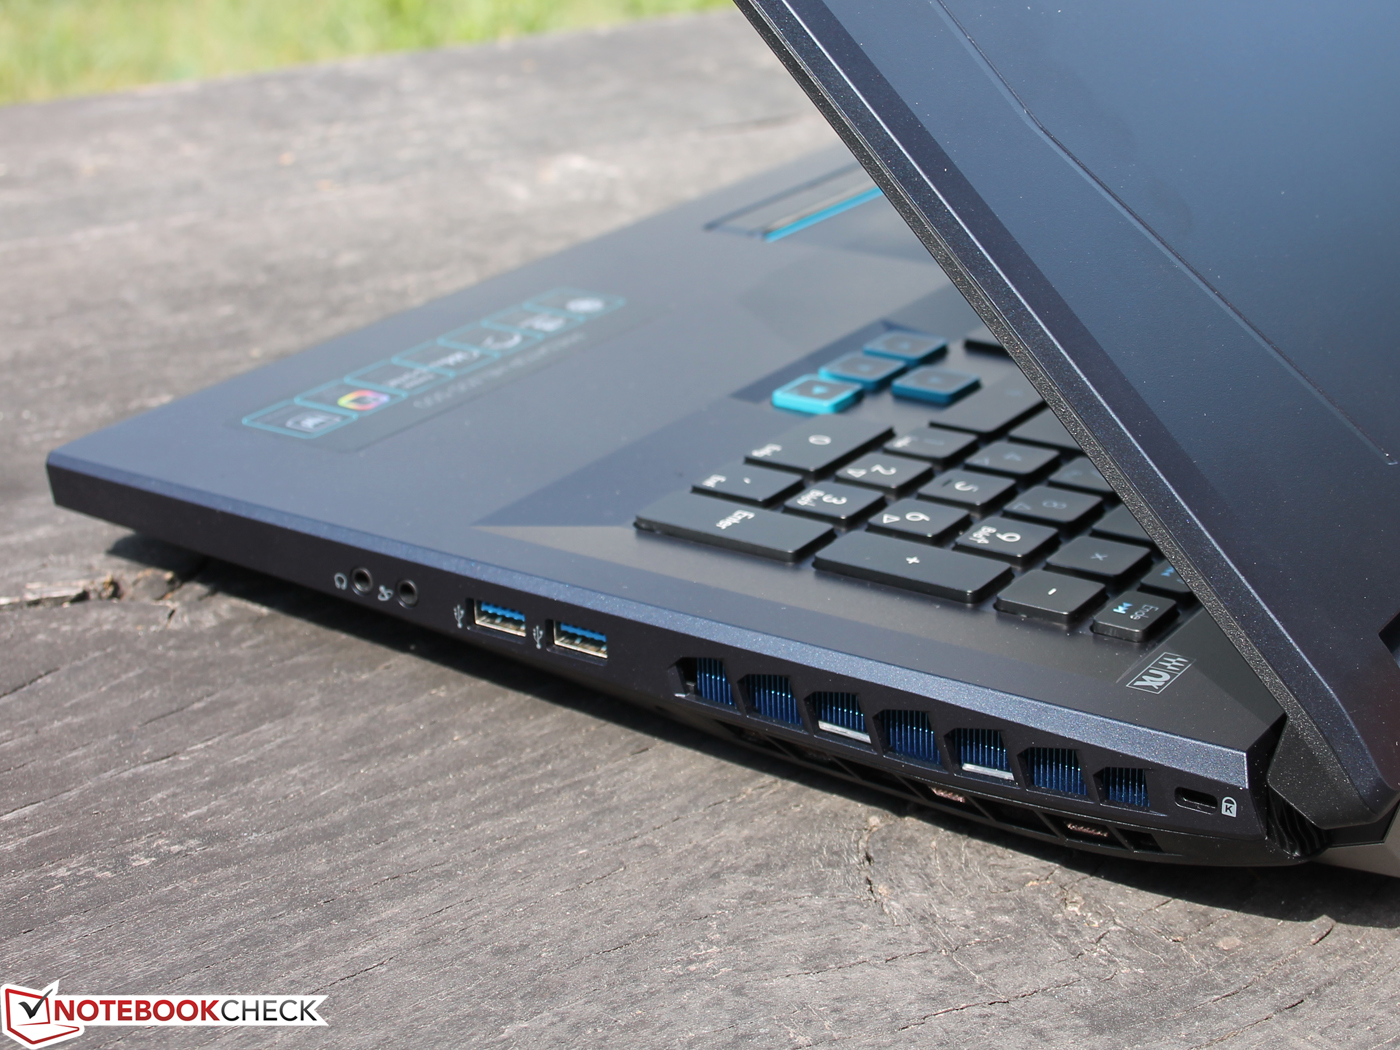
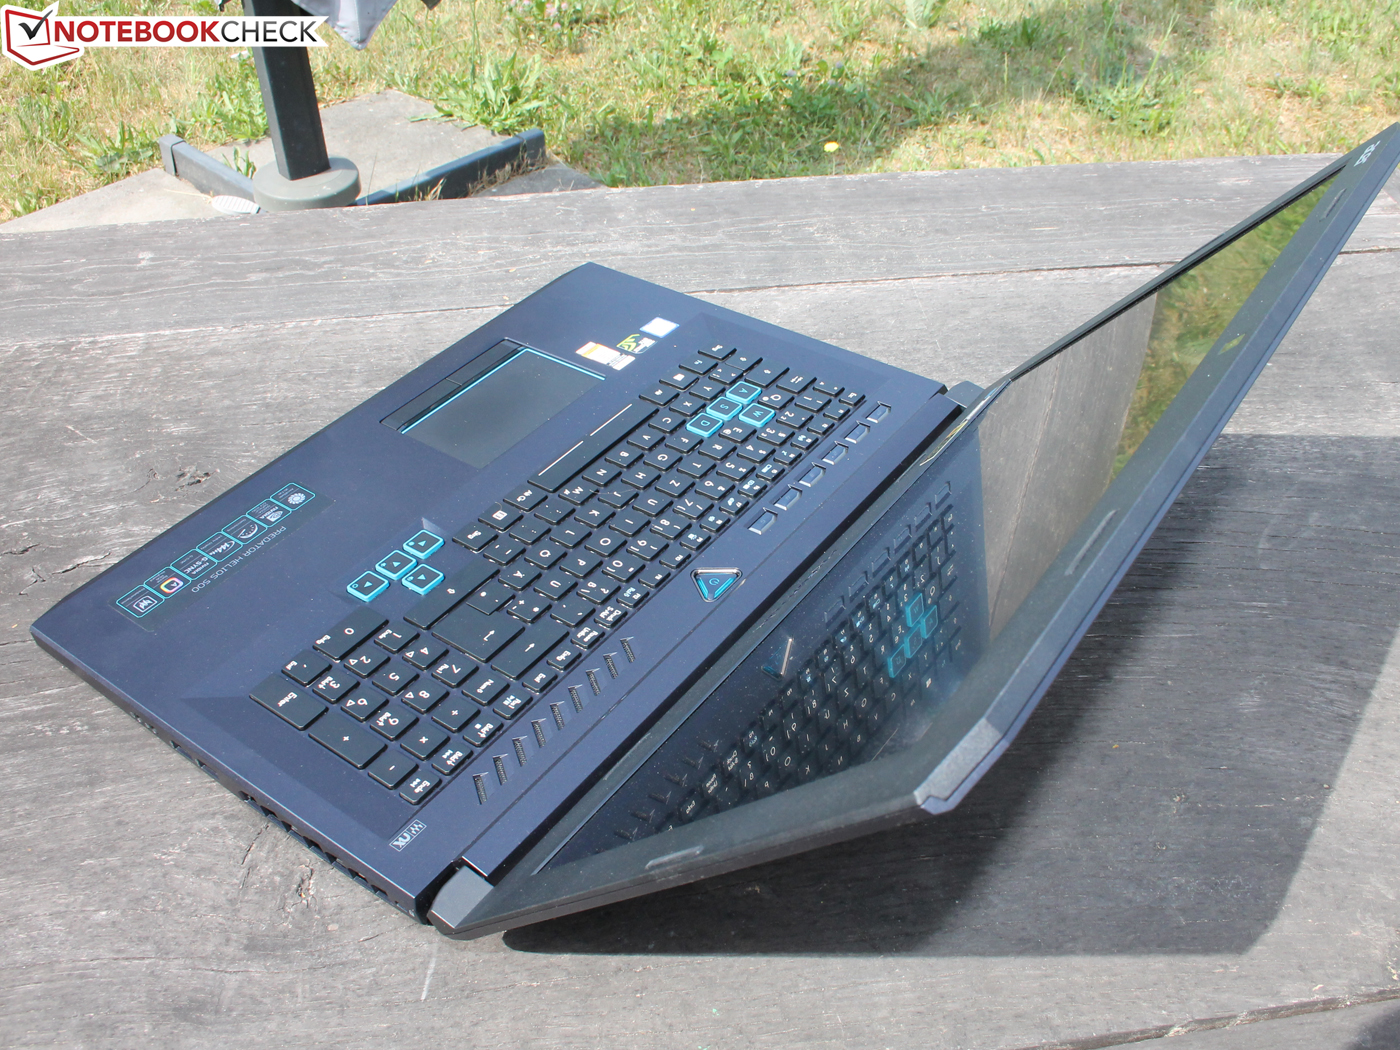
Föga överraskande: Acer Predator Helios 500 i en 4K-version med Intel Core i9-8950HK är även den en utmärkt spelenhet då den fortfarande har de flesta fördelar som den billigare versionen ha. Men i vårt tycke är den billigare i7-modellen ett bättre val. Intel Core i9-8950HK-processorn kan knappt dra nytta av sin högre prestanda och dessutom orsakar den högre temperaturer och – tillsammans med 4K-skärmen – högre energiförbrukning. När det kommer till skärmen: UltraHD-skärmen är definitivt en givande uppgradering, som möjliggör spelande i 4K tillsammans med ett GeForce GTX 1070. Skärmens kvalitet övertygar, särskilt den höga färgrymdstäckningen. Å andra sidan har FullHD-skärmen högre bilduppdateringsfrekvens, så båda skärmalternativen har sina för och nackdelar.
4K på topp, Core i9 är en flopp: Även om dess 4K LCD ger stora fördelar åt många användare så är Core i9-processorn till stor del ett slöseri med pengar.
Sammanfattningsvis kan vi rekommendera 4K-skärmen, men Core i9-8950HK-processorn är inte värd det högre priset – det är bara när det kommer till enkelkärnig prestanda som den briljerar, vilket inte är särskilt viktigt för spel.
Acer Predator Helios 500 PH517-51-93LS
- 09/03/2018 v6 (old)
Benjamin Herzig