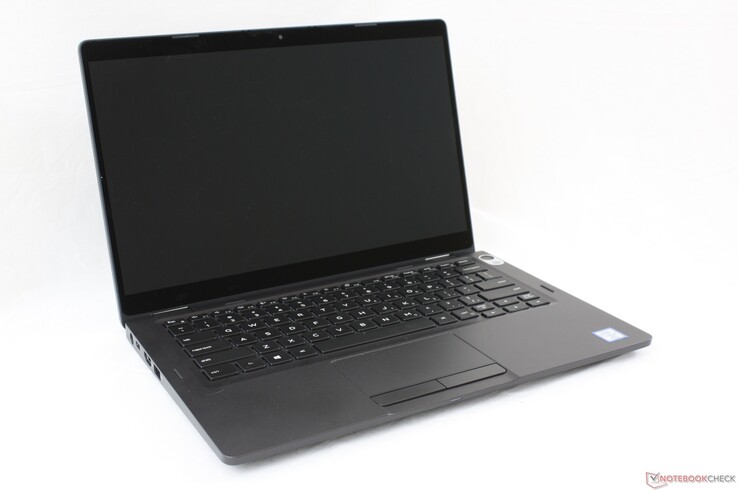
Test: Dell Latitude 13 5300 2-in-1 - Ett alternativ till ThinkPad X390 Yoga
Topp 10...
» Topp 10: Bästa bärbara allround/multimediadatorerna
» Topp 10: Bästa bärbara speldatorerna
» Topp 10: Bärbara budget/kontorsdatorer
» Topp 10: Bästa bärbara kontors/premiumdatorerna
» Topp 10: Bärbara arbetsstationer
» Topp 10: De bästa små/kompakta bärbara datorerna
» Topp 10: Bästa ultrabooks
» Topp 10: Bästa hybriddatorerna
» Topp 10: Bästa surfplattorna
» Topp 10: Marknadens bästa smartphones
| SD Card Reader | |
| average JPG Copy Test (av. of 3 runs) | |
| Dell XPS 13 9380 2019 (Toshiba Exceria Pro SDXC 64 GB UHS-II) | |
| Dell Latitude 13 5300 2-in-1 (Toshiba Exceria Pro M501) | |
| Samsung Notebook 9 NP930QAA (Toshiba Exceria Pro M501 microSDXC 64GB) | |
| Lenovo ThinkPad X390-20Q1S02M00 (Toshiba Exceria Pro M501) | |
| HP ProBook 430 G6-5TJ89EA (Toshiba Exceria Pro SDXC 64 GB UHS-II) | |
| maximum AS SSD Seq Read Test (1GB) | |
| Dell XPS 13 9380 2019 (Toshiba Exceria Pro SDXC 64 GB UHS-II) | |
| Dell Latitude 13 5300 2-in-1 (Toshiba Exceria Pro M501) | |
| Samsung Notebook 9 NP930QAA (Toshiba Exceria Pro M501 microSDXC 64GB) | |
| Lenovo ThinkPad X390-20Q1S02M00 (Toshiba Exceria Pro M501) | |
| HP ProBook 430 G6-5TJ89EA (Toshiba Exceria Pro SDXC 64 GB UHS-II) | |
| |||||||||||||||||||||||||
Distribution av ljusstyrkan: 89 %
Mitt på batteriet: 316.2 cd/m²
Kontrast: 1171:1 (Svärta: 0.27 cd/m²)
ΔE ColorChecker Calman: 5.67 | ∀{0.5-29.43 Ø4.77}
calibrated: 1.26
ΔE Greyscale Calman: 7 | ∀{0.09-98 Ø5}
95.7% sRGB (Argyll 1.6.3 3D)
61.4% AdobeRGB 1998 (Argyll 1.6.3 3D)
66.5% AdobeRGB 1998 (Argyll 3D)
95.7% sRGB (Argyll 3D)
64.9% Display P3 (Argyll 3D)
Gamma: 2.64
CCT: 6440 K
| Dell Latitude 13 5300 2-in-1 LG Philips LGD05DC, IPS, 13.3", 1920x1080 | Lenovo ThinkPad X390-20Q1S02M00 LP133WF7-SPB1, IPS LED, 13.3", 1920x1080 | Samsung Notebook 9 NP930QAA BOE075E, IPS, 13.3", 1920x1080 | Dell XPS 13 9380 2019 ID: AUO 282B B133ZAN Dell: 90NTH, IPS, 13.3", 3840x2160 | HP Spectre x360 13t-ae000 LGD0588, IPS, 13.3", 3840x2160 | HP EliteBook x360 1030 G3 45X96UT Chi Mei CMN1380, IPS, 13.3", 1920x1080 | |
|---|---|---|---|---|---|---|
| Display | 0% | -1% | -2% | 8% | 3% | |
| Display P3 Coverage (%) | 64.9 | 65.3 1% | 65.4 1% | 64.7 0% | 71.9 11% | 66.7 3% |
| sRGB Coverage (%) | 95.7 | 95.9 0% | 91.5 -4% | 93.1 -3% | 98.1 3% | 98.6 3% |
| AdobeRGB 1998 Coverage (%) | 66.5 | 66.6 0% | 66.2 0% | 65.3 -2% | 73.1 10% | 68.7 3% |
| Response Times | -48% | -23% | -52% | -36% | -9% | |
| Response Time Grey 50% / Grey 80% * (ms) | 37.6 ? | 57.6 ? -53% | 49.2 ? -31% | 58 ? -54% | 51.6 ? -37% | 39.6 ? -5% |
| Response Time Black / White * (ms) | 24 ? | 34 ? -42% | 27.6 ? -15% | 36 ? -50% | 32.4 ? -35% | 27.2 ? -13% |
| PWM Frequency (Hz) | 3049 ? | 26040 ? | ||||
| Screen | 25% | -5% | 2% | 19% | 17% | |
| Brightness middle (cd/m²) | 316.2 | 356 13% | 473 50% | 404 28% | 329.8 4% | 467.2 48% |
| Brightness (cd/m²) | 298 | 336 13% | 441 48% | 389 31% | 318 7% | 445 49% |
| Brightness Distribution (%) | 89 | 88 -1% | 88 -1% | 85 -4% | 74 -17% | 91 2% |
| Black Level * (cd/m²) | 0.27 | 0.16 41% | 0.57 -111% | 0.37 -37% | 0.25 7% | 0.4 -48% |
| Contrast (:1) | 1171 | 2225 90% | 830 -29% | 1092 -7% | 1319 13% | 1168 0% |
| Colorchecker dE 2000 * | 5.67 | 3.6 37% | 3.72 34% | 3.72 34% | 2.37 58% | 2.41 57% |
| Colorchecker dE 2000 max. * | 7.97 | 5.5 31% | 7.83 2% | 7.38 7% | 4.08 49% | 5.58 30% |
| Colorchecker dE 2000 calibrated * | 1.26 | 1.1 13% | 2.14 -70% | 2.06 -63% | 1.33 -6% | |
| Greyscale dE 2000 * | 7 | 4.7 33% | 5.1 27% | 4.44 37% | 2.8 60% | 3.7 47% |
| Gamma | 2.64 83% | 2.48 89% | 2.31 95% | 2.34 94% | 2.145 103% | 2.37 93% |
| CCT | 6440 101% | 6374 102% | 7569 86% | 7095 92% | 6441 101% | 7158 91% |
| Color Space (Percent of AdobeRGB 1998) (%) | 61.4 | 61.3 0% | 58.9 -4% | 60 -2% | 67 9% | 62.5 2% |
| Color Space (Percent of sRGB) (%) | 95.7 | 95.7 0% | 90.8 -5% | 93 -3% | 98 2% | 99.6 4% |
| Totalt genomsnitt (program/inställningar) | -8% /
11% | -10% /
-7% | -17% /
-6% | -3% /
10% | 4% /
11% |
* ... mindre är bättre
Visa svarstider
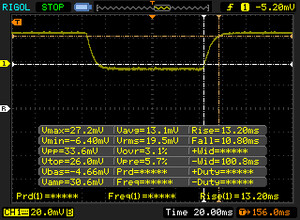
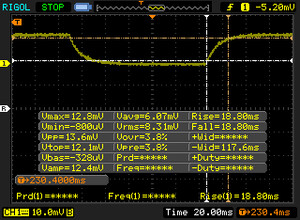
| ↔ Svarstid svart till vitt | ||
|---|---|---|
| 24 ms ... stiga ↗ och falla ↘ kombinerat | ↗ 13.2 ms stiga | |
| ↘ 10.8 ms hösten | ||
| Skärmen visar bra svarsfrekvens i våra tester, men kan vara för långsam för konkurrenskraftiga spelare. I jämförelse sträcker sig alla testade enheter från 0.1 (minst) till 240 (maximalt) ms. » 53 % av alla enheter är bättre. Detta innebär att den uppmätta svarstiden är sämre än genomsnittet av alla testade enheter (20.2 ms). | ||
| ↔ Svarstid 50 % grått till 80 % grått | ||
| 37.6 ms ... stiga ↗ och falla ↘ kombinerat | ↗ 18.8 ms stiga | |
| ↘ 18.8 ms hösten | ||
| Skärmen visar långsamma svarsfrekvenser i våra tester och kommer att vara otillfredsställande för spelare. I jämförelse sträcker sig alla testade enheter från 0.165 (minst) till 636 (maximalt) ms. » 54 % av alla enheter är bättre. Detta innebär att den uppmätta svarstiden är sämre än genomsnittet av alla testade enheter (31.5 ms). | ||
Skärmflimmer / PWM (Puls-Width Modulation)
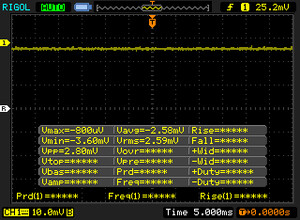
| Skärmflimmer / PWM upptäcktes inte | |||
Som jämförelse: 53 % av alla testade enheter använder inte PWM för att dämpa skärmen. Om PWM upptäcktes mättes ett medelvärde av 8070 (minst: 5 - maximum: 343500) Hz. | |||
| Cinebench R15 | |
| CPU Single 64Bit | |
| Dell Latitude 7400 2-in-1 | |
| Dell Inspiron 13 7380 | |
| Dell G3 15 3579 | |
| Dell XPS 13 9370 i7 UHD | |
| Dell Latitude 13 5300 2-in-1 | |
| Dell XPS 13 9360 FHD i7 Iris | |
| Dell XPS 13 9380 2019 | |
| Dell Latitude 14 5495 | |
| Dell Latitude 13 3390 | |
| Dell XPS 13 9360-4764 | |
| HP 14-dk0008ng | |
| CPU Multi 64Bit | |
| Dell G3 15 3579 | |
| Dell Latitude 14 5495 | |
| Dell XPS 13 9380 2019 | |
| Dell XPS 13 9370 i7 UHD | |
| Dell Latitude 7400 2-in-1 | |
| Dell Latitude 13 5300 2-in-1 | |
| Dell Inspiron 13 7380 | |
| Dell Latitude 13 3390 | |
| HP 14-dk0008ng | |
| Dell XPS 13 9360-4764 | |
| Dell XPS 13 9360 FHD i7 Iris | |
| PCMark 8 Home Score Accelerated v2 | 3485 poäng | |
| PCMark 8 Work Score Accelerated v2 | 4911 poäng | |
| PCMark 10 Score | 3863 poäng | |
Hjälp | ||
| Dell Latitude 13 5300 2-in-1 SK hynix PC401 HFS256GD9TNG | Lenovo ThinkPad X390-20Q1S02M00 Intel SSD Pro 7600p SSDPEKKF512G8L | Huawei MateBook 13 i7 Samsung SSD PM981 MZVLB512HAJQ | HP Spectre x360 13t-ae000 Lite-On CA1-8D256-HP | HP EliteBook x360 1030 G3 45X96UT Samsung SSD PM981 MZVLB512HAJQ | |
|---|---|---|---|---|---|
| AS SSD | 93% | 123% | 5% | 89% | |
| Seq Read (MB/s) | 1236 | 2689 118% | 1889 53% | 2133 73% | 1798 45% |
| Seq Write (MB/s) | 500 | 1462 192% | 1812 262% | 945 89% | 1374 175% |
| 4K Read (MB/s) | 40.1 | 63.8 59% | 55.5 38% | 29.84 -26% | 46.05 15% |
| 4K Write (MB/s) | 115.7 | 139.8 21% | 118.4 2% | 91.4 -21% | 104.3 -10% |
| 4K-64 Read (MB/s) | 474.1 | 865 82% | 1257 165% | 725 53% | 1408 197% |
| 4K-64 Write (MB/s) | 350.4 | 1041 197% | 1571 348% | 404.1 15% | 790 125% |
| Access Time Read * (ms) | 0.04 | 0.037 7% | 0.041 -3% | 0.121 -203% | 0.041 -3% |
| Access Time Write * (ms) | 0.051 | 0.024 53% | 0.032 37% | 0.13 -155% | 0.036 29% |
| Score Read (Points) | 638 | 1198 88% | 1502 135% | 968 52% | 1634 156% |
| Score Write (Points) | 516 | 1328 157% | 1871 263% | 590 14% | 1032 100% |
| Score Total (Points) | 1456 | 3095 113% | 4147 185% | 1998 37% | 3484 139% |
| Copy ISO MB/s (MB/s) | 818 | 1290 58% | 1800 120% | 1492 82% | 1947 138% |
| Copy Program MB/s (MB/s) | 395.5 | 436.5 10% | 385.6 -3% | 300.9 -24% | 453.9 15% |
| Copy Game MB/s (MB/s) | 452.5 | 1147 153% | 982 117% | 839 85% | 990 119% |
* ... mindre är bättre
| 3DMark | |
| 1280x720 Cloud Gate Standard Graphics | |
| Dell G3 15 3579 | |
| Huawei MateBook 13 i7 | |
| HP 14-dk0008ng | |
| Dell XPS 13 9360 FHD i7 Iris | |
| Dell Latitude 14 5495 | |
| Dell Inspiron 13 7380 | |
| Dell XPS 13 9380 2019 | |
| Dell XPS 13 9370 i7 UHD | |
| Genomsnitt Intel UHD Graphics 620 (6205 - 16400, n=225) | |
| Dell Latitude 13 3390 | |
| Dell XPS 13 9360-4764 | |
| Dell Latitude 13 5300 2-in-1 | |
| HP ProBook 430 G6-5TJ89EA | |
| 1280x720 Cloud Gate Standard Score | |
| Dell G3 15 3579 | |
| Huawei MateBook 13 i7 | |
| HP 14-dk0008ng | |
| Dell XPS 13 9380 2019 | |
| Dell Latitude 14 5495 | |
| Dell Inspiron 13 7380 | |
| Dell XPS 13 9370 i7 UHD | |
| Genomsnitt Intel UHD Graphics 620 (5358 - 10960, n=225) | |
| Dell Latitude 13 5300 2-in-1 | |
| Dell Latitude 13 3390 | |
| Dell XPS 13 9360 FHD i7 Iris | |
| HP ProBook 430 G6-5TJ89EA | |
| Dell XPS 13 9360-4764 | |
| 3DMark 11 | |
| 1280x720 Performance GPU | |
| Dell G3 15 3579 | |
| Huawei MateBook 13 i7 | |
| HP 14-dk0008ng | |
| Dell Latitude 14 5495 | |
| Dell XPS 13 9360 FHD i7 Iris | |
| Dell XPS 13 9370 i7 UHD | |
| Dell Inspiron 13 7380 | |
| Dell XPS 13 9380 2019 | |
| Genomsnitt Intel UHD Graphics 620 (1144 - 3432, n=244) | |
| Dell Latitude 13 5300 2-in-1 | |
| HP ProBook 430 G6-5TJ89EA | |
| Dell XPS 13 9360-4764 | |
| Dell Latitude 13 3390 | |
| 1280x720 Performance Combined | |
| Dell G3 15 3579 | |
| Huawei MateBook 13 i7 | |
| HP 14-dk0008ng | |
| Dell Latitude 14 5495 | |
| Dell XPS 13 9360 FHD i7 Iris | |
| Dell XPS 13 9380 2019 | |
| Dell XPS 13 9370 i7 UHD | |
| Dell Inspiron 13 7380 | |
| Genomsnitt Intel UHD Graphics 620 (927 - 2505, n=244) | |
| Dell XPS 13 9360-4764 | |
| Dell Latitude 13 3390 | |
| Dell Latitude 13 5300 2-in-1 | |
| HP ProBook 430 G6-5TJ89EA | |
| 3DMark 06 Standard Score | 10108 poäng | |
| 3DMark 11 Performance | 1896 poäng | |
| 3DMark Ice Storm Standard Score | 51629 poäng | |
| 3DMark Cloud Gate Standard Score | 8000 poäng | |
Hjälp | ||
| Dell Latitude 13 5300 2-in-1 UHD Graphics 620, i5-8365U, SK hynix PC401 HFS256GD9TNG | Lenovo ThinkPad X390-20Q1S02M00 UHD Graphics 620, i5-8265U, Intel SSD Pro 7600p SSDPEKKF512G8L | Huawei MateBook 13 i7 GeForce MX150, i7-8565U, Samsung SSD PM981 MZVLB512HAJQ | Samsung Notebook 9 NP930QAA UHD Graphics 620, i5-8550U, Samsung PM961 MZVLW256HEHP | HP Spectre x360 13t-ae000 UHD Graphics 620, i5-8550U, Lite-On CA1-8D256-HP | HP EliteBook x360 1030 G3 45X96UT UHD Graphics 620, i7-8650U, Samsung SSD PM981 MZVLB512HAJQ | |
|---|---|---|---|---|---|---|
| Noise | 2% | -1% | 2% | 7% | 6% | |
| av / miljö * (dB) | 28.5 | 29.2 -2% | 28.6 -0% | 29 -2% | 28.2 1% | 28.5 -0% |
| Idle Minimum * (dB) | 28.5 | 29.2 -2% | 28.6 -0% | 29 -2% | 28.2 1% | 28.5 -0% |
| Idle Average * (dB) | 28.5 | 29.2 -2% | 28.6 -0% | 29 -2% | 28.2 1% | 28.5 -0% |
| Idle Maximum * (dB) | 28.5 | 29.2 -2% | 28.6 -0% | 29 -2% | 28.2 1% | 28.5 -0% |
| Load Average * (dB) | 35.5 | 34.8 2% | 34.2 4% | 32.6 8% | 30.7 14% | 30.8 13% |
| Load Maximum * (dB) | 42.1 | 34.8 17% | 47 -12% | 36.7 13% | 32.9 22% | 32.8 22% |
| Witcher 3 ultra * (dB) | 43 |
* ... mindre är bättre
Ljudnivå
| Låg belastning |
| 28.5 / 28.5 / 28.5 dB(A) |
| Hög belastning |
| 35.5 / 42.1 dB(A) |
 | ||
30 dB tyst 40 dB(A) hörbar 50 dB(A) högt ljud |
||
min: | ||
(-) Den maximala temperaturen på ovansidan är 47.2 °C / 117 F, jämfört med genomsnittet av 34.3 °C / 94 F , allt från 21.2 till 62.5 °C för klassen Office.
(-) Botten värms upp till maximalt 60 °C / 140 F, jämfört med genomsnittet av 36.8 °C / 98 F
(+) Vid tomgångsbruk är medeltemperaturen för ovansidan 28.7 °C / 84 F, jämfört med enhetsgenomsnittet på 29.5 °C / ### class_avg_f### F.
(+) Handledsstöden och pekplattan är kallare än hudtemperaturen med maximalt 31.2 °C / 88.2 F och är därför svala att ta på.
(-) Medeltemperaturen för handledsstödsområdet på liknande enheter var 27.5 °C / 81.5 F (-3.7 °C / -6.7 F).
Dell Latitude 13 5300 2-in-1 ljudanalys
(+) | högtalare kan spela relativt högt (83.7 dB)
Bas 100 - 315 Hz
(±) | reducerad bas - i genomsnitt 12.5% lägre än medianen
(±) | linjäriteten för basen är genomsnittlig (10.6% delta till föregående frekvens)
Mellan 400 - 2000 Hz
(+) | balanserad mellan - endast 3.9% från medianen
(+) | mids är linjära (6.8% delta till föregående frekvens)
Högsta 2 - 16 kHz
(+) | balanserade toppar - endast 1.6% från medianen
(+) | toppar är linjära (4.9% delta till föregående frekvens)
Totalt 100 - 16 000 Hz
(+) | det totala ljudet är linjärt (14.5% skillnad mot median)
Jämfört med samma klass
» 11% av alla testade enheter i den här klassen var bättre, 3% liknande, 86% sämre
» Den bästa hade ett delta på 7%, genomsnittet var 21%, sämst var 53%
Jämfört med alla testade enheter
» 18% av alla testade enheter var bättre, 4% liknande, 78% sämre
» Den bästa hade ett delta på 4%, genomsnittet var 24%, sämst var 134%
Apple MacBook 12 (Early 2016) 1.1 GHz ljudanalys
(+) | högtalare kan spela relativt högt (83.6 dB)
Bas 100 - 315 Hz
(±) | reducerad bas - i genomsnitt 11.3% lägre än medianen
(±) | linjäriteten för basen är genomsnittlig (14.2% delta till föregående frekvens)
Mellan 400 - 2000 Hz
(+) | balanserad mellan - endast 2.4% från medianen
(+) | mids är linjära (5.5% delta till föregående frekvens)
Högsta 2 - 16 kHz
(+) | balanserade toppar - endast 2% från medianen
(+) | toppar är linjära (4.5% delta till föregående frekvens)
Totalt 100 - 16 000 Hz
(+) | det totala ljudet är linjärt (10.2% skillnad mot median)
Jämfört med samma klass
» 7% av alla testade enheter i den här klassen var bättre, 2% liknande, 91% sämre
» Den bästa hade ett delta på 5%, genomsnittet var 18%, sämst var 53%
Jämfört med alla testade enheter
» 4% av alla testade enheter var bättre, 1% liknande, 94% sämre
» Den bästa hade ett delta på 4%, genomsnittet var 24%, sämst var 134%
| Av/Standby | |
| Låg belastning | |
| Hög belastning |
|
Förklaring:
min: | |
| Dell Latitude 13 5300 2-in-1 i5-8365U, UHD Graphics 620, SK hynix PC401 HFS256GD9TNG, IPS, 1920x1080, 13.3" | Lenovo ThinkPad X390-20Q1S02M00 i5-8265U, UHD Graphics 620, Intel SSD Pro 7600p SSDPEKKF512G8L, IPS LED, 1920x1080, 13.3" | Huawei MateBook 13 i7 i7-8565U, GeForce MX150, Samsung SSD PM981 MZVLB512HAJQ, IPS, 2160x1440, 13" | Samsung Notebook 9 NP930QAA i5-8550U, UHD Graphics 620, Samsung PM961 MZVLW256HEHP, IPS, 1920x1080, 13.3" | HP Spectre x360 13t-ae000 i5-8550U, UHD Graphics 620, Lite-On CA1-8D256-HP, IPS, 3840x2160, 13.3" | HP EliteBook 735 G5 3UN62EA R7 2700U, Vega 10, Toshiba KBG30ZMV256G, IPS, 1920x1080, 13.3" | HP EliteBook x360 1030 G3 45X96UT i7-8650U, UHD Graphics 620, Samsung SSD PM981 MZVLB512HAJQ, IPS, 1920x1080, 13.3" | |
|---|---|---|---|---|---|---|---|
| Power Consumption | -14% | -43% | -53% | -40% | -43% | -21% | |
| Idle Minimum * (Watt) | 2.8 | 3.4 -21% | 3.5 -25% | 4.4 -57% | 5.9 -111% | 5.5 -96% | 3.4 -21% |
| Idle Average * (Watt) | 5.1 | 5.6 -10% | 7.5 -47% | 11.8 -131% | 9.8 -92% | 9.4 -84% | 7.6 -49% |
| Idle Maximum * (Watt) | 7.1 | 8.7 -23% | 12.4 -75% | 15.5 -118% | 10.6 -49% | 11.6 -63% | 11.5 -62% |
| Load Average * (Watt) | 39.9 | 43.6 -9% | 64.2 -61% | 38 5% | 36.6 8% | 39 2% | 35.4 11% |
| Load Maximum * (Watt) | 60.3 | 65 -8% | 65.7 -9% | 39.8 34% | 34.3 43% | 45.6 24% | 51.9 14% |
| Witcher 3 ultra * (Watt) | 52.5 |
* ... mindre är bättre
| Dell Latitude 13 5300 2-in-1 i5-8365U, UHD Graphics 620, 60 Wh | Lenovo ThinkPad X390-20Q1S02M00 i5-8265U, UHD Graphics 620, 48 Wh | Huawei MateBook 13 i7 i7-8565U, GeForce MX150, 41.7 Wh | Samsung Notebook 9 NP930QAA i5-8550U, UHD Graphics 620, 39 Wh | HP Spectre x360 13t-ae000 i5-8550U, UHD Graphics 620, 60 Wh | HP EliteBook x360 1030 G3 45X96UT i7-8650U, UHD Graphics 620, 56.2 Wh | |
|---|---|---|---|---|---|---|
| Batteridrifttid | -22% | -43% | -43% | -19% | -6% | |
| Reader / Idle (h) | 28.3 | 15.4 -46% | 14.6 -48% | |||
| WiFi v1.3 (h) | 10.4 | 8.3 -20% | 7.6 -27% | 6.6 -37% | 7.1 -32% | 9.8 -6% |
| Load (h) | 2.1 | 1.6 -24% | 0.9 -57% | 1.2 -43% | 2 -5% |
För
Emot
Läs den fullständiga versionen av den här recensionen på engelska här.
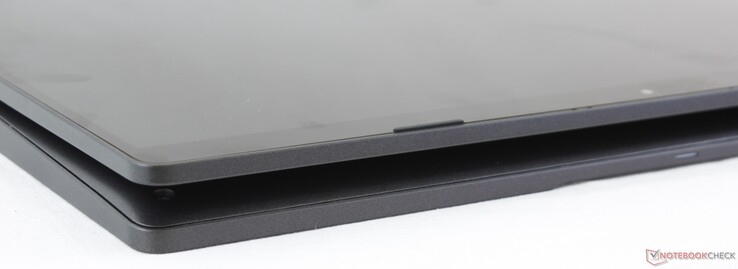
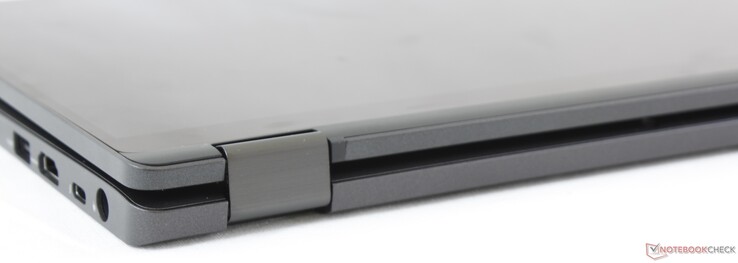
Dell Latitude 13 5300 2-in-1 får jobbet gjort, men den gör det varken bättre eller sämre än någon annan och står därför inte ut jämfört med andra bärbara företagsinriktade subnotebooks. 360-gradersgångjärnen är praktiska, men datorn väger också en aning mer än motsvarande modeller från Lenovo och HP. Den har stöd för en aktiv stylus, men den magnetiska hållaren är inte lika säker som en inbyggd fördjupning eller en fysisk rem. Den har lång batteritid men kommer ändå med en propretiär AC-adapter som standard istället för det smidigare och mer universella USB Typ C.
Den bästa aspekten av denna omvandlingsbara Latitude är servicemöjligheterna. Dell gör det riktigt enkelt för slutanvändaren att uppgradera komponenterna utan att något annat än en Philips-skruvmejsel behövs. Toppskiktsfunktioner som Thunderbolt 3, Smart Card-läsare och WWAN är tillval istället för standard för att hålla priset nere för användare som inte behöver dessa funktioner. Mittenskiktsmodeller bör alltid handla om valmöjligheter och det finns definitivt rejält med möjligheter att få precis det man vill ha när man köper Latitude 5000.
Om du kan tänka dig att spendera lite mer pengar så är HP EliteBook x360 1030 G3 ett lättare och mer ljusstarkt alternativ som dessutom har fastare tangentbordsknappar. Annars är Latitude 13 5300 2-in-1 ett skapligt alternativ till den likvärdigt prissatta ThinkPad X390 Yoga då den är en aning starkare och mer uthållig. Vi rekommenderar att du hoppar över Core i7-processorn och istället investerar i en SKU med Core i5 och några mer påtagliga extrafunktioner som WWAN, Thunderbolt 3, extra lagring eller utökat skydd.
Det handlar helt som service, valmöjligheter och anslutbarhet. Latitude 13 5300 2-in-1 står på tre grundpelare som passar typiska kontors- eller hemmascenarier. Den kunde dock varit en aning lättare och haft en mer ljusstark skärm, vilket hade resulterat i bättre synlighet utomhus och gjort att den omvandlingsbara formfaktorn kunde ha utnyttjats ytterligare.
Dell Latitude 13 5300 2-in-1
- 10/17/2019 v7 (old)
Allen Ngo


