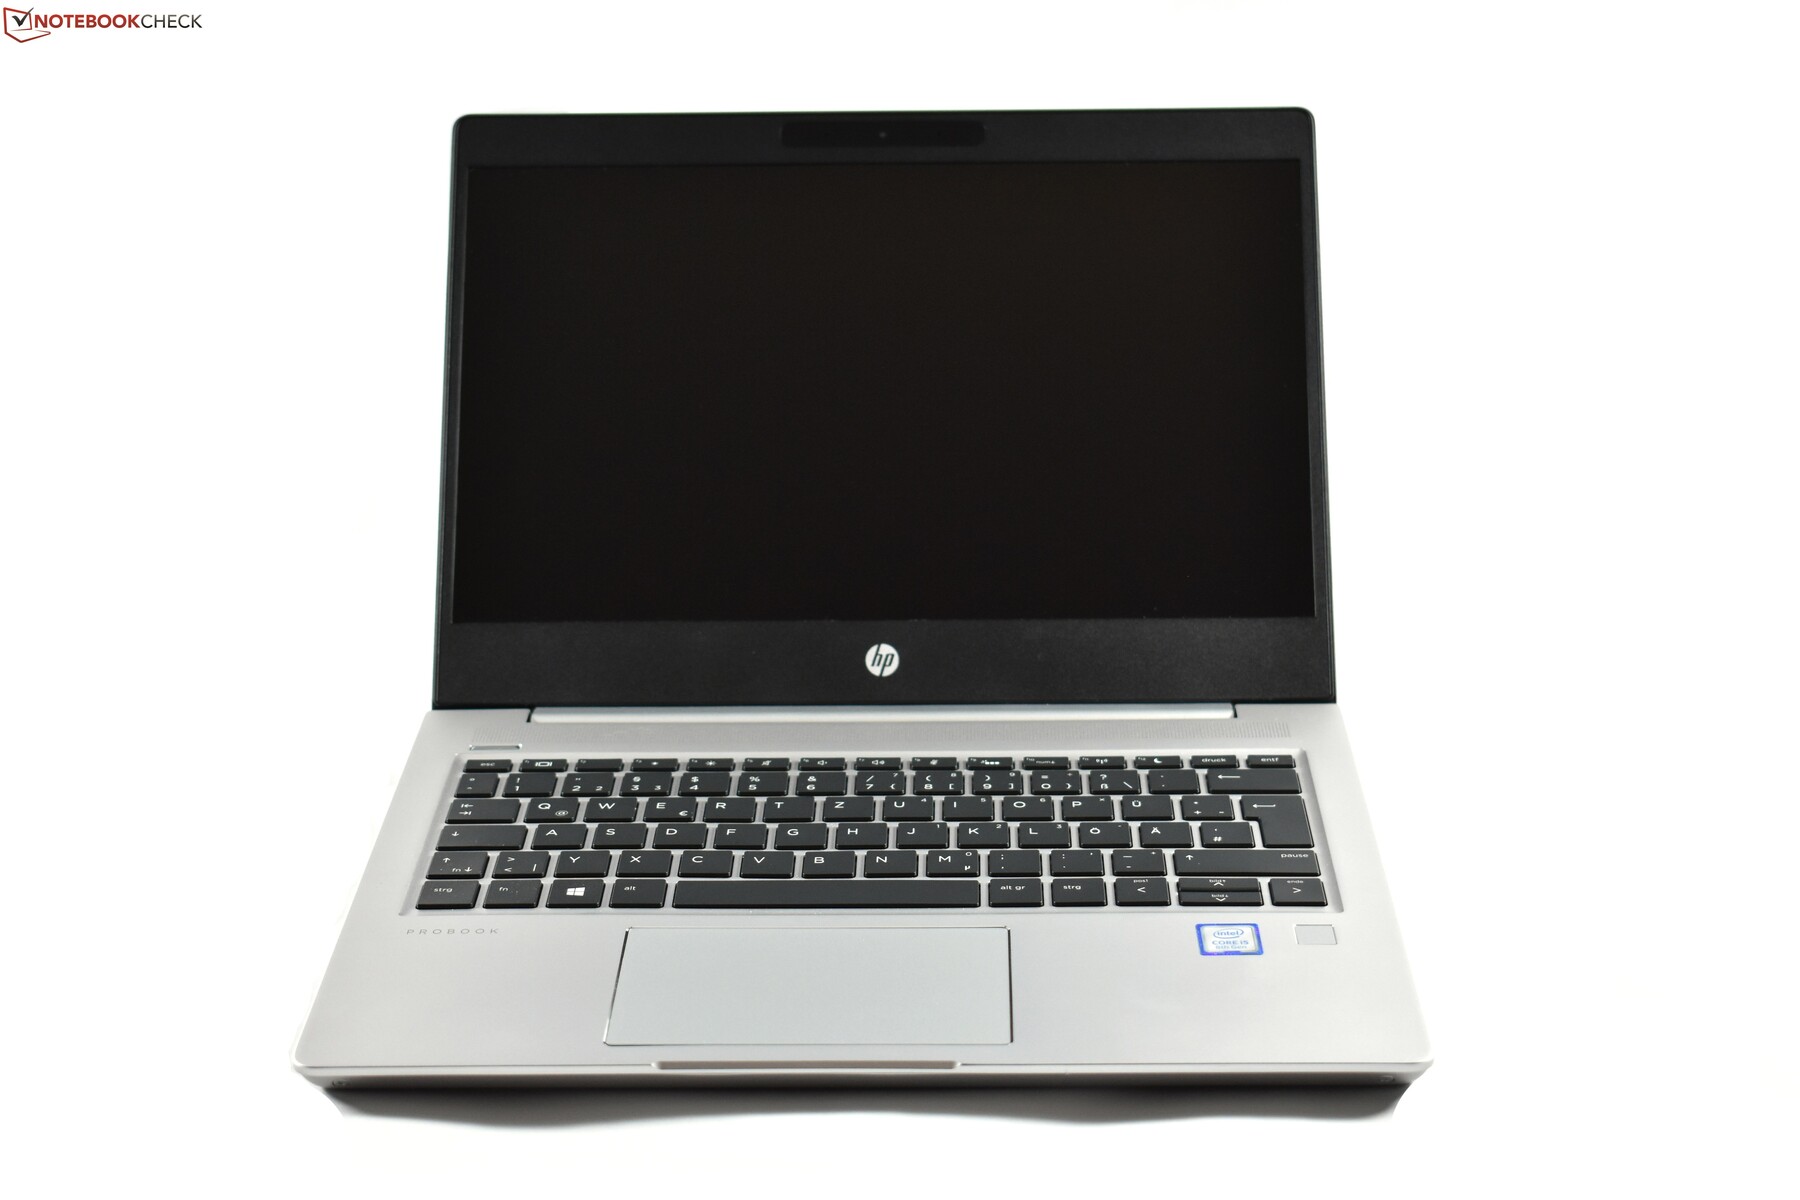
Test: HP ProBook 430 G6 (Core i5-8265U, 8 GB RAM, 256 GB SSD, FHD) Laptop (Sammanfattning)
| SD Card Reader | |
| average JPG Copy Test (av. of 3 runs) | |
| Dell XPS 13 9380 2019 (Toshiba Exceria Pro SDXC 64 GB UHS-II) | |
| Dell Latitude 7390 (Toshiba Exceria Pro M501) | |
| HP ProBook 430 G5-3KX72ES (Toshiba Exceria Pro SDXC 64 GB UHS-II) | |
| Lenovo ThinkPad L390-20NR0013GE (Toshiba Exceria Pro M501 UHS-II) | |
| HP ProBook 430 G6-5TJ89EA (Toshiba Exceria Pro SDXC 64 GB UHS-II) | |
| Genomsnitt av klass Office (19.8 - 198.5, n=22, senaste 2 åren) | |
| maximum AS SSD Seq Read Test (1GB) | |
| Dell Latitude 7390 (Toshiba Exceria Pro M501) | |
| Dell XPS 13 9380 2019 (Toshiba Exceria Pro SDXC 64 GB UHS-II) | |
| HP ProBook 430 G5-3KX72ES (Toshiba Exceria Pro SDXC 64 GB UHS-II) | |
| Lenovo ThinkPad L390-20NR0013GE (Toshiba Exceria Pro M501 UHS-II) | |
| HP ProBook 430 G6-5TJ89EA (Toshiba Exceria Pro SDXC 64 GB UHS-II) | |
| Genomsnitt av klass Office (27.4 - 249, n=21, senaste 2 åren) | |
| Networking | |
| iperf3 transmit AX12 | |
| Lenovo ThinkPad L390-20NR0013GE | |
| HP ProBook 430 G6-5TJ89EA | |
| HP ProBook 430 G5-3KX72ES | |
| Dell XPS 13 9380 2019 | |
| HP EliteBook 830 G5-3JX74EA | |
| Dell Latitude 7390 | |
| iperf3 receive AX12 | |
| Lenovo ThinkPad L390-20NR0013GE | |
| HP ProBook 430 G6-5TJ89EA | |
| HP ProBook 430 G5-3KX72ES | |
| HP EliteBook 830 G5-3JX74EA | |
| Dell Latitude 7390 | |
| Dell XPS 13 9380 2019 | |
| |||||||||||||||||||||||||
Distribution av ljusstyrkan: 88 %
Mitt på batteriet: 254 cd/m²
Kontrast: 1417:1 (Svärta: 0.18 cd/m²)
ΔE ColorChecker Calman: 5.4 | ∀{0.5-29.43 Ø4.71}
calibrated: 4.1
ΔE Greyscale Calman: 3.8 | ∀{0.09-98 Ø4.96}
62.5% sRGB (Argyll 1.6.3 3D)
39.4% AdobeRGB 1998 (Argyll 1.6.3 3D)
43.3% AdobeRGB 1998 (Argyll 3D)
62.6% sRGB (Argyll 3D)
41.87% Display P3 (Argyll 3D)
Gamma: 2.41
CCT: 7100 K
| HP ProBook 430 G6-5TJ89EA CMN1375, , 1920x1080, 13.3" | Lenovo ThinkPad L390-20NR0013GE LP133WF2-SPL8, , 1920x1080, 13.3" | HP ProBook 430 G5-3KX72ES LGD052D, , 1920x1080, 13.3" | HP EliteBook 830 G5-3JX74EA IVO M133NVF3-R0, , 1920x1080, 13.3" | Dell Latitude 7390 AU Optronics AUO462D / B133HAN [DELL P/N:F7VDJ], , 1920x1080, 13.3" | Dell XPS 13 9380 2019 ID: AUO 282B B133ZAN Dell: 90NTH, , 3840x2160, 13.3" | |
|---|---|---|---|---|---|---|
| Display | -3% | -4% | 49% | 51% | 52% | |
| Display P3 Coverage (%) | 41.87 | 40.42 -3% | 40.23 -4% | 64.2 53% | 65.1 55% | 64.7 55% |
| sRGB Coverage (%) | 62.6 | 60.4 -4% | 60.3 -4% | 89.2 42% | 90.8 45% | 93.1 49% |
| AdobeRGB 1998 Coverage (%) | 43.3 | 41.8 -3% | 41.59 -4% | 65.2 51% | 65.9 52% | 65.3 51% |
| Response Times | -2% | 5% | 15% | -18% | -30% | |
| Response Time Grey 50% / Grey 80% * (ms) | 40.8 ? | 42.8 ? -5% | 41.6 ? -2% | 36 ? 12% | 48.8 ? -20% | 58 ? -42% |
| Response Time Black / White * (ms) | 30.4 ? | 30 ? 1% | 27.2 ? 11% | 24.8 ? 18% | 35.2 ? -16% | 36 ? -18% |
| PWM Frequency (Hz) | 26040 ? | 30490 ? | 20490 ? | 1020 ? | ||
| Screen | -19% | -12% | 19% | 22% | 20% | |
| Brightness middle (cd/m²) | 255 | 298 17% | 262 3% | 316 24% | 329 29% | 404 58% |
| Brightness (cd/m²) | 238 | 278 17% | 253 6% | 326 37% | 316 33% | 389 63% |
| Brightness Distribution (%) | 88 | 81 -8% | 82 -7% | 85 -3% | 92 5% | 85 -3% |
| Black Level * (cd/m²) | 0.18 | 0.33 -83% | 0.28 -56% | 0.19 -6% | 0.25 -39% | 0.37 -106% |
| Contrast (:1) | 1417 | 903 -36% | 936 -34% | 1663 17% | 1316 -7% | 1092 -23% |
| Colorchecker dE 2000 * | 5.4 | 6.5 -20% | 5.7 -6% | 4.5 17% | 4.3 20% | 3.72 31% |
| Colorchecker dE 2000 max. * | 19.5 | 23.9 -23% | 22.4 -15% | 12.1 38% | 7.8 60% | 7.38 62% |
| Colorchecker dE 2000 calibrated * | 4.1 | 4.9 -20% | 4.8 -17% | 2.9 29% | 2.5 39% | 2.06 50% |
| Greyscale dE 2000 * | 3.8 | 5.6 -47% | 3.6 5% | 5 -32% | 3.6 5% | 4.44 -17% |
| Gamma | 2.41 91% | 2.08 106% | 2.15 102% | 2.22 99% | 2.43 91% | 2.34 94% |
| CCT | 7100 92% | 6669 97% | 7096 92% | 6018 108% | 6928 94% | 7095 92% |
| Color Space (Percent of AdobeRGB 1998) (%) | 39.4 | 38.4 -3% | 38.3 -3% | 57.9 47% | 59.1 50% | 60 52% |
| Color Space (Percent of sRGB) (%) | 62.5 | 60.1 -4% | 60.1 -4% | 87.3 40% | 90.6 45% | 93 49% |
| Totalt genomsnitt (program/inställningar) | -8% /
-14% | -4% /
-8% | 28% /
24% | 18% /
22% | 14% /
19% |
* ... mindre är bättre
Visa svarstider
| ↔ Svarstid svart till vitt | ||
|---|---|---|
| 30.4 ms ... stiga ↗ och falla ↘ kombinerat | ↗ 16.4 ms stiga | 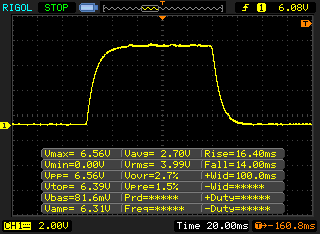 |
| ↘ 14 ms hösten | ||
| Skärmen visar långsamma svarsfrekvenser i våra tester och kommer att vara otillfredsställande för spelare. I jämförelse sträcker sig alla testade enheter från 0.1 (minst) till 240 (maximalt) ms. » 82 % av alla enheter är bättre. Detta innebär att den uppmätta svarstiden är sämre än genomsnittet av alla testade enheter (19.8 ms). | ||
| ↔ Svarstid 50 % grått till 80 % grått | ||
| 40.8 ms ... stiga ↗ och falla ↘ kombinerat | ↗ 22.8 ms stiga | 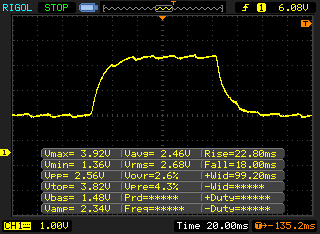 |
| ↘ 18 ms hösten | ||
| Skärmen visar långsamma svarsfrekvenser i våra tester och kommer att vara otillfredsställande för spelare. I jämförelse sträcker sig alla testade enheter från 0.165 (minst) till 636 (maximalt) ms. » 64 % av alla enheter är bättre. Detta innebär att den uppmätta svarstiden är sämre än genomsnittet av alla testade enheter (30.9 ms). | ||
Skärmflimmer / PWM (Puls-Width Modulation)
| Skärmflimmer / PWM upptäckt | 26040 Hz | ≤ 40 % ljusstyrka inställning | 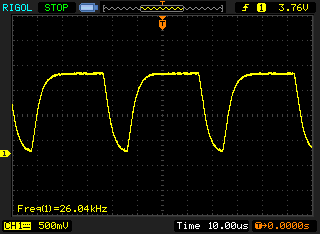 |
Displayens bakgrundsbelysning flimrar vid 26040 Hz (i värsta fall, t.ex. med PWM) Flimrande upptäckt vid en ljusstyrkeinställning på 40 % och lägre. Det ska inte finnas något flimmer eller PWM över denna ljusstyrkeinställning. Frekvensen för 26040 Hz är ganska hög, så de flesta användare som är känsliga för PWM bör inte märka något flimmer. Som jämförelse: 52 % av alla testade enheter använder inte PWM för att dämpa skärmen. Om PWM upptäcktes mättes ett medelvärde av 7748 (minst: 5 - maximum: 343500) Hz. | |||
| PCMark 8 | |
| Home Score Accelerated v2 | |
| Genomsnitt av klass Office (n=1senaste 2 åren) | |
| HP EliteBook 830 G5-3JX74EA | |
| HP ProBook 430 G5-3KX72ES | |
| Dell Latitude 7390 | |
| Dell XPS 13 9380 2019 | |
| Genomsnitt Intel Core i5-8265U, Intel UHD Graphics 620 (2747 - 4244, n=24) | |
| Lenovo ThinkPad L390-20NR0013GE | |
| HP ProBook 430 G6-5TJ89EA | |
| Work Score Accelerated v2 | |
| Genomsnitt av klass Office (n=1senaste 2 åren) | |
| HP EliteBook 830 G5-3JX74EA | |
| HP ProBook 430 G6-5TJ89EA | |
| Dell Latitude 7390 | |
| Lenovo ThinkPad L390-20NR0013GE | |
| HP ProBook 430 G5-3KX72ES | |
| Genomsnitt Intel Core i5-8265U, Intel UHD Graphics 620 (3132 - 4927, n=23) | |
| Dell XPS 13 9380 2019 | |
| PCMark 8 Home Score Accelerated v2 | 3342 poäng | |
| PCMark 8 Work Score Accelerated v2 | 4887 poäng | |
| PCMark 10 Score | 3753 poäng | |
Hjälp | ||
| HP ProBook 430 G6-5TJ89EA WDC PC SN520 SDAPNUW-256G | Lenovo ThinkPad L390-20NR0013GE Samsung SSD PM981 MZVLB256HAHQ | HP ProBook 430 G5-3KX72ES Toshiba XG5 KXG50ZNV512G | HP EliteBook 830 G5-3JX74EA Samsung SSD PM961 1TB M.2 PCIe 3.0 x4 NVMe (MZVLW1T0) | Dell XPS 13 9380 2019 SK hynix PC401 HFS256GD9TNG | Genomsnitt WDC PC SN520 SDAPNUW-256G | |
|---|---|---|---|---|---|---|
| CrystalDiskMark 5.2 / 6 | 24% | -9% | 22% | -14% | -1% | |
| Write 4K (MB/s) | 101.8 | 99.6 -2% | 111.3 9% | 108.5 7% | 84.6 -17% | 118.5 ? 16% |
| Read 4K (MB/s) | 41.35 | 37.22 -10% | 32.46 -21% | 40.53 -2% | 38.52 -7% | 42 ? 2% |
| Write Seq (MB/s) | 929 | 1432 54% | 526 -43% | 1026 10% | 557 -40% | 1123 ? 21% |
| Read Seq (MB/s) | 1388 | 2072 49% | 1430 3% | 2080 50% | 1393 0% | 1208 ? -13% |
| Write 4K Q32T1 (MB/s) | 453.5 | 439.7 -3% | 516 14% | 451 -1% | 339.5 -25% | 324 ? -29% |
| Read 4K Q32T1 (MB/s) | 286.2 | 264.8 -7% | 366.6 28% | 269.7 -6% | 255.4 -11% | 322 ? 13% |
| Write Seq Q32T1 (MB/s) | 1302 | 1549 19% | 524 -60% | 1770 36% | 558 -57% | 1091 ? -16% |
| Read Seq Q32T1 (MB/s) | 1751 | 3318 89% | 1783 2% | 3214 84% | 2541 45% | 1729 ? -1% |

| 3DMark 11 - 1280x720 Performance GPU | |
| Genomsnitt av klass Office (2551 - 18313, n=72, senaste 2 åren) | |
| Dell XPS 13 9380 2019 | |
| Genomsnitt Intel UHD Graphics 620 (1144 - 3432, n=244) | |
| HP EliteBook 830 G5-3JX74EA | |
| Lenovo ThinkPad L390-20NR0013GE | |
| HP ProBook 430 G6-5TJ89EA | |
| HP ProBook 430 G5-3KX72ES | |
| Dell Latitude 7390 | |
| 3DMark | |
| 1280x720 Cloud Gate Standard Graphics | |
| Genomsnitt av klass Office (11640 - 118515, n=38, senaste 2 åren) | |
| Dell XPS 13 9380 2019 | |
| HP EliteBook 830 G5-3JX74EA | |
| Genomsnitt Intel UHD Graphics 620 (6205 - 16400, n=225) | |
| HP ProBook 430 G5-3KX72ES | |
| HP ProBook 430 G6-5TJ89EA | |
| Lenovo ThinkPad L390-20NR0013GE | |
| Dell Latitude 7390 | |
| 1920x1080 Fire Strike Graphics | |
| Genomsnitt av klass Office (736 - 21871, n=75, senaste 2 åren) | |
| HP EliteBook 830 G5-3JX74EA | |
| Genomsnitt Intel UHD Graphics 620 (557 - 2608, n=213) | |
| HP ProBook 430 G5-3KX72ES | |
| HP ProBook 430 G6-5TJ89EA | |
| Lenovo ThinkPad L390-20NR0013GE | |
| Dell Latitude 7390 | |
| 3DMark 11 Performance | 1851 poäng | |
| 3DMark Cloud Gate Standard Score | 7644 poäng | |
| 3DMark Fire Strike Score | 969 poäng | |
Hjälp | ||
| låg | med. | hög | ultra | |
|---|---|---|---|---|
| BioShock Infinite (2013) | 54.7 | 30.19 | 24.32 | 7.36 |
| The Witcher 3 (2015) | 15.2 | |||
| Dota 2 Reborn (2015) | 63.8 | 38.2 | 18.1 | 16.2 |
| Civilization 6 (2016) | 43.8 | 16 | ||
| X-Plane 11.11 (2018) | 30.3 | 22.7 | 19.1 |
Ljudnivå
| Låg belastning |
| 29.4 / 29.4 / 30 dB(A) |
| Hög belastning |
| 32.5 / 32.5 dB(A) |
 | ||
30 dB tyst 40 dB(A) hörbar 50 dB(A) högt ljud |
||
min: | ||
(+) Den maximala temperaturen på ovansidan är 38.3 °C / 101 F, jämfört med genomsnittet av 34.3 °C / 94 F , allt från 21.2 till 62.5 °C för klassen Office.
(±) Botten värms upp till maximalt 41.1 °C / 106 F, jämfört med genomsnittet av 36.8 °C / 98 F
(+) Vid tomgångsbruk är medeltemperaturen för ovansidan 23.2 °C / 74 F, jämfört med enhetsgenomsnittet på 29.5 °C / ### class_avg_f### F.
(+) Handledsstöden och pekplattan är kallare än hudtemperaturen med maximalt 25.2 °C / 77.4 F och är därför svala att ta på.
(+) Medeltemperaturen för handledsstödsområdet på liknande enheter var 27.5 °C / 81.5 F (+2.3 °C / 4.1 F).
HP ProBook 430 G6-5TJ89EA ljudanalys
(±) | högtalarljudstyrkan är genomsnittlig men bra (74.1 dB)
Bas 100 - 315 Hz
(-) | nästan ingen bas - i genomsnitt 19.7% lägre än medianen
(±) | linjäriteten för basen är genomsnittlig (10.2% delta till föregående frekvens)
Mellan 400 - 2000 Hz
(+) | balanserad mellan - endast 3.1% från medianen
(+) | mids är linjära (5.6% delta till föregående frekvens)
Högsta 2 - 16 kHz
(+) | balanserade toppar - endast 3.7% från medianen
(+) | toppar är linjära (6.3% delta till föregående frekvens)
Totalt 100 - 16 000 Hz
(±) | linjäriteten för det totala ljudet är genomsnittlig (21.3% skillnad mot median)
Jämfört med samma klass
» 52% av alla testade enheter i den här klassen var bättre, 9% liknande, 39% sämre
» Den bästa hade ett delta på 7%, genomsnittet var 21%, sämst var 53%
Jämfört med alla testade enheter
» 60% av alla testade enheter var bättre, 7% liknande, 33% sämre
» Den bästa hade ett delta på 4%, genomsnittet var 23%, sämst var 134%
Lenovo ThinkPad L390-20NR0013GE ljudanalys
(±) | högtalarljudstyrkan är genomsnittlig men bra (76.1 dB)
Bas 100 - 315 Hz
(-) | nästan ingen bas - i genomsnitt 18.2% lägre än medianen
(±) | linjäriteten för basen är genomsnittlig (11.5% delta till föregående frekvens)
Mellan 400 - 2000 Hz
(+) | balanserad mellan - endast 2.1% från medianen
(+) | mids är linjära (6.3% delta till föregående frekvens)
Högsta 2 - 16 kHz
(±) | högre toppar - i genomsnitt 7.1% högre än medianen
(+) | toppar är linjära (4.2% delta till föregående frekvens)
Totalt 100 - 16 000 Hz
(±) | linjäriteten för det totala ljudet är genomsnittlig (22% skillnad mot median)
Jämfört med samma klass
» 58% av alla testade enheter i den här klassen var bättre, 8% liknande, 34% sämre
» Den bästa hade ett delta på 7%, genomsnittet var 21%, sämst var 53%
Jämfört med alla testade enheter
» 64% av alla testade enheter var bättre, 6% liknande, 30% sämre
» Den bästa hade ett delta på 4%, genomsnittet var 23%, sämst var 134%
HP EliteBook 830 G5-3JX74EA ljudanalys
(+) | högtalare kan spela relativt högt (82.7 dB)
Bas 100 - 315 Hz
(-) | nästan ingen bas - i genomsnitt 19.9% lägre än medianen
(±) | linjäriteten för basen är genomsnittlig (11.3% delta till föregående frekvens)
Mellan 400 - 2000 Hz
(+) | balanserad mellan - endast 2.3% från medianen
(+) | mids är linjära (4.8% delta till föregående frekvens)
Högsta 2 - 16 kHz
(+) | balanserade toppar - endast 4% från medianen
(+) | toppar är linjära (5.6% delta till föregående frekvens)
Totalt 100 - 16 000 Hz
(±) | linjäriteten för det totala ljudet är genomsnittlig (17% skillnad mot median)
Jämfört med samma klass
» 44% av alla testade enheter i den här klassen var bättre, 8% liknande, 48% sämre
» Den bästa hade ett delta på 5%, genomsnittet var 18%, sämst var 53%
Jämfört med alla testade enheter
» 31% av alla testade enheter var bättre, 8% liknande, 61% sämre
» Den bästa hade ett delta på 4%, genomsnittet var 23%, sämst var 134%
| Av/Standby | |
| Låg belastning | |
| Hög belastning |
|
Förklaring:
min: | |
| HP ProBook 430 G6-5TJ89EA i5-8265U, UHD Graphics 620, WDC PC SN520 SDAPNUW-256G, IPS LED, 1920x1080, 13.3" | Lenovo ThinkPad L390-20NR0013GE i5-8265U, UHD Graphics 620, Samsung SSD PM981 MZVLB256HAHQ, IPS LED, 1920x1080, 13.3" | HP ProBook 430 G5-3KX72ES i5-8250U, UHD Graphics 620, Toshiba XG5 KXG50ZNV512G, IPS LED, 1920x1080, 13.3" | HP EliteBook 830 G5-3JX74EA i5-8550U, UHD Graphics 620, Samsung SSD PM961 1TB M.2 PCIe 3.0 x4 NVMe (MZVLW1T0), IPS LED, 1920x1080, 13.3" | Dell Latitude 7390 i5-8350U, UHD Graphics 620, SK hynix SC311 M.2, IPS, 1920x1080, 13.3" | Dell XPS 13 9380 2019 i5-8265U, UHD Graphics 620, SK hynix PC401 HFS256GD9TNG, IPS, 3840x2160, 13.3" | Genomsnitt Intel UHD Graphics 620 | Genomsnitt av klass Office | |
|---|---|---|---|---|---|---|---|---|
| Power Consumption | -10% | -12% | -19% | -3% | -25% | -8% | -24% | |
| Idle Minimum * (Watt) | 3.5 | 3.8 -9% | 4.5 -29% | 4.5 -29% | 2.34 33% | 4.8 -37% | 3.81 ? -9% | 4.26 ? -22% |
| Idle Average * (Watt) | 5.76 | 6.8 -18% | 6.8 -18% | 6.4 -11% | 5.6 3% | 8.6 -49% | 6.94 ? -20% | 7.31 ? -27% |
| Idle Maximum * (Watt) | 8.3 | 9.8 -18% | 8.8 -6% | 9.2 -11% | 6.5 22% | 10.4 -25% | 8.75 ? -5% | 8.55 ? -3% |
| Load Average * (Watt) | 34.8 | 32.4 7% | 36.8 -6% | 35.7 -3% | 43 -24% | 37.9 -9% | 35 ? -1% | 43.8 ? -26% |
| Load Maximum * (Watt) | 45.7 | 52 -14% | 46.2 -1% | 65.4 -43% | 67.4 -47% | 48.5 -6% | 47.5 ? -4% | 64.5 ? -41% |
* ... mindre är bättre
| HP ProBook 430 G6-5TJ89EA i5-8265U, UHD Graphics 620, 45 Wh | Lenovo ThinkPad L390-20NR0013GE i5-8265U, UHD Graphics 620, 45 Wh | HP ProBook 430 G5-3KX72ES i5-8250U, UHD Graphics 620, 48 Wh | HP EliteBook 830 G5-3JX74EA i5-8550U, UHD Graphics 620, 49 Wh | Dell Latitude 7390 i5-8350U, UHD Graphics 620, 60 Wh | Dell XPS 13 9380 2019 i5-8265U, UHD Graphics 620, 52 Wh | Genomsnitt av klass Office | |
|---|---|---|---|---|---|---|---|
| Batteridrifttid | -16% | -26% | -16% | 24% | -2% | 34% | |
| Reader / Idle (h) | 16.2 | 16.2 0% | 12.8 -21% | 27.7 71% | 17.2 6% | 24.5 ? 51% | |
| H.264 (h) | 9.1 | 9.4 3% | 8 -12% | 12.5 37% | 15.5 ? 70% | ||
| WiFi v1.3 (h) | 9.5 | 7 -26% | 7 -26% | 7.1 -25% | 8.3 -13% | 13.2 ? 39% | |
| Load (h) | 2.4 | 1.4 -42% | 2.3 -4% | 1.5 -37% | 2.4 0% | 1.808 ? -25% |
För
Emot
Läs den fullständiga versionen av den här recensionen på engelska här.
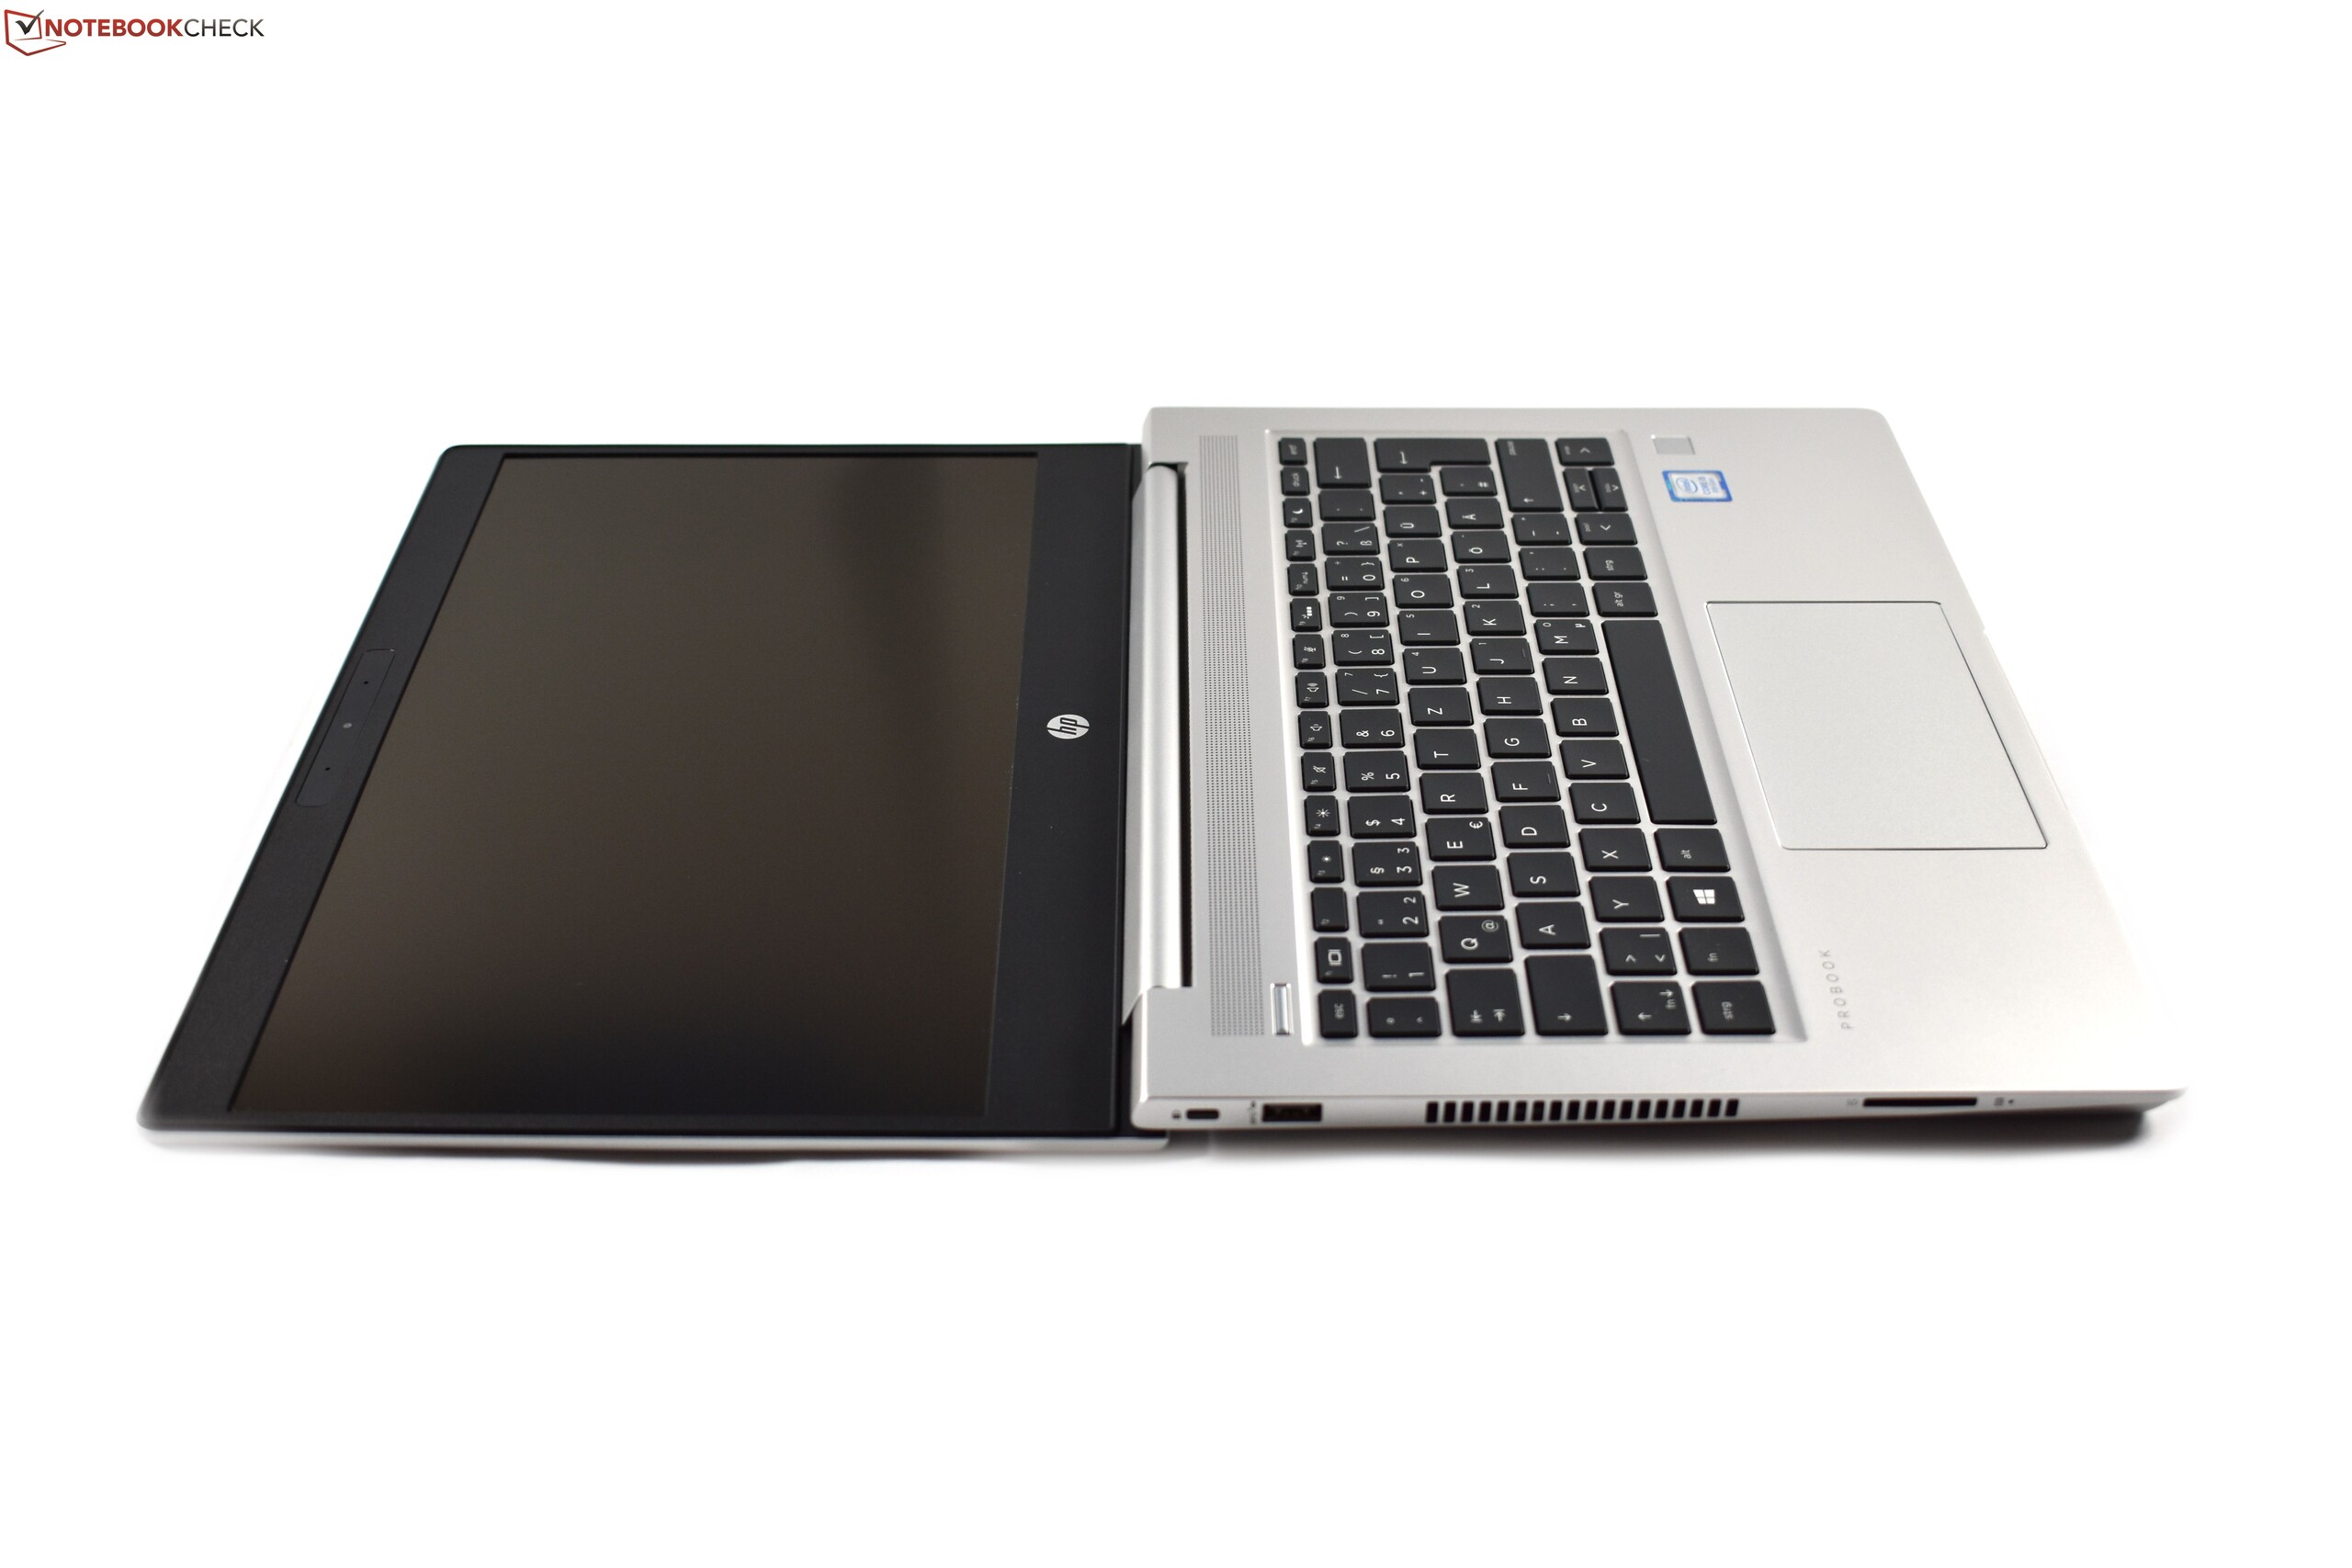
För att sammanfatta så är HP ProBook 430 G6 en framgång. Den påminner om sina dyrare EliteBook-syskon samtidigt som den håller sig billig, men HP har hållt kompromisserna till ett minimum vilket är ännu mer imponerande med tanke på den stora skillnaden i pris mellan ProBook 430 G6 och EliteBook 830 G5.
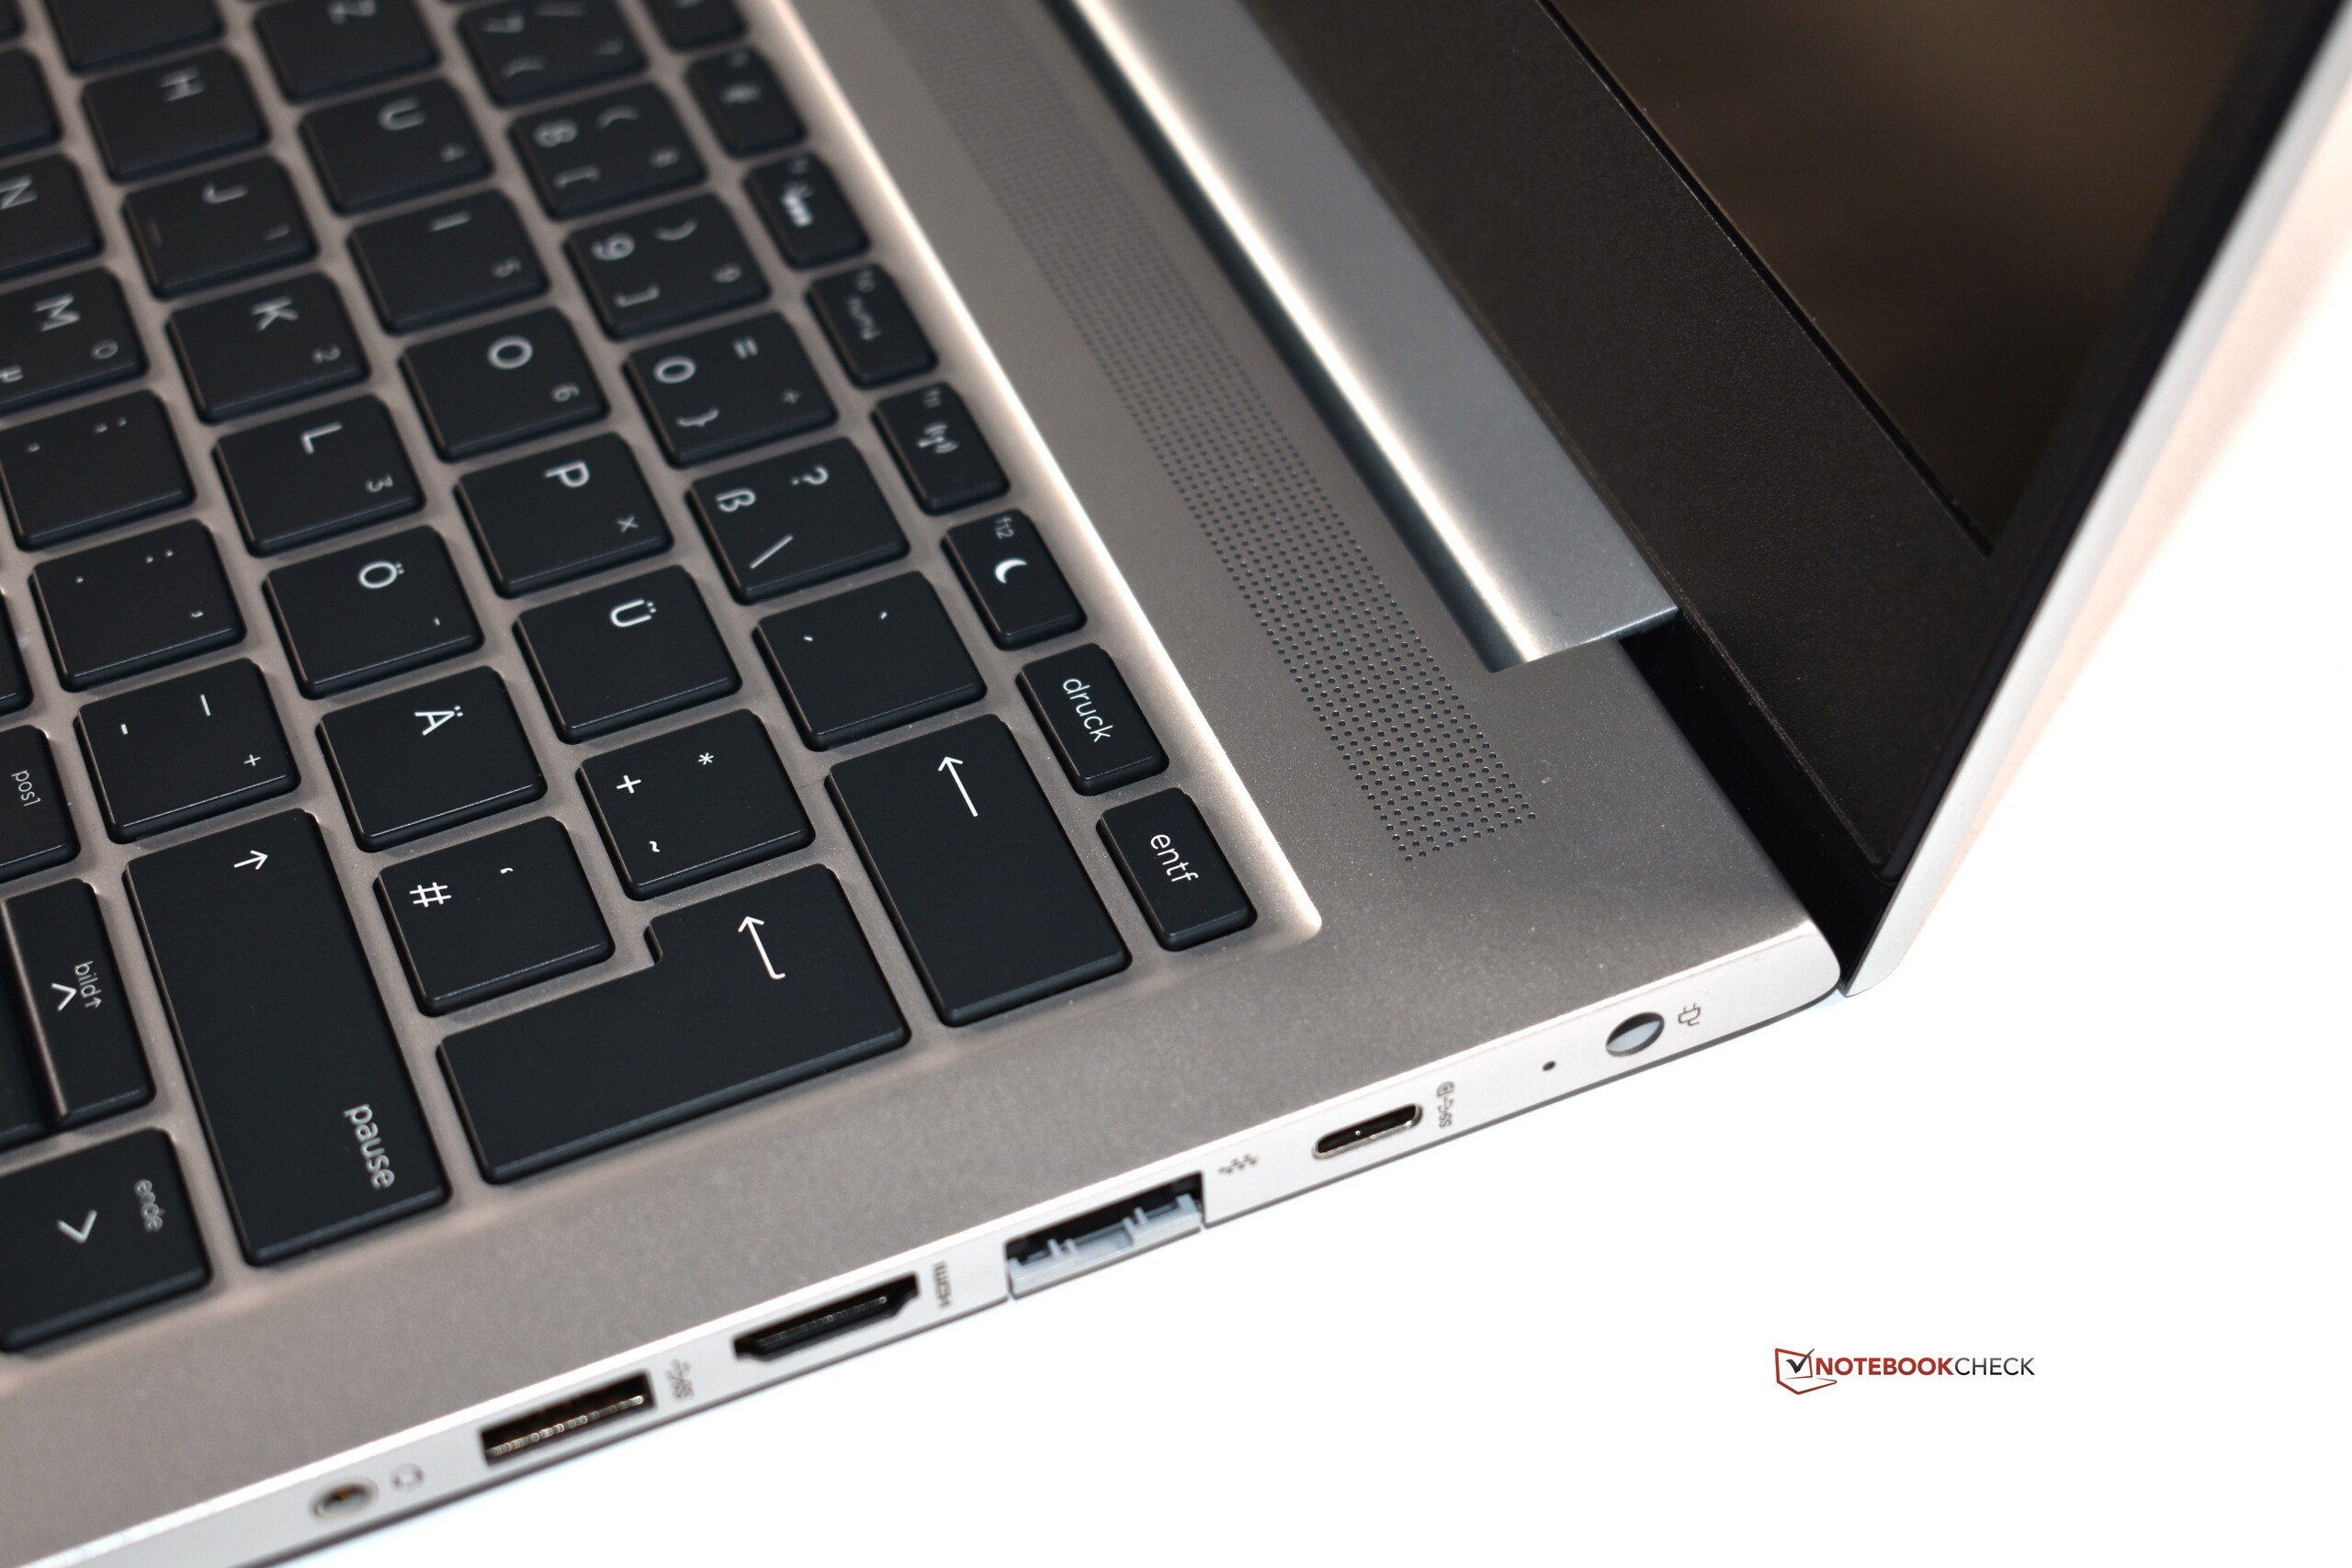
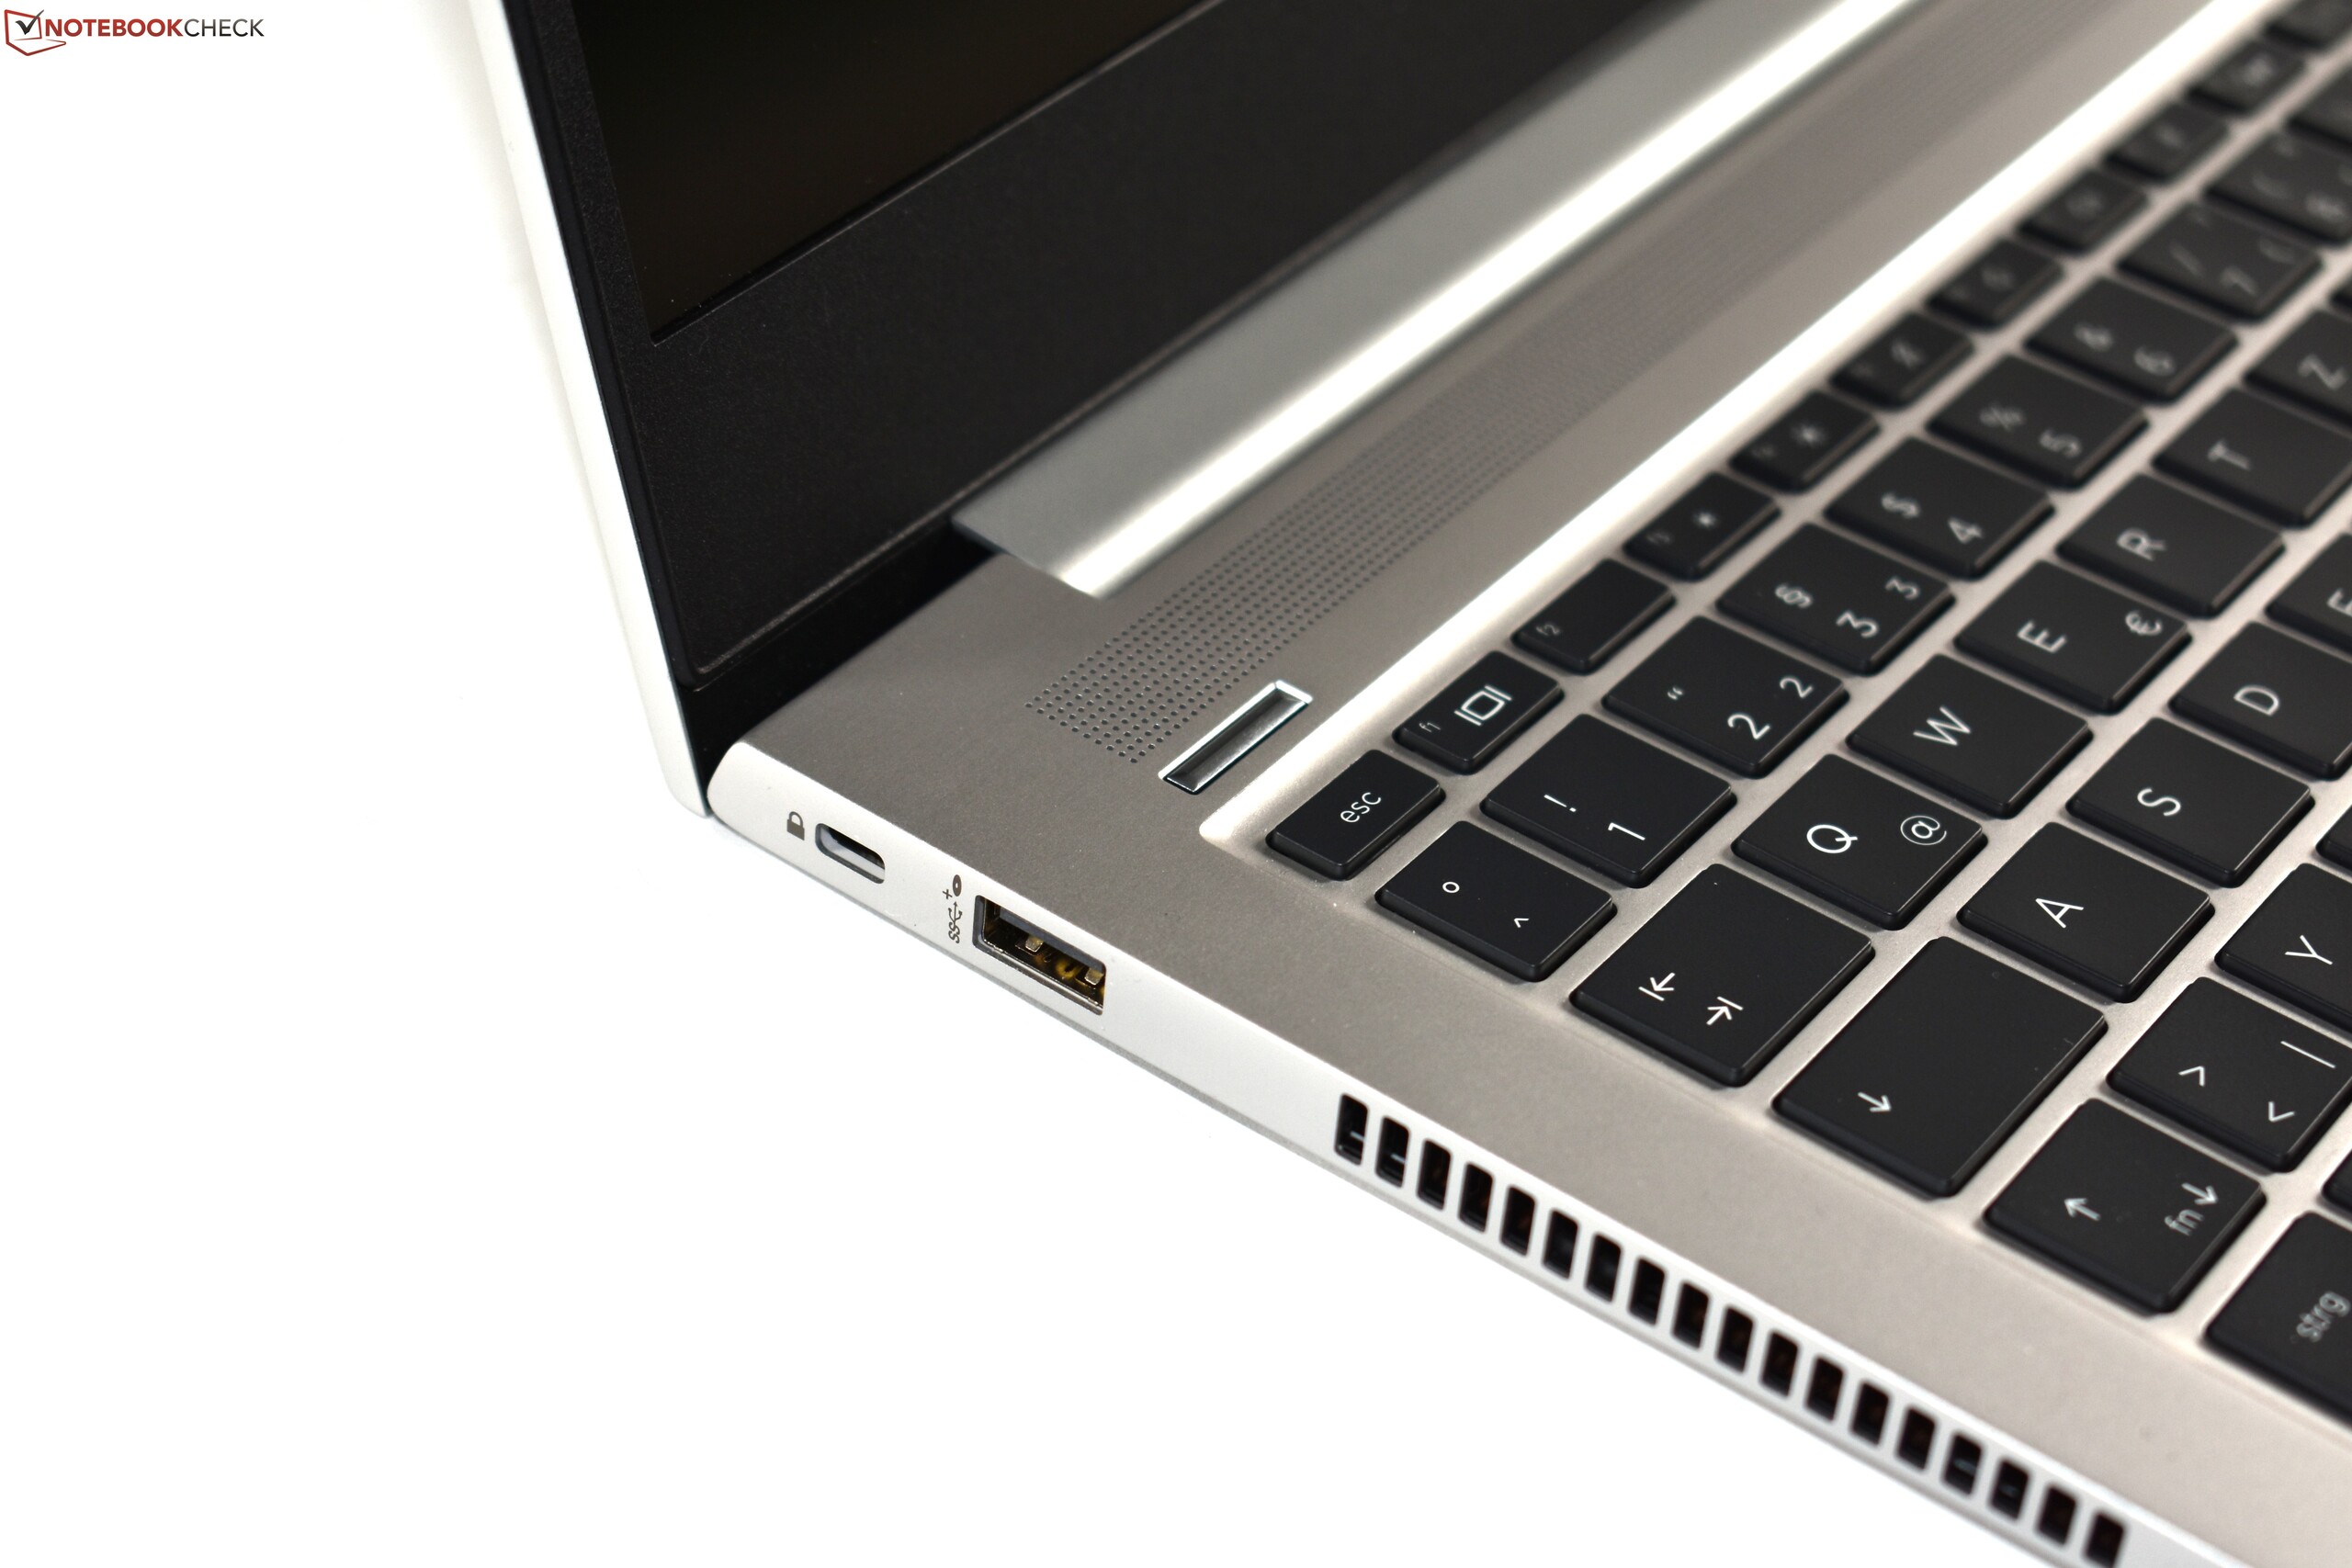
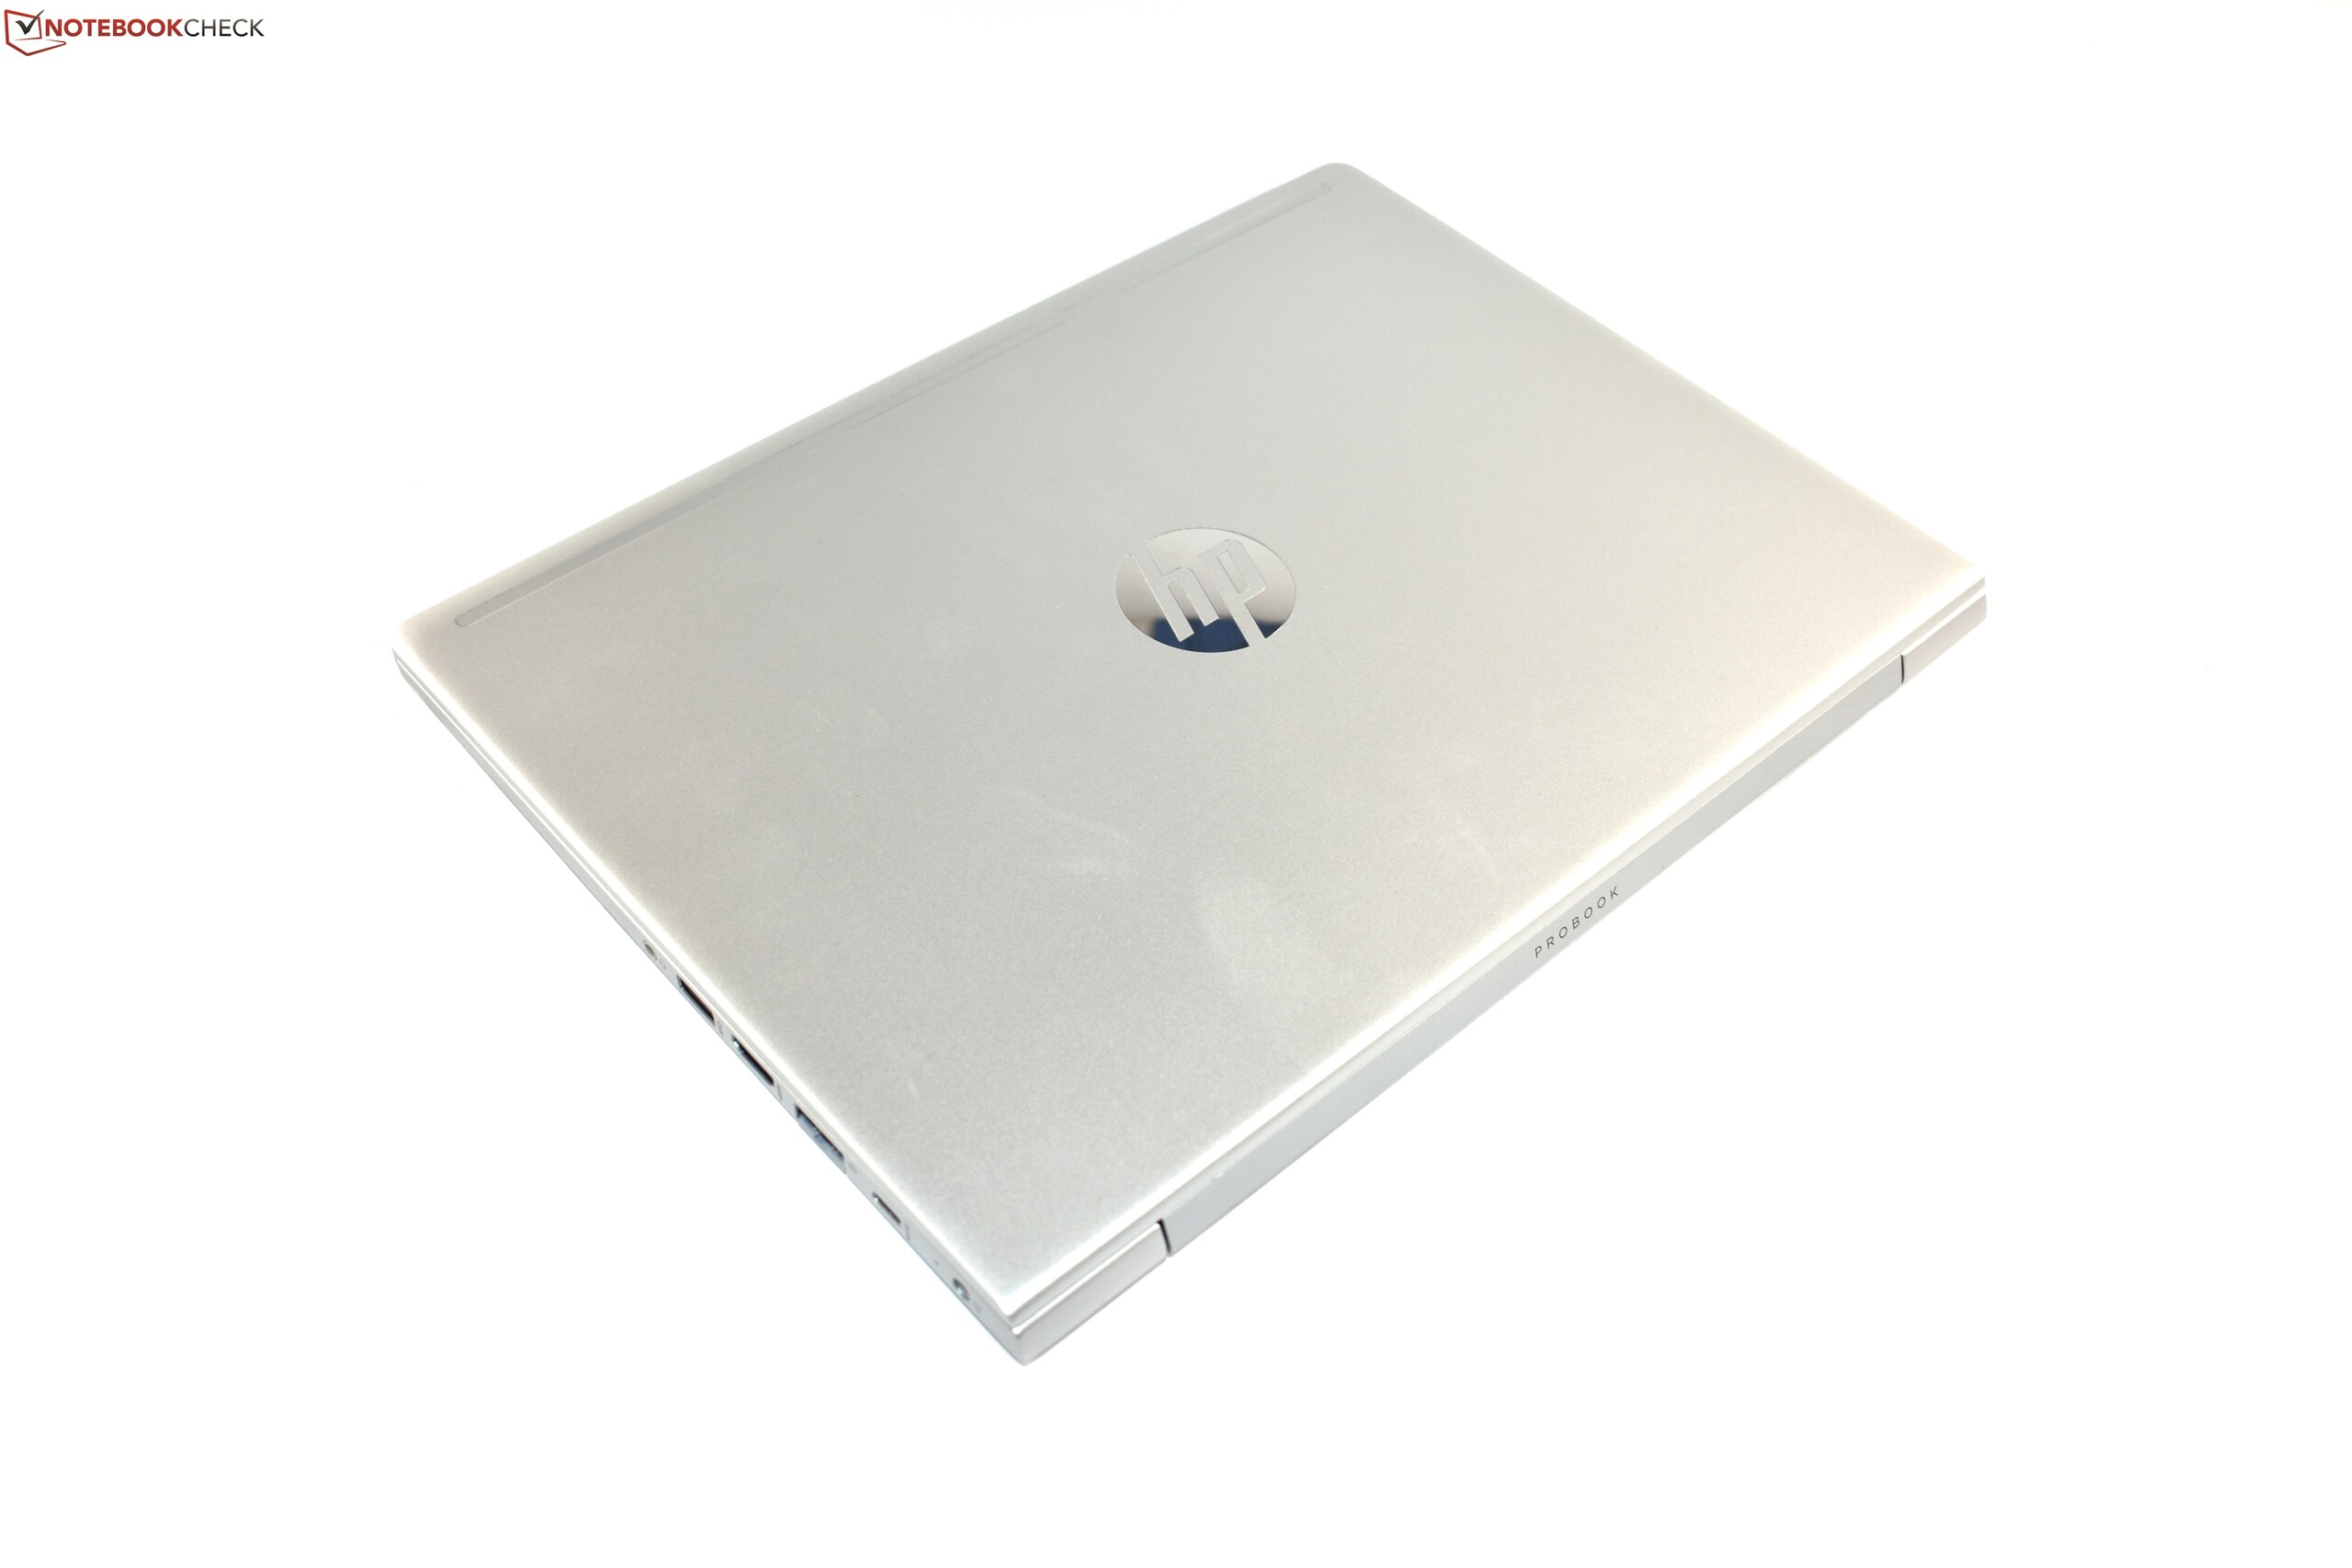
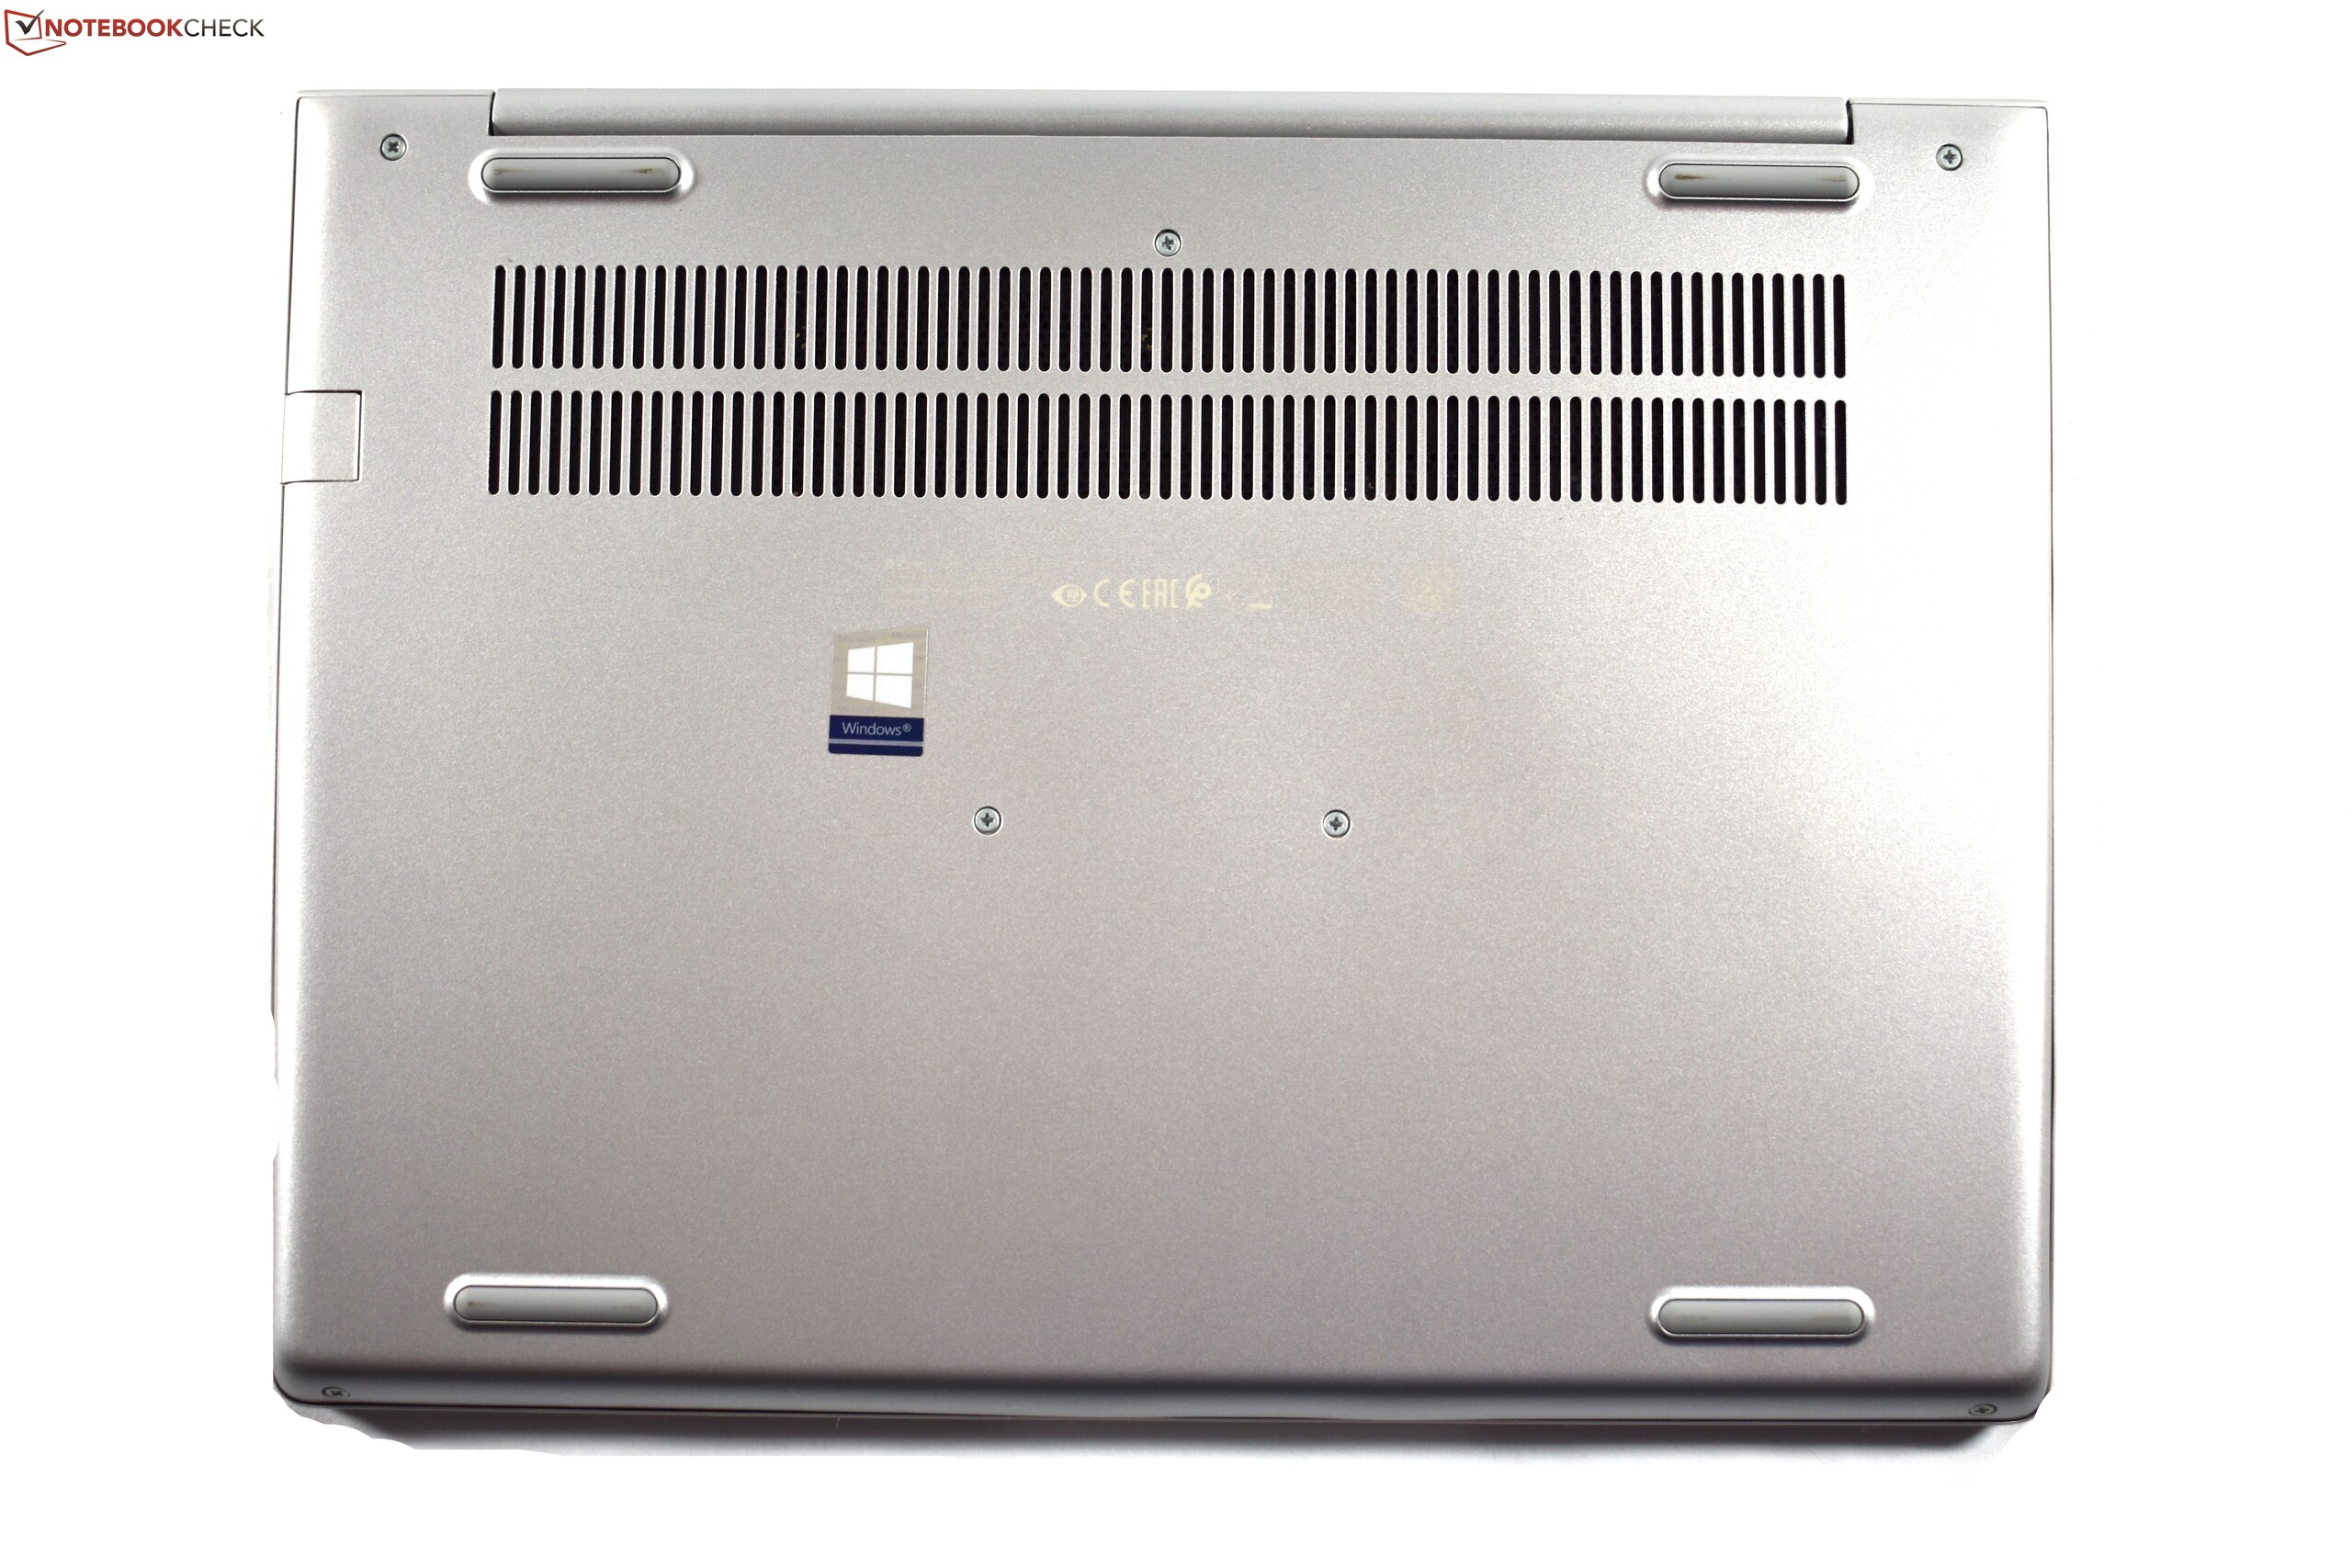
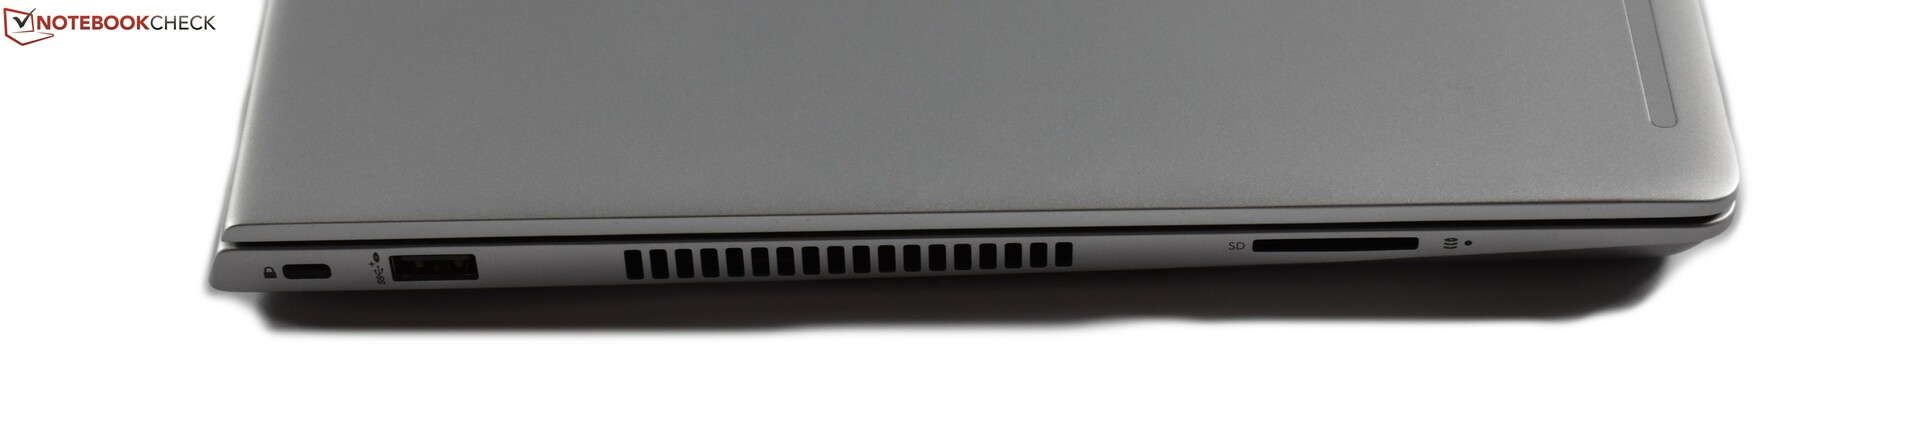
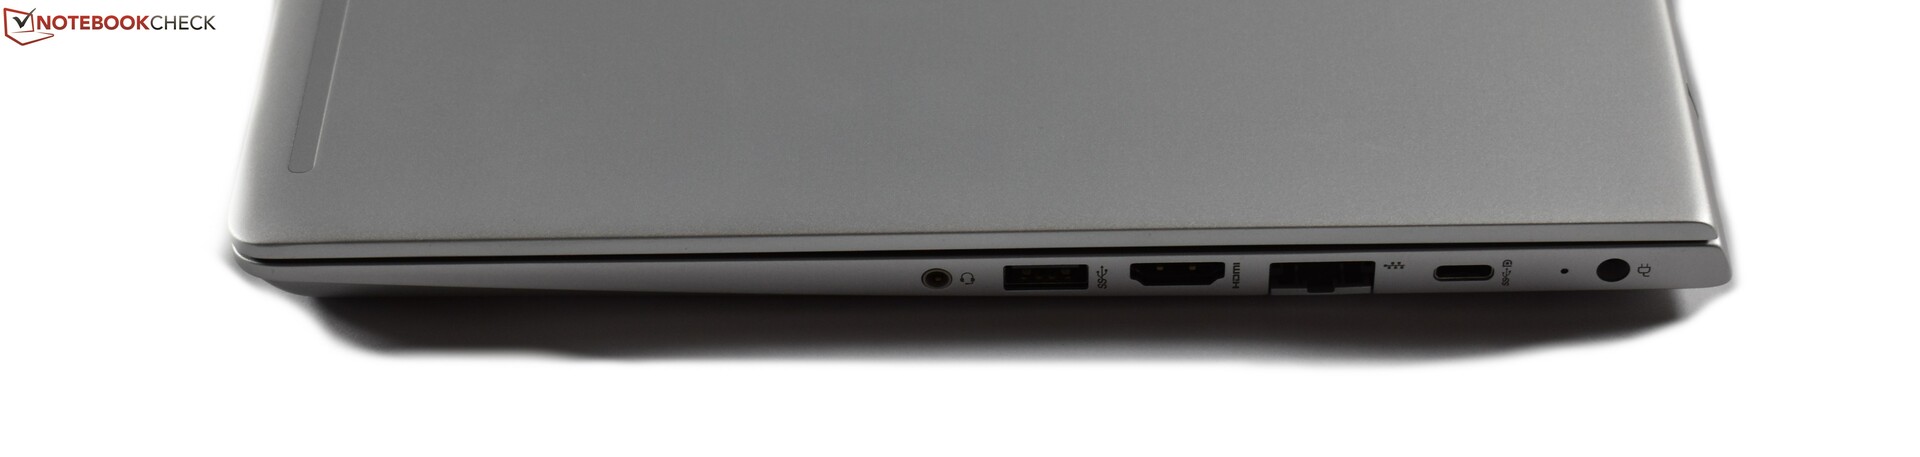
ProBook 430 G6 har många styrkor; en höjdpunkt är de utmärkta uppgraderingsmöjligheterna som inkluderar utbytbart RAM, utbytbar SSD-enhet och en ledig 2.5-tumsplats. Den här instegsmodellen slår till och med en del större och dyrare modeller på den punkten. Vidare kan ProBook överträffa konkurrenterna med en SD-kortläsare i full storlek, vilket varken EliteBook 830 G5 eller Lenovo ThinkPad L390 har att erbjuda. Vår recensionsenhet hade dessutom utmärkt batteritid tack vare låg energiförbrukning. Ytterligare plus inkluderar ett gediget hölje, skapliga inmatningsenheter och låga temperaturer. Dessutom presterar den nya Whiskey Lake-processorn bättre än Kaby Lake R-processorerna som driver ProBook 430 G5 och EliteBook 830 G5.
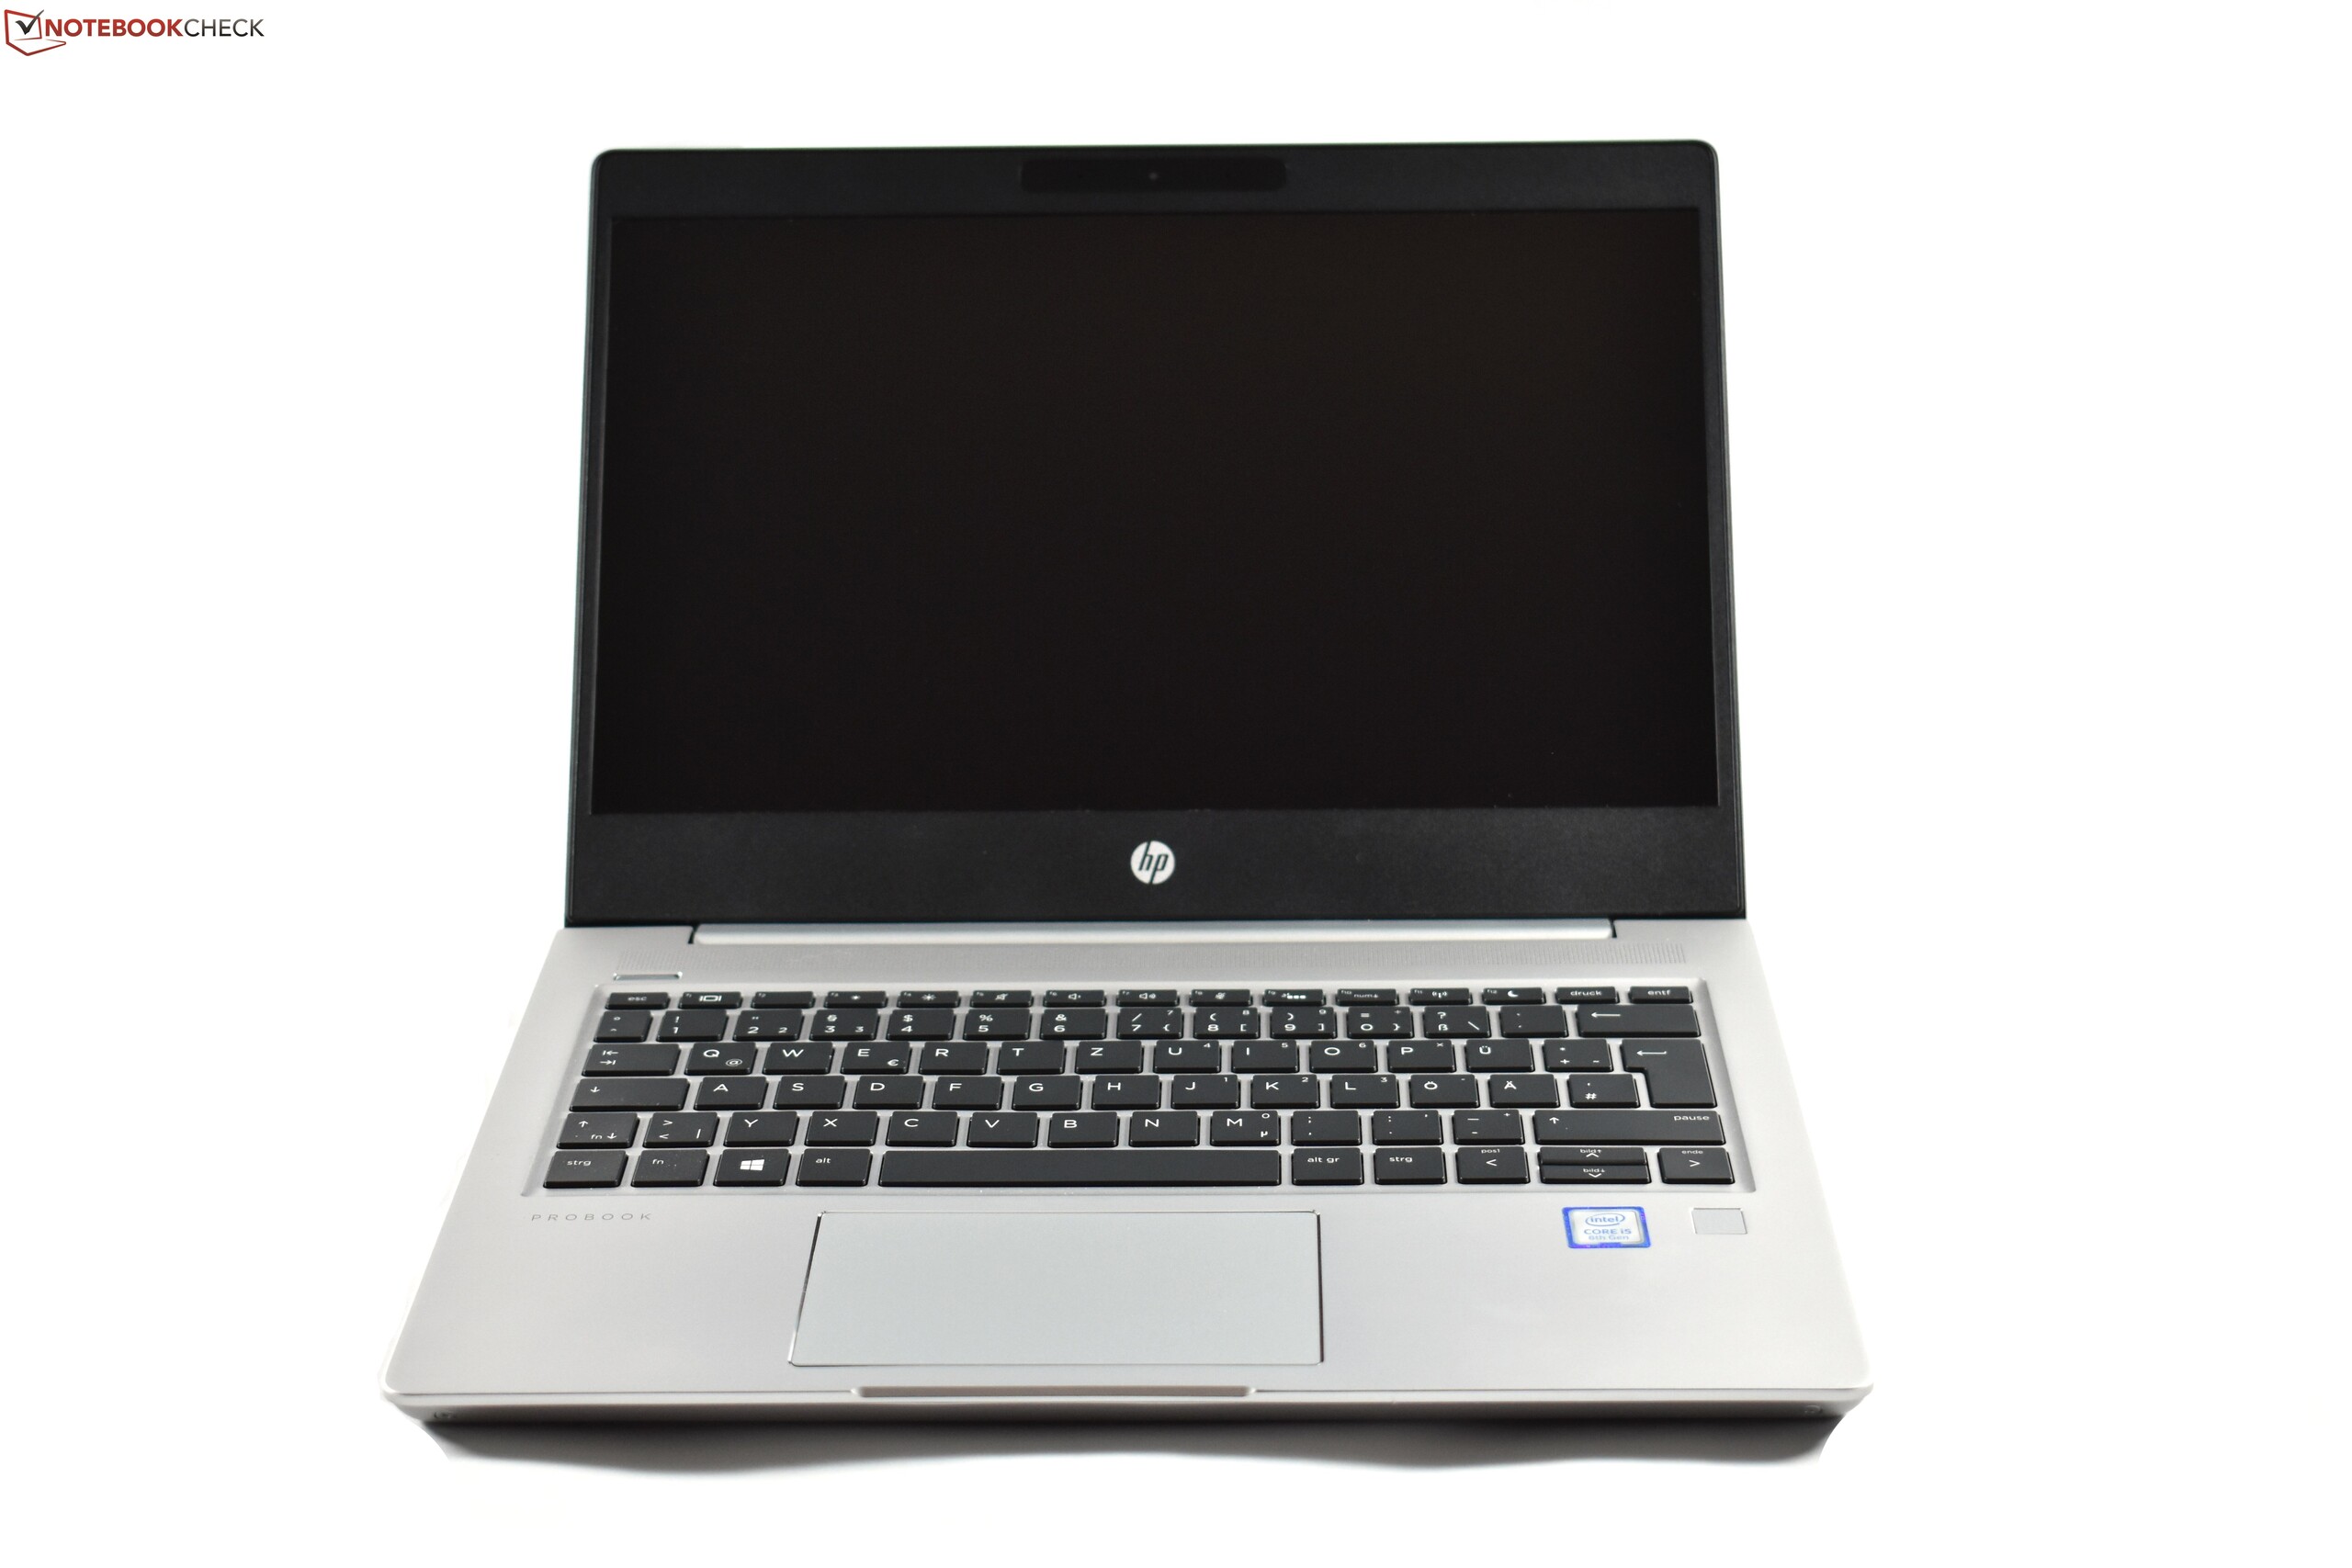
Den största svagheten ProBook 430 G6 har är skärmen. IPS-panelen är för mörk för vår smak och dess färgrymdstäckning är en besvikelse. HP erbjuder heller inte någon bättre skärm, vilket är synd. Oturligt nog har vi några mindre klagomål med. En garanti på 1 år är för kort för en företagslaptop och känns som ett billigt drag av HP. Det hade också varit bra om en styrpinne fanns som tillval.
Vidare saknas en del företagsfunktioner såsom en smart card-läsare. Slutligen var styrplattan dåligt installerad på vår recensionsenhet, men vi utgår från att det var en miss och inte ett vanligt förekommande problem. Det kändes dock ändå nedslående.
HP ProBook 430 G6 är ett utmärkt val för studenter och små företag. Batteritiden, uppgraderingsmöjligheterna och den lätta men ändå robusta designen imponerade på oss i våra tester, men den mörka skärmen var en besvikelse.
Slutsatsen är att den undermåliga skärmen är en kompromiss jämfört med konkurrenter som ThinkPad L390, men ProBook 430 G6 har bättre batteritid, bättre uppgraderingsmöjligheter och lägre temperaturer tillsammans med en SD-kortläsare i full storlek. L390 har aningen bättre inmatningsenheter och en mer ljusstark skärm, men ProBook tar sig i vårt tyckte precis före.
HP ProBook 430 G6-5TJ89EA
- 09/26/2019 v7 (old)
Benjamin Herzig
Price comparison
