Test: Dell Latitude 5310 - Kontorslaptop med lång batteritid (Sammanfattning)
Gradering | Datum | Modell | Vikt | Höjd | Storlek | Upplösning | Pris |
|---|---|---|---|---|---|---|---|
| 86.8 % v7 (old) | 10/2020 | Dell Latitude 5310-GXX0D i5-10310U, UHD Graphics 620 | 1.2 kg | 19.7 mm | 13.30" | 1920x1080 | |
| 88.7 % v7 (old) | 09/2020 | HP EliteBook 830 G7 i7-10810U, UHD Graphics 620 | 1.3 kg | 18.1 mm | 13.30" | 1920x1080 | |
| 83.7 % v7 (old) | Fujitsu Lifebook U939 i5 i5-8265U, UHD Graphics 620 | 900 g | 15 mm | 13.30" | 1920x1080 | ||
| 85.1 % v7 (old) | Dynabook Portege X30L-G1331 i5-10210U, UHD Graphics 620 | 859 g | 17.9 mm | 13.30" | 1920x1080 | ||
| 89.5 % v7 (old) | Lenovo ThinkPad X13-20UGS00800 R7 PRO 4750U, Vega 7 | 1.3 kg | 16.9 mm | 13.30" | 1920x1080 | ||
| 88 % v7 (old) | 08/2020 | Lenovo ThinkPad X13-20T20033GE i5-10210U, UHD Graphics 620 | 1.3 kg | 16.9 mm | 13.30" | 1920x1080 |

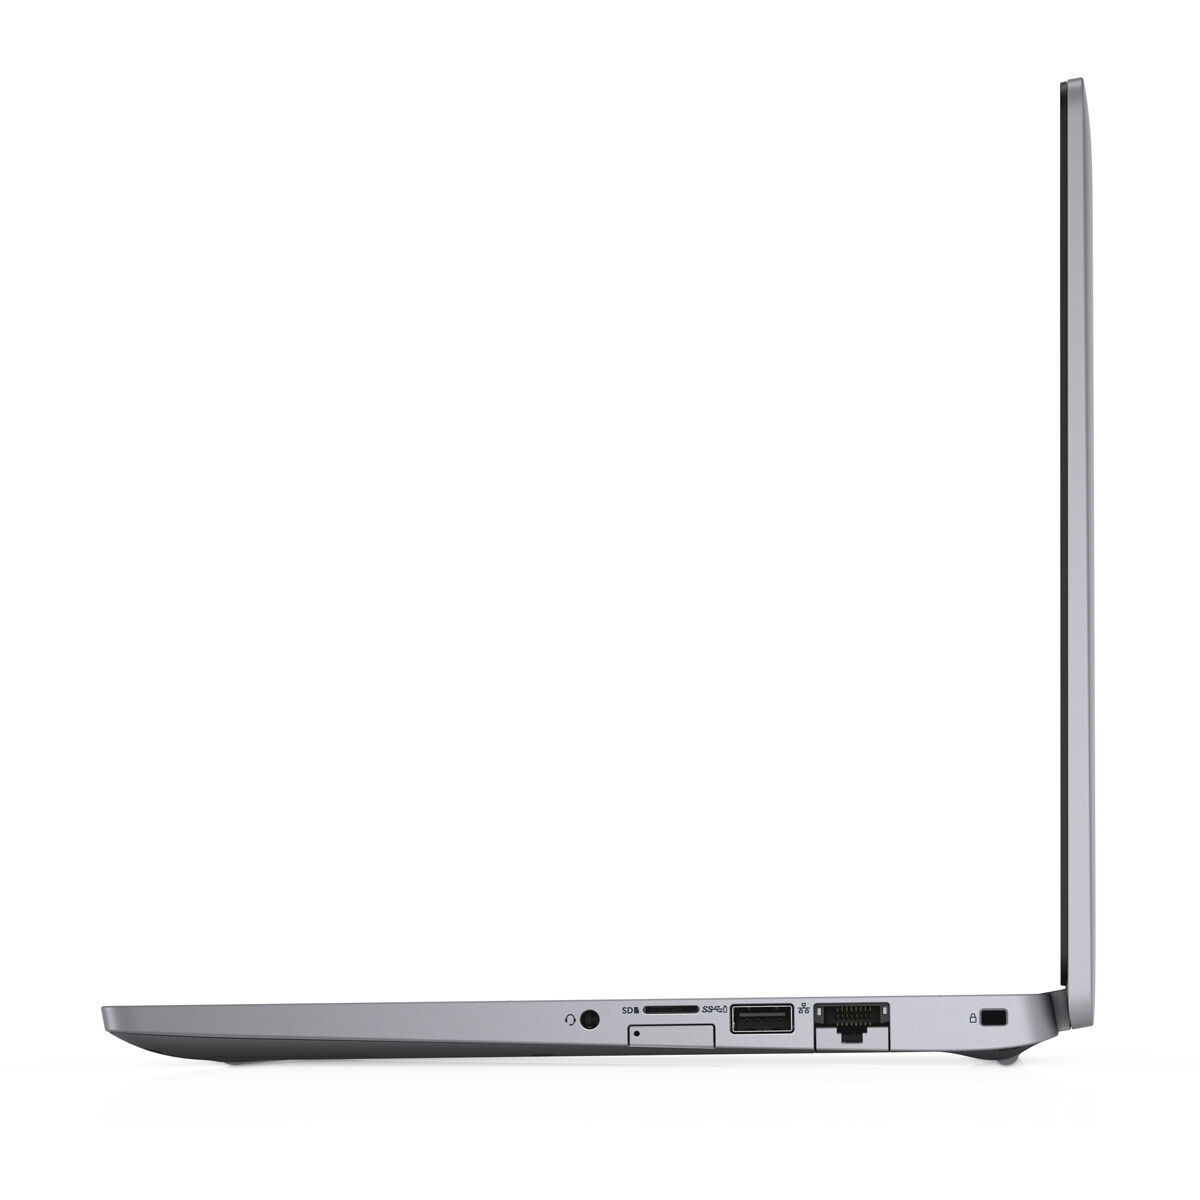
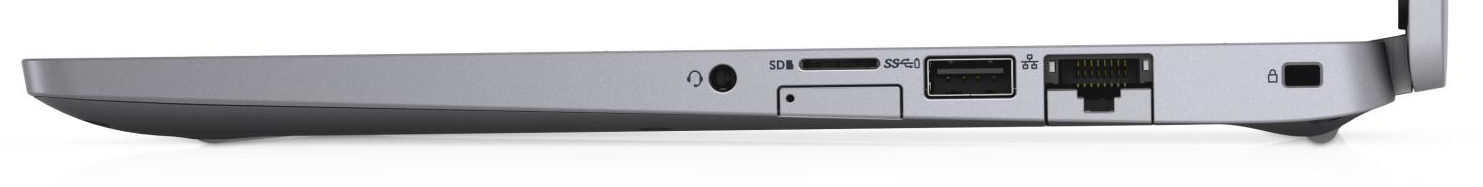
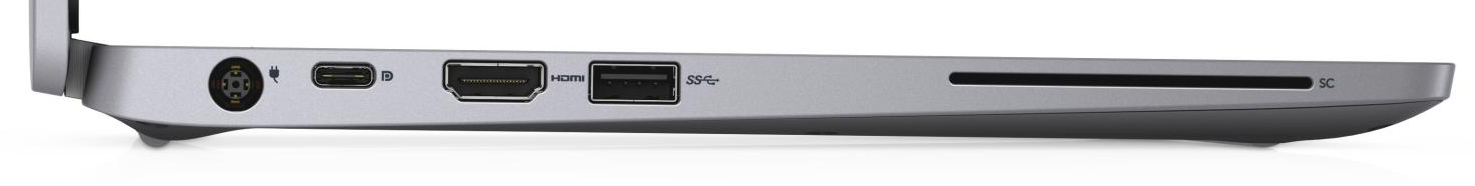
| SD Card Reader | |
| average JPG Copy Test (av. of 3 runs) | |
| Fujitsu Lifebook U939 i5 (Toshiba Exceria Pro SDXC 64 GB UHS-II) | |
| Dell Latitude 5310-GXX0D (Toshiba Exceria Pro M501 microSDXC 64GB) | |
| Dynabook Portege X30L-G1331 (Toshiba Exceria Pro M501 64 GB UHS-II) | |
| Genomsnitt av klass Subnotebook (23.7 - 188, n=9, senaste 2 åren) | |
| Lenovo ThinkPad X13-20UGS00800 (Toshiba Exceria Pro M501 64 GB UHS-II) | |
| Lenovo ThinkPad X13-20T20033GE (Toshiba Exceria Pro M501 64 GB UHS-II) | |
| maximum AS SSD Seq Read Test (1GB) | |
| Dell Latitude 5310-GXX0D (Toshiba Exceria Pro M501 microSDXC 64GB) | |
| Fujitsu Lifebook U939 i5 (Toshiba Exceria Pro SDXC 64 GB UHS-II) | |
| Genomsnitt av klass Subnotebook (24.9 - 195, n=8, senaste 2 åren) | |
| Dynabook Portege X30L-G1331 (Toshiba Exceria Pro M501 64 GB UHS-II) | |
| Lenovo ThinkPad X13-20UGS00800 (Toshiba Exceria Pro M501 64 GB UHS-II) | |
| Lenovo ThinkPad X13-20T20033GE (Toshiba Exceria Pro M501 64 GB UHS-II) | |
| Networking | |
| iperf3 transmit AX12 | |
| Dell Latitude 5310-GXX0D | |
| Dynabook Portege X30L-G1331 | |
| Genomsnitt Intel Wi-Fi 6 AX201 (49.8 - 1775, n=324) | |
| HP EliteBook 830 G7 | |
| Lenovo ThinkPad X13-20UGS00800 | |
| Lenovo ThinkPad X13-20T20033GE | |
| Fujitsu Lifebook U939 i5 | |
| iperf3 receive AX12 | |
| Lenovo ThinkPad X13-20T20033GE | |
| Dell Latitude 5310-GXX0D | |
| HP EliteBook 830 G7 | |
| Lenovo ThinkPad X13-20UGS00800 | |
| Genomsnitt Intel Wi-Fi 6 AX201 (136 - 1743, n=324) | |
| Dynabook Portege X30L-G1331 | |
| Fujitsu Lifebook U939 i5 | |


| |||||||||||||||||||||||||
Distribution av ljusstyrkan: 83 %
Mitt på batteriet: 303 cd/m²
Kontrast: 927:1 (Svärta: 0.33 cd/m²)
ΔE ColorChecker Calman: 6.89 | ∀{0.5-29.43 Ø4.72}
ΔE Greyscale Calman: 7.32 | ∀{0.09-98 Ø4.97}
93% sRGB (Argyll 1.6.3 3D)
59% AdobeRGB 1998 (Argyll 1.6.3 3D)
63.2% AdobeRGB 1998 (Argyll 3D)
90.8% sRGB (Argyll 3D)
61.8% Display P3 (Argyll 3D)
Gamma: 3.74
CCT: 6101 K
| Dell Latitude 5310-GXX0D LG Philips LP133WF7-SPF1, IPS, 1920x1080, 13.3" | HP EliteBook 830 G7 Chi Mei CMN13A9, IPS, 1920x1080, 13.3" | Fujitsu Lifebook U939 i5 Sharp SHP14BD, IPS, 1920x1080, 13.3" | Dynabook Portege X30L-G1331 Toshiba TOS508F, IPS, 1920x1080, 13.3" | Lenovo ThinkPad X13-20UGS00800 B133HAK01.1, IPS LED, 1920x1080, 13.3" | Lenovo ThinkPad X13-20T20033GE Lenovo B133HAK01.1, IPS, 1920x1080, 13.3" | |
|---|---|---|---|---|---|---|
| Display | 7% | 5% | 7% | 5% | 6% | |
| Display P3 Coverage (%) | 61.8 | 65.7 6% | 65.3 6% | 66.9 8% | 64.8 5% | 66 7% |
| sRGB Coverage (%) | 90.8 | 97.4 7% | 95 5% | 97.6 7% | 95.6 5% | 96.2 6% |
| AdobeRGB 1998 Coverage (%) | 63.2 | 67.4 7% | 66 4% | 67.8 7% | 65.7 4% | 67.2 6% |
| Response Times | 4% | -1% | -9% | -3% | 3% | |
| Response Time Grey 50% / Grey 80% * (ms) | 51 ? | 46.8 ? 8% | 55.2 ? -8% | 54.8 ? -7% | 56.8 ? -11% | 52.8 ? -4% |
| Response Time Black / White * (ms) | 32 ? | 32 ? -0% | 29.6 ? 7% | 35.6 ? -11% | 30 ? 6% | 29.2 ? 9% |
| PWM Frequency (Hz) | 26600 ? | 211.9 ? | 23810 ? | |||
| Screen | 39% | 16% | 36% | 18% | 18% | |
| Brightness middle (cd/m²) | 306 | 454.5 49% | 384 25% | 482 58% | 331 8% | 359 17% |
| Brightness (cd/m²) | 293 | 435 48% | 362 24% | 452 54% | 315 8% | 342 17% |
| Brightness Distribution (%) | 83 | 91 10% | 90 8% | 91 10% | 90 8% | 90 8% |
| Black Level * (cd/m²) | 0.33 | 0.27 18% | 0.31 6% | 0.4 -21% | 0.21 36% | 0.21 36% |
| Contrast (:1) | 927 | 1683 82% | 1239 34% | 1205 30% | 1576 70% | 1710 84% |
| Colorchecker dE 2000 * | 6.89 | 3.12 55% | 4.8 30% | 1.85 73% | 6.1 11% | 6.7 3% |
| Colorchecker dE 2000 max. * | 11.66 | 4.85 58% | 9.4 19% | 3.08 74% | 10 14% | 10.9 7% |
| Greyscale dE 2000 * | 7.32 | 3.1 58% | 6.6 10% | 2 73% | 6.3 14% | 7.4 -1% |
| Gamma | 3.74 59% | 2.01 109% | 2.2 100% | 2.1 105% | 2.77 79% | 2.85 77% |
| CCT | 6101 107% | 6902 94% | 7999 81% | 6822 95% | 6938 94% | 6309 103% |
| Color Space (Percent of AdobeRGB 1998) (%) | 59 | 61.5 4% | 61.2 4% | 62.5 6% | 60.7 3% | 61.7 5% |
| Color Space (Percent of sRGB) (%) | 93 | 97 4% | 95 2% | 97.7 5% | 95.4 3% | 95.9 3% |
| Colorchecker dE 2000 calibrated * | 1.97 | 1.4 | 1.2 | 1.2 | 1.3 | |
| Totalt genomsnitt (program/inställningar) | 17% /
28% | 7% /
12% | 11% /
24% | 7% /
12% | 9% /
14% |
* ... mindre är bättre
Visa svarstider
| ↔ Svarstid svart till vitt | ||
|---|---|---|
| 32 ms ... stiga ↗ och falla ↘ kombinerat | ↗ 18 ms stiga | 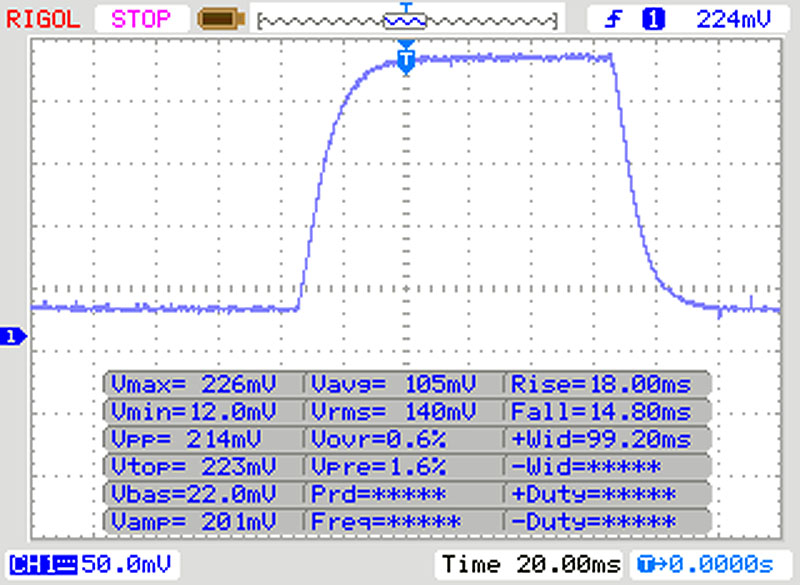 |
| ↘ 14 ms hösten | ||
| Skärmen visar långsamma svarsfrekvenser i våra tester och kommer att vara otillfredsställande för spelare. I jämförelse sträcker sig alla testade enheter från 0.1 (minst) till 240 (maximalt) ms. » 86 % av alla enheter är bättre. Detta innebär att den uppmätta svarstiden är sämre än genomsnittet av alla testade enheter (19.8 ms). | ||
| ↔ Svarstid 50 % grått till 80 % grått | ||
| 51 ms ... stiga ↗ och falla ↘ kombinerat | ↗ 23 ms stiga | 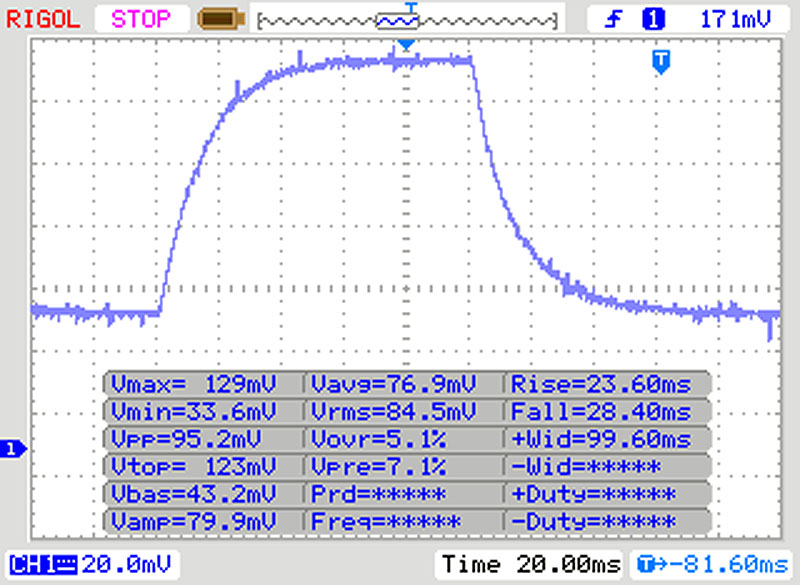 |
| ↘ 28 ms hösten | ||
| Skärmen visar långsamma svarsfrekvenser i våra tester och kommer att vara otillfredsställande för spelare. I jämförelse sträcker sig alla testade enheter från 0.165 (minst) till 636 (maximalt) ms. » 87 % av alla enheter är bättre. Detta innebär att den uppmätta svarstiden är sämre än genomsnittet av alla testade enheter (31 ms). | ||
Skärmflimmer / PWM (Puls-Width Modulation)
| Skärmflimmer / PWM upptäcktes inte | 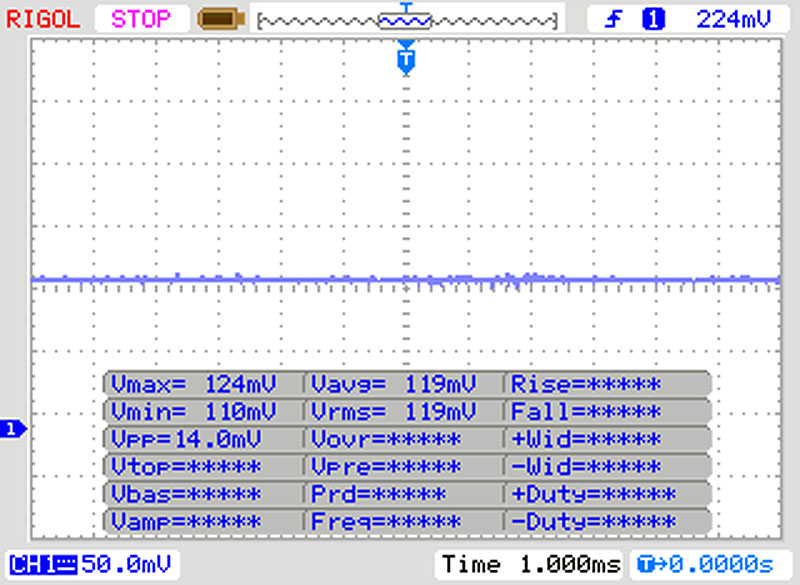 | ||
Som jämförelse: 52 % av alla testade enheter använder inte PWM för att dämpa skärmen. Om PWM upptäcktes mättes ett medelvärde av 7753 (minst: 5 - maximum: 343500) Hz. | |||
| Cinebench R15 | |
| CPU Single 64Bit | |
| Genomsnitt av klass Subnotebook (72.4 - 322, n=56, senaste 2 åren) | |
| Lenovo ThinkPad X13-20UGS00800 | |
| HP EliteBook 830 G7 | |
| Dell Latitude 5310-GXX0D | |
| Genomsnitt Intel Core i5-10310U (164 - 173.8, n=5) | |
| Lenovo ThinkPad X13-20T20033GE | |
| Dynabook Portege X30L-G1331 | |
| Fujitsu Lifebook U939 i5 | |
| CPU Multi 64Bit | |
| Genomsnitt av klass Subnotebook (327 - 3345, n=56, senaste 2 åren) | |
| Lenovo ThinkPad X13-20UGS00800 | |
| Lenovo ThinkPad X13-20T20033GE | |
| Dell Latitude 5310-GXX0D | |
| Genomsnitt Intel Core i5-10310U (499 - 767, n=5) | |
| Fujitsu Lifebook U939 i5 | |
| Dynabook Portege X30L-G1331 | |
| Blender - v2.79 BMW27 CPU | |
| Fujitsu Lifebook U939 i5 | |
| Dynabook Portege X30L-G1331 | |
| Genomsnitt Intel Core i5-10310U (683 - 896, n=5) | |
| Lenovo ThinkPad X13-20T20033GE | |
| HP EliteBook 830 G7 | |
| Dell Latitude 5310-GXX0D | |
| Lenovo ThinkPad X13-20UGS00800 | |
| Genomsnitt av klass Subnotebook (159 - 2271, n=57, senaste 2 åren) | |
| 7-Zip 18.03 | |
| 7z b 4 -mmt1 | |
| Genomsnitt av klass Subnotebook (2643 - 6699, n=58, senaste 2 åren) | |
| HP EliteBook 830 G7 | |
| Lenovo ThinkPad X13-20UGS00800 | |
| Dynabook Portege X30L-G1331 | |
| Lenovo ThinkPad X13-20T20033GE | |
| Dell Latitude 5310-GXX0D | |
| Genomsnitt Intel Core i5-10310U (3615 - 4398, n=5) | |
| Fujitsu Lifebook U939 i5 | |
| 7z b 4 | |
| Genomsnitt av klass Subnotebook (11668 - 77867, n=56, senaste 2 åren) | |
| Lenovo ThinkPad X13-20UGS00800 | |
| HP EliteBook 830 G7 | |
| Dell Latitude 5310-GXX0D | |
| Lenovo ThinkPad X13-20T20033GE | |
| Genomsnitt Intel Core i5-10310U (15976 - 19935, n=5) | |
| Dynabook Portege X30L-G1331 | |
| Fujitsu Lifebook U939 i5 | |
| Cinebench R20 | |
| CPU (Single Core) | |
| Genomsnitt av klass Subnotebook (128 - 832, n=56, senaste 2 åren) | |
| Lenovo ThinkPad X13-20UGS00800 | |
| HP EliteBook 830 G7 | |
| Dell Latitude 5310-GXX0D | |
| Genomsnitt Intel Core i5-10310U (411 - 438, n=5) | |
| Dynabook Portege X30L-G1331 | |
| Fujitsu Lifebook U939 i5 | |
| Lenovo ThinkPad X13-20T20033GE | |
| CPU (Multi Core) | |
| Genomsnitt av klass Subnotebook (579 - 8541, n=56, senaste 2 åren) | |
| Lenovo ThinkPad X13-20UGS00800 | |
| Dell Latitude 5310-GXX0D | |
| HP EliteBook 830 G7 | |
| Lenovo ThinkPad X13-20T20033GE | |
| Genomsnitt Intel Core i5-10310U (1192 - 1588, n=5) | |
| Fujitsu Lifebook U939 i5 | |
| Dynabook Portege X30L-G1331 | |
| Geekbench 5.5 | |
| Single-Core | |
| Genomsnitt av klass Subnotebook (726 - 2224, n=47, senaste 2 åren) | |
| HP EliteBook 830 G7 | |
| Lenovo ThinkPad X13-20UGS00800 | |
| Dell Latitude 5310-GXX0D | |
| Genomsnitt Intel Core i5-10310U (1040 - 1128, n=6) | |
| Dynabook Portege X30L-G1331 | |
| Lenovo ThinkPad X13-20T20033GE | |
| Fujitsu Lifebook U939 i5 | |
| Multi-Core | |
| Genomsnitt av klass Subnotebook (2557 - 17218, n=47, senaste 2 åren) | |
| Lenovo ThinkPad X13-20UGS00800 | |
| Lenovo ThinkPad X13-20T20033GE | |
| Dell Latitude 5310-GXX0D | |
| HP EliteBook 830 G7 | |
| Dynabook Portege X30L-G1331 | |
| Fujitsu Lifebook U939 i5 | |
| Genomsnitt Intel Core i5-10310U (2821 - 3854, n=6) | |
| HWBOT x265 Benchmark v2.2 - 4k Preset | |
| Genomsnitt av klass Subnotebook (0.97 - 25.1, n=56, senaste 2 åren) | |
| Lenovo ThinkPad X13-20UGS00800 | |
| Dell Latitude 5310-GXX0D | |
| HP EliteBook 830 G7 | |
| Lenovo ThinkPad X13-20T20033GE | |
| Genomsnitt Intel Core i5-10310U (3.88 - 5.35, n=5) | |
| Dynabook Portege X30L-G1331 | |
| Fujitsu Lifebook U939 i5 | |
| LibreOffice - 20 Documents To PDF | |
| HP EliteBook 830 G7 | |
| Genomsnitt Intel Core i5-10310U (60 - 71.4, n=5) | |
| Fujitsu Lifebook U939 i5 | |
| Dynabook Portege X30L-G1331 | |
| Dell Latitude 5310-GXX0D | |
| Lenovo ThinkPad X13-20UGS00800 | |
| Genomsnitt av klass Subnotebook (39.9 - 220, n=55, senaste 2 åren) | |
| Lenovo ThinkPad X13-20T20033GE | |
| R Benchmark 2.5 - Overall mean | |
| Fujitsu Lifebook U939 i5 | |
| Genomsnitt Intel Core i5-10310U (0.703 - 0.806, n=5) | |
| Lenovo ThinkPad X13-20T20033GE | |
| Dynabook Portege X30L-G1331 | |
| Dell Latitude 5310-GXX0D | |
| HP EliteBook 830 G7 | |
| Lenovo ThinkPad X13-20UGS00800 | |
| Genomsnitt av klass Subnotebook (0.4024 - 1.456, n=57, senaste 2 åren) | |
* ... mindre är bättre
| PCMark 8 Home Score Accelerated v2 | 3469 poäng | |
| PCMark 8 Creative Score Accelerated v2 | 3539 poäng | |
| PCMark 8 Work Score Accelerated v2 | 4764 poäng | |
| PCMark 10 Score | 4085 poäng | |
Hjälp | ||
| PCMark 8 | |
| Home Score Accelerated v2 | |
| Lenovo ThinkPad X13-20UGS00800 | |
| Lenovo ThinkPad X13-20T20033GE | |
| Dynabook Portege X30L-G1331 | |
| HP EliteBook 830 G7 | |
| Genomsnitt Intel Core i5-10310U, Intel UHD Graphics 620 (3469 - 3499, n=2) | |
| Dell Latitude 5310-GXX0D | |
| Genomsnitt av klass Subnotebook (1739 - 1828, n=2, senaste 2 åren) | |
| Work Score Accelerated v2 | |
| Lenovo ThinkPad X13-20UGS00800 | |
| Lenovo ThinkPad X13-20T20033GE | |
| Dynabook Portege X30L-G1331 | |
| Genomsnitt Intel Core i5-10310U, Intel UHD Graphics 620 (4764 - 5098, n=2) | |
| Dell Latitude 5310-GXX0D | |
| HP EliteBook 830 G7 | |
| Genomsnitt av klass Subnotebook (1609 - 1656, n=2, senaste 2 åren) | |
| DPC Latencies / LatencyMon - interrupt to process latency (max), Web, Youtube, Prime95 | |
| Dell Latitude 5310-GXX0D | |
| Dynabook Portege X30L-G1331 | |
| Lenovo ThinkPad X13-20UGS00800 | |
| Lenovo ThinkPad X13-20T20033GE | |
| Fujitsu Lifebook U939 i5 | |
| HP EliteBook 830 G7 | |
* ... mindre är bättre

| Dell Latitude 5310-GXX0D SK Hynix BC511 HFM512GDJTNI | HP EliteBook 830 G7 Samsung SSD PM981a MZVLB512HBJQ | Fujitsu Lifebook U939 i5 Samsung SSD PM981 MZVLB512HAJQ | Dynabook Portege X30L-G1331 Samsung SSD PM981a MZVLB512HBJQ | Lenovo ThinkPad X13-20UGS00800 Samsung SSD PM981a MZVLB512HBJQ | Lenovo ThinkPad X13-20T20033GE Samsung SSD PM981a MZVLB512HBJQ | Genomsnitt SK Hynix BC511 HFM512GDJTNI | |
|---|---|---|---|---|---|---|---|
| CrystalDiskMark 5.2 / 6 | 49% | 26% | 46% | 46% | 48% | -6% | |
| Write 4K (MB/s) | 145.5 | 118.3 -19% | 159 9% | 164.1 13% | 95.7 -34% | 131.1 -10% | 111 ? -24% |
| Read 4K (MB/s) | 48.83 | 60.4 24% | 48.12 -1% | 49.34 1% | 37.47 -23% | 45.48 -7% | 42.6 ? -13% |
| Write Seq (MB/s) | 1067 | 2067 94% | 1657 55% | 1777 67% | 2032 90% | 2042 91% | 1037 ? -3% |
| Read Seq (MB/s) | 1133 | 2394 111% | 1522 34% | 1752 55% | 2207 95% | 2259 99% | 1100 ? -3% |
| Write 4K Q32T1 (MB/s) | 420.3 | 325.5 -23% | 349.2 -17% | 401.1 -5% | 517 23% | 429.1 2% | 410 ? -2% |
| Read 4K Q32T1 (MB/s) | 462.6 | 332.2 -28% | 452.2 -2% | 498.7 8% | 387 -16% | 370.7 -20% | 444 ? -4% |
| Write Seq Q32T1 (MB/s) | 1077 | 2978 177% | 1941 80% | 2988 177% | 2977 176% | 2963 175% | 1072 ? 0% |
| Read Seq Q32T1 (MB/s) | 2302 | 3552 54% | 3510 52% | 3544 54% | 3556 54% | 3564 55% | 2269 ? -1% |
| AS SSD | 8% | 38% | 59% | 35% | 29% | -11% | |
| Seq Read (MB/s) | 1975 | 2081 5% | 2677 36% | 2067 5% | 2553 29% | 2714 37% | 1458 ? -26% |
| Seq Write (MB/s) | 1002 | 1433 43% | 1819 82% | 2444 144% | 1406 40% | 1374 37% | 900 ? -10% |
| 4K Read (MB/s) | 51.8 | 49.92 -4% | 53.7 4% | 55.8 8% | 48.53 -6% | 51.2 -1% | 49 ? -5% |
| 4K Write (MB/s) | 121.7 | 119.1 -2% | 145.8 20% | 124.6 2% | 119.6 -2% | 135.7 12% | 114.9 ? -6% |
| 4K-64 Read (MB/s) | 806 | 585 -27% | 1202 49% | 1601 99% | 808 0% | 962 19% | 776 ? -4% |
| 4K-64 Write (MB/s) | 780 | 1630 109% | 1290 65% | 1696 117% | 1846 137% | 1420 82% | 744 ? -5% |
| Access Time Read * (ms) | 0.04 | 0.043 -8% | 0.044 -10% | 0.048 -20% | 0.062 -55% | 0.043 -8% | 0.061 ? -53% |
| Access Time Write * (ms) | 0.031 | 0.097 -213% | 0.026 16% | 0.091 -194% | 0.031 -0% | 0.028 10% | 0.03329 ? -7% |
| Score Read (Points) | 1055 | 843 -20% | 1523 44% | 1864 77% | 1112 5% | 1284 22% | 970 ? -8% |
| Score Write (Points) | 1002 | 1892 89% | 1618 61% | 2065 106% | 2107 110% | 1693 69% | 949 ? -5% |
| Score Total (Points) | 2562 | 3149 23% | 3887 52% | 4908 92% | 3742 46% | 3579 40% | 2401 ? -6% |
| Copy ISO MB/s (MB/s) | 742 | 2452 230% | 2051 176% | 1395 88% | 864 ? 16% | ||
| Copy Program MB/s (MB/s) | 389.9 | 72.2 -81% | 572 47% | 491.8 26% | 309 ? -21% | ||
| Copy Game MB/s (MB/s) | 556 | 404 -27% | 1447 160% | 948 71% | 499 ? -10% | ||
| Totalt genomsnitt (program/inställningar) | 29% /
23% | 32% /
33% | 53% /
54% | 41% /
39% | 39% /
37% | -9% /
-9% |
* ... mindre är bättre
Continuous load read: DiskSpd Read Loop, Queue Depth 8
| 3DMark 11 Performance | 2067 poäng | |
| 3DMark Ice Storm Standard Score | 60188 poäng | |
| 3DMark Cloud Gate Standard Score | 8812 poäng | |
| 3DMark Fire Strike Score | 1110 poäng | |
| 3DMark Time Spy Score | 453 poäng | |
Hjälp | ||
| 3DMark 11 - 1280x720 Performance GPU | |
| Genomsnitt av klass Subnotebook (995 - 18489, n=54, senaste 2 åren) | |
| Lenovo ThinkPad X13-20UGS00800 | |
| HP EliteBook 830 G7 | |
| Dell Latitude 5310-GXX0D | |
| Lenovo ThinkPad X13-20T20033GE | |
| Dynabook Portege X30L-G1331 | |
| Genomsnitt Intel UHD Graphics 620 (1144 - 3432, n=244) | |
| Fujitsu Lifebook U939 i5 | |
| 3DMark | |
| 1280x720 Cloud Gate Standard Graphics | |
| Genomsnitt av klass Subnotebook (5577 - 61591, n=28, senaste 2 åren) | |
| Lenovo ThinkPad X13-20UGS00800 | |
| HP EliteBook 830 G7 | |
| Dell Latitude 5310-GXX0D | |
| Genomsnitt Intel UHD Graphics 620 (6205 - 16400, n=225) | |
| 1920x1080 Fire Strike Graphics | |
| Genomsnitt av klass Subnotebook (832 - 16347, n=55, senaste 2 åren) | |
| Lenovo ThinkPad X13-20UGS00800 | |
| HP EliteBook 830 G7 | |
| Lenovo ThinkPad X13-20T20033GE | |
| Dynabook Portege X30L-G1331 | |
| Dell Latitude 5310-GXX0D | |
| Genomsnitt Intel UHD Graphics 620 (557 - 2608, n=213) | |
| 2560x1440 Time Spy Graphics | |
| Genomsnitt av klass Subnotebook (804 - 6288, n=54, senaste 2 åren) | |
| Lenovo ThinkPad X13-20UGS00800 | |
| HP EliteBook 830 G7 | |
| Lenovo ThinkPad X13-20T20033GE | |
| Dynabook Portege X30L-G1331 | |
| Dell Latitude 5310-GXX0D | |
| Genomsnitt Intel UHD Graphics 620 (299 - 797, n=88) | |
| låg | med. | hög | ultra | |
|---|---|---|---|---|
| Tomb Raider (2013) | 97.6 | 47.6 | 28.2 | 13.1 |
| BioShock Infinite (2013) | 58.1 | 34.7 | 28.3 | 9 |
| Dota 2 Reborn (2015) | 73.5 | 39.5 | 19.5 | 17.3 |
| X-Plane 11.11 (2018) | 8.59 | 7.45 | 8.82 | |
| Far Cry 5 (2018) | 15 | 7 | 6 | 5 |
Ljudnivå
| Låg belastning |
| 24.9 / 24.9 / 24.9 dB(A) |
| Hög belastning |
| 37.7 / 41.2 dB(A) |
 | ||
30 dB tyst 40 dB(A) hörbar 50 dB(A) högt ljud |
||
min: | ||
| Dell Latitude 5310-GXX0D i5-10310U, UHD Graphics 620 | HP EliteBook 830 G7 i7-10810U, UHD Graphics 620 | Fujitsu Lifebook U939 i5 i5-8265U, UHD Graphics 620 | Dynabook Portege X30L-G1331 i5-10210U, UHD Graphics 620 | Lenovo ThinkPad X13-20UGS00800 R7 PRO 4750U, Vega 7 | Lenovo ThinkPad X13-20T20033GE i5-10210U, UHD Graphics 620 | Genomsnitt Intel UHD Graphics 620 | Genomsnitt av klass Subnotebook | |
|---|---|---|---|---|---|---|---|---|
| Noise | -2% | -9% | -6% | -5% | -6% | -8% | 2% | |
| av / miljö * (dB) | 24.9 | 26.8 -8% | 29.8 -20% | 28.5 -14% | 29.1 -17% | 29.3 -18% | 29 ? -16% | 24.2 ? 3% |
| Idle Minimum * (dB) | 24.9 | 27.1 -9% | 29.8 -20% | 28.5 -14% | 29.1 -17% | 29.3 -18% | 29.1 ? -17% | 24.3 ? 2% |
| Idle Average * (dB) | 24.9 | 27.1 -9% | 29.8 -20% | 28.5 -14% | 29.1 -17% | 29.3 -18% | 29.1 ? -17% | 24.5 ? 2% |
| Idle Maximum * (dB) | 24.9 | 27.1 -9% | 29.8 -20% | 28.5 -14% | 29.1 -17% | 29.3 -18% | 29.7 ? -19% | 25.1 ? -1% |
| Load Average * (dB) | 37.7 | 31.4 17% | 31.7 16% | 32 15% | 31.1 18% | 30.7 19% | 33.5 ? 11% | 34.3 ? 9% |
| Load Maximum * (dB) | 41.2 | 39 5% | 36.3 12% | 38 8% | 31.8 23% | 34 17% | 36.1 ? 12% | 42.1 ? -2% |
* ... mindre är bättre
(±) Den maximala temperaturen på ovansidan är 42.2 °C / 108 F, jämfört med genomsnittet av 35.9 °C / 97 F , allt från 21.4 till 59 °C för klassen Subnotebook.
(±) Botten värms upp till maximalt 44 °C / 111 F, jämfört med genomsnittet av 39.2 °C / 103 F
(+) Vid tomgångsbruk är medeltemperaturen för ovansidan 27.7 °C / 82 F, jämfört med enhetsgenomsnittet på 30.8 °C / ### class_avg_f### F.
(+) Handledsstöden och pekplattan är kallare än hudtemperaturen med maximalt 29.6 °C / 85.3 F och är därför svala att ta på.
(±) Medeltemperaturen för handledsstödsområdet på liknande enheter var 28.2 °C / 82.8 F (-1.4 °C / -2.5 F).
| Dell Latitude 5310-GXX0D i5-10310U, UHD Graphics 620 | HP EliteBook 830 G7 i7-10810U, UHD Graphics 620 | Fujitsu Lifebook U939 i5 i5-8265U, UHD Graphics 620 | Dynabook Portege X30L-G1331 i5-10210U, UHD Graphics 620 | Lenovo ThinkPad X13-20UGS00800 R7 PRO 4750U, Vega 7 | Lenovo ThinkPad X13-20T20033GE i5-10210U, UHD Graphics 620 | Genomsnitt Intel UHD Graphics 620 | Genomsnitt av klass Subnotebook | |
|---|---|---|---|---|---|---|---|---|
| Heat | -3% | 3% | -11% | 7% | 2% | 3% | 4% | |
| Maximum Upper Side * (°C) | 42.2 | 41 3% | 46.3 -10% | 41.2 2% | 44.8 -6% | 48.4 -15% | 41.1 ? 3% | 41.7 ? 1% |
| Maximum Bottom * (°C) | 44 | 47.2 -7% | 44.9 -2% | 44 -0% | 42.1 4% | 43.8 -0% | 44.3 ? -1% | 43.5 ? 1% |
| Idle Upper Side * (°C) | 28.6 | 28 2% | 25.8 10% | 34.6 -21% | 24.1 16% | 25.2 12% | 26.8 ? 6% | 26.8 ? 6% |
| Idle Bottom * (°C) | 29.2 | 32 -10% | 25.8 12% | 36.2 -24% | 25.1 14% | 25.7 12% | 27.7 ? 5% | 27.4 ? 6% |
* ... mindre är bättre
Dell Latitude 5310-GXX0D ljudanalys
(-) | inte särskilt höga högtalare (70.5 dB)
Bas 100 - 315 Hz
(±) | reducerad bas - i genomsnitt 13.8% lägre än medianen
(±) | linjäriteten för basen är genomsnittlig (13.5% delta till föregående frekvens)
Mellan 400 - 2000 Hz
(+) | balanserad mellan - endast 4.3% från medianen
(±) | linjäriteten för mids är genomsnittlig (7% delta till föregående frekvens)
Högsta 2 - 16 kHz
(+) | balanserade toppar - endast 1.4% från medianen
(+) | toppar är linjära (3% delta till föregående frekvens)
Totalt 100 - 16 000 Hz
(+) | det totala ljudet är linjärt (14.4% skillnad mot median)
Jämfört med samma klass
» 29% av alla testade enheter i den här klassen var bättre, 6% liknande, 66% sämre
» Den bästa hade ett delta på 5%, genomsnittet var 18%, sämst var 53%
Jämfört med alla testade enheter
» 18% av alla testade enheter var bättre, 4% liknande, 78% sämre
» Den bästa hade ett delta på 4%, genomsnittet var 23%, sämst var 134%
| Av/Standby | |
| Låg belastning | |
| Hög belastning |
|
Förklaring:
min: | |
| Dell Latitude 5310-GXX0D i5-10310U, UHD Graphics 620 | HP EliteBook 830 G7 i7-10810U, UHD Graphics 620 | Fujitsu Lifebook U939 i5 i5-8265U, UHD Graphics 620 | Dynabook Portege X30L-G1331 i5-10210U, UHD Graphics 620 | Lenovo ThinkPad X13-20UGS00800 R7 PRO 4750U, Vega 7 | Lenovo ThinkPad X13-20T20033GE i5-10210U, UHD Graphics 620 | Genomsnitt Intel UHD Graphics 620 | Genomsnitt av klass Subnotebook | |
|---|---|---|---|---|---|---|---|---|
| Power Consumption | -13% | -22% | -10% | -63% | -18% | -30% | -35% | |
| Idle Minimum * (Watt) | 2.2 | 3.6 -64% | 3.1 -41% | 2.8 -27% | 6 -173% | 2.9 -32% | 3.81 ? -73% | 3.78 ? -72% |
| Idle Average * (Watt) | 4 | 4.7 -18% | 5.9 -48% | 4.9 -23% | 8.9 -123% | 5.6 -40% | 6.94 ? -74% | 6.57 ? -64% |
| Idle Maximum * (Watt) | 6.9 | 5.1 26% | 9.2 -33% | 9 -30% | 11.3 -64% | 8.9 -29% | 8.75 ? -27% | 7.94 ? -15% |
| Load Average * (Watt) | 37 | 33.3 10% | 35.8 3% | 31.2 16% | 34.2 8% | 30.1 19% | 35 ? 5% | 41.9 ? -13% |
| Load Maximum * (Watt) | 58 | 70 -21% | 51.9 11% | 49.4 15% | 37.2 36% | 61.3 -6% | 47.5 ? 18% | 64.4 ? -11% |
* ... mindre är bättre
| Dell Latitude 5310-GXX0D i5-10310U, UHD Graphics 620, 60 Wh | HP EliteBook 830 G7 i7-10810U, UHD Graphics 620, 53 Wh | Fujitsu Lifebook U939 i5 i5-8265U, UHD Graphics 620, 50 Wh | Dynabook Portege X30L-G1331 i5-10210U, UHD Graphics 620, 42 Wh | Lenovo ThinkPad X13-20UGS00800 R7 PRO 4750U, Vega 7, 48 Wh | Lenovo ThinkPad X13-20T20033GE i5-10210U, UHD Graphics 620, 48 Wh | Genomsnitt av klass Subnotebook | |
|---|---|---|---|---|---|---|---|
| Batteridrifttid | 14% | -35% | -35% | -45% | -24% | -7% | |
| Reader / Idle (h) | 26.5 | 34.6 31% | 28.6 ? 8% | ||||
| H.264 (h) | 17.1 | 8.3 -51% | 11.7 -32% | 15.4 ? -10% | |||
| WiFi v1.3 (h) | 12.7 | 11.5 -9% | 8.2 -35% | 8.3 -35% | 8.7 -31% | 9.3 -27% | 14 ? 10% |
| Load (h) | 3.1 | 3.7 19% | 1.5 -52% | 2.7 -13% | 1.969 ? -36% |
För
Emot
Läs den fullständiga versionen av den här recensionen på engelska här.
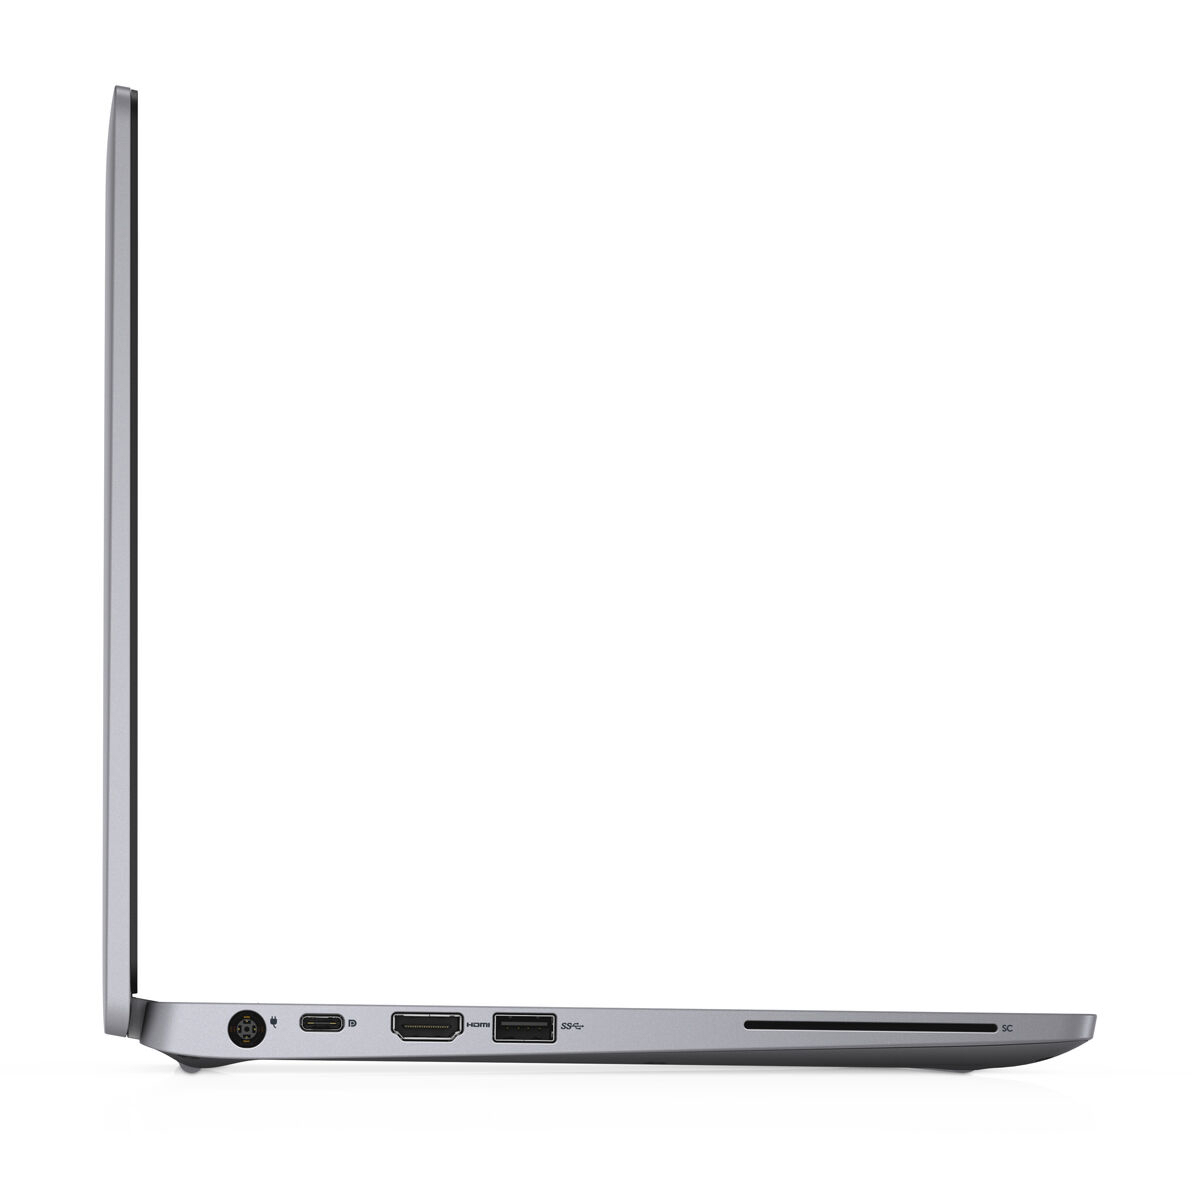
Latitude är en uthållig kollega för vardagens arbete. En laddning borde få batteriet att hålla hela dagen. Den går att ladda med både den inkluderade USB Typ C-nätadaptern eller med en propretiär nätadapter från Dell.
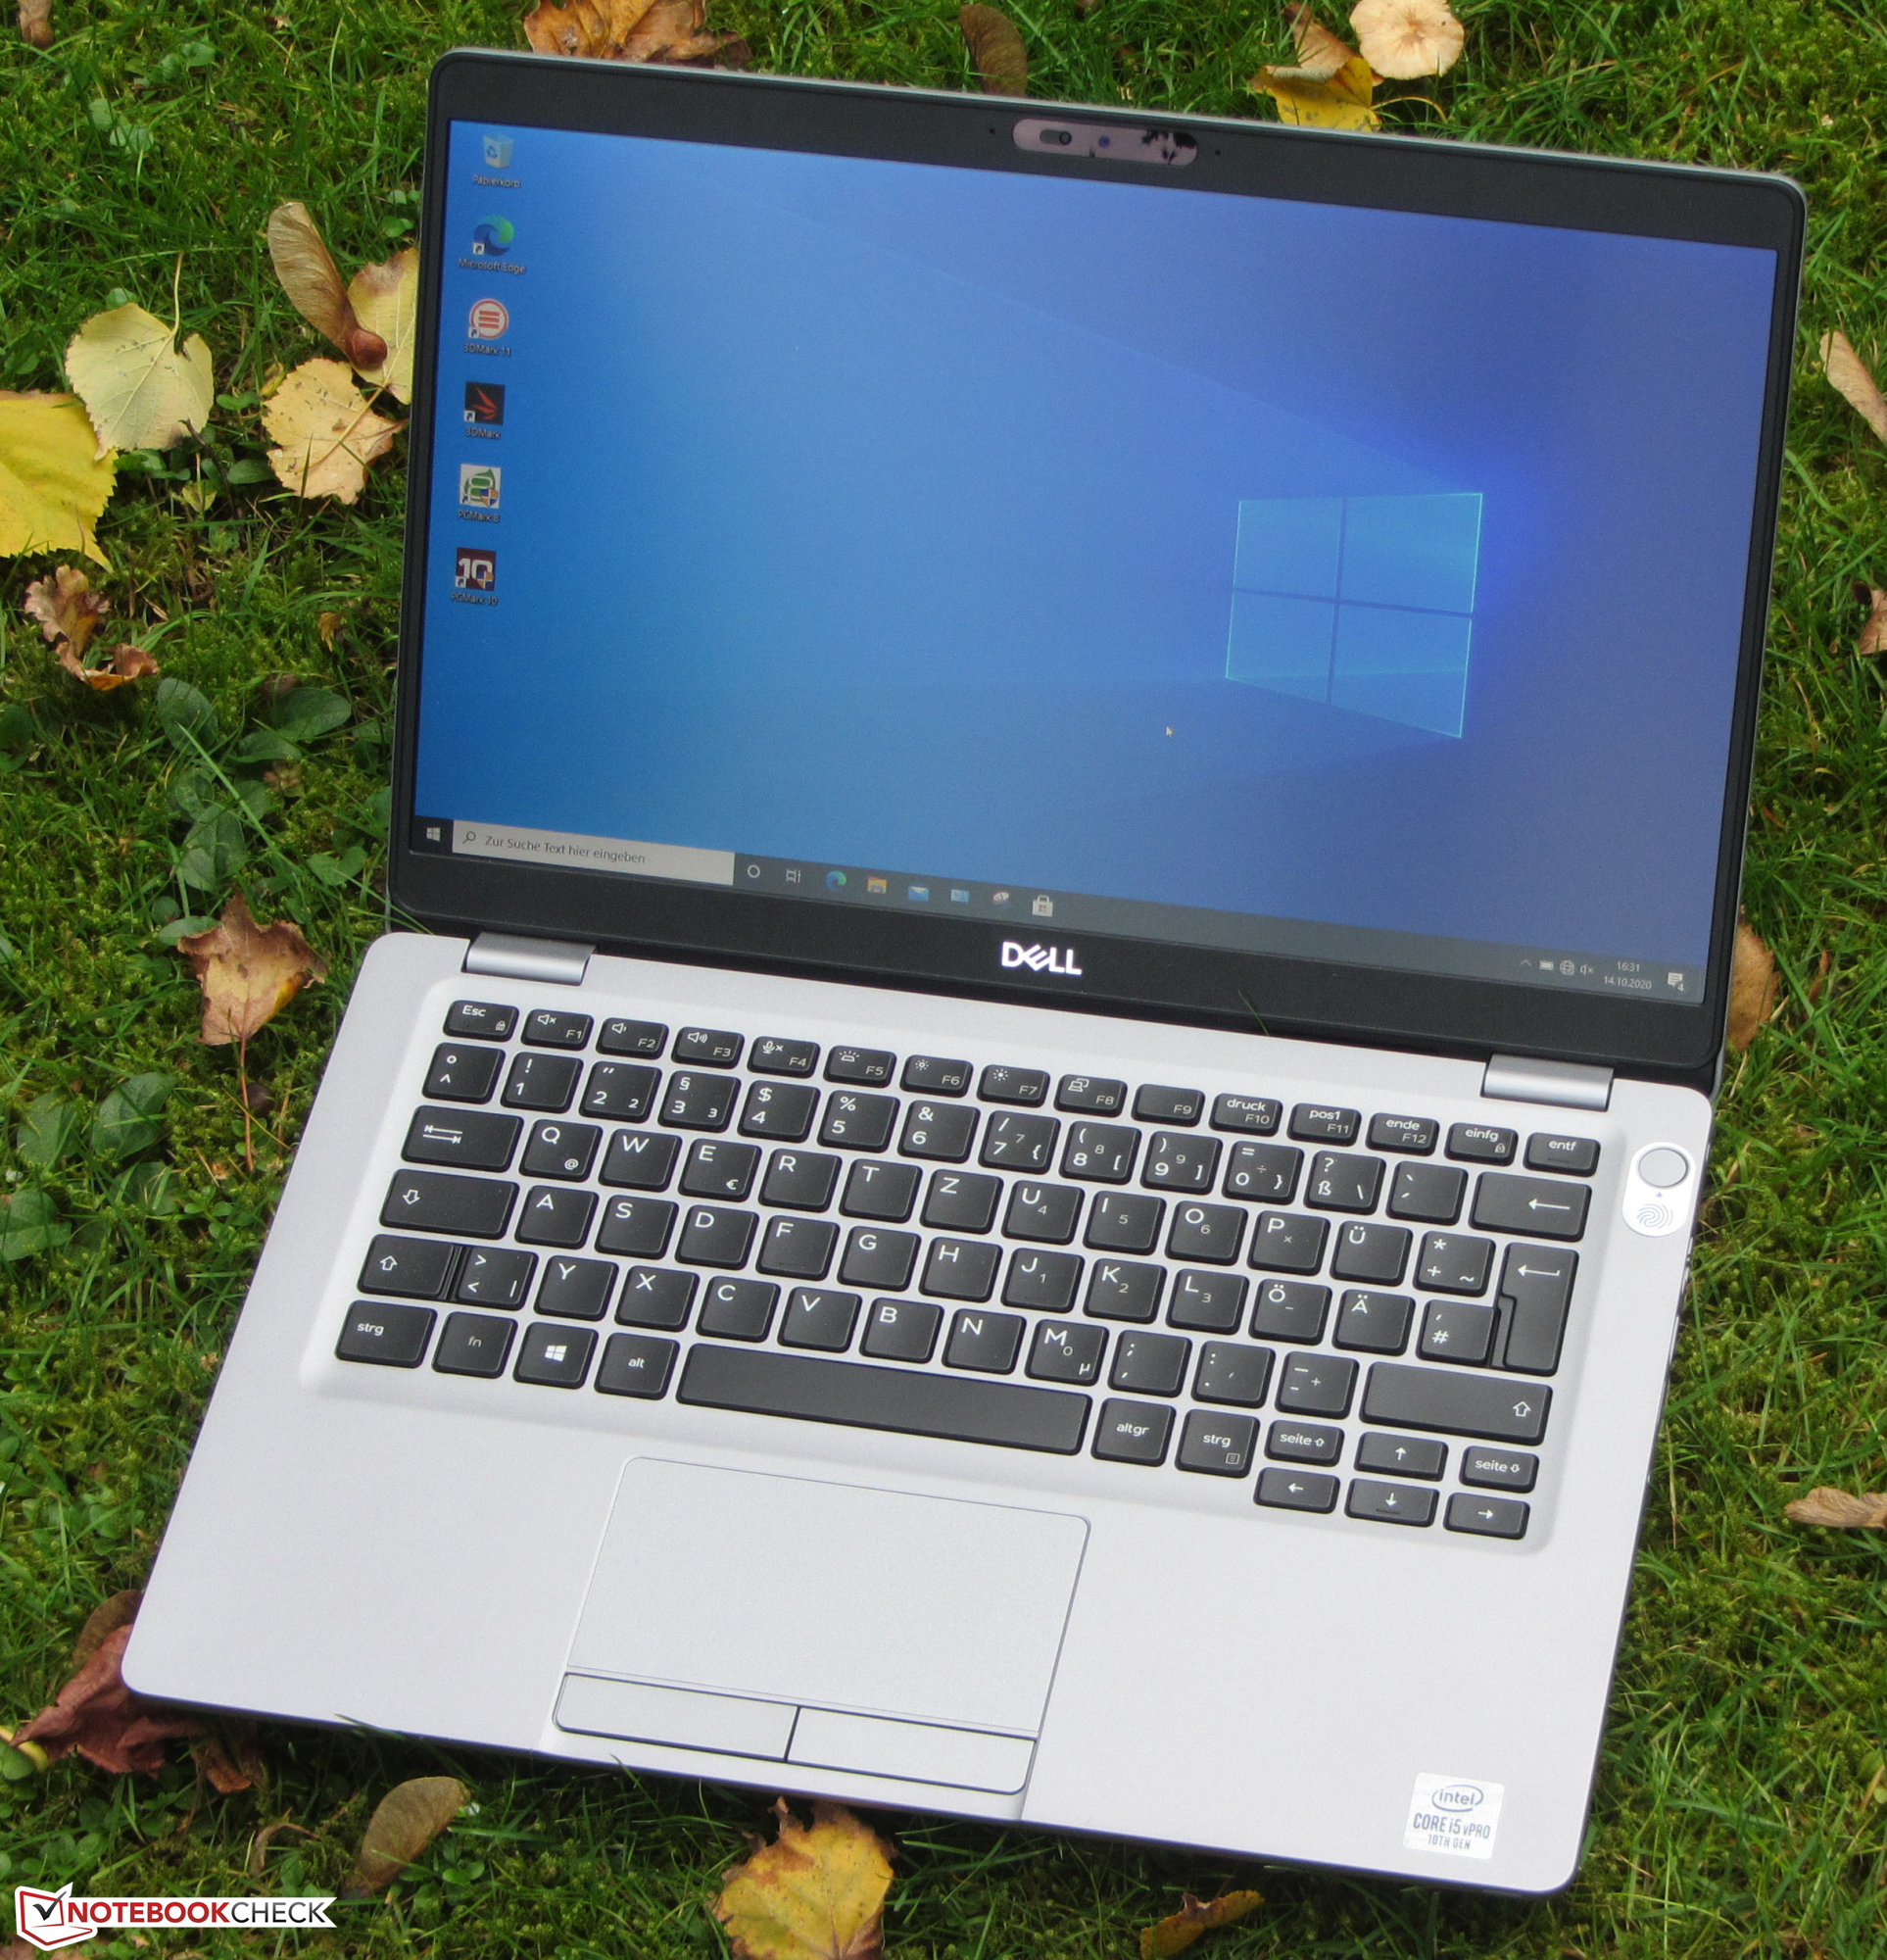
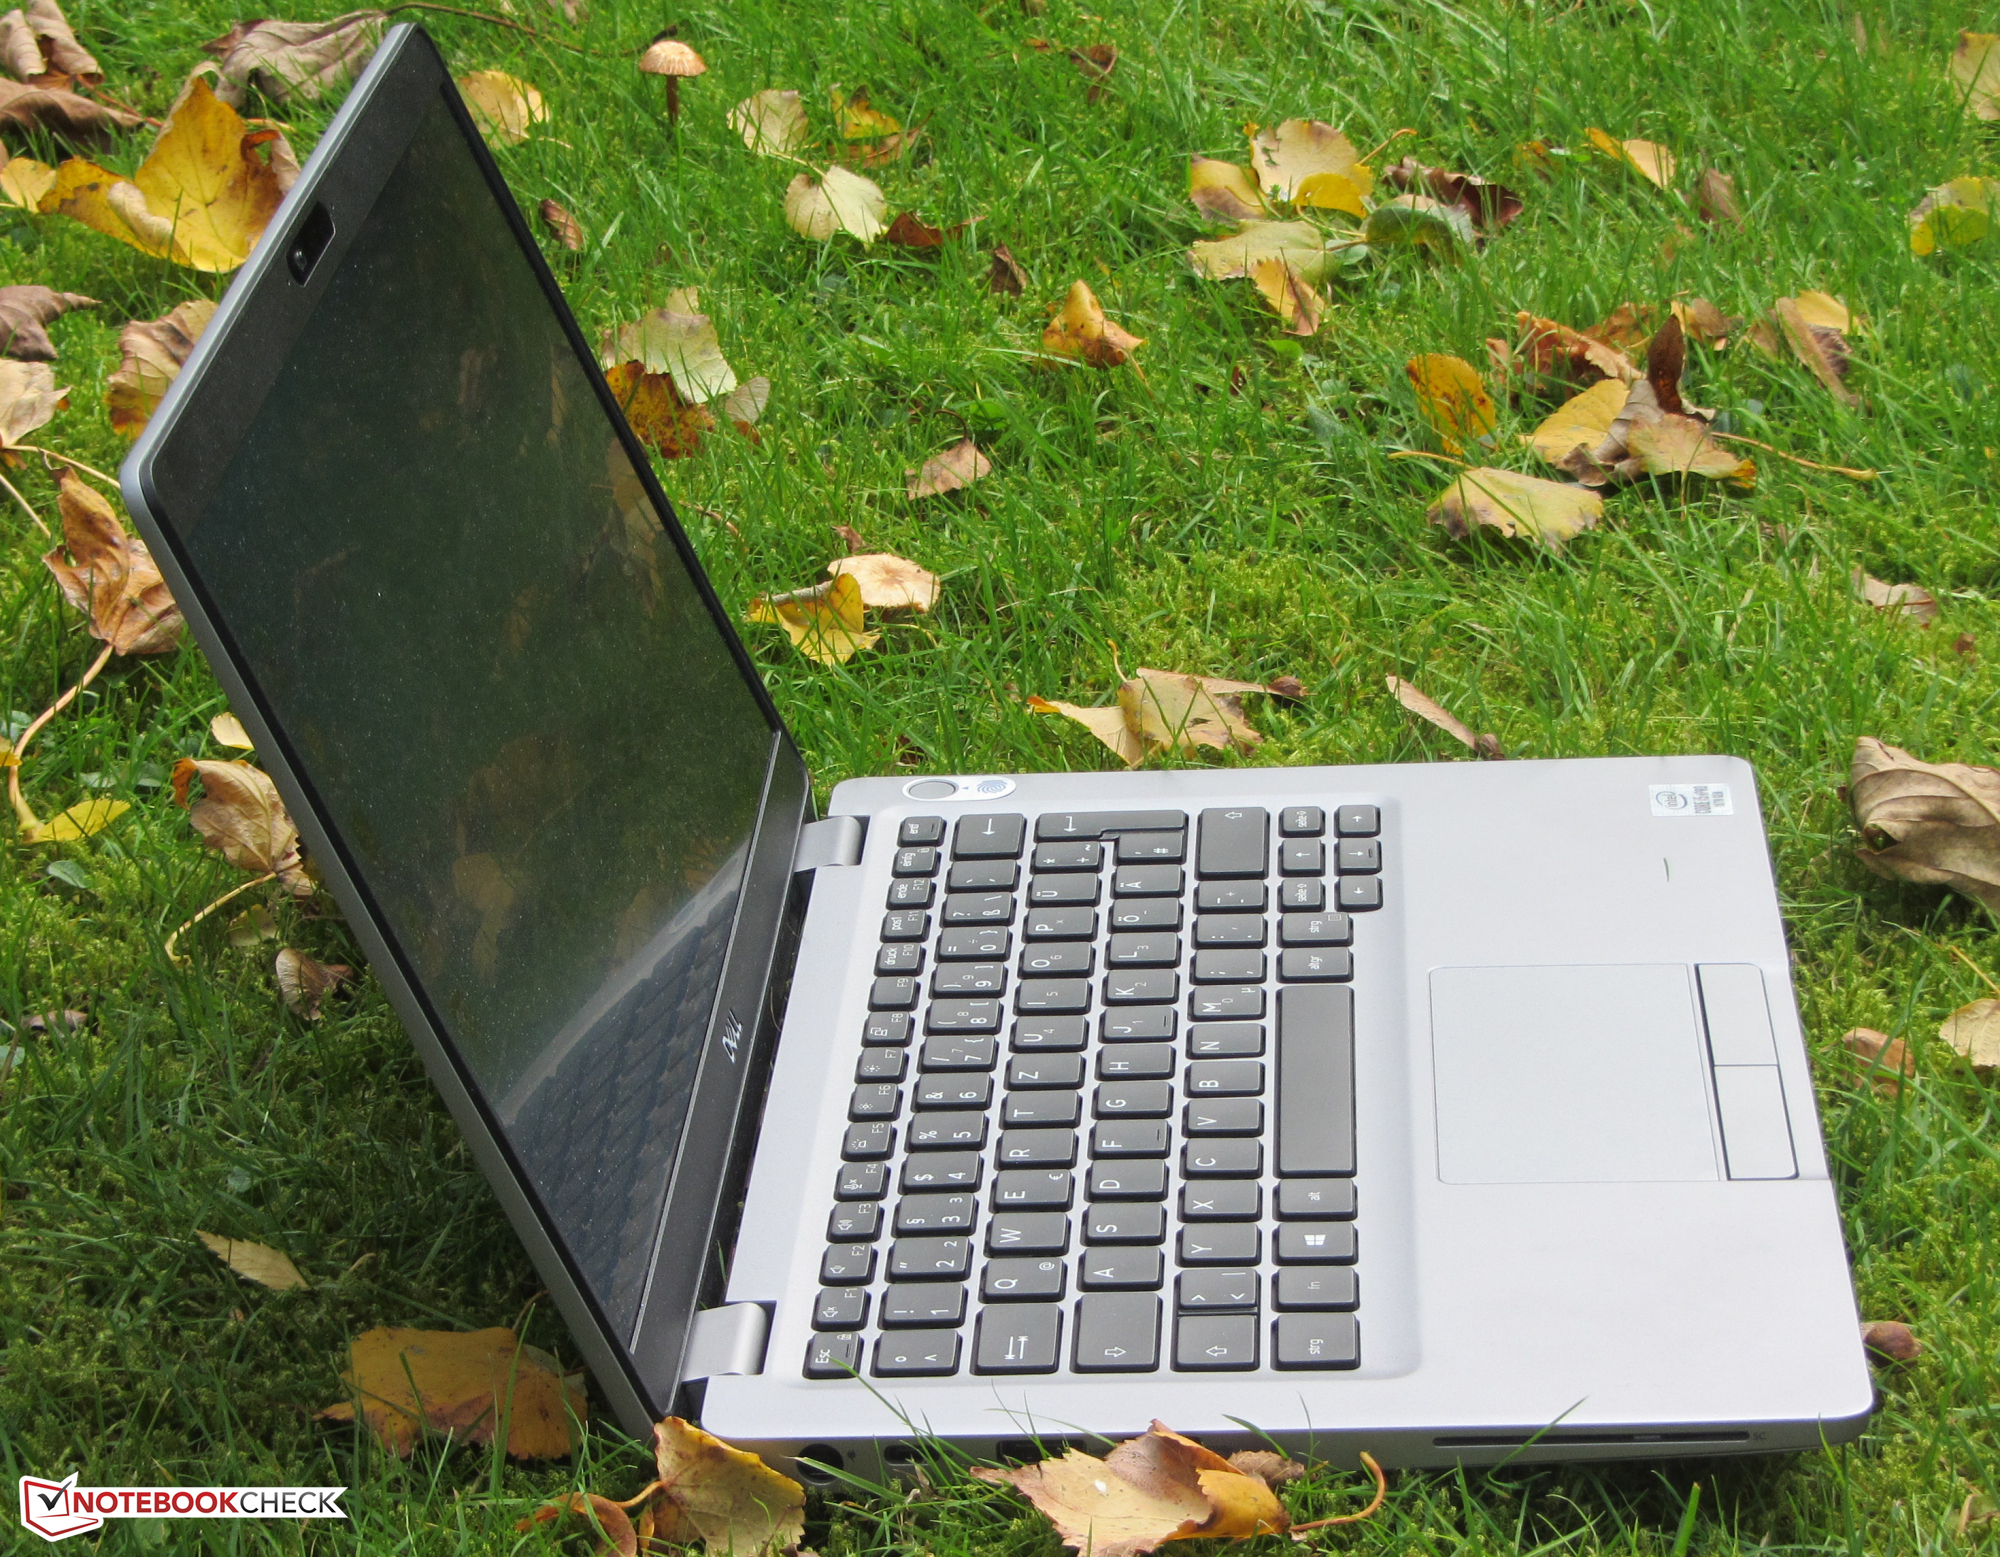
Med Latitude 5310 levererar Dell en välavrundad kontorslaptop utan några större brister.
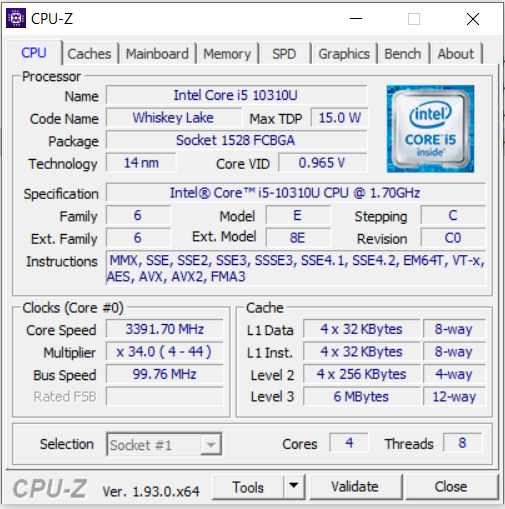
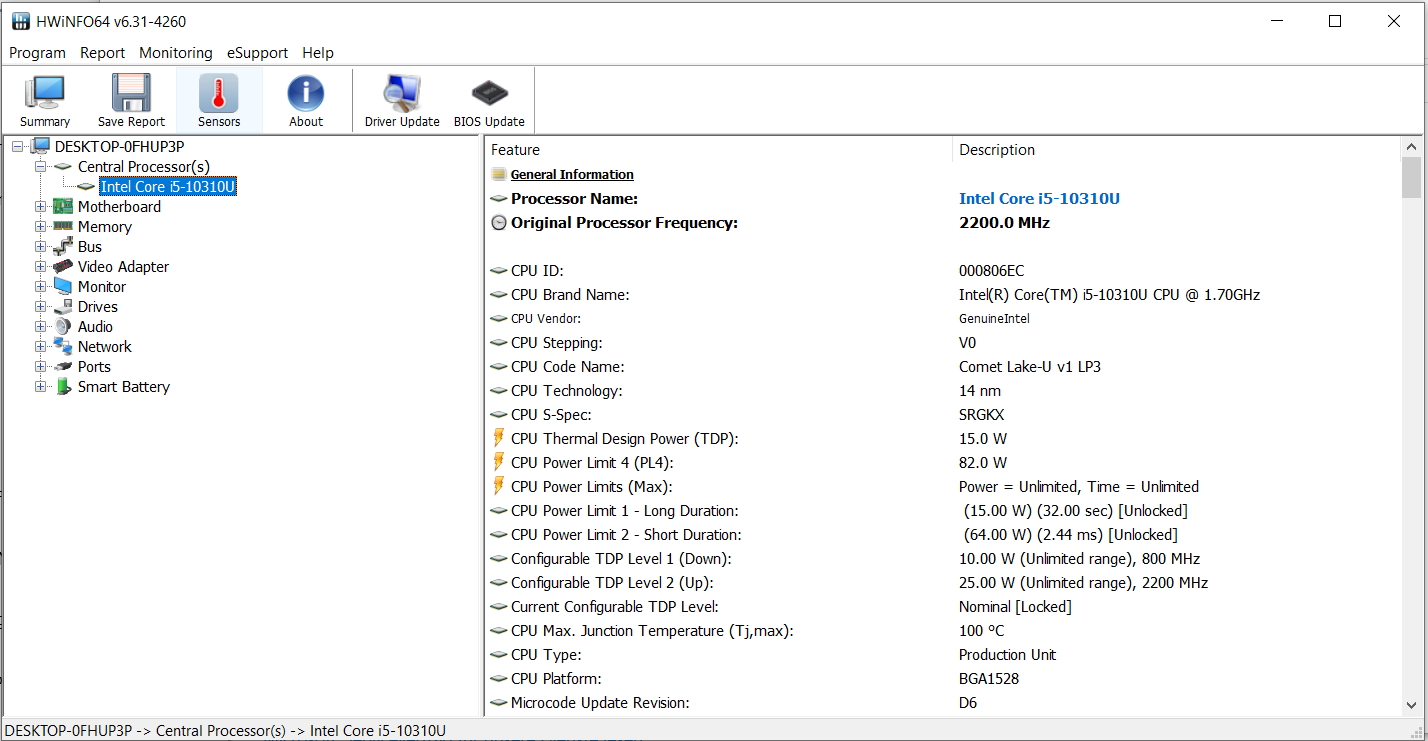
Den inbyggda Core i5-processorn har mer än tillräckligt med datorkraft för kontors- och internetapplikationer. Värme- och ljudnivåerna är på en acceptabel nivå.
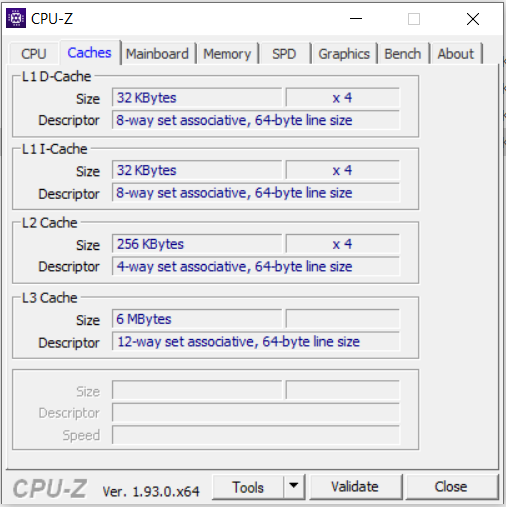
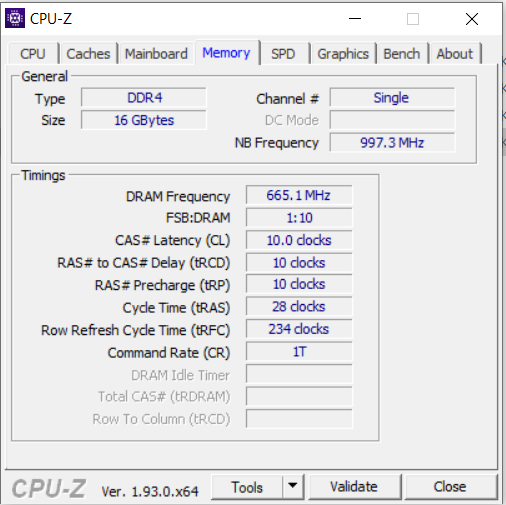
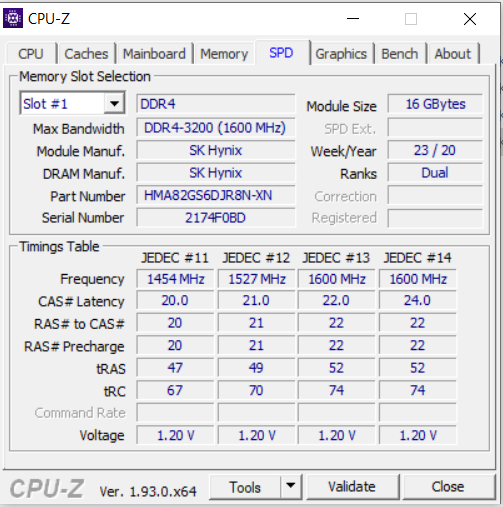
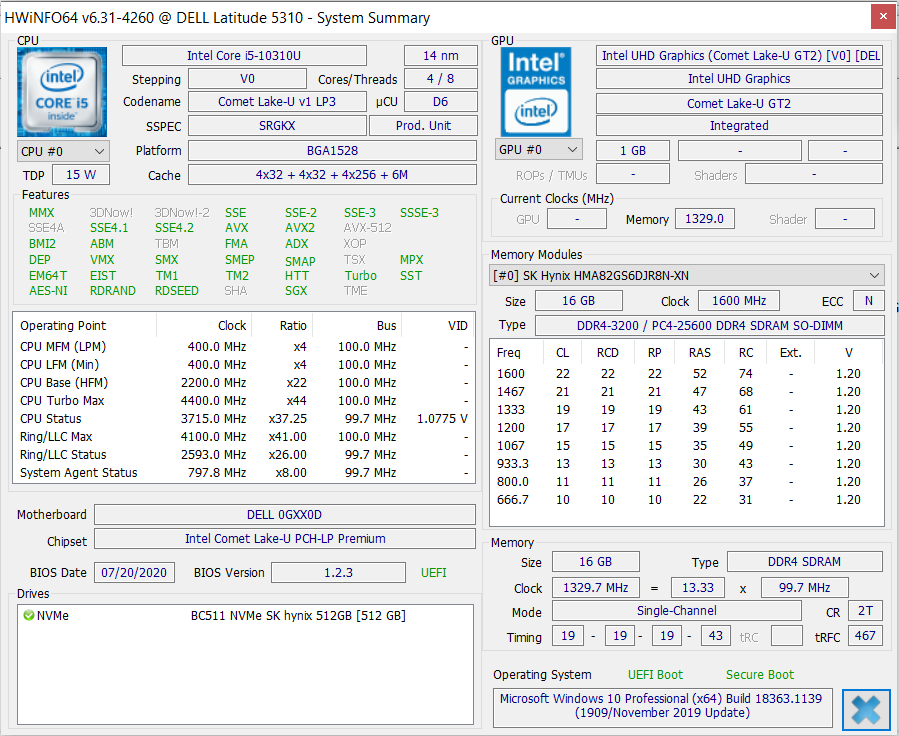
Processorn har tillgång till 8 GB RAM (1x 8 GB, enkel kanal, max. 32 GB). Vi rekommenderar att installera en andra minnesmodul för att aktivera dualkanalsläge. En NVMe SSD (512 GB) säkrar ett snabbt och smidigt system. Det går dessutom att byta ut SSD-enheten mot en snabbare och/eller större modell. Uppgraderingar och service kräver dock att man tar bort bottenplattan.
Skärmen (Full HD, IPS) får poäng för en matt yta, stabila betraktningsvinklar, acceptabel färgåtergivning och ett skapligt färgomfång. Ljusstyrkan och kontrastnivån är i grunden okej. Men med tanke på priset förtjänar datorn bättre. Dell erbjuder också ett LTE-modem som tillval till Latitude. Vår testenhet hade inget sådant men det går att montera i efterhand. Det finns redan LTE-antenner och en plats för SIM-kort.
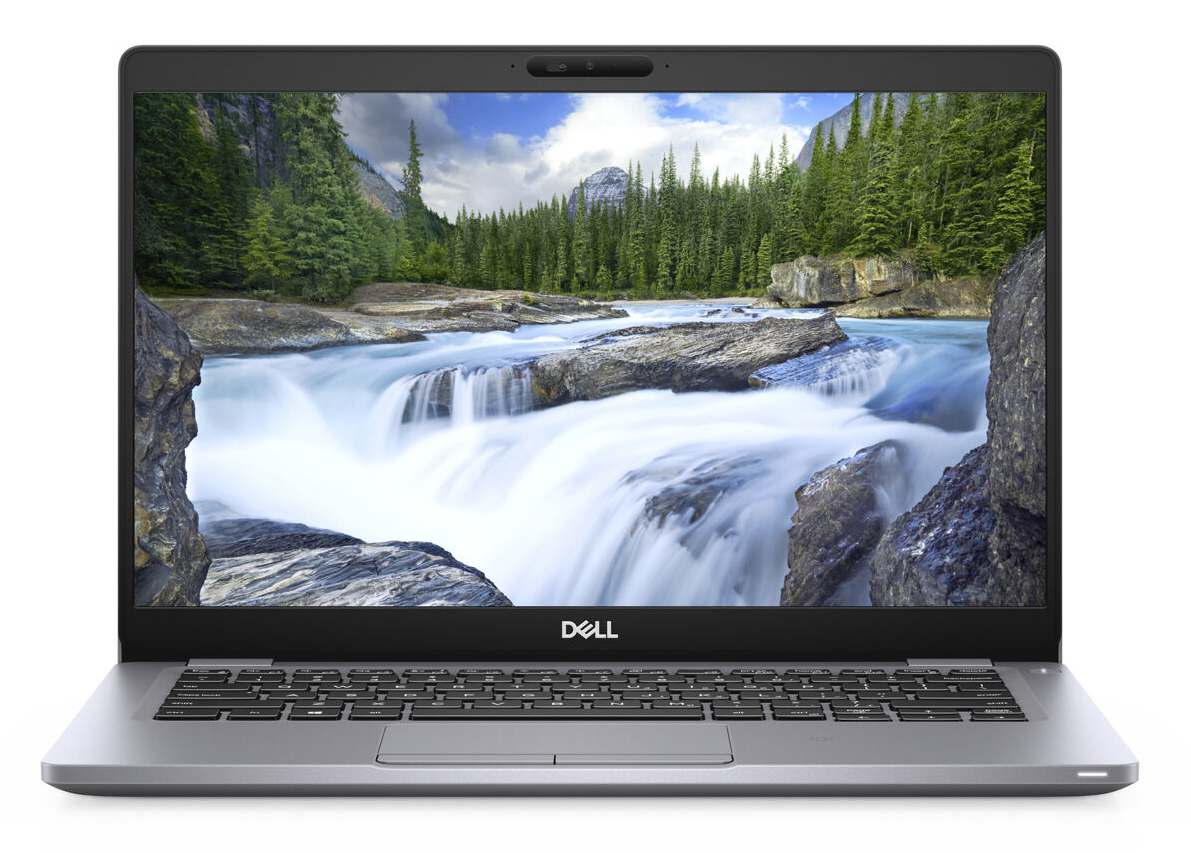
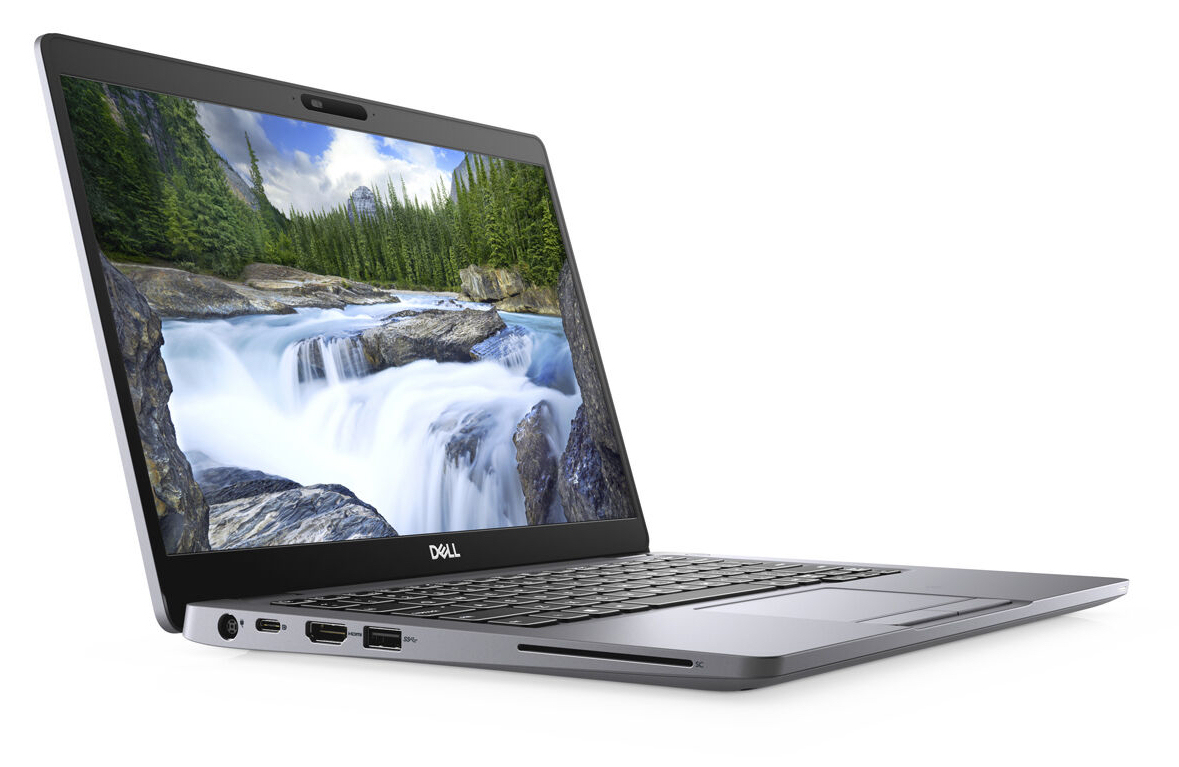
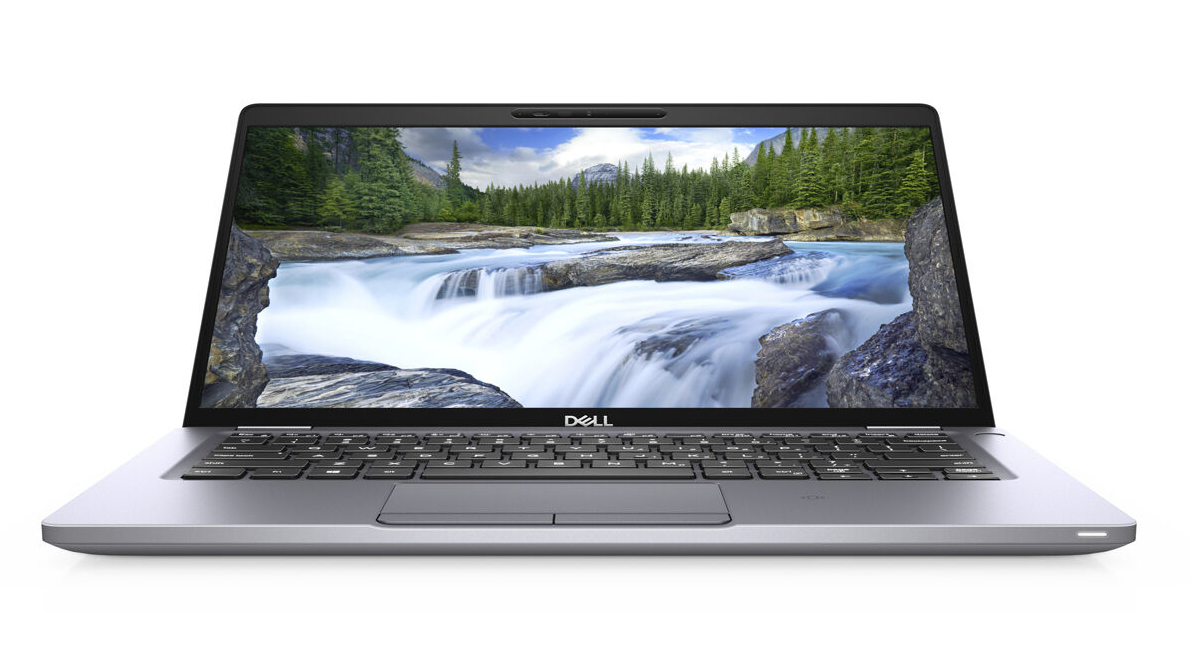
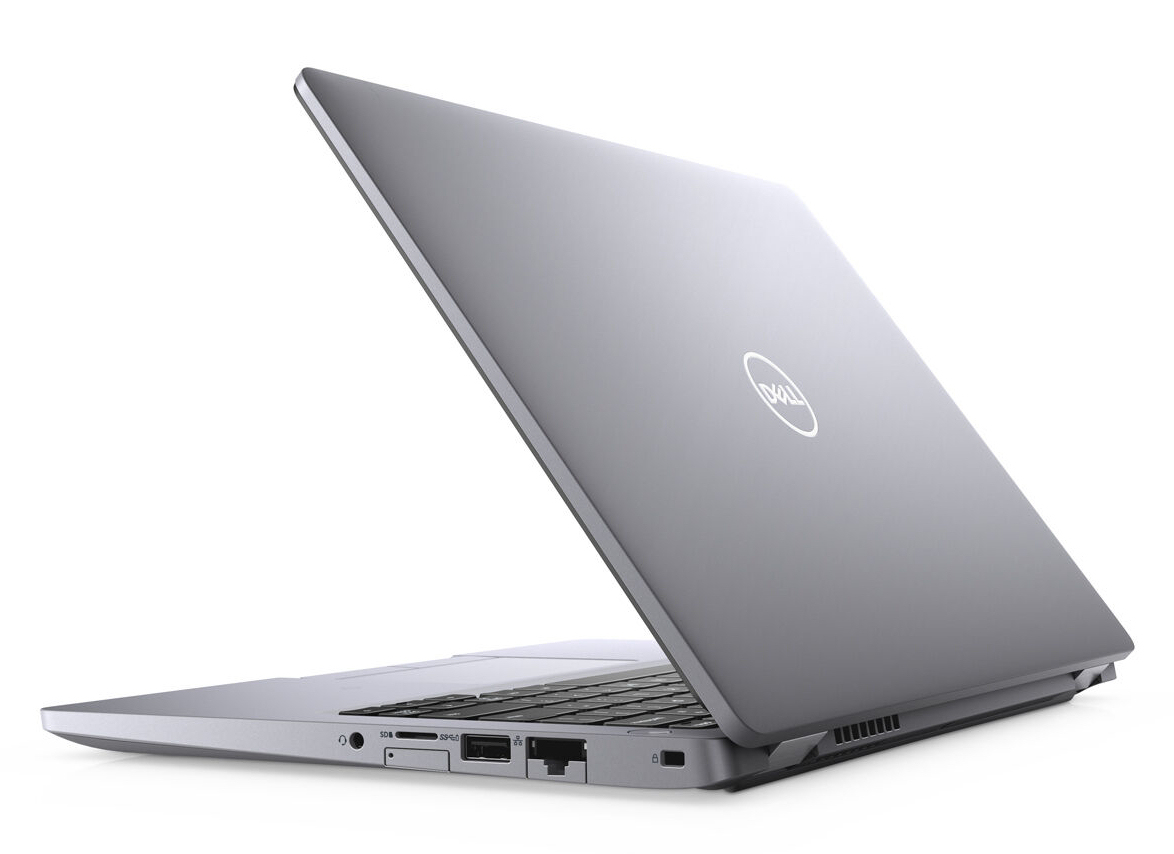
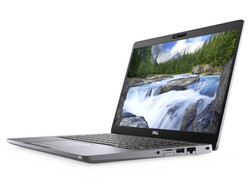
Dell Latitude 5310-GXX0D
- 10/18/2020 v7 (old)
Sascha Mölck
Price comparison
