Test: Dell Inspiron 15 5568 2-i-1 (sammanfattning)


| SD Card Reader | |
| average JPG Copy Test (av. of 3 runs) | |
| Dell XPS 13 2016 9350 (FHD, i7-6560U) | |
| Lenovo Yoga 510-15ISK | |
| HP Envy 15-w103ng x360 | |
| Dell Inspiron 15 5568 | |
| Acer Aspire R14 R5-471T-79GQ | |
| Lenovo Ideapad 500-15ISK 80NT005WGE | |
| maximum AS SSD Seq Read Test (1GB) | |
| Dell XPS 13 2016 9350 (FHD, i7-6560U) | |
| HP Envy 15-w103ng x360 | |
| Lenovo Yoga 510-15ISK | |
| Dell Inspiron 15 5568 | |
| Lenovo Ideapad 500-15ISK 80NT005WGE | |
| Acer Aspire R14 R5-471T-79GQ | |
| Networking | |
| iperf Server (receive) TCP 1 m | |
| Dell Inspiron 15 5568 | |
| HP x2 210 G1 | |
| iperf Client (transmit) TCP 1 m | |
| Dell Inspiron 15 5568 | |
| HP x2 210 G1 | |
| |||||||||||||||||||||||||
Distribution av ljusstyrkan: 85 %
Mitt på batteriet: 266 cd/m²
Kontrast: 1023:1 (Svärta: 0.26 cd/m²)
ΔE ColorChecker Calman: 4.98 | ∀{0.5-29.43 Ø4.71}
ΔE Greyscale Calman: 2.68 | ∀{0.09-98 Ø4.96}
57% sRGB (Argyll 1.6.3 3D)
36% AdobeRGB 1998 (Argyll 1.6.3 3D)
39.3% AdobeRGB 1998 (Argyll 3D)
57.1% sRGB (Argyll 3D)
38.04% Display P3 (Argyll 3D)
Gamma: 2.27
CCT: 6583 K
| Dell Inspiron 15 5568 HD Graphics 520, 6500U, Toshiba THNSNK256GCS8 | HP Spectre x360 15-ap012dx HD Graphics 520, 6200U, Sandisk X300 SD7SN6S-256G-1006 | HP Envy 15-w103ng x360 GeForce 930M, 6200U, Samsung SSD PM851 256 GB MZNTE256HMHP | Lenovo Yoga 510-15ISK Radeon R7 M460, 6200U, Liteonit CV3-DE256 | Acer Aspire R14 R5-471T-79GQ HD Graphics 520, 6500U | |
|---|---|---|---|---|---|
| Display | 61% | 5% | 12% | -3% | |
| Display P3 Coverage (%) | 38.04 | 62.8 65% | 39.97 5% | 42.58 12% | 36.92 -3% |
| sRGB Coverage (%) | 57.1 | 88.2 54% | 59.8 5% | 63.9 12% | 55.4 -3% |
| AdobeRGB 1998 Coverage (%) | 39.3 | 63.9 63% | 41.32 5% | 43.99 12% | 38.15 -3% |
| Response Times | -3% | -8% | -22% | -63% | |
| Response Time Grey 50% / Grey 80% * (ms) | 42 ? | 32.8 ? 22% | 37 ? 12% | 43.2 ? -3% | 80 ? -90% |
| Response Time Black / White * (ms) | 22 ? | 28 ? -27% | 28 ? -27% | 30.8 ? -40% | 30 ? -36% |
| PWM Frequency (Hz) | |||||
| Screen | 4% | -30% | 4% | -7% | |
| Brightness middle (cd/m²) | 266 | 298 12% | 208 -22% | 254 -5% | 215 -19% |
| Brightness (cd/m²) | 249 | 295 18% | 205 -18% | 230 -8% | 203 -18% |
| Brightness Distribution (%) | 85 | 88 4% | 80 -6% | 86 1% | 85 0% |
| Black Level * (cd/m²) | 0.26 | 0.57 -119% | 0.26 -0% | 0.26 -0% | 0.25 4% |
| Contrast (:1) | 1023 | 523 -49% | 800 -22% | 977 -4% | 860 -16% |
| Colorchecker dE 2000 * | 4.98 | 4.43 11% | 6.97 -40% | 4.23 15% | 5.04 -1% |
| Colorchecker dE 2000 max. * | 11.82 | 6.62 44% | 9.5 20% | 10.6 10% | |
| Greyscale dE 2000 * | 2.68 | 2.45 9% | 7.37 -175% | 2.87 -7% | 3.3 -23% |
| Gamma | 2.27 97% | 2.45 90% | 2.34 94% | 2.35 94% | 2.35 94% |
| CCT | 6583 99% | 6326 103% | 6823 95% | 5965 109% | 6370 102% |
| Color Space (Percent of AdobeRGB 1998) (%) | 36 | 57.2 59% | 38 6% | 40.35 12% | 35 -3% |
| Color Space (Percent of sRGB) (%) | 57 | 87.8 54% | 59 4% | 63.48 11% | 55 -4% |
| Totalt genomsnitt (program/inställningar) | 21% /
15% | -11% /
-20% | -2% /
2% | -24% /
-14% |
* ... mindre är bättre
Visa svarstider
| ↔ Svarstid svart till vitt | ||
|---|---|---|
| 22 ms ... stiga ↗ och falla ↘ kombinerat | ↗ 6 ms stiga | 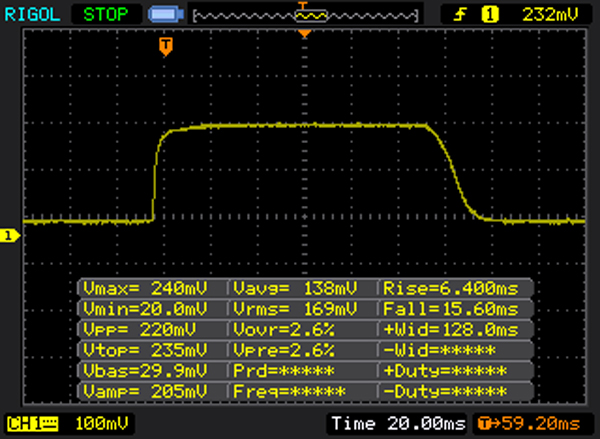 |
| ↘ 16 ms hösten | ||
| Skärmen visar bra svarsfrekvens i våra tester, men kan vara för långsam för konkurrenskraftiga spelare. I jämförelse sträcker sig alla testade enheter från 0.1 (minst) till 240 (maximalt) ms. » 49 % av alla enheter är bättre. Detta innebär att den uppmätta svarstiden är sämre än genomsnittet av alla testade enheter (19.8 ms). | ||
| ↔ Svarstid 50 % grått till 80 % grått | ||
| 42 ms ... stiga ↗ och falla ↘ kombinerat | ↗ 19 ms stiga | 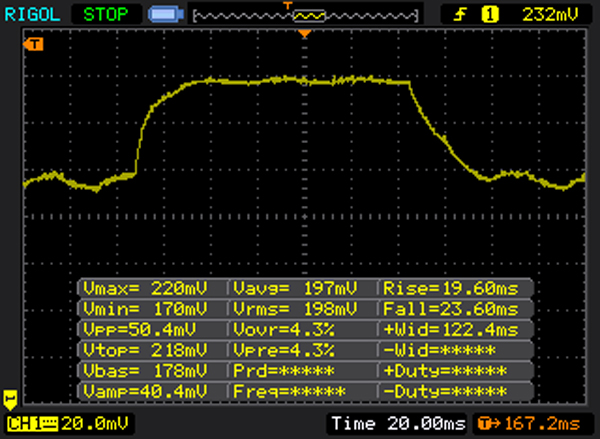 |
| ↘ 23 ms hösten | ||
| Skärmen visar långsamma svarsfrekvenser i våra tester och kommer att vara otillfredsställande för spelare. I jämförelse sträcker sig alla testade enheter från 0.165 (minst) till 636 (maximalt) ms. » 67 % av alla enheter är bättre. Detta innebär att den uppmätta svarstiden är sämre än genomsnittet av alla testade enheter (31 ms). | ||
Skärmflimmer / PWM (Puls-Width Modulation)
| Skärmflimmer / PWM upptäcktes inte | ||
Som jämförelse: 52 % av alla testade enheter använder inte PWM för att dämpa skärmen. Om PWM upptäcktes mättes ett medelvärde av 7754 (minst: 5 - maximum: 343500) Hz. | ||
| Cinebench R15 | |
| CPU Multi 64Bit | |
| Lenovo Ideapad 500-15ISK 80NT005WGE | |
| Acer Aspire R14 R5-471T-79GQ | |
| HP Spectre x360 15-ap012dx | |
| Dell Inspiron 15 5568 | |
| HP Envy 15-w103ng x360 | |
| Lenovo Yoga 510-15ISK | |
| CPU Single 64Bit | |
| Lenovo Ideapad 500-15ISK 80NT005WGE | |
| Acer Aspire R14 R5-471T-79GQ | |
| Dell Inspiron 15 5568 | |
| HP Spectre x360 15-ap012dx | |
| HP Envy 15-w103ng x360 | |
| Lenovo Yoga 510-15ISK | |
| PCMark 8 - Home Score Accelerated v2 | |
| Lenovo Yoga 510-15ISK | |
| Dell Inspiron 15 5568 | |
| Lenovo Ideapad 500-15ISK 80NT005WGE | |
| Acer Aspire R14 R5-471T-79GQ | |
| HP Envy 15-w103ng x360 | |
| HP Spectre x360 15-ap012dx | |
| PCMark 8 Home Score Accelerated v2 | 3607 poäng | |
| PCMark 8 Work Score Accelerated v2 | 4433 poäng | |
Hjälp | ||
| Dell Inspiron 15 5568 HD Graphics 520, 6500U, Toshiba THNSNK256GCS8 | HP Spectre x360 15-ap012dx HD Graphics 520, 6200U, Sandisk X300 SD7SN6S-256G-1006 | HP Envy 15-w103ng x360 GeForce 930M, 6200U, Samsung SSD PM851 256 GB MZNTE256HMHP | Acer Aspire R14 R5-471T-79GQ HD Graphics 520, 6500U | Lenovo Yoga 510-15ISK Radeon R7 M460, 6200U, Liteonit CV3-DE256 | |
|---|---|---|---|---|---|
| CrystalDiskMark 3.0 | 14% | 13% | -9% | 18% | |
| Read Seq (MB/s) | 458.6 | 475.6 4% | 515 12% | 503 10% | 487 6% |
| Write Seq (MB/s) | 270 | 425 57% | 240.7 -11% | 161.6 -40% | 450.7 67% |
| Read 512 (MB/s) | 397.4 | 258.4 -35% | 391.3 -2% | 319.7 -20% | 384.5 -3% |
| Write 512 (MB/s) | 242 | 318.9 32% | 240 -1% | 161.5 -33% | 356.3 47% |
| Read 4k (MB/s) | 19.88 | 35.48 78% | 27.64 39% | 26.04 31% | 27.05 36% |
| Write 4k (MB/s) | 86.7 | 93 7% | 95.2 10% | 81.6 -6% | 63.7 -27% |
| Read 4k QD32 (MB/s) | 275.3 | 281.2 2% | 367.9 34% | 278.5 1% | 281.5 2% |
| Write 4k QD32 (MB/s) | 197.6 | 138.7 -30% | 239 21% | 161.6 -18% | 232 17% |

| 3DMark 11 - 1280x720 Performance | |
| Lenovo Ideapad 500-15ISK 80NT005WGE | |
| HP Envy 15-w103ng x360 | |
| Lenovo Yoga 510-15ISK | |
| Dell Inspiron 15 5568 | |
| Acer Aspire R14 R5-471T-79GQ | |
| HP Spectre x360 15-ap012dx | |
| 3DMark 11 Performance | 1672 poäng | |
| 3DMark Cloud Gate Standard Score | 6323 poäng | |
Hjälp | ||
| Tomb Raider | |
| 1366x768 Normal Preset AA:FX AF:4x | |
| HP Envy 15-w103ng x360 | |
| Dell Inspiron 15 5568 | |
| Lenovo Ideapad 500-15ISK 80NT005WGE | |
| Acer Aspire R14 R5-471T-79GQ | |
| Lenovo Yoga 510-15ISK | |
| Asus ASUSPRO P2530UA-DM0046E | |
| Acer TravelMate P648-M-757N | |
| Lenovo ThinkPad X260-20F6007RGE | |
| 1366x768 High Preset AA:FX AF:8x | |
| HP Envy 15-w103ng x360 | |
| Lenovo Ideapad 500-15ISK 80NT005WGE | |
| Lenovo Yoga 510-15ISK | |
| Dell Inspiron 15 5568 | |
| Asus ASUSPRO P2530UA-DM0046E | |
| Acer Aspire R14 R5-471T-79GQ | |
| Acer TravelMate P648-M-757N | |
| Lenovo ThinkPad X260-20F6007RGE | |
| låg | med. | hög | ultra | |
|---|---|---|---|---|
| Tomb Raider (2013) | 84.1 | 42.7 | 27.9 | 12.6 |
| BioShock Infinite (2013) | 54.4 | 31.5 | 27.7 | 8.2 |
| Rise of the Tomb Raider (2016) | 17.6 | 10.8 | 6.2 |
Ljudnivå
| Låg belastning |
| 32.8 / 32.8 / 33.8 dB(A) |
| Hög belastning |
| 36.3 / 36.3 dB(A) |
 | ||
30 dB tyst 40 dB(A) hörbar 50 dB(A) högt ljud |
||
min: | ||
(+) Den maximala temperaturen på ovansidan är 37.2 °C / 99 F, jämfört med genomsnittet av 35.4 °C / 96 F , allt från 19.6 till 60 °C för klassen Convertible.
(-) Botten värms upp till maximalt 50.6 °C / 123 F, jämfört med genomsnittet av 36.9 °C / 98 F
(+) Vid tomgångsbruk är medeltemperaturen för ovansidan 26.2 °C / 79 F, jämfört med enhetsgenomsnittet på 30.3 °C / ### class_avg_f### F.
(+) Handledsstöden och pekplattan är kallare än hudtemperaturen med maximalt 25.2 °C / 77.4 F och är därför svala att ta på.
(+) Medeltemperaturen för handledsstödsområdet på liknande enheter var 28 °C / 82.4 F (+2.8 °C / 5 F).
| Av/Standby | |
| Låg belastning | |
| Hög belastning |
|
Förklaring:
min: | |
| Dell Inspiron 15 5568 HD Graphics 520, 6500U, Toshiba THNSNK256GCS8 | HP Spectre x360 15-ap012dx HD Graphics 520, 6200U, Sandisk X300 SD7SN6S-256G-1006 | HP Envy 15-w103ng x360 GeForce 930M, 6200U, Samsung SSD PM851 256 GB MZNTE256HMHP | Lenovo Yoga 510-15ISK Radeon R7 M460, 6200U, Liteonit CV3-DE256 | Acer Aspire R14 R5-471T-79GQ HD Graphics 520, 6500U | |
|---|---|---|---|---|---|
| Power Consumption | -45% | -13% | -20% | 4% | |
| Idle Minimum * (Watt) | 4.34 | 6.5 -50% | 4.15 4% | 4 8% | 4 8% |
| Idle Average * (Watt) | 7.5 | 13.3 -77% | 8.2 -9% | 7.5 -0% | 6.6 12% |
| Idle Maximum * (Watt) | 8.4 | 15.1 -80% | 8.2 2% | 8.1 4% | 8.6 -2% |
| Load Average * (Watt) | 30.4 | 30.8 -1% | 34.6 -14% | 40.8 -34% | 30.5 -0% |
| Load Maximum * (Watt) | 32.5 | 38.5 -18% | 48 -48% | 57.3 -76% | 32.2 1% |
* ... mindre är bättre
| Dell Inspiron 15 5568 HD Graphics 520, 6500U, Toshiba THNSNK256GCS8 | HP Spectre x360 15-ap012dx HD Graphics 520, 6200U, Sandisk X300 SD7SN6S-256G-1006 | HP Envy 15-w103ng x360 GeForce 930M, 6200U, Samsung SSD PM851 256 GB MZNTE256HMHP | Acer Aspire R14 R5-471T-79GQ HD Graphics 520, 6500U | Lenovo Yoga 510-15ISK Radeon R7 M460, 6200U, Liteonit CV3-DE256 | |
|---|---|---|---|---|---|
| Batteridrifttid | 40% | 32% | 50% | 23% | |
| Reader / Idle (h) | 7.5 | 11.8 57% | 12.2 63% | ||
| H.264 (h) | 5 | 5.6 12% | |||
| WiFi v1.3 (h) | 5 | 7.2 44% | 6.6 32% | 7.5 50% | 5.6 12% |
| Load (h) | 1.6 | 1.9 19% | 1.7 6% |
För
Emot
En längre version av testet finns att läsa här (på engelska).
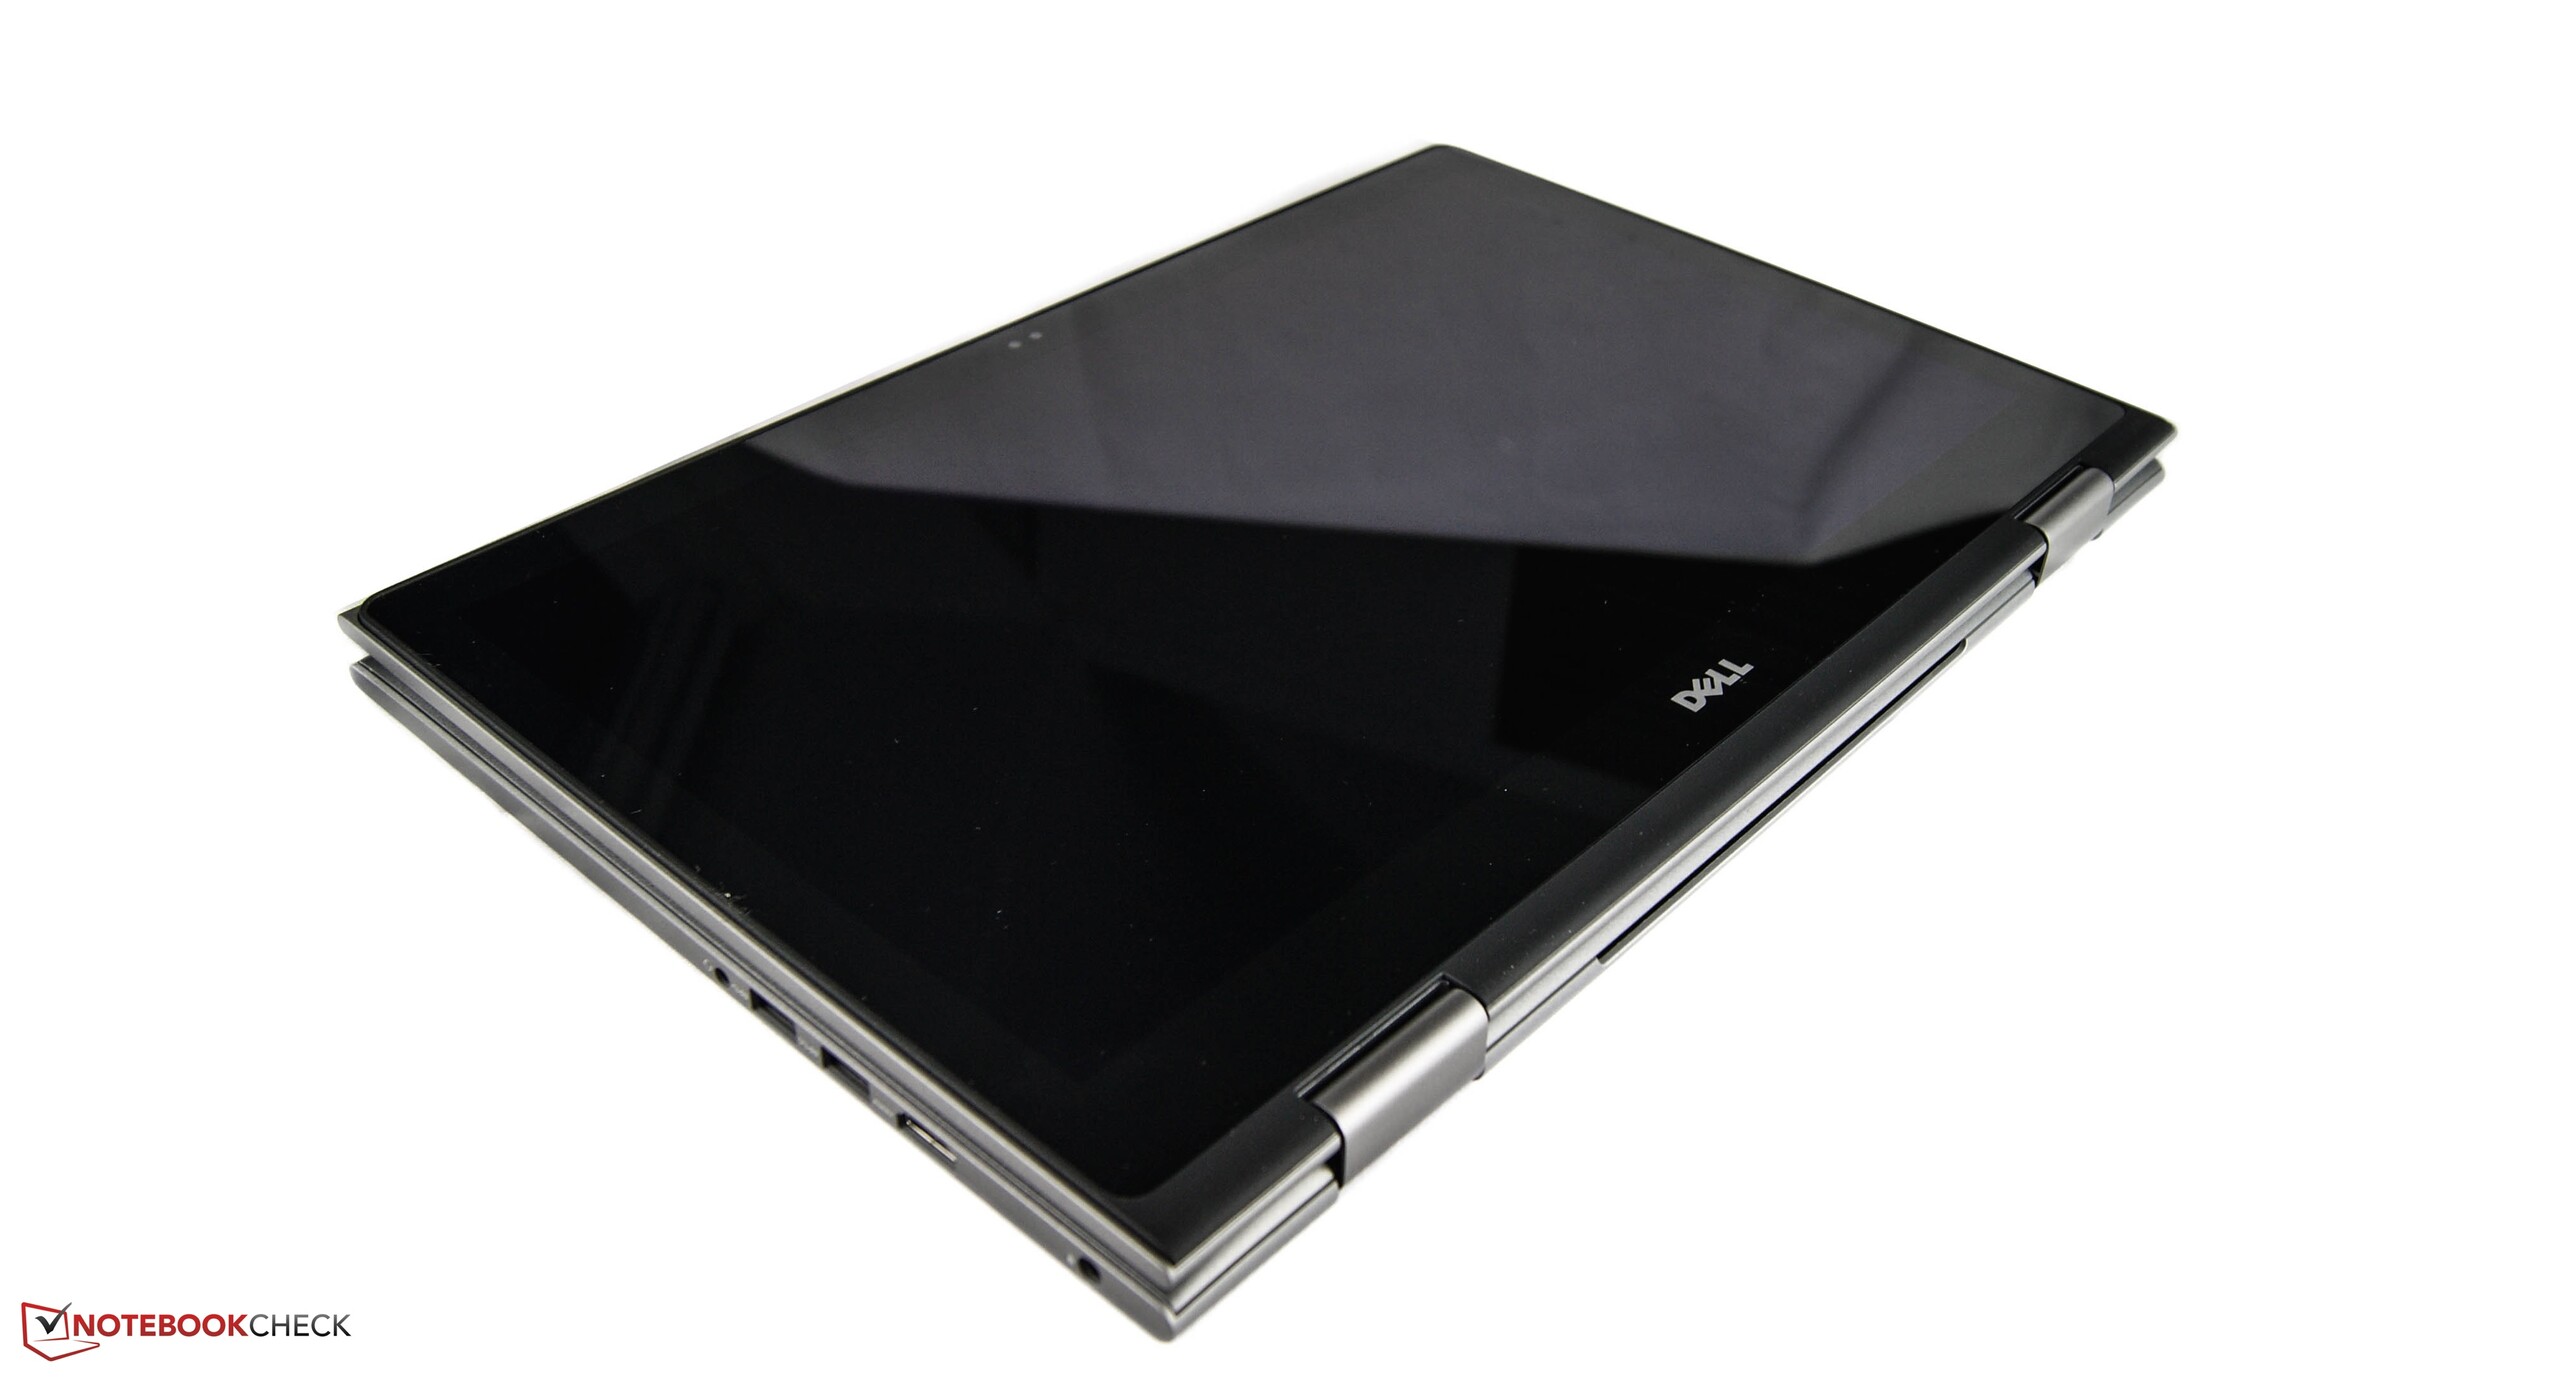
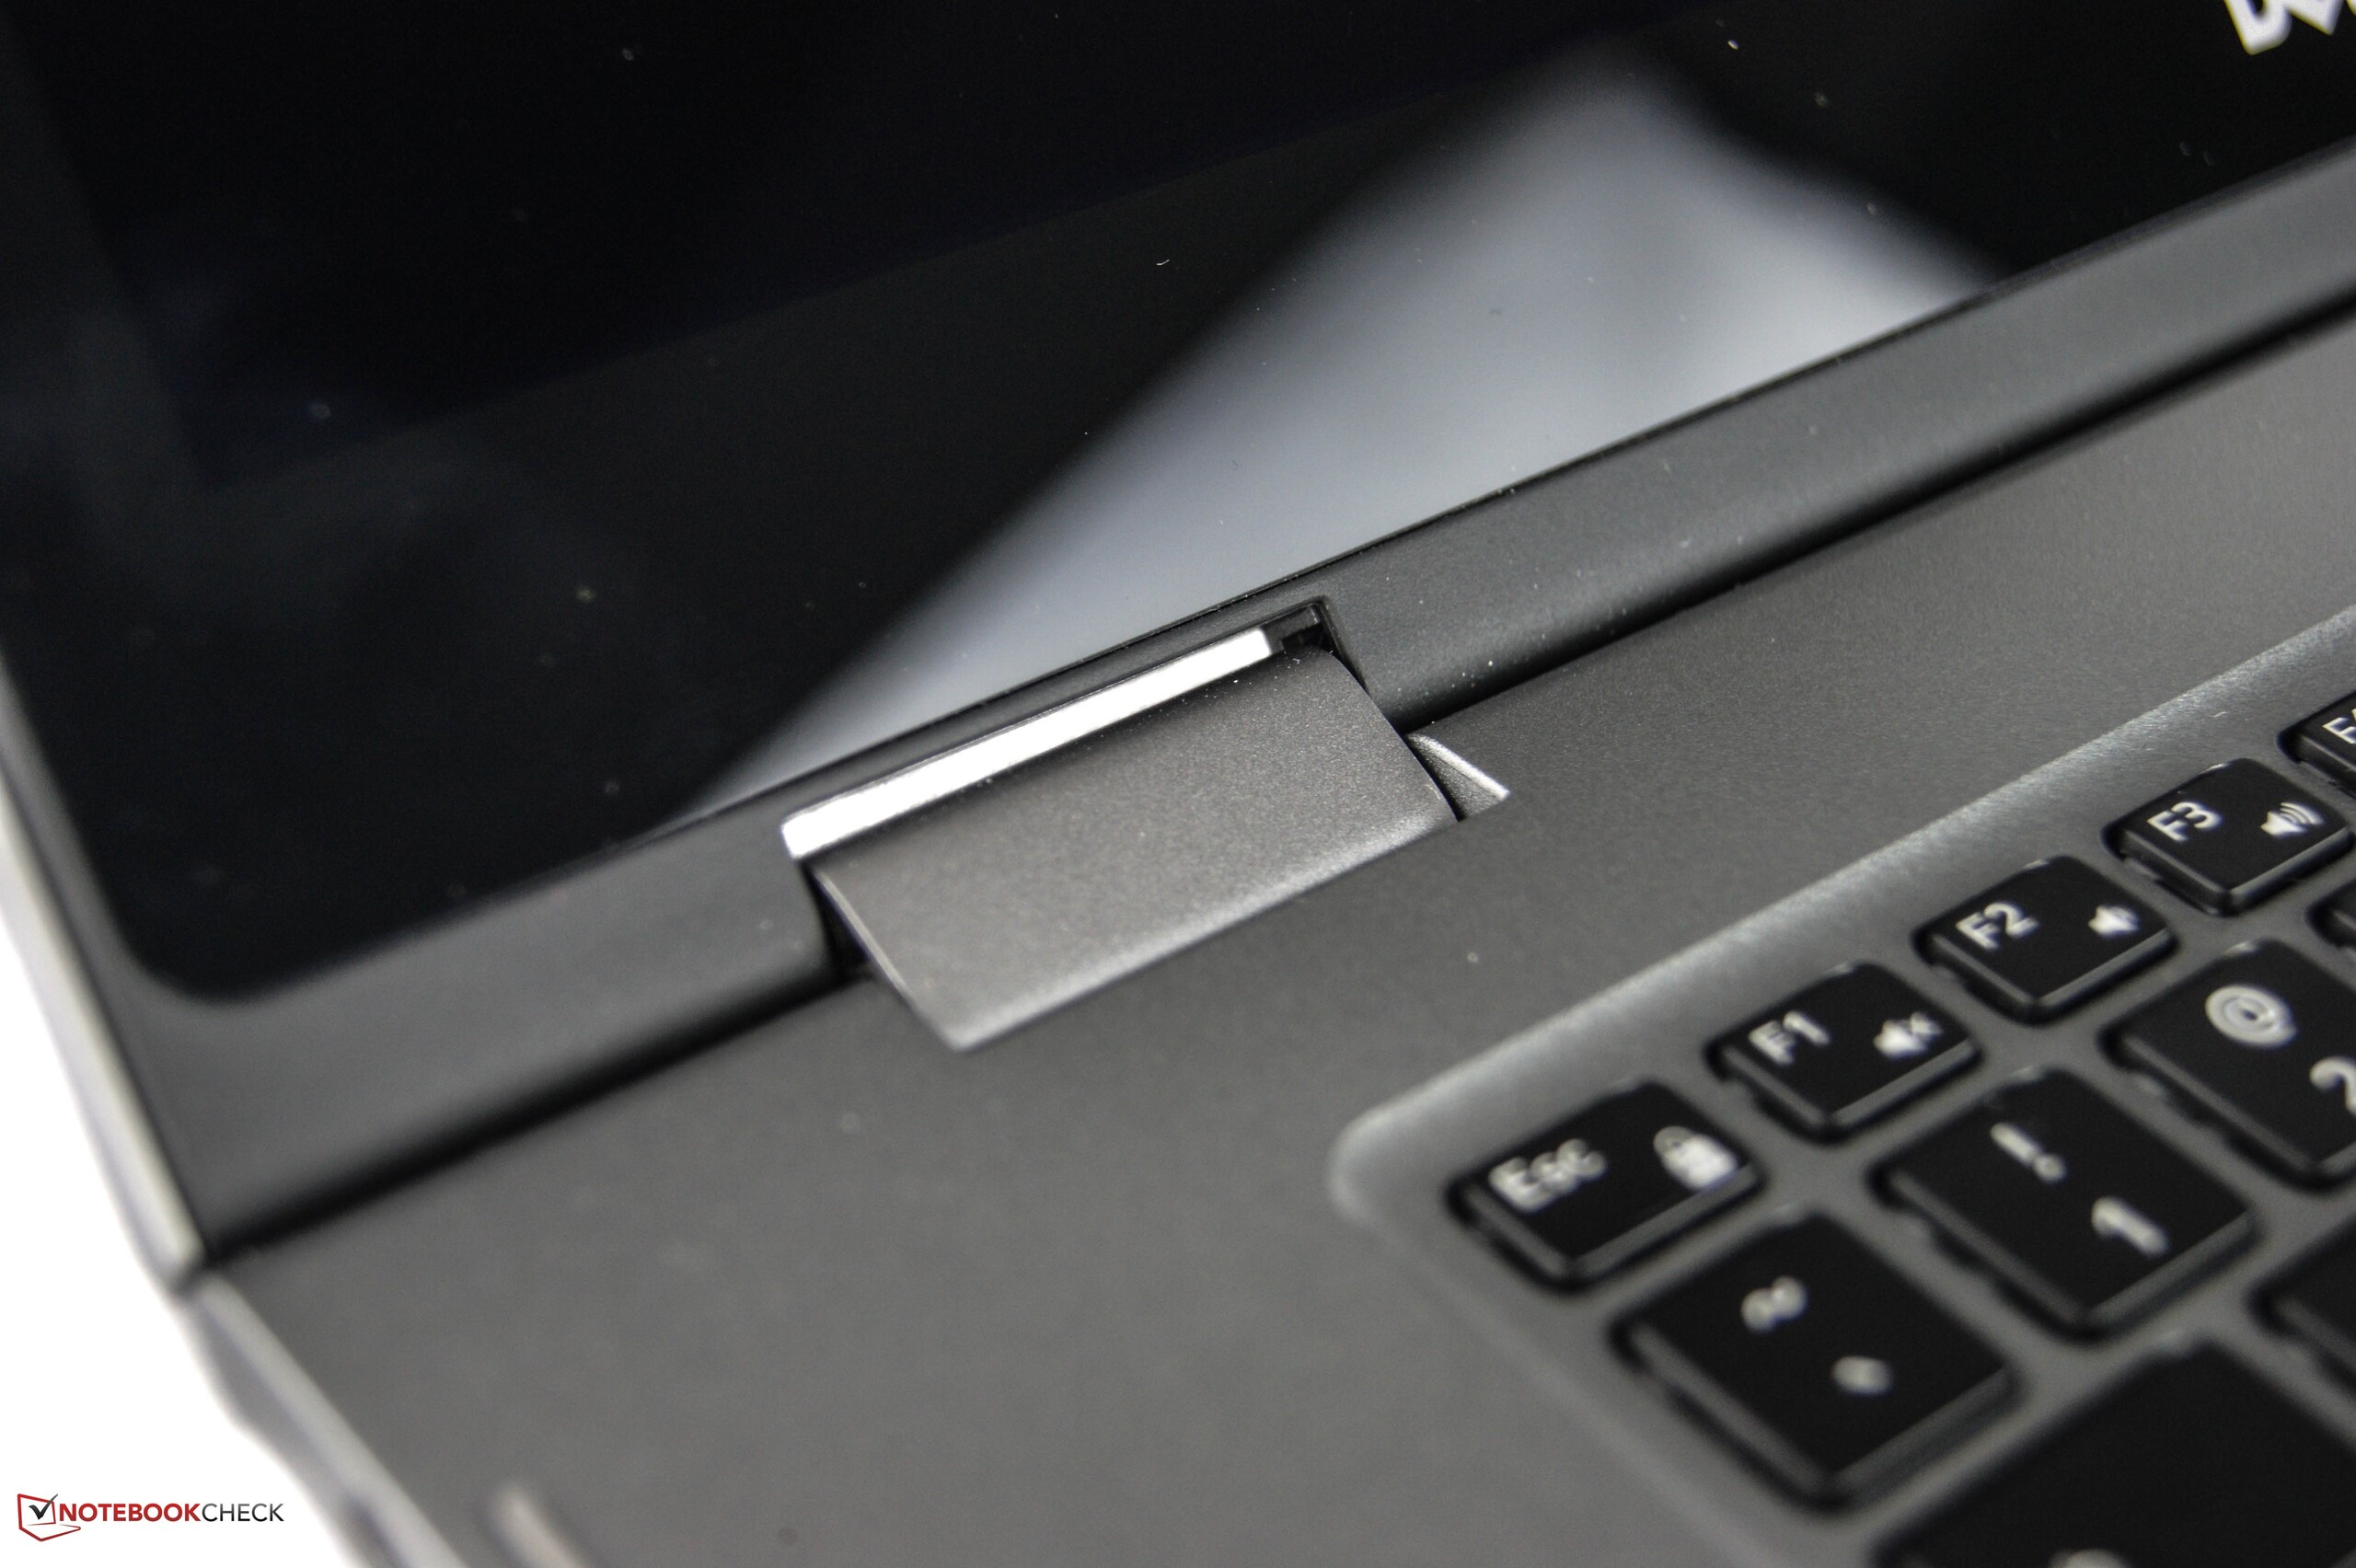
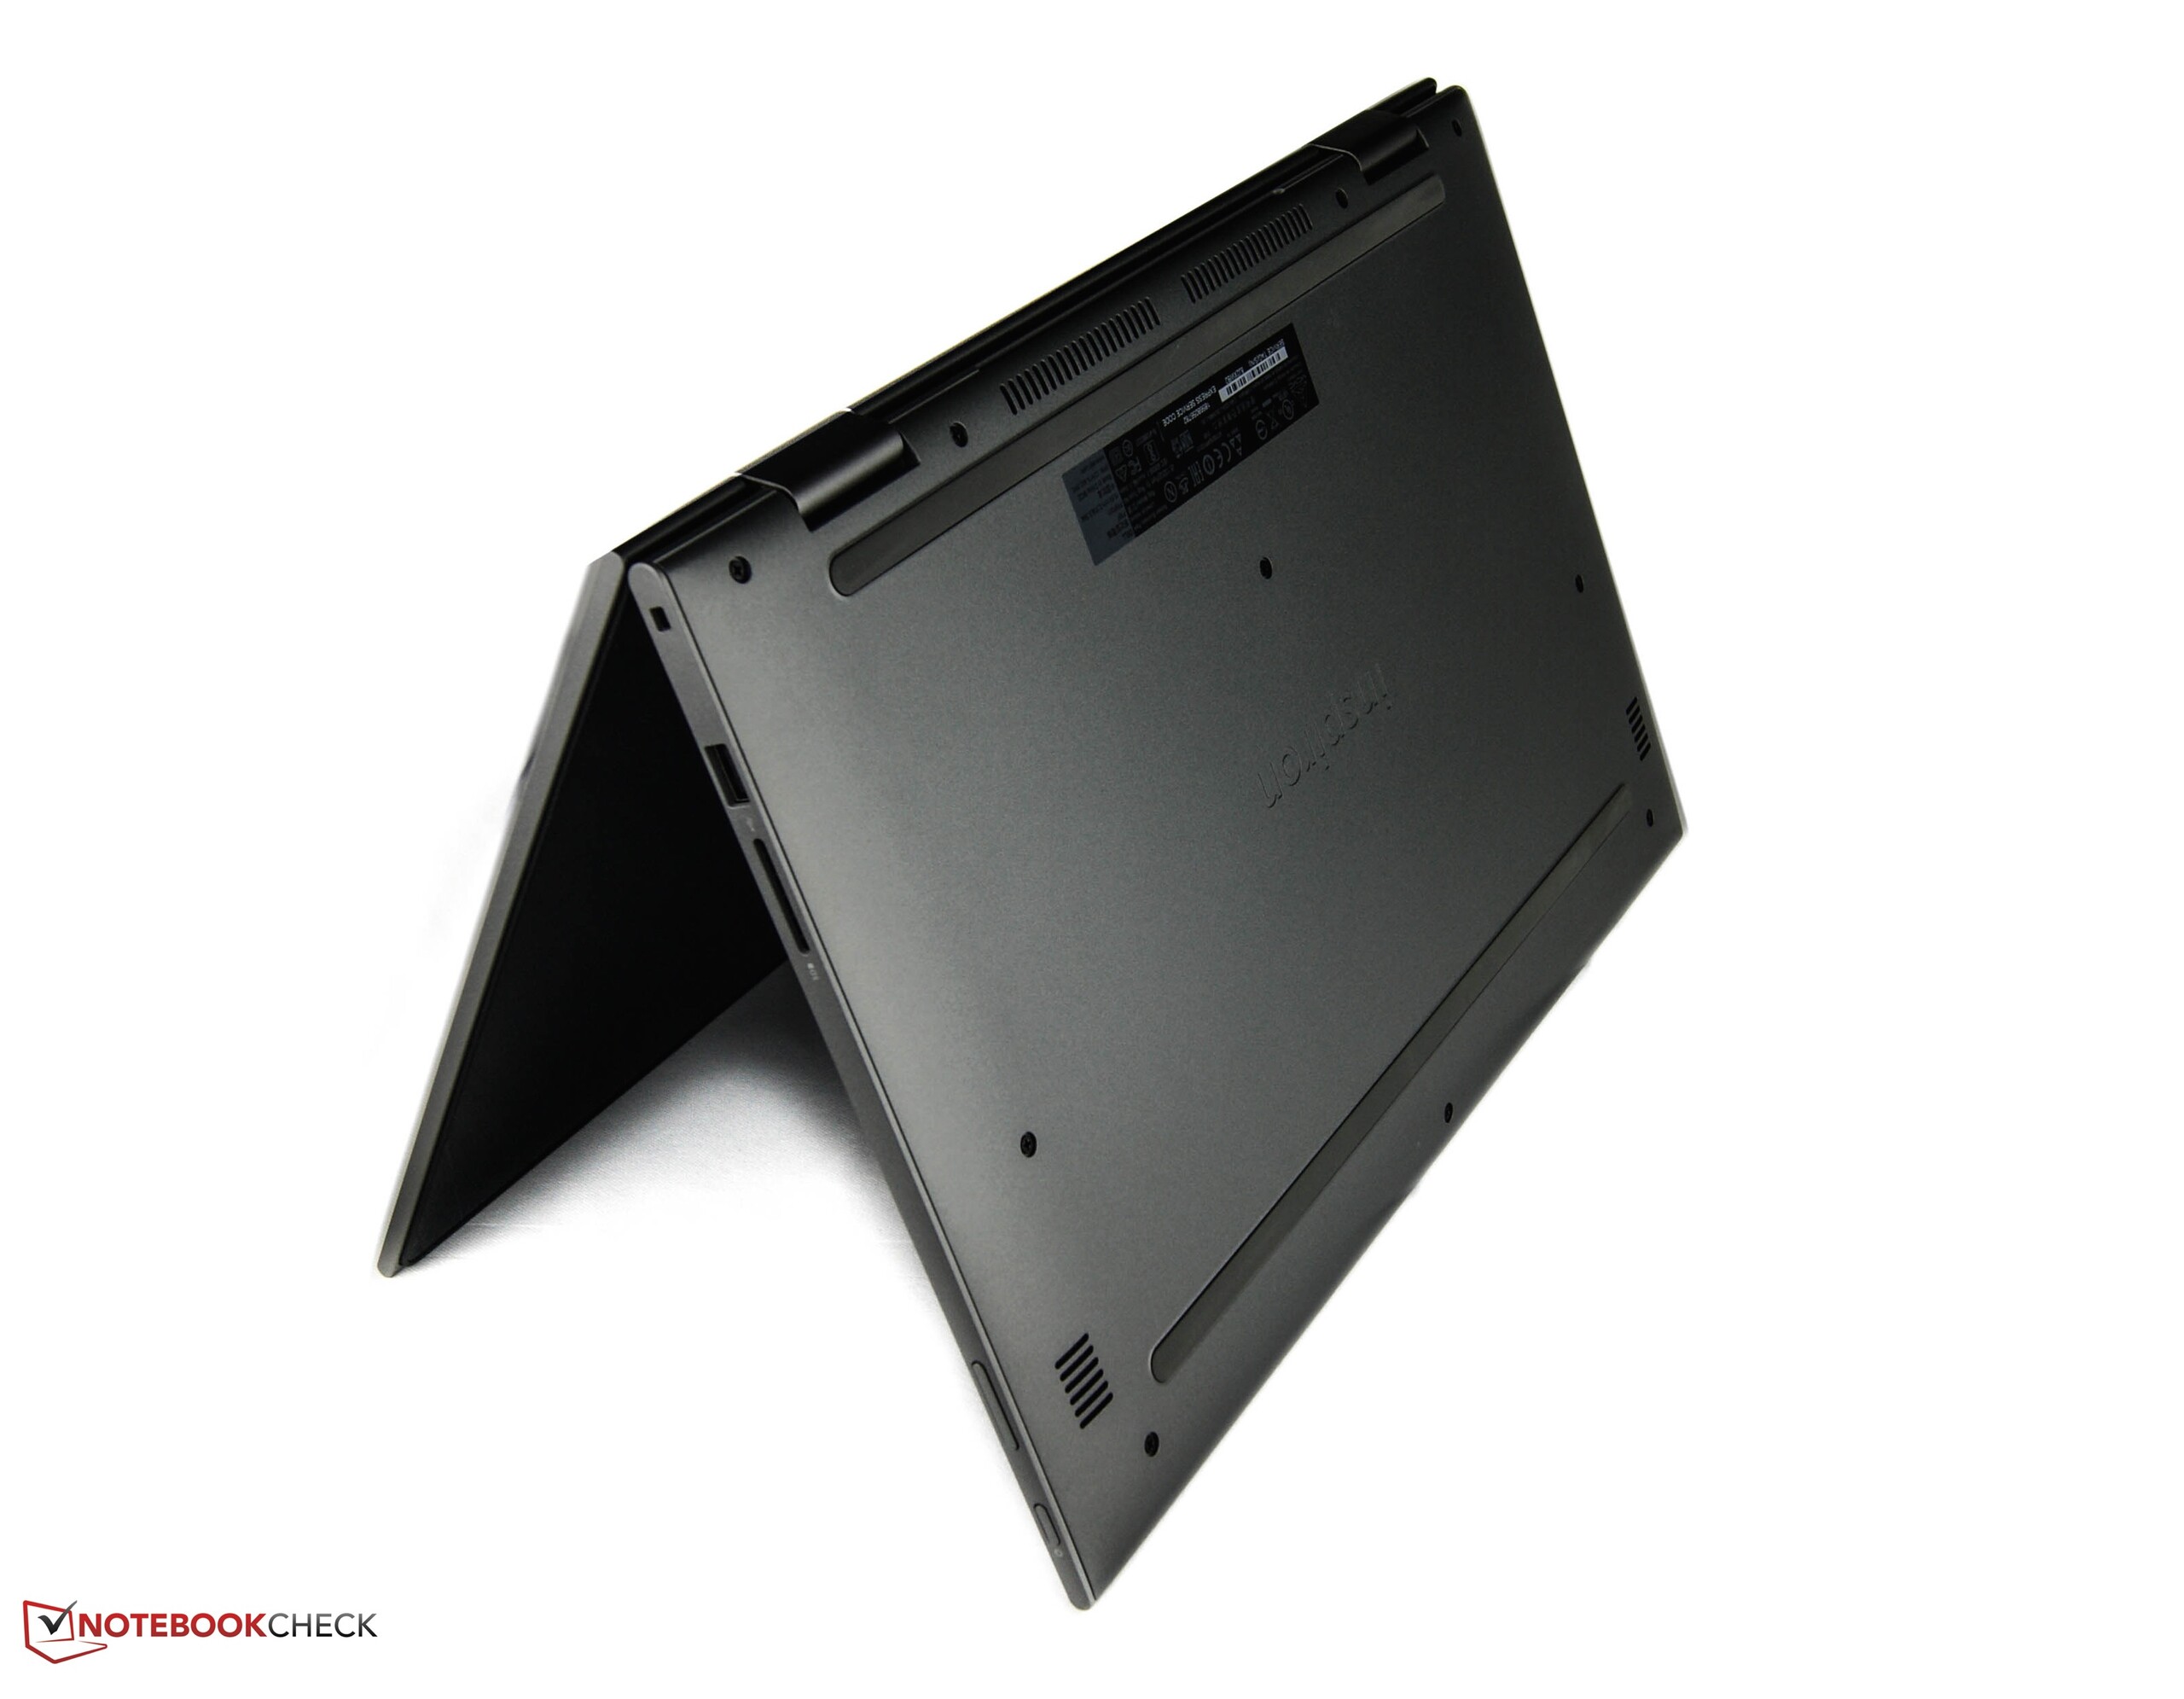
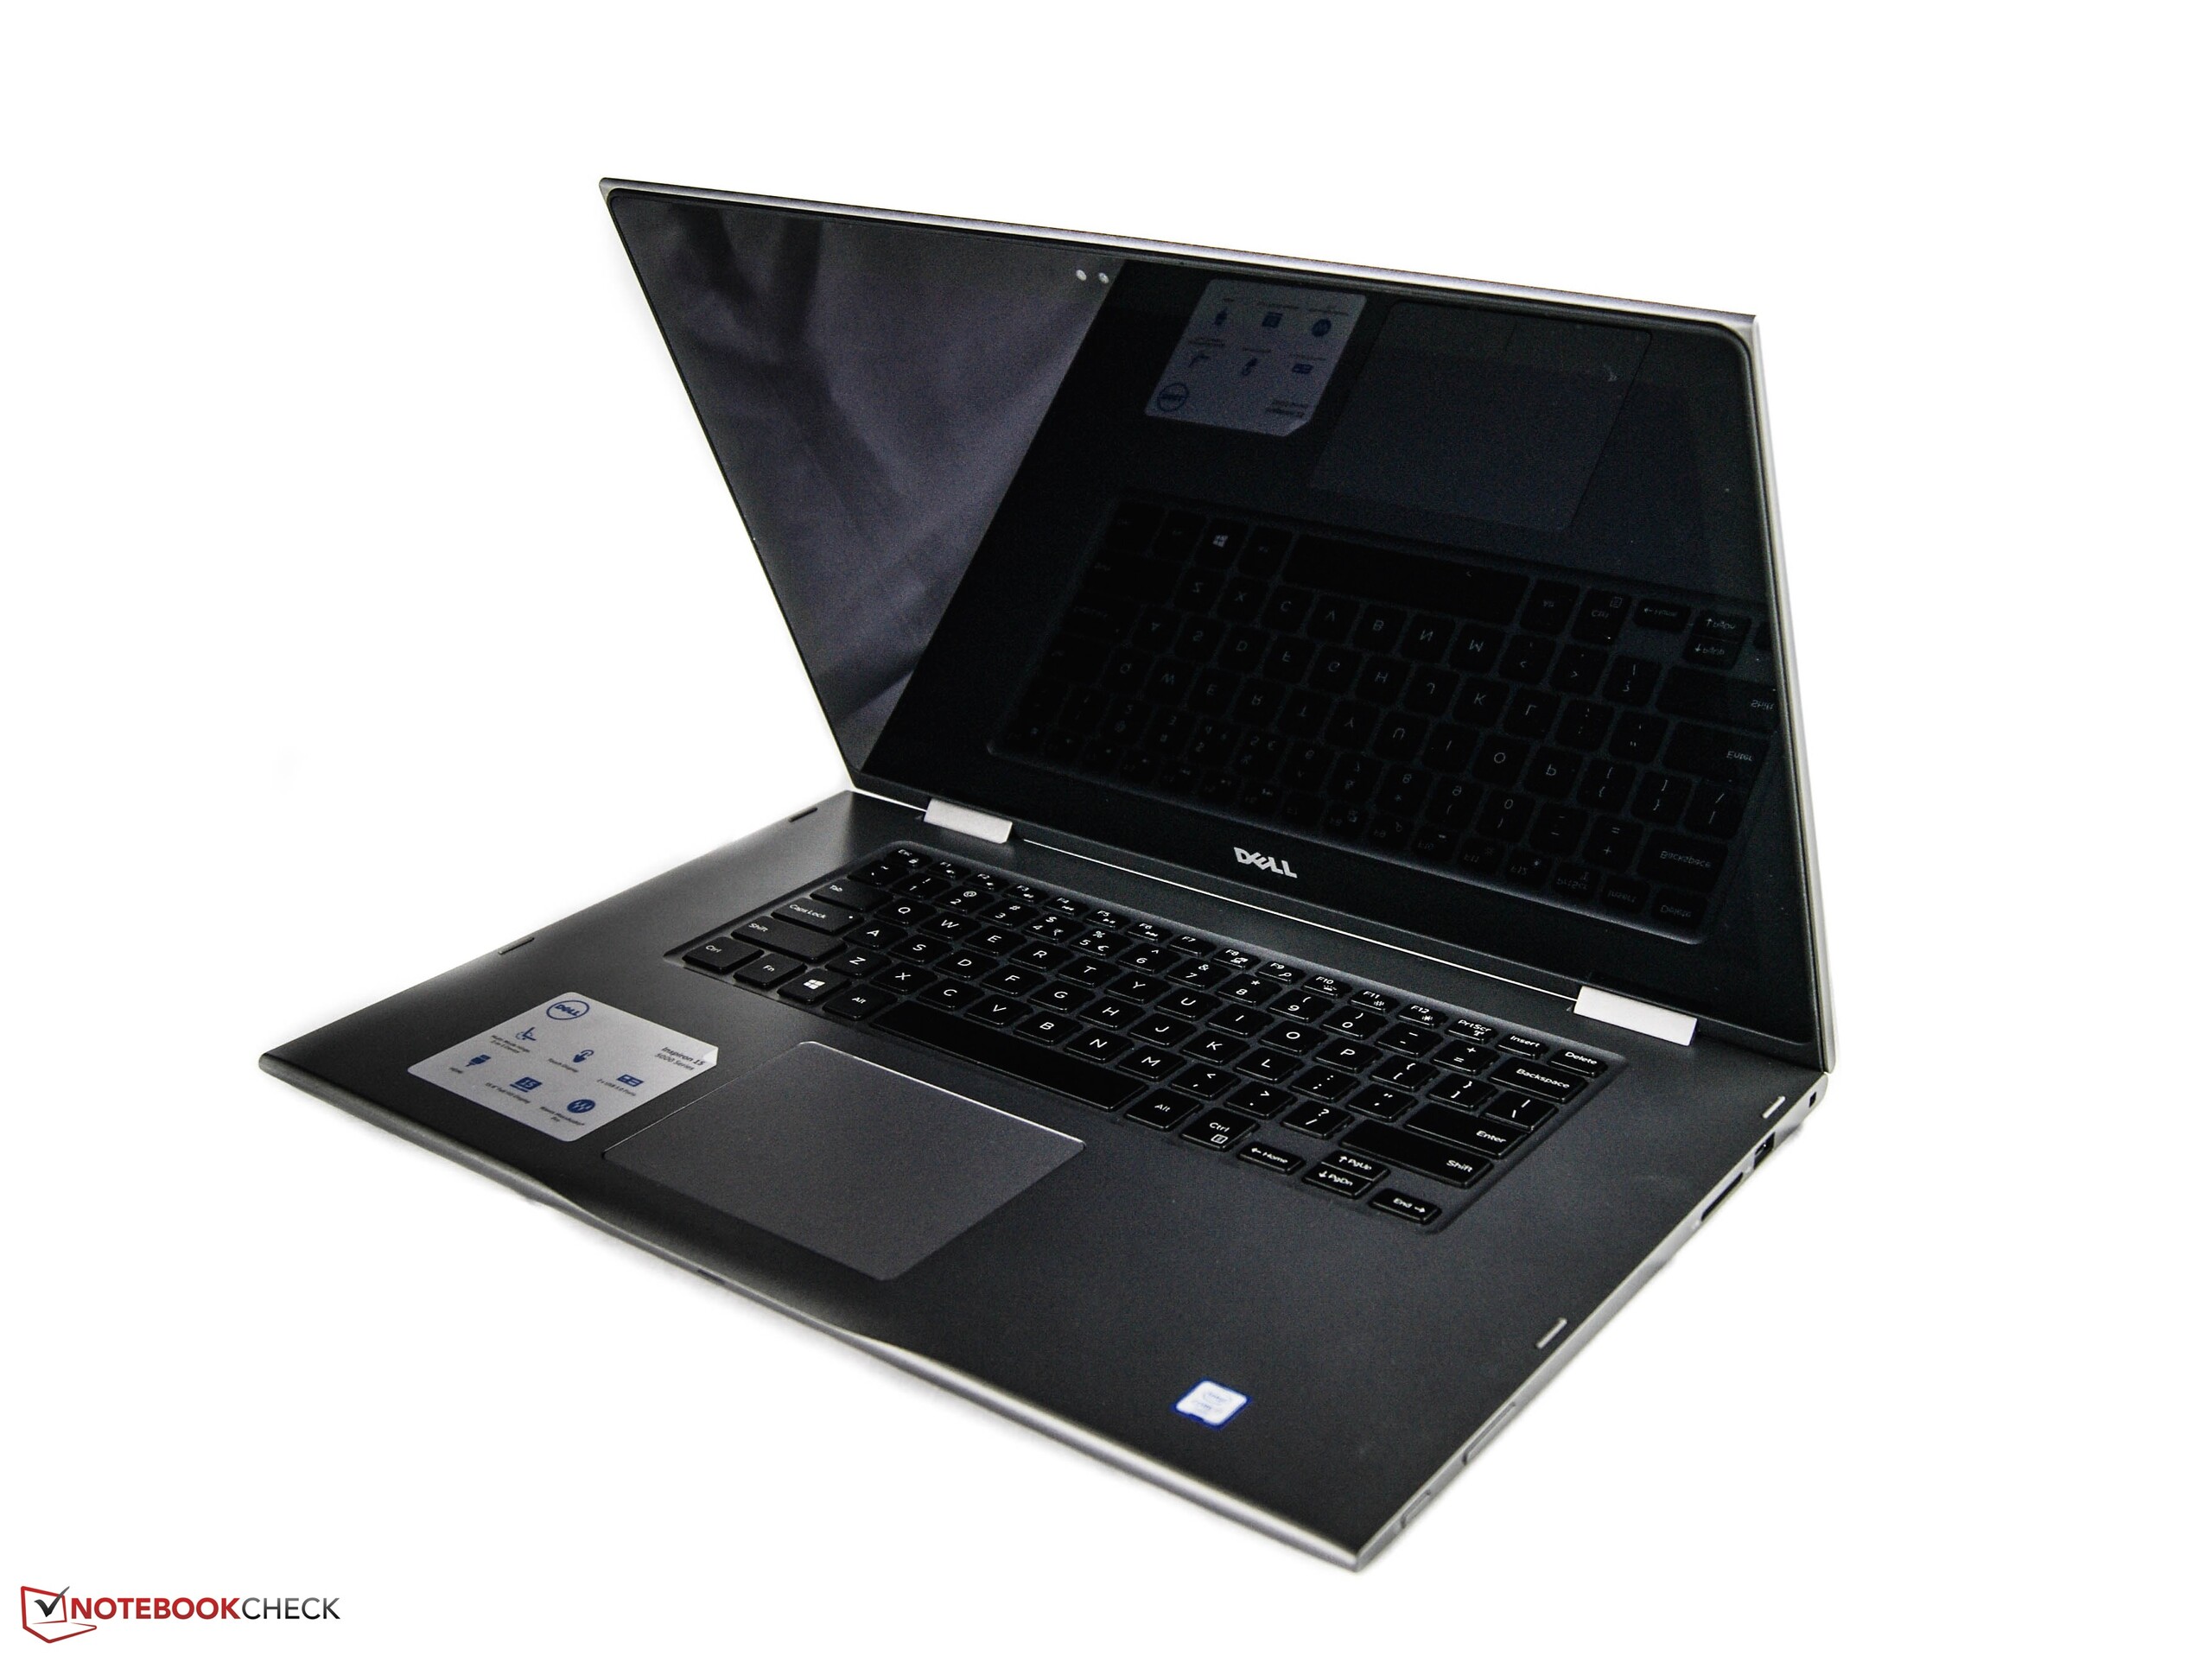
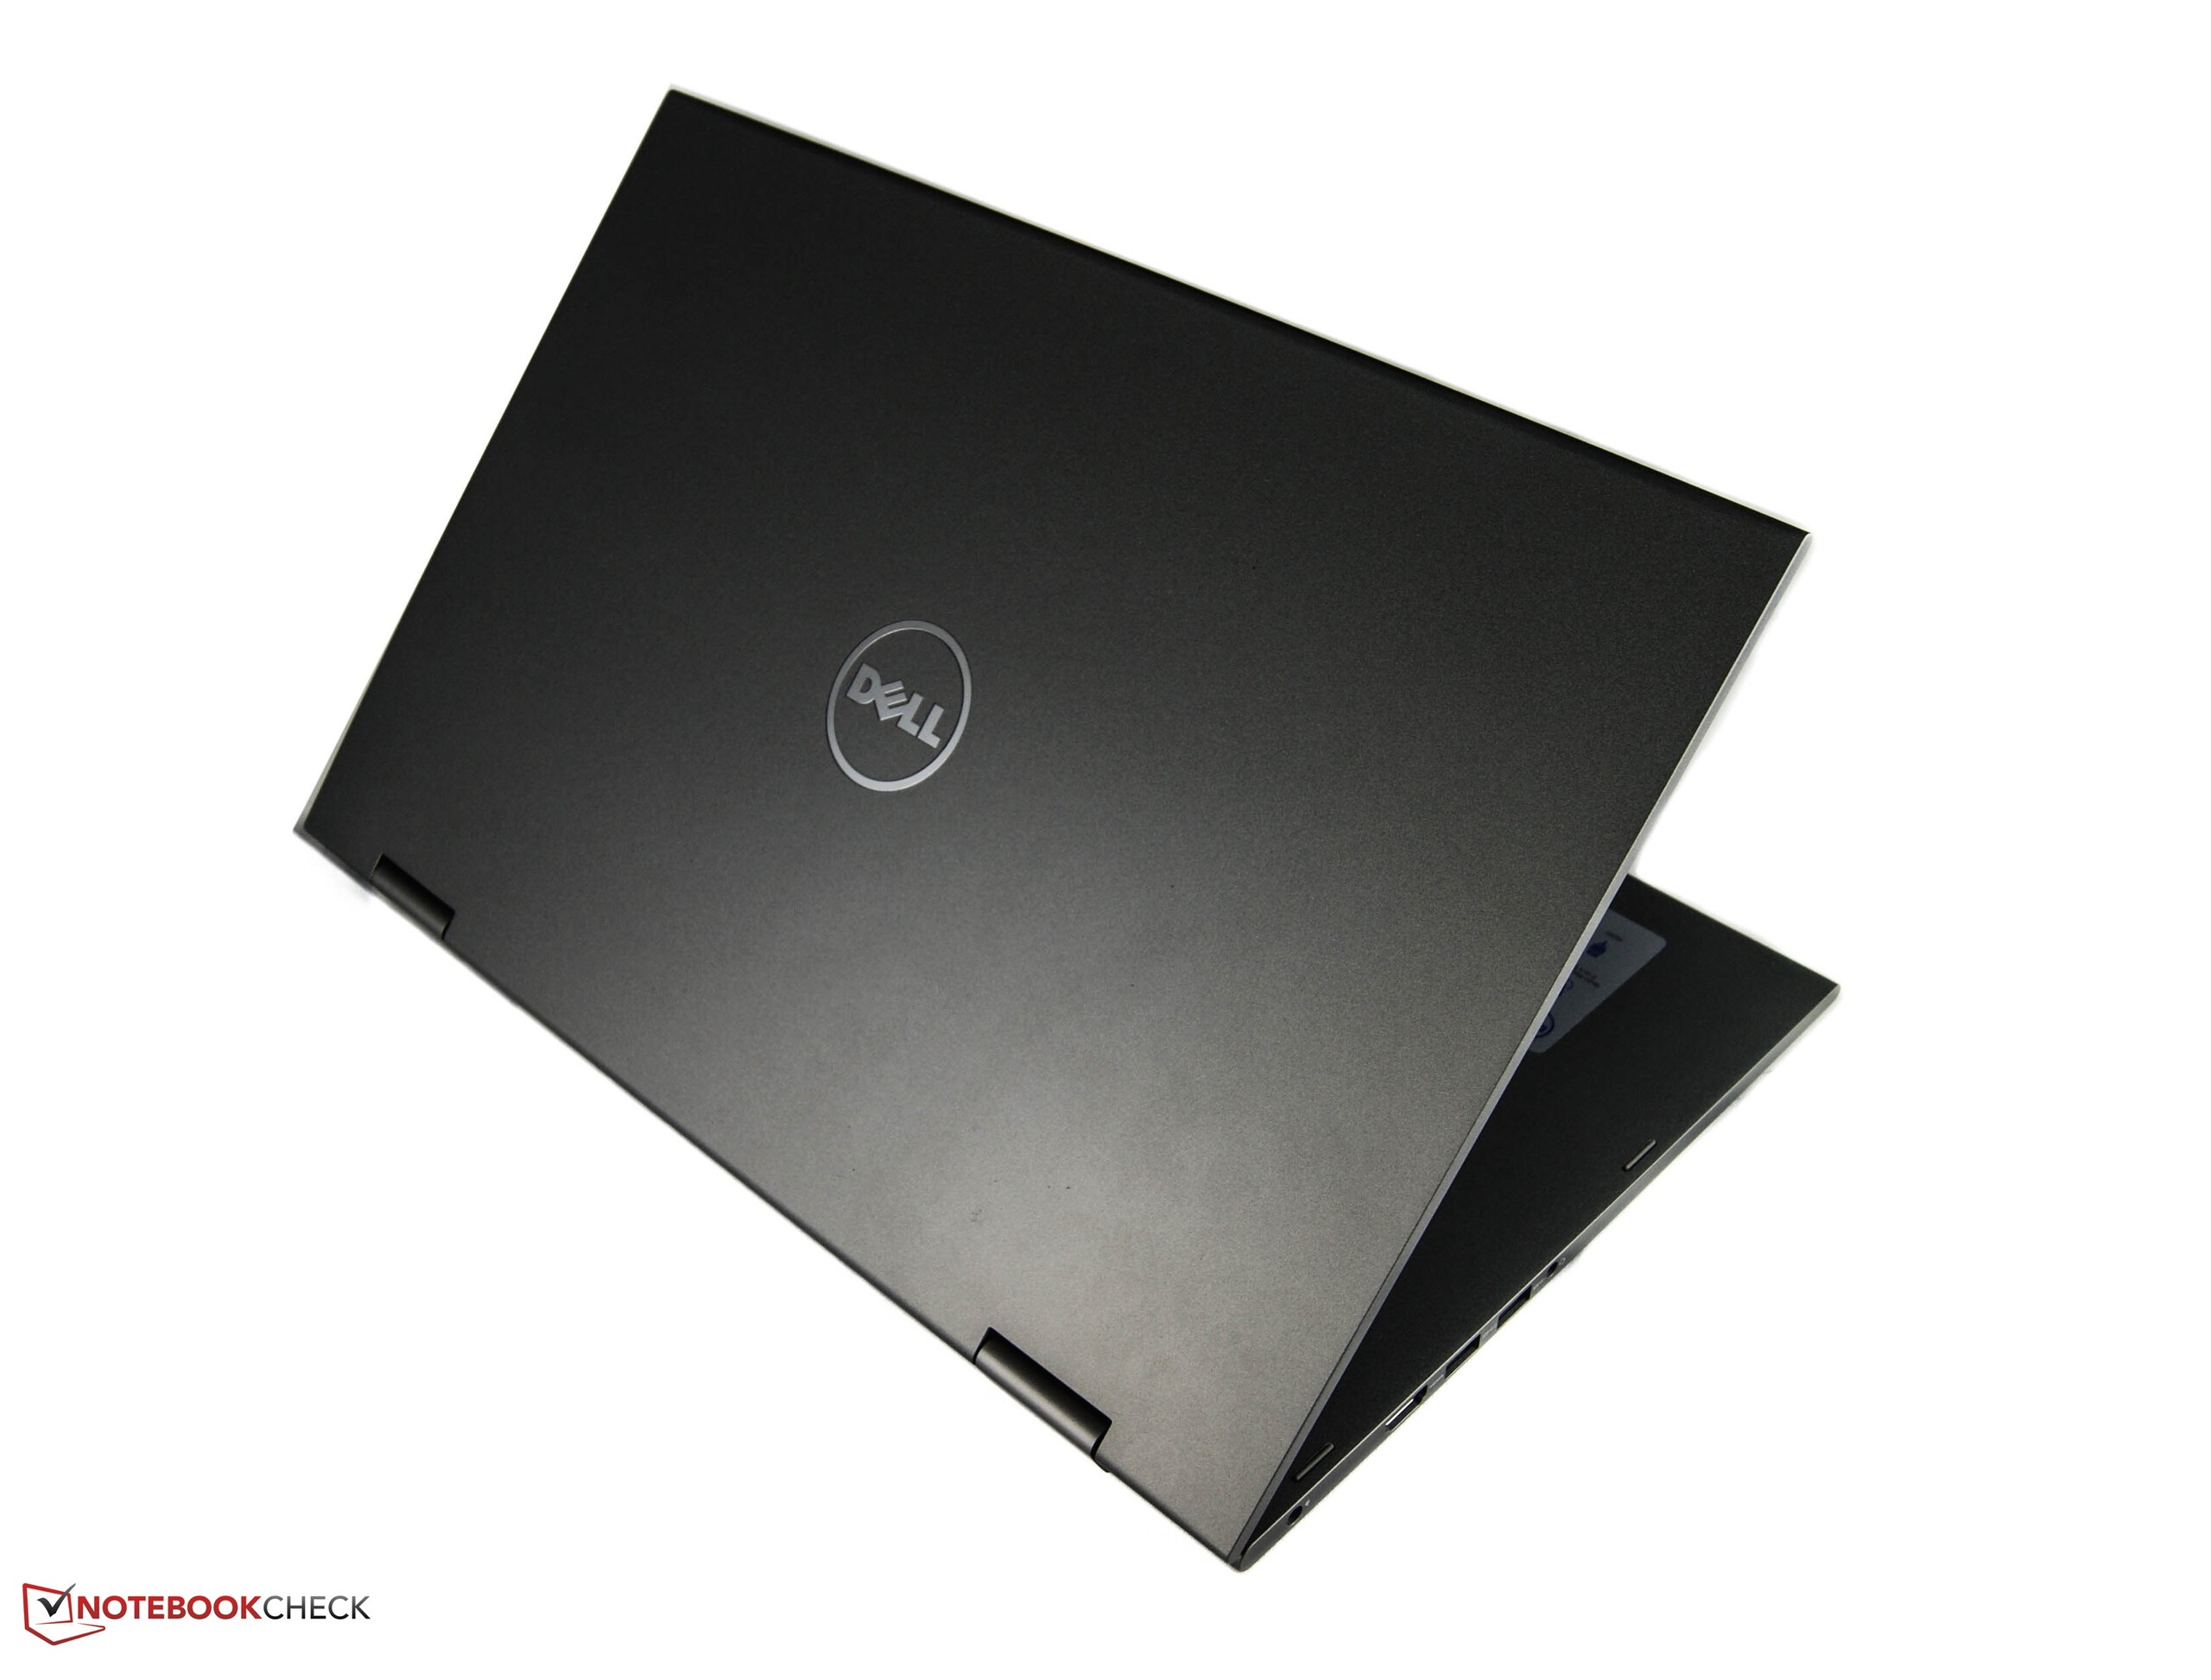
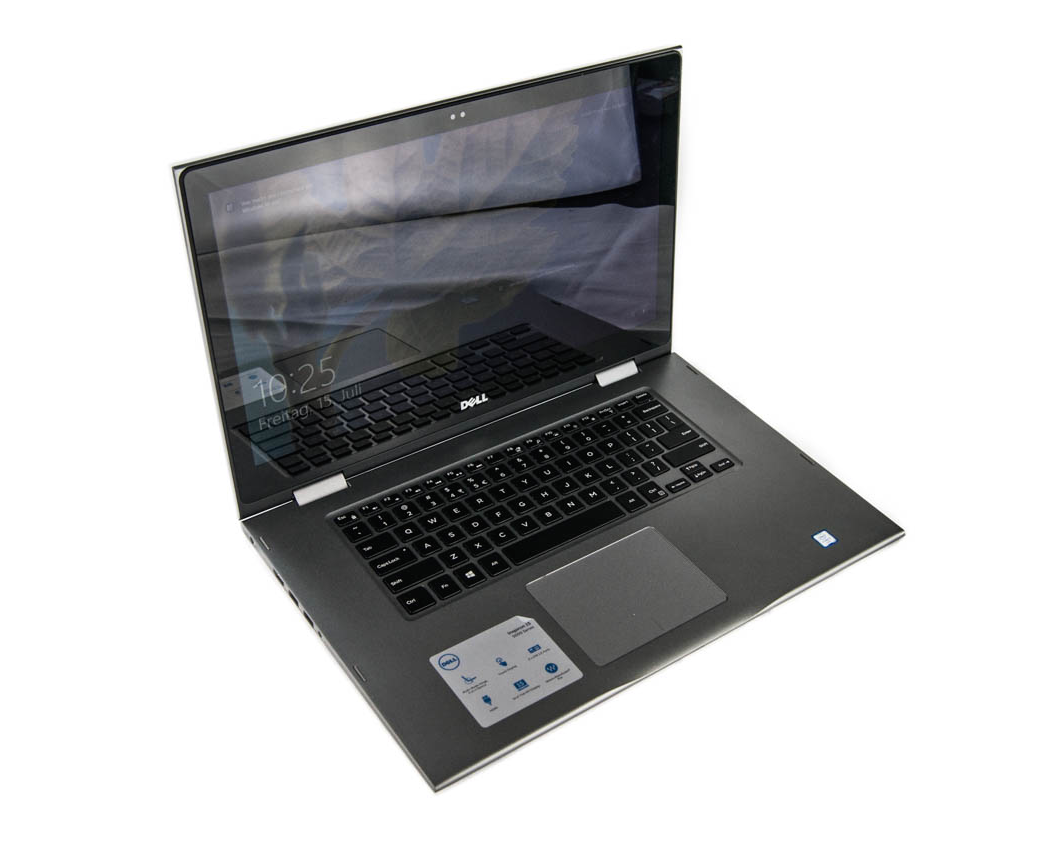
En bra 2-i-1-enhet bör kunna balansera prestanda, byggkvalitet och mobilitet. Bortsett från några få undantag lyckas Dell med den bedriften med nya Inspiron 15 5568. Chassit håller hög kvalitet överlag, förutom några mindre brister: skärmens baksida kunde vara mer robust och viktfördelningen är inte optimal.
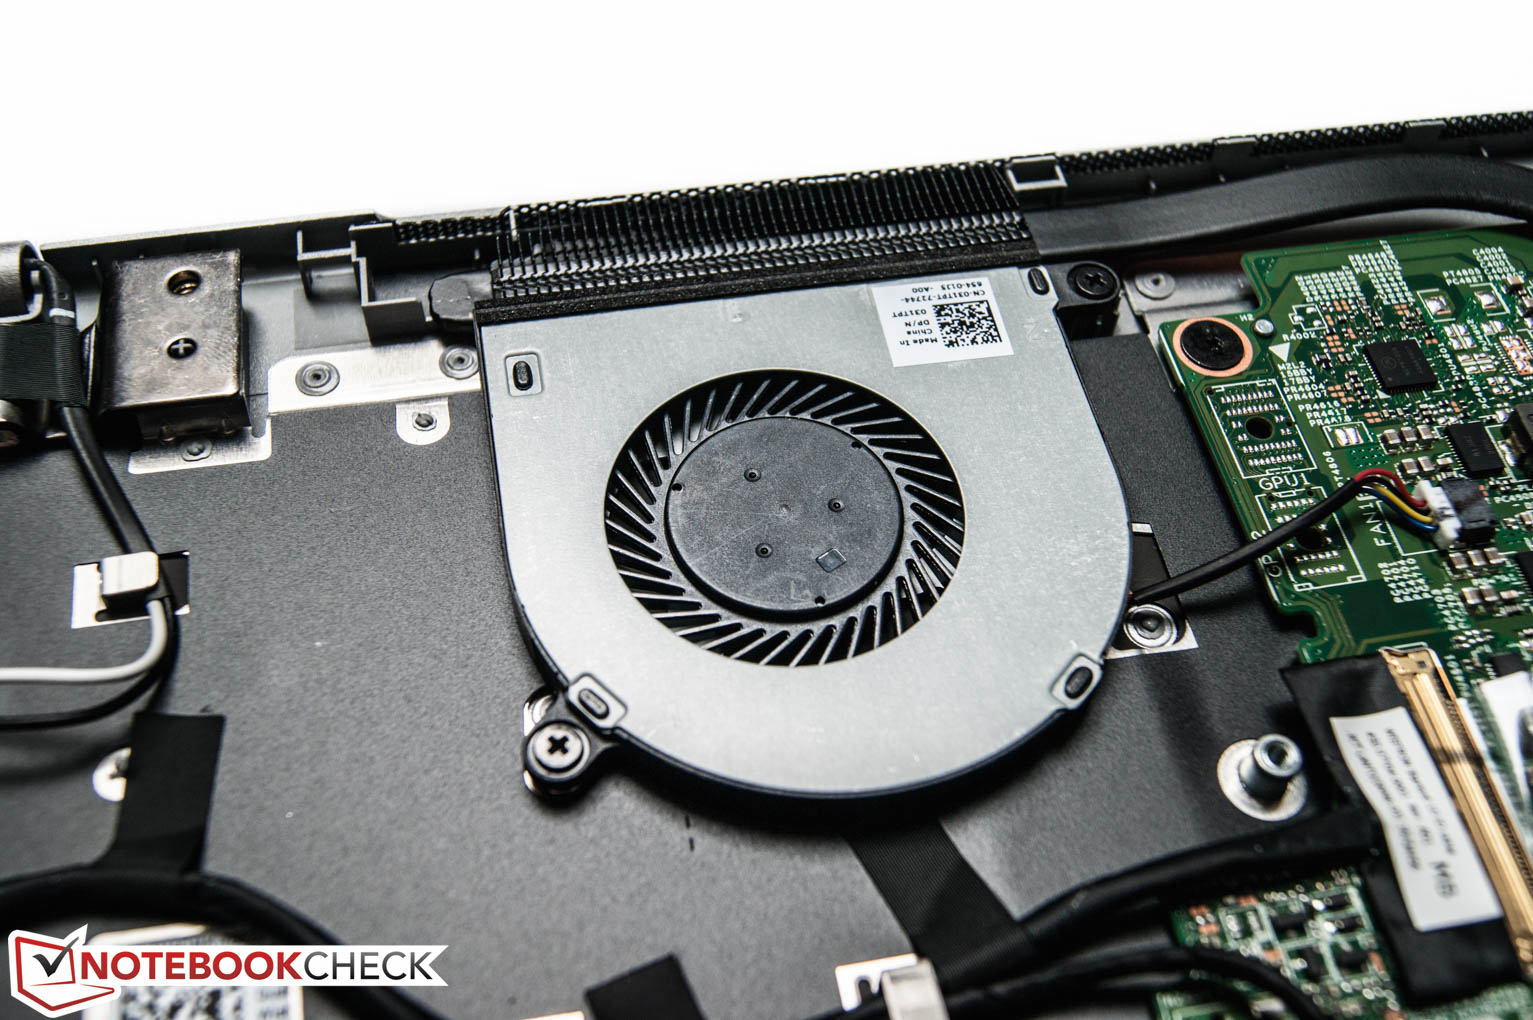
Vi har inga allvarliga invändningar vad gäller skärmen, men en något högre ljusstyrka skulle uppskattas. Prestandareserverna är nästa viktiga punkt. Eftersom Dell har satsat på uteslutande högpresterande hårdvara gör vår testmodell bra ifrån sig i testerna. Tyvärr sker det på bekostnad av högre temperaturer. Värmeutvecklingen är extremt koncentrerad till ena sidan, så om datorn står stilla på ett och samma ställe blir den mycket varm under ihållande belastning. Dessutom är batteritiden kort jämfört med vissa konkurrenter.
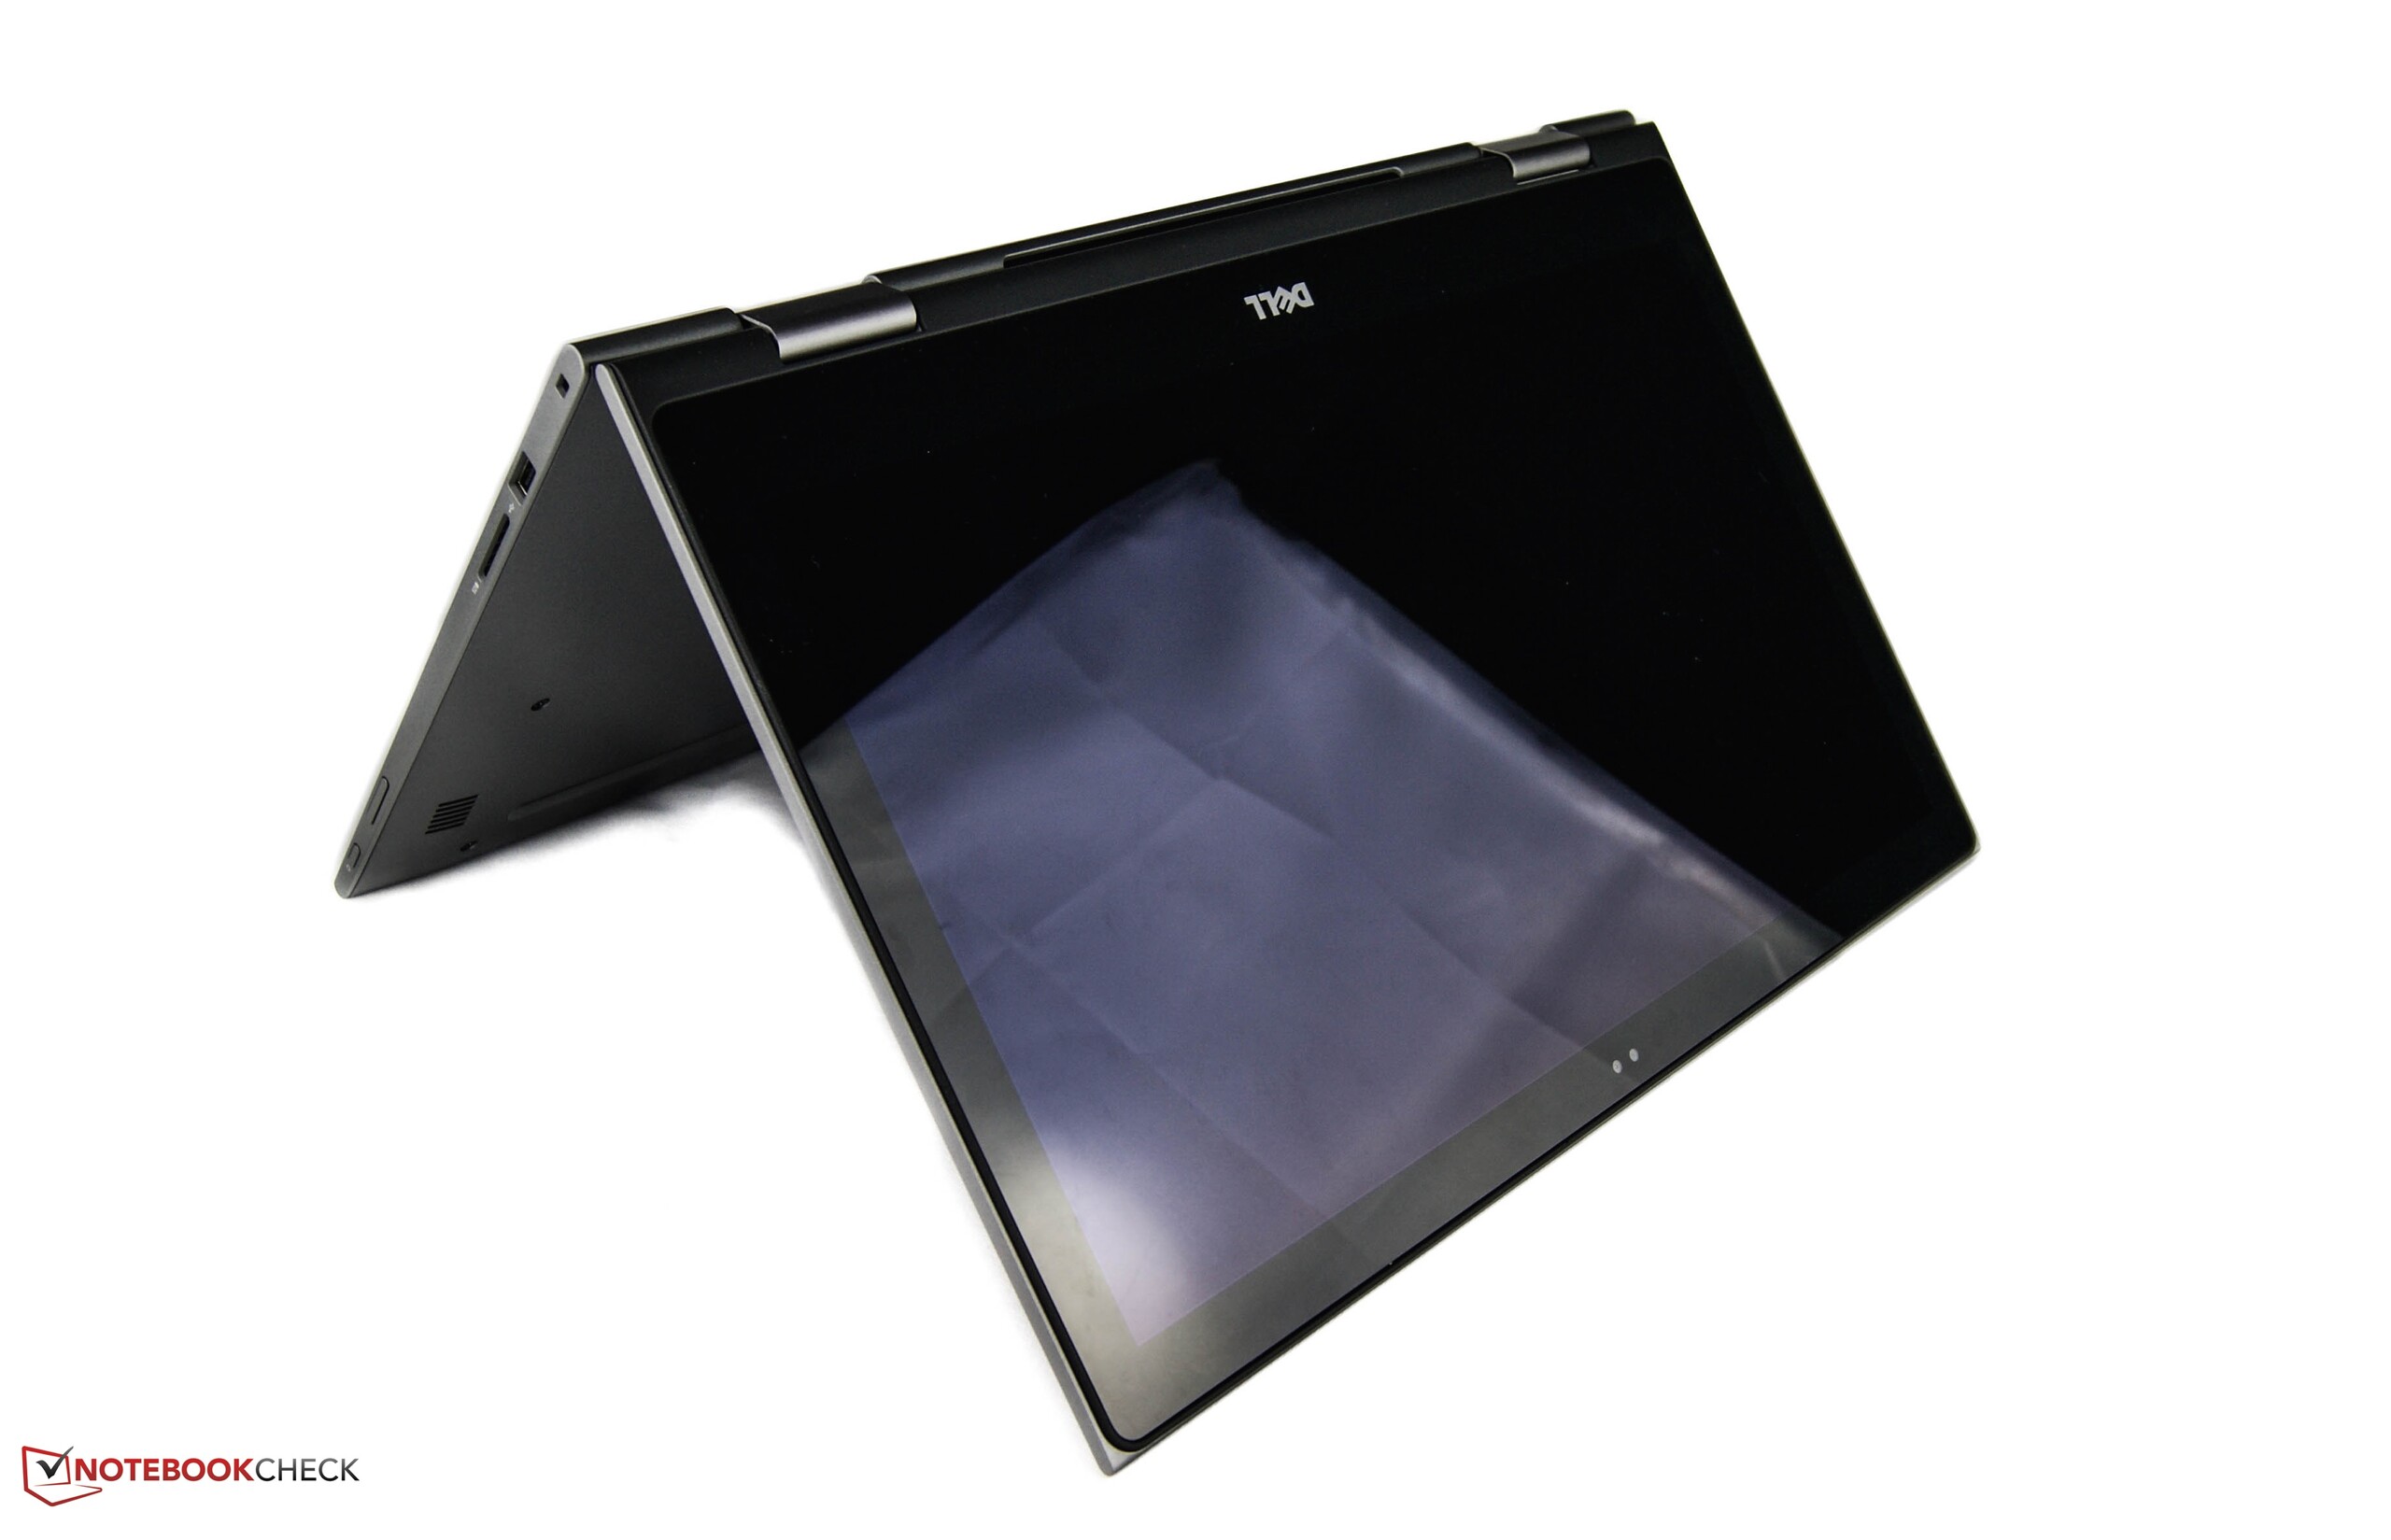
Köpare som är på jakt efter en snygg och mångsidig 2-i-1 i 15-tumsformat bör titta närmare på Dells nya Inspiron 5000-serie. Som alternativ kan HP:s Spectre X360 också vara intressant, då den har en mer ljusstark skärm, längre batteritid och lägre totalvikt.
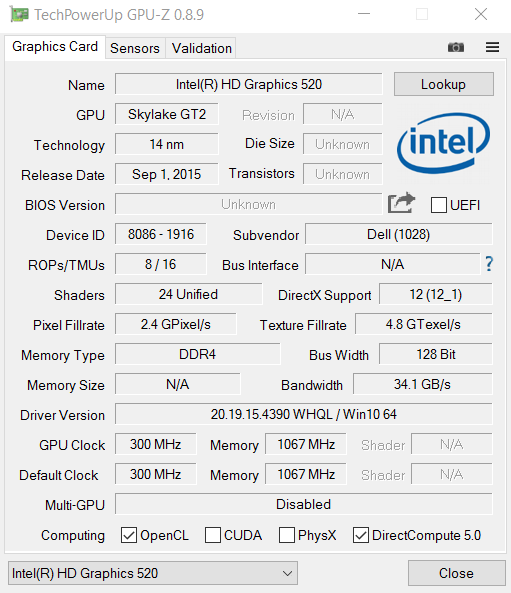
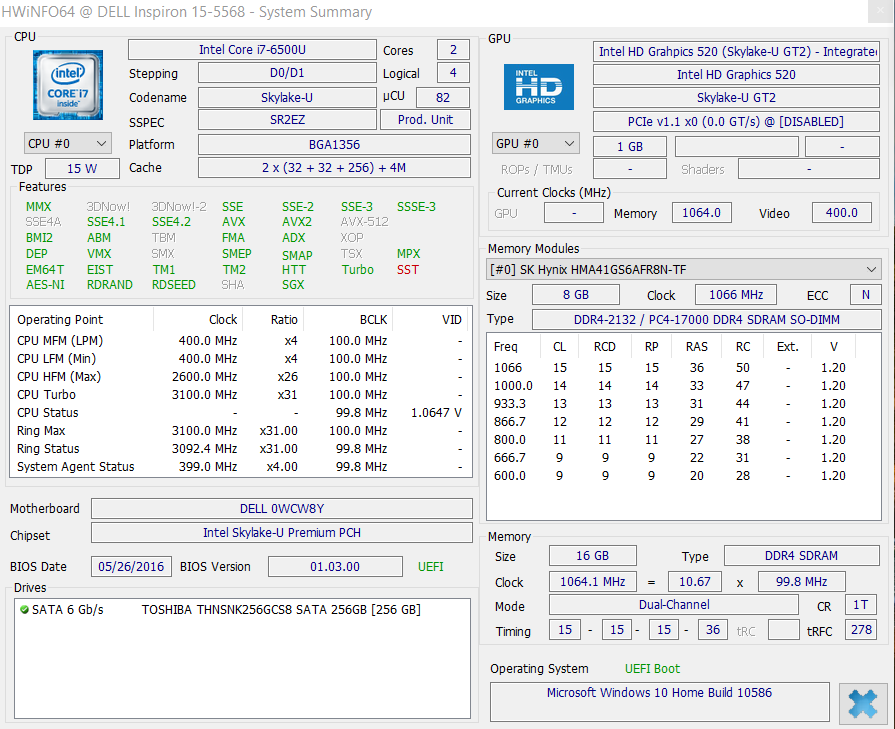
Dell Inspiron 15 5568
- 07/19/2016 v5.1 (old)
Nino Ricchizzi