Test: Asus ZenBook S UX391U (Core i7, FHD) Laptop (Sammanfattning)
| |||||||||||||||||||||||||
Distribution av ljusstyrkan: 92 %
Mitt på batteriet: 298 cd/m²
Kontrast: 1150:1 (Svärta: 0.26 cd/m²)
ΔE ColorChecker Calman: 5.6 | ∀{0.5-29.43 Ø4.71}
calibrated: 2.6
ΔE Greyscale Calman: 5.5 | ∀{0.09-98 Ø4.96}
90.3% sRGB (Argyll 1.6.3 3D)
58.9% AdobeRGB 1998 (Argyll 1.6.3 3D)
65.2% AdobeRGB 1998 (Argyll 3D)
90.5% sRGB (Argyll 3D)
64.4% Display P3 (Argyll 3D)
Gamma: 2.47
CCT: 7533 K
| Asus ZenBook S UX391U AUO B133HAN04.9, , 1920x1080, 13.3" | Dell XPS 13 9370 FHD i5 SHP1484, , 1920x1080, 13.3" | HP Spectre 13-af033ng AU Optronics AUO422D, , 1920x1080, 13.3" | Huawei Matebook X Pro i5 Tianma XM, , 3000x2000, 13.9" | Huawei MateBook X Chi Mei CMN8201 / P130ZDZ-EF1, , 2160x1440, 13.3" | Apple MacBook Pro 13 2017 APPA033, , 2560x1600, 13.3" | |
|---|---|---|---|---|---|---|
| Display | 7% | -0% | 4% | 3% | 33% | |
| Display P3 Coverage (%) | 64.4 | 68.9 7% | 64 -1% | 65.9 2% | 65.8 2% | 99.2 54% |
| sRGB Coverage (%) | 90.5 | 96.6 7% | 90.7 0% | 95.2 5% | 96.2 6% | 99.9 10% |
| AdobeRGB 1998 Coverage (%) | 65.2 | 69.6 7% | 65.1 0% | 67.6 4% | 66.8 2% | 87.1 34% |
| Response Times | -48% | 29% | 11% | 22% | 3% | |
| Response Time Grey 50% / Grey 80% * (ms) | 44.8 ? | 62.4 ? -39% | 27 ? 40% | 40.4 ? 10% | 33 ? 26% | 42.8 ? 4% |
| Response Time Black / White * (ms) | 29.2 ? | 45.6 ? -56% | 24 ? 18% | 25.6 ? 12% | 24 ? 18% | 28.8 ? 1% |
| PWM Frequency (Hz) | 1008 ? | |||||
| Screen | 20% | 14% | 14% | 19% | 37% | |
| Brightness middle (cd/m²) | 299 | 428 43% | 304 2% | 442.7 48% | 408 36% | 588 97% |
| Brightness (cd/m²) | 300 | 405 35% | 287 -4% | 428 43% | 395 32% | 561 87% |
| Brightness Distribution (%) | 92 | 87 -5% | 80 -13% | 84 -9% | 88 -4% | 92 0% |
| Black Level * (cd/m²) | 0.26 | 0.26 -0% | 0.21 19% | 0.31 -19% | 0.45 -73% | 0.45 -73% |
| Contrast (:1) | 1150 | 1646 43% | 1448 26% | 1428 24% | 907 -21% | 1307 14% |
| Colorchecker dE 2000 * | 5.6 | 3.8 32% | 3.66 35% | 2.24 60% | 1.55 72% | 1.7 70% |
| Colorchecker dE 2000 max. * | 9.1 | 7.2 21% | 5.66 38% | 7.19 21% | 2.19 76% | 3.5 62% |
| Colorchecker dE 2000 calibrated * | 2.6 | 1.11 57% | ||||
| Greyscale dE 2000 * | 5.5 | 4.4 20% | 3.51 36% | 9.7 -76% | 1.91 65% | 1.9 65% |
| Gamma | 2.47 89% | 2.21 100% | 2.55 86% | 1.42 155% | 2.34 94% | 2.33 94% |
| CCT | 7533 86% | 7067 92% | 6955 93% | 6227 104% | 6491 100% | 6738 96% |
| Color Space (Percent of AdobeRGB 1998) (%) | 58.9 | 62.8 7% | 59 0% | 61.6 5% | 61 4% | 77.92 32% |
| Color Space (Percent of sRGB) (%) | 90.3 | 96.4 7% | 91 1% | 95 5% | 96 6% | 99.94 11% |
| Totalt genomsnitt (program/inställningar) | -7% /
9% | 14% /
13% | 10% /
12% | 15% /
16% | 24% /
31% |
* ... mindre är bättre
Visa svarstider
| ↔ Svarstid svart till vitt | ||
|---|---|---|
| 29.2 ms ... stiga ↗ och falla ↘ kombinerat | ↗ 16 ms stiga | 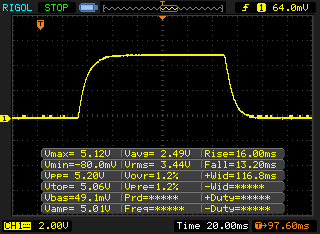 |
| ↘ 13.2 ms hösten | ||
| Skärmen visar relativt långsamma svarsfrekvenser i våra tester och kan vara för långsam för spelare. I jämförelse sträcker sig alla testade enheter från 0.1 (minst) till 240 (maximalt) ms. » 78 % av alla enheter är bättre. Detta innebär att den uppmätta svarstiden är sämre än genomsnittet av alla testade enheter (19.8 ms). | ||
| ↔ Svarstid 50 % grått till 80 % grått | ||
| 44.8 ms ... stiga ↗ och falla ↘ kombinerat | ↗ 22.8 ms stiga | 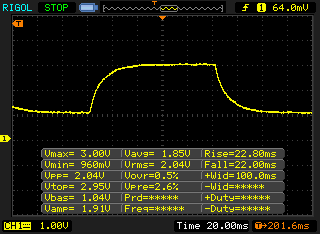 |
| ↘ 22 ms hösten | ||
| Skärmen visar långsamma svarsfrekvenser i våra tester och kommer att vara otillfredsställande för spelare. I jämförelse sträcker sig alla testade enheter från 0.165 (minst) till 636 (maximalt) ms. » 76 % av alla enheter är bättre. Detta innebär att den uppmätta svarstiden är sämre än genomsnittet av alla testade enheter (30.9 ms). | ||
Skärmflimmer / PWM (Puls-Width Modulation)
| Skärmflimmer / PWM upptäcktes inte | 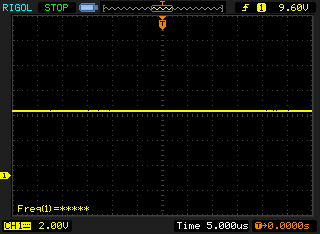 | ||
Som jämförelse: 52 % av alla testade enheter använder inte PWM för att dämpa skärmen. Om PWM upptäcktes mättes ett medelvärde av 7744 (minst: 5 - maximum: 343500) Hz. | |||
| Cinebench R15 | |
| CPU Single 64Bit | |
| Genomsnitt av klass Subnotebook (72.4 - 322, n=57, senaste 2 åren) | |
| Asus ZenBook S UX391U (Quiet Mode off) | |
| Asus ZenBook S UX391U (Quiet Mode on) | |
| Genomsnitt Intel Core i7-8550U (108 - 172, n=76) | |
| Huawei Matebook X Pro i5 | |
| Apple MacBook Pro 13 2017 (macOS) | |
| Apple MacBook Pro 13 2017 (Win10) | |
| HP Spectre 13-af033ng | |
| Dell XPS 13 9370 FHD i5 | |
| Huawei MateBook X | |
| CPU Multi 64Bit | |
| Genomsnitt av klass Subnotebook (327 - 3345, n=57, senaste 2 åren) | |
| Dell XPS 13 9370 FHD i5 | |
| Asus ZenBook S UX391U (Quiet Mode off) | |
| Asus ZenBook S UX391U (Quiet Mode on) | |
| Genomsnitt Intel Core i7-8550U (301 - 761, n=78) | |
| Huawei Matebook X Pro i5 | |
| HP Spectre 13-af033ng | |
| Apple MacBook Pro 13 2017 (macOS) | |
| Apple MacBook Pro 13 2017 (Win10) | |
| Huawei MateBook X | |
| PCMark 8 Home Score Accelerated v2 | 3554 poäng | |
| PCMark 8 Creative Score Accelerated v2 | 4707 poäng | |
| PCMark 8 Work Score Accelerated v2 | 4882 poäng | |
| PCMark 10 Score | 3321 poäng | |
Hjälp | ||

| 3DMark 11 Performance | 1592 poäng | |
| 3DMark Ice Storm Standard Score | 39992 poäng | |
| 3DMark Cloud Gate Standard Score | 6256 poäng | |
| 3DMark Fire Strike Score | 897 poäng | |
Hjälp | ||
| låg | med. | hög | ultra | |
|---|---|---|---|---|
| Tomb Raider (2013) | 78.1 | 39.2 | 27.4 | 12.4 |
| BioShock Infinite (2013) | 52.8 | 30.7 | 26.7 | 9 |
| The Witcher 3 (2015) | 17.3 |
Ljudnivå
| Låg belastning |
| 29.7 / 29.7 / 30.1 dB(A) |
| Hög belastning |
| 36.8 / 36.8 dB(A) |
 | ||
30 dB tyst 40 dB(A) hörbar 50 dB(A) högt ljud |
||
min: | ||
| Asus ZenBook S UX391U UHD Graphics 620, i5-8550U, Samsung PM961 NVMe MZVLW512HMJP | Dell XPS 13 9370 FHD i5 UHD Graphics 620, i5-8250U, Toshiba XG5 KXG50ZNV256G | HP Spectre 13-af033ng UHD Graphics 620, i5-8550U, Samsung PM961 NVMe MZVLW512HMJP | Huawei Matebook X Pro i5 GeForce MX150, i5-8250U, Samsung PM961 MZVLW256HEHP | Apple MacBook Pro 13 2017 Iris Plus Graphics 640, i5-7360U, Apple SSD AP0128 | |
|---|---|---|---|---|---|
| Noise | 3% | 3% | 1% | -0% | |
| av / miljö * (dB) | 29.7 | 29.1 2% | 30.13 -1% | 27.9 6% | 30.2 -2% |
| Idle Minimum * (dB) | 29.7 | 29.1 2% | 30.13 -1% | 27.9 6% | 30.2 -2% |
| Idle Average * (dB) | 29.7 | 29.1 2% | 30.13 -1% | 27.9 6% | 30.2 -2% |
| Idle Maximum * (dB) | 30.1 | 29.1 3% | 30.13 -0% | 27.9 7% | 30.2 -0% |
| Load Average * (dB) | 36.8 | 32.2 12% | 31.5 14% | 36.2 2% | 32.9 11% |
| Load Maximum * (dB) | 36.8 | 37.3 -1% | 33.5 9% | 45.2 -23% | 39.3 -7% |
| Witcher 3 ultra * (dB) | 45 |
* ... mindre är bättre
(±) Den maximala temperaturen på ovansidan är 40.3 °C / 105 F, jämfört med genomsnittet av 35.9 °C / 97 F , allt från 21.4 till 59 °C för klassen Subnotebook.
(±) Botten värms upp till maximalt 41.5 °C / 107 F, jämfört med genomsnittet av 39.2 °C / 103 F
(+) Vid tomgångsbruk är medeltemperaturen för ovansidan 26 °C / 79 F, jämfört med enhetsgenomsnittet på 30.8 °C / ### class_avg_f### F.
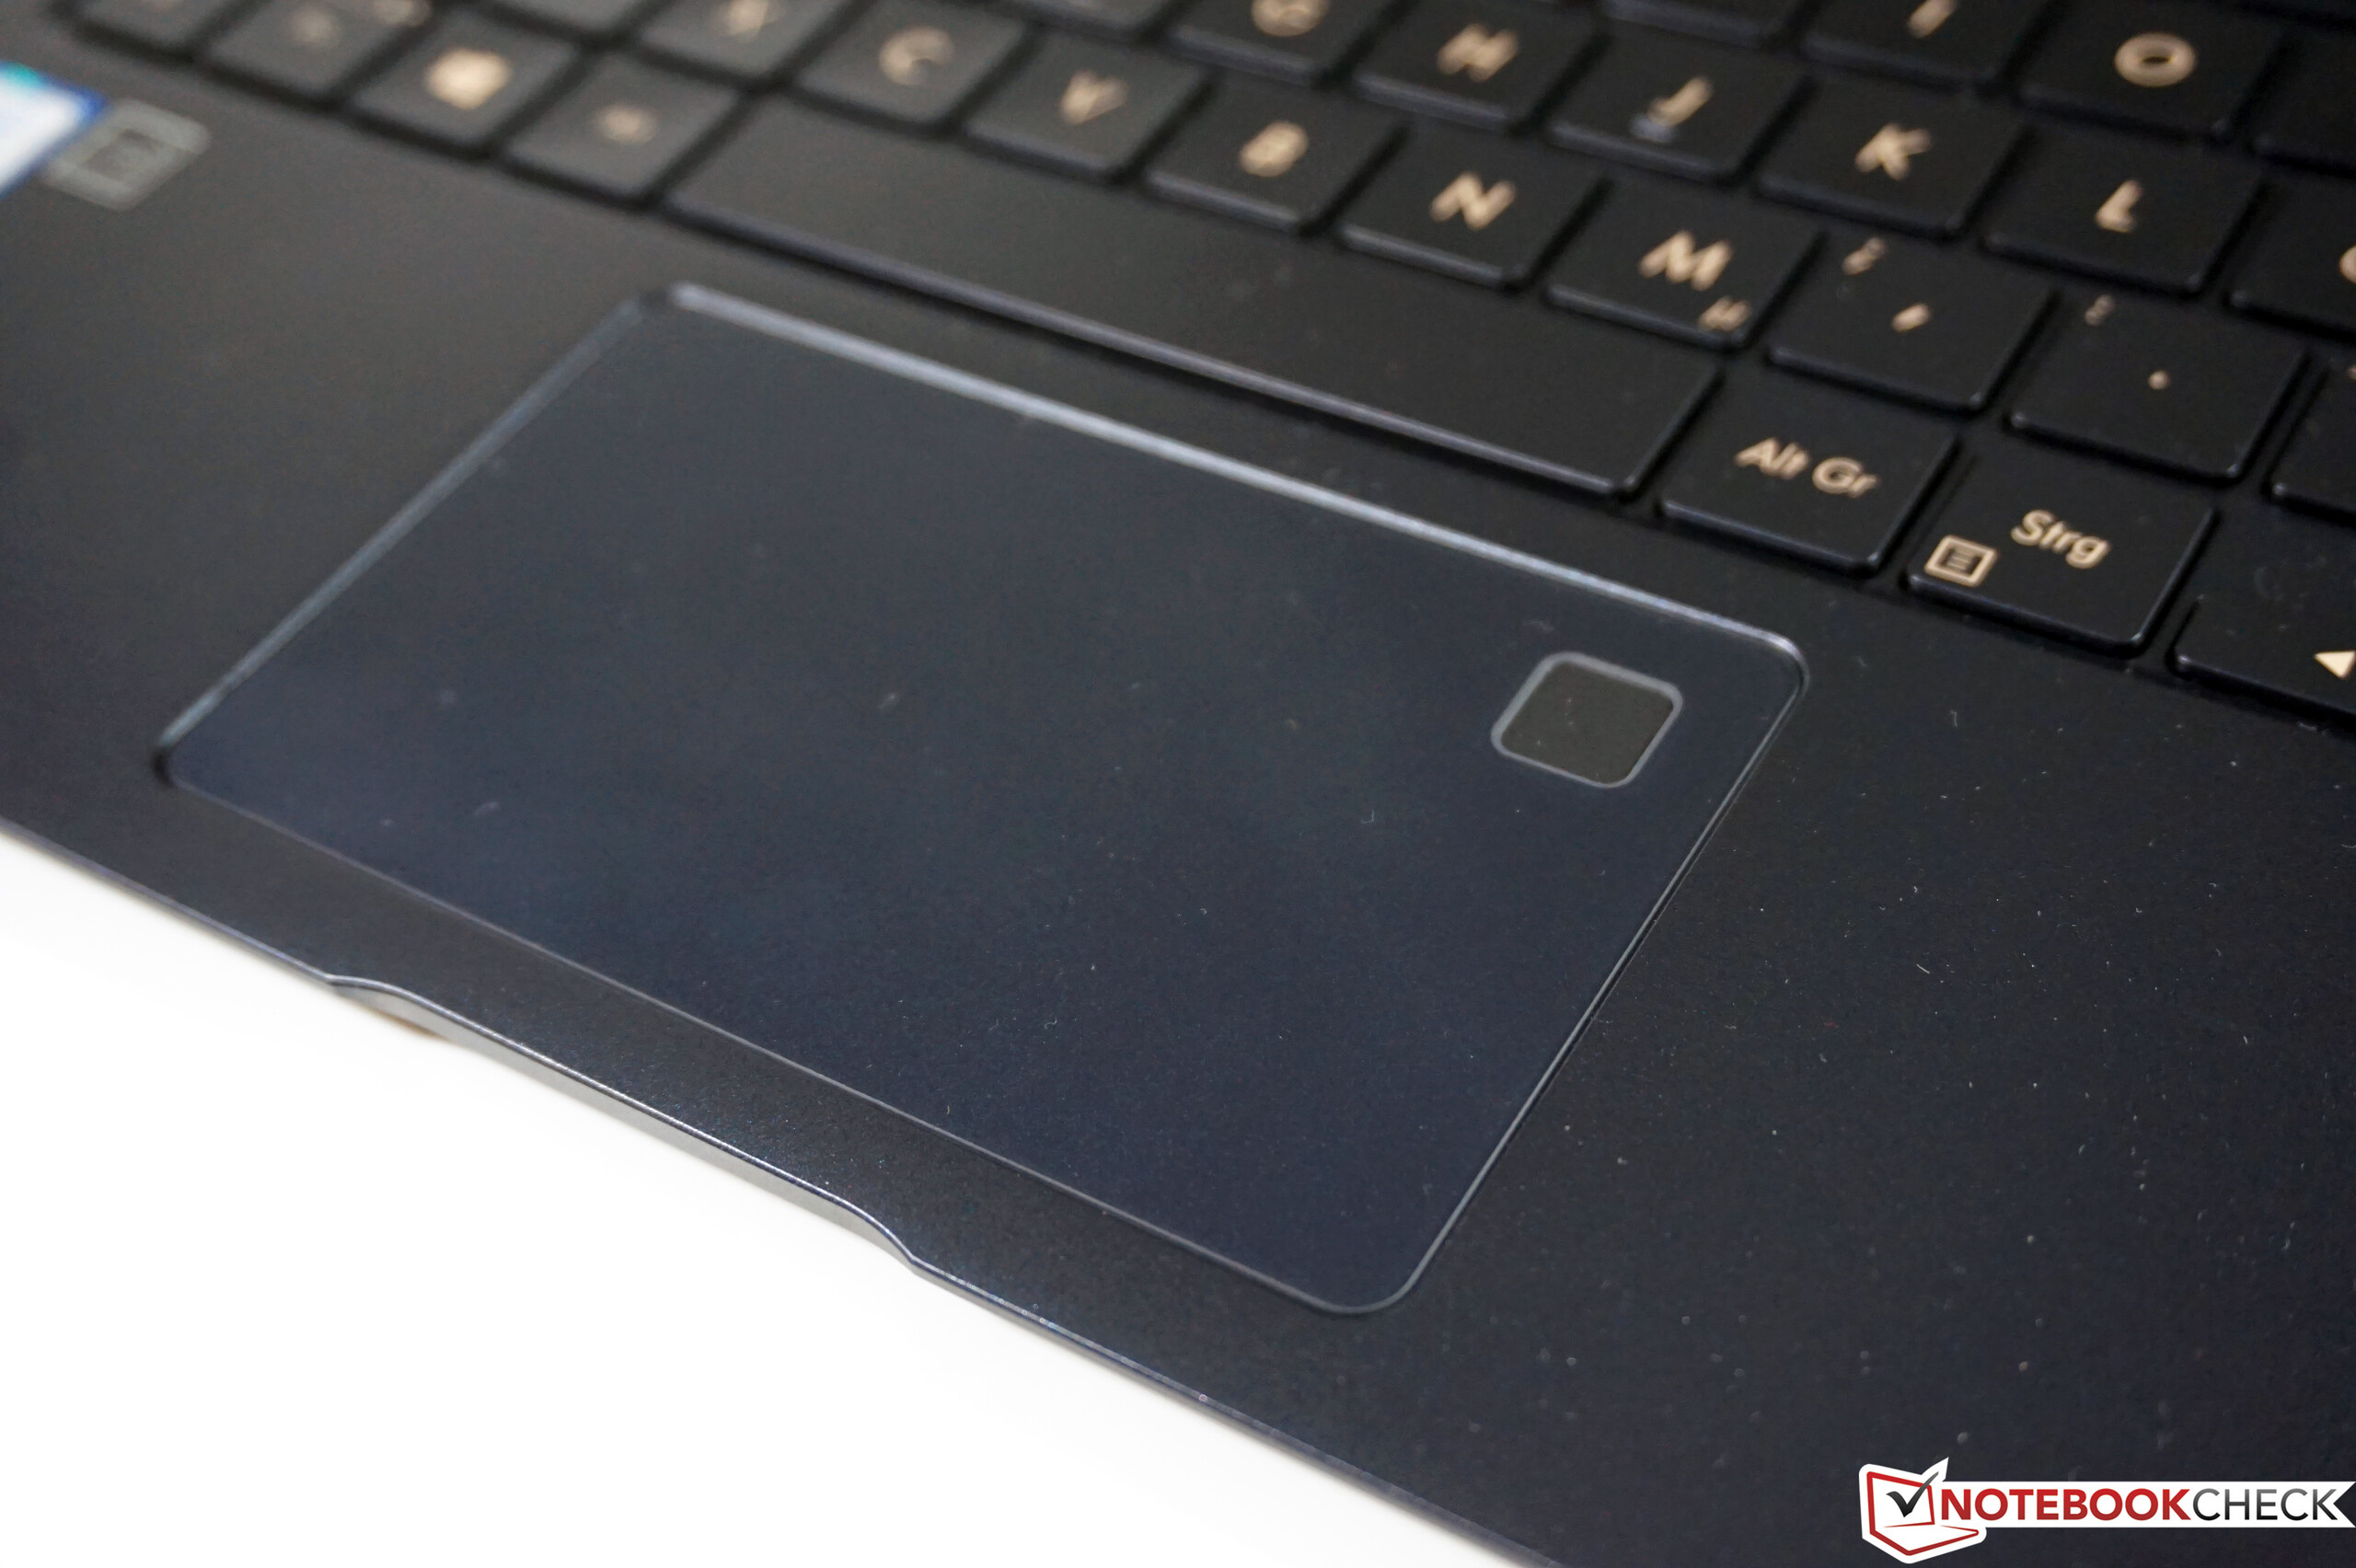
(+) Handledsstöden och pekplattan är kallare än hudtemperaturen med maximalt 26.9 °C / 80.4 F och är därför svala att ta på.
(±) Medeltemperaturen för handledsstödsområdet på liknande enheter var 28.2 °C / 82.8 F (+1.3 °C / 2.4 F).
Asus ZenBook S UX391U ljudanalys
(±) | högtalarljudstyrkan är genomsnittlig men bra (79.7 dB)
Bas 100 - 315 Hz
(-) | nästan ingen bas - i genomsnitt 17% lägre än medianen
(±) | linjäriteten för basen är genomsnittlig (9.6% delta till föregående frekvens)
Mellan 400 - 2000 Hz
(±) | reducerade mids - i genomsnitt 5.9% lägre än median
(+) | mids är linjära (6.3% delta till föregående frekvens)
Högsta 2 - 16 kHz
(+) | balanserade toppar - endast 2.1% från medianen
(+) | toppar är linjära (4.5% delta till föregående frekvens)
Totalt 100 - 16 000 Hz
(±) | linjäriteten för det totala ljudet är genomsnittlig (17.4% skillnad mot median)
Jämfört med samma klass
» 46% av alla testade enheter i den här klassen var bättre, 9% liknande, 45% sämre
» Den bästa hade ett delta på 5%, genomsnittet var 18%, sämst var 53%
Jämfört med alla testade enheter
» 33% av alla testade enheter var bättre, 8% liknande, 58% sämre
» Den bästa hade ett delta på 4%, genomsnittet var 23%, sämst var 134%
Dell XPS 13 9370 FHD i5 ljudanalys
(+) | högtalare kan spela relativt högt (82.8 dB)
Bas 100 - 315 Hz
(-) | nästan ingen bas - i genomsnitt 18.6% lägre än medianen
(±) | linjäriteten för basen är genomsnittlig (11.1% delta till föregående frekvens)
Mellan 400 - 2000 Hz
(±) | högre mellan - i genomsnitt 5.3% högre än median
(+) | mids är linjära (3.8% delta till föregående frekvens)
Högsta 2 - 16 kHz
(+) | balanserade toppar - endast 3.9% från medianen
(+) | toppar är linjära (6.4% delta till föregående frekvens)
Totalt 100 - 16 000 Hz
(±) | linjäriteten för det totala ljudet är genomsnittlig (18.2% skillnad mot median)
Jämfört med samma klass
» 53% av alla testade enheter i den här klassen var bättre, 7% liknande, 40% sämre
» Den bästa hade ett delta på 5%, genomsnittet var 18%, sämst var 53%
Jämfört med alla testade enheter
» 39% av alla testade enheter var bättre, 8% liknande, 53% sämre
» Den bästa hade ett delta på 4%, genomsnittet var 23%, sämst var 134%
| Av/Standby | |
| Låg belastning | |
| Hög belastning |
|
Förklaring:
min: | |
| Asus ZenBook S UX391U i5-8550U, UHD Graphics 620, Samsung PM961 NVMe MZVLW512HMJP, IPS, 1920x1080, 13.3" | Dell XPS 13 9370 FHD i5 i5-8250U, UHD Graphics 620, Toshiba XG5 KXG50ZNV256G, IPS, 1920x1080, 13.3" | HP Spectre 13-af033ng i5-8550U, UHD Graphics 620, Samsung PM961 NVMe MZVLW512HMJP, IPS, 1920x1080, 13.3" | Huawei Matebook X Pro i5 i5-8250U, GeForce MX150, Samsung PM961 MZVLW256HEHP, IPS, 3000x2000, 13.9" | Huawei MateBook X i5-7200U, HD Graphics 620, LITEON CB1-SD256, , 2160x1440, 13.3" | Apple MacBook Pro 13 2017 i5-7360U, Iris Plus Graphics 640, Apple SSD AP0128, IPS, 2560x1600, 13.3" | Genomsnitt Intel UHD Graphics 620 | Genomsnitt av klass Subnotebook | |
|---|---|---|---|---|---|---|---|---|
| Power Consumption | 11% | 11% | -25% | -24% | 3% | -1% | -8% | |
| Idle Minimum * (Watt) | 3.24 | 3.14 3% | 2.8 14% | 3.5 -8% | 4.6 -42% | 3.7 -14% | 3.81 ? -18% | 3.71 ? -15% |
| Idle Average * (Watt) | 6.1 | 5.22 14% | 6.2 -2% | 8.9 -46% | 11 -80% | 5.2 15% | 6.94 ? -14% | 6.54 ? -7% |
| Idle Maximum * (Watt) | 9.2 | 6 35% | 9.4 -2% | 12.3 -34% | 12 -30% | 7.6 17% | 8.75 ? 5% | 7.89 ? 14% |
| Load Average * (Watt) | 38.8 | 38.5 1% | 32.2 17% | 54.2 -40% | 39.5 -2% | 41.6 -7% | 35 ? 10% | 42.1 ? -9% |
| Load Maximum * (Watt) | 52.6 | 50.4 4% | 36.6 30% | 52.1 1% | 34.6 34% | 50.5 4% | 47.5 ? 10% | 65.1 ? -24% |
| Witcher 3 ultra * (Watt) | 42.4 |
* ... mindre är bättre
| Asus ZenBook S UX391U i5-8550U, UHD Graphics 620, 50 Wh | Dell XPS 13 9370 FHD i5 i5-8250U, UHD Graphics 620, 52 Wh | HP Spectre 13-af033ng i5-8550U, UHD Graphics 620, 43 Wh | Huawei Matebook X Pro i5 i5-8250U, GeForce MX150, 57.4 Wh | Huawei MateBook X i5-7200U, HD Graphics 620, 40 Wh | Apple MacBook Pro 13 2017 i5-7360U, Iris Plus Graphics 640, 54.5 Wh | Genomsnitt av klass Subnotebook | |
|---|---|---|---|---|---|---|---|
| Batteridrifttid | 23% | -12% | 15% | 5% | 6% | 41% | |
| H.264 (h) | 10.4 | 13.9 34% | 10.8 4% | 11.4 10% | 15.3 ? 47% | ||
| WiFi v1.3 (h) | 8.2 | 10.7 30% | 5.9 -28% | 9.3 13% | 5.6 -32% | 11.4 39% | 14.1 ? 72% |
| Load (h) | 1.9 | 2 5% | 1.7 -11% | 2.2 16% | 2.7 42% | 1.3 -32% | 1.998 ? 5% |
För
Emot
Läs den fullständiga versionen av den här recensionen på engelska här.
Hur mycket prestanda behöver en mobil enhet? Tunna enheter har ofta problem med att använda prestandapotentialen hos moderna mobila fyrkärniga processorer. Men vardagsuppgifter behöver sällan så mycket prestanda. Vi gillade idén med ett extra Tyst Läge, som är mer utförligt jämfört med de vanliga energi-inställningarna i Windows.
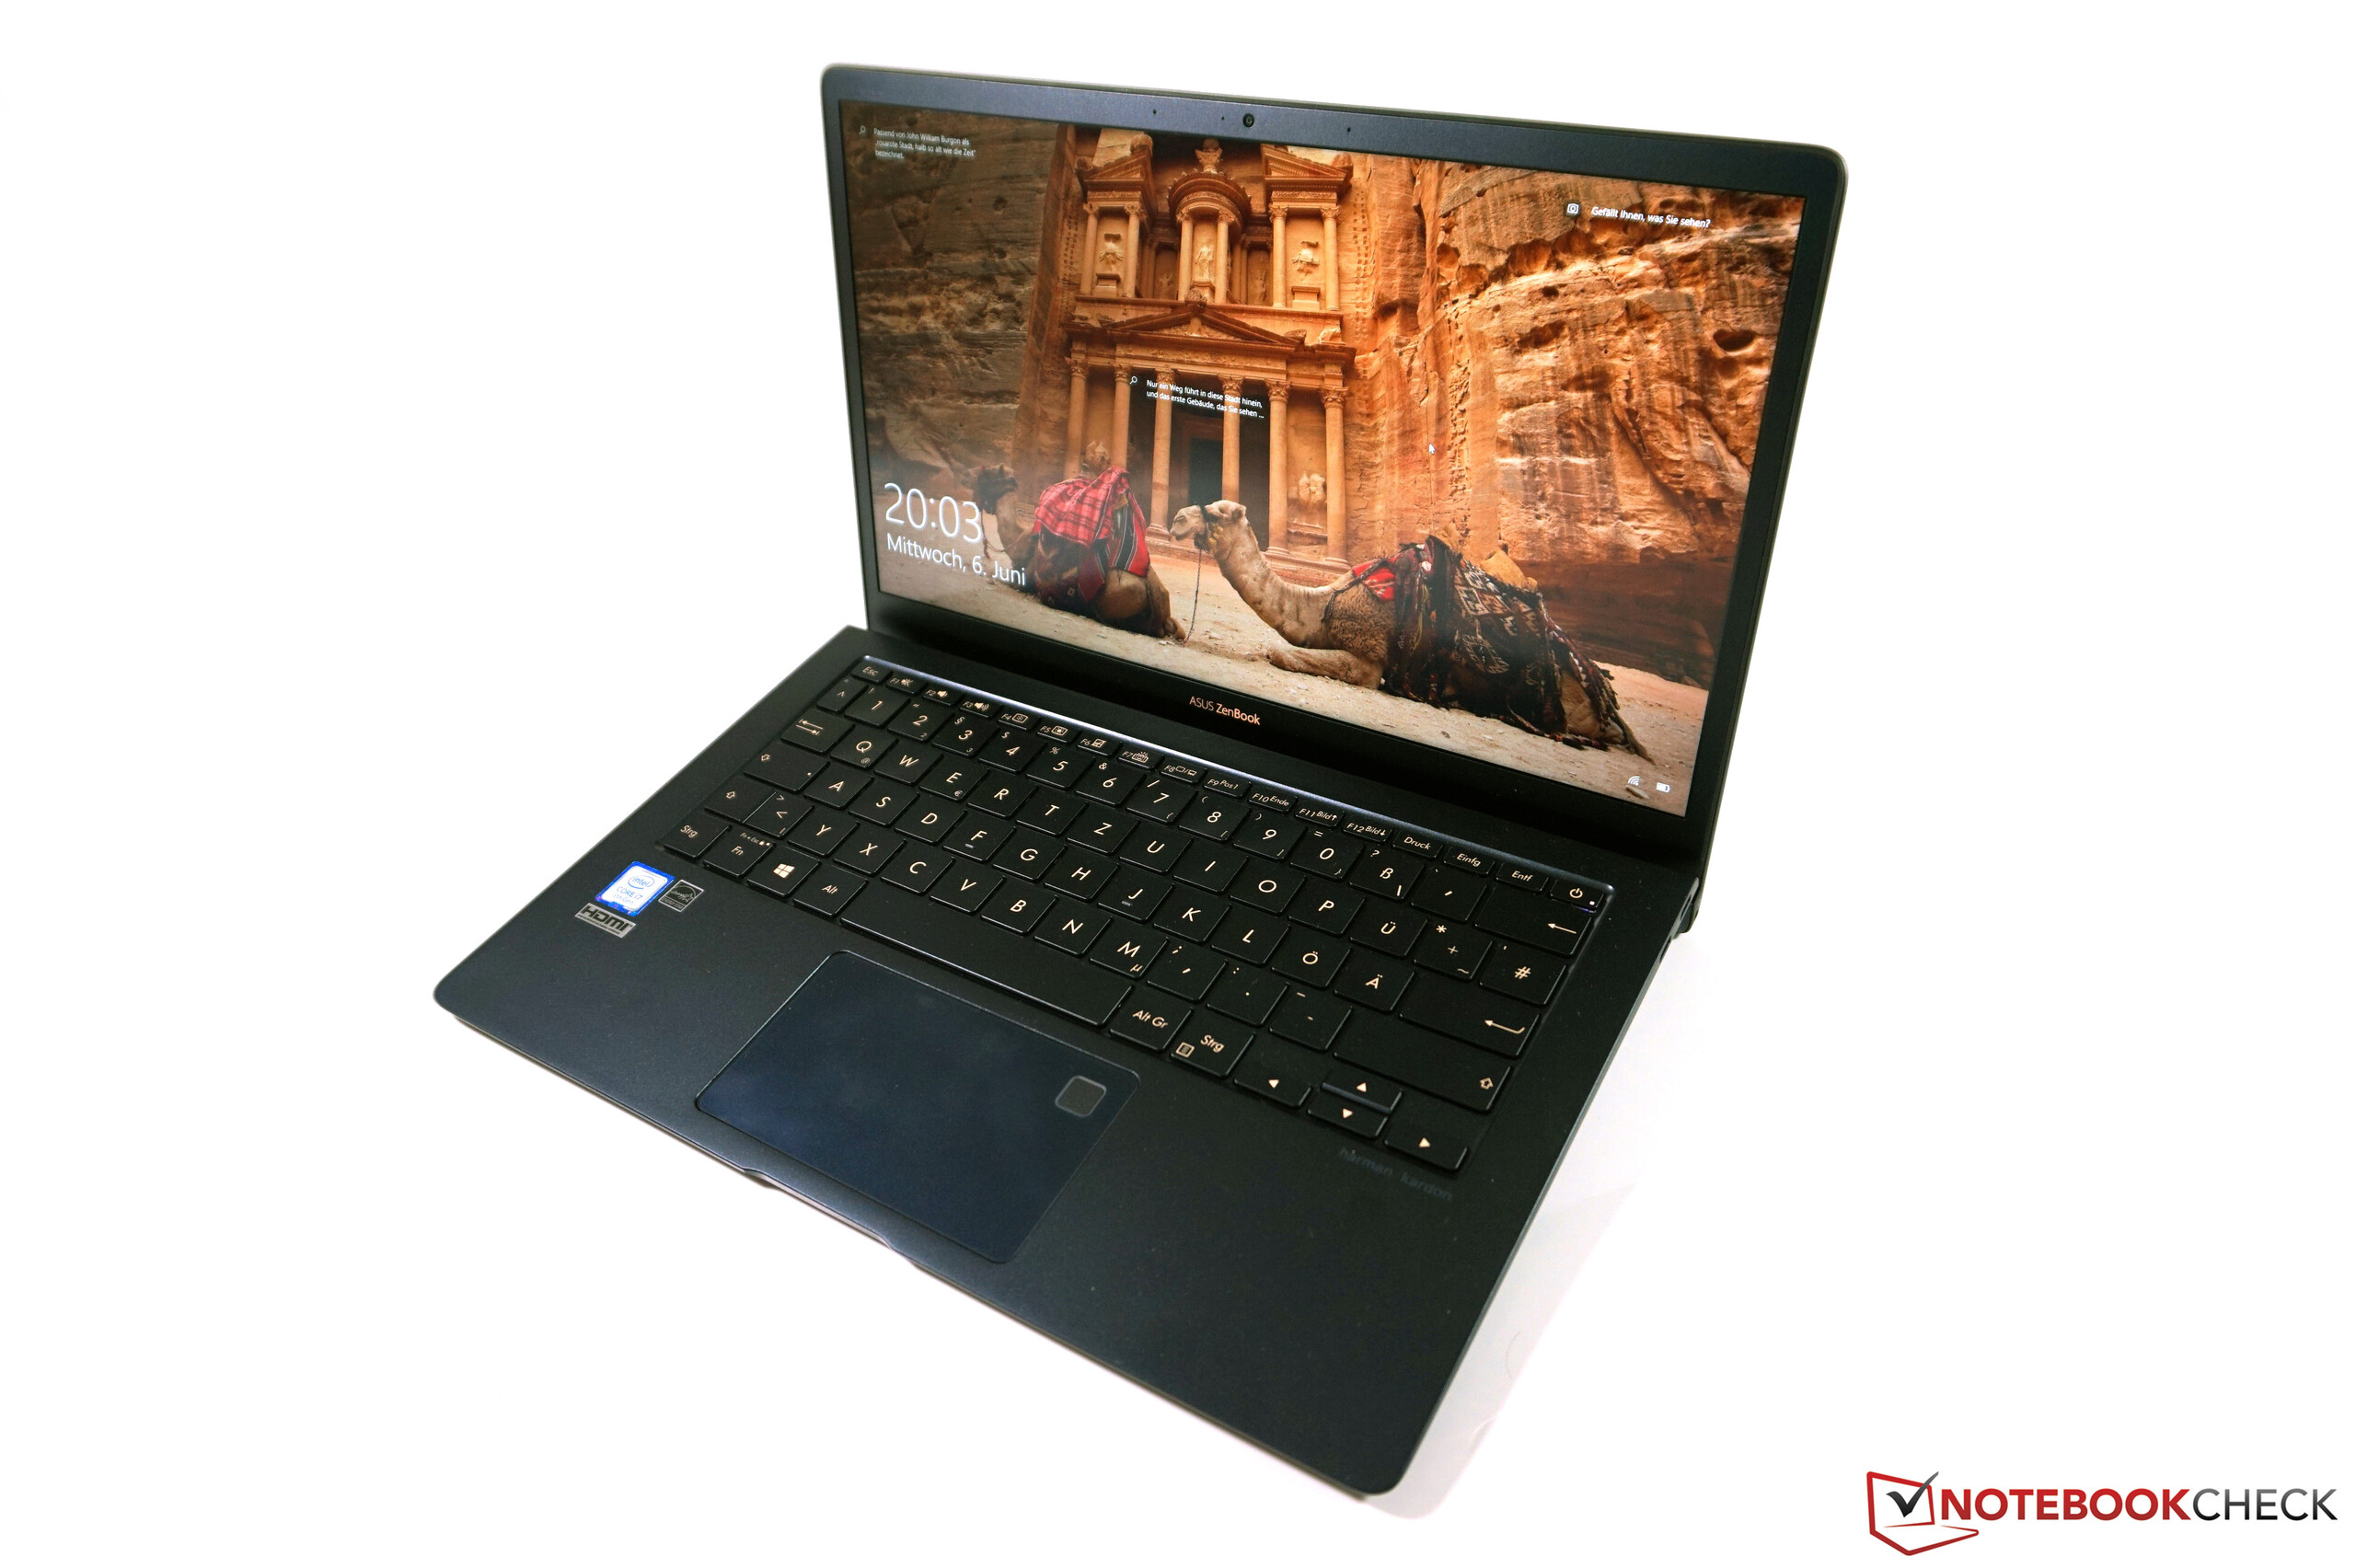
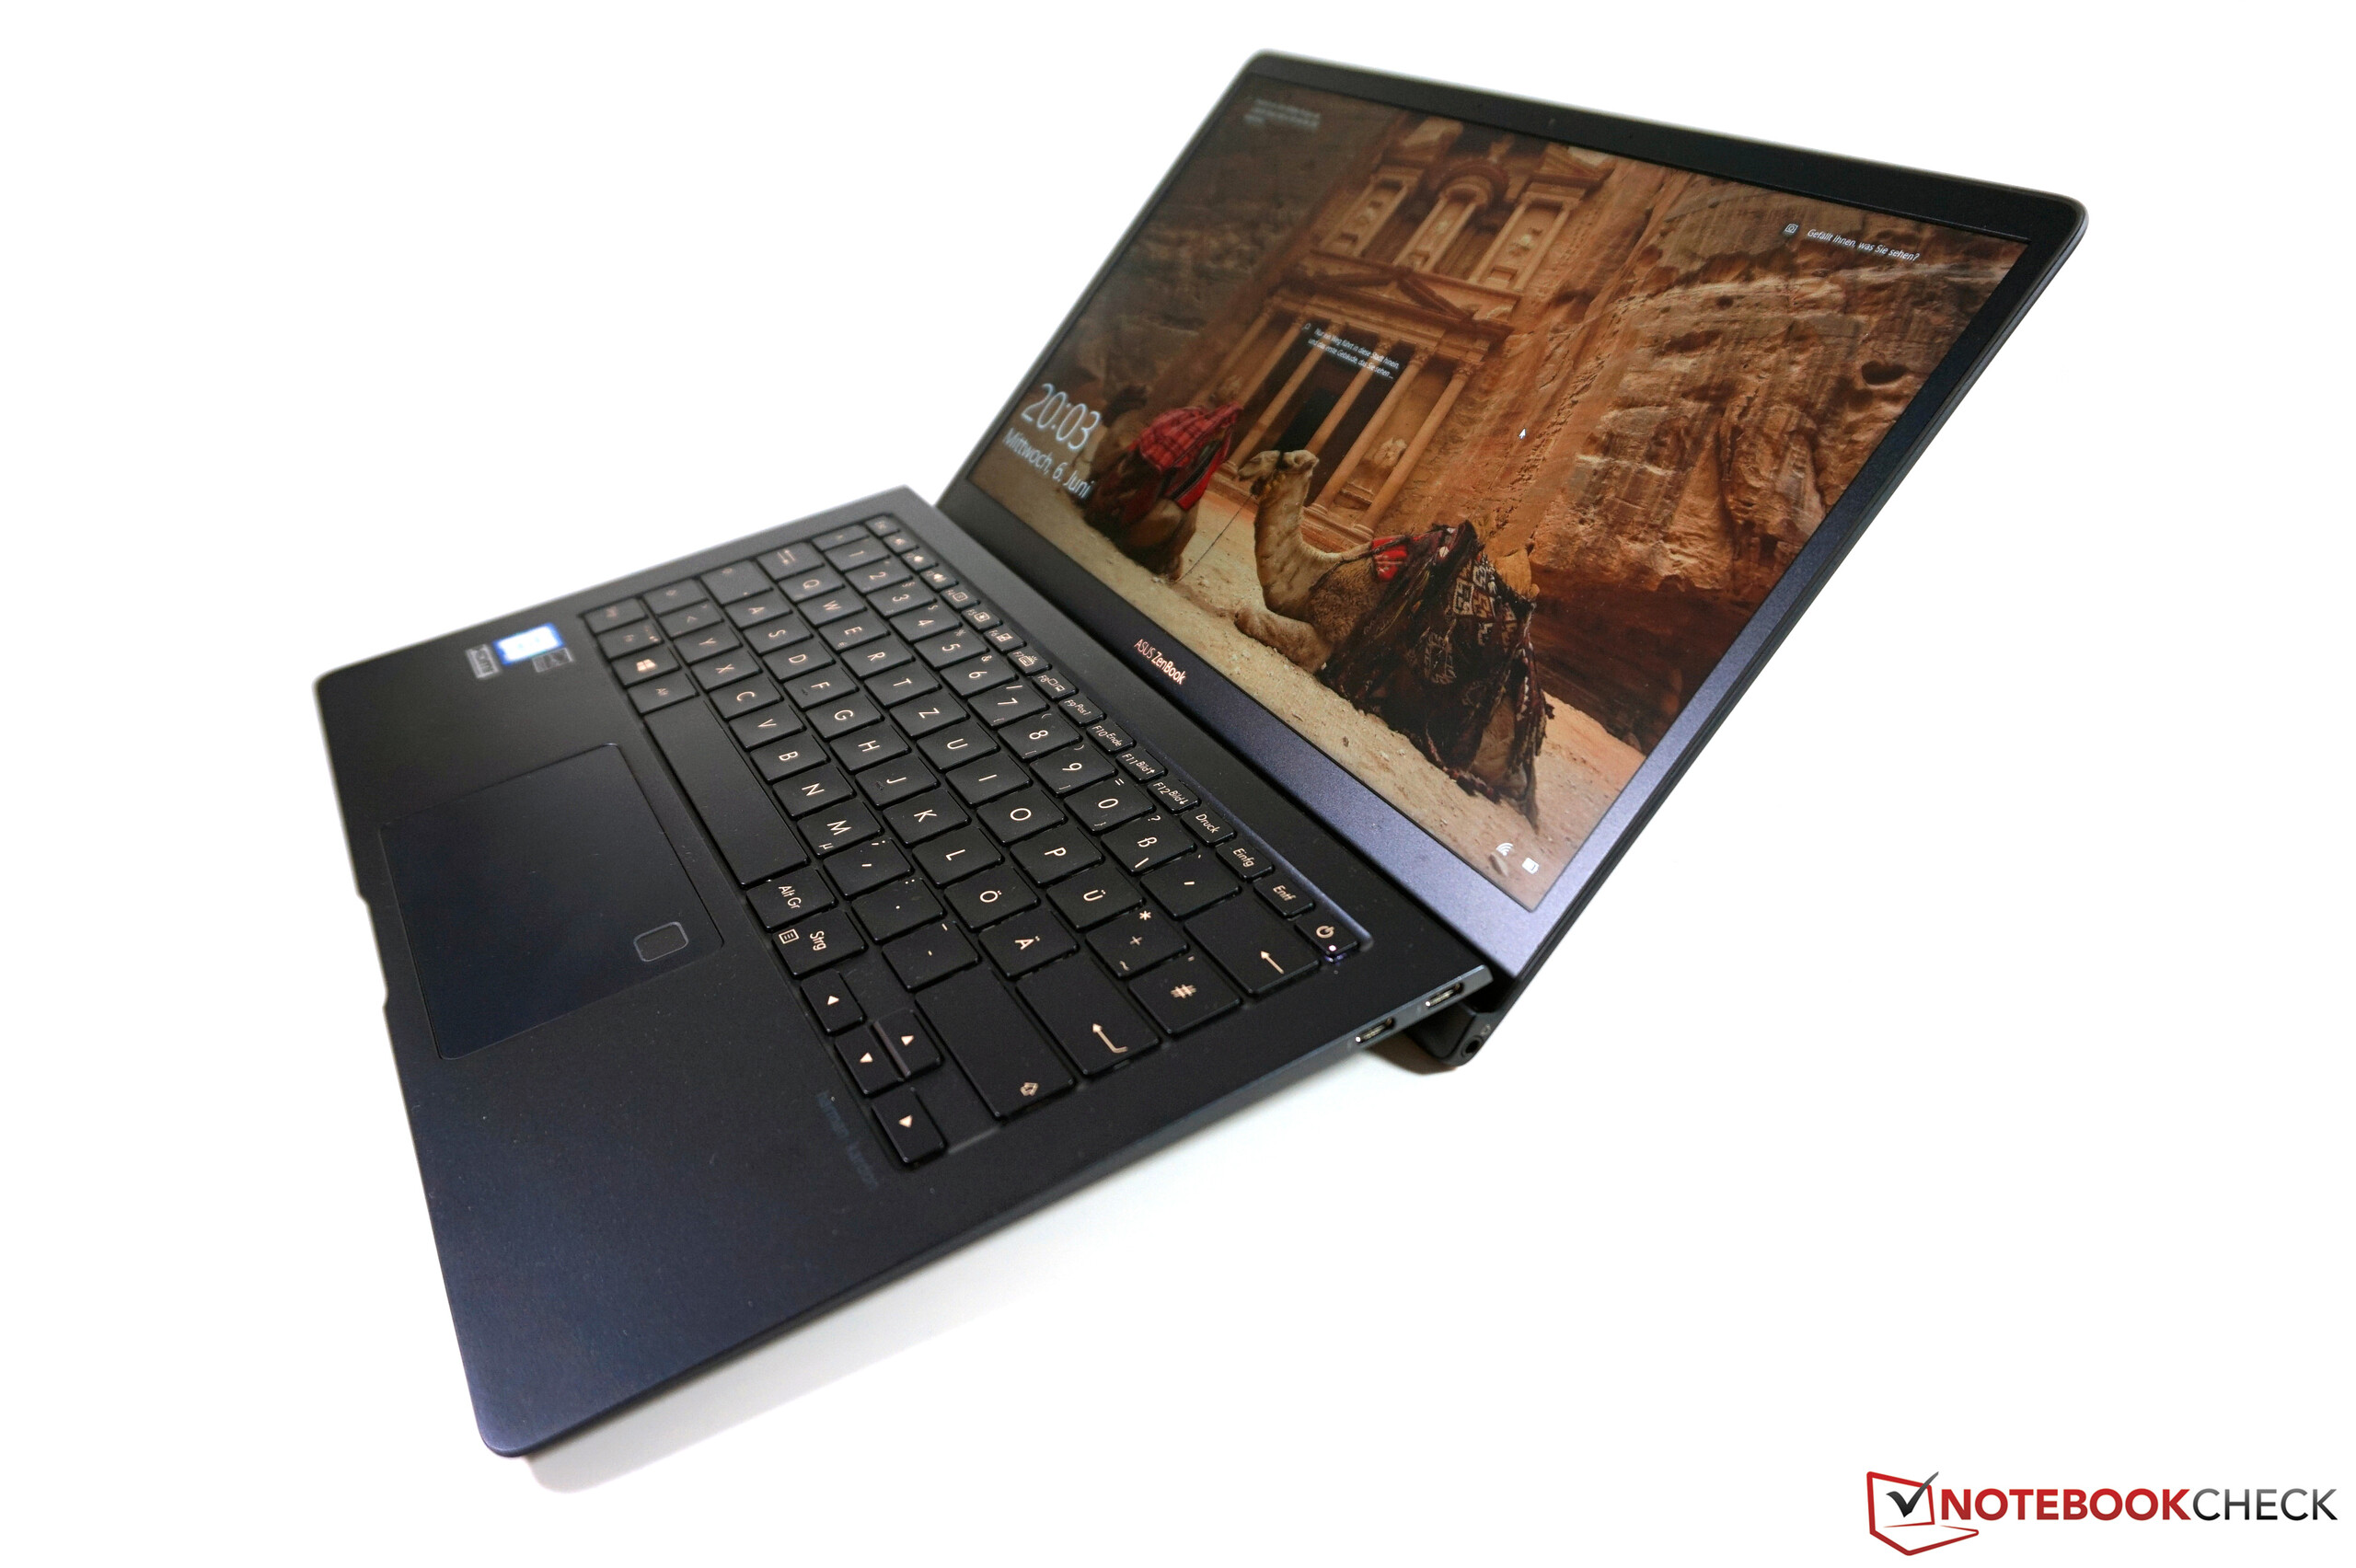
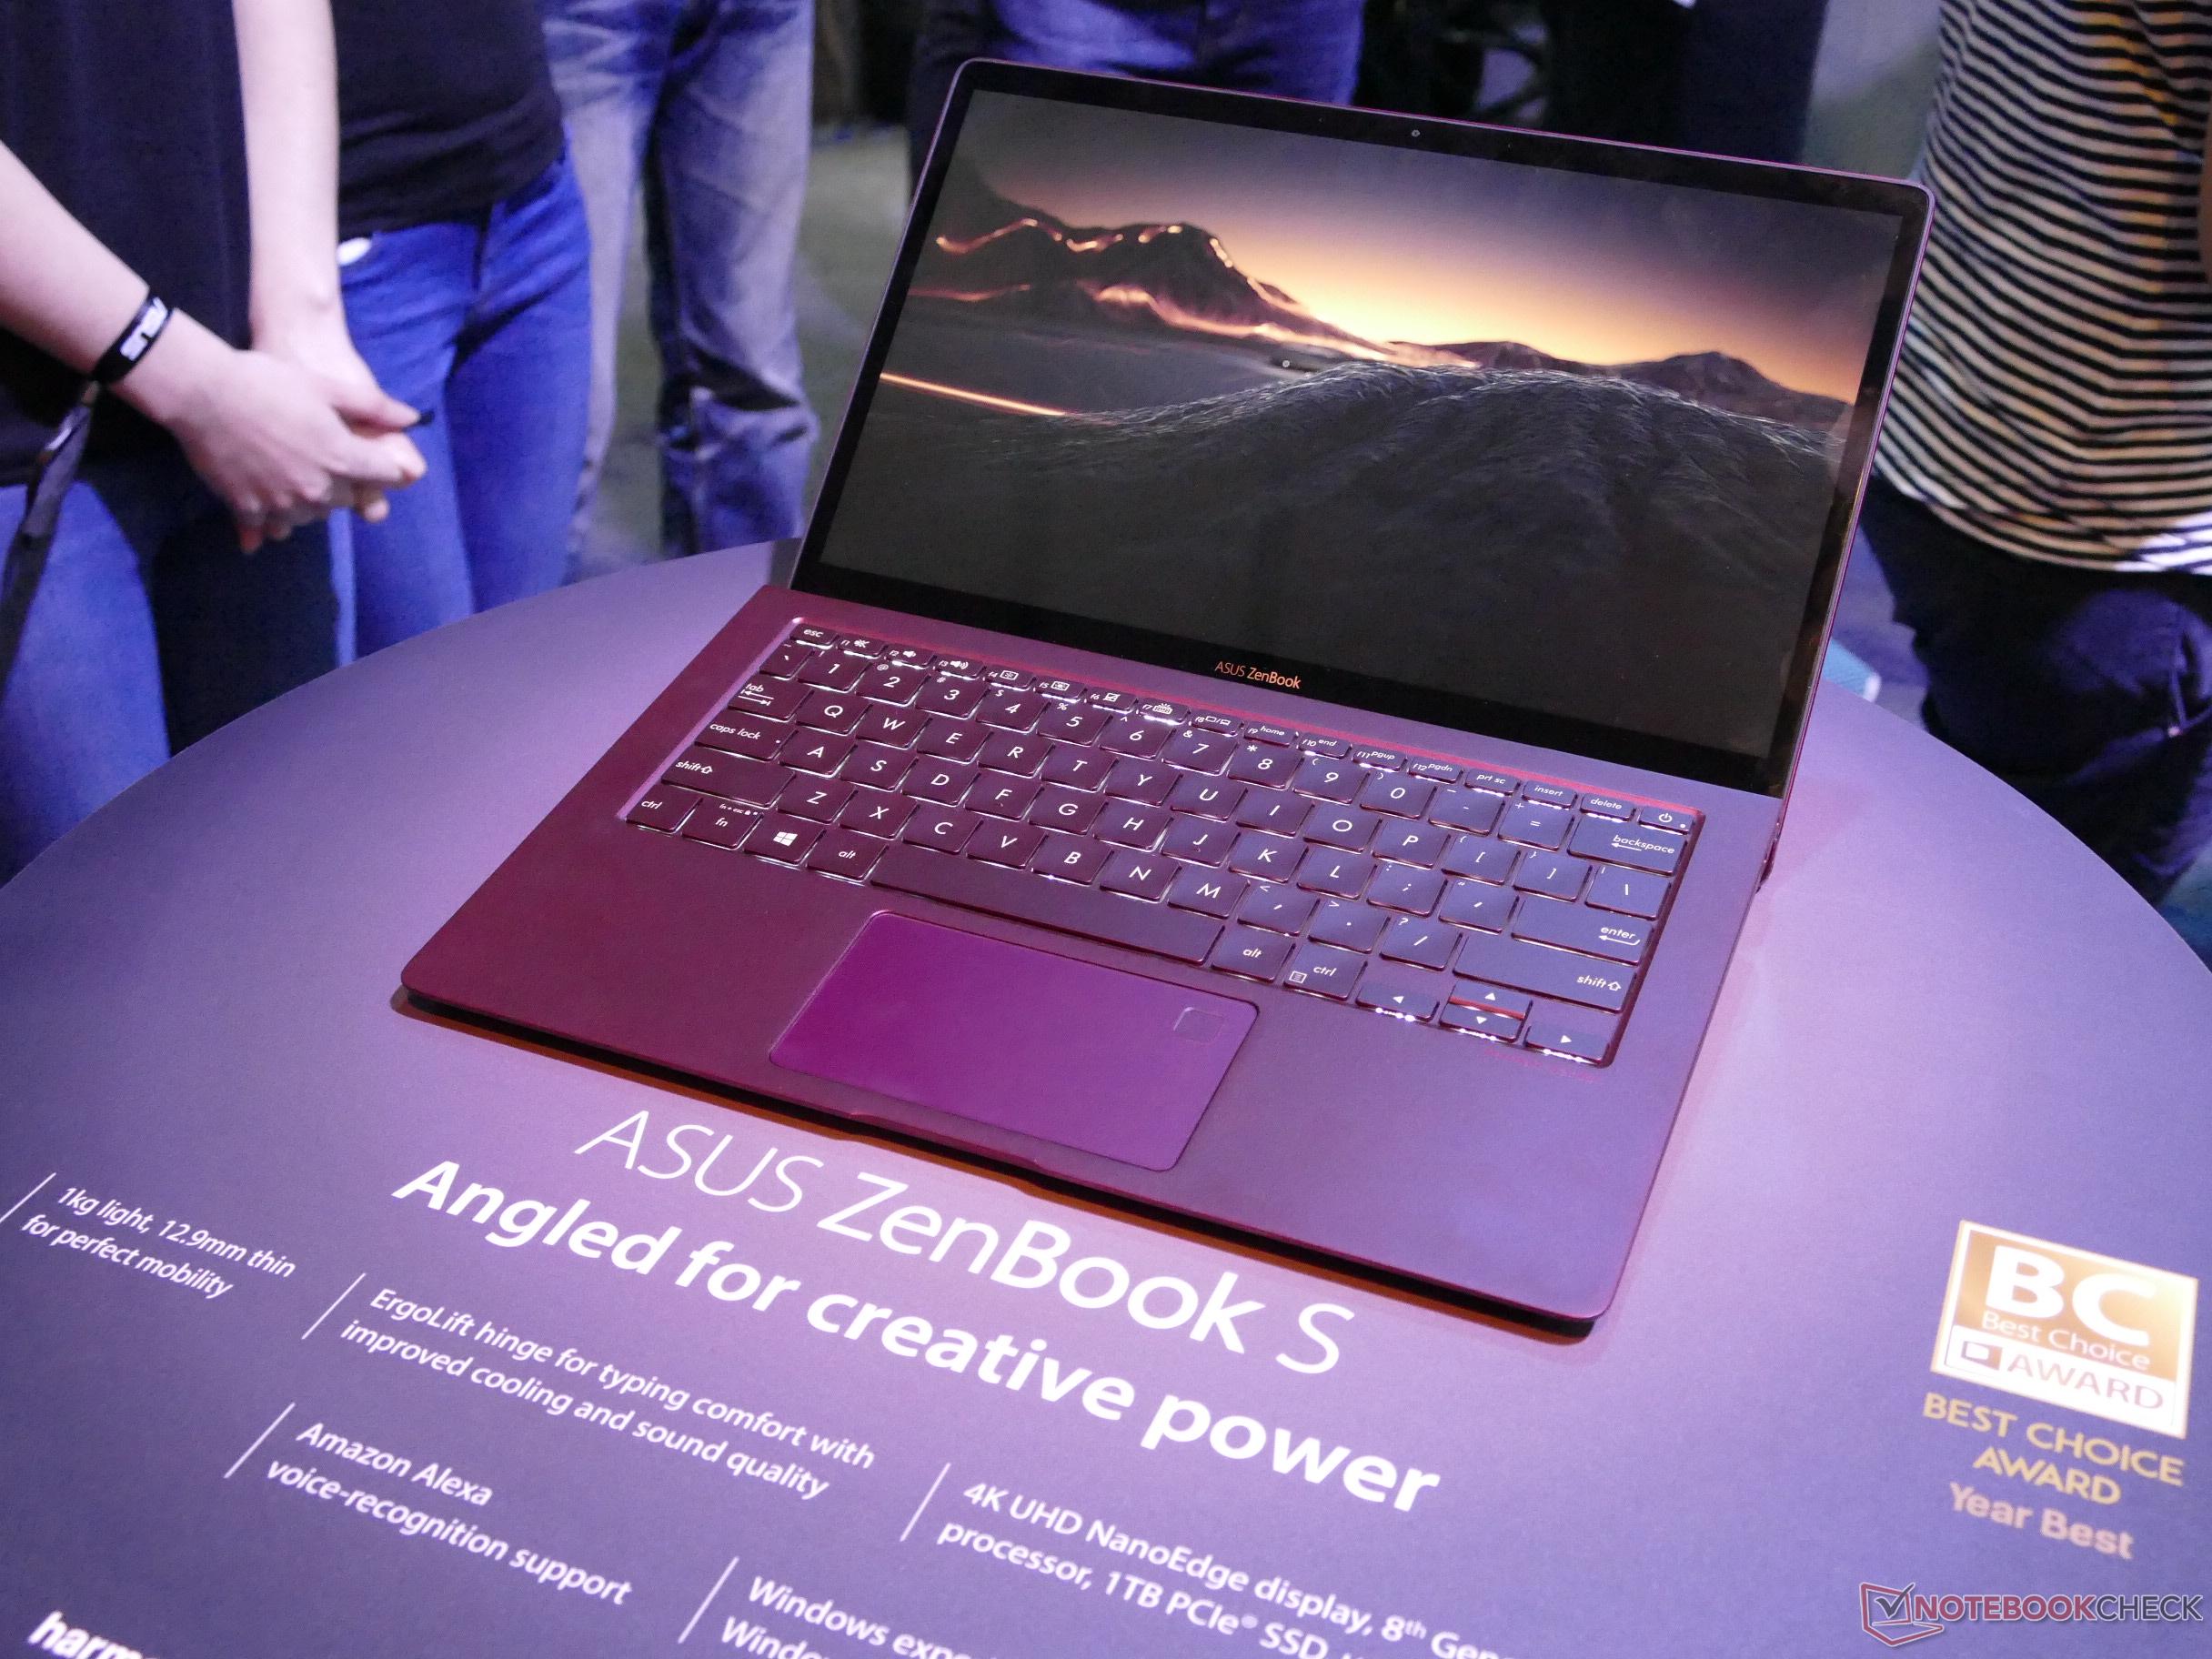
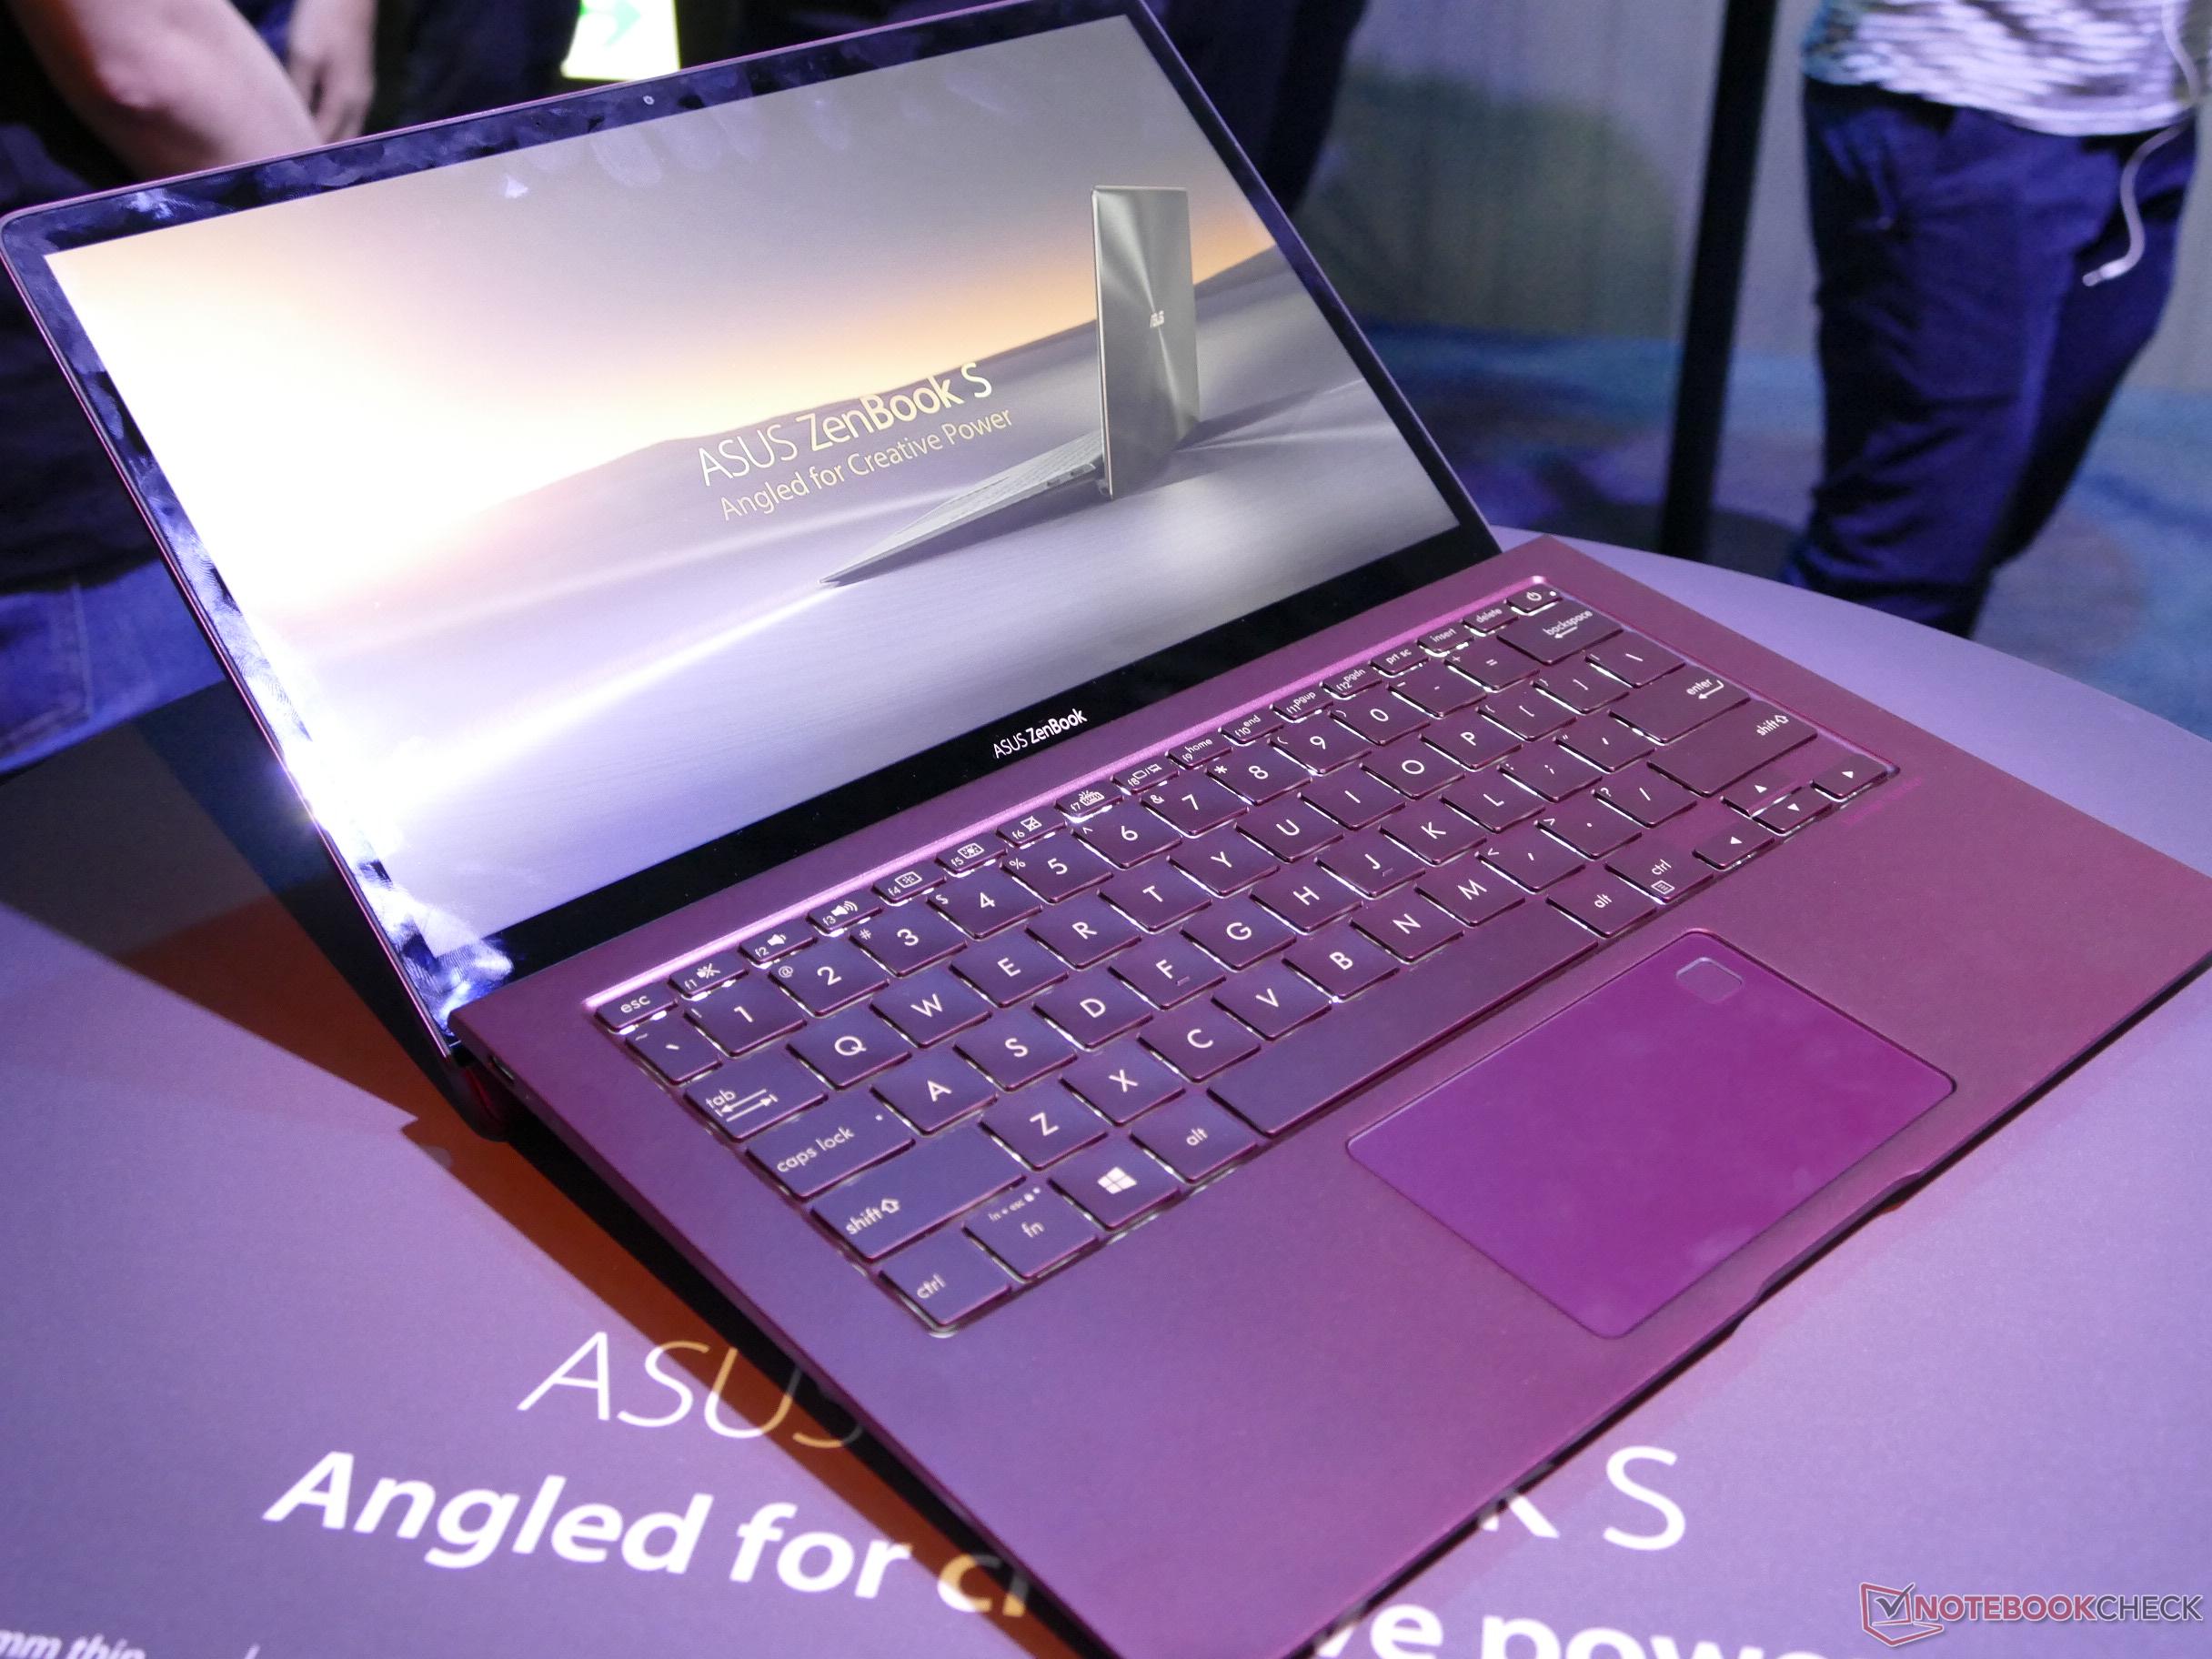
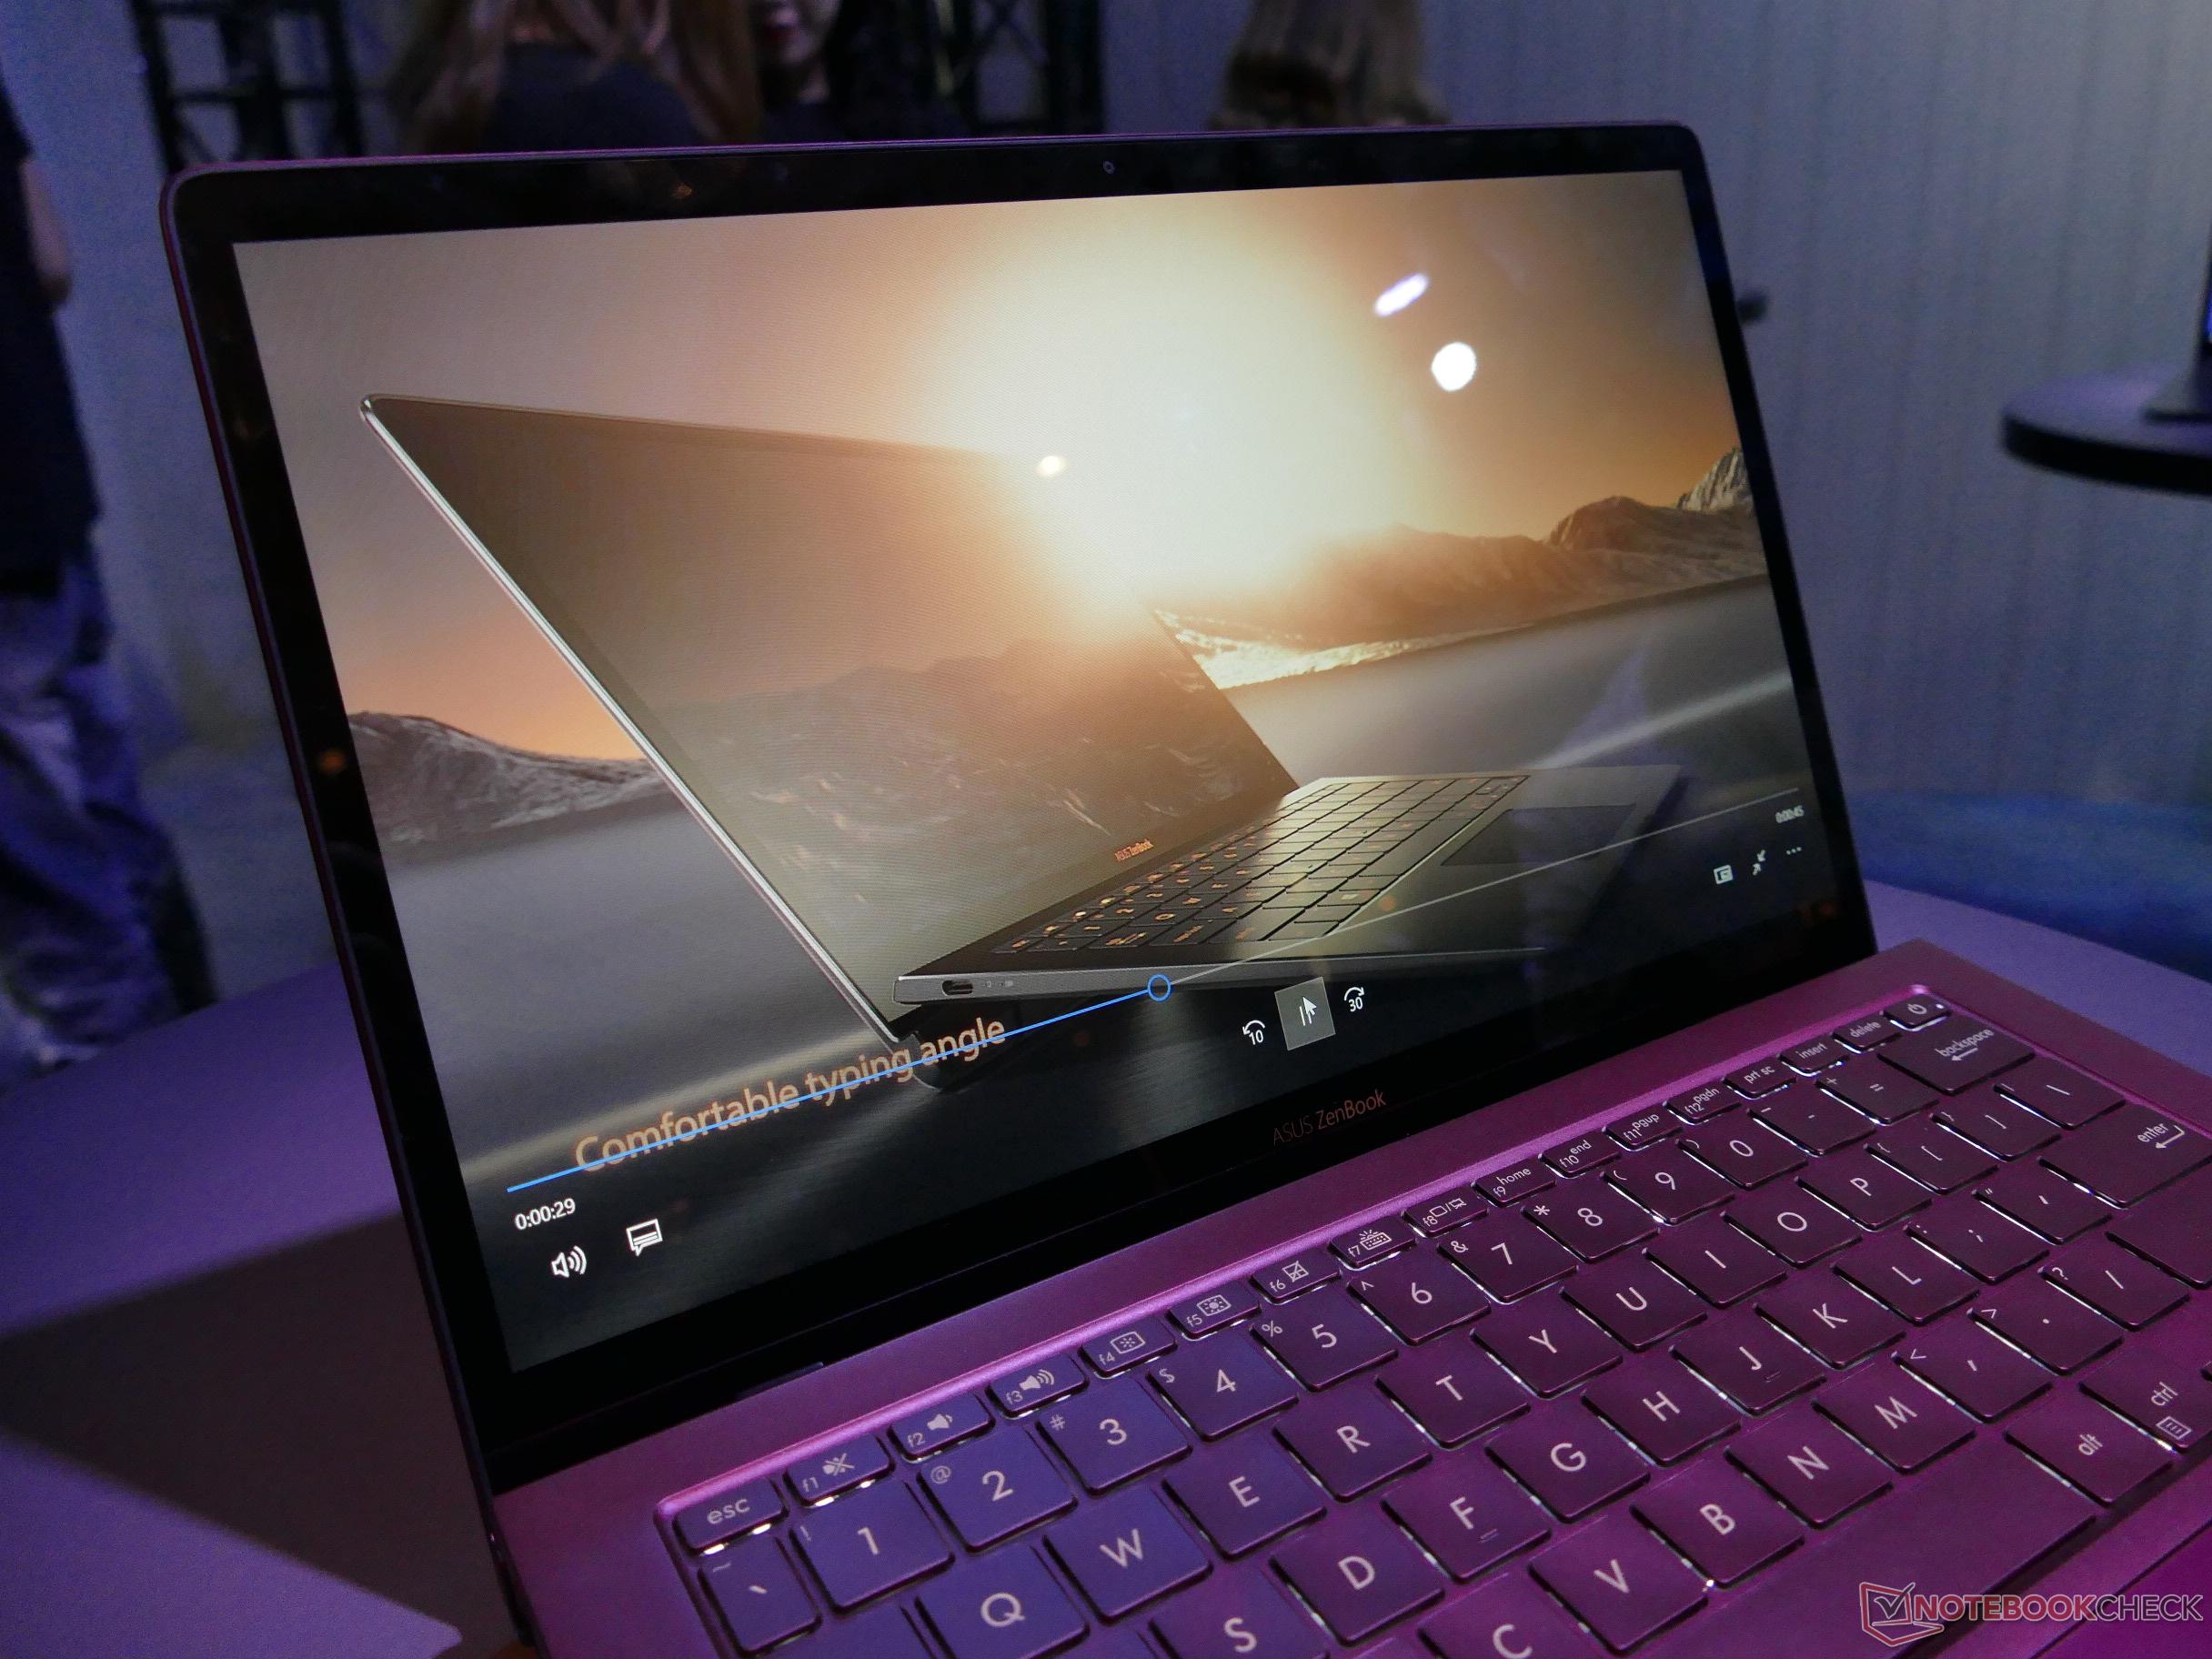
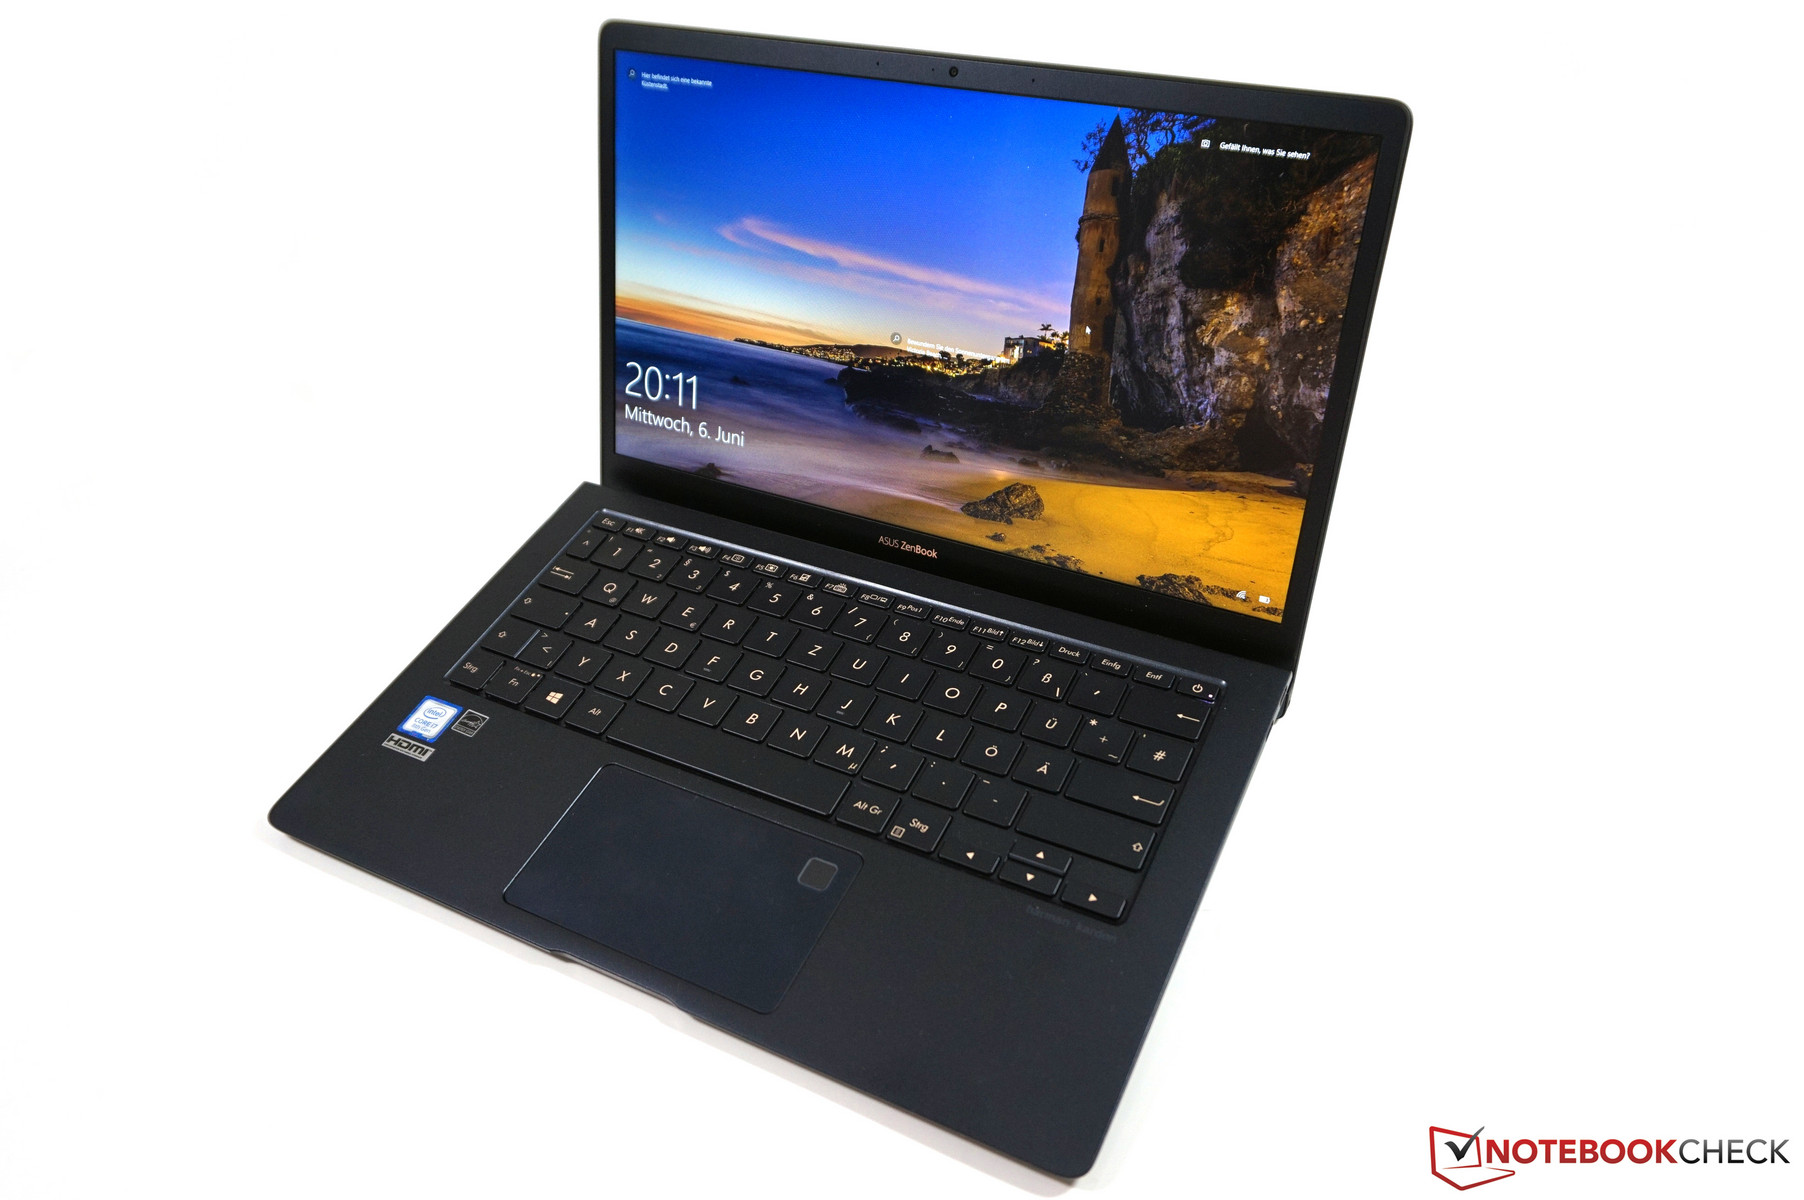
Asus nya ZenBook S UX391 är extremt mobil och riktar sig mot kunder som ofta är ute och reser och behöver en kompakt enhet. Väldigt komplexa applikationer är vanligen inte överst på listan över krav, utan istället kommer den i huvudsak användas för att skriva epost, använda molnapplikationer eller ett Office-paket. ZenBook S har mer än tillräckligt med prestanda för dessa scenarier, även om du aktiverar det tysta läget.
ZenBook S UX391 är ett riktigt bra val om du vill ha en tyst och kompakt kollega. Men en del rivaler kan utnyttja prestandan hos denna fyrkärniga ULV-processor bättre och har dessutom längre batteritid.
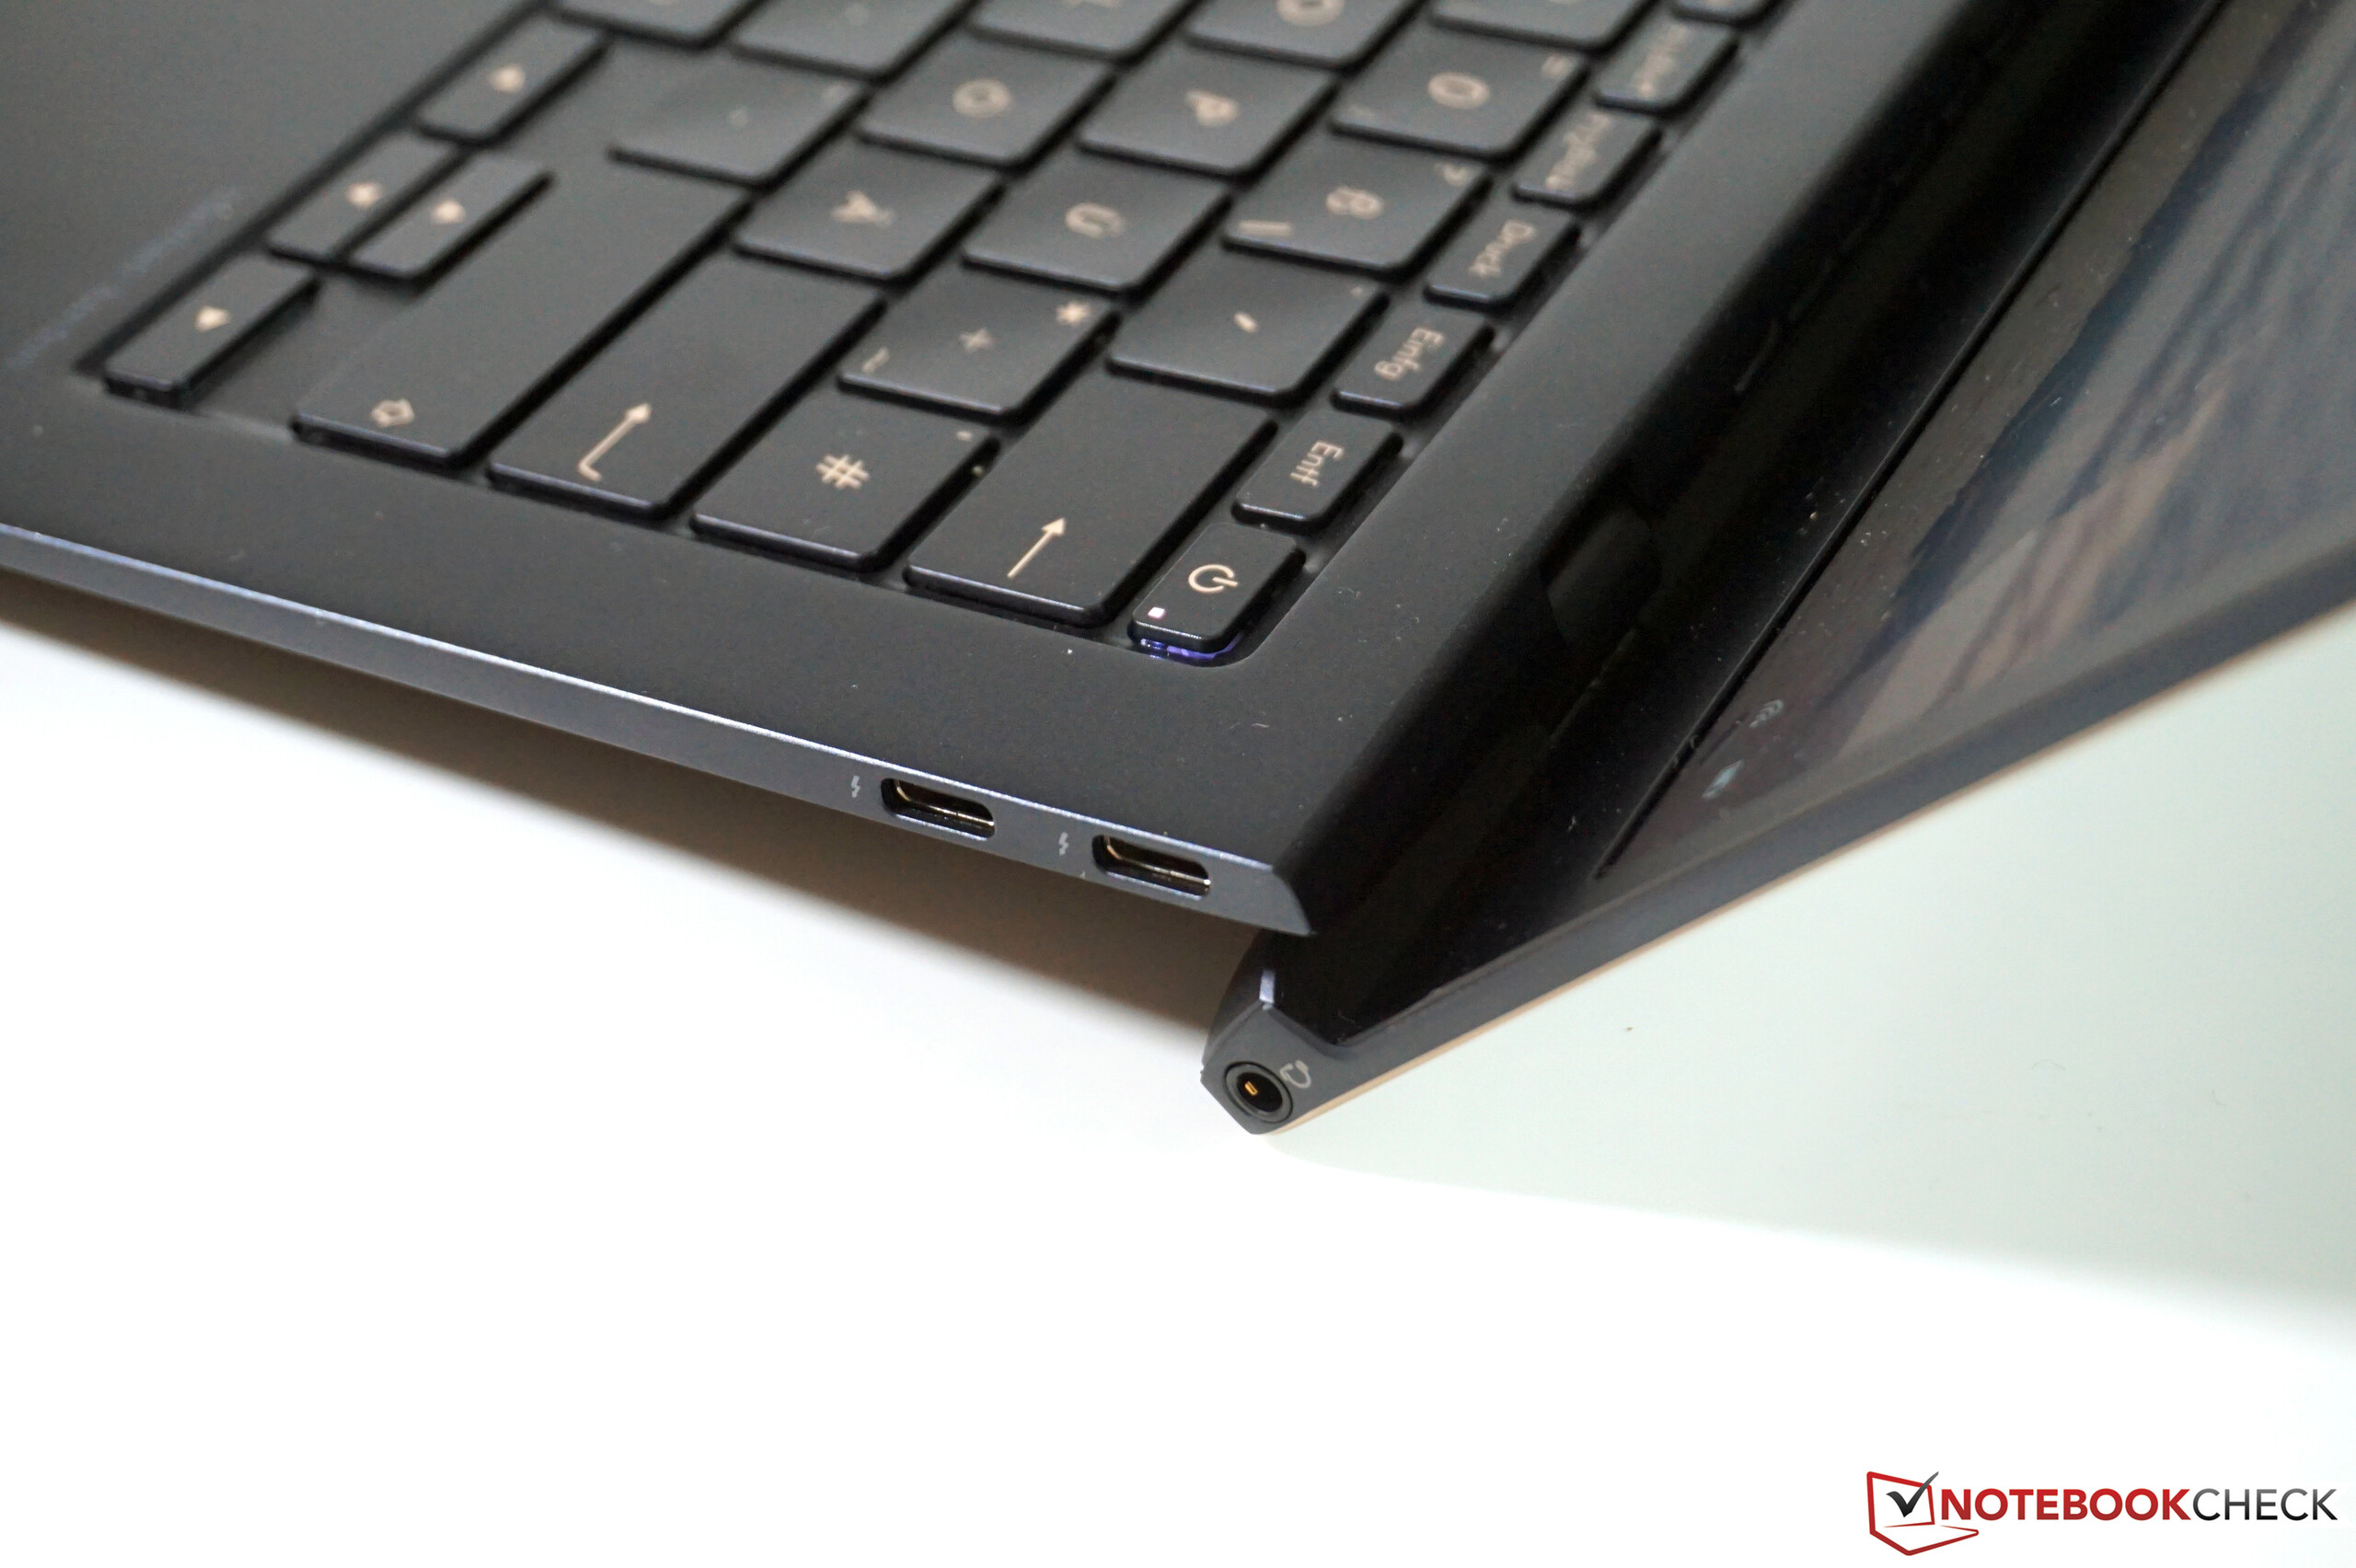
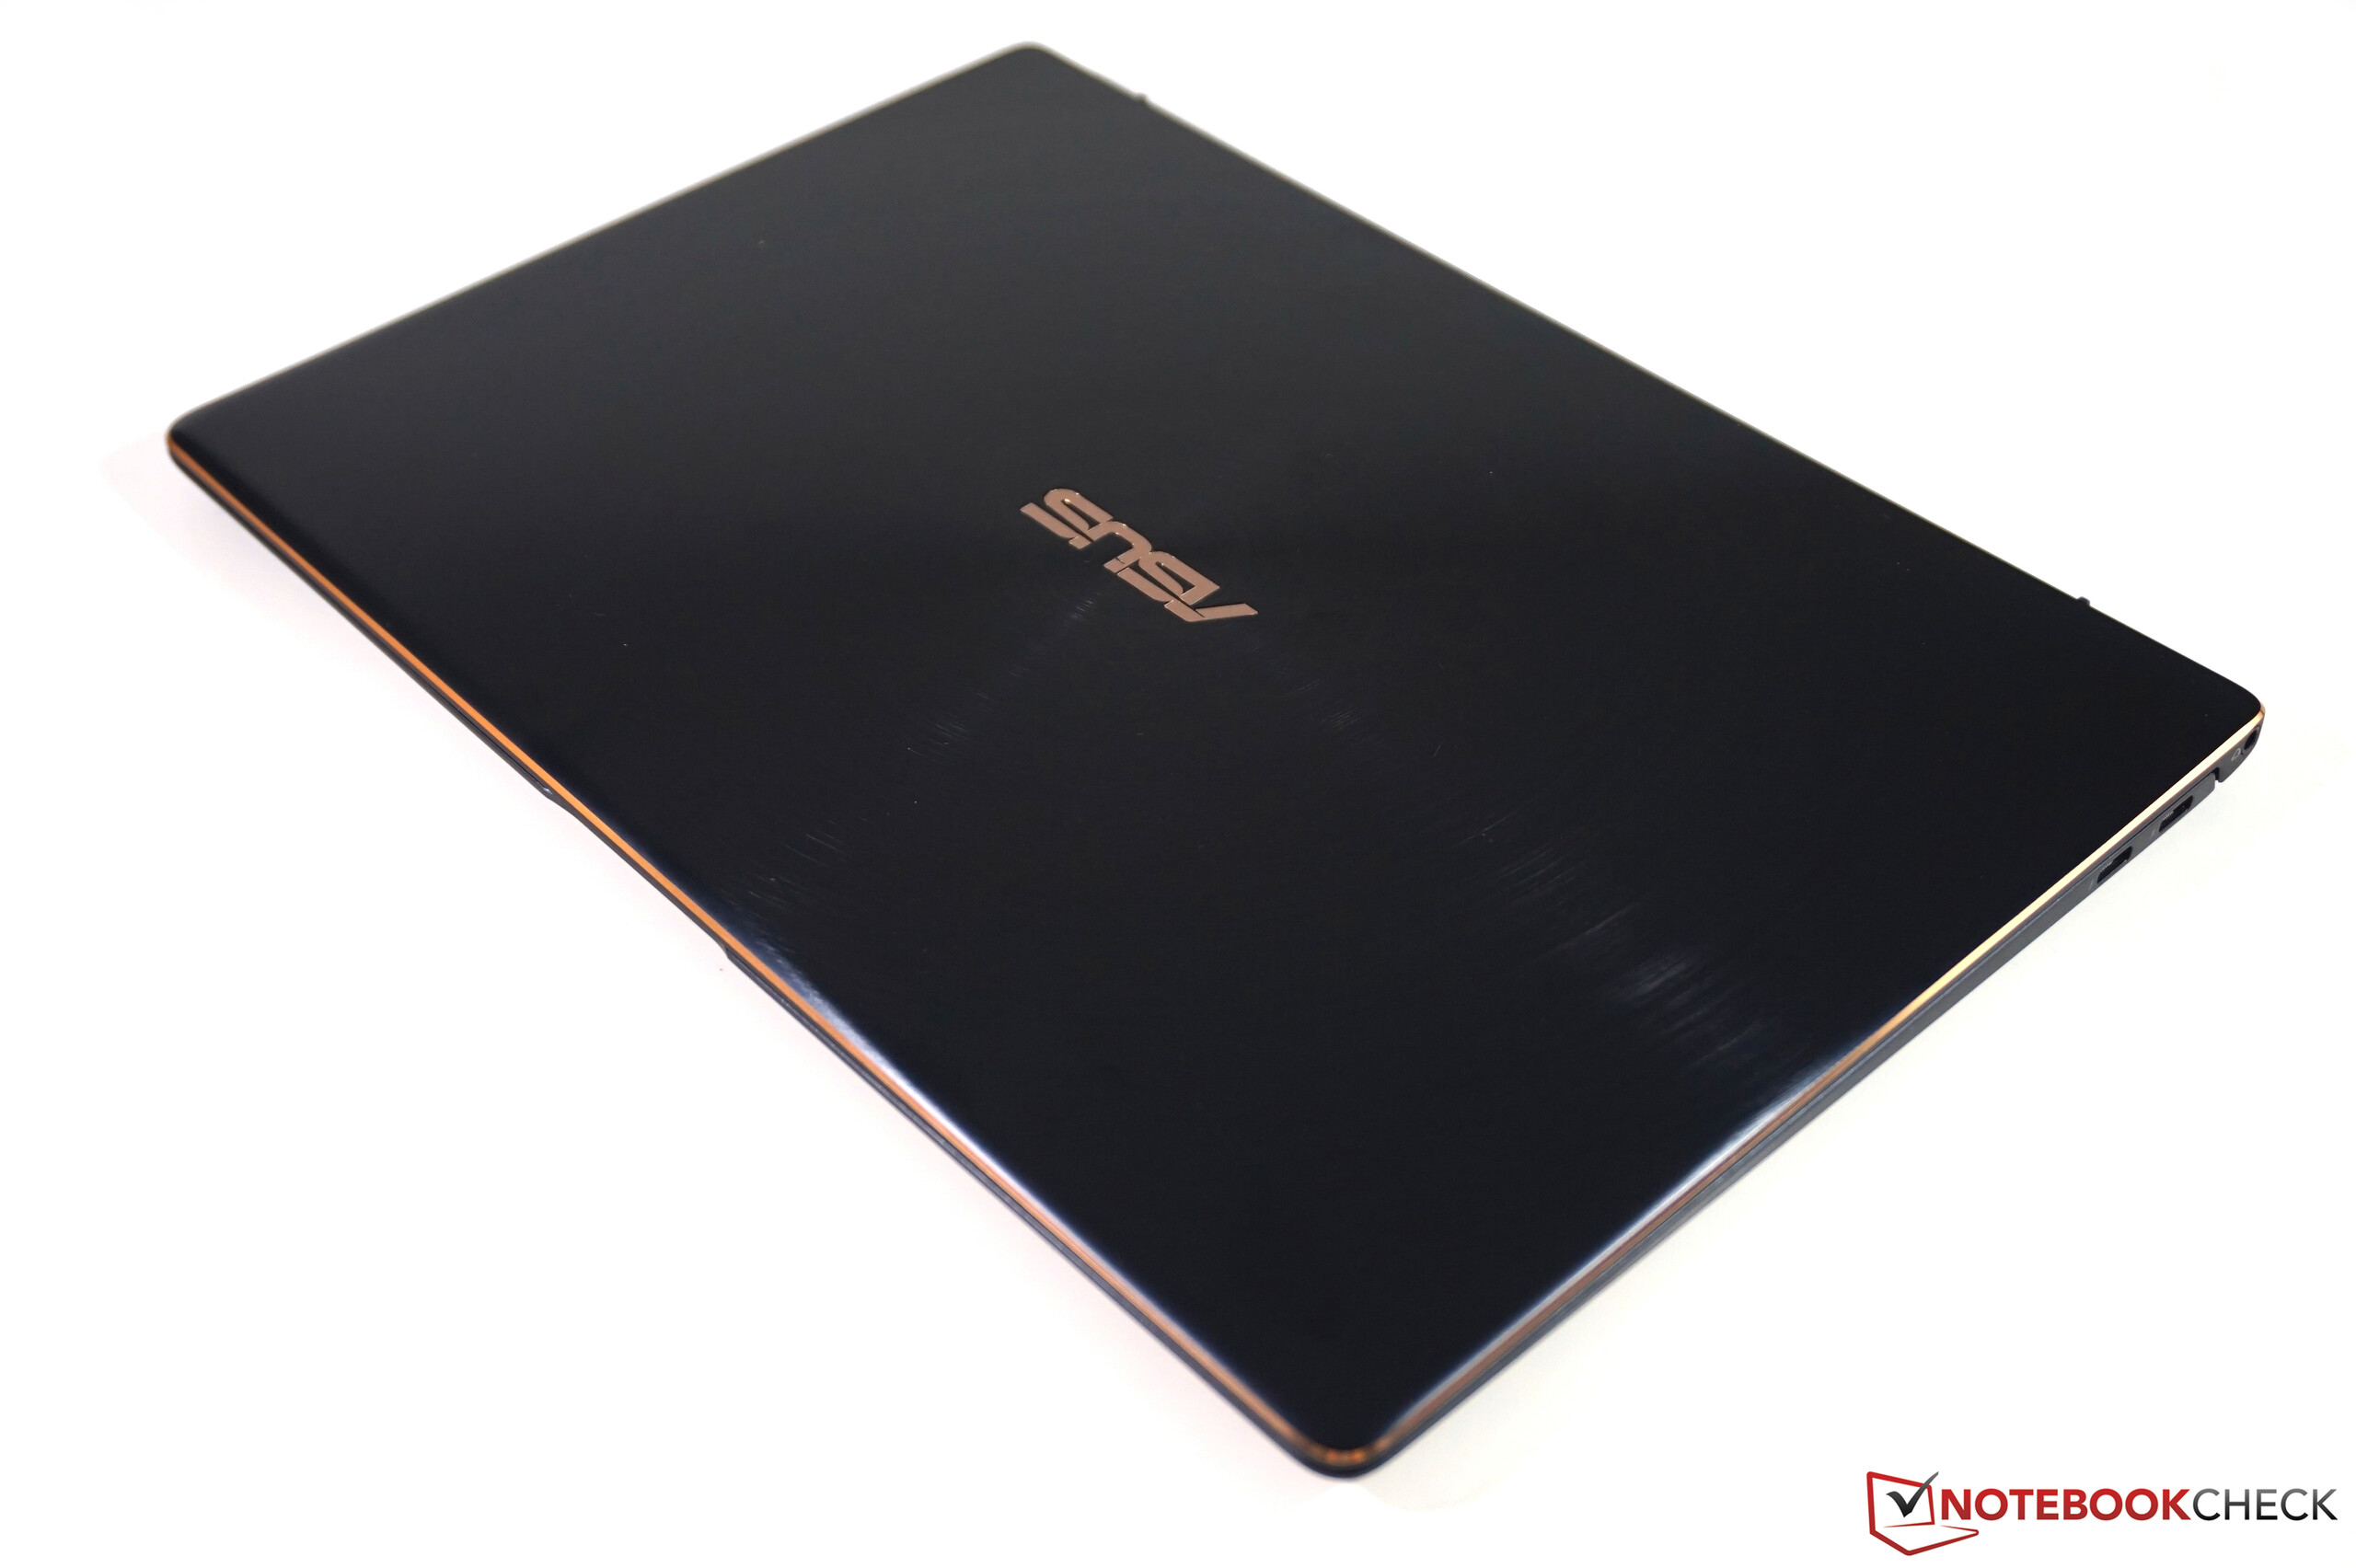
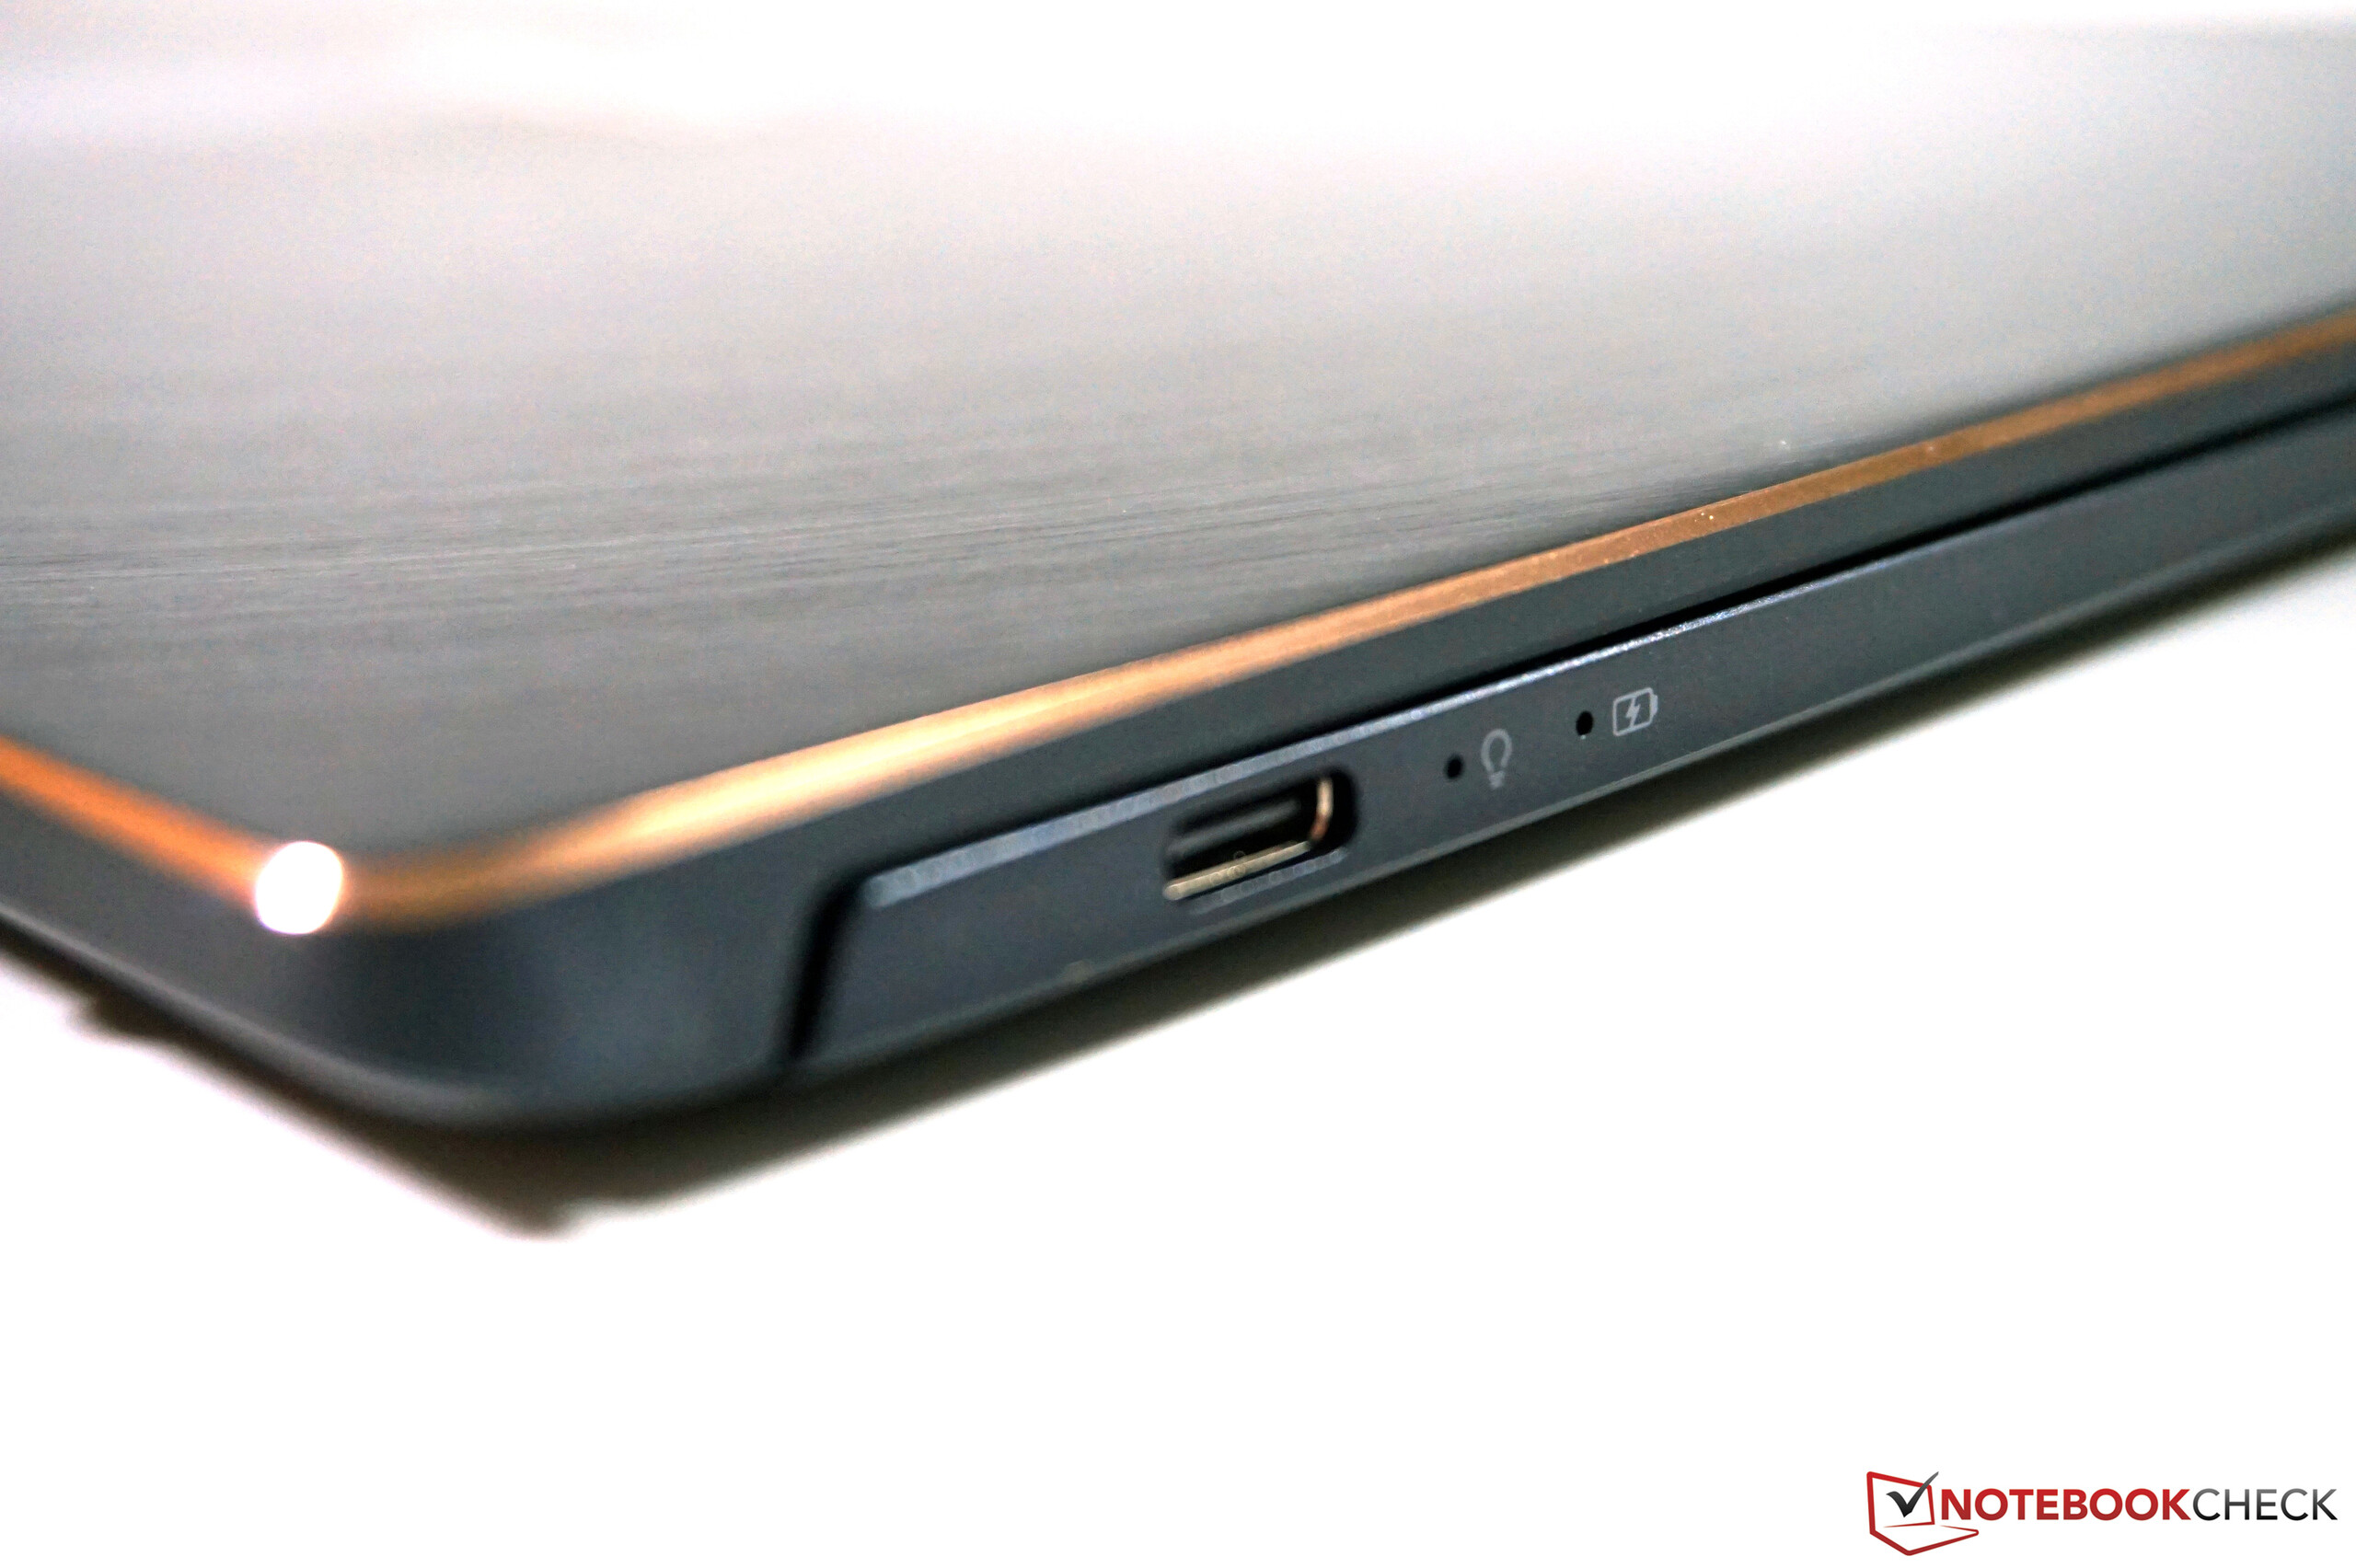
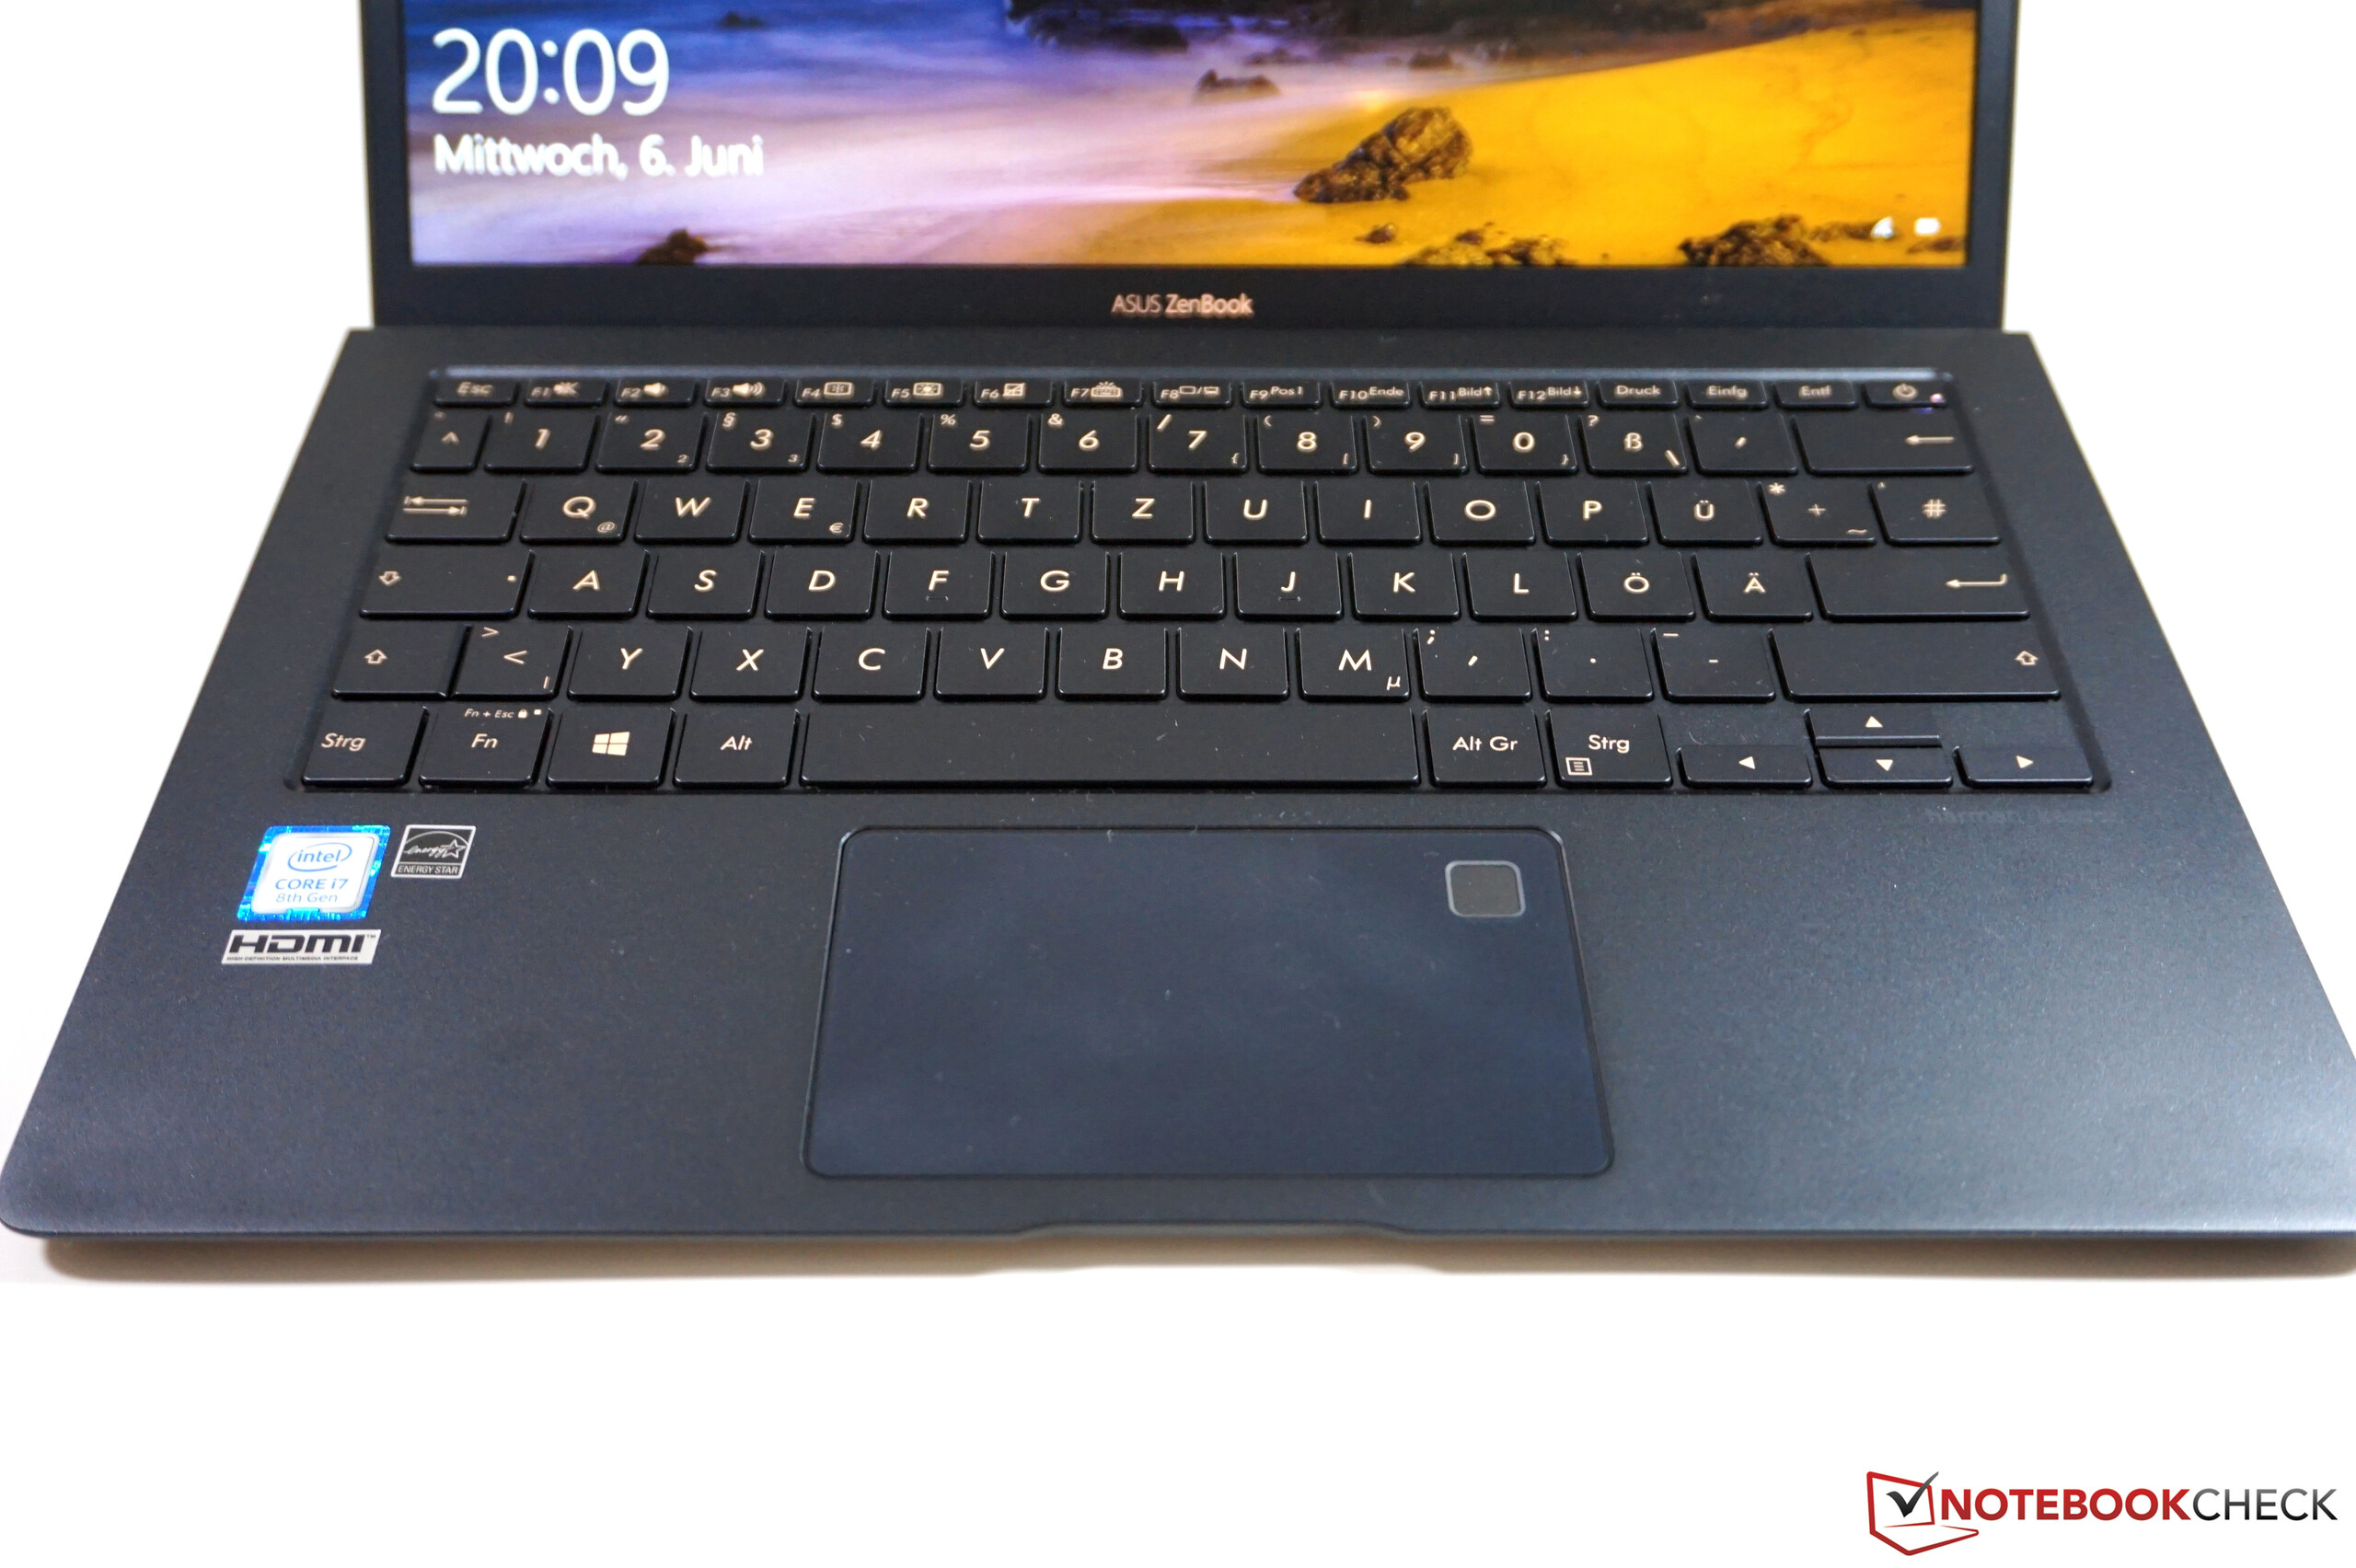
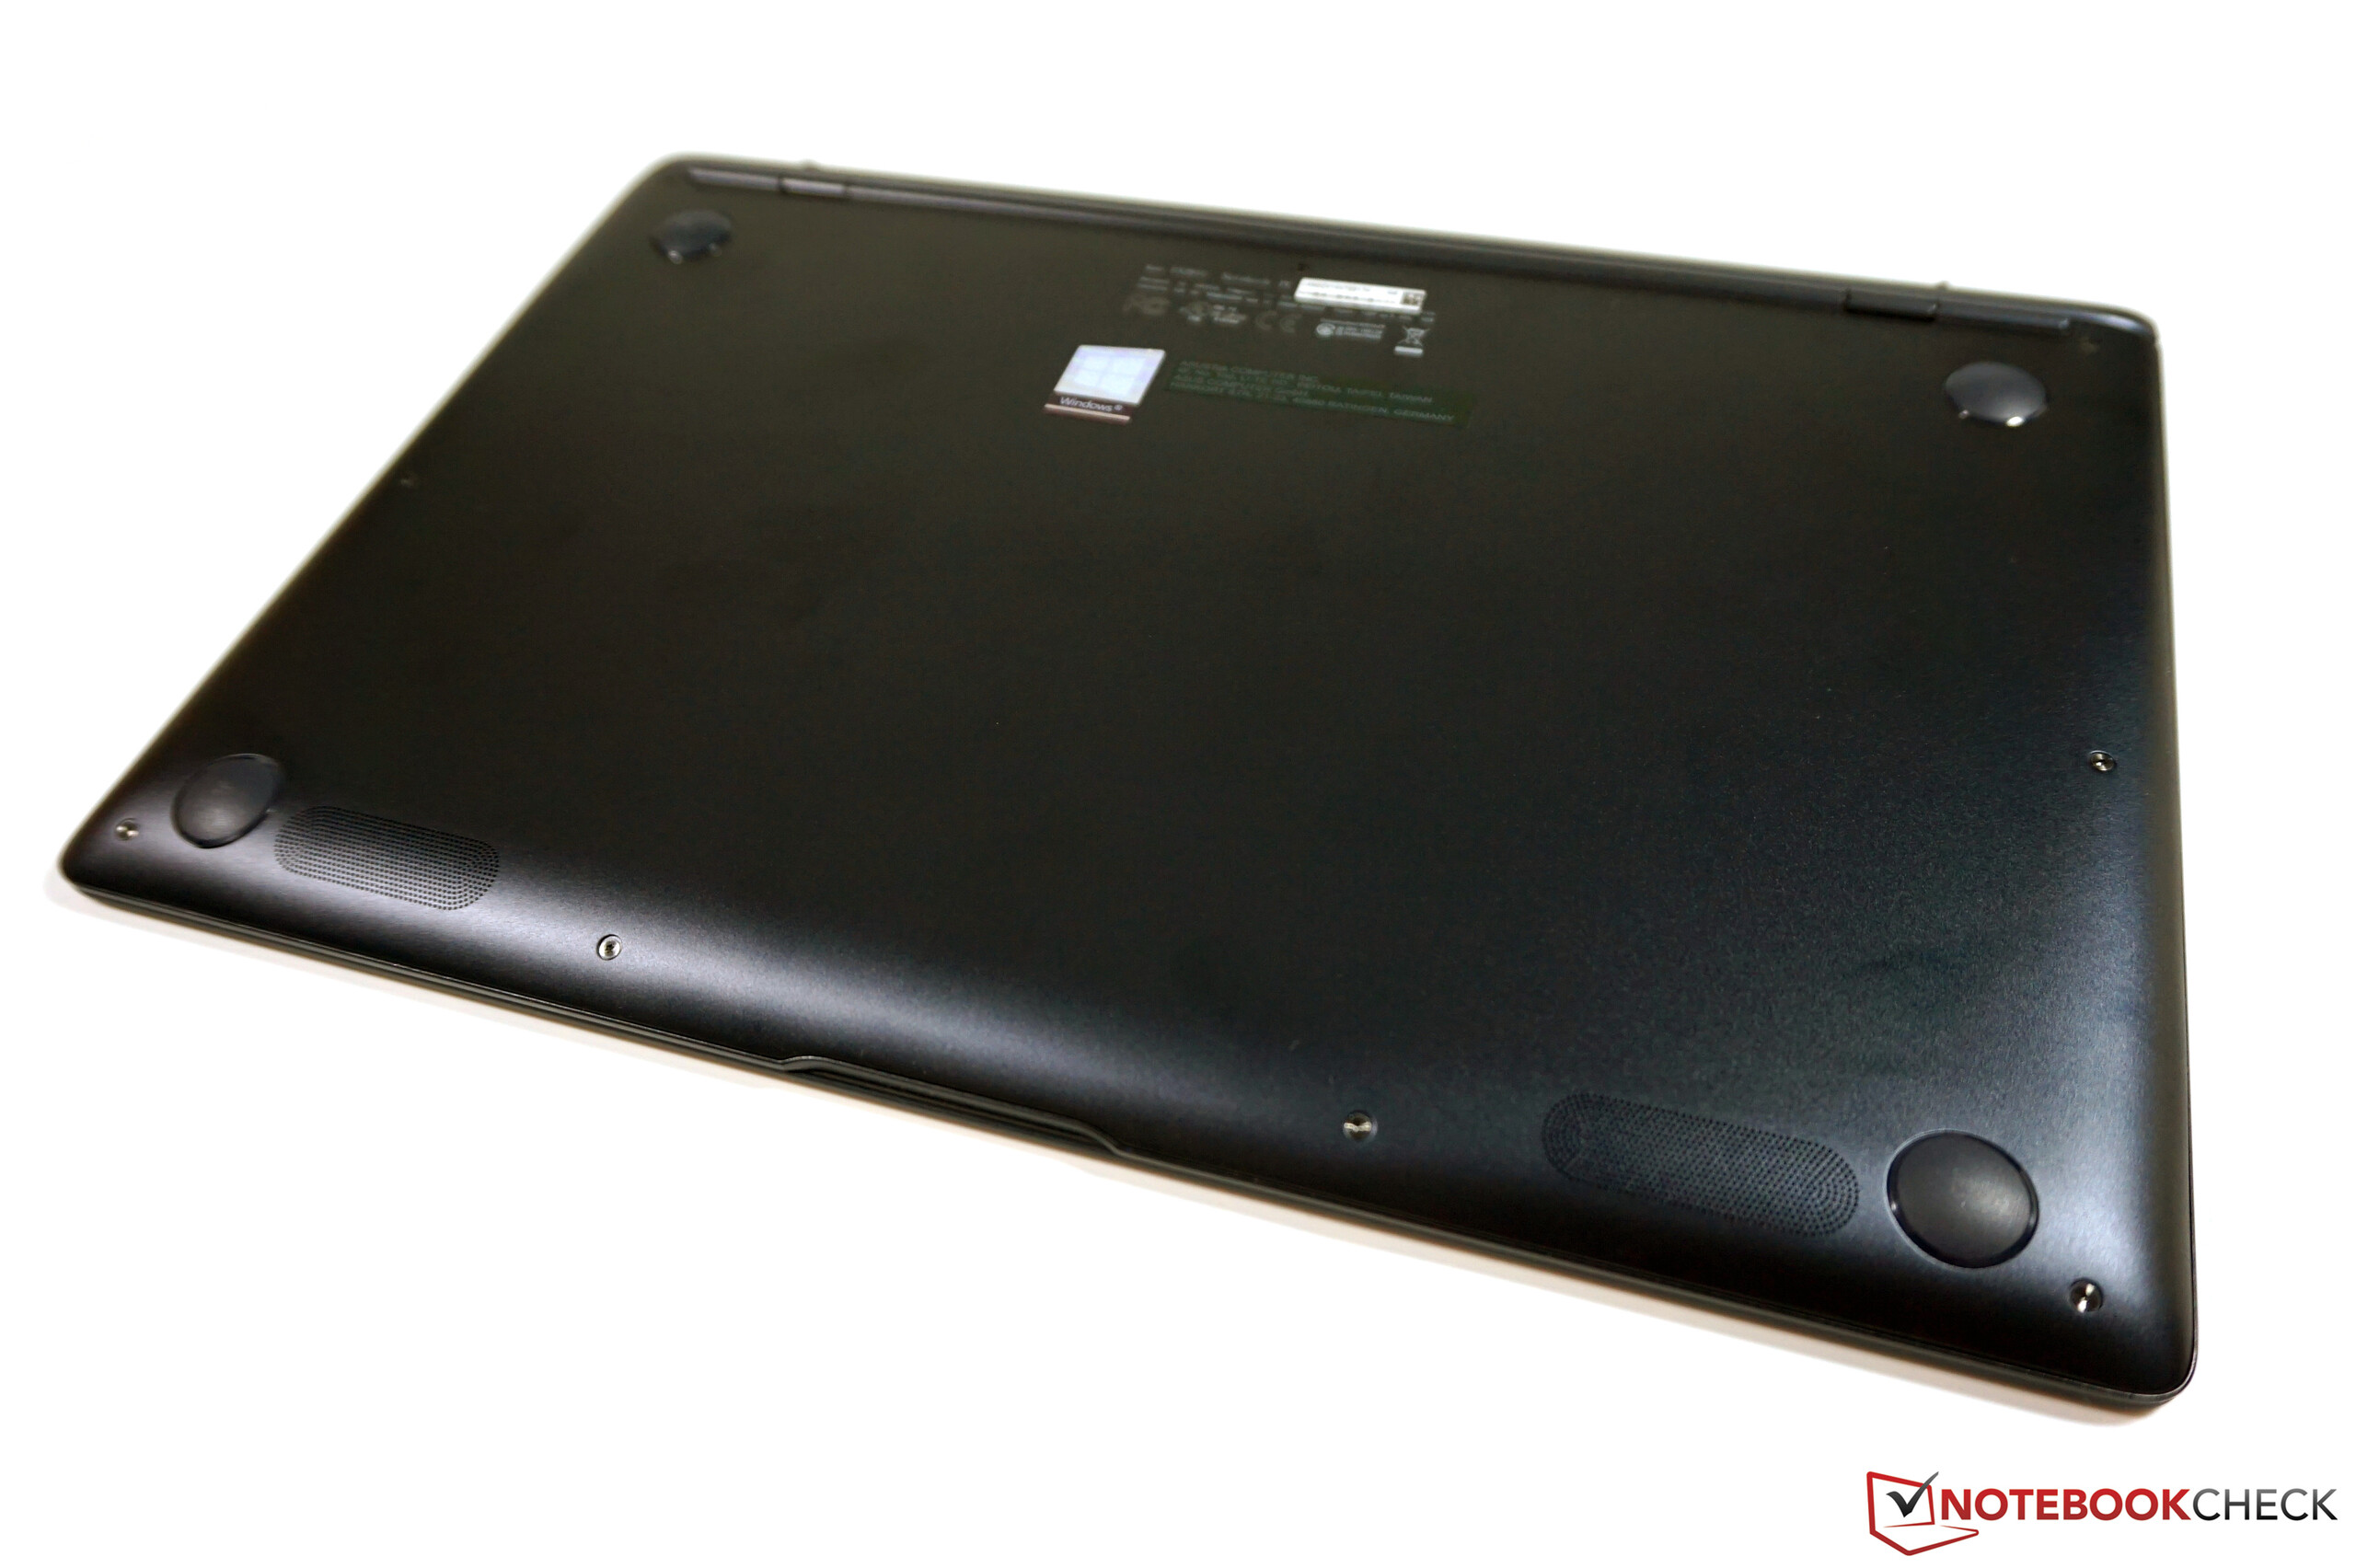
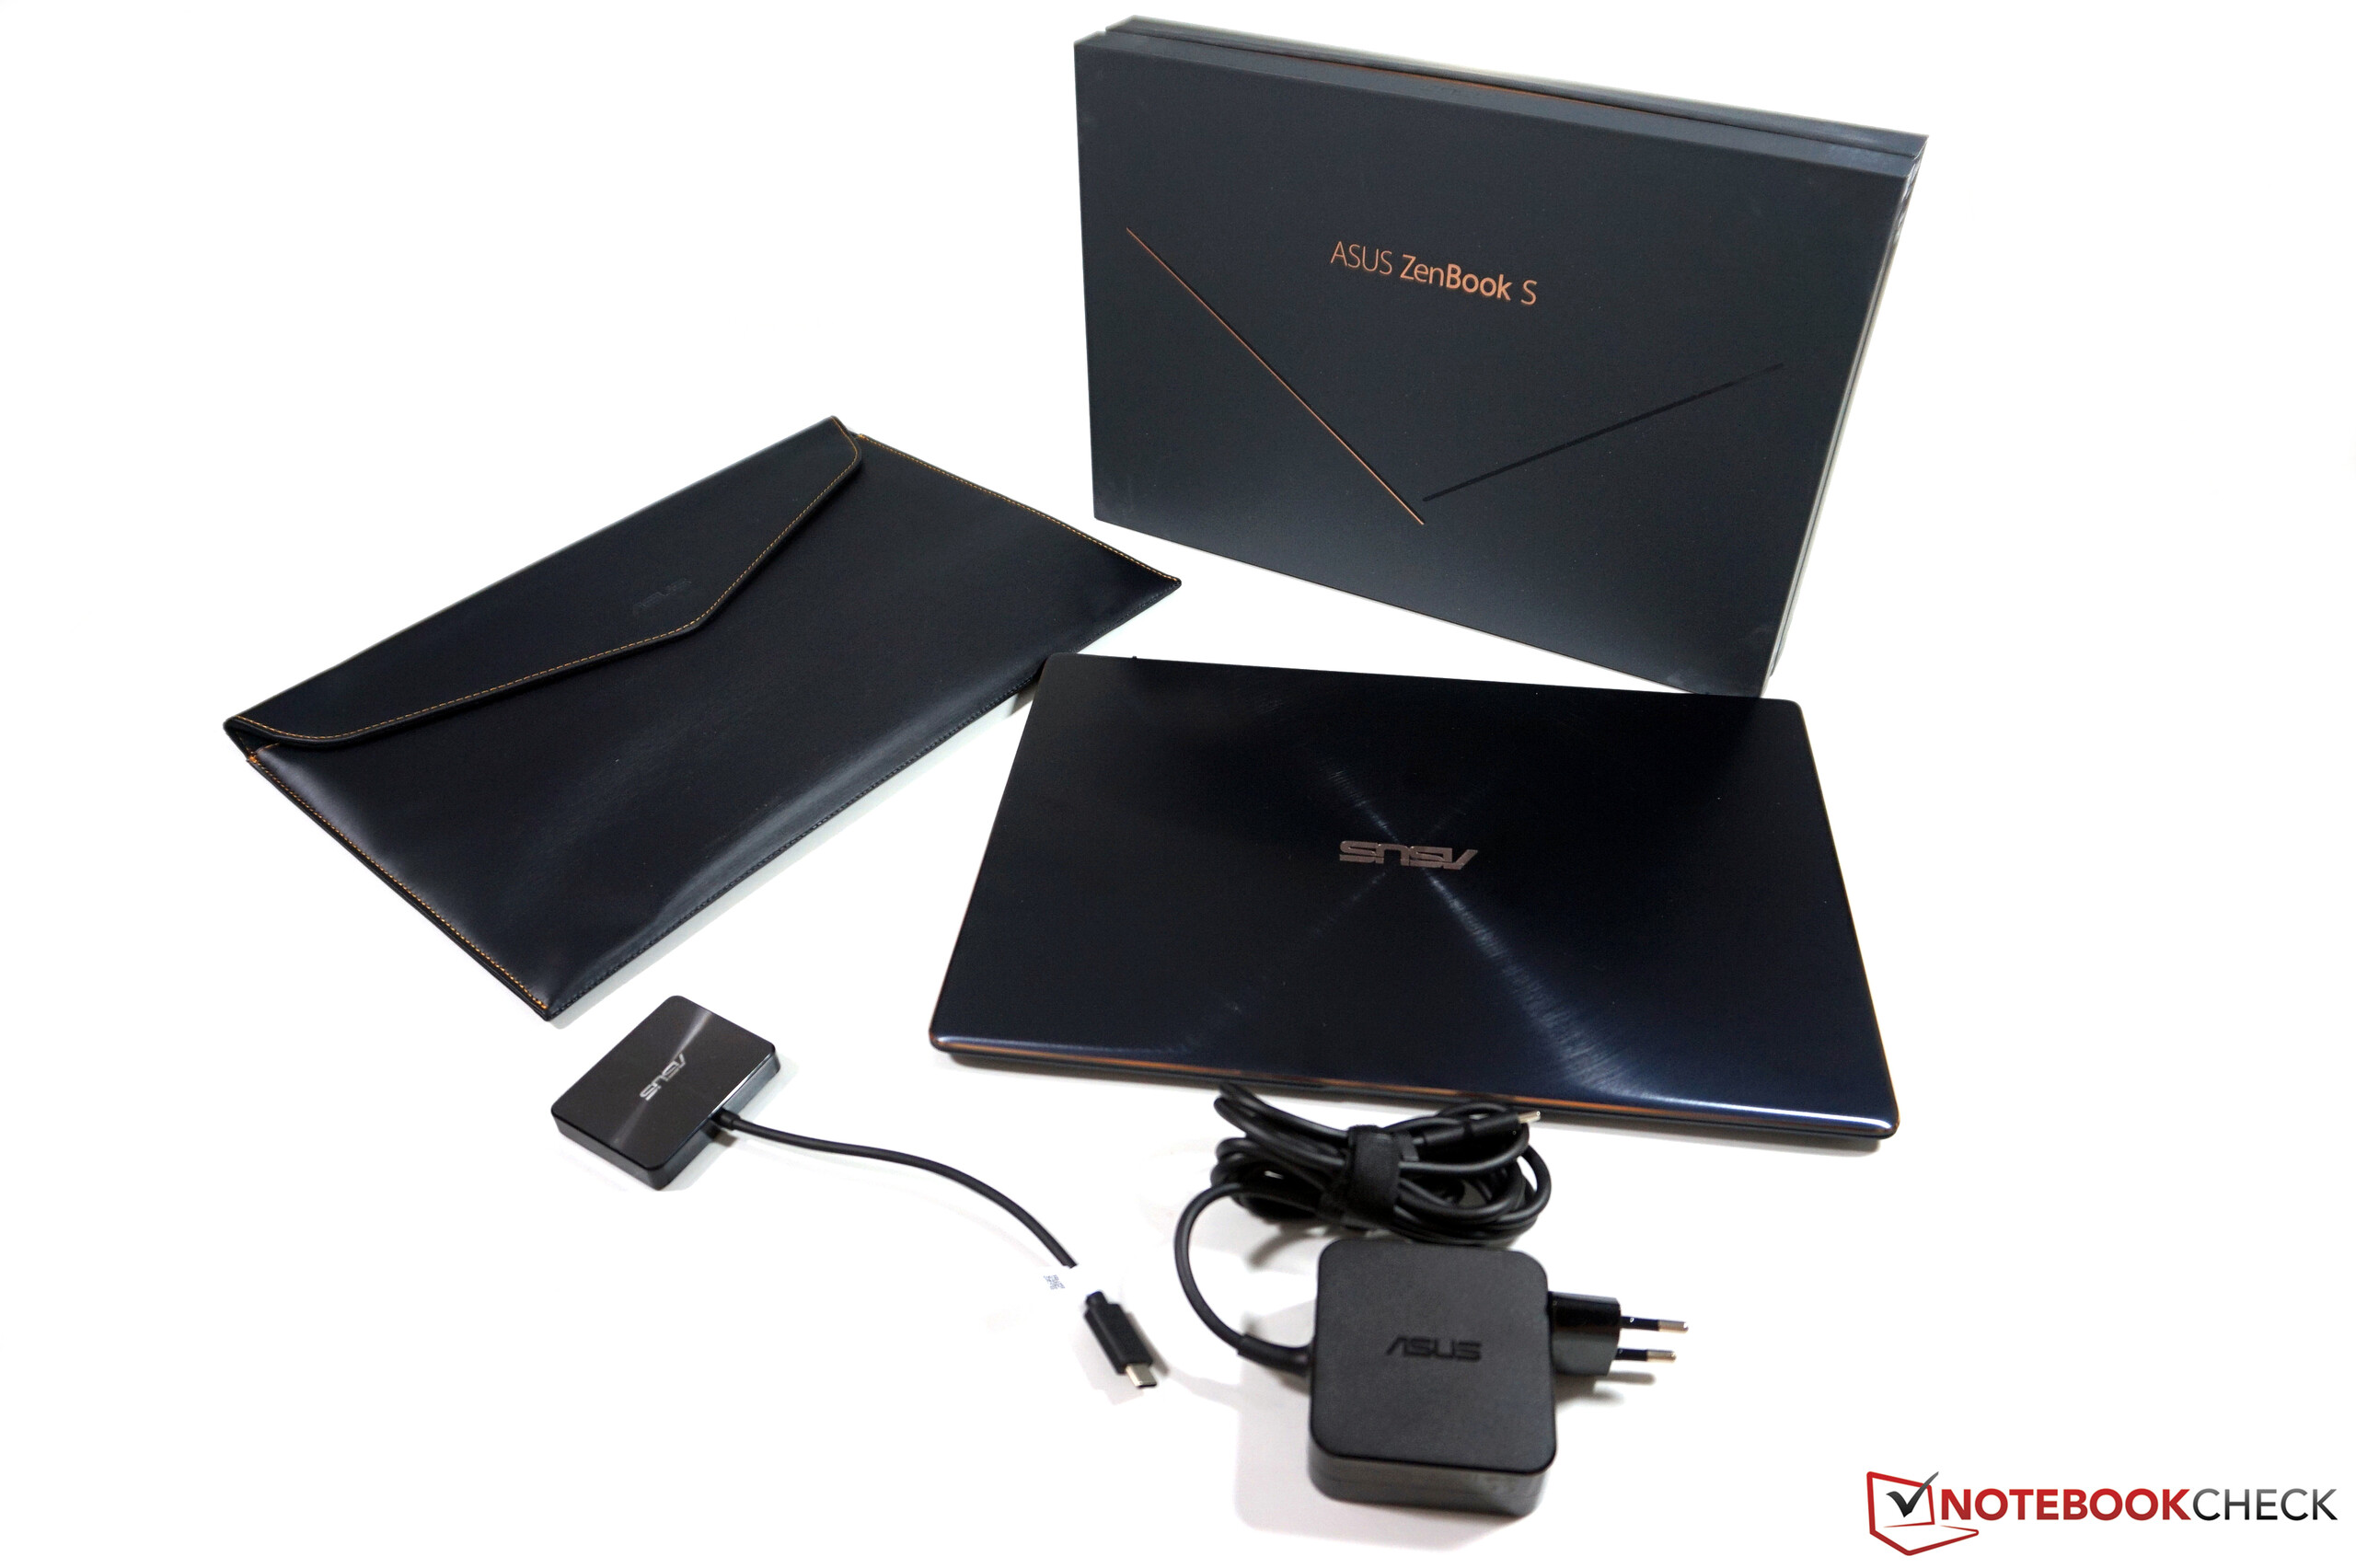
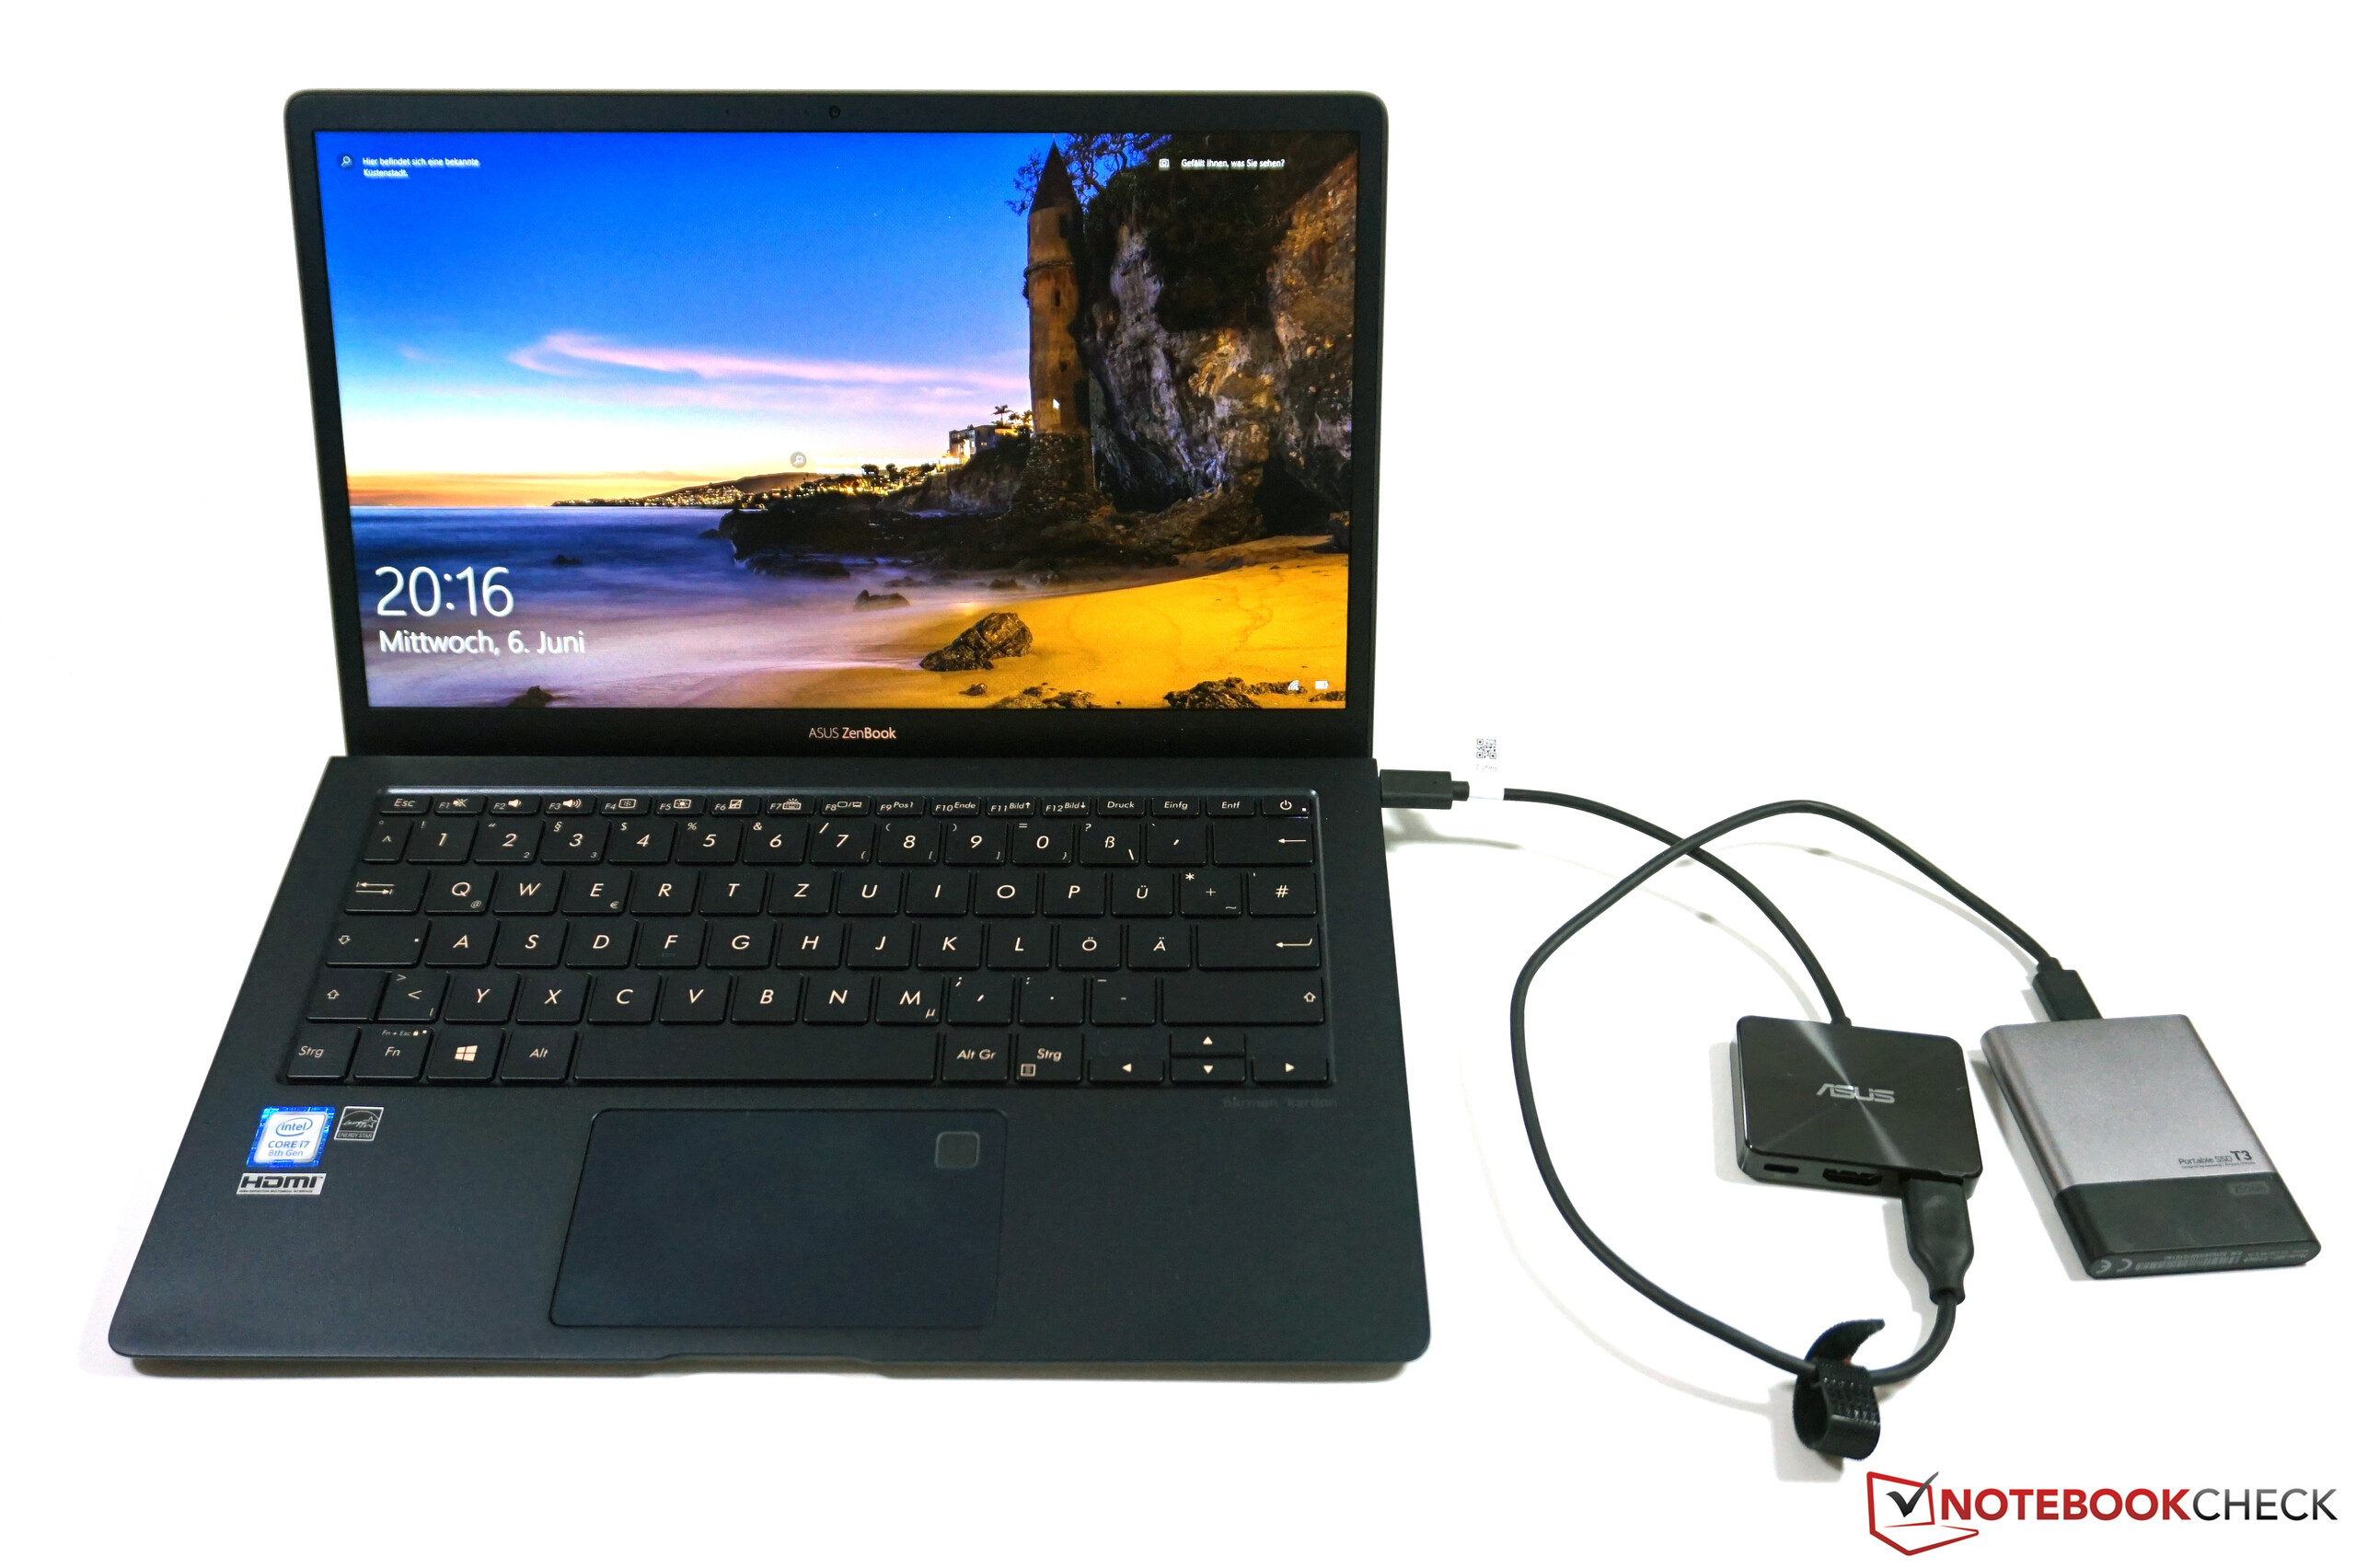
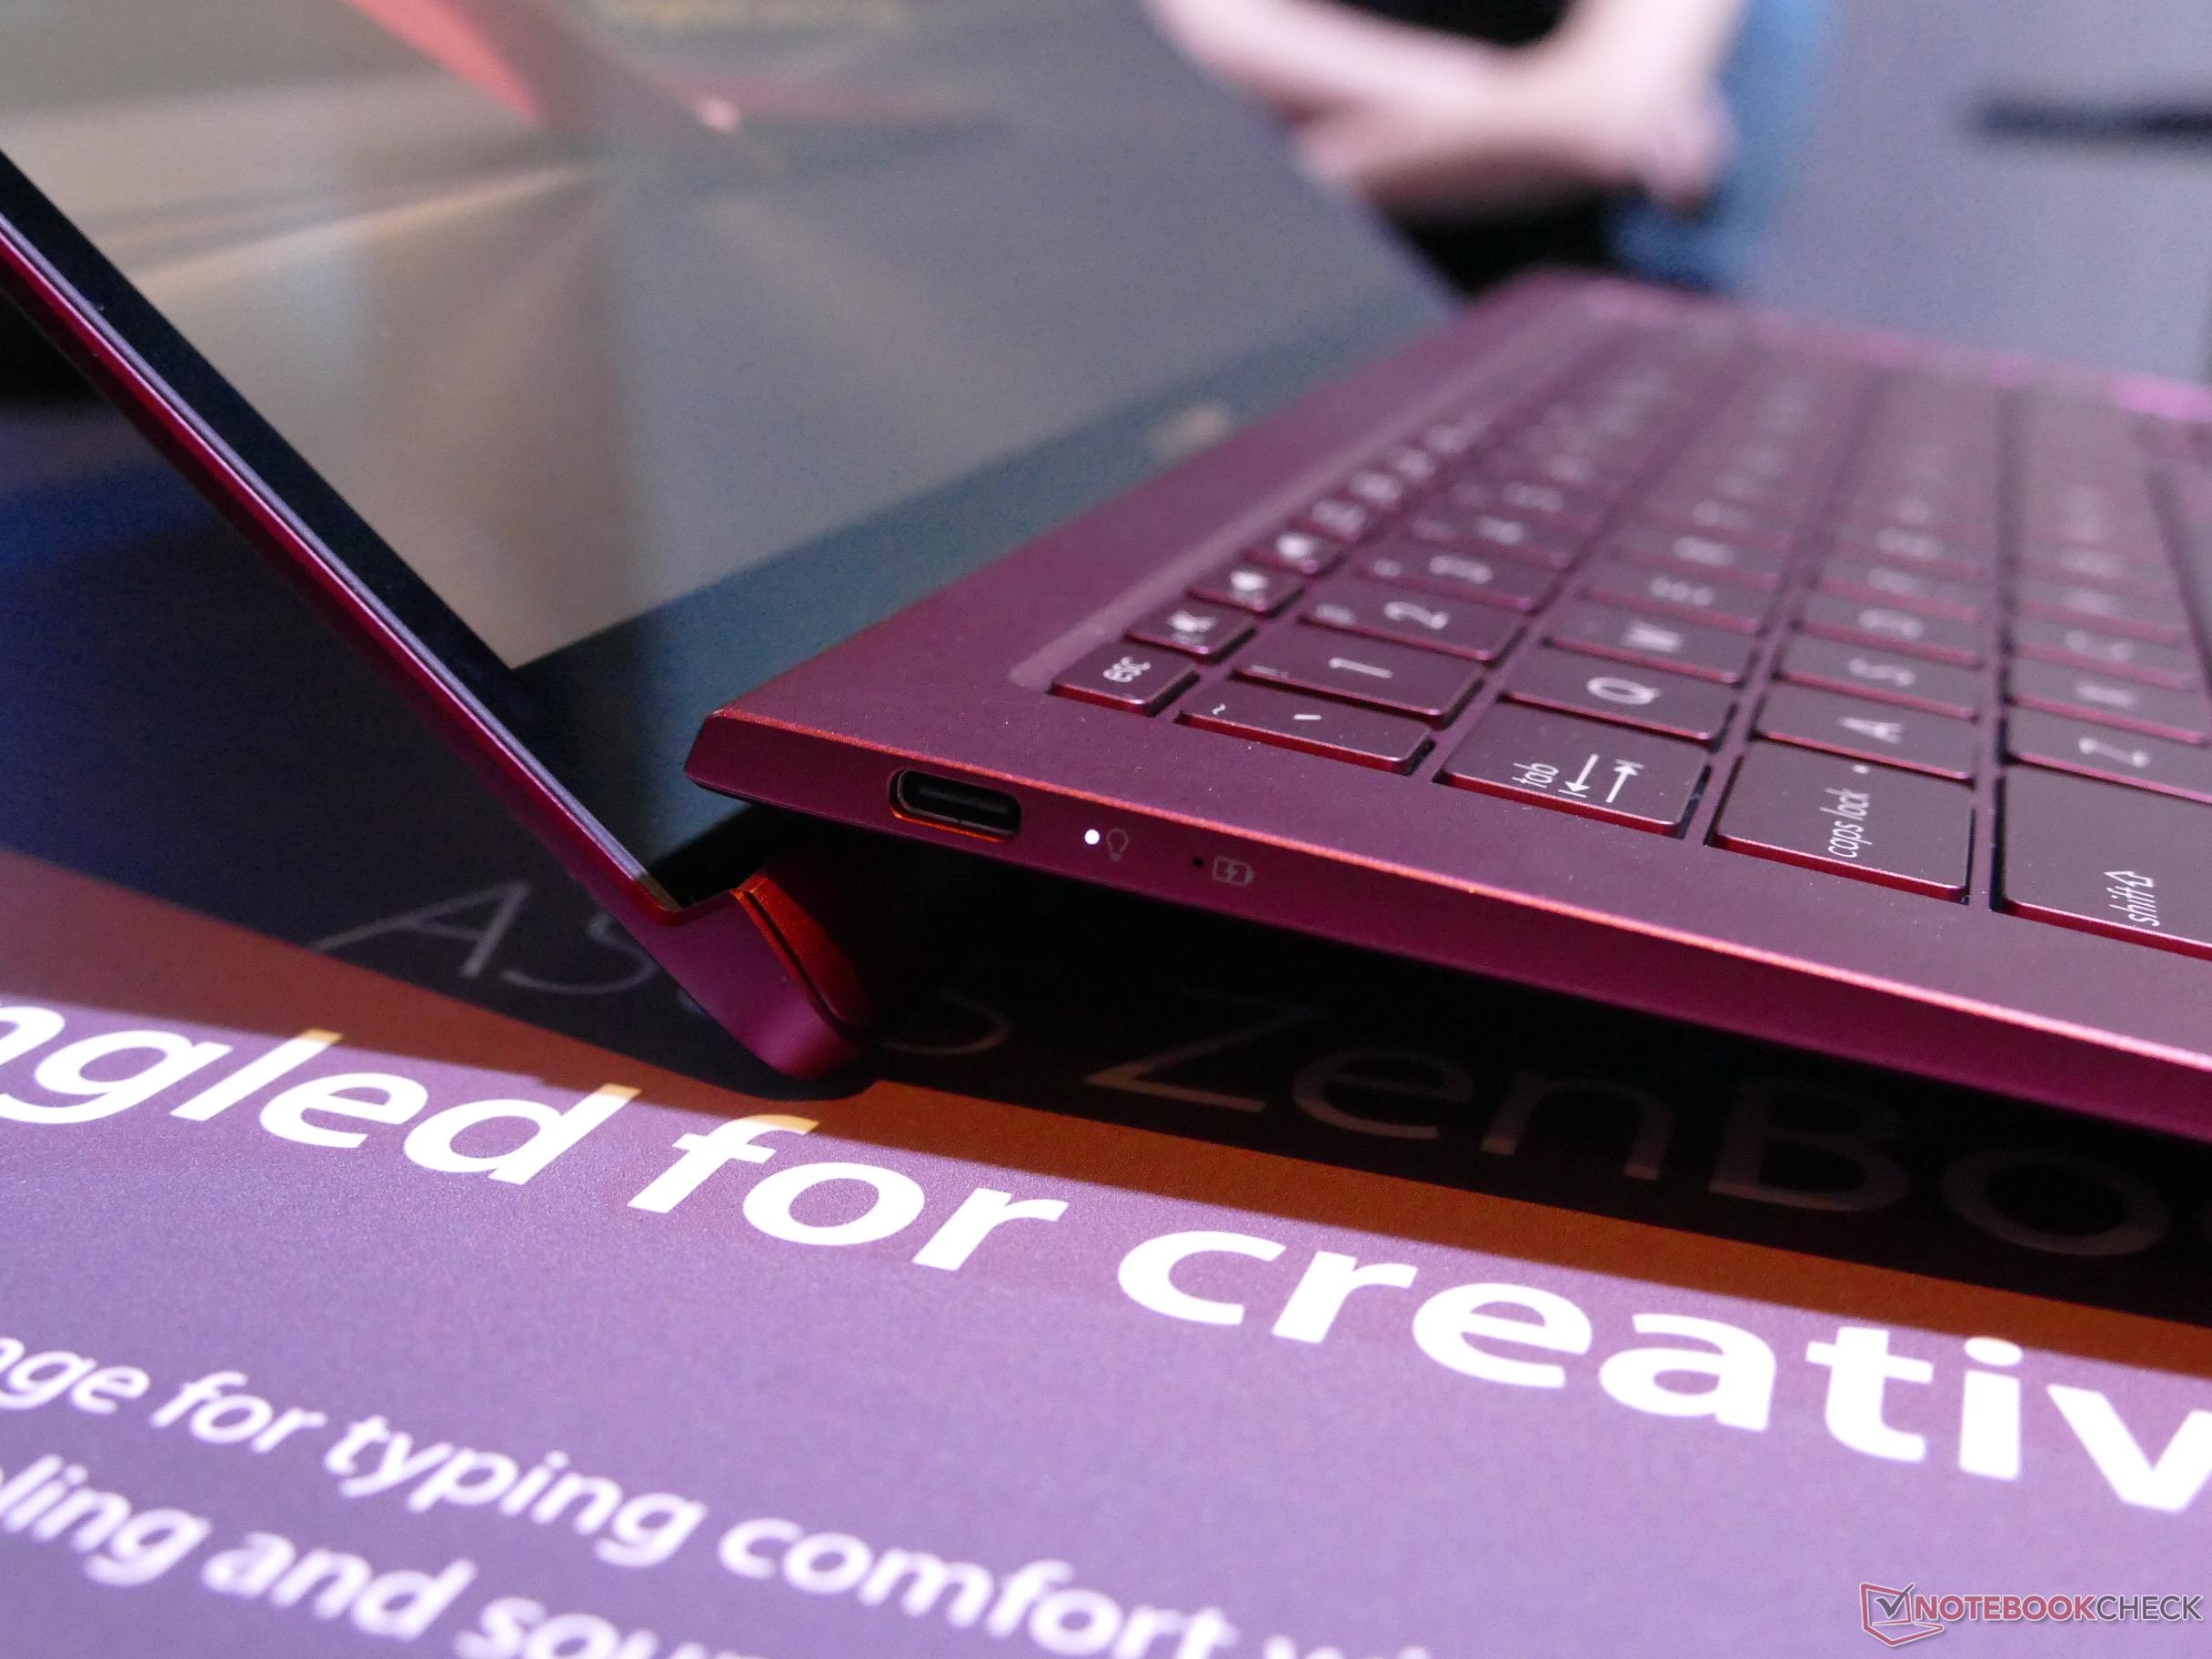
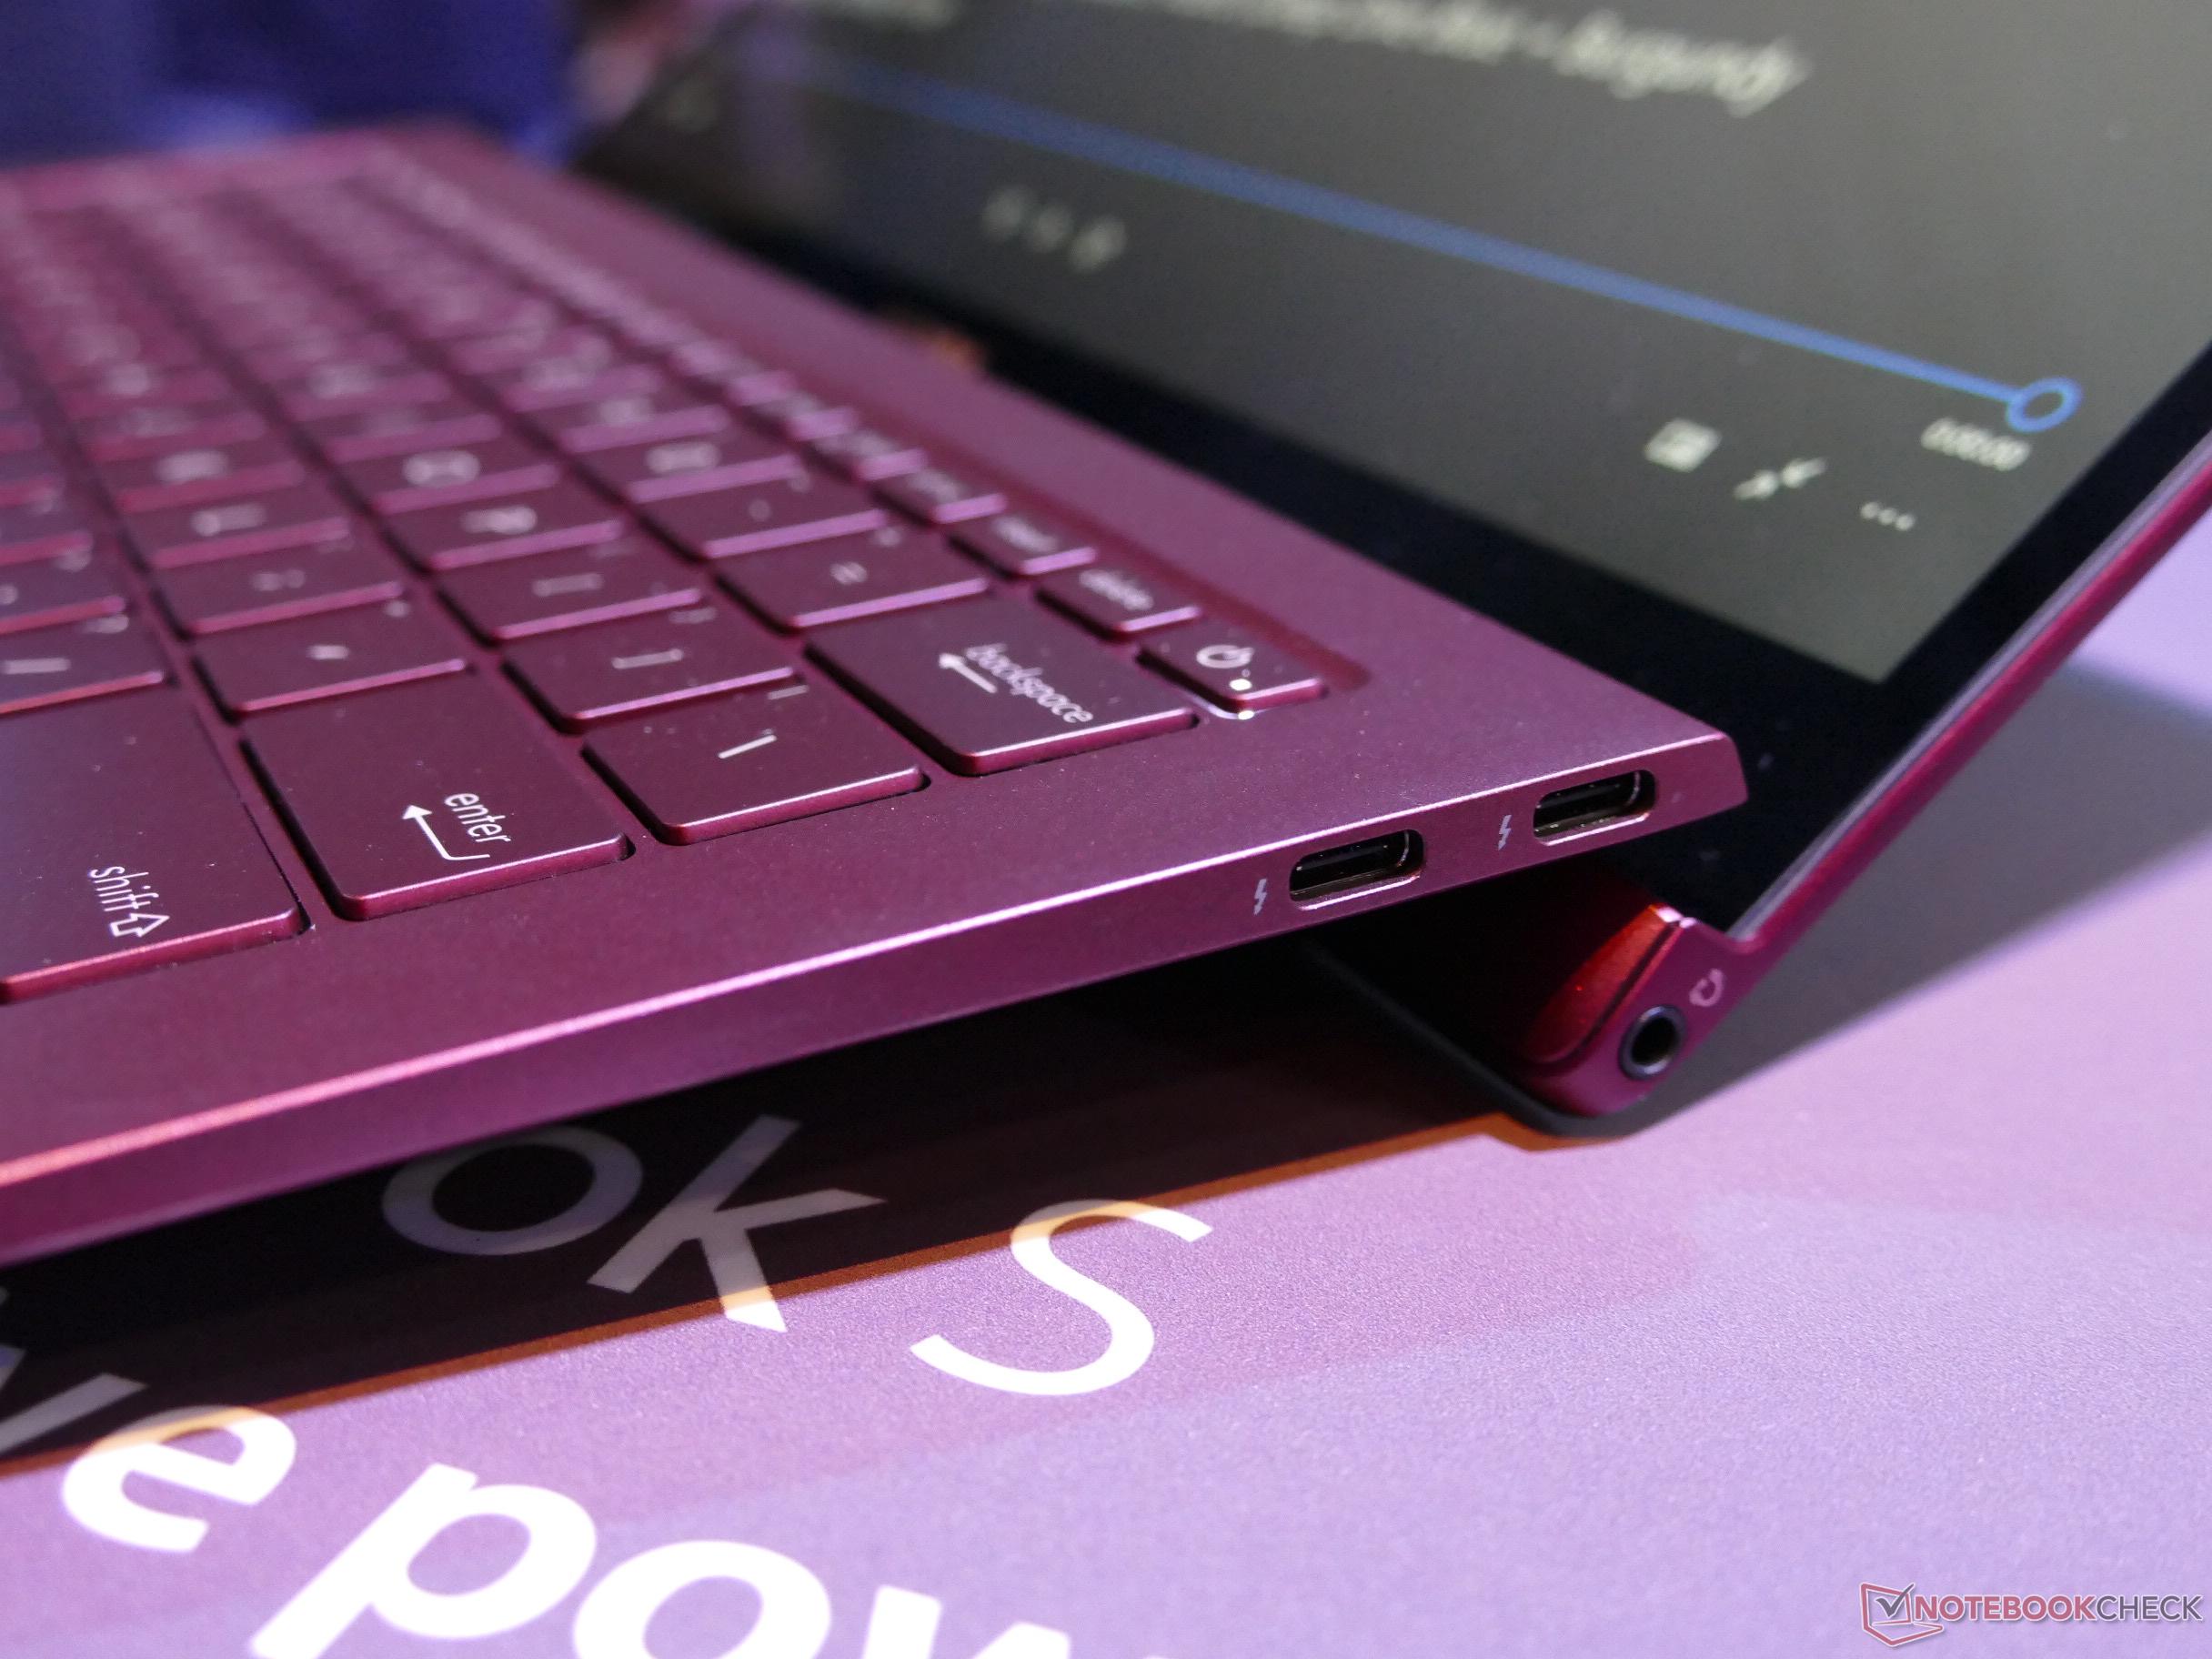
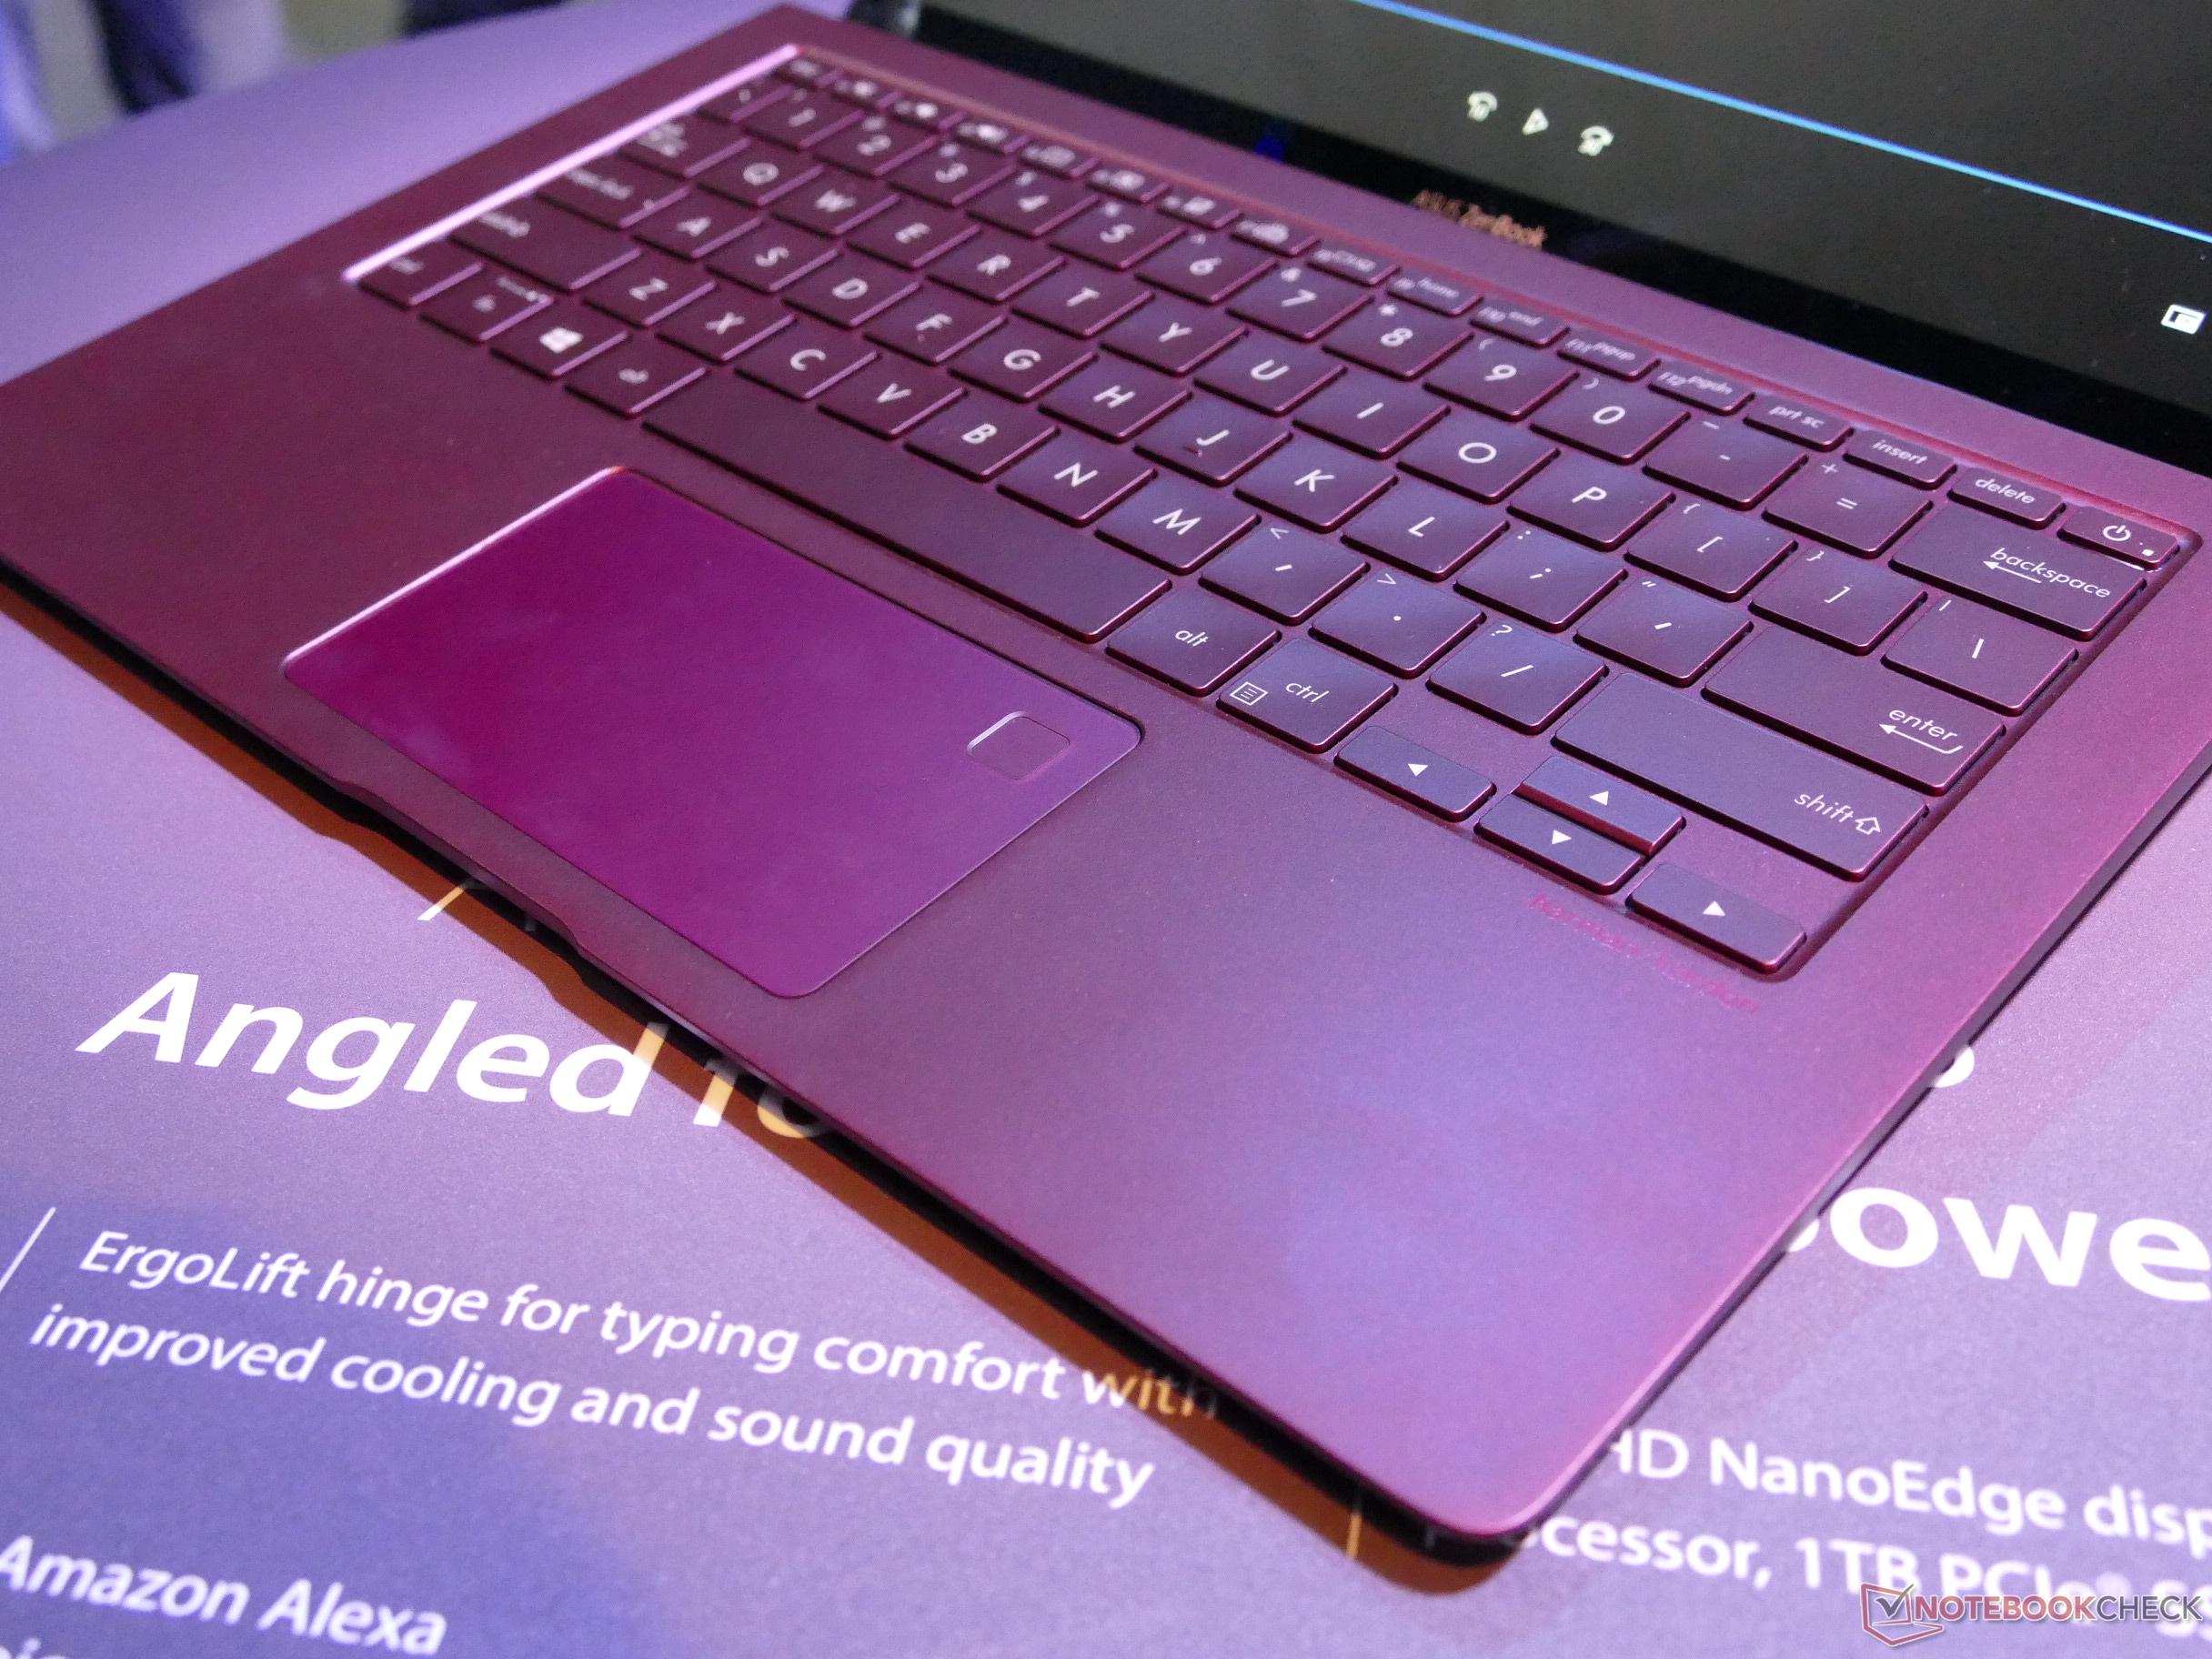
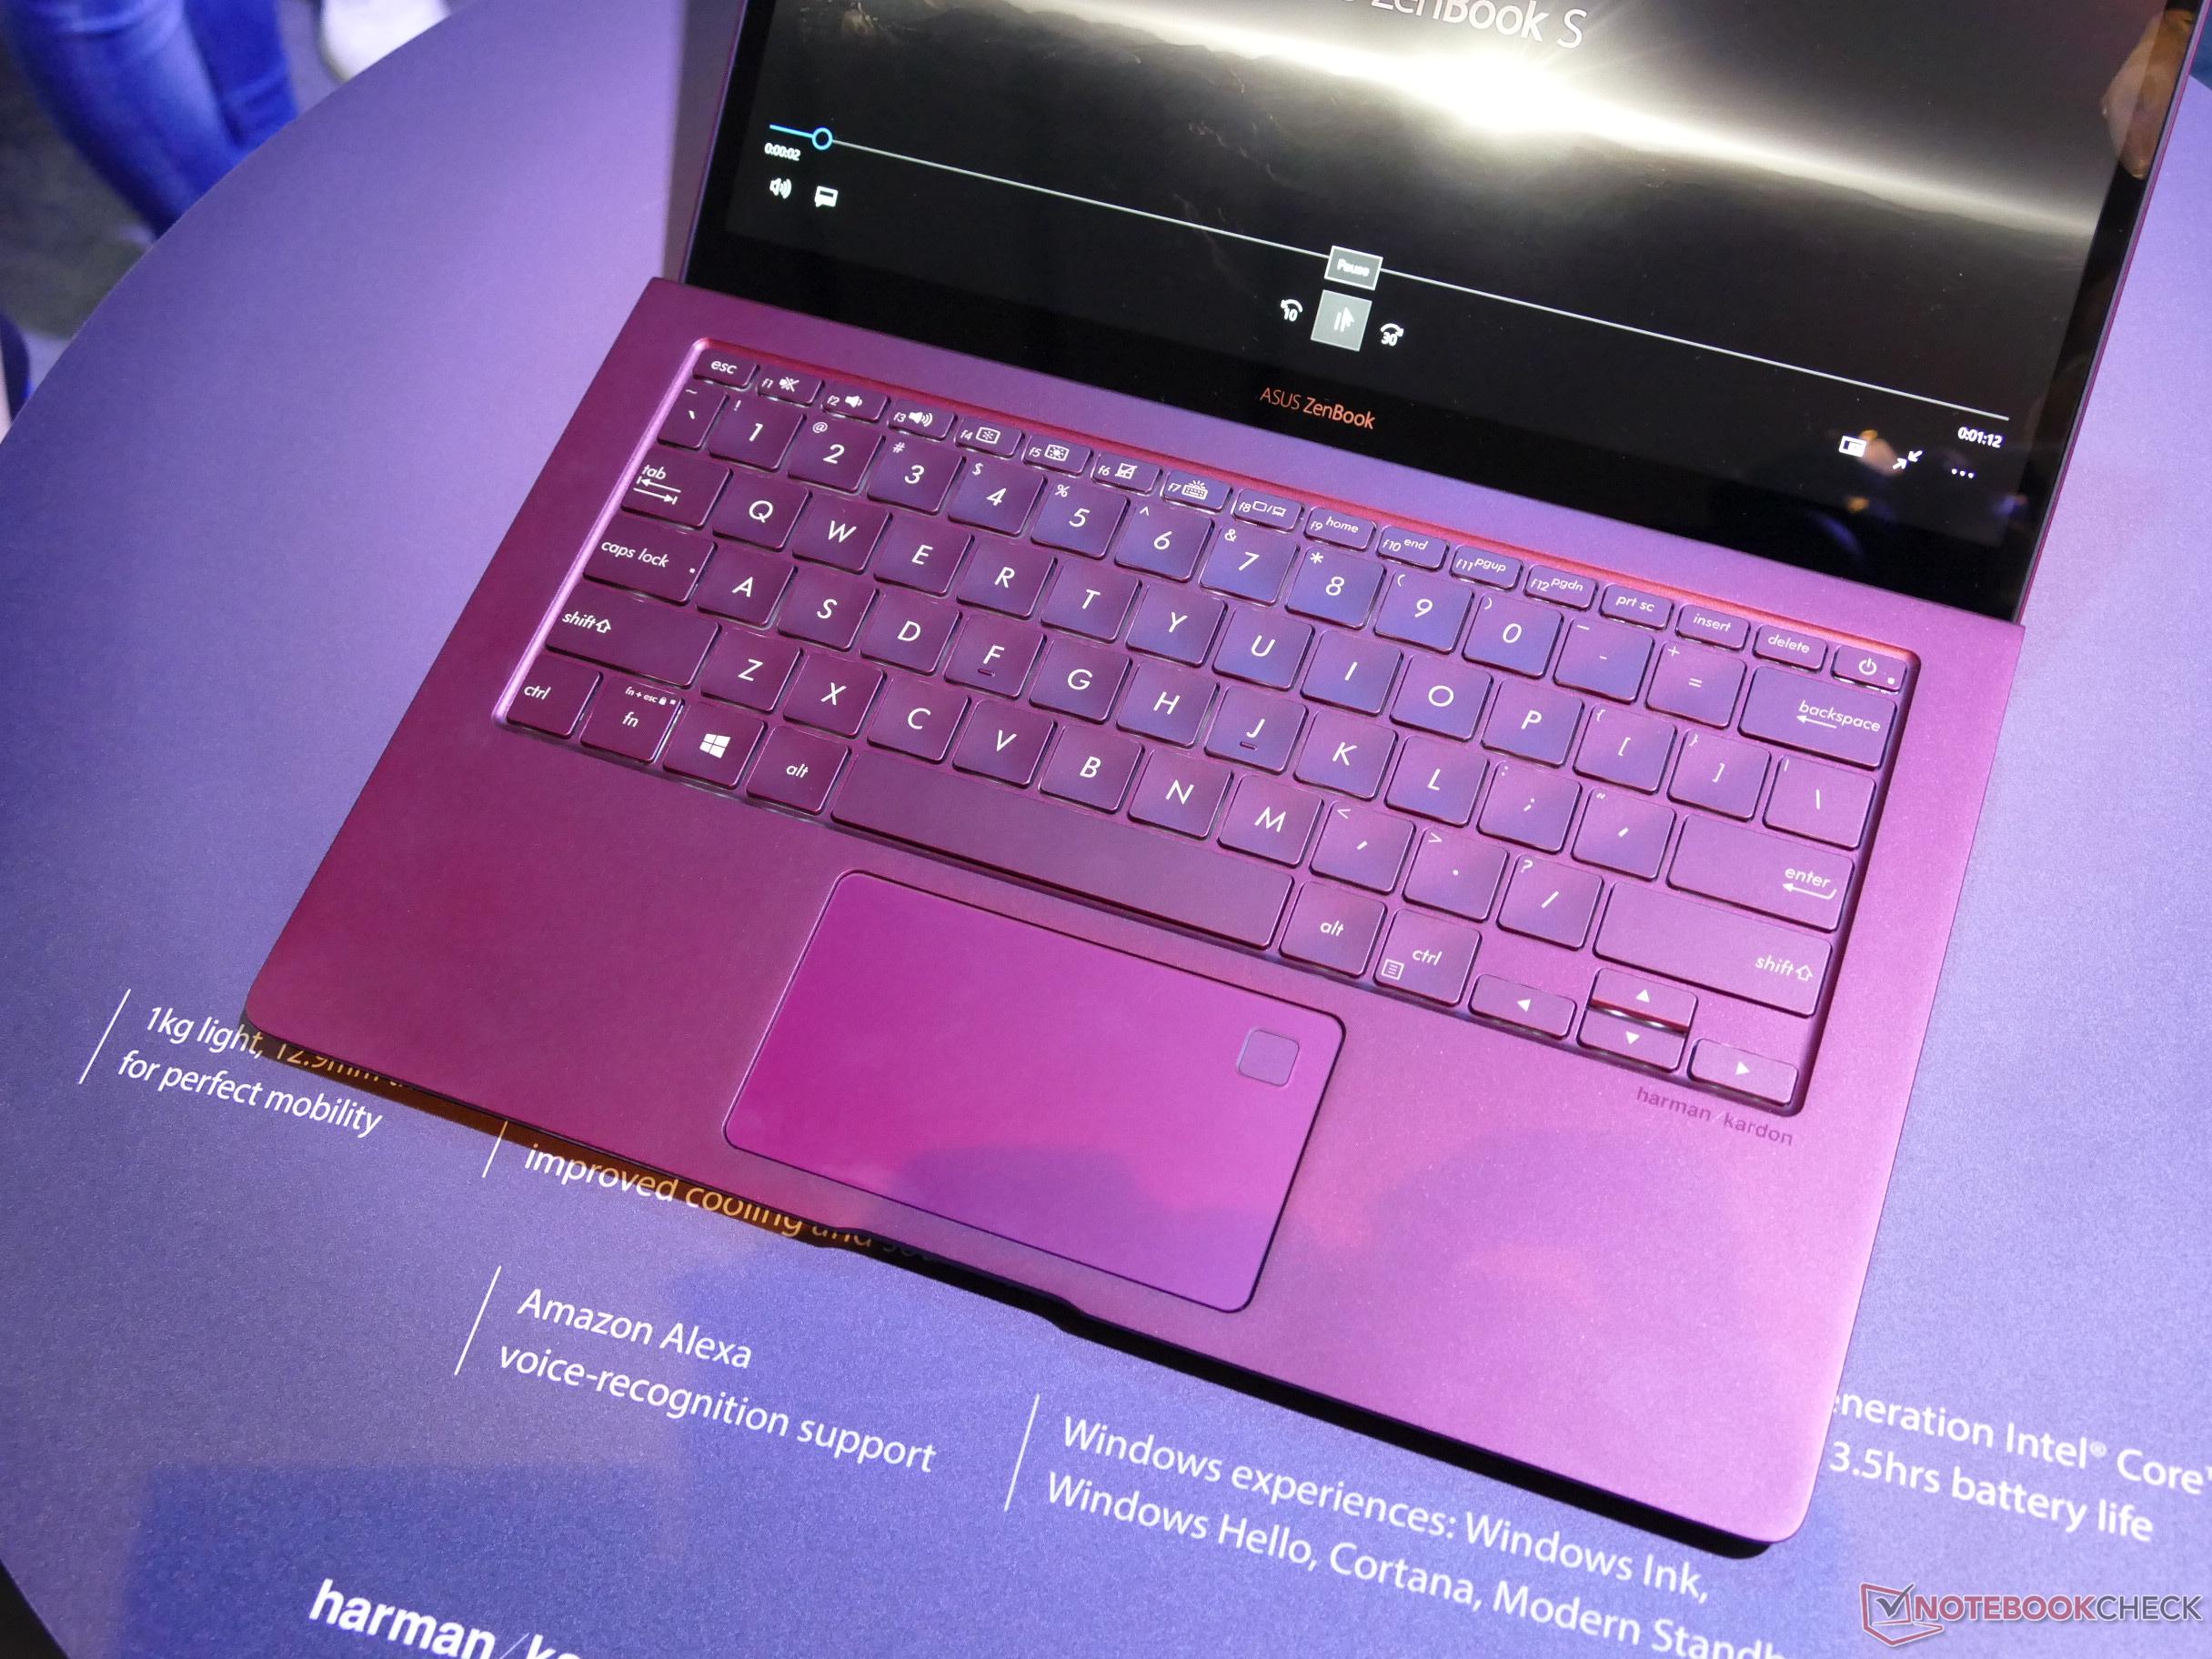
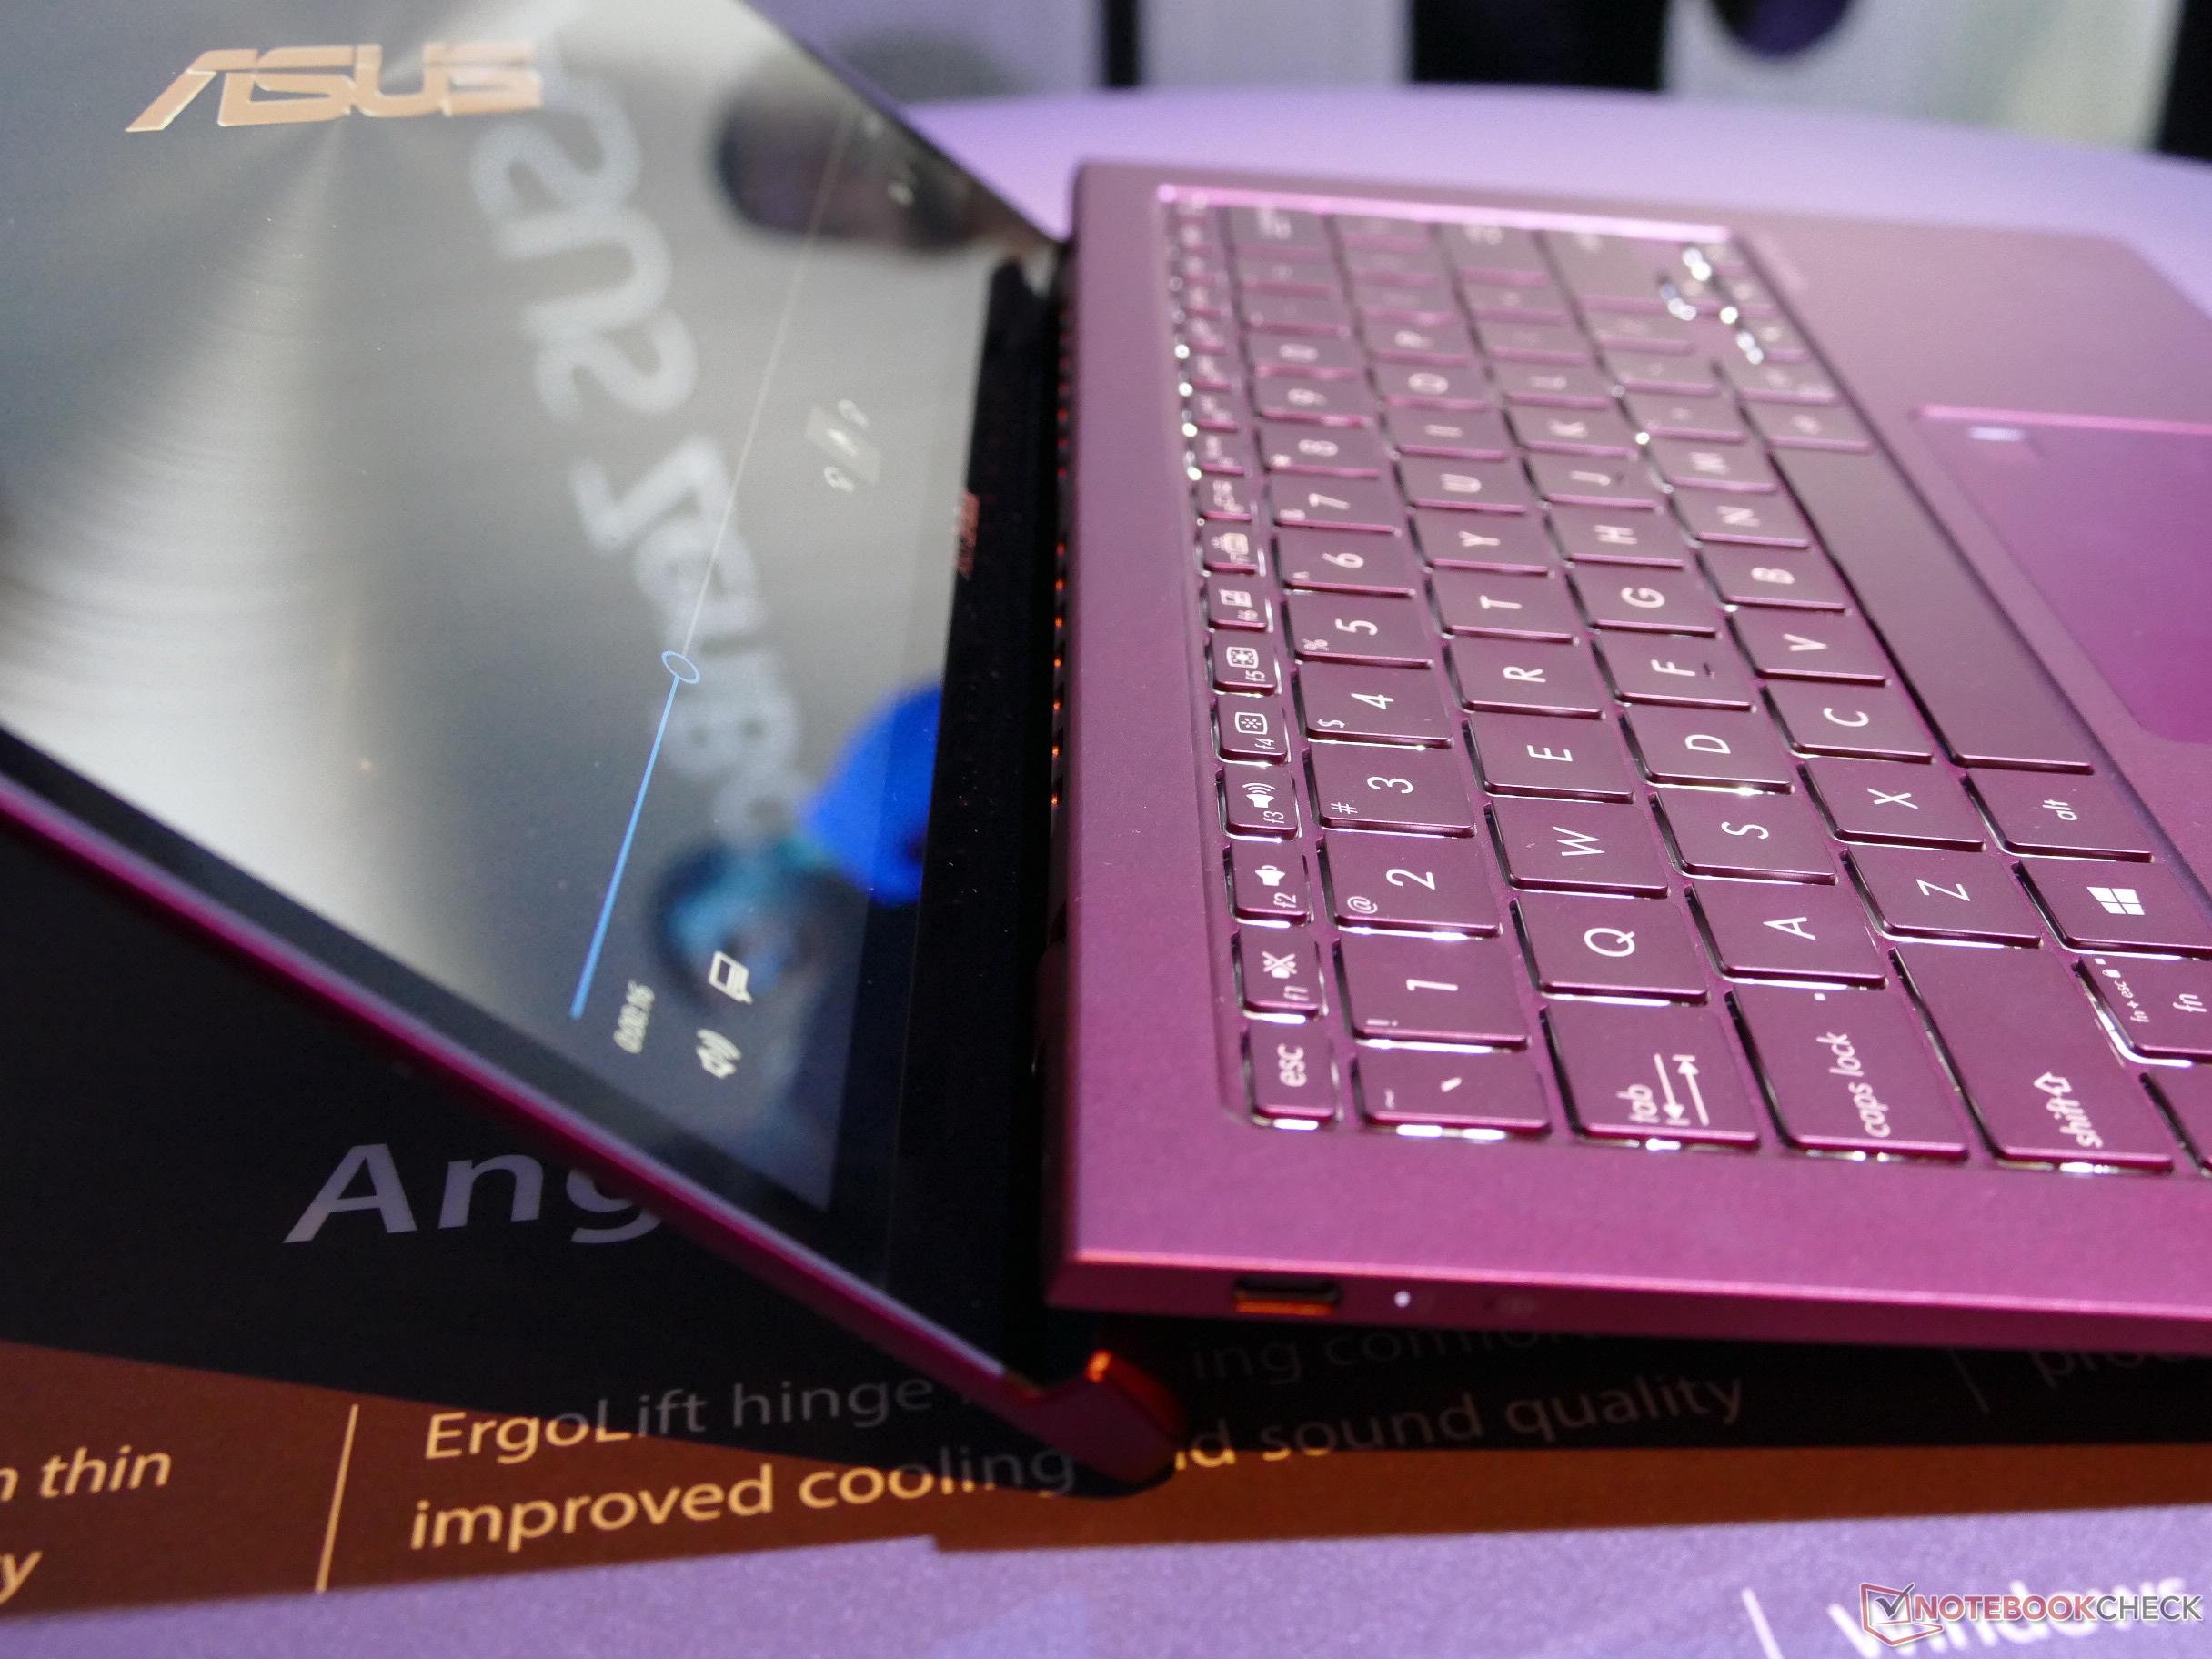
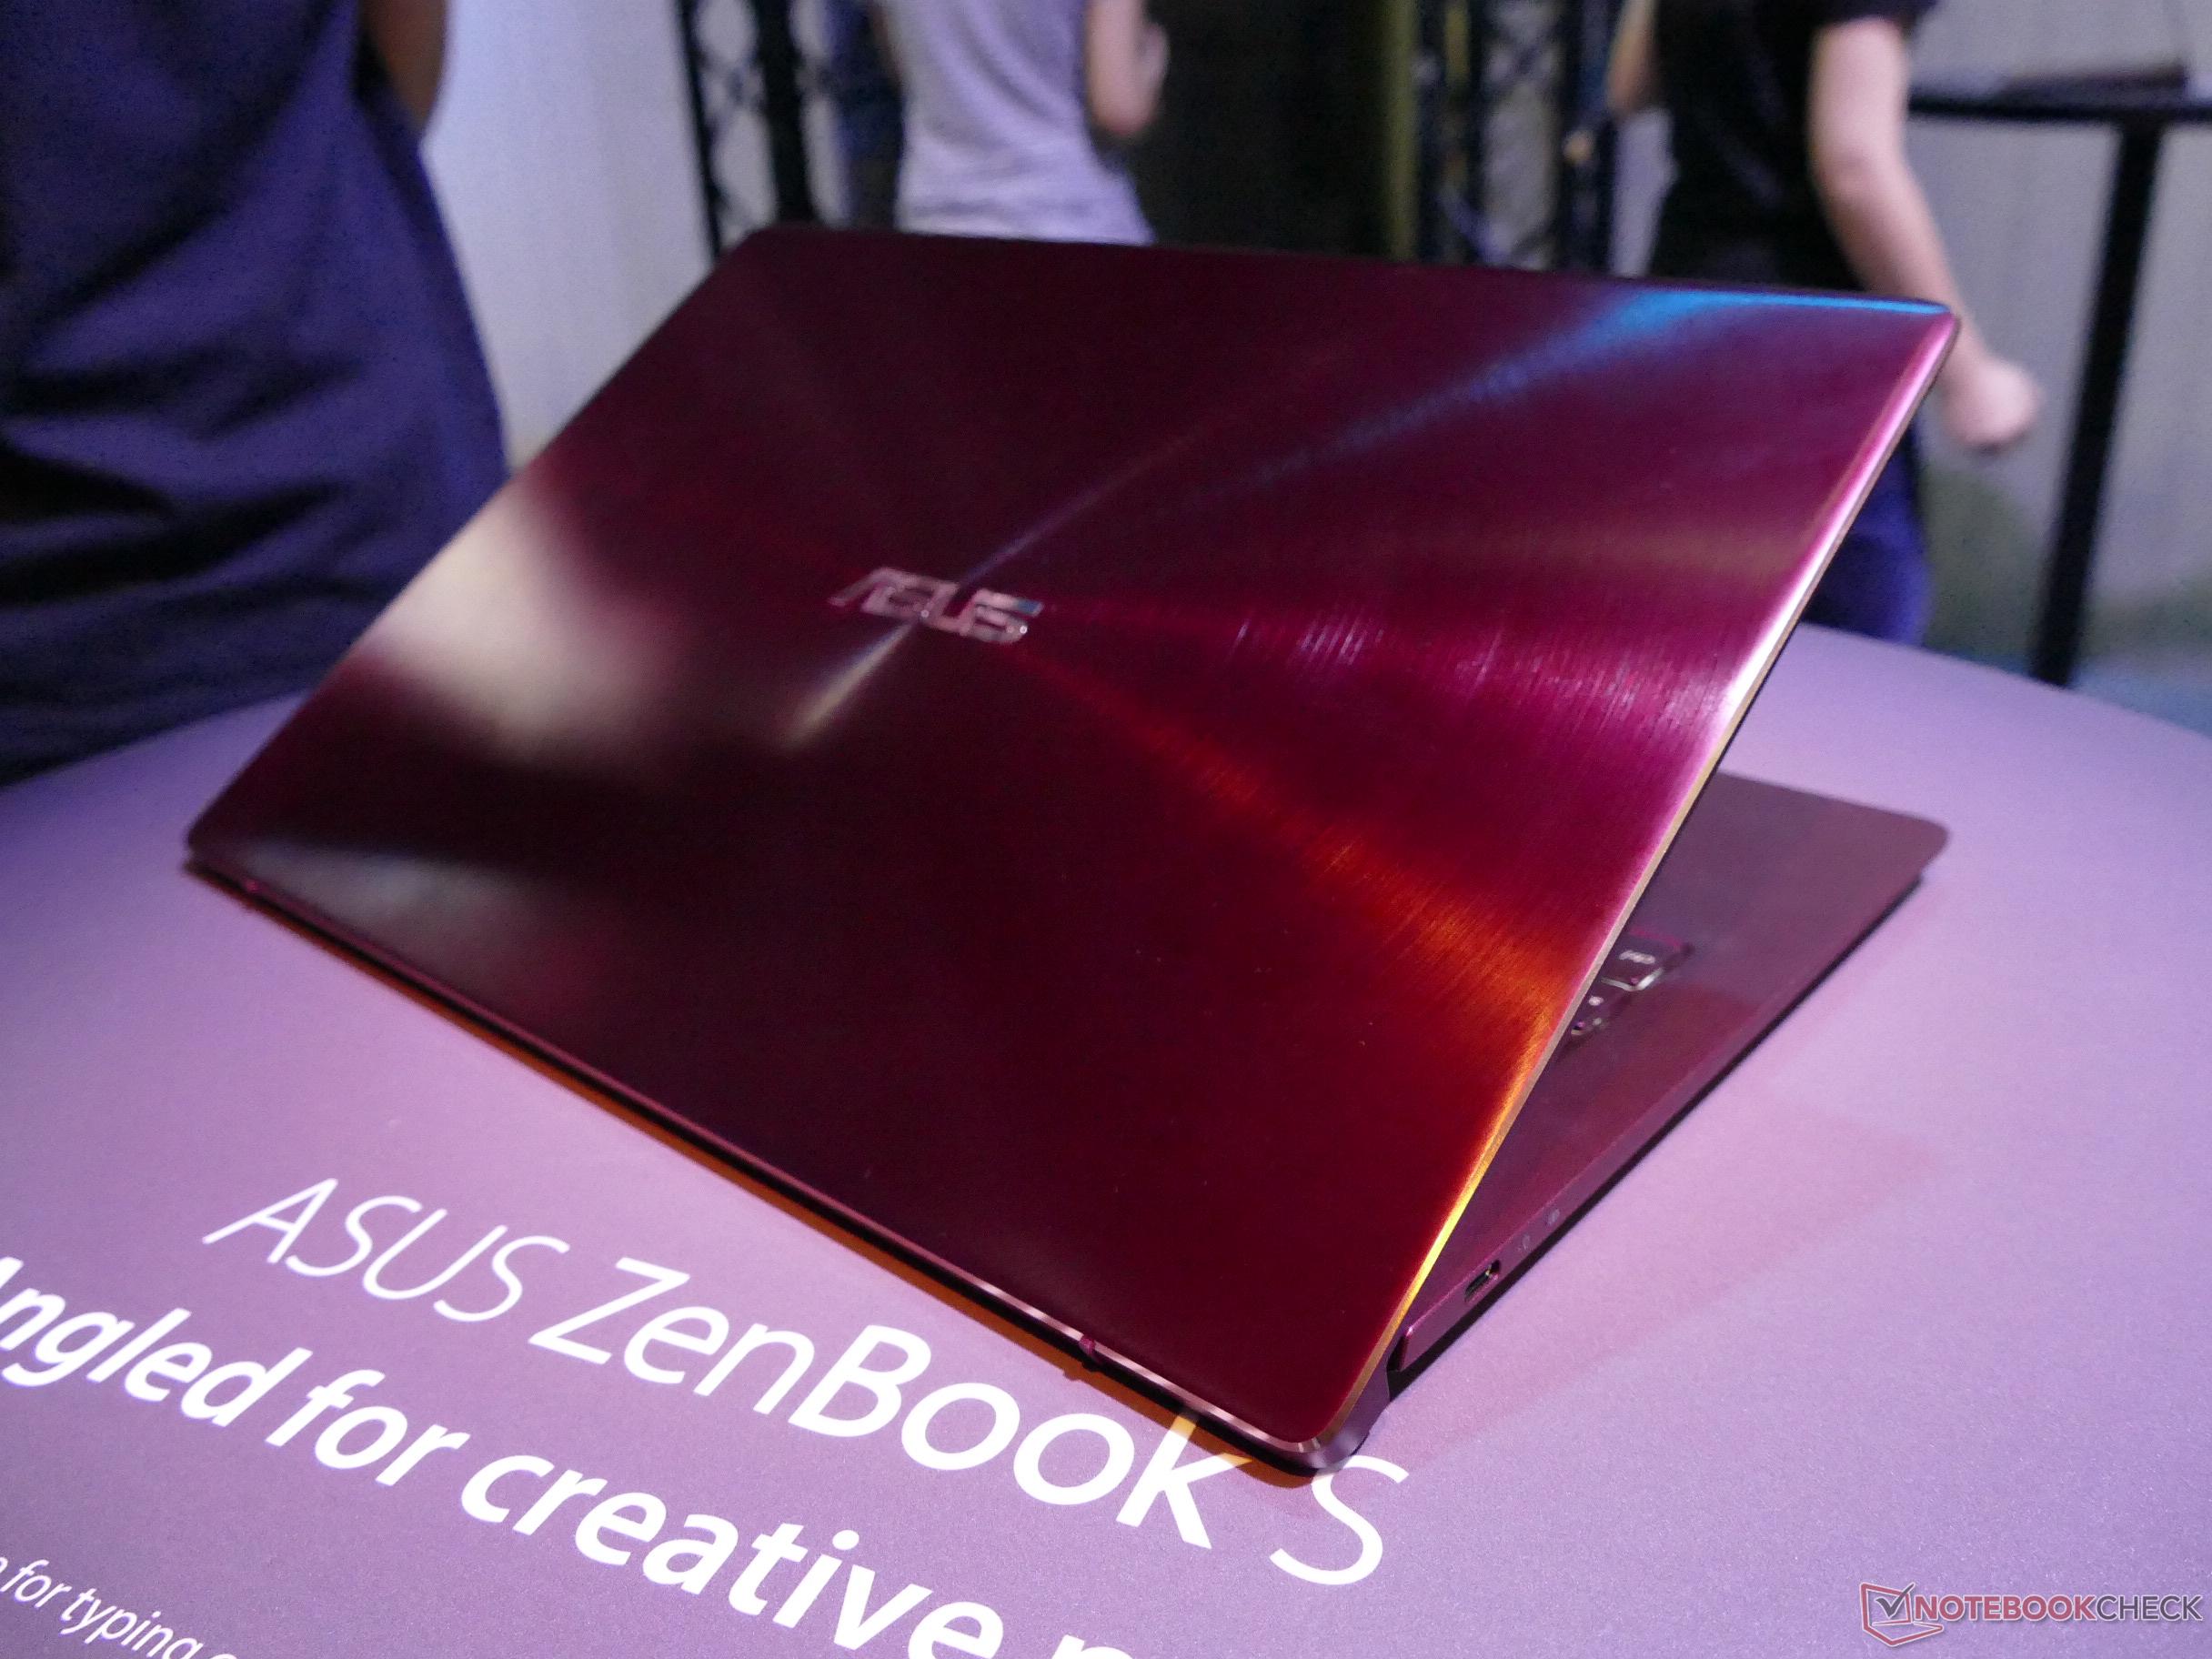
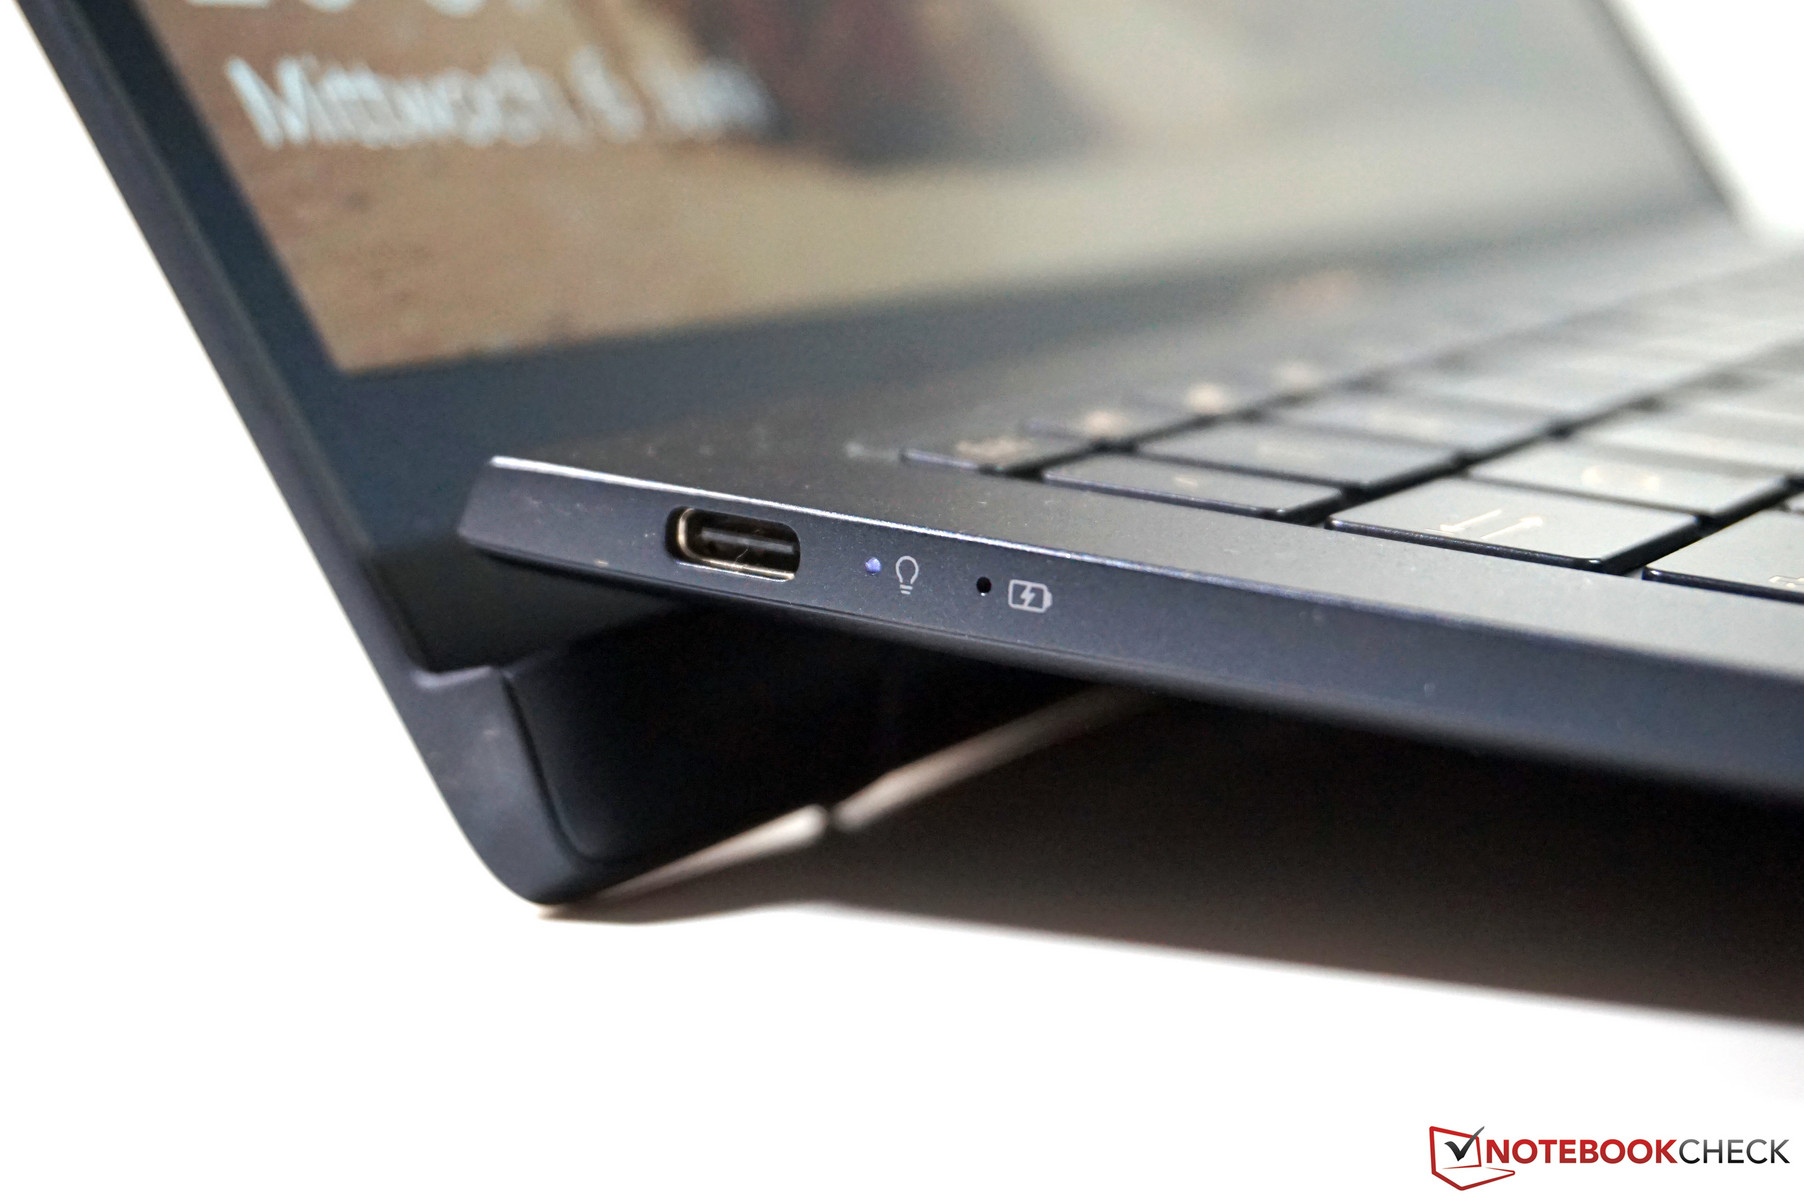
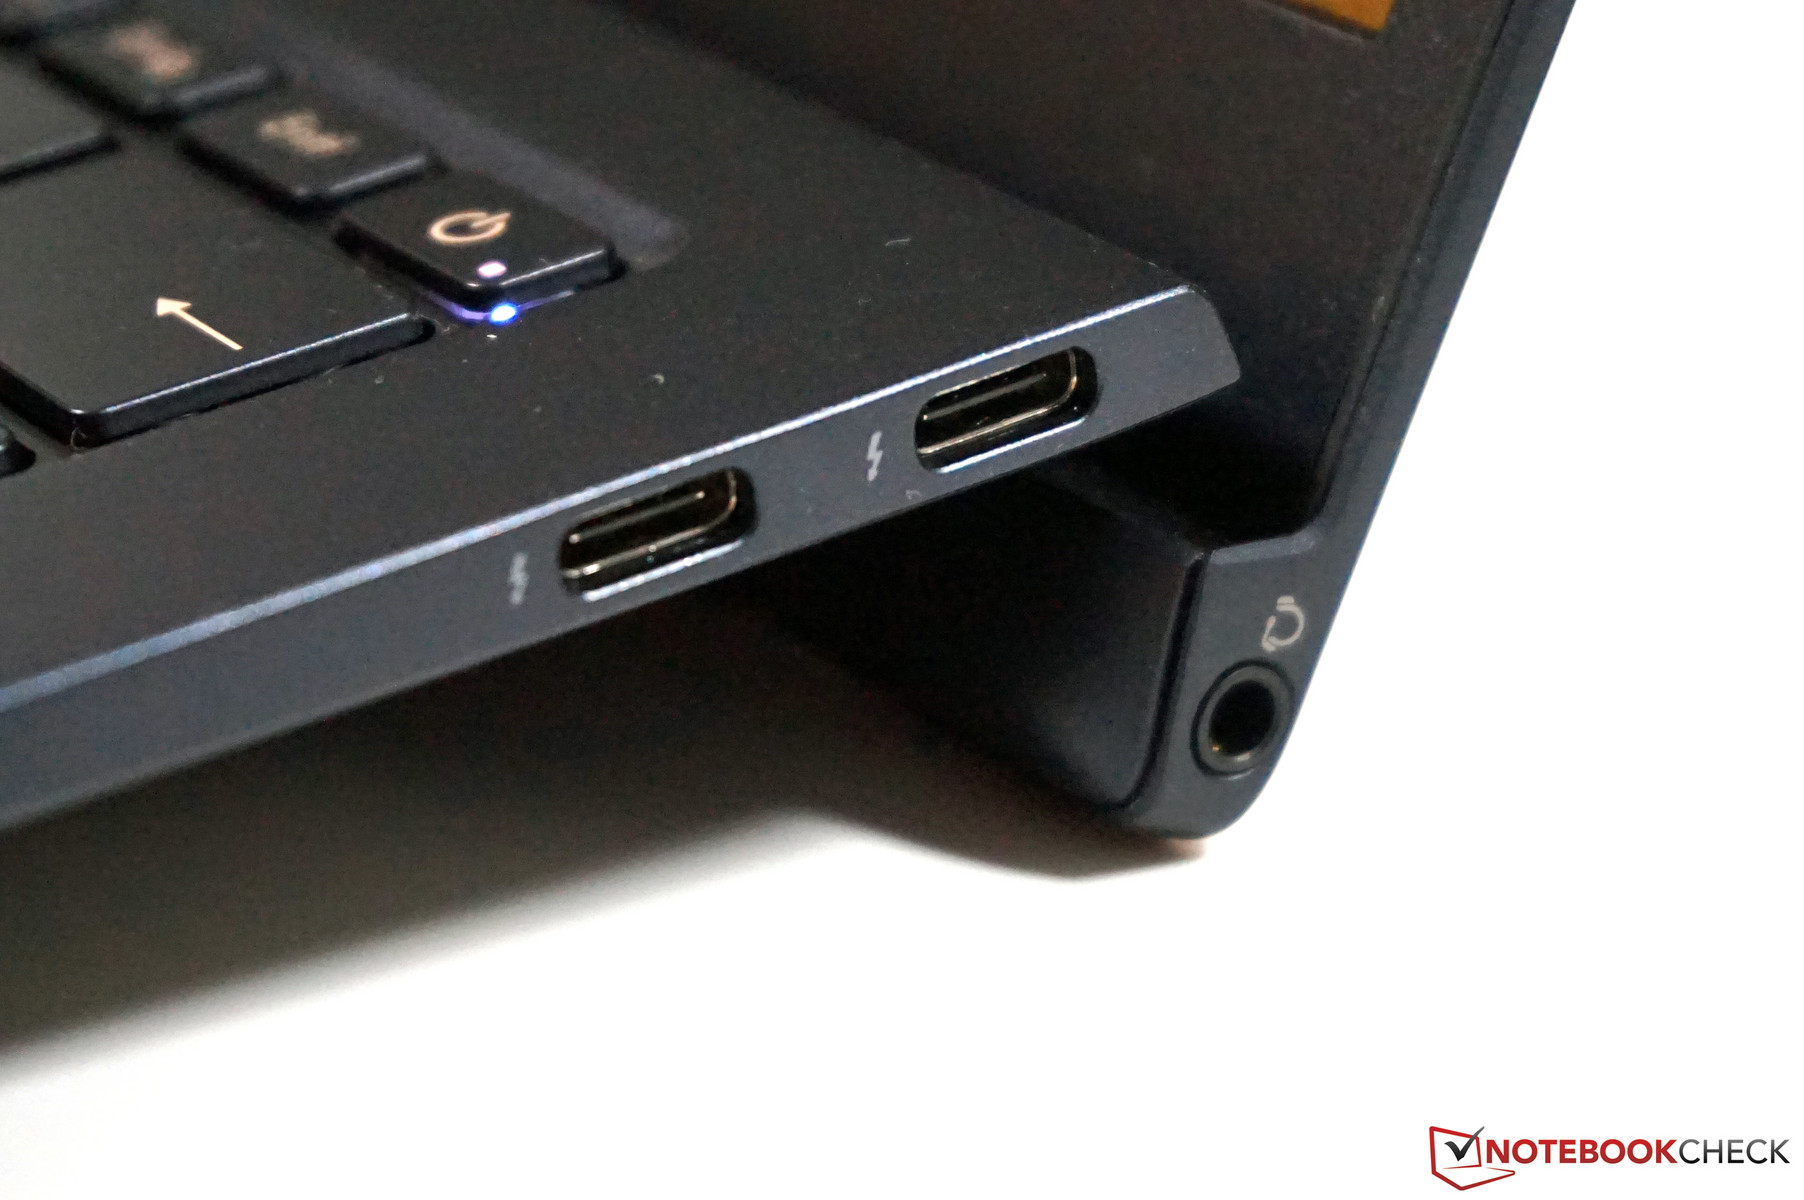
Du får också en enhet av hög kvalitet med ett metallhölje och bra konstruktionskvalitet. Vi gillade den matta 1080p-skärmen, även om den kunde varit lite mer ljusstark och lite bättre kalibrerad efter leverans. Inmatningsenheterna är skapliga och Asus använder moderna portar. En liten dockningsstation som ingår lägger till traditionella portar.
Den mediokra prestandan har vi redan nämnt ovan. Om du behöver mer prestanda i ett kompakt chassi bör du hålla utkik efter en annan modell. Annars kan vi rekommendera ZenBook S UX391.
Asus ZenBook S UX391U
- 09/11/2018 v6 (old)
Andreas Osthoff
Price comparison
